hvdc: pathway to america’s sustainable future · hvdc: pathway to america’s sustainable future...
TRANSCRIPT
HVDC: Pathway to America’s Sustainable Future
Wayne Galli, Ph.D., P.E.
Executive Vice PresidentExecutive Vice President
April 22, 2013
DOE Applications of High-Voltage Direct Current Transmission Technologies Workshop
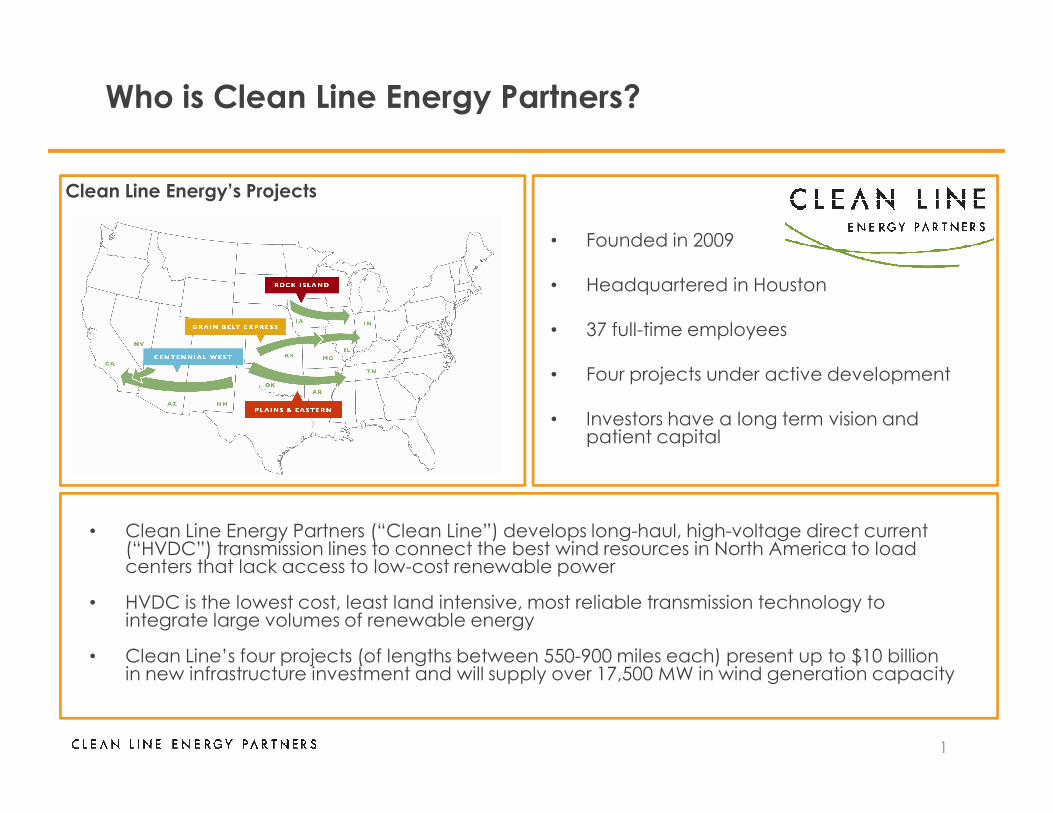
Who is Clean Line Energy Partners?
• Founded in 2009
• Headquartered in Houston
• 37 full-time employees
• Four projects under active development
Investors have a long term vision and
Clean Line Energy’s Projects
1
• Clean Line Energy Partners (“Clean Line”) develops long-haul, high-voltage direct current (“HVDC”) transmission lines to connect the best wind resources in North America to load centers that lack access to low-cost renewable power
• HVDC is the lowest cost, least land intensive, most reliable transmission technology to integrate large volumes of renewable energy
• Clean Line’s four projects (of lengths between 550-900 miles each) present up to $10 billion in new infrastructure investment and will supply over 17,500 MW in wind generation capacity
• Investors have a long term vision and patient capital
45%
50%
55%
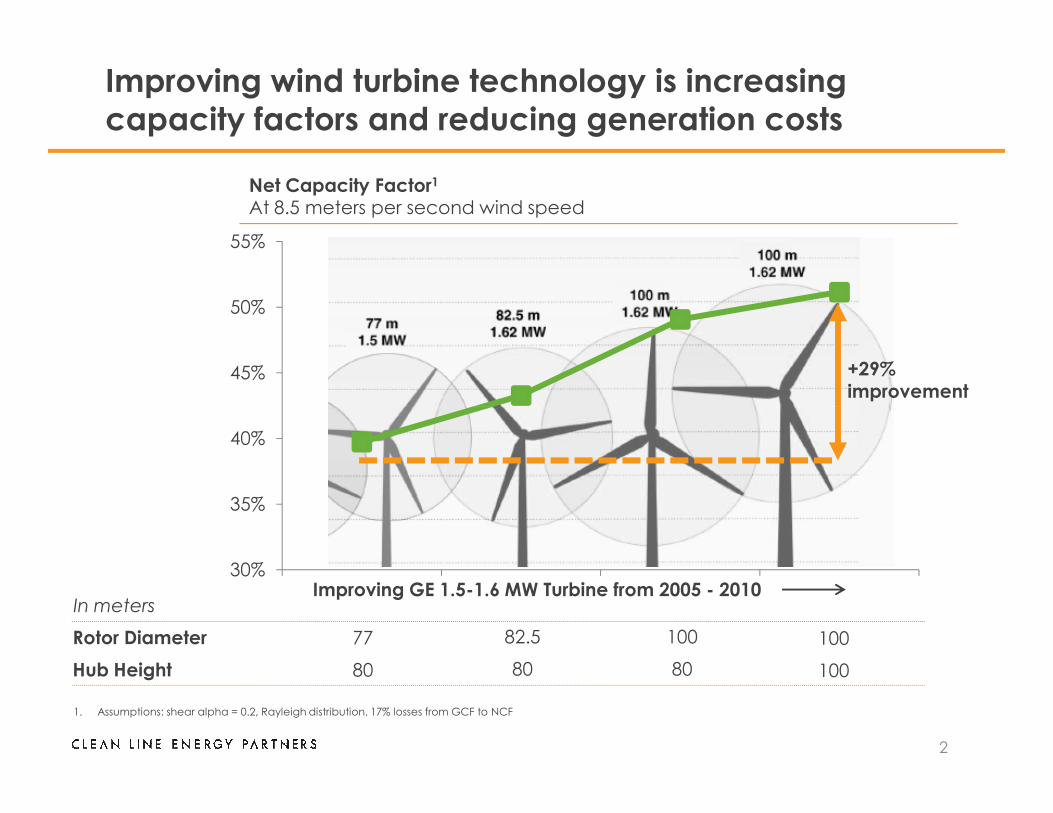
Improving wind turbine technology is increasing
capacity factors and reducing generation costs
Net Capacity Factor1
At 8.5 meters per second wind speed
+29% improvement
2
30%
35%
40%
1. Assumptions: shear alpha = 0.2, Rayleigh distribution, 17% losses from GCF to NCF
Rotor Diameter
Hub Height
In metersImproving GE 1.5-1.6 MW Turbine from 2005 - 2010
77
80
82.5
80
100
80
100
100
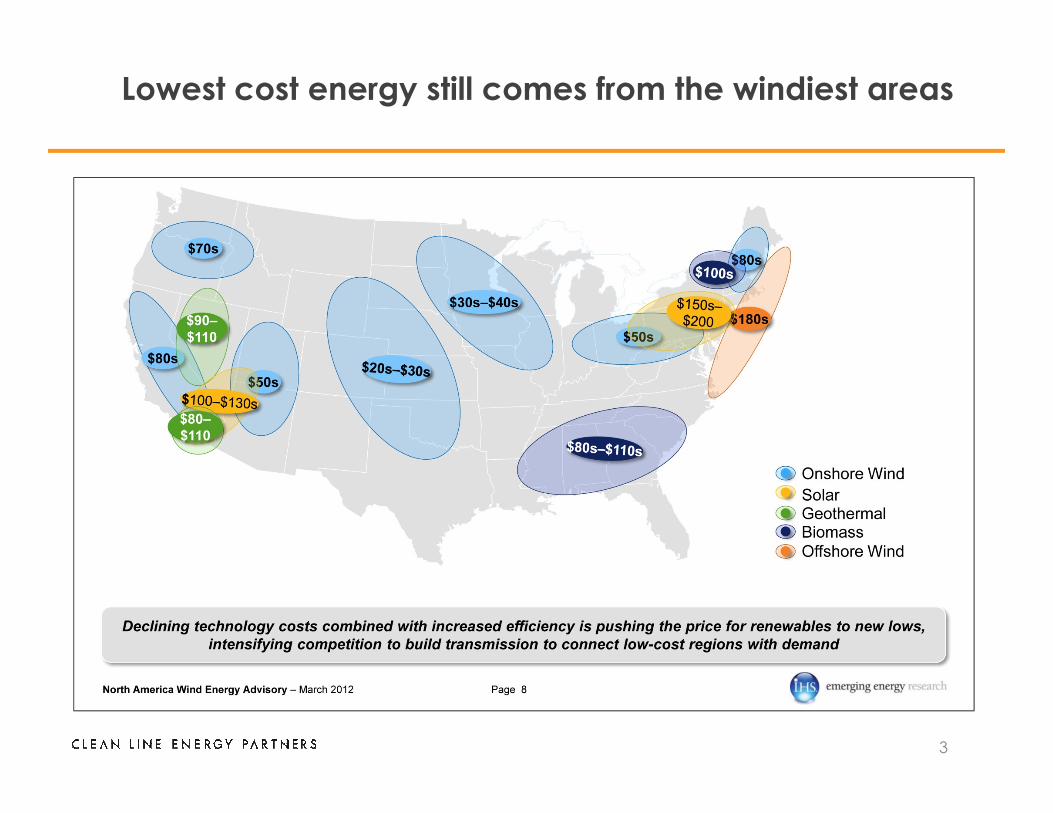
Lowest cost energy still comes from the windiest areas
3
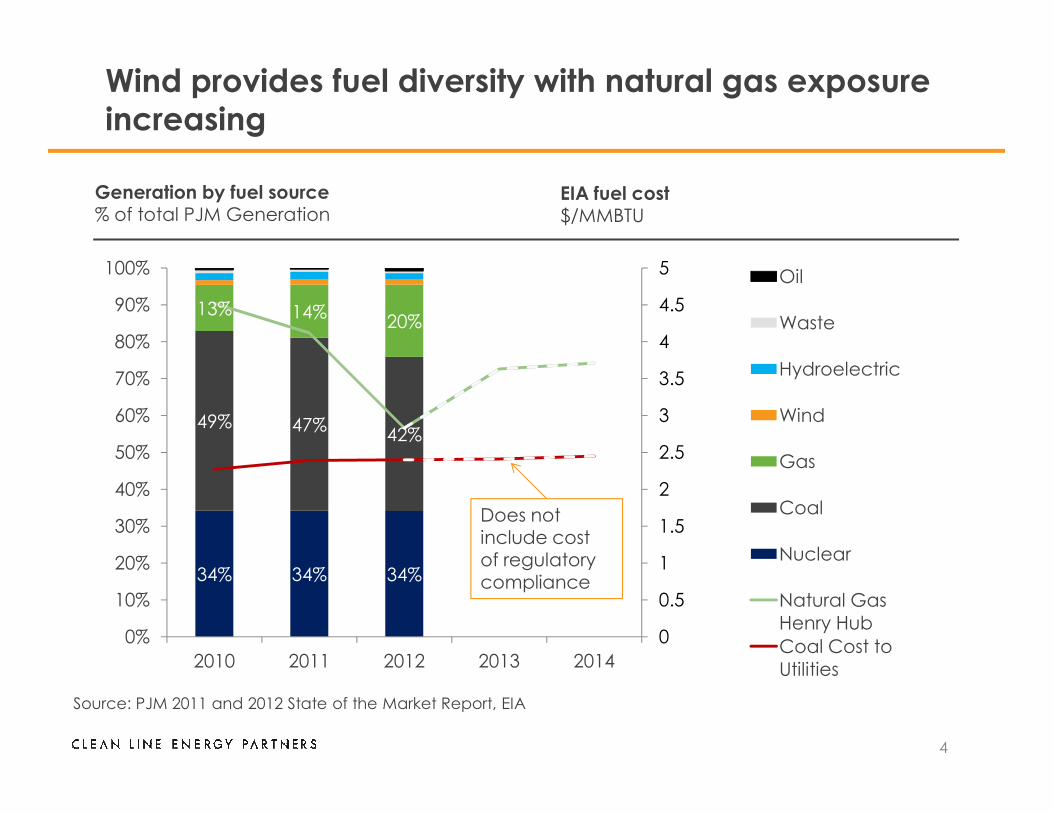
Wind provides fuel diversity with natural gas exposure
increasing
Generation by fuel source% of total PJM Generation
13% 14%20%
3
3.5
4
4.5
5
60%
70%
80%
90%
100% Oil
Waste
Hydroelectric
Wind
EIA fuel cost$/MMBTU
4
Source: PJM 2011 and 2012 State of the Market Report, EIA
34% 34% 34%
49% 47%42%
0
0.5
1
1.5
2
2.5
3
0%
10%
20%
30%
40%
50%
60%
2010 2011 2012 2013 2014
Wind
Gas
Coal
Nuclear
Natural Gas
Henry Hub
Coal Cost to
Utilities
Does not include cost of regulatory compliance
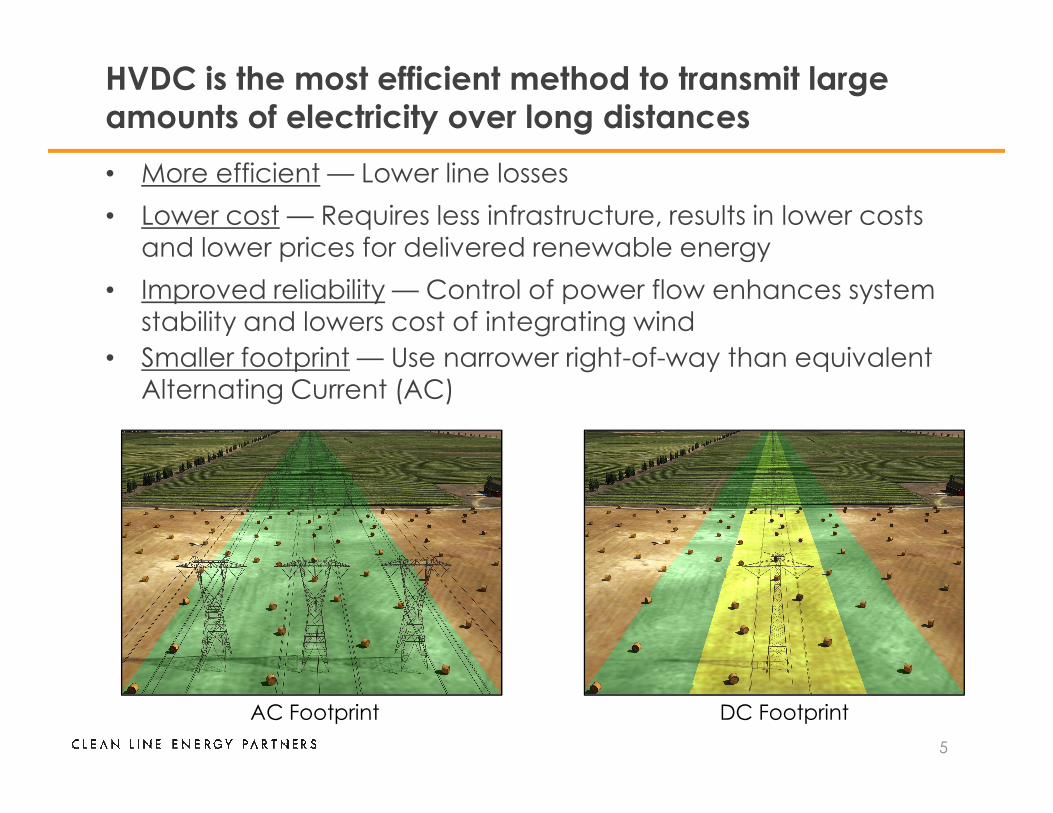
HVDC is the most efficient method to transmit large
amounts of electricity over long distances
• More efficient— Lower line losses
• Lower cost— Requires less infrastructure, results in lower costs and lower prices for delivered renewable energy
• Improved reliability — Control of power flow enhances system stability and lowers cost of integrating wind
• Smaller footprint — Use narrower right-of-way than equivalent Alternating Current (AC)
5
AC Footprint DC Footprint
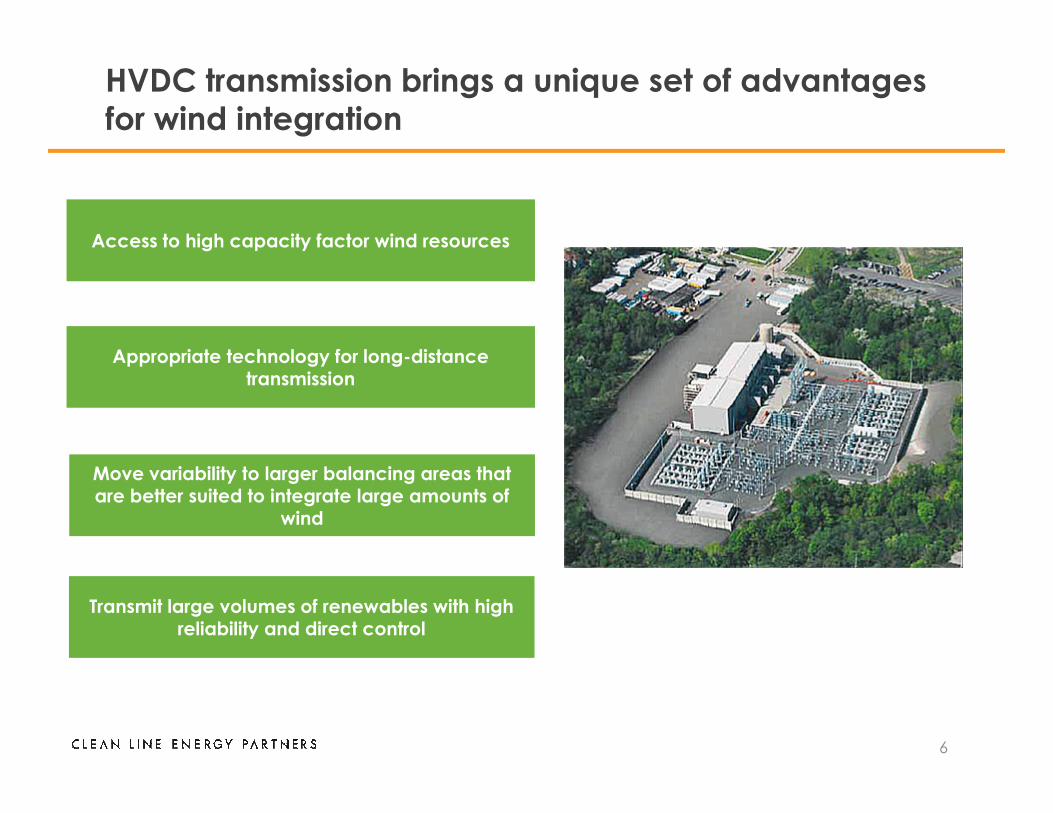
HVDC transmission brings a unique set of advantages
for wind integration
Access to high capacity factor wind resources
Appropriate technology for long-distance transmission
6
Move variability to larger balancing areas that are better suited to integrate large amounts of
wind
Transmit large volumes of renewables with high reliability and direct control
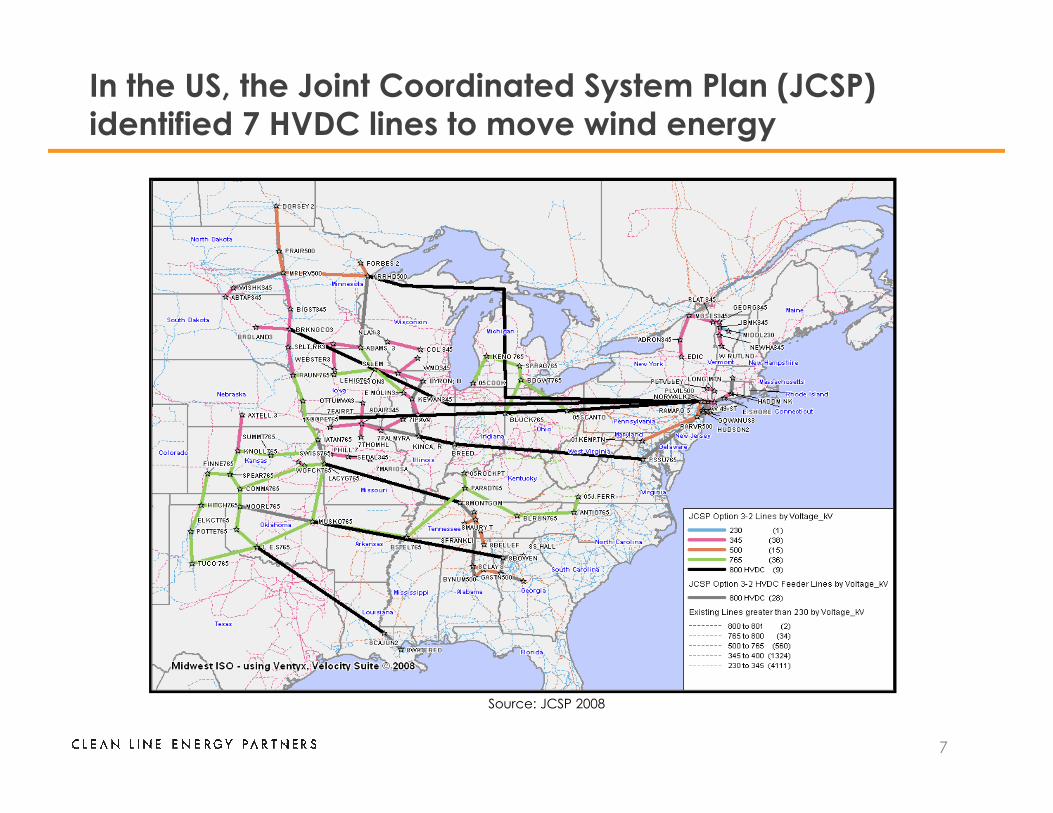
In the US, the Joint Coordinated System Plan (JCSP)
identified 7 HVDC lines to move wind energy
7
Source: JCSP 2008
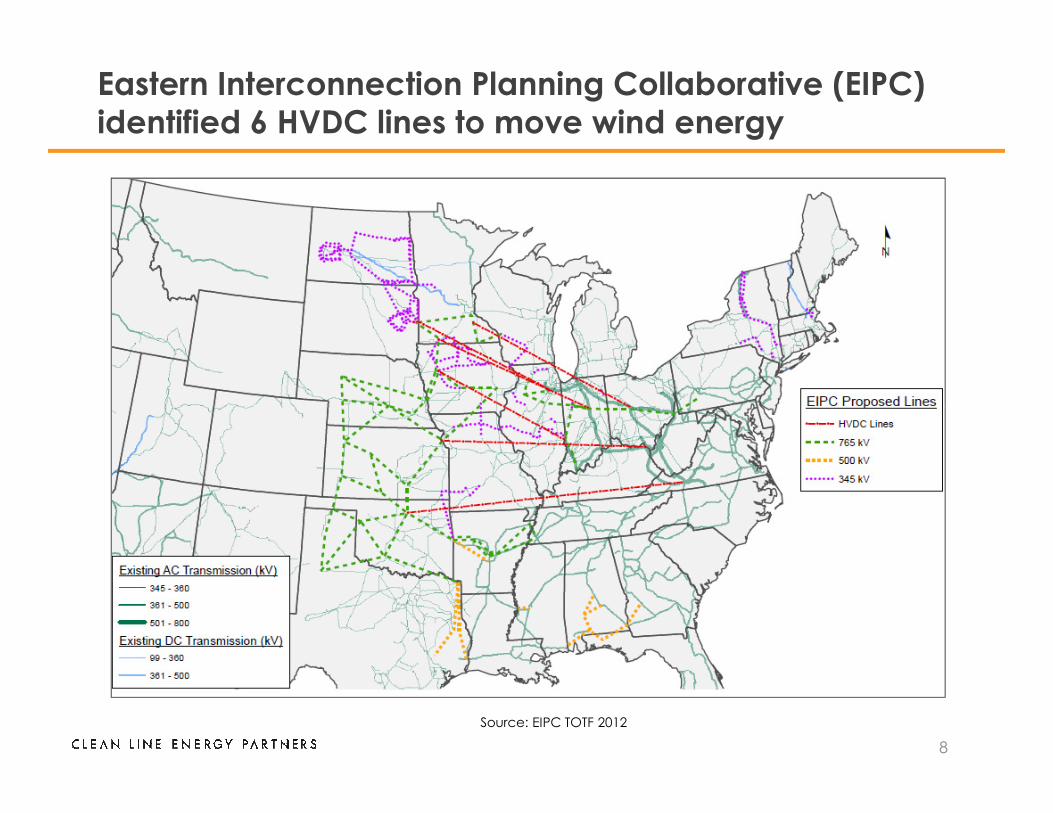
Eastern Interconnection Planning Collaborative (EIPC)
identified 6 HVDC lines to move wind energy
8
Source: EIPC TOTF 2012
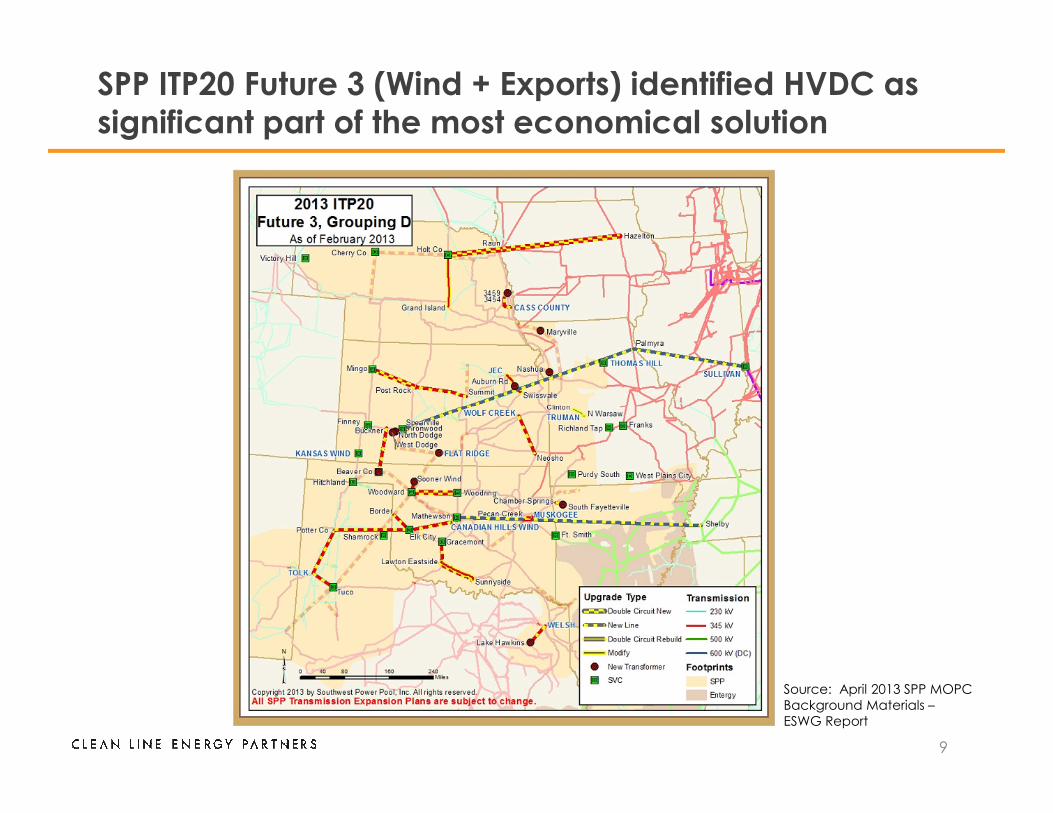
SPP ITP20 Future 3 (Wind + Exports) identified HVDC as
significant part of the most economical solution
9
Source: April 2013 SPP MOPC Background Materials –ESWG Report
Technical Challenges of Implementation
• Low short-circuit ratios mean weak system interactions on windward end
– SCR of 3.0 or greater is best. Most Clean Line projects are less than 2.0. Dynamic reactive equipment and robust conversion concerns.
– Who wins in voltage control? Wind farms or converter station? Possible need for wide area control and
10
station? Possible need for wide area control and coordination with high speed communications.
• Large power injections on the load end
– System frequency events, operating concerns
• Variability of resources
– Wind integration concerns – lots of scientific answers, policy makers don’t always like physics
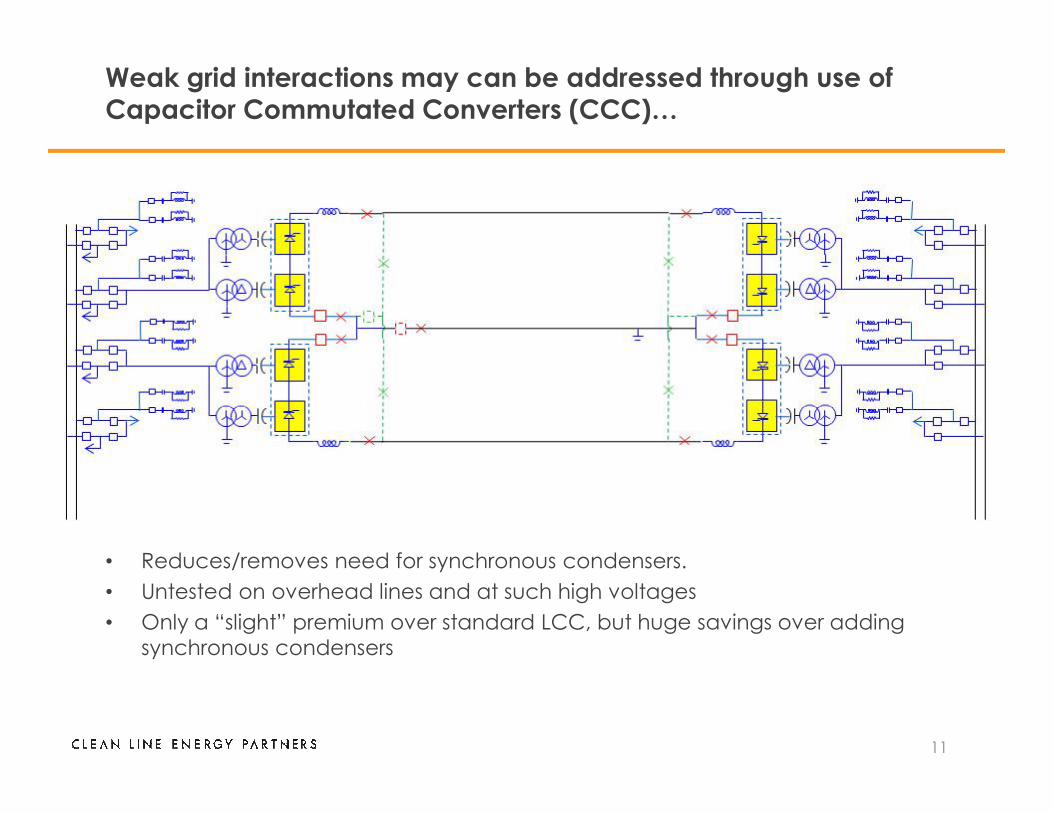
Weak grid interactions may can be addressed through use of Capacitor Commutated Converters (CCC)…
11
• Reduces/removes need for synchronous condensers.
• Untested on overhead lines and at such high voltages
• Only a “slight” premium over standard LCC, but huge savings over adding synchronous condensers
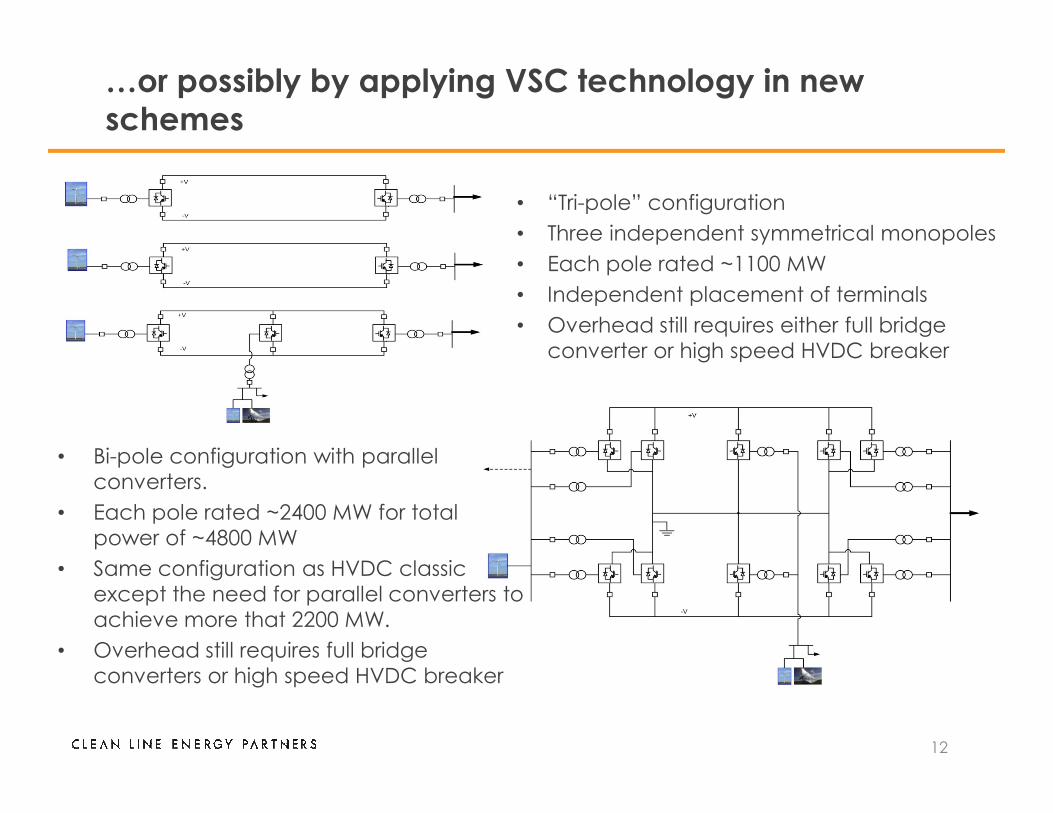
…or possibly by applying VSC technology in new
schemes
• “Tri-pole” configuration
• Three independent symmetrical monopoles
• Each pole rated ~1100 MW
• Independent placement of terminals
• Overhead still requires either full bridge converter or high speed HVDC breaker
12
• Bi-pole configuration with parallel converters.
• Each pole rated ~2400 MW for total power of ~4800 MW
• Same configuration as HVDC classic except the need for parallel converters to achieve more that 2200 MW.
• Overhead still requires full bridge converters or high speed HVDC breaker
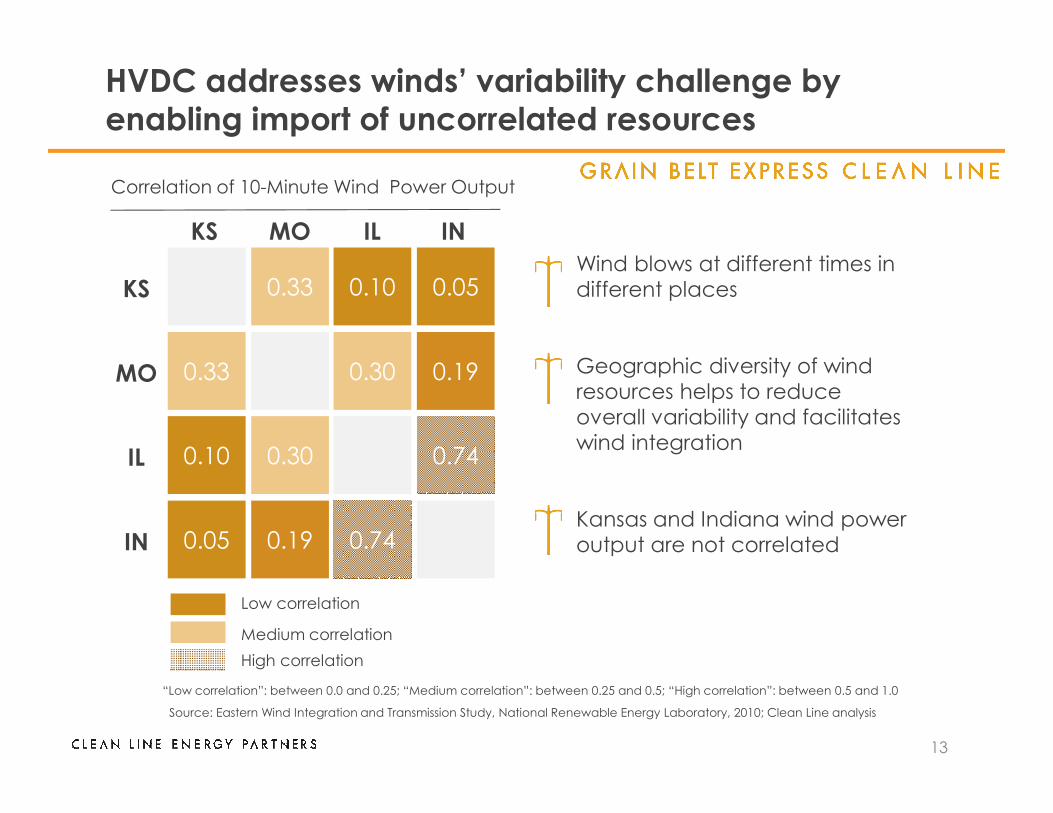
Correlation of 10-Minute Wind Power Output
0.33 0.10 0.05
0.33 0.30 0.19
KS MO IL IN
KS
MO
Wind blows at different times in different places
Geographic diversity of wind resources helps to reduce overall variability and facilitates
HVDC addresses winds’ variability challenge by
enabling import of uncorrelated resources
13
Low correlation
Medium correlation
High correlation
Source: Eastern Wind Integration and Transmission Study, National Renewable Energy Laboratory, 2010; Clean Line analysis
“Low correlation”: between 0.0 and 0.25; “Medium correlation”: between 0.25 and 0.5; “High correlation”: between 0.5 and 1.0
0.10 0.30 0.74
0.05 0.19 0.74
IL
IN
overall variability and facilitates wind integration
Kansas and Indiana wind power output are not correlated
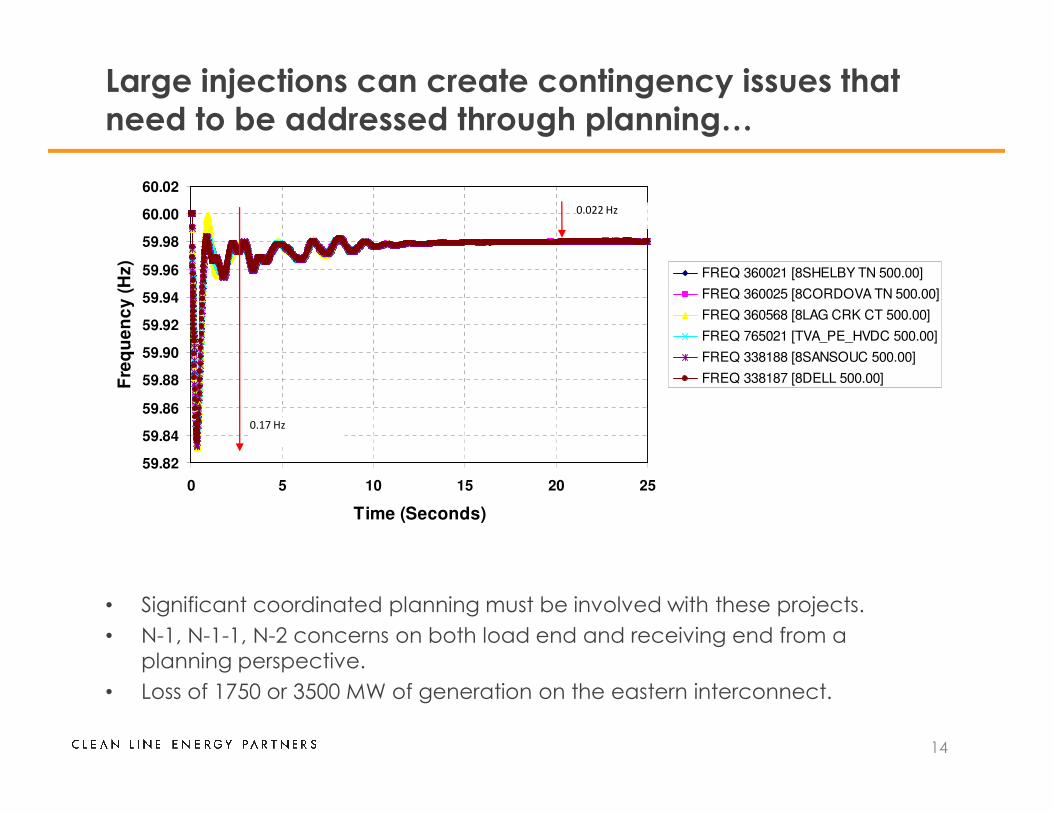
Large injections can create contingency issues that
need to be addressed through planning…
59.86
59.88
59.90
59.92
59.94
59.96
59.98
60.00
60.02
Fre
qu
en
cy
(H
z)
FREQ 360021 [8SHELBY TN 500.00]
FREQ 360025 [8CORDOVA TN 500.00]
FREQ 360568 [8LAG CRK CT 500.00]
FREQ 765021 [TVA_PE_HVDC 500.00]
FREQ 338188 [8SANSOUC 500.00]
FREQ 338187 [8DELL 500.00]
0.022 Hz
14
• Significant coordinated planning must be involved with these projects.
• N-1, N-1-1, N-2 concerns on both load end and receiving end from a planning perspective.
• Loss of 1750 or 3500 MW of generation on the eastern interconnect.
59.82
59.84
59.86
0 5 10 15 20 25
Time (Seconds)
0.17 Hz
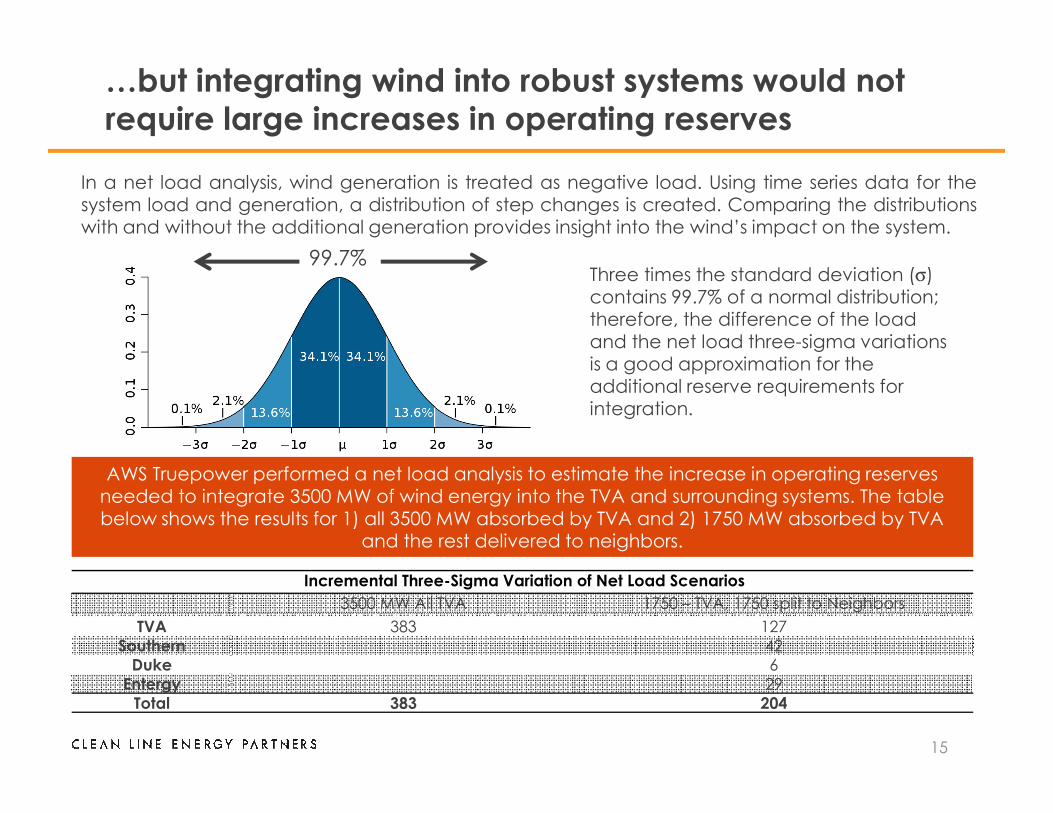
…but integrating wind into robust systems would not
require large increases in operating reserves
Three times the standard deviation (σ)contains 99.7% of a normal distribution; therefore, the difference of the load and the net load three-sigma variations is a good approximation for the additional reserve requirements for integration.
99.7%
In a net load analysis, wind generation is treated as negative load. Using time series data for thesystem load and generation, a distribution of step changes is created. Comparing the distributionswith and without the additional generation provides insight into the wind’s impact on the system.
15
Incremental Three-Sigma Variation of Net Load Scenarios
3500 MW All TVA 1750 – TVA, 1750 split to Neighbors
TVA 383 127Southern 42Duke 6Entergy 29Total 383 204
integration.
AWS Truepower performed a net load analysis to estimate the increase in operating reserves needed to integrate 3500 MW of wind energy into the TVA and surrounding systems. The table below shows the results for 1) all 3500 MW absorbed by TVA and 2) 1750 MW absorbed by TVA
and the rest delivered to neighbors.
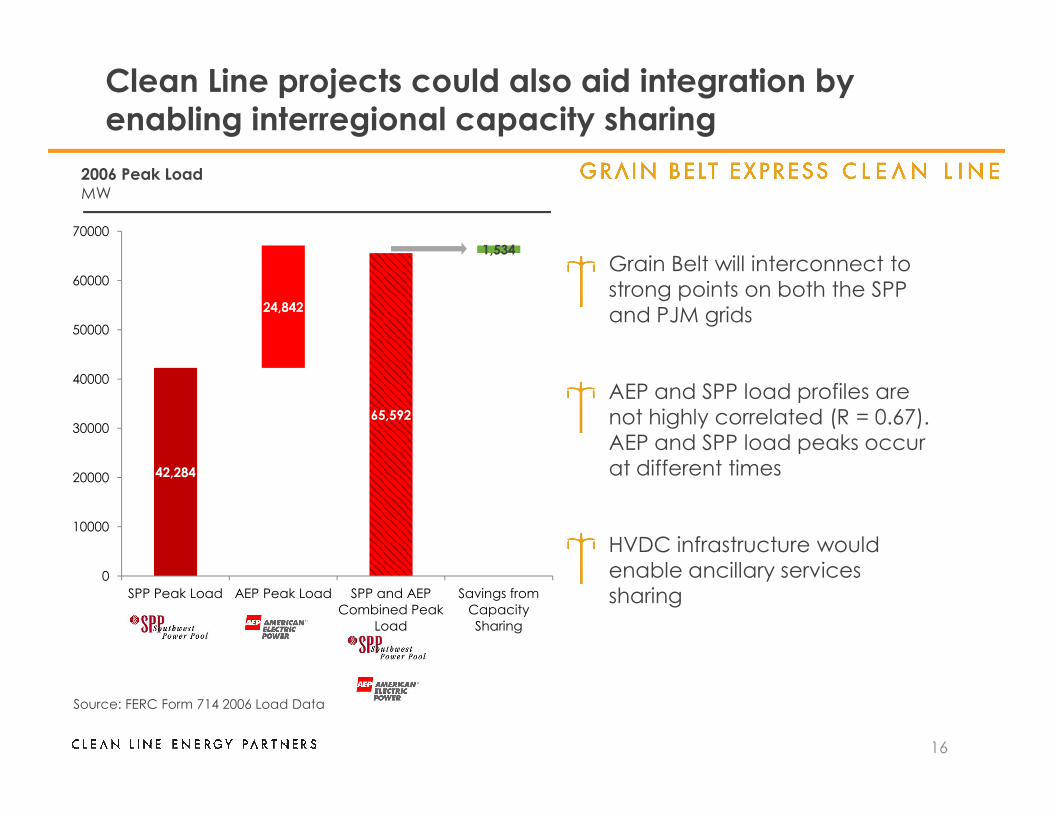
Clean Line projects could also aid integration by
enabling interregional capacity sharing
Grain Belt will interconnect to strong points on both the SPP and PJM grids
AEP and SPP load profiles are not highly correlated (R = 0.67). 65,592
24,842
1,534
40000
50000
60000
70000
2006 Peak Load
MW
16
Source: FERC Form 714 2006 Load Data
not highly correlated (R = 0.67). AEP and SPP load peaks occur at different times
HVDC infrastructure would enable ancillary services sharing sharing
42,284
65,592
0
10000
20000
30000
SPP Peak Load AEP Peak Load SPP and AEP
Combined Peak
Load
Savings from
Capacity
Sharing
www.cleanlineenergy.com
Follow Clean Line on Twitter
@cleanlineenergy
Visit Clean Line’s YouTube channel
www.youtube.com/user/cleanlineenergy