hunt arizona · pdf filefield operation tony guiles ... kinds) of weapon. ... they are much...
TRANSCRIPT

Hunt Arizona2017 Edition
A R I Z O N A G A M E A N D F I S H D E P A R T M E N T
Survey, Harvest and Hunt Data for Big and Small Game

ARIZONA GAME AND FISH COMMISSION
Chair, Edward "Pat" Madden ........................................ FlagstaffJames R. Ammons ..............................................................YumaJames S. Zieler .............................................................. St. John's Eric S. Sparks ...................................................................Tucson Kurt R. Davis .................................................................. Phoenix
ARIZONA GAME AND FISH DEPARTMENT5000 W. Carefree Highway
Phoenix, AZ 85086(602) 942-3000 www.azgfd.gov
Larry D. Voyles ..........................................................................DirectorTy E. Gray .................................................................... Deputy Director
ASSISTANT DIRECTORSTom Finley ....................................................................Field OperationTony Guiles .............................. Information, Education and RecreationJohn Bullington ............................................................. Special ServicesJim deVos ............................................................Wildlife Management
The Arizona Game and Fish Department prohibits discrimination on the basis of race, color, sex, national origin, age, or disability in its programs and activities. If anyone believes that they have been discriminated against in any of the AGFD’s programs or activities, including employment practices, they may file a complaint with the Director’s Office, 5000 W. Carefree Highway Phoenix, AZ 85086, (602) 942-3000, or with the Fish and Wildlife Service, 4401 N. Fairfax Dr. Mail Stop: WSFR-4020, Arlington, VA 22203. Persons with a disability may request a reasonable accommodation or this document in an alternative format by contacting the Director’s Office as listed above.
Published by the Arizona Game and Fish DepartmentInformation and Education Division, Information Branch, Publications Section
©June 2017
Cover photograph: George Andrejko
REGIONAL OFFICESRegion I — Chris Bagnoli, Supervisor
2878 E. White Mountain Blvd., Pinetop, AZ 85935, (928) 367-4281Region II — Craig McMullen, Supervisor
3500 S. Lake Mary Road, Flagstaff, AZ 86005, (928) 774-5045 Region III — Scott Poppenberger, Supervisor
5325 N. Stockton Hill Rd., Kingman, AZ 86409, (928) 692-7700 Region IV — Pat Barber, Supervisor
9140 E. 28th St., Yuma, AZ 85365, (928) 342-0091 Region V — Raul Vega, Supervisor
555 N. Greasewood Rd., Tucson, AZ 85745, (520) 628-5376 Region VI — Jay Cook, Supervisor
7200 E. University, Mesa, AZ 85207, (480) 981-9400

Hunt Arizona 2017 i
Table of Contents
How to Use Survey and Harvest Data �����1-2Bonus Points by Species ����������������������������� 2-6
DeerMule Deer Natural History �����������������������������8Mule Deer Hunt History����������������������������������9White-tailed Deer Natural History �����������������9White-tailed Deer Hunt History ��������������������10Survey Data ��������������������������������������������������11Hunt Data �����������������������������������������������������20Harvest Data ������������������������������������������������24
Pronghorn Antelope Natural History ���������������������������������������������42Hunt History �������������������������������������������������43Survey Data ������������������������������������������������� 44Hunt Data ���������������������������������������������������� 48Harvest Data ������������������������������������������������51
Elk Natural History ���������������������������������������������57Hunt History �������������������������������������������������58Survey Data ��������������������������������������������������59Hunt Data �����������������������������������������������������62Harvest Data ������������������������������������������������65
TurkeyNatural History ���������������������������������������������88Hunt History �������������������������������������������������89Survey Data ��������������������������������������������������90Hunt Data �����������������������������������������������������92Harvest Data ������������������������������������������������95
JavelinaNatural History �������������������������������������������103Hunt History �����������������������������������������������104Survey Data ������������������������������������������������105Hunt Data ���������������������������������������������������110Harvest Data ���������������������������������������������� 113
Bighorn SheepNatural History �������������������������������������������122Hunt History �����������������������������������������������122Survey Data ������������������������������������������������123Hunt Data ���������������������������������������������������128Harvest Data ����������������������������������������������129Successful Hunter Scores ���������������������������133Measurement Data�������������������������������������135Hunt Application Data �������������������������������136
BisonNatural History �������������������������������������������137Hunt History �����������������������������������������������138Survey Data ������������������������������������������������139Hunt Data ���������������������������������������������������141Harvest Data ����������������������������������������������142
Black BearNatural History �������������������������������������������144Hunt History �����������������������������������������������145Hunt Data ���������������������������������������������������146Harvest Data ����������������������������������������������147
Mountain LionNatural History �������������������������������������������151Hunt History �����������������������������������������������152
Hunt Data ���������������������������������������������������153Harvest Data ����������������������������������������������154
Small GameQuail �����������������������������������������������������������160
Natural History ����������������������������������������160Hunt History ��������������������������������������������161
White-winged Dove �����������������������������������162Natural History ����������������������������������������162Hunt History ��������������������������������������������163
Mourning Dove ������������������������������������������163Natural History ����������������������������������������163Hunt History ��������������������������������������������164
Cottontail Rabbit ����������������������������������������164Natural History ����������������������������������������164Hunt History ��������������������������������������������164
Tree Squirrels ����������������������������������������������165Natural History ����������������������������������������165Hunt History ��������������������������������������������165
Band-tailed Pigeon �������������������������������������166Natural History ����������������������������������������166Hunt History ��������������������������������������������166
Blue Grouse ������������������������������������������������166Natural History ����������������������������������������166Hunt History ��������������������������������������������167
Pheasant �����������������������������������������������������167Natural History ����������������������������������������167Hunt History ��������������������������������������������167
Small Game Harvest Data ��������������������������168
PredatorsCoyotes �������������������������������������������������������173
Natural History ����������������������������������������173Hunting and Trapping History �����������������173
Bobcats ������������������������������������������������������174Natural History ����������������������������������������174Hunting and Trapping History �����������������174
Foxes ����������������������������������������������������������174Natural History ����������������������������������������175Hunting and Trapping History �����������������175
Skunks ��������������������������������������������������������175Natural History ����������������������������������������176Trapping History ��������������������������������������176
Furbearers Beaver ��������������������������������������������������������177
Natural History ����������������������������������������177Trapping History ��������������������������������������178
Muskrat ������������������������������������������������������178Natural History ����������������������������������������178Trapping History ��������������������������������������178
Raccoon ������������������������������������������������������178Natural History ����������������������������������������179Trapping and Hunt History ����������������������179
Ringtail �������������������������������������������������������179Natural History ����������������������������������������179Trapping History ��������������������������������������179
Otter �����������������������������������������������������������180Natural History ����������������������������������������180Trapping and Hunt History ����������������������180
Weasel ��������������������������������������������������������180Natural History ����������������������������������������180Trapping History ��������������������������������������180
Badger ��������������������������������������������������������181Natural History ����������������������������������������181Trapping History ��������������������������������������181
Trapping �����������������������������������������������������181
Predator and Furbearer Harvest Data ����������������������������������������������182Trapping Data ���������������������������������������������183
WaterfowlNatural History �������������������������������������������184Hunt History �����������������������������������������������185Survey and Harvest Data ����������������������������187
Sandhill CraneNatural History �������������������������������������������189Hunt History �����������������������������������������������190Harvest Data ����������������������������������������������191
Other Birds and MammalsPigeon (Rock Dove) ������������������������������������197
Natural History and Status ����������������������197House (English) Sparrow ����������������������������197
Natural History and Status ����������������������197European Starling ���������������������������������������198
Natural History and Status ����������������������198Peach-faced Lovebird ���������������������������������198
Natural History and Status ����������������������198American Crow �������������������������������������������198
Natural History and Status ����������������������199Coati �����������������������������������������������������������199
Natural History and Status ����������������������199Gunnison’s Prairie Dog ������������������������������ 200
Natural History and Status ��������������������� 200Black-tailed Prairie Dog ����������������������������� 200
Natural History and Status ��������������������� 200Specially Protected Mammals ������������������� 200Bats ����������������������������������������������������������� 200
Natural History and Status ��������������������� 200Black-footed Ferret �������������������������������������201
Natural History and Status ����������������������201Hualapai Mexican Vole ������������������������������201
Natural History and Status ����������������������201Jaguar ���������������������������������������������������������202
Natural History and Status ����������������������202Jaguarundi ��������������������������������������������������202
Natural History and Status ����������������������202Ocelot ���������������������������������������������������������202
Natural History and Status ����������������������203Otter (see Furbearers) ��������������������������������203Porcupine ���������������������������������������������������203
Natural History and Status ����������������������203Gray Wolf ���������������������������������������������������204
Natural History and Status ����������������������205
Game Management Unit Map �����������������206

Hunt Arizona 2017 1
How to Use Survey and Harvest Data
Both novice and experienced hunters will find this book a valuable resource to help in making informed decisions regarding hunt selections. The book is a com-pendium of facts about hunting in Arizona, including up-to-date information on:• Which game management units have the most big-
game permits, • The units with the narrowest male to female ratios, • Units and hunts with the highest hunt success, • Hunts that have the best drawing odds, and • Historical survey and hunt information the reader
can use to compare trends for the major game species in each management unit.
The information is relatively simple to use. Look-ing through the section on deer, for example, you will find a summary of the survey data for both mule deer and white-tailed deer in each game management unit having these species. This information will help you de-termine whether a unit has a high proportion of bucks and whether it is experiencing good fawn production. Bear in mind, however, that due to differences in survey methods the male to female and female to young ratios are only estimates.
By checking the unit hunt information summary, you can determine the hunter success rate, how many per-mits were available in the past, and the drawing odds for previous hunts. Be aware that some units have sev-eral authorized hunts, each limited to a specific kind (or kinds) of weapon. Your selection of a hunt for which to apply will depend on your own preference of hunt area, weapon type, season dates, and the kind of animal you wish to harvest.
Beating the OddsPermits for big-game hunts in Arizona are issued through a drawing system. Since the best predictor of the future is the past, the best estimate of your draw odds for an upcoming hunt is the draw rate for that hunt in the previous draw. Draw odds for each hunt are calculated by dividing successful first choice applicants by the total first choice applicants. Even though some permits may have been issued to second choice appli-cants, this method accurately reflects the applicant’s chances of receiving their first choice.
The odds of receiving a permit for a second choice hunt instead of a first choice hunt are calculated by sub-
tracting the draw rate for the first choice hunt from the draw rate for the second choice hunt. The odds for re-ceiving your first or second choice would therefore be the same as your highest odds choice. For example, if your first choice selection had a 40 percent draw rate last year, and your second choice selection had a 60 per-cent draw rate, your odds this year are 40 percent for getting your first choice, 20 percent for getting your second choice, and 60 percent overall (assuming that the results of this year’s draw will be similar to those of the previous draw). It therefore makes little sense to ap-ply for a second choice hunt with a lower draw rate than your first choice hunt. Only those hunts that did not fill with first or second choice applications are considered for third, fourth, or fifth choices. Therefore, only hunts with draw odds of 100 percent are good candidates for these choices.
While draw rates are relatively favorable for most deer, turkey and javelina hunts, they are much more competitive for elk, antelope, bison, and bighorn sheep. Beginning in 1991, the Arizona Game and Fish Department began issuing bonus points to unsuccessful applicants for these species. In 1999, unsuccessful applicants for deer began to receive bonus points. In 2005, turkey, javelina, and spring bear began receiving bonus points. Each point accumulated gives the applicant an extra entry in the hunt drawing for that species. For more information about the bonus point system, please refer to R12-4-107 in the current Fall Hunting Regulations booklet.
A summary of 2016 draw odds seems to indicate little advantage to having many bonus points. Further analysis, however, reveals that applicants with the larg-est number of bonus points are applying for hunts with the poorest draw odds, which obscures the benefits of having multiple bonus points. For example, elk appli-cants without any bonus points applied for hunts with draw odds that averaged 17.9 percent, while those with 23 bonus points applied for hunts with draw odds aver-aging less that 0.60 percent. This tendency held true for their second choices as well.
Comparing applicants on the basis of their first choice hunts reveals a truer picture of the advantages of bonus points, particularly for those applying for hunts with high draw odds. General an-telope applicants with 25 bonus points, for example, were drawn for their first choice hunt at over 66 times the rate of applicants with no bonus points (66.7 vs 0.39 percent). General elk

2 Hunt Arizona 2017
How to Use Survey and Harvest Data
applicants with 23 bonus points were drawn for their first choice hunt at over 88 times the rate of applicants with no bonus points (100 percent versus 11.9 percent).
Draw odds in the tables contained in this report are computed without regard to numbers of bo-nus points and therefore represent your odds if you have an average number of bonus points. In the 2016 draw, the average applicant for elk tags had about 3 bonus points while those applying for antelope, big-horn sheep, bison, and deer tags had 11, 17, 10, and 2 respectively.
Another point to consider when choosing hunts is the number of people on your application. This can be
an important factor when applying for hunts with low numbers of permits, since no permits will be issued if there are not enough for everyone on the applica-tion. Applying with three other people for a 10-permit hunt, for example, cuts your odds by 30 percent. Ap-plying with people who have fewer bonus points than you have will also decrease your odds, since the num-ber of bonus points assigned to an application is the average accumulated by the group.
One last tip to keep in mind is that new hunts, or hunts in which permits have been recently increased, generally have slightly better draw odds than other hunts. Conversely, hunts with reduced numbers of permits generally have poorer odds.
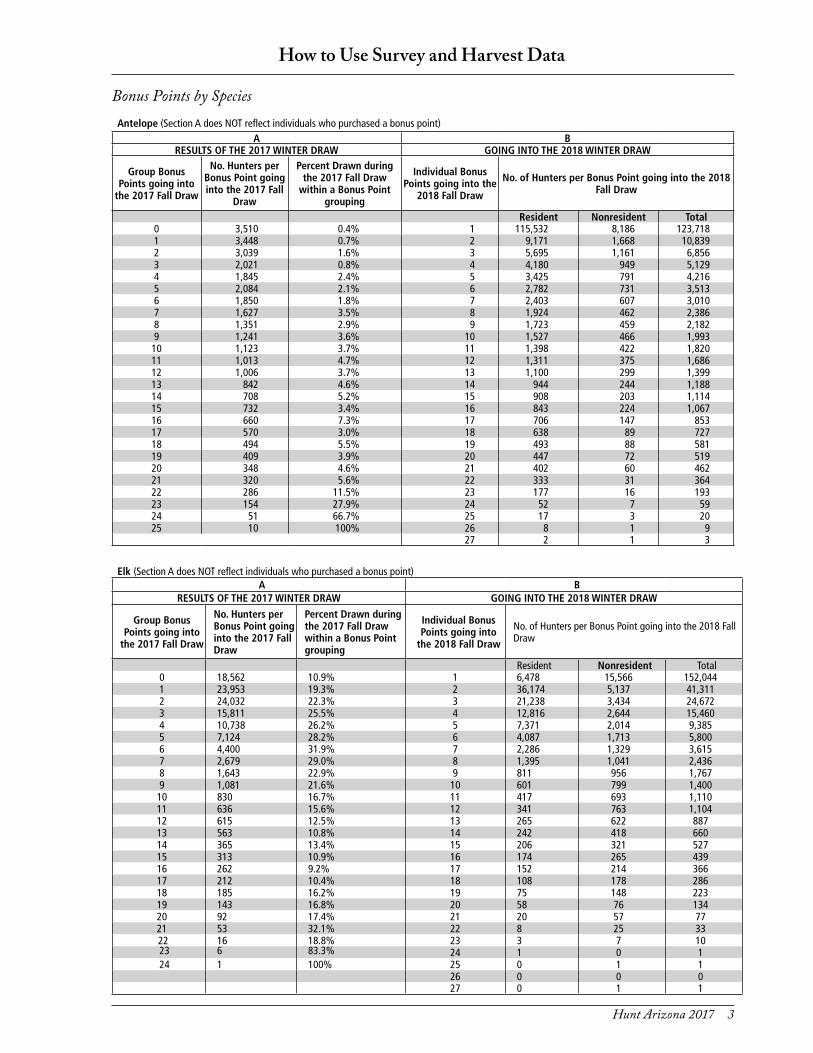
For all species except antelope and elk, the tables below are a summary of group bonus points resulting from the 2016 Fall Draw (Section A) and individual bonus points going into the 2017 Fall Draw (Section B).
For antelope and elk, the tables are a summary of group bonus points resulting from the 2017 Antelope and Elk Draw (Section A) and individual bonus points going into the 2018 Antelope and Elk Draw (Section B). Group bonus points are the average number of bonus points per hunt application. A hunt application can be submitted with 1 to 4 applicants. The bonus points, which may differ for each individual on an application, are averaged to come up with “group bonus points.” Individual bonus points in Section B are the count of all hunters in each bonus point
level. Both group and individual bonus points include the permanent hunter education point and the loyalty point. All potential hunters may not be represented in Section A if an individual with bonus points did not apply during the recent Draw. Also, keep in mind that applicants with the greatest number of bonus points often apply for hunts with poorest draw odds, which obscures the benefits of having multiple bonus points. Refer to the narrative on the previous pages about “Beating the Odds.”
Remember, all potential hunters may not apply in a given year. Also, Section A does NOT reflect individuals who may have purchased a bonus point for a given species.
DeerA B
RESULTS OF THE 2016 FALL DRAW GOING INTO THE 2017 FALL DRAW
Group Bonus Points going into
the 2016 Fall Draw
No� Hunters per Bonus Point
going into the 2016 Fall Draw
Percent Drawn during the 2016 Fall Draw within
a Bonus Point grouping
Individual Bonus Points going into
the 2017 Fall Draw
No� of Hunters per Bonus Point going into the 2017 Fall Draw
RESIDENT NONRESIDENT TOTAL0 18,516 43�5% 1 131,537 9,733 141,2701 29,457 54% 2 30,712 2,780 33,4922 20,474 53�4% 3 10,858 1,922 12,7803 7,360 49�4% 4 4,748 1,003 5,7514 3,542 38�3% 5 2,555 1,092 3,6475 1,996 26�2% 6 1,551 1,076 2,6276 1,293 21�0% 7 1,109 885 1,9947 897 21�5% 8 717 742 1,4598 589 13�9% 9 478 624 1,1029 498 15�1% 10 307 615 922
10 419 10�3% 11 242 526 76811 363 6�1% 12 195 544 73912 336 10�4% 13 162 434 59613 249 9�2% 14 120 321 44114 245 10�2% 15 112 287 39915 236 5�1% 16 98 273 37116 171 8�2% 17 46 246 29217 122 9�8% 18 22 177 19918 106 14�2% 19 6 157 16319 106 9.4% 20 2 129 131
20 2 129 131
Bonus Points By Species Bonus points listed below include the permanent hunter education point and the loyalty point (earn by submitting a valid application for 5 consecutive years).
Hunt Arizona 2017 3
Bonus Points by Species
How to Use Survey and Harvest Data
Antelope (Section A does NOT reflect individuals who purchased a bonus point)A B
RESULTS OF THE 2017 WINTER DRAW GOING INTO THE 2018 WINTER DRAW
Group Bonus Points going into
the 2017 Fall Draw
No� Hunters per Bonus Point going into the 2017 Fall
Draw
Percent Drawn during the 2017 Fall Draw
within a Bonus Point grouping
Individual Bonus Points going into the
2018 Fall Draw
No� of Hunters per Bonus Point going into the 2018 Fall Draw
Resident Nonresident Total0 3,510 0�4% 1 115,532 8,186 123,7181 3,448 0�7% 2 9,171 1,668 10,8392 3,039 1�6% 3 5,695 1,161 6,8563 2,021 0�8% 4 4,180 949 5,1294 1,845 2�4% 5 3,425 791 4,2165 2,084 2�1% 6 2,782 731 3,5136 1,850 1�8% 7 2,403 607 3,0107 1,627 3�5% 8 1,924 462 2,3868 1,351 2�9% 9 1,723 459 2,1829 1,241 3�6% 10 1,527 466 1,993
10 1,123 3�7% 11 1,398 422 1,82011 1,013 4�7% 12 1,311 375 1,68612 1,006 3�7% 13 1,100 299 1,39913 842 4�6% 14 944 244 1,18814 708 5�2% 15 908 203 1,11415 732 3�4% 16 843 224 1,06716 660 7�3% 17 706 147 85317 570 3�0% 18 638 89 72718 494 5�5% 19 493 88 58119 409 3�9% 20 447 72 51920 348 4�6% 21 402 60 46221 320 5�6% 22 333 31 36422 286 11�5% 23 177 16 19323 154 27�9% 24 52 7 5924 51 66�7% 25 17 3 2025 10 100% 26 8 1 9
27 2 1 3
Elk (Section A does NOT reflect individuals who purchased a bonus point)A B
RESULTS OF THE 2017 WINTER DRAW GOING INTO THE 2018 WINTER DRAW
Group Bonus Points going into
the 2017 Fall Draw
No� Hunters per Bonus Point going into the 2017 Fall Draw
Percent Drawn during the 2017 Fall Draw within a Bonus Point grouping
Individual Bonus Points going into
the 2018 Fall Draw
No� of Hunters per Bonus Point going into the 2018 Fall Draw
Resident Nonresident Total0 18,562 10�9% 1 6,478 15,566 152,0441 23,953 19�3% 2 36,174 5,137 41,3112 24,032 22�3% 3 21,238 3,434 24,6723 15,811 25�5% 4 12,816 2,644 15,4604 10,738 26�2% 5 7,371 2,014 9,3855 7,124 28�2% 6 4,087 1,713 5,8006 4,400 31�9% 7 2,286 1,329 3,6157 2,679 29�0% 8 1,395 1,041 2,4368 1,643 22�9% 9 811 956 1,7679 1,081 21�6% 10 601 799 1,400
10 830 16�7% 11 417 693 1,11011 636 15�6% 12 341 763 1,10412 615 12�5% 13 265 622 88713 563 10�8% 14 242 418 66014 365 13�4% 15 206 321 52715 313 10�9% 16 174 265 43916 262 9�2% 17 152 214 36617 212 10�4% 18 108 178 28618 185 16�2% 19 75 148 22319 143 16�8% 20 58 76 13420 92 17�4% 21 20 57 7721 53 32�1% 22 8 25 33 22 16 18�8% 23 3 7 10 23 6 83�3% 24 1 0 1 24 1 100% 25 0 1 1
26 0 0 027 0 1 1

4 Hunt Arizona 2017
Bonus Points by Species
How to Use Survey and Harvest Data
Turkey (Accrue bonus points through both the spring and fall draws; Section A does NOT reflect individuals who purchased a bonus point)
A BResults of 2017 Spring Draw Going into the 2017 Fall Draw
Group Bonus Points going into the 2017 Spring
Draw
No� Hunters per Bonus Point going
into the 2017 Spring Draw
Percent Drawn during the 2017
Spring Draw within a Bonus Point
grouping
Individual Bonus Points going into the
2017 Fall Draw
No� of Hunters per Bonus Point going into the 2017 Fall Draw
Resident Nonresident Total0 2,238 24�8% 1 131,209 6,950 138,1591 4,731 34�5% 2 8,110 242 8,3522 3,451 40�7% 3 2,547 125 2,6723 1,528 45�6% 4 913 82 9954 568 67�3% 5 399 68 4675 305 62�6% 6 211 47 2586 152 39�5% 7 190 32 2227 118 21�2% 8 113 53 1668 85 11�8% 9 100 26 1269 62 17�7% 10 88 19 107
10 63 14�3% 11 88 19 10711 69 13% 12 70 6 7612 44 6�8% 13 68 8 7613 53 13�2% 14 32 9 4114 20 10% 15 29 4 3315 23 13% 16 20 6 2616 22 27�3% 17 20 10 3017 20 15% 18 18 1 1918 18 38�9% 19 12 4 1619 14 42�9% 20 5 2 7820 2 100% 21 1 4 521 1 100% 22 5 2 7
23 2 0 2
Javelina (Accrue bonus points through both the spring and fall draws; Section A does NOT reflect individuals who purchased a bonus point)
A BResults of the 2017 Spring Draw Going into the 2017 Fall Draw
Group Bonus Points going into the 2017 Spring
Draw
No� Hunters per Bonus Point going
into the 2017 Spring Draw
Percent Drawn during the 2017 Spring Draw within a Bonus Point grouping
Individual Bonus Points going into
the 2017 Fall Draw
No� of Hunters per Bonus Point going into the 2017 Fall Draw
(Spring Hunts) Resident Nonresident Total0 6,903 86�2% 1 132,590 7,247 139,8371 9,973 91% 2 1,570 230 1,8002 3,992 97% 3 169 131 3003 301 100% 4 44 71 1154 35 100% 5 27 60 875 11 100% 6 23 41 646 11 100% 7 10 18 287 4 100% 8 7 21 28
11 3 100% 9 2 22 2410 1 11 1211 1 15 1612 3 3 613 2 4 614 4 5 915 2 1 316 0 1 117 0 2 218 2 0 219 2 0 220 1 0 121 1 1 222 2 0 223 1 0 1

Hunt Arizona 2017 5
Bonus Points by Species
How to Use Survey and Harvest Data
Bighorn (Section A does NOT reflect individuals who purchased a bonus point)A B
Results of the 2016 Fall Draw Going into the 2017 Fall Draw
Group Bonus Points going into
the 2016 Fall Draw
No� Hunters per Bonus Point going into the
2016 Fall Draw
Percent Drawn during the 2016 Fall Draw
within a Bonus Point grouping
Individual Bonus Points going into the
2017 Fall Draw
No� of Hunters per Bonus Point going into the 2017 Fall Draw
Resident Nonresident Total0 1,484 0�00% 1 118,592 7,518 126,1101 1,593 0�00% 2 3,764 1,634 5,3982 1,401 0�14% 3 2,383 1,144 3,5273 797 0�13% 4 1,493 513 2,0064 725 0�00% 5 921 785 1,7065 1,094 0�27% 6 1,233 865 2,0986 905 0�44% 7 1,081 647 1,7287 659 0�61% 8 749 556 1,3058 595 0�17% 9 731 507 1,2389 605 0�50% 10 606 522 1,128
10 564 0�53% 11 594 470 1,06411 541 0�37% 12 560 424 98412 510 1�57% 13 520 393 91313 505 0�40% 14 461 337 79814 549 0�73% 15 477 358 83515 571 1�05% 16 518 307 82516 508 1�38% 17 445 236 68117 377 1�86% 18 348 189 53718 318 0�31% 19 287 162 44919 303 0�99% 20 235 158 39320 268 1�12% 21 252 111 36321 274 1�46% 22 239 117 35622 239 0�42% 23 227 87 31423 235 2�55% 24 190 83 27324 194 2�06% 25 144 67 21125 184 2�17% 26 171 44 21526 213 0�00% 27 201 34 23527 103 21�36% 28 84 4 88
Bear (Spring draw only) (Due to complications with the 2016 Spring Draw, draw results are unavailable)A B
Results of the 2017 Spring Draw Going into the 2018 Spring Draw
Group Bonus Points going into
the 2017 Fall Draw
No� Hunters per Bonus Point going into the 2017 Fall
Draw
Percent Drawn during the 2017 Fall Draw
within a Bonus Point grouping
Individual Bonus Points going into the 2018
Fall Draw
No� of Hunters per Bonus Point going into the 2018 Fall Draw
0 227 0�0% 1 131,423 6,839 138,2621 306 2�29% 2 873 54 9272 153 15�0% 3 277 17 2943 44 34�1% 4 139 14 1534 23 13�0% 5 74 6 805 8 50�0% 6 41 4 456 13 30�8% 7 19 2 217 1 100�0% 8 8 4 129 1 0�0% 9 10 2 12
10 1 0�0% 10 13 1 1411 2 0�0% 11 14 3 1712 1 100�0% 12 7 2 9

6 Hunt Arizona 2017
Bonus Points by Species
How to Use Survey and Harvest Data
Bison (Accrue bonus points through both the spring and fall draws; Section A does NOT reflect individuals who purchased a bonus point) (Due to complications with the 2016 Spring Draw, draw results are unavailable)
A BResults of the 2016 Fall Draw Going into the 2017 Fall Draw
Group Bonus Points going into
the 2016 Fall Draw
No� Hunters per Bonus Point going into the 2016 Fall
Draw
Percent Drawn during the 2016 Fall Draw
within a Bonus Point grouping
Individual Bonus Points going into the
2017 Fall Draw
No� of Hunters per Bonus Point going into the 2017 Fall Draw
Resident Nonresident Total0 282 1�8% 1 125,970 6,993 132,9631 383 3�4% 2 1,931 311 2,2422 246 4�9% 3 932 210 1,1423 170 5�3% 4 594 117 7114 103 5�8% 5 413 109 5225 80 3�8% 6 319 81 4006 54 1�9% 7 255 56 3117 43 9�3% 8 216 68 2848 71 2�8% 9 259 44 3039 45 2�2% 10 223 57 28010 42 2�4% 11 180 39 21911 37 8�1% 12 141 32 17312 28 0�0% 13 136 22 15813 29 3�5% 14 117 18 13514 21 4�8% 15 106 11 11715 17 0�0% 16 92 14 10616 16 6�3% 17 80 10 9017 20 10�0% 18 86 5 9118 19 15�8% 19 78 12 9019 25 4�0% 20 79 7 8620 17 0�0% 21 52 10 6221 20 0�0% 22 62 2 6422 21 4�8% 23 57 5 6223 15 0�0% 24 48 2 5024 13 0�0% 25 44 3 4725 11 0�0% 26 54 1 5526 10 10�0% 27 40 2 4227 15 6�7% 28 36 2 3828 8 87�5% 29 22 1 2329 7 100�0% 30 27 0 2730 0 0�0% 31 7 1 831 1 100�0% 32 6 0 632 0 0�0% 33 6 0 635 1 100�0% 34 1 0 1 35 2 0 2 36 2 1 3
37 1 0 1 40 1 0 1 41 0 1 1
43 2 0 244 1 0 1

Hunt Arizona 2017 7
This page intentionally left blank�

8 Hunt Arizona 2017
Deer
Two species of deer occur in Arizona, the mule deer (Odocoileus hemionus) and the white-tailed deer (Odocoileus virginianus).
Mule DeerNatural HistoryMule deer are the most abundant big-game animal in Arizona. They can be found in most areas of the state, from sparsely vegetated deserts upward into high, for-ested mountains. Rocky Mountain mule deer occur primarily in northern Arizona above the Mogollon Rim in game management units 1 through 13, while the so-called desert mule deer is found in all of the more southern units (15 through 46).
The mule deer gets its name from its large ears. Its coat is reddish-brown in summer, turning to a blue-gray or a chocolate brown in winter. The forehead is much darker than the face, while the animal’s throat, belly, and inner leg surfaces are white. One of the mule deer’s most distinguishing characteristics is a white rump patch and a narrow, black-tipped white tail.
The mule deer is the larger of Arizona’s deer species. Adult bucks may weigh more than 200 pounds and stand up to 42 inch-es tall at the shoulder. Does average about 125 pounds.
Mule deer antlers typically branch into two main beams, each of which may fork into two or more tines. The size and number of points is dependent on a combination of the buck’s age, nutrition, and genetic back-ground. The antlers develop under a layer of soft skin, called velvet, which supplies them with nutrients. When fully grown, the antlers harden and the now dry velvet is rubbed off. The
bony antlers are retained until spring, after the breeding season has passed. Buck deer are polygamous and use their antlers to intimidate other males and drive them away from the does during the winter breeding season.
After a gestation period of about 190 days, the does give birth to one or two spotted fawns. Fawns in northern Ari-zona are born in late spring, while those in southern Arizona usually arrive in midsummer. A fawn’s spots disappear in about two months. The young remain with their mother un-til the following spring. Both sexes attain maturity in about one year and have a life span of about 10 years.
Research has shown that mule deer population lev-els are largely determined by the number of fawns that survive to be yearlings. Fawn survival, in turn, is largely determined by climatic events, with wet, mild winters contributing to high fawn survival rates. Dry winters and springs usually result in poor fawn survival, and heavy snows and freezing temperatures occasionally re-duce the population levels of both fawn and adult Rocky Mountain mule deer. Another limiting factor for mule
GEO
RGE
AN
DRE
JKO

Hunt Arizona 2017 9
deer is preda-tion. In Arizona, the mountain lion is the prin-cipal mule deer predator.
Mule deer are primarily brows-ers, although they feed largely on forbs and new grass growth in the spring and summer. Other major diet items are twigs, bark,
buds, leaves, and nuts. Important browse plants include mountain mahogany, cliff rose, sagebrush, and oak in northern Arizona, with jojoba, buck brush, and moun-tain mahogany being favored in southern Arizona. Most feeding is done at dawn and dusk, although hu-man activity and a full moon may cause a shift to more feeding at night.
Hunt HistoryAs befits Arizona’s principal game animal, deer re-ceived some protection as early as 1887 when a four-month season of October 1 through January 31 was established by the territorial legislature. Buck-on-ly hunting was instituted in 1893, and the season was gradually reduced until 1913 when the new state legis-lature authorized a two-month season and a two-buck bag limit. Even this was deemed excessive by the state’s sportsmen, and a public initiative in 1916 reduced the limit to one buck deer to be taken during the month of October.
Despite a serious overpopulation of deer on the North Kaibab in the 1920s, deer numbers appeared to decline in the rest of the state. In 1929, the mule deer season was closed south of the Gila River, and even as recently as 1946, fewer than 5,000 mule deer (more than 80 percent of all deer killed) were harvested in Arizona. Then, for reasons that are still unclear, deer pop-ulations began to increase. As the populations rose, doe and “any-deer” hunts were authorized. In 1961, an all-time high of 91,120 deer hunters took 35,897 deer. More than 86 percent of these were mule deer and nearly 10,000 were antlerless animals. Archery deer hunting was also now be-ginning to provide a significant hunting opportunity.
A series of years of poor fawn survival followed. By 1970 fewer than 16,000 deer were taken, and hunt success had fallen to 16 percent. With the institution of permit-only deer hunting the following year, hunter numbers dropped from more than 97,000 to fewer than 68,000. Only about 9,500 mule deer were reported harvested.
Deer permit numbers gradually increased after 1972, leveling off at around 70,000 per year between 1976 and 1982, when hunters took more than 12,000 mule deer, approximately 75 percent of the total deer harvest. Then, a series of wet winters resulted in an increase in fawn survival rates, and hunter numbers and the num-bers of deer bagged increased accordingly until 1986, when nearly 86,000 hunters took 25,566 deer, of which 77 percent were mule deer.
Since then, another series of droughts has occurred, and deer hunting opportunity is again being curtailed. Today, about 47,000 permits are offered with hunt suc-cess between 21 percent and 28 percent; 60 percent of the total deer harvested today are mule deer. Prospects in the near future are still discouraging, but mule deer are “boom and bust” animals. With the advent of bet-ter than average winter rains, mule deer populations will once again improve.
White-tailed DeerNatural HistoryArizona’s other deer is a small subspecies of the white-tailed deer. These Coues (pronounced Cows) deer are most common in the state’s southeastern mountains, but range northward to the edge of the Mogollon Rim, up into the White Mountains, and as far west as Syca-more Canyon in Unit 8. Coues whitetails require areas of predictable summer precipitation and are most common in oak woodlands and on chaparral covered hillsides with oaks and pines. This species, while more resilient than mule deer to hunt pressure, is less tolerant of droughts and appears to be more affected by live-stock grazing.
In contrast to the mule deer’s branching antlers, the tines or points of a whitetail’s antlers originate from a forward-curving main beam. Mature bucks generally have three to four tines per side. The coat color is gray-ish-brown salt-and-pepper with white underparts; the face is marked with white halos around the eyes and a white band across the muzzle. The most distinguishing characteristic of the whitetail, however, is a long, fluffy tail that is all white on the underside, gray to reddish-black on top, and often lifted upward as an alarm signal.
The Coues deer is much smaller than most of its eastern cousins. Bucks stand just over 30 inches at the shoulder and rarely weigh more than 100 pounds. Does average 65 pounds. The rutting season usually runs from December through February, and the fawn drop coincides with the new growth of forbs that results from the summer rains.
A doe’s first pregnancy usually results in a single fawn; thereafter she may bear twins. White-tailed deer fawns may stay with their mothers for more than a year, and seeing two generations running together is not uncom-
Mule deer distribution

10 Hunt Arizona 2017
Deer
mon. Unlike mule deer, white-tailed deer rarely form herds, and most observations are of fewer than six animals.
When seen at a distance, white-tailed deer can often be distinguished from mule deer by their cautious, run-ning gait and flagging white tail. Whitetails never use the stiff legged, bounding gait sometimes employed by mule deer. Habitat preferences also differ. In Arizo-na’s southern mountain ranges, whitetails are generally found at higher elevations and in rougher country than are mule deer.
Hunt HistoryThe Coues white-tailed deer is perhaps Arizona’s finest game animal. Wary, and expert at using cover, white-
tails rarely offer the hunter a standing shot once jumped. Per-haps for this reason, the species has become increasingly impor-tant in the harvest. Although the statewide take has varied from 1,500 to more than 7,000 white-tails a year, depending on the vagaries of drought and fawn survival, the recent trend has been for this species to constitute an ever greater proportion of the statewide harvest. For example, whitetails comprised less than 15 percent of Arizona’s deer har-vest in 1961, nearly 40 percent in 1998 , and just over 40 percent today.G
EORG
E A
ND
REJK
O
White-tailed deer distribution

Hunt Arizona 2017 11
Deer Survey DataHistoric Summary of Mule Deer Survey Data
Year Bucks Does Fawns Unclassified Total Bucks/100 Does Fawns/100 Does 1948 95 293 143 77 608 32 491949 149 387 189 73 798 39 491950 373 1326 690 103 2492 28 521951 432 1553 887 424 3296 28 571952 804 2398 1551 747 5500 34 651953 636 2101 1512 559 4808 30 721954 616 2373 1020 553 4562 26 431955 1052 2276 841 594 4763 46 371956 352 1184 539 279 2354 30 461957 735 2079 886 540 4240 35 431958 552 1810 1057 350 3769 31 581959 1049 2748 1388 698 5883 38 511960 1125 2890 1179 409 5603 39 411961 1162 2806 1212 522 5702 41 431962 1213 3072 1205 478 5968 39 391963 1185 3186 1189 350 5910 37 371964 1118 3269 1467 353 6207 34 451965 1260 3460 1775 377 6872 36 511966 1299 4370 2240 486 8395 30 511967 1341 4715 2462 320 8838 28 521968 1029 3708 1620 324 6681 28 441969 1173 4494 2324 392 8383 26 521970 1306 5218 2669 383 9576 25 511971 1551 6018 2649 597 10815 26 441972 1262 4385 2093 346 8086 29 481973 1089 4363 2514 286 8252 25 581974 1009 4184 1999 319 7511 24 481975 1126 4275 1911 439 7751 26 451976 1029 4320 1820 263 7432 24 421977 1022 4402 1696 467 7587 23 391978 1329 5719 2573 472 10093 23 451979 1119 4824 2249 288 8480 23 471980 1255 5815 2428 311 9809 22 421981 1367 6315 2694 254 10630 22 431982 1299 5992 3033 249 10573 22 511983 1360 6540 3361 361 11622 21 511984 1401 6259 3411 407 11478 22 551985 2102 9093 4312 345 15852 23 471986 2148 10521 4989 210 17868 20 471987 2227 10193 4139 175 16734 22 411988 2157 11383 4577 145 18262 19 401989 1976 10272 3465 214 15927 19 341990 1778 10361 4024 203 16366 17 391991 1798 10532 4444 220 16994 17 421992 1689 9500 4332 100 15621 18 461993 1910 10177 4190 167 16444 19 411994 2103 11504 3833 159 17599 18 331995 1820 11082 3668 265 16835 16 331996 1590 9954 3001 124 14669 16 301997 1351 8756 3168 100 13375 15 361998 1404 8041 3919 53 13417 17 491999 1705 8559 3786 44 14094 20 442000 1732 8416 2794 80 13022 21 332001 1502 7408 3051 45 12006 20 412002 1321 7069 1838 142 10370 19 262003 1268 6190 2524 36 10018 20 412004 1134 5148 2309 59 8650 22 452005 1054 4738 2333 69 8194 22 492006 1146 5143 2150 89 8528 22 422007 1180 4931 2071 59 8241 24 422008 1132 4164 1965 106 7367 27 472009 1006 4380 1683 26 7095 23 382010 993 4581 1960 68 7602 22 432011 1206 5589 2494 71 9360 22 452012 1285 5829 2675 77 9866 22 462013 1403 6193 2953 65 10614 23 482014 1399 5735 2794 30 9958 24 322015 1736 6573 3188 74 11571 26 492016 1631 6049 2795 87 10562 27 46

12 Hunt Arizona 2017
Deer Survey DataHistoric Summary of White-tailed Deer Survey Data
Year Bucks Does Fawns Unclassified Total Bucks/100 Does Fawns/100 Does 1947 58 72 11 26 167 81 151948 32 96 61 54 243 33 641949 49 95 37 67 248 52 391950 136 223 109 108 576 61 491951 25 68 22 23 138 37 321952 145 272 139 146 702 53 511953 151 336 387 181 1055 45 1151954 367 828 309 204 1708 44 371955 227 497 217 120 1061 46 441956 247 533 167 219 1166 46 311957 266 455 147 170 1038 58 321958 221 420 148 88 877 53 351959 177 453 137 93 860 39 301960 159 440 164 124 887 36 371961 266 484 174 113 1037 55 361962 263 586 193 135 1177 45 331963 291 630 212 152 1285 46 341964 291 581 243 143 1258 50 421965 211 502 224 124 1061 42 451966 222 484 222 100 1028 46 461967 164 391 164 80 799 42 421968 152 382 144 105 783 40 381969 131 350 152 71 704 37 431970 149 373 138 49 709 40 371971 170 398 150 94 812 43 381972 145 312 133 70 660 46 431973 113 316 149 54 632 36 471974 101 244 95 54 494 41 391975 147 448 195 65 855 33 441976 171 577 183 73 1004 30 321977 165 577 178 76 996 29 311978 202 644 336 84 1266 31 521979 226 752 312 54 1344 30 411980 306 766 267 62 1401 40 351981 329 1069 404 48 1850 31 381982 315 1020 471 59 1865 31 461983 296 978 528 50 1852 30 541984 283 1016 538 56 1893 28 531985 424 1388 690 42 2544 31 501986 439 1403 544 112 2498 31 391987 444 1648 493 34 2619 27 301988 425 1584 551 29 2589 27 351989 461 1749 567 87 2864 26 321990 568 1970 742 53 3333 29 381991 483 1814 671 107 3075 27 371992 466 1859 634 58 3017 25 341993 479 1764 528 62 2833 27 301994 541 2000 518 192 3251 27 261995 538 2227 588 102 3455 24 261996 620 2697 729 91 4137 23 271997 484 2380 569 45 3478 20 241998 475 1967 679 52 3173 24 351999 422 1885 679 32 3018 22 362000 405 1734 499 57 2695 23 292001 451 1925 711 132 3219 23 372002 475 2023 558 44 3100 23 282003 550 2165 761 45 3521 25 352004 636 2423 777 45 3881 26 322005 544 2031 738 41 3354 27 362006 581 2055 738 38 3412 28 362007 684 2319 800 56 3859 30 352008 658 2164 799 33 3654 30 372009 529 1876 571 30 3006 28 302010 621 1928 555 50 3154 32 292011 649 2480 724 42 3895 26 292012 595 2146 647 38 3426 28 302013 670 2546 826 44 4086 26 322014 652 2454 783 41 3930 27 322015 798 2744 1074 63 4679 29 392016 972 2995 1203 50 5220 32 40

Hunt Arizona 2017 13
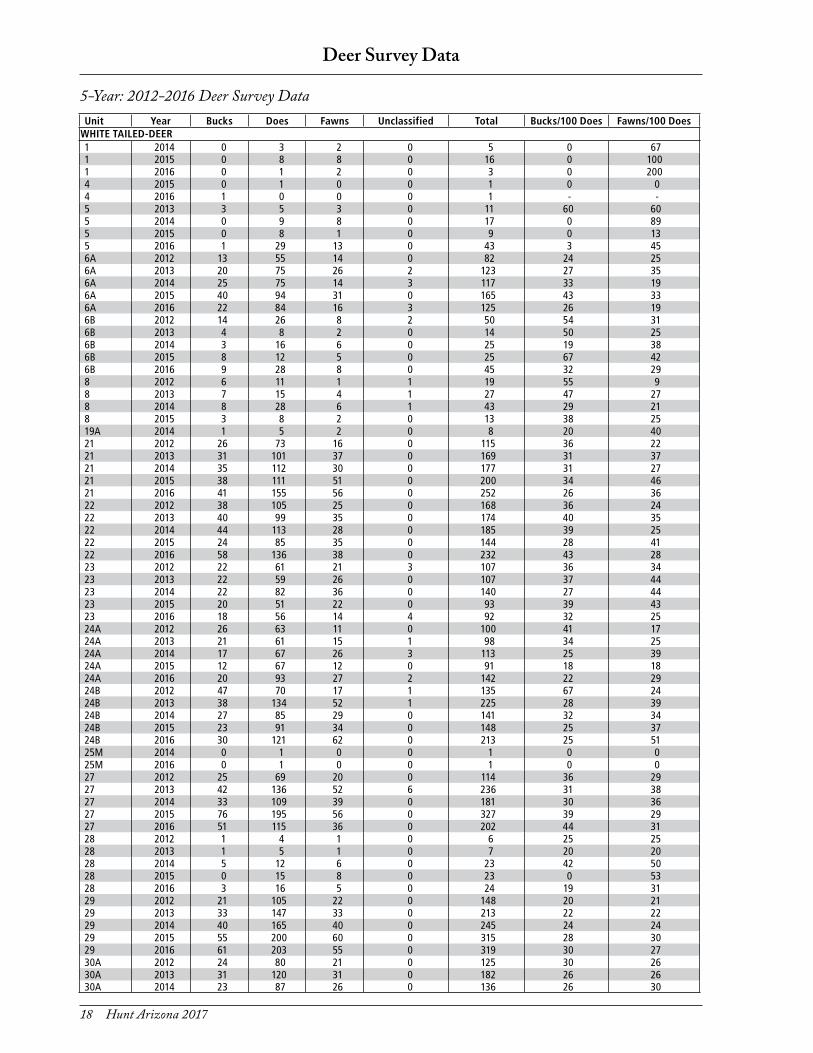
Deer Survey Data
5-Year: 2012-2016 Deer Survey DataUnit Year Bucks Does Fawns Unclassified Total Bucks/100 Does Fawns/100 DoesMULE DEER1 2012 15 79 29 0 123 19 371 2013 14 60 22 0 96 23 371 2014 17 59 20 0 96 29 341 2015 32 132 41 0 205 24 311 2016 19 91 41 16 167 21 452 2012 10 46 21 0 77 22 462 2013 5 24 9 0 38 21 382 2014 4 11 3 0 18 36 272 2015 9 57 21 0 87 16 372 2016 6 19 5 0 30 32 263A/3C 2012 22 75 47 0 144 29 633A/3C 2013 48 181 98 0 327 27 543A/3C 2014 25 121 66 0 212 21 553A/3C 2015 44 219 100 1 364 20 463A/3C 2016 29 86 48 1 164 34 563B 2012 6 24 15 3 48 25 633B 2013 6 42 25 0 73 14 603B 2014 1 6 3 0 10 17 503B 2015 5 13 8 0 26 38 623B 2016 1 12 3 0 16 8 254 2012 24 44 24 0 92 55 554 2013 21 43 25 0 89 49 584 2014 8 27 15 0 50 30 564 2015 20 36 21 0 77 56 584 2016 6 19 9 0 34 32 475 2012 28 118 52 0 198 24 445 2013 39 112 55 1 207 35 495 2014 41 181 116 1 339 23 645 2015 40 138 93 0 271 29 675 2016 83 311 190 5 589 27 616A 2012 18 95 26 4 143 19 276A 2013 28 135 49 1 213 21 366A 2014 29 113 49 0 191 26 436A 2015 37 194 90 0 321 19 466A 2016 19 91 53 0 163 21 586B 2012 26 119 47 8 200 22 406B 2013 20 146 62 0 228 14 426B 2014 23 80 33 4 140 29 416B 2015 30 102 53 0 185 29 526B 2016 45 177 77 5 304 25 447 2012 37 193 89 0 319 19 467 2013 14 59 29 0 102 24 497 2014 32 126 34 0 192 25 277 2015 42 139 82 0 263 30 597 2016 39 248 103 0 396 16 448 2012 50 194 87 0 331 26 458 2013 27 144 36 0 207 19 258 2014 24 119 45 0 188 20 388 2015 38 148 43 0 229 26 299 2012 20 141 78 0 239 14 559 2013 14 100 45 0 159 14 459 2014 6 90 53 6 155 7 599 2015 13 80 51 0 144 16 649 2016 13 88 44 0 145 15 5010 2012 24 150 42 0 216 16 2810 2013 17 77 18 0 112 22 2310 2014 17 135 39 0 191 13 2910 2015 15 56 21 0 92 27 3810 2016 18 52 21 0 91 35 4012AE 2012 20 99 82 0 201 20 8312AE 2013 30 81 67 0 178 37 8312AE 2014 36 98 76 0 210 37 7812AE 2015 31 105 83 0 219 30 7912AE 2016 17 32 45 0 94 53 141

14 Hunt Arizona 2017
Deer Survey Data
5-Year: 2012-2016 Deer Survey DataUnit Year Bucks Does Fawns Unclassified Total Bucks/100 Does Fawns/100 DoesMULE DEER12AW 2012 57 180 198 0 435 32 11012AW 2013 112 350 356 7 825 32 10212AW 2014 128 344 283 2 757 37 8212AW 2015 193 347 276 0 816 56 8012AW 2016 155 306 266 0 727 51 8712B 2012 22 71 57 3 153 31 8012B 2013 31 110 83 10 234 28 7512B 2014 26 54 94 0 174 48 17412B 2015 31 72 62 0 165 43 8612B 2016 90 212 159 0 461 42 7512BW 2015 31 102 81 14 228 30 7913A 2012 15 48 50 0 113 31 10413A 2013 29 77 76 0 182 38 9913A 2014 49 82 68 0 199 60 8313A 2015 33 76 70 0 179 43 9213A 2016 41 35 12 0 88 117 3413B 2012 41 82 76 0 199 50 9313B 2013 48 176 104 0 328 27 5913B 2014 65 154 89 0 308 42 5813B 2015 66 131 79 0 276 50 6013B 2016 28 50 25 0 103 56 5015A 2012 2 9 1 0 12 22 1115A 2013 7 35 6 0 48 20 1715A 2014 14 37 7 0 58 38 1915A 2015 6 32 0 0 38 19 015B 2012 4 22 13 2 41 18 5915B 2013 28 145 39 0 212 19 2715B 2014 29 97 30 2 158 30 3115B 2015 39 92 29 0 160 42 3215B 2016 16 46 2 0 64 35 416A 2012 15 33 8 0 56 45 2416A 2013 7 38 5 0 50 18 1316A 2014 9 36 8 0 53 25 2216A 2015 21 48 26 0 95 44 5416A 2016 16 47 21 0 84 34 4517A 2012 12 58 8 0 78 21 1417A 2013 7 27 2 0 36 26 717A 2014 9 27 12 0 48 33 4417A 2015 16 56 14 2 88 29 2517A 2016 12 33 7 0 52 36 2117B 2012 36 97 30 0 163 37 3117B 2013 27 99 37 0 163 27 3717B 2014 24 95 33 0 152 25 3517B 2015 47 191 89 0 327 25 4717B 2016 31 133 44 0 208 23 3318A 2012 9 76 17 0 102 12 2218A 2013 11 51 13 0 75 22 2518A 2014 9 51 18 0 78 18 3518A 2015 12 25 4 0 41 48 1618A 2016 10 75 6 0 91 13 818B 2012 28 183 41 0 252 15 2218B 2013 22 132 48 0 202 17 3618B 2014 7 54 1 0 62 13 218B 2015 26 150 36 0 212 17 2418B 2016 24 121 47 0 192 20 3919A 2012 14 91 30 0 135 15 3319A 2013 9 56 11 0 76 16 2019A 2014 19 71 36 0 126 27 5119A 2015 15 47 19 0 81 32 4019A 2016 21 121 35 21 198 17 2919B 2012 15 51 21 2 89 29 4119B 2013 17 44 17 0 78 39 3919B 2014 10 34 12 0 56 29 3519B 2015 16 29 15 4 64 55 5219B 2016 14 32 13 1 60 44 41

Hunt Arizona 2017 15
Deer Survey Data
5-Year: 2012-2016 Deer Survey DataUnit Year Bucks Does Fawns Unclassified Total Bucks/100 Does Fawns/100 DoesMULE DEER20A 2012 9 33 8 0 50 27 2420A 2013 20 57 20 0 97 35 3520A 2014 4 19 4 0 27 21 2120A 2015 34 136 45 0 215 25 3320A 2016 20 83 30 3 136 24 3620B 2012 21 87 31 0 139 24 3620B 2013 23 64 28 0 115 36 4420B 2014 11 38 26 0 75 29 6820B 2015 29 66 25 5 125 44 3820B 2016 43 117 42 0 202 37 3620C 2012 32 84 53 0 169 38 6320C 2013 42 106 51 0 199 40 4820C 2014 55 162 99 0 316 34 6120C 2015 33 89 37 17 176 37 4220C 2016 44 203 58 0 305 22 2921 2012 22 119 35 0 176 18 2921 2013 37 161 94 6 298 23 5821 2014 43 178 74 0 295 24 4221 2015 28 132 64 0 224 21 4821 2016 36 135 59 0 230 27 4422 2012 20 104 47 0 171 19 4522 2013 19 88 47 0 154 22 5322 2014 37 137 67 0 241 27 4922 2015 22 112 56 0 190 20 5022 2016 20 75 29 0 124 27 3923 2012 22 131 77 1 231 17 5923 2013 22 156 99 0 277 14 6323 2014 37 178 86 0 301 21 4823 2015 28 132 70 0 230 21 5323 2016 19 104 53 0 176 18 5124A 2012 27 90 34 1 152 30 3824A 2013 24 105 41 1 171 23 3924A 2014 16 86 31 0 133 19 3624A 2015 12 112 28 0 152 11 2524A 2016 22 132 37 0 191 17 2824B 2012 20 134 51 0 205 15 3824B 2013 15 96 51 0 162 16 5324B 2014 13 89 58 1 161 15 6524B 2015 19 96 47 0 162 20 4924B 2016 21 112 67 0 200 19 6025M 2012 12 41 17 0 70 29 4125M 2013 23 62 21 0 106 37 3425M 2014 34 83 54 0 171 41 6525M 2015 36 75 27 0 138 48 3625M 2016 31 90 31 0 152 34 3427 2012 44 273 103 3 423 16 3827 2013 59 297 92 0 448 20 3127 2014 48 283 114 0 445 17 4027 2015 77 409 159 0 645 19 3927 2016 101 467 203 0 771 22 4328 2012 25 141 64 1 231 18 4528 2013 18 144 62 0 224 13 4328 2014 23 148 70 0 241 16 4728 2015 34 146 88 0 268 23 6028 2016 56 205 82 0 343 27 4029 2012 15 124 30 0 169 12 2429 2013 14 78 23 0 115 18 2929 2014 26 97 34 0 157 27 3529 2015 24 119 46 0 189 20 3929 2016 28 104 36 0 168 27 3530A 2012 38 154 69 0 261 25 4530A 2013 22 151 73 0 246 15 4830A 2014 47 180 90 5 322 26 5030A 2015 39 161 94 0 294 24 58

16 Hunt Arizona 2017
Deer Survey Data
5-Year: 2012-2016 Deer Survey DataUnit Year Bucks Does Fawns Unclassified Total Bucks/100 Does Fawns/100 DoesMULE DEER30A 2016 65 257 96 0 418 25 3730B 2012 23 133 65 2 223 17 4930B 2013 15 79 38 0 132 19 4830B 2014 2 21 15 0 38 10 7130B 2015 42 227 92 0 361 19 4130B 2016 65 257 96 0 418 25 3731 2012 11 130 46 0 187 8 3531 2013 25 194 82 0 301 13 4231 2014 35 173 61 0 269 20 3531 2015 34 145 46 0 225 23 3231 2016 29 133 60 0 222 22 4532 2012 35 292 106 10 443 12 3632 2013 40 323 149 14 526 12 4632 2014 36 378 163 0 577 10 4332 2015 59 422 202 10 693 14 4832 2016 61 339 151 15 566 18 4533 2012 16 87 44 12 159 18 5133 2013 9 110 42 2 163 8 3833 2014 11 56 20 0 87 20 3633 2015 18 157 77 1 253 11 4933 2016 17 98 57 0 172 17 5834 2012 7 33 4 1 45 21 1234 2013 10 44 4 0 58 23 934 2014 16 38 4 0 58 42 1134 2015 7 80 47 0 134 9 5935 2012 4 46 29 0 79 9 6335 2013 11 62 33 1 107 18 5335 2014 7 52 23 0 82 13 4435 2015 5 25 13 0 43 20 5235A 2012 4 39 24 0 67 10 6235A 2013 10 55 29 1 95 18 5335A 2014 7 47 19 0 73 15 4035A 2015 3 20 10 0 33 15 5035A 2016 14 57 24 0 95 25 4235B 2012 0 7 5 0 12 0 7135B 2013 1 7 4 0 12 14 5735B 2014 0 5 4 0 9 0 8035B 2015 2 5 3 0 10 40 6035B 2016 2 16 10 0 28 13 6336A 2012 20 187 109 15 331 11 5836A 2013 21 154 86 3 264 14 5636A 2014 28 195 64 1 288 14 3336A 2015 22 121 74 4 221 18 6136A 2016 14 88 37 0 139 16 4236B 2012 17 152 57 2 228 11 3836B 2013 4 71 33 1 109 6 4636B 2014 8 104 49 0 161 8 4736B 2015 2 50 19 2 73 4 3836B 2016 3 45 25 0 73 7 5636C 2012 8 69 31 0 108 12 4536C 2013 5 39 16 0 60 13 4136C 2014 5 38 13 0 56 13 3436C 2015 3 37 24 0 64 8 6537 2012 79 149 85 0 313 53 5737 2013 34 196 76 0 306 17 3937 2014 16 91 51 0 158 18 5637 2015 25 87 50 0 162 29 5737A 2012 9 30 9 0 48 30 3037A 2013 8 29 7 0 44 28 2437A 2014 5 14 7 0 26 36 5037A 2015 12 34 17 0 63 35 5037A 2016 19 52 34 0 105 37 6537B 2012 20 82 51 0 153 24 6237B 2013 26 167 69 0 262 16 41

Hunt Arizona 2017 17
Deer Survey Data
5-Year: 2012-2016 Deer Survey DataUnit Year Bucks Does Fawns Unclassified Total Bucks/100 Does Fawns/100 DoesMULE DEER37B 2014 11 77 44 0 132 14 5737B 2015 22 81 48 0 151 27 5937B 2016 37 115 43 0 195 32 3739 2011 2 18 0 0 20 11 039 2012 5 22 9 0 36 23 4139 2013 6 36 24 7 73 17 6739 2014 20 73 48 0 141 27 6639 2015 21 57 20 0 98 37 3539 2016 20 49 26 0 95 41 5340A 2012 2 3 1 0 6 67 3340A 2013 8 6 2 0 16 133 3340A 2014 7 23 9 0 39 30 3940A 2015 9 3 0 0 12 300 040A 2016 23 39 12 0 74 59 3141 2012 16 103 50 1 170 16 4941 2013 29 82 57 4 172 35 7041 2014 22 118 41 0 181 19 3541 2015 28 76 26 1 131 37 3441 2016 12 58 12 2 84 21 2142 2012 19 92 39 0 150 21 4242 2013 13 44 31 1 89 30 7042 2014 39 76 47 0 162 51 6242 2015 13 42 15 4 74 31 3642 2016 19 57 33 5 114 33 5843A 2012 0 1 2 0 3 0 20043A 2013 2 16 6 0 24 13 3843A 2014 2 16 6 2 26 13 3843A 2015 1 5 1 0 7 20 2043A 2016 0 6 3 0 9 0 5043B 2012 1 6 2 0 9 17 3343B 2013 2 23 10 0 35 9 4343B 2014 1 3 2 0 6 33 6743B 2015 4 29 7 0 40 14 2443B 2016 3 8 5 0 16 38 6344A 2012 19 76 27 0 122 25 3644A 2013 14 27 13 0 54 52 4844A 2014 27 35 14 0 76 77 4044A 2015 10 21 9 1 41 48 4344A 2016 10 30 12 0 52 33 4045 2012 31 108 33 3 175 29 3145 2013 27 68 36 5 136 40 5345 2014 23 84 36 6 149 27 4345 2015 19 43 19 8 89 44 4445 2016 38 122 39 12 211 31 32
18 Hunt Arizona 2017
Deer Survey Data
Unit Year Bucks Does Fawns Unclassified Total Bucks/100 Does Fawns/100 DoesMULE DEER1 2014 0 3 2 0 5 0 671 2015 0 8 8 0 16 0 1001 2016 0 1 2 0 3 0 2004 2015 0 1 0 0 1 0 04 2016 1 0 0 0 1 - -5 2013 3 5 3 0 11 60 605 2014 0 9 8 0 17 0 895 2015 0 8 1 0 9 0 135 2016 1 29 13 0 43 3 456A 2012 13 55 14 0 82 24 256A 2013 20 75 26 2 123 27 356A 2014 25 75 14 3 117 33 196A 2015 40 94 31 0 165 43 336A 2016 22 84 16 3 125 26 196B 2012 14 26 8 2 50 54 316B 2013 4 8 2 0 14 50 256B 2014 3 16 6 0 25 19 386B 2015 8 12 5 0 25 67 426B 2016 9 28 8 0 45 32 298 2012 6 11 1 1 19 55 98 2013 7 15 4 1 27 47 278 2014 8 28 6 1 43 29 218 2015 3 8 2 0 13 38 2519A 2014 1 5 2 0 8 20 4021 2012 26 73 16 0 115 36 2221 2013 31 101 37 0 169 31 3721 2014 35 112 30 0 177 31 2721 2015 38 111 51 0 200 34 4621 2016 41 155 56 0 252 26 3622 2012 38 105 25 0 168 36 2422 2013 40 99 35 0 174 40 3522 2014 44 113 28 0 185 39 2522 2015 24 85 35 0 144 28 4122 2016 58 136 38 0 232 43 2823 2012 22 61 21 3 107 36 3423 2013 22 59 26 0 107 37 4423 2014 22 82 36 0 140 27 4423 2015 20 51 22 0 93 39 4323 2016 18 56 14 4 92 32 2524A 2012 26 63 11 0 100 41 1724A 2013 21 61 15 1 98 34 2524A 2014 17 67 26 3 113 25 3924A 2015 12 67 12 0 91 18 1824A 2016 20 93 27 2 142 22 2924B 2012 47 70 17 1 135 67 2424B 2013 38 134 52 1 225 28 3924B 2014 27 85 29 0 141 32 3424B 2015 23 91 34 0 148 25 3724B 2016 30 121 62 0 213 25 5125M 2014 0 1 0 0 1 0 025M 2016 0 1 0 0 1 0 027 2012 25 69 20 0 114 36 2927 2013 42 136 52 6 236 31 3827 2014 33 109 39 0 181 30 3627 2015 76 195 56 0 327 39 2927 2016 51 115 36 0 202 44 3128 2012 1 4 1 0 6 25 2528 2013 1 5 1 0 7 20 2028 2014 5 12 6 0 23 42 5028 2015 0 15 8 0 23 0 5328 2016 3 16 5 0 24 19 3129 2012 21 105 22 0 148 20 2129 2013 33 147 33 0 213 22 2229 2014 40 165 40 0 245 24 2429 2015 55 200 60 0 315 28 3029 2016 61 203 55 0 319 30 2730A 2012 24 80 21 0 125 30 2630A 2013 31 120 31 0 182 26 2630A 2014 23 87 26 0 136 26 30
5-Year: 2012-2016 Deer Survey Data
WHITE TAILED-DEER

Hunt Arizona 2017 19
Deer Survey Data
Unit Year Bucks Does Fawns Unclassified Total Bucks/100 Does Fawns/100 DoesMULE DEER30A 2015 31 90 45 0 166 34 5030A 2016 41 135 39 1 216 30 2930B 2012 26 91 8 3 128 29 930B 2013 30 83 25 1 139 36 3030B 2014 35 129 63 1 228 27 4930B 2015 35 115 44 0 194 30 3830B 2016 38 108 52 1 199 35 4831 2012 14 84 17 0 115 17 2031 2013 20 100 34 0 154 20 3431 2014 18 81 21 0 120 22 2631 2015 28 101 32 0 161 28 3231 2016 31 101 27 0 159 31 2732 2012 29 101 31 2 163 29 3132 2013 28 114 34 2 178 25 3032 2014 35 133 31 8 207 26 2332 2015 38 135 45 9 227 28 3332 2016 47 149 43 4 243 32 2933 2012 77 294 116 1 488 26 3933 2013 37 240 98 0 375 15 4133 2014 55 240 92 3 390 23 3833 2015 66 256 141 0 463 26 5533 2016 63 282 189 4 538 22 6734A 2012 27 168 51 1 247 16 3034A 2013 51 222 56 5 334 23 2534A 2014 36 146 36 4 222 25 2534A 2015 53 165 77 4 299 32 4734A 2016 55 174 103 0 332 32 5934B 2012 16 77 21 2 116 21 2734B 2013 27 93 14 2 136 29 1534B 2014 23 81 20 1 125 28 2534B 2015 34 92 40 1 167 37 4334B 2016 30 55 24 5 114 55 4435A 2012 34 102 22 6 164 33 2235A 2013 37 81 30 0 148 46 3735A 2014 18 85 28 2 133 21 3335A 2015 36 95 23 2 156 38 2435A 2016 48 117 51 10 226 41 4435B 2012 35 174 71 1 281 20 4135B 2013 36 149 51 2 238 24 3435B 2014 44 193 65 2 304 23 3435B 2015 37 190 81 5 313 19 4335B 2016 60 152 65 0 277 39 4336A 2012 28 126 55 6 215 22 4436A 2013 36 146 65 17 264 25 4536A 2014 29 163 60 5 257 18 3736A 2015 19 130 35 4 188 15 2736A 2016 56 164 58 3 281 34 3536B 2012 20 125 43 3 191 16 3436B 2013 34 192 56 2 284 18 2936B 2014 33 142 47 5 227 23 3336B 2015 47 217 93 3 360 22 4336B 2016 44 135 65 2 246 33 4836C 2012 20 76 34 6 136 26 4536C 2013 36 156 43 2 237 23 2836C 2014 50 156 42 1 249 32 2736C 2015 23 74 30 0 127 31 4136C 2016 28 100 34 0 162 28 3437A 2012 1 0 0 0 1 - -37A 2014 1 2 0 1 4 50 037A 2015 0 2 1 0 3 0 5037A 2016 4 6 1 1 12 67 1737B 2012 5 6 1 0 12 83 1737B 2013 5 5 3 0 13 100 6037B 2015 1 1 0 0 2 100 037B 2016 2 1 0 0 3 200 040A 2016 2 9 4 0 15 22 44FTHU 2015 51 135 62 35 283 38 46
5-Year: 2012-2016 Deer Survey Data
WHITE TAILED-DEER (continued)

20 Hunt Arizona 2017
Deer Hunt Data
Historic Summary of General Deer Hunts1
Year2 1st Choice Applicants
PermitsIssued Hunters Hunter
Days
Deer HarvestPercent SuccessMule Deer Whitetail
TotalBucks Antlerless Bucks Antlerless
1946 – – – – 4733 – 991 – 5724 –1947 – – – – 6420 – 1152 – 7572 –1948 – – – – 7358 – 1347 – 8705 –1949 – – – – 7465 386 1203 – 9054 –1950 – – – – 9009 798 1175 – 10982 –1951 – – – – 9618 658 1234 – 11510 –1952 – – – – 10575 2707 1490 – 14772 –1953 – – – – 12590 3948 1791 – 18329 –1954 – – – – 11662 6425 1500 – 19587 –1955 – – 53791 – 15220 5483 1489 300 22492 421956 – – 64123 – 16175 8943 2066 357 27541 431957 – – 56499 – 15307 4859 1808 593 22567 401958 – – 76358 259876 17994 9840 3394 1702 32930 431959 – – 78102 290686 16329 7769 3105 1687 28890 371960 – – 87986 318806 19291 8380 3871 1111 32653 371961 – – 91120 350200 22459 8307 3891 843 35500 391962 – – 93337 373035 16658 7579 3211 983 28431 311963 – – 92594 371619 14082 6262 2859 1463 24666 271964 – – 86867 335508 12613 2362 3207 1116 19298 221965 – – 87548 316911 11357 2002 2871 741 16971 191966 – – 88230 354586 12158 2040 2390 597 17185 201967 – – 90361 365358 12350 1388 2404 258 16400 181968 – – 88253 359684 12298 741 2722 205 15966 181969 – – 91575 358833 12203 567 2124 78 14972 161970 – – 97113 395038 13167 420 2197 35 15819 161971 – 77437 67263 256100 9129 334 1517 18 10998 161972 66905 74096 63269 241882 9137 338 1653 17 11145 181973 83334 75200 64120 243322 11114 402 2080 22 13618 211974 79664 82650 72352 255592 11715 533 3221 0 15469 211975 80929 79750 69262 253721 12576 408 2870 0 15854 231976 86829 83125 72049 228763 10578 261 2656 0 13495 191977 83593 84265 72472 255850 9871 6 2295 24 12196 171978 84017 81675 69709 264624 9075 38 2247 40 11400 161979 85072 78215 66451 270068 10347 0 3207 54 13608 211980 94285 79409 66909 278520 11111 0 3480 46 14637 221981 92679 77755 66308 274028 10825 0 3466 38 14329 221982 91673 83045 71123 296368 12187 0 3965 34 16186 231983 71826 94285 77106 309699 12767 0 4173 51 16991 221984 72989 92545 82618 328231 17102 0 7030 75 24207 291985 80014 92345 84079 333156 16292 273 6782 110 23457 281986 82982 94871 84687 331015 16493 2961 5829 86 25369 301987 84145 87340 79557 304440 15081 2191 4777 92 22141 281988 85084 79135 72796 290084 13744 1781 4505 75 20105 281989 84485 75925 69974 277264 13516 694 4293 84 18587 271990 82911 76620 70901 284643 11278 2809 4368 62 18517 261991 79466 68304 63109 256780 12101 0 5268 76 17445 281992 85343 68910 64143 256592 11997 0 5639 75 17711 281993 87558 70348 65151 260399 11879 0 5489 58 17426 271994 92904 68849 63330 256856 10867 0 5336 0 16203 261995 92139 63708 58649 242281 8824 0 4876 0 13700 231996 88529 57570 52679 212116 7229 0 4091 0 11320 221997 89627 51222 47210 195719 6065 0 4154 33 10252 221998 88329 46694 42753 173577 5877 0 4095 7 9979 24
1 Muzzleloader hunt data included up until 1984� Youth-0nly hunt data not included in this table�2 1994 and 1995 data does not include results of hunts at Ft� Huachuca� Beginning with 1996, Ft� Huachuca data is based on questionnaire returns,
not data gathered by the Fort�

Hunt Arizona 2017 21
Deer Hunt Data
Historic Summary of General Deer Hunts1
Year2 1st Choice Applicants
PermitsIssued Hunters Hunter
Days
Deer HarvestPercent SuccessMule Deer Whitetail
TotalBucks Antlerless Bucks Antlerless
1999 92104 47065 42970 175908 5924 310 3264 8 9506 222000 85091 46072 41677 166780 5025 188 4121 0 9334 222001 83808 44978 41110 170820 5226 623 3369 0 9218 222002 84384 42020 38368 163098 4540 0 3595 0 8135 212003 86546 37260 33905 144027 3753 0 3937 0 7690 232004 90057 36665 33395 136377 4037 0 4515 0 8552 262005 83264 37918 34883 144949 4357 0 4214 0 8571 252006 85534 38138 35016 147433 4811 0 4158 0 8969 262007 68625 39834 37002 158215 5388 0 4362 0 9750 262008 62236 41958 38770 157646 5215 0 5094 0 10309 272009 64469 43783 40468 164403 6323 0 5205 0 11528 282010 61818 43993 40584 167638 4818 0 5122 0 9940 242011 62982 43716 40142 165695 5198 0 4686 0 9884 252012 65476 42872 39435 165643 5246 0 5019 0 10265 262013 65475 42468 38928 167362 5253 0 4960 0 10213 262014 71324 42175 38486 165784 5165 0 4761 0 9926 262015 74094 41817 38320 158747 6433 0 6448 0 12881 342016 77834 42034 38373 164350 7002 4 6638 0 13644 36
1 Muzzleloader hunt data included up until 1984� Youth-0nly hunt data not included in this table�2 1994 and 1995 data does not include results of hunts at Ft� Huachuca� Beginning with 1996, Ft� Huachuca data is based on questionnaire returns,
not data gathered by the Fort�
Year 1st ChoiceApplicants
Permits Issued Hunters Hunter
Days
Deer HarvestPercentSuccessMule Deer Whitetail
TotalBucks Antlerless Bucks Antlerless
1992 299 350 336 1386 147 0 2 0 149 441993 403 150 148 569 88 0 7 0 95 641994 608 275 264 1073 158 0 14 0 172 651995 837 339 331 1450 177 0 18 0 195 591996 1076 706 649 2262 178 0 21 0 199 311997 1155 603 543 2083 159 0 35 0 194 361998 1497 808 763 2502 263 0 42 0 305 401999 1897 1224 1100 2719 280 360 41 0 681 612000 2427 1250 1134 2959 167 395 57 0 619 552001 2571 1625 1449 3858 166 591 47 0 804 552002 2863 1510 1394 4117 141 462 37 0 640 462003 2855 980 904 2704 114 301 44 0 459 512004 2815 1030 923 2711 149 225 54 0 428 462005 2634 1280 1143 3258 140 269 34 0 443 392006 2581 1332 1219 4469 291 64 148 0 503 412007 2520 1769 1633 5601 342 269 223 0 834 512008 2668 2109 1941 6032 367 364 195 0 926 482009 3364 2049 1898 5980 616 137 288 0 981 522010 3645 2186 2034 6723 488 194 288 0 970 482011 3936 2184 2055 6891 676 60 249 0 985 482012 3772 2139 2022 6361 782 79 49 0 910 452013 3933 2231 2117 6609 706 193 219 0 1118 532014 4688 2290 2181 6707 681 292 292 0 1265 582015 4972 2343 2159 6703 973 315 0 0 1252 582016 5143 2771 2494 7746 803 484 363 0 1650 66
Historic Summary of Youth-Only Deer Hunts

22 Hunt Arizona 2017
Deer Hunt Data
Historic Summary of Muzzleloader Deer Hunts
Year1st ChoiceApplicants
PermitsIssued
HuntersHunterDays
Deer HarvestPercentSuccess
Mule Deer WhitetailTotal
Bucks Antlerless Bucks Antlerless1984 424 950 664 3035 200 0 11 0 211 321985 263 950 739 3154 201 0 10 0 211 291986 337 950 840 3947 178 0 19 0 197 231987 402 750 664 2651 134 0 26 0 160 241988 556 1000 821 3545 171 0 20 0 191 231989 877 1250 1110 5660 259 0 10 0 269 241990 713 1139 996 4822 130 0 19 0 149 151991 772 1181 1074 5424 205 0 31 0 236 221992 964 1300 1189 5808 216 0 21 0 237 201993 970 1625 1437 6950 285 0 2 0 287 201994 1070 1821 1667 7875 303 0 13 0 316 191995 1213 1626 1456 7135 278 0 5 0 283 191996 1267 1479 1309 6323 189 0 14 0 203 161997 1540 1335 1179 5605 184 0 7 0 191 161998 1621 1120 1008 4372 164 0 16 0 180 181999 1541 1055 949 4063 157 0 26 0 183 192000 1489 915 822 3812 111 0 26 0 137 172001 1456 869 782 3775 170 0 24 0 194 252002 1775 995 874 4020 143 0 18 0 161 182003 1585 745 675 3189 150 0 32 0 182 272004 1896 783 679 2988 119 0 33 0 152 222005 1498 859 768 3189 193 0 23 0 216 282006 1724 924 807 3726 190 0 29 0 219 272007 1506 940 873 4350 233 0 13 0 246 282008 1756 1015 940 4456 217 0 40 0 257 272009 1532 1023 952 4439 253 0 29 0 282 302010 1480 1049 952 4688 176 0 25 0 201 212011 1427 1023 938 4355 188 0 33 0 221 242012 1494 1220 1121 5151 242 0 16 0 258 232013 1428 1147 1029 4735 243 0 24 0 267 262014 1641 1150 1032 4830 218 0 23 0 241 232015 1839 1143 1045 4801 247 0 44 0 291 282016 1558 1245 1075 5101 260 0 39 0 299 28
Year1st ChoiceApplicants
PermitsIssued
HuntersHunterDays
Deer HarvestPercentSuccess
Mule Deer WhitetailTotal
Bucks Antlerless Bucks Antlerless2008 1167 1912 1607 10373 225 0 0 0 225 142009 1512 1900 1719 11418 296 0 0 0 296 172010 1258 920 862 6123 122 0 0 0 122 142011 1312 755 681 4854 114 0 0 0 114 172012 1559 959 860 6312 153 0 0 0 153 182013 1532 955 878 6349 206 0 0 0 206 232014 1756 1006 916 6035 276 0 2 0 278 302015 2189 705 680 5011 246 0 0 0 246 362016 2388 675 583 4275 209 0 0 0 209 36
Summary Of Archery Deer Hunts (Draw Hunts)

Hunt Arizona 2017 23
Deer Hunt DataSummary of Archery Deer Hunts (Over-the-Counter Hunts)
Year Tags Sold Hunters Hunter DaysDEER HARVEST
PercentSuccess
Mule Deer WhitetailTotal
Buck Antlerless Buck Antlerless1952 – 104 – 21 0 0 0 21 201954 – 156 – 5 0 0 0 5 31955 – 98 – 12 0 0 0 12 121956 – 670 – 49 0 0 0 49 71957 – – – 33 0 0 0 33 –1958 2736 2181 11736 175 226 1 1 403 191959 3451 3165 16292 143 224 0 8 375 121960 2349 2245 9517 82 93 2 6 183 81961 1695 1384 5518 15 20 5 2 42 31962 4625 4319 19768 141 172 47 44 404 91963 4567 4225 16922 88 91 18 17 214 51964 3596 3246 12809 50 63 13 15 141 41965 3835 3798 – – – – – 122 31966 3596 3387 – – – – – 150 41967 4679 4390 – – – – – 206 51968 4510 4216 – – – – – 176 41969 5107 4664 – – – – – 208 51970 5855 5275 – – – – – 228 41971 7261 6412 – – – – – 285 41972 – 6832 – – – – – 315 51973 – 7000 – – – – – 310 41974 – 7420 – – – – – 419 61975 – 7163 – – – – – 346 41976 – 7517 – – – – – 373 51977 – 9038 – – – – – 416 51978 – 7313 – – – – – 381 51979 – 8425 – – – – – 620 71980 – 7157 – – – – – 237 31981 19814 12862 77011 327 40 88 16 471 41982 15109 10212 63099 287 51 60 0 398 41983 11934 9689 63071 248 61 71 0 380 41984 12628 10619 70553 417 35 65 0 517 51985 14249 12302 85328 534 71 138 0 743 61986 16554 14397 104288 742 130 94 0 966 71987 18666 16163 111826 748 58 115 0 921 61988 20883 17909 119793 704 223 108 0 1035 61989 22399 19423 125848 598 201 189 0 988 51990 22398 19325 125940 674 35 100 0 809 41991 20324 18051 126545 773 0 129 0 902 51992 18883 17505 120123 691 0 100 0 791 51993 21580 19559 133174 1084 63 136 27 1310 71994 23445 20646 144881 942 105 212 39 1298 61995 23329 20383 149129 916 97 166 64 1243 61996 23568 20698 143789 996 83 145 36 1260 61997 23166 19939 148077 691 30 138 18 877 41998 23022 19375 146101 1050 63 166 38 1317 71999 24293 20738 158187 1032 27 227 28 1314 62000 25338 21148 155575 1209 55 177 37 1478 72001 23783 20408 148346 827 12 194 25 1058 52002 23082 19595 151816 929 7 247 37 1220 62003 22447 18512 139107 621 5 291 20 937 52004 22675 18305 138856 779 0 262 0 1041 62005 22949 18824 14847 803 0 377 0 1180 62006 24538 20352 153887 939 0 410 0 1349 72007 23907 19265 157895 870 0 393 0 1263 72008 19837 15070 117624 536 0 418 0 954 52009 20236 16131 127080 713 0 571 0 1284 62010 20850 16791 137355 649 0 475 0 1124 72011 20825 17635 134309 797 0 479 0 1276 72012 21392 17393 122787 615 0 355 0 970 62013 22930 19159 162409 1128 0 513 0 1641 9
2014 23755 19065 158427 1227 0 592 0 1819 10 20153
20164 17353 14346 116434 1189 0 576 0 1765 123 2015 Data not available�4 2016 Data are preliminary�

24 Hunt Arizona 2017
Deer Harvest Data5-Year: 2012-2016 Harvest
AA = Any Antlered Deer, MD = Mule Deer, WT = Whitetail Deer, ALS = Antlerless, CN = Camp Navajo, FTHU = Fort Huachuca, C = CHAMP Hunt; in the unit column, E = early or 1st season, M = 2nd season, T = 3rd season, and L = late or 4th season�
Unit Year HuntType Dates Permits
Authorized1st ChoiceApplicants
PermitsIssued
DrawOdds Hunters Hunters
DaysHarvest Hunt
SuccessMD-Buck MD-Aless WT- Buck WT-Aless TotalGENERAL 1 2012 AA 10/26 - 11/04 275 691 275 24�3 239 1012 62 0 0 0 62 261 2013 AA 10/25 - 11/03 225 821 225 19�1 201 883 66 0 0 0 66 331 2014 AA 10/24 - 11/02 225 860 225 18 211 1018 63 0 0 0 63 301 2015 AA 10/23 - 11/01 225 1111 225 14 216 904 86 0 0 0 86 401 2016 AA 10/21 - 10/30 225 1173 225 13�1 201 896 121 0 0 0 121 602 2012 AA 11/02 - 11/08 100 235 100 26 93 440 37 0 0 0 37 402 2013 AA 11/01 - 11/10 100 224 100 22�8 83 395 19 0 0 0 19 232 2014 AA 10/31 - 11/09 100 206 100 29�6 86 634 21 0 0 0 21 242 2015 AA 10/30 - 11/08 100 207 100 25�6 83 363 27 0 0 0 27 332 2016 AA 10/28 - 11/06 80 222 80 26�1 76 353 22 0 0 0 22 293A/3C 2012 AA 10/26 - 11/04 200 1973 200 7�5 196 802 129 0 0 0 129 663A/3C 2013 AA 10/25 - 11/03 225 2442 225 7�9 215 871 121 0 0 0 121 563A/3C 2014 AA 10/24 - 11/02 125 2522 126 4�4 124 464 91 0 0 0 91 733A/3C 2015 AA 10/23 - 11/01 125 2743 125 4�1 125 487 91 0 0 0 91 733A/3C 2016 AA 10/21 - 10/30 100 2755 100 3�2 96 400 80 0 0 0 80 834 2012 AA 10/26 - 11/04 217 557 217 21�5 197 935 54 0 0 0 54 274 (Hopi) 2012 AA 10/26 - 11/04 8 1 8 100 5 13 5 0 0 0 5 1004 2013 AA 10/25 - 11/03 241 670 241 19�6 225 1330 44 0 0 0 44 204 (Hopi) 2013 AA 10/25 - 11/03 9 4 9 100 9 18 9 0 0 0 9 1004 2014 AA 10/24 - 11/02 241 623 241 20�5 221 1022 30 0 0 0 30 144 (Hopi) 2014 AA 10/24 - 11/02 9 8 9 100 7 25 0 0 0 0 0 04 2015 AA 10/23 - 11/01 241 625 241 20�3 218 1153 57 0 0 0 57 264 (Hopi) 2015 AA 10/23 - 11/01 9 6 9 83-3 0 0 0 0 0 0 0 -4 2016 AA 10/21 - 10/30 241 652 241 19�3 212 1053 75 0 0 0 75 354 (Hopi) 2016 AA 10/21 - 10/30 9 4 9 100 9 50 5 0 0 0 5 565 2012 AA 11/02 - 11/08 376 1405 376 23�6 363 1707 88 0 0 0 88 245 (Hopi) 2012 AA 11/02 – 11/08 24 18 24 100 20 68 0 0 0 0 0 05 2013 AA 11/01 - 11/10 424 1599 424 21 392 1952 118 0 0 0 118 305 (Hopi) 2013 AA 11/01 - 11/10 26 19 26 94�7 26 96 10 0 0 0 10 385 2014 AA 10/31 - 11/09 424 1845 424 19�2 400 1985 104 0 0 0 104 265 (Hopi) 2014 AA 10/31 - 11/09 26 13 26 100 20 86 4 0 0 0 4 205 2015 AA 10/30 - 11/08 282 1660 282 14�9 258 1290 75 0 0 0 75 295 (Hopi) 2015 AA 10/30 - 11/08 18 21 18 71�4 18 102 8 0 0 0 8 445 2016 AA 10/21 - 10/30 471 1883 471 21�2 451 2209 169 0 0 0 169 375 (Hopi) 2016 AA 10/21 - 10/30 29 35 29 80 29 121 10 0 0 0 10 346A 2012 MD 11/02 - 11/08 475 1734 475 23�2 450 1831 107 0 0 0 107 246A 2013 MD 11/01 - 11/07 425 1828 425 19�2 405 1574 130 0 0 0 130 326A 2013 MD 12/13 - 12/31 10 548 11 1�8 11 59 11 0 0 0 11 1006A 2014 MD 10/31 - 11/06 475 2044 475 19�5 431 1720 96 0 0 0 96 226A E 2015 MD 10/30 - 11/05 475 2161 475 18�4 438 1709 100 0 0 0 100 236A E 2016 MD 10/28 - 11/03 475 2083 475 19�4 434 1819 128 0 0 0 128 296A E 2012 WT 10/26 - 11/01 150 123 150 58�5 138 520 0 0 32 0 32 236A E 2013 WT 10/25 - 10/31 150 206 150 44�2 143 554 0 0 39 0 39 276A E 2014 WT 10/24 - 10/30 150 192 150 48�4 133 546 0 0 15 0 15 116A E 2015 WT 10/23 - 10/29 150 226 150 36�3 135 520 0 0 39 0 39 296A E 2016 WT 10/21 - 10/27 150 174 150 49�4 132 631 0 0 34 0 34 266A M 2012 WT 11/09 - 11/15 175 85 175 63�5 168 681 0 0 44 0 44 266A M 2013 WT 11/08 - 11/14 125 107 125 52�3 115 495 0 0 18 0 18 166A M 2014 WT 11/07 - 11/13 125 115 125 47�8 120 548 0 0 52 0 52 436A M 2015 WT 10/30 - 11/05 125 107 125 47�7 113 443 0 0 25 0 25 226A M 2016 WT 11/04 - 11/10 125 118 125 55�1 120 572 0 0 42 0 42 356A L 2012 WT 12/14 - 12/31 75 546 75 9�7 71 532 0 0 33 0 33 466A L 2013 WT 12/13 - 12/31 75 378 75 10�3 69 412 0 0 42 0 42 616A L 2014 WT 12/12 - 12/31 50 550 50 7�5 44 328 0 0 17 0 17 396A L 2015 WT 12/11 - 12/31 50 496 50 7�9 46 256 0 0 25 0 25 546A L 2016 WT 12/09 - 12/31 50 507 50 7�1 50 232 0 0 30 0 30 606B 2012 MD 11/09 - 11/15 275 296 275 50 258 1057 36 0 0 0 36 146B 2013 MD 11/08 - 11/14 275 300 275 49�7 259 1088 55 0 0 0 55 216B 2014 MD 11/07 - 11/13 275 355 275 44�2 253 1055 41 0 0 0 41 166B 2015 MD 11/06 - 11/12 275 410 275 39 255 990 71 0 0 0 71 286B 2016 MD 11/04 - 11/10 200 374 200 32�4 165 725 42 0 0 0 42 256B E 2012 WT 11/02 - 11/08 55 34 55 91�2 46 174 0 0 10 0 10 226B E 2013 WT 11/01 - 11/07 55 32 55 68�8 50 193 0 0 8 0 8 166B E 2014 WT 10/31 - 11/06 55 37 55 94�6 47 184 0 0 6 0 6 136B E 2015 WT 10/30 - 11/05 55 37 55 78�4 44 121 0 0 9 0 9 206B E 2016 WT 10/28 - 11/03 55 18 55 83�3 48 191 0 0 7 0 7 156B/8 L 2012 WT 12/14 - 12/31 25 98 25 16�3 22 111 0 0 8 0 8 366B/8 L 2013 WT 12/13 - 12/31 25 137 25 13�1 19 106 0 0 14 0 14 74

Hunt Arizona 2017 25
Deer Harvest Data
Unit Year HuntType Dates Permits
Authorized1st ChoiceApplicants
PermitsIssued
DrawOdds Hunters Hunters
DaysHarvest Hunt
SuccessMD-Buck MD-Aless WT- Buck WT-Aless TotalGENERAL 6B/8 L 2014 WT 12/12 - 12/31 25 154 25 10�4 20 209 0 0 7 0 7 356B/8 L 2015 WT 12/11 - 12/31 25 133 25 15 25 153 0 0 14 0 14 566B/8 L 2016 WT 12/09 - 12/31 25 139 25 9�4 23 183 0 0 13 0 13 577 2015 AA 10/30 - 11/08 1025 1944 1025 38�3 949 4896 174 0 0 0 174 187 2016 AA 10/28 - 11/06 1025 1778 1025 39�6 963 4297 306 0 0 0 306 327C 2016 AA 10/21 - 10/27 10 22 10 18�2 7 26 6 0 0 0 6 867 E 2012 AA 11/02 - 11/08 875 1191 875 48�6 823 3839 192 0 0 0 192 237 E 2013 AA 11/01 - 11/10 875 1668 875 38�4 785 3787 154 0 0 0 154 207 E 2014 AA 10/31 - 11/09 875 1669 875 39 802 4164 165 0 0 0 165 217 L 2012 AA 12/14 - 12/31 10 394 10 2�3 9 67 7 0 0 0 7 788 2012 MD 11/02 - 11/08 650 1487 650 36�4 596 2466 199 0 0 0 199 338 2013 MD 11/01 - 11/07 650 1675 650 31�2 617 2584 177 0 0 0 177 298 2014 MD 10/31 - 11/06 625 1791 625 29�8 588 2451 154 0 0 0 154 268 E 2015 MD 10/30 - 11/05 525 1824 525 23�7 483 2137 157 0 0 0 157 338 E 2016 MD 10/28 - 11/03 550 1769 550 25 516 2335 154 0 0 0 154 308 E 2012 WT 10/26 - 11/01 75 36 75 80�6 63 263 0 0 13 0 13 218 E 2013 WT 10/25 - 11/03 75 74 75 60�8 70 296 0 0 18 0 18 268 E 2014 WT 10/24 - 11/02 75 72 75 48�6 65 341 0 0 12 0 12 188 E 2015 WT 10/23 - 11/01 75 70 75 60 62 282 0 0 13 0 13 218 E 2016 WT 10/21 - 10/30 75 58 75 67�2 68 316 0 0 7 0 7 109 2015 AA 10/30 - 11/05 425 733 425 39�8 384 1666 92 0 0 0 92 2409 E 2012 AA 11/02 - 11/11 400 701 400 41�5 360 1734 94 0 0 0 94 2609 E 2013 AA 11/01 - 11/10 425 608 425 46�5 403 1983 159 0 0 0 159 3909 E 2014 AA 10/31 - 11/06 400 741 400 37 377 1649 88 0 0 0 88 2309 E 2016 AA 10/28 - 11/03 425 567 425 46�7 379 1766 100 0 0 0 100 2609 L 2016 AA 12/09 - 12/31 15 678 15 1�8 13 69 8 0 0 0 8 6210 2012 AA 10/26 - 11/04 550 779 550 47�2 511 2642 129 0 0 0 129 2510 2013 AA 10/25 - 11/03 500 795 500 41 454 2386 85 0 0 0 85 1910 2014 AA 10/24 - 11/02 400 713 400 40�1 376 1917 86 0 0 0 86 2310 2016 AA 10/21 - 10/30 350 727 350 36�2 325 1664 95 0 0 0 95 2910 E 2015 AA 10/30 - 11/01 350 794 350 32�2 323 1643 58 0 0 0 58 1812AE E 2012 AA 10/26 - 11/04 175 766 175 15�4 162 867 83 0 0 0 83 5112AE E 2013 AA 10/25 - 11/03 125 705 125 15�5 120 548 75 0 0 0 75 6312AE E 2014 AA 10/24 - 11/02 95 693 95 9�2 92 413 58 0 0 0 58 6312AE E 2015 AA 10/23 - 11/01 95 545 95 11�2 89 342 71 0 0 0 71 8012AE E 2016 AA 10/21 - 10/30 95 819 95 9�3 89 414 61 0 0 0 61 6912AE L 2012 AA 11/23 - 12/02 30 854 30 2�9 30 185 23 0 0 0 23 7712AE L 2013 AA 11/22 - 12/01 30 901 30 3�1 30 235 14 0 0 0 14 4712AE L 2014 AA 11/21 - 11/30 30 736 30 3�4 30 138 18 0 0 0 18 6012AE L 2015 AA 11/20 - 11/29 30 639 30 3�1 30 178 22 0 0 0 22 7312AE L 2016 AA 11/18 - 11/27 30 707 30 3�8 24 110 20 0 0 0 20 8312AW C 2012 AA 9/14 - 9/20 10 59 10 16�9 9 34 9 0 0 0 9 10012AW C 2013 AA 9/13 - 9/19 10 66 10 13�6 10 39 6 0 0 0 6 6012AW C 2014 AA 9/12 - 9/18 10 69 10 14�5 10 43 6 0 0 0 6 6012AW C 2015 AA 9/11 - 9/17 10 97 10 10�3 10 45 5 0 0 0 5 5012AW C 2016 AA 9/09 - 9/15 10 80 10 12�5 10 30 8 0 0 0 8 8012AW E 2012 AA 10/26 - 11/04 500 3076 500 12�2 481 2278 281 0 0 0 281 5812AW E 2013 AA 10/25 - 11/03 500 3289 500 11�1 470 2402 273 0 0 0 273 5812AW E 2014 AA 10/24 - 11/02 500 2992 500 11�7 454 2094 286 0 0 0 286 6312AW E 2015 AA 10/23 - 11/01 450 3164 450 10�6 426 1939 254 0 0 0 254 6012AW E 2016 AA 10/21 - 10/30 500 2963 500 11�5 480 2352 309 0 0 0 309 6412AW L 2012 AA 11/23 - 12/02 135 2631 135 4�2 133 766 110 0 0 0 110 8312AW L 2013 AA 11/22 - 12/01 135 2778 135 4�1 135 758 98 0 0 0 98 7312AW L 2014 AA 11/21 - 11/30 135 3136 135 3�7 133 695 101 0 0 0 101 7612AW L 2015 AA 11/20 - 11/29 100 2998 100 3 100 497 94 0 0 0 94 9412AW L 2016 AA 11/18 - 11/27 100 2892 100 2�7 93 511 73 0 0 0 73 7812B E 2012 AA 10/26 - 11/04 25 145 25 12�4 23 128 13 0 0 0 13 5712B E 2013 AA 10/25 - 11/03 25 121 25 10�7 25 116 16 0 0 0 16 6412B E 2014 AA 10/24 - 11/02 25 150 25 14 22 122 3 0 0 0 3 1412B E 2015 AA 11/20 - 11/29 25 147 25 8�8 22 144 9 0 0 0 9 4112B E 2016 AA 10/21 - 10/30 25 154 25 11�7 23 146 12 0 0 0 12 5212B L 2012 AA 11/23 - 12/02 20 447 20 4�3 20 129 11 0 0 0 11 5512B L 2013 AA 11/22 - 12/01 20 470 20 3 20 130 10 0 0 0 10 5012B L 2014 AA 11/21 - 11/30 20 496 20 2�2 20 96 16 0 0 0 16 8012B L 2015 AA 10/23 - 11/01 20 583 20 3�3 18 95 15 0 0 0 15 8312B L 2016 AA 11/18 - 11/27 20 514 20 2�7 19 89 14 0 0 0 14 7412BW E 2012 AA 10/26 - 11/04 150 361 150 23�3 143 695 92 0 0 0 92 6412BW E 2013 AA 10/25 - 11/03 120 341 120 18�2 106 520 70 0 0 0 70 66
5-Year: 2012-2016 Harvest
AA = Any Antlered Deer, MD = Mule Deer, WT = Whitetail Deer, ALS = Antlerless, CN = Camp Navajo, FTHU = Fort Huachuca, C = CHAMP Hunt; in the unit column, E = early or 1st season, M = 2nd season, T = 3rd season, and L = late or 4th season�

26 Hunt Arizona 2017
Deer Harvest Data
Unit Year HuntType Dates Permits
Authorized1st ChoiceApplicants
PermitsIssued
DrawOdds Hunters Hunters
DaysHarvest Hunt
SuccessMD-Buck MD-Aless WT- Buck WT-Aless TotalGENERAL 12BW E 2014 AA 10/24 - 11/02 130 358 130 21�2 117 623 71 0 0 0 71 6112BW E 2015 AA 10/23 - 11/01 140 370 140 16�8 122 582 79 0 0 0 79 6512BW E 2016 AA 10/21 - 10/30 140 405 140 19�3 124 572 106 0 0 0 106 8512BW L 2012 AA 11/23 - 12/02 75 908 75 5�8 73 378 56 0 0 0 56 7712BW L 2013 AA 11/22 - 12/01 75 1079 75 4�7 66 375 47 0 0 0 47 7112BW L 2014 AA 11/21 - 11/30 85 901 85 5�1 82 417 67 0 0 0 67 8212BW L 2015 AA 11/20 - 11/29 85 1017 85 5 85 391 75 0 0 0 75 8812BW L 2016 AA 11/18 - 11/27 75 1032 75 3�9 71 274 61 0 0 0 61 8613A 2012 AA 11/16 - 11/25 60 1842 60 2�6 57 314 46 0 0 0 46 8113A 2013 AA 11/15 - 11/24 60 1751 60 2�5 58 338 47 0 0 0 47 8113A 2014 AA 11/14 - 11/23 60 1785 60 2�2 60 386 45 0 0 0 45 7513A 2015 AA 11/13 - 11/22 60 1861 60 2�1 58 332 49 0 0 0 49 8413A 2016 AA 11/04 - 11/13 60 1445 60 2�6 56 414 36 0 0 0 36 6413B 2012 AA 11/09 - 11/18 65 3703 65 1�8 65 351 50 0 0 0 50 7713B 2013 AA 11/08 - 11/17 70 3645 70 1�9 70 457 53 0 0 0 53 7613B 2014 AA 11/07 - 11/16 70 4062 70 1�7 70 439 51 0 0 0 51 7313B 2015 AA 11/06 - 11/15 70 4659 71 1�5 68 360 58 0 0 0 58 8513B 2016 AA 11/11 - 11/20 75 6744 75 1�1 70 385 62 0 0 0 62 8916A 2012 AA 10/26 - 11/04 550 353 550 100 514 2595 77 0 0 0 77 1516A 2013 AA 10/25 - 11/03 550 293 550 100 491 2338 61 0 0 0 61 1216A 2014 AA 10/24 - 11/02 450 302 450 99 394 2145 71 0 0 0 71 1816A 2015 AA 10/23 - 11/01 350 275 350 96 318 1564 65 0 0 0 65 2016A 2016 AA 10/21 - 11/30 350 339 350 86�4 313 1510 67 0 0 0 67 2117A 2012 AA 10/26 - 11/04 375 532 375 50�6 347 1702 75 0 0 0 75 2217A 2013 AA 10/25 - 11/03 375 579 375 49�7 346 1702 61 0 0 0 61 1817A 2014 AA 10/24 - 11/02 275 519 275 45�3 249 1206 42 0 0 0 42 1717A 2015 AA 10/23 - 11/01 200 424 200 34�9 179 872 58 0 0 0 58 3217A 2016 AA 10/21 - 10/30 175 396 175 32�1 160 654 52 0 0 0 52 3317A/17B L 2012 AA 12/14 - 12/23 25 613 25 3�8 22 114 11 0 0 0 11 5017B 2012 AA 10/26 - 11/04 425 614 425 50�3 403 1794 110 0 0 0 110 2717B 2013 AA 10/25 - 11/03 15 291 15 3�4 14 66 14 0 0 0 14 10017B E 2014 AA 10/24 - 11/02 425 763 425 38�7 402 1778 106 0 0 0 106 2617B E 2015 AA 10/23 - 11/01 425 759 425 38�6 401 1748 157 0 0 0 157 3917B E 2016 AA 10/21 - 10/30 500 766 500 47 450 2181 149 0 0 0 149 3317B L 2013 AA 12/13 - 12/22 425 661 425 47�4 396 1821 131 0 0 0 131 3317B L 2014 AA 12/12 - 12/21 15 447 15 2�5 15 92 13 0 0 0 13 8717B L 2015 AA 12/11 - 12/31 15 498 15 2�6 13 86 13 0 0 0 13 10017B L 2016 AA 12/09 - 12/31 15 568 15 1�9 11 79 11 0 0 0 11 10018A 2012 AA 10/26 - 11/04 650 419 649 98�8 580 2967 119 0 0 0 119 2118A 2013 AA 10/25 - 11/03 600 527 600 80�8 555 2915 112 0 0 0 112 2018A 2014 AA 10/24 - 11/02 600 430 600 94�4 535 2949 93 0 0 0 93 1718A 2016 AA 10/21 - 10/30 550 486 550 78�4 484 2939 87 0 0 0 87 1818A E 2015 AA 10/23 - 11/01 550 435 550 88 511 2733 134 0 0 0 134 2618B 2012 AA 10/26 - 11/01 325 404 325 63�9 295 1169 76 0 0 0 76 2618B 2012 AA 11/09 - 11/15 325 207 325 79�7 293 1167 79 0 0 0 79 2718B 2013 AA 10/25 - 10/31 325 461 325 57�3 296 1131 114 0 0 0 114 3918B 2013 AA 11/08 - 11/14 325 285 325 70�9 307 1225 88 0 0 0 88 2918B E 2014 AA 10/24 - 10/30 300 526 300 43�9 272 1027 88 0 0 0 88 3218B E 2015 AA 10/23 - 10/29 275 406 275 50�5 238 889 104 0 0 0 104 4418B E 2016 AA 10/21 - 10/30 550 679 550 58�9 498 2328 182 0 0 0 182 3718B L 2014 AA 11/07 - 11/13 300 232 300 70�7 278 1094 73 0 0 0 73 2618B L 2015 AA 10/23 - 11/01 275 343 275 58 246 947 107 0 0 0 107 4319A 2012 AA 10/26 - 11/04 625 1183 625 40�9 588 2729 213 0 0 0 213 3619A 2013 AA 10/25 - 11/03 625 1370 625 36�5 594 2600 238 0 5 0 243 4119A 2014 AA 10/24 - 11/02 625 1350 625 38�7 581 2590 202 0 2 0 204 3519A 2016 AA 10/21 - 10/30 700 1376 700 39 664 3214 247 0 21 0 268 4019A E 2015 AA 10/23 - 11/01 675 1457 675 36�2 629 2711 244 0 11 0 255 4119B 2012 AA 10/26 - 11/04 200 173 200 60�7 183 866 62 0 0 0 62 3419B 2013 AA 10/25 - 11/03 225 196 225 63�8 218 1130 48 0 0 0 48 2219B 2014 AA 10/24 - 11/02 225 203 225 65�5 215 1090 53 0 0 0 53 2519B 2016 AA 10/21 - 10/30 225 190 225 58�4 205 1172 54 0 0 0 54 2619B E 2015 AA 10/23 - 11/01 225 232 225 56 209 978 51 0 0 0 51 2420A 2012 AA 10/26 - 11/04 700 876 700 60�4 636 2779 165 0 0 0 165 2620A 2013 AA 10/25 - 11/03 700 1002 700 52�2 639 2767 145 0 0 0 145 2320A 2014 AA 10/24 - 11/02 750 908 750 56�6 694 3192 173 0 0 0 173 2520A 2015 AA 10/23 - 11/01 750 1006 749 54 719 3034 305 0 0 0 305 4220A 2016 AA 10/21 - 10/30 800 1288 800 48�5 730 3005 303 0 0 0 303 4220B 2012 AA 11/09 - 11/15 350 277 350 84�5 329 1230 59 0 0 0 59 18
5-Year: 2012-2016 Harvest
AA = Any Antlered Deer, MD = Mule Deer, WT = Whitetail Deer, ALS = Antlerless, CN = Camp Navajo, FTHU = Fort Huachuca, C = CHAMP Hunt; in the unit column, E = early or 1st season, M = 2nd season, T = 3rd season, and L = late or 4th season�

Hunt Arizona 2017 27
Deer Harvest Data
5-Year: 2012-2016 Harvest
AA = Any Antlered Deer, MD = Mule Deer, WT = Whitetail Deer, ALS = Antlerless, CN = Camp Navajo, FTHU = Fort Huachuca, C = CHAMP Hunt; in the unit column, E = early or 1st season, M = 2nd season, T = 3rd season, and L = late or 4th season�
Unit Year HuntType Dates Permits
Authorized1st ChoiceApplicants
PermitsIssued
DrawOdds Hunters Hunters
DaysHarvest Hunt
SuccessMD-Buck MD-Aless WT- Buck WT-Aless TotalGENERAL 20B 2013 AA 11/08 - 11/14 350 279 350 76�7 317 1146 46 0 0 0 46 1520B 2014 AA 11/07 - 11/13 390 246 390 87�4 356 1273 41 0 0 0 41 1220B 2015 AA 11/06 - 11/12 350 277 350 77�3 314 1093 63 0 0 0 63 2020B 2016 AA 11/04 - 11/10 350 198 350 91�4 321 1166 81 0 0 0 81 2520C E 2012 AA 10/26 - 11/01 350 280 349 82�5 327 1291 57 0 0 0 57 1720C E 2013 AA 10/25 - 10/31 350 301 349 85�4 302 1181 75 0 0 0 75 2520C E 2014 AA 10/24 - 10/30 380 293 380 80�5 360 1456 99 0 0 0 99 2820C E 2015 AA 10/30 - 11/05 400 294 400 86�7 376 1305 129 0 0 0 129 3420C E 2016 AA 10/28 - 11/03 400 421 400 71�7 353 1378 149 0 0 0 149 4220C L 2012 AA 11/09 - 11/15 350 145 350 99�3 317 1191 30 0 0 0 30 920C L 2013 AA 11/08 - 11/14 350 133 350 100 312 1145 44 0 0 0 44 1420C L 2014 AA 11/07 - 11/13 380 107 378 100 342 1292 111 0 0 0 111 3220C L 2015 AA 11/13 - 11/19 400 233 400 97 352 1248 90 0 0 0 90 2620C L 2016 AA 11/11 - 11/17 400 169 400 100 353 1357 116 0 0 0 116 3321 2012 MD 11/09 - 11/15 550 855 550 47�5 490 1943 100 0 0 0 100 2021 2013 MD 11/08 - 11/14 500 866 500 41�3 455 1853 103 0 0 0 103 2321 2014 MD 11/07 - 11/13 550 937 550 43 503 2007 99 0 0 0 99 2021 2015 MD 11/06 - 11/12 550 862 550 45�2 521 2003 118 0 0 0 118 2321 2016 MD 11/04 - 11/10 550 692 550 48�3 518 1911 110 0 0 0 110 2121 2016 MD 12/09 - 12/31 10 570 10 1�8 8 45 3 0 0 0 3 3821 E 2012 WT 10/26 - 11/01 625 259 625 99�2 571 2230 0 0 85 0 85 1521 E 2013 WT 10/25 - 10/31 625 213 625 98�1 581 2443 0 0 99 0 99 1721 E 2014 WT 10/24 - 10/30 625 268 625 99�3 559 2282 0 0 95 0 95 1721 E 2015 WT 10/23 - 10/29 625 272 625 97�4 587 2097 0 0 161 0 161 2721 E 2016 WT 10/21 - 10/27 675 252 675 97�2 600 2283 0 0 187 0 187 3121 L 2012 WT 12/14 - 12/31 30 351 30 6 30 188 0 0 10 0 10 3321 L 2013 WT 12/13 - 12/31 30 355 30 5�4 27 147 0 0 18 0 18 6721 L 2014 WT 12/12 - 12/31 30 488 30 5�7 30 170 0 0 5 0 5 1721 L 2015 WT 12/11 - 12/31 30 447 30 5�8 28 190 0 0 13 0 13 4621 L 2016 WT 12/09 - 12/31 30 381 30 5�5 25 130 0 0 13 0 13 5222 2012 MD 11/02 - 11/08 600 797 600 51�4 548 2027 82 0 0 0 82 1522 2013 MD 11/01 - 11/07 600 968 600 44�6 536 2075 93 0 0 0 93 1722 2014 MD 10/31 - 11/06 600 914 603 43�5 576 2337 70 0 0 0 70 1222 2015 MD 10/30 - 11/05 600 932 600 45�1 547 2211 82 0 0 0 82 1522 2016 MD 10/28 - 11/03 600 924 600 41�1 567 2182 130 0 0 0 130 2322 E 2012 WT 10/26 - 11/01 750 568 750 77�3 702 2816 0 0 132 0 132 1922 E 2013 WT 10/25 - 10/31 800 548 801 76�5 731 2799 0 0 169 0 169 2322 E 2014 WT 10/24 - 10/30 800 580 800 67�8 722 2790 0 0 138 0 138 1922 E 2015 WT 10/23 - 10/29 400 428 400 55�1 356 1263 0 0 126 0 126 3522 E 2016 WT 10/21 - 10/27 400 463 400 54�9 363 1381 0 0 122 0 122 3422 M 2015 WT 11/06 - 11/12 400 251 400 76�9 374 1491 0 0 114 0 114 3022 M 2016 WT 11/04 - 11/10 400 285 401 67�7 379 1483 0 0 73 0 73 1922 L 2012 WT 12/14 - 12/31 25 544 25 4�6 22 113 0 0 6 0 6 2722 L 2013 WT 12/13 - 12/31 25 602 25 4 23 132 0 0 12 0 12 5222 L 2014 WT 12/12 - 12/31 50 769 50 5�2 47 344 0 0 28 0 28 6022 L 2015 WT 12/11 - 12/31 50 822 50 4�4 50 307 0 0 30 0 30 6022 L 2016 WT 12/09 - 12/31 50 881 50 4�2 45 245 0 0 34 0 34 7623 E 2012 MD 11/02 - 11/08 625 1324 625 32�1 574 2456 110 0 0 0 110 1923 E 2013 MD 11/01 - 11/07 625 1362 625 32�7 578 2424 110 0 0 0 110 1923 E 2014 MD 10/31 - 11/06 625 1348 625 33�4 568 2519 108 0 0 0 108 1923 E 2015 MD 10/30 - 11/05 625 1420 625 29 577 2387 139 0 0 0 139 2423 E 2016 MD 10/28 - 11/03 625 1486 625 29�4 584 2440 171 0 0 0 171 2923 L 2012 MD 12/14 - 12/31 20 855 20 2 20 137 12 0 0 0 12 6023 L 2013 MD 12/13 - 12/31 20 766 20 2�2 12 68 4 0 0 0 4 3323 L 2014 MD 12/12 - 12/31 20 831 20 2�2 20 138 13 0 0 0 13 6523 L 2015 MD 12/11 - 12/31 20 822 20 2�3 20 140 16 0 0 0 16 8023 E 2012 WT 10/26 - 11/01 575 480 575 56�7 535 2002 0 0 121 0 121 2323 E 2013 WT 10/25 - 10/31 575 516 575 53�3 521 2049 0 0 99 0 99 1923 E 2014 WT 10/24 - 10/30 575 455 575 64�4 511 2075 0 0 79 0 79 1523 E 2015 WT 10/23 - 10/29 290 327 290 52�9 251 1095 0 0 56 0 56 2223 E 2016 WT 10/21 - 10/27 300 322 299 53�4 283 1231 0 0 103 0 103 3623 M 2015 WT 11/06 - 11/12 285 190 285 67�9 268 1208 0 0 103 0 103 3823 M 2016 WT 11/04 - 11/10 275 291 275 51�2 264 1103 0 0 63 0 63 2423 L 2012 WT 12/14 - 12/31 85 970 85 6�5 83 527 0 0 46 0 46 5523 L 2013 WT 12/13 - 12/31 85 911 85 5�5 80 540 0 0 43 0 43 5423 L 2014 WT 12/12 - 12/31 85 952 85 6�9 78 485 0 0 45 0 45 5823 L 2015 WT 12/11 - 12/31 85 1030 85 6�4 76 465 0 0 47 0 47 6223 L 2016 WT 12/09 - 12/31 85 1098 85 6�3 79 537 0 0 43 0 43 54

28 Hunt Arizona 2017
Deer Harvest Data
Unit Year HuntType Dates Permits
Authorized1st ChoiceApplicants
PermitsIssued
DrawOdds Hunters Hunters
DaysHarvest Hunt
SuccessMD-Buck MD-Aless WT- Buck WT-Aless TotalGENERAL 24A 2012 MD 11/16 - 11/25 300 510 300 43�9 286 1403 70 0 0 0 70 2424A 2013 MD 11/15 - 11/24 300 512 300 43 263 1160 80 0 0 0 80 3024A 2014 MD 11/14 - 11/23 300 571 300 41 287 1482 69 0 0 0 69 2424A 2015 MD 11/13 - 11/22 300 563 300 40�7 273 1187 101 0 0 0 101 3724A 2016 MD 11/11 - 11/20 200 565 200 25�1 179 860 96 0 0 0 96 5424A T 2013 WT 11/29 - 12/08 375 134 375 95�5 331 1544 0 0 76 0 76 2324A T 2014 WT 11/28 - 12/07 375 144 375 92�4 337 1608 0 0 78 0 78 2324A T 2015 WT 11/27 - 12/06 375 156 378 92�3 339 1551 0 0 86 0 86 2524A T 2016 WT 11/25 - 12/04 325 122 325 95�9 294 1501 0 0 79 0 79 2724A E 2012 WT 10/26 - 11/01 500 297 500 100 481 1872 0 0 113 0 113 2324A E 2013 WT 10/25 - 10/31 325 275 325 74�9 293 1104 0 0 62 0 62 2124A E 2014 WT 10/24 - 10/30 325 186 325 91�9 325 1270 0 0 62 0 62 1924A E 2015 WT 10/23 - 10/29 325 196 325 89�3 307 1348 0 0 81 0 81 2624A E 2016 WT 10/21 - 10/27 325 160 325 98�8 318 1237 0 0 76 0 76 2424A M 2012 WT 11/30 - 12/09 550 226 550 96�9 515 2407 0 0 130 0 130 2524A M 2013 WT 11/01 - 11/07 375 70 373 100 348 1520 0 0 56 0 56 1624A M 2014 WT 10/31 - 11/06 375 58 375 100 327 1325 0 0 59 0 59 1824A M 2015 WT 11/06 - 11/12 375 78 375 100 352 1530 0 0 69 0 69 2024A M 2016 WT 11/04 - 11/10 325 92 325 97�8 282 1046 0 0 61 0 61 2224A L 2012 WT 12/14 - 12/31 45 395 45 8�1 42 286 0 0 13 0 13 3124A L 2013 WT 12/13 - 12/31 50 355 50 8�5 50 316 0 0 23 0 23 4624A L 2014 WT 12/12 - 12/31 50 398 50 6�5 41 274 0 0 26 0 26 6324A L 2015 WT 12/11 -12/31 50 405 50 8�6 44 392 0 0 20 0 20 4524A L 2016 WT 12/09 - 12/31 50 352 50 9�9 50 291 0 0 31 0 31 6224B 2012 MD 11/16 - 11/25 600 581 600 66�1 542 2533 82 0 0 0 82 1524B 2013 MD 11/15 - 11/24 450 558 450 58�8 442 1979 61 0 0 0 61 1424B 2014 MD 11/14 - 11/23 450 573 450 53�6 417 1927 53 0 0 0 53 1324B 2015 MD 11/13 - 11/22 400 521 400 54�3 378 1551 120 0 0 0 120 3224B 2016 MD 11/11 - 11/20 400 572 400 48�1 383 1813 95 0 0 0 95 2524B T 2015 WT 11/27 - 12/06 350 115 350 99�1 302 1470 0 0 105 0 105 3524B T 2016 WT 11/25 - 12/04 350 189 350 82�5 317 1298 0 0 119 0 119 3824B E 2012 WT 10/26 - 11/01 425 223 425 90�6 390 1288 0 0 112 0 112 2924B E 2013 WT 10/25 - 10/31 450 271 450 88�6 408 1483 0 0 144 0 144 3524B E 2014 WT 10/24 - 10/30 475 323 475 83 448 1494 0 0 111 0 111 2524B E 2015 WT 10/23 - 10/29 300 241 300 75�5 278 1041 0 0 108 0 108 3924B E 2016 WT 10/21 - 10/27 300 280 300 64�6 258 972 0 0 91 0 91 3524B M 2012 WT 11/02 - 11/08 425 85 425 100 374 1362 0 0 102 0 102 2724B M 2013 WT 11/01 - 11/07 450 96 451 100 400 1576 0 0 110 0 110 2824B M 2014 WT 11/07 - 11/13 475 133 475 100 447 1670 0 0 104 0 104 2324B M 2015 WT 11/06 - 11/12 350 94 350 97�9 323 1246 0 0 116 0 116 3624B M 2016 WT 11/04 - 11/10 350 129 350 100 323 1087 0 0 97 0 97 3024B L 2012 WT 12/14 - 12/31 40 398 40 7 32 134 0 0 24 0 24 7524B L 2013 WT 12/13 - 12/31 40 410 40 7�3 38 192 0 0 17 0 17 4524B L 2014 WT 12/12 - 12/31 40 430 42 7�7 39 294 0 0 26 0 26 6724B L 2015 WT 12/11 - 12/31 50 463 50 8�9 50 320 0 0 20 0 20 4024B L 2016 WT 12/09 - 12/31 50 498 50 8 47 338 0 0 22 0 22 4727 E 2012 MD 11/02 - 11/08 725 1162 725 43�4 652 2879 177 0 0 0 177 2727 E 2013 MD 11/01 - 11/07 700 1266 700 36�3 647 2595 176 0 0 0 176 2727 E 2014 MD 10/31 - 11/06 625 1449 624 30�1 578 2167 240 0 0 0 240 4227 E 2015 MD 10/30 - 11/05 525 1562 525 21�5 476 2024 201 0 0 0 201 4227 E 2016 MD 10/28 - 11/03 525 1565 525 23�5 487 1893 234 0 0 0 234 4827 L 2012 MD 12/14 - 12/31 25 890 25 2�4 25 192 3 0 0 0 3 1227 L 2013 MD 12/13 - 12/31 25 805 25 2�4 25 182 16 0 0 0 16 6427 L 2014 MD 12/12 - 12/31 25 1042 25 2�2 23 192 15 0 0 0 15 6527 L 2015 MD 12/11 - 12/31 25 927 25 2�5 25 103 23 0 0 0 23 9227 L 2016 MD 12/09 - 12/31 25 957 25 2�5 21 138 17 0 0 0 17 8127/28 E 2012 WT 10/26 - 11/01 600 182 600 98�9 542 2269 0 0 122 0 122 2327/28 E 2013 WT 10/25 - 10/31 600 209 600 97�6 559 2425 0 0 117 0 117 2127/28 E 2014 WT 10/24 - 10/30 600 206 600 96�6 545 2299 0 0 118 0 118 2227/28 E 2015 WT 10/23 - 10/29 600 293 600 97�6 537 2230 0 0 200 0 200 3727/28 E 2016 WT 10/21 - 10/27 600 310 600 86�8 549 2426 0 0 198 0 198 3627/28 L 2012 WT 12/14 - 12/31 40 200 40 13�5 38 211 0 0 21 0 21 5527/28 L 2013 WT 12/13 - 12/31 40 312 40 9�3 36 318 0 0 28 0 28 7827/28 L 2014 WT 12/12 - 12/31 40 348 40 6�9 37 230 0 0 17 0 17 4627/28 L 2015 WT 12/11 - 12/31 40 376 40 7�4 37 215 0 0 22 0 22 5927/28 L 2016 WT 12/09 - 12/31 40 394 40 5�8 37 221 0 0 35 0 35 9528 E 2012 MD 11/02 - 11/08 425 377 425 65�8 412 1800 82 0 0 0 82 2028 E 2013 MD 11/01 - 11/07 425 395 425 70�4 381 1607 93 0 0 0 93 24
5-Year: 2012-2016 Harvest
AA = Any Antlered Deer, MD = Mule Deer, WT = Whitetail Deer, ALS = Antlerless, CN = Camp Navajo, FTHU = Fort Huachuca, C = CHAMP Hunt; in the unit column, E = early or 1st season, M = 2nd season, T = 3rd season, and L = late or 4th season�

Hunt Arizona 2017 29
Deer Harvest Data
Unit Year HuntType Dates Permits
Authorized1st ChoiceApplicants
PermitsIssued
DrawOdds Hunters Hunters
DaysHarvest Hunt
SuccessMD-Buck MD-Aless WT- Buck WT-Aless TotalGENERAL 28 E 2014 MD 10/31 - 11/06 425 265 425 82�3 389 1718 79 0 0 0 79 2028 E 2015 MD 10/30 - 11/05 425 301 425 78�7 405 1496 136 0 0 0 136 3428 E 2016 MD 10/28 - 11/03 425 311 425 78�8 399 1624 135 0 0 0 135 3428 L 2012 MD 11/16 - 11/22 425 175 425 98�3 387 1614 57 0 0 0 57 1528 L 2013 MD 11/15 - 11/21 375 109 375 100 347 1569 56 0 0 0 56 1628 L 2014 MD 11/14 - 11/20 375 102 375 100 334 1383 63 0 0 0 63 1928 L 2015 MD 11/13 - 11/19 375 136 375 100 346 1328 89 0 0 0 89 2628 L 2016 MD 11/11 - 11/17 400 138 400 99�3 342 1340 155 0 0 0 155 4529 E 2012 MD 11/02 - 11/08 75 116 75 60�3 67 253 36 0 0 0 36 5429 E 2013 MD 11/01 - 11/07 75 130 75 47�7 66 252 18 0 0 0 18 2729 E 2014 MD 10/31 - 11/06 75 102 75 63�7 75 336 16 0 0 0 16 2129 E 2015 MD 10/30 - 11/05 75 91 75 65�9 71 204 25 0 0 0 25 3529 E 2016 MD 10/28 - 11/03 75 130 75 46�2 68 246 4 0 0 0 4 629 L 2012 MD 11/16 - 11/22 75 41 75 87�8 66 294 18 0 0 0 18 2729 L 2013 MD 11/15 - 11/21 75 37 75 89�2 73 289 20 0 0 0 20 2729 L 2014 MD 11/14 - 11/20 75 38 75 100 64 250 18 0 0 0 18 2829 L 2015 MD 11/13 - 11/19 75 40 75 97�5 65 191 48 0 0 0 48 7429 L 2016 MD 11/11 - 11/31 75 95 75 60 67 256 10 0 0 0 10 1529 T 2012 WT 11/30 - 12/09 200 36 200 88�9 178 761 0 0 46 0 46 2629 T 2013 WT 11/29 - 12/08 225 29 223 100 208 990 0 0 45 0 45 2229 T 2014 WT 11/28 - 12/07 225 28 225 100 209 1011 0 0 44 0 44 2129 T 2015 WT 11/27 - 12/06 225 48 225 91�7 200 989 0 0 61 0 61 3129 T 2016 WT 11/25 - 12/04 225 56 225 96�4 194 811 0 0 89 0 89 4629 E 2012 WT 10/26 - 11/01 250 93 250 96�8 217 767 0 0 43 0 43 2029 E 2013 WT 10/25 - 10/31 250 96 247 83�3 199 638 0 0 58 0 58 2929 E 2014 WT 10/24 - 10/30 250 123 247 84�6 213 793 0 0 22 0 22 1029 E 2015 WT 10/23 - 10/29 250 112 250 90�2 213 744 0 0 67 0 67 3129 E 2016 WT 10/21 - 10/27 250 150 250 94�7 235 951 0 0 96 0 96 4129 M 2012 WT 11/09 - 11/15 250 54 250 100 207 782 0 0 49 0 49 2429 M 2013 WT 11/08 - 11/14 225 61 225 80�3 194 725 0 0 19 0 19 1029 M 2014 WT 11/07 - 11/13 225 42 225 95�2 218 936 0 0 65 0 65 3029 M 2015 WT 11/06 - 11/12 225 70 225 97�1 203 751 0 0 63 0 63 3129 M 2016 WT 11/04 - 11/10 225 78 225 100 206 664 0 0 79 0 79 3829 L 2012 WT 12/14 - 12/31 40 157 40 21�7 38 169 0 0 11 0 11 2929 L 2013 WT 12/13 - 12/31 40 201 40 11�4 34 154 0 0 14 0 14 4129 L 2014 WT 12/12 - 12/31 40 199 40 12�6 35 153 0 0 16 0 16 4629 L 2015 WT 12/11 - 12/31 40 294 40 8�5 36 175 0 0 25 0 25 6929 L 2016 WT 12/09 - 12/31 40 317 40 8�8 36 169 0 0 31 0 31 8630A E 2012 MD 11/02 - 11/08 375 389 375 81�7 359 1455 119 0 0 0 119 3330A E 2013 MD 11/01 - 11/07 375 393 375 82�4 333 1192 84 0 0 0 84 2530A E 2014 MD 10/31 - 11/06 375 420 375 79�3 364 1542 72 0 0 0 72 2030A E 2015 MD 10/30 - 11/05 375 338 375 89�6 352 1366 153 0 0 0 153 4330A E 2016 MD 10/28 - 11/03 400 463 400 77�3 363 1257 151 0 0 0 151 4230A L 2012 MD 11/16 - 11/22 375 136 375 97�1 323 1123 68 0 0 0 68 2130A L 2013 MD 11/15 - 11/21 375 107 375 100 328 1362 43 0 0 0 43 1330A L 2014 MD 11/14 - 11/20 375 120 375 100 315 1282 54 0 0 0 54 1730A L 2015 MD 11/13 - 11/19 375 136 375 99�3 342 1248 75 0 0 0 75 2230A L 2016 MD 11/11 - 11/17 400 134 400 100 371 1452 124 0 0 0 124 3330A T 2012 WT 11/30 - 12/09 200 17 200 100 173 701 0 0 69 0 69 4030A T 2013 WT 11/29 - 12/08 200 26 199 100 175 905 0 0 66 0 66 3830A T 2014 WT 11/28 - 12/07 200 24 200 100 168 622 0 0 34 0 34 2030A T 2015 WT 11/27 - 12/06 200 23 200 95�7 169 642 0 0 69 0 69 4130A T 2016 WT 11/25 - 12/04 200 34 200 94�1 158 673 0 0 79 0 79 5030A E 2012 WT 10/26 - 11/01 200 21 200 100 170 533 0 0 40 0 40 2430A E 2013 WT 10/25 - 10/31 200 26 200 100 193 786 0 0 62 0 62 3230A E 2014 WT 10/24 - 10/30 200 27 200 100 168 621 0 0 36 0 36 2130A E 2015 WT 10/23 - 10/29 200 18 200 100 173 610 0 0 54 0 54 3130A E 2016 WT 10/21 - 10/27 225 33 225 100 188 660 0 0 53 0 53 2830A M 2012 WT 11/09 - 11/15 200 22 200 100 175 632 0 0 60 0 60 3430A M 2013 WT 11/08 - 11/14 200 29 200 100 194 768 0 0 58 0 58 3030A M 2014 WT 11/07 - 11/13 200 20 200 100 169 669 0 0 48 0 48 2830A M 2015 WT 11/06 - 11/12 200 33 200 100 160 500 0 0 53 0 53 3330A M 2016 WT 11/04 - 11/10 225 27 225 100 159 713 0 0 47 0 47 3030A L 2012 WT 12/14 - 12/31 40 136 40 17�6 38 208 0 0 19 0 19 5030A L 2013 WT 12/13 - 12/31 40 128 40 20�3 38 200 0 0 25 0 25 6630A L 2014 WT 12/12 - 12/31 40 153 40 19�6 36 180 0 0 11 0 11 3130A L 2015 WT 12/11 - 12/31 40 131 40 16 40 285 0 0 26 0 26 6530A L 2016 WT 12/09 - 12/31 40 128 40 17�2 37 184 0 0 24 0 24 65
5-Year: 2012-2016 Harvest
AA = Any Antlered Deer, MD = Mule Deer, WT = Whitetail Deer, ALS = Antlerless, CN = Camp Navajo, FTHU = Fort Huachuca, C = CHAMP Hunt; in the unit column, E = early or 1st season, M = 2nd season, T = 3rd season, and L = late or 4th season�

30 Hunt Arizona 2017
Deer Harvest Data
5-Year: 2012-2016 Harvest
AA = Any Antlered Deer, MD = Mule Deer, WT = Whitetail Deer, ALS = Antlerless, CN = Camp Navajo, FTHU = Fort Huachuca, C = CHAMP Hunt; in the unit column, E = early or 1st season, M = 2nd season, T = 3rd season, and L = late or 4th season�
Unit Year HuntType Dates Permits
Authorized1st ChoiceApplicants
PermitsIssued
DrawOdds Hunters Hunters
DaysHarvest Hunt
SuccessMD-Buck MD-Aless WT- Buck WT-Aless TotalGENERAL 30B E 2012 MD 11/02 - 11/08 400 475 396 72 376 1499 73 0 0 0 73 1930B E 2013 MD 11/01 - 11/07 400 429 400 80�4 380 1613 97 0 0 0 97 2630B E 2014 MD 10/31 - 11/06 400 398 400 84�7 355 1552 73 0 0 0 73 2130B E 2015 MD 10/30 - 11/05 400 370 400 90�5 382 1438 164 0 0 0 164 4330B E 2016 MD 10/28 - 11/03 400 391 400 79�5 377 1506 129 0 0 0 129 3430B L 2012 MD 11/16 - 11/22 400 163 400 99�4 363 1447 92 0 0 0 92 2530B L 2013 MD 11/15 - 11/21 400 202 397 97�5 381 1645 79 0 0 0 79 2130B L 2014 MD 11/14 - 11/20 400 209 399 98�6 363 1603 76 0 0 0 76 2130B L 2015 MD 11/13 - 11/19 400 210 400 99 363 1330 132 0 0 0 132 3630B L 2016 MD 11/11 - 11/17 400 227 400 99�1 367 1541 124 0 0 0 124 3430B T 2012 WT 11/30 - 12/09 100 17 100 94�1 95 356 0 0 33 0 33 3530B T 2013 WT 11/29 - 12/08 100 17 99 100 92 340 0 0 43 0 43 4730B T 2014 WT 11/28 - 12/07 100 44 100 65�9 97 452 0 0 41 0 41 4230B T 2015 WT 11/27 - 12/06 100 25 100 80 94 371 0 0 35 0 35 3730B T 2016 WT 11/25 - 12/04 100 25 100 88 93 363 0 0 33 0 33 3530B E 2012 WT 10/26 - 11/01 125 61 125 100 116 417 0 0 35 0 35 3030B E 2013 WT 10/25 - 10/31 125 60 127 91�7 92 339 0 0 23 0 23 2530B E 2014 WT 10/24 - 10/30 125 41 125 97�6 110 468 0 0 30 0 30 2730B E 2015 WT 10/23 - 10/29 125 37 125 100 112 439 0 0 32 0 32 2930B E 2016 WT 10/21 - 10/27 125 41 124 100 124 506 0 0 57 0 57 4630B M 2012 WT 11/09 - 11/15 125 24 125 100 114 351 0 0 48 0 48 4230B M 2013 WT 11/08 - 11/14 125 37 124 100 116 438 0 0 27 0 27 2330B M 2014 WT 11/07 - 11/13 125 29 125 100 115 448 0 0 28 0 28 2430B M 2015 WT 11/06 - 11/12 125 18 125 100 119 360 0 0 70 0 70 5930B M 2016 WT 11/04 - 11/10 125 34 125 91�2 116 390 0 0 44 0 44 3830B L 2012 WT 12/14 - 12/31 75 176 75 29 73 409 0 0 36 0 36 4930B L 2013 WT 12/13 - 12/31 75 200 75 25 66 371 0 0 21 0 21 3230B L 2014 WT 12/12 - 12/31 75 215 75 25�6 70 389 0 0 41 0 41 5930B L 2015 WT 12/11 - 12/31 75 217 75 17�5 75 385 0 0 45 0 45 6030B L 2016 WT 12/09 - 12/31 75 243 75 17�7 67 394 0 0 42 0 42 6331 E 2012 MD 11/02 - 11/08 100 259 100 33�6 100 353 34 0 0 0 34 3431 E 2013 MD 11/01 - 11/07 100 310 100 29�7 97 405 24 0 0 0 24 2531 E 2014 MD 10/31 - 11/06 100 304 100 30�3 85 303 39 0 0 0 39 4631 E 2015 MD 10/30 - 11/05 100 289 100 29�1 90 307 40 0 0 0 40 4431 E 2016 MD 10/28 - 11/03 100 306 100 28�4 93 331 55 0 0 0 55 5931 L 2012 MD 11/16 - 11/22 100 67 100 67�2 89 335 28 0 0 0 28 3131 L 2013 MD 11/15 - 11/21 100 64 100 57�8 94 362 29 0 0 0 29 3131 L 2014 MD 11/14 - 11/20 100 107 100 45�8 98 398 30 0 0 0 30 3131 L 2015 MD 11/13 - 11/19 100 104 100 58�7 92 284 34 0 0 0 34 3731 L 2016 MD 11/11 - 11/17 100 158 100 39�9 91 330 35 0 0 0 35 3831 T 2012 WT 11/30 - 12/09 200 91 200 83�5 193 986 0 0 54 0 54 2831 T 2013 WT 11/29 - 12/08 200 106 200 67�9 188 828 0 0 56 0 56 3031 T 2014 WT 11/28 - 12/07 150 56 150 69�6 135 680 0 0 59 0 59 4431 T 2015 WT 11/27 - 12/06 150 123 150 42�3 142 596 0 0 54 0 54 3831 T 2016 WT 11/25 - 12/04 150 103 150 57�3 135 604 0 0 80 0 80 5931 E 2012 WT 10/26 - 11/01 200 192 200 55�7 194 674 0 0 53 0 53 2731 E 2013 WT 10/25 - 10/31 200 174 200 63�8 185 736 0 0 52 0 52 2831 E 2014 WT 10/24 - 10/30 200 181 200 65�7 193 858 0 0 65 0 65 3431 E 2015 WT 10/23 - 10/29 150 191 150 44�5 140 528 0 0 57 0 57 4131 E 2016 WT 10/21 - 10/27 150 155 150 51 121 487 0 0 63 0 63 5231 M 2012 WT 11/09 - 11/15 200 85 200 100 189 718 0 0 71 0 71 3831 M 2013 WT 11/08 - 11/14 150 97 150 86�6 143 563 0 0 52 0 52 3631 M 2014 WT 11/07 - 11/13 150 97 150 77�3 145 583 0 0 50 0 50 3431 M 2015 WT 11/06 - 11/12 150 98 150 74�5 143 525 0 0 65 0 65 4531 M 2016 WT 11/04 - 11/10 150 128 150 60�2 126 435 0 0 56 0 56 4431 L 2012 WT 12/14 - 12/31 125 608 125 16�4 116 506 0 0 45 0 45 3931 L 2013 WT 12/13 - 12/31 125 576 125 17�7 115 699 0 0 66 0 66 5731 L 2014 WT 12/12 - 12/31 125 735 125 12�4 115 659 0 0 74 0 74 6431 L 2015 WT 12/11 - 12/31 125 775 125 12�5 125 721 0 0 93 0 93 7431 L 2016 WT 12/09 - 12/31 125 779 125 12�3 122 750 0 0 85 0 85 7032 E 2012 MD 11/02 - 11/08 350 547 350 54�7 328 1220 97 0 0 0 97 3032 E 2013 MD 11/01 - 11/07 350 633 349 46�4 322 1179 89 0 0 0 89 2832 E 2014 MD 10/31 - 11/06 350 596 350 47�1 326 1235 93 0 0 0 93 2932 E 2015 MD 10/30 - 11/05 350 571 350 49�7 321 1202 149 0 0 0 149 4632 E 2016 MD 10/28 - 11/03 375 603 375 49�6 346 1342 183 0 0 0 183 5332 L 2012 MD 11/16 - 11/22 350 271 350 74�5 335 1317 85 0 0 0 85 2532 L 2013 MD 11/15 - 11/21 350 219 350 76�7 317 1262 66 0 0 0 66 2132 L 2014 MD 11/14 - 11/20 350 302 350 71�5 331 1337 96 0 0 0 96 29

Hunt Arizona 2017 31
Deer Harvest Data
Unit Year HuntType Dates Permits
Authorized1st ChoiceApplicants
PermitsIssued
DrawOdds Hunters Hunters
DaysHarvest Hunt
SuccessMD-Buck MD-Aless WT- Buck WT-Aless TotalGENERAL 32 L 2015 MD 11/13 - 11/19 350 288 350 74 326 1188 90 0 0 0 90 2832 L 2016 MD 11/11 - 11/17 375 298 375 73�8 357 1468 168 0 0 0 168 4732 T 2012 WT 11/30 - 12/09 400 137 400 96�4 346 1574 0 0 84 0 84 2432 T 2013 WT 11/29 - 12/08 400 185 400 91�4 341 1644 0 0 104 0 104 3032 T 2014 WT 11/28 - 12/07 400 197 400 98 358 1651 0 0 78 0 78 2232 T 2015 WT 11/27 - 12/06 400 130 400 98�5 329 1388 0 0 61 0 61 1932 T 2016 WT 11/25 - 12/04 400 136 401 97�1 373 1583 0 0 158 0 158 4232 E 2012 WT 10/26 - 11/01 450 202 450 99 414 1534 0 0 106 0 106 2632 E 2013 WT 10/25 - 10/31 450 194 450 99�5 393 1533 0 0 99 0 99 2532 E 2014 WT 10/24 - 10/30 450 249 450 100 400 1456 0 0 100 0 100 2532 E 2015 WT 12/23 - 10/29 425 166 425 95�8 387 1444 0 0 121 0 121 3132 E 2016 WT 10/21 - 10/27 425 205 425 99 401 1606 0 0 142 0 142 3532 M 2012 WT 11/09 - 11/15 450 145 450 100 417 1555 0 0 121 0 121 2932 M 2013 WT 11/08 - 11/14 450 145 450 97�2 388 1567 0 0 91 0 91 2332 M 2014 WT 11/07 - 11/13 450 114 450 95�6 393 1601 0 0 102 0 102 2632 M 2015 WT 11/06 - 11/12 425 128 425 96�9 396 1482 0 0 157 0 157 4032 M 2016 WT 11/04 - 11/10 425 119 425 100 388 1506 0 0 152 0 152 3932 L 2012 WT 12/14 - 12/31 40 430 40 6�7 38 203 0 0 18 0 18 4732 L 2013 WT 12/13 - 12/31 40 444 40 5�9 30 153 0 0 20 0 20 6732 L 2014 WT 12/12 - 12/31 40 416 40 7�2 37 271 0 0 11 0 11 3032 L 2015 WT 12/11 - 12/31 50 418 50 10 45 284 0 0 32 0 32 7132 L 2016 WT 12/09 - 12/31 50 426 50 5�6 45 219 0 0 14 0 14 3133 E 2016 MD 10/28 - 11/03 300 377 300 65�3 267 1040 70 0 0 0 70 2633 L 2012 MD 11/02 - 11/08 300 389 300 61�7 282 1132 50 0 0 0 50 1833 L 2013 MD 11/01 - 11/07 300 380 300 59�5 290 1208 50 0 0 0 50 1733 L 2014 MD 10/31 - 11/06 300 445 300 57�1 266 1064 51 0 0 0 51 1933 L 2015 MD 10/30 - 11/05 300 439 300 52�4 276 1062 82 0 0 0 82 3033 T 2012 WT 11/30 - 12/09 700 517 700 70 657 2793 0 0 201 0 201 3133 T 2013 WT 11/29 - 12/08 700 478 700 73�8 645 2881 0 0 223 0 223 3533 T 2014 WT 11/28 - 12/07 700 486 700 66�3 632 2738 0 0 164 0 164 2633 T 2015 WT 11/27 - 12/06 700 429 700 83�7 667 3022 0 0 252 0 252 3833 T 2016 WT 11/25 - 12/04 725 471 725 78�1 658 2813 0 0 252 0 252 3833 E 2012 WT 10/26 - 11/01 700 780 700 62�1 654 2301 0 0 258 0 258 3933 E 2013 WT 10/25 - 10/31 700 881 700 55�1 650 2186 0 0 240 0 240 3733 E 2014 WT 10/24 - 10/30 700 796 700 58�7 655 2281 0 0 227 0 227 3533 E 2015 WT 10/23 - 10/29 700 676 700 66�9 663 2018 0 0 271 0 271 4133 E 2016 WT 10/21 - 10/27 725 756 725 64�7 683 2404 0 0 322 0 322 4733 M 2012 WT 11/09 - 11/15 700 482 700 81�5 661 2356 0 0 259 0 259 3933 M 2013 WT 11/08 - 11/14 700 503 698 71 632 2346 0 0 166 0 166 2633 M 2014 WT 11/07 - 11/13 700 453 700 85�9 626 2515 0 0 188 0 188 3033 M 2015 WT 11/06 - 11/12 700 449 700 92 648 2259 0 0 237 0 237 3733 M 2016 WT 11/04 - 11/10 725 409 725 93�6 661 2426 0 0 257 0 257 3933 L 2012 WT 12/14 - 12/31 50 1343 50 3�6 47 268 0 0 22 0 22 4733 L 2013 WT 12/13 - 12/31 50 1419 50 3�2 47 223 0 0 28 0 28 6033 L 2014 WT 12/12 - 12/31 50 1363 50 3�7 44 234 0 0 24 0 24 5533 L 2015 WT 12/11 - 12/31 50 1265 50 3�8 41 274 0 0 26 0 26 6333 L 2016 WT 12/09 - 12/31 50 1359 50 3�2 48 300 0 0 31 0 31 6534A E 2012 MD 11/02 - 11/08 25 223 25 8�1 23 83 8 0 0 0 8 3534A E 2013 MD 11/01 - 11/07 25 174 25 11�5 18 72 7 0 0 0 7 3934A E 2014 MD 10/31 - 11/06 25 188 25 10�6 25 118 0 0 0 0 0 034A E 2015 MD 10/30 - 11/05 25 223 25 10�3 19 44 11 0 0 0 11 5834A E 2016 MD 10/28 - 11/03 25 212 25 10�4 25 109 3 0 0 0 3 1234A T 2012 WT 11/30 - 12/09 600 193 600 96�9 545 2520 0 0 108 0 108 2034A T 2013 WT 11/29 - 12/08 600 239 589 98�7 550 2229 0 0 118 0 118 2134A T 2014 WT 11/28 - 12/07 600 209 600 98�1 539 2506 0 0 167 0 167 3134A T 2015 WT 11/27 - 12/06 600 268 600 94 550 2326 0 0 164 0 164 3034A T 2016 WT 11/25 - 12/04 600 344 600 98 566 2613 0 0 192 0 192 3434A E 2012 WT 10/26 - 11/01 675 364 675 95�9 632 2194 0 0 120 0 120 1934A E 2013 WT 10/25 - 10/31 675 371 675 97�6 617 2284 0 0 124 0 124 2034A E 2014 WT 10/24 - 10/30 675 415 675 95�9 584 2237 0 0 127 0 127 2234A E 2015 WT 10/23 - 10/29 675 382 675 97�1 593 2249 0 0 155 0 155 2634A E 2016 WT 10/21 - 10/27 675 390 675 92�8 614 2275 0 0 212 0 212 3534A M 2012 WT 11/09 - 11/15 675 239 675 96�7 612 2242 0 0 124 0 124 2034A M 2013 WT 11/08 - 11/14 675 276 665 98�2 615 2448 0 0 91 0 91 1534A M 2014 WT 11/07 - 11/13 675 232 675 98�3 578 2280 0 0 142 0 142 2534A M 2015 WT 11/06 - 11/12 675 265 675 100 613 2177 0 0 172 0 172 2834A M 2016 WT 11/04 - 11/10 675 272 675 100 626 2269 0 0 139 0 139 2234A L 2012 WT 12/14 - 12/31 40 558 40 5�4 40 238 0 0 12 0 12 30
5-Year: 2012-2016 Harvest
AA = Any Antlered Deer, MD = Mule Deer, WT = Whitetail Deer, ALS = Antlerless, CN = Camp Navajo, FTHU = Fort Huachuca, C = CHAMP Hunt; in the unit column, E = early or 1st season, M = 2nd season, T = 3rd season, and L = late or 4th season�

32 Hunt Arizona 2017
Deer Harvest Data
5-Year: 2012-2016 Harvest
AA = Any Antlered Deer, MD = Mule Deer, WT = Whitetail Deer, ALS = Antlerless, CN = Camp Navajo, FTHU = Fort Huachuca, C = CHAMP Hunt; in the unit column, E = early or 1st season, M = 2nd season, T = 3rd season, and L = late or 4th season�
Unit Year HuntType Dates Permits
Authorized1st ChoiceApplicants
PermitsIssued
DrawOdds Hunters Hunters
DaysHarvest Hunt
SuccessMD-Buck MD-Aless WT- Buck WT-Aless TotalGENERAL 34A L 2013 WT 12/13 - 12/31 40 502 40 5�4 40 204 0 0 19 0 19 4834A L 2014 WT 12/12 - 12/31 40 650 40 5�1 37 172 0 0 17 0 17 4634A L 2015 WT 12/11 - 12/31 40 627 40 5�1 40 220 0 0 23 0 23 5834A L 2016 WT 12/09 - 12/31 40 707 40 5�1 40 349 0 0 20 0 20 5034B E 2012 MD 11/02 - 11/08 75 123 75 40�7 72 276 15 0 0 0 15 2134B E 2013 MD 11/01 - 11/07 50 96 50 46�9 45 173 11 0 0 0 11 2434B E 2014 MD 10/31 - 11/06 50 69 50 40�6 45 176 14 0 0 0 14 3134B E 2015 MD 10/30 - 11/05 50 100 50 39 50 207 7 0 0 0 7 1434B E 2016 MD 10/28 - 11/03 50 99 50 26�3 36 171 0 0 0 0 0 034B L 2012 MD 11/16 - 11/22 75 35 75 91�4 66 272 13 0 0 0 13 2034B L 2013 MD 11/15 - 11/21 50 64 50 42�2 42 171 3 0 0 0 3 734B L 2014 MD 11/14 - 11/20 50 61 50 57�4 44 150 6 0 0 0 6 1434B L 2015 MD 11/13 - 11/19 50 37 50 54�1 41 150 26 0 0 0 26 6334B L 2016 MD 11/11 - 11/19 50 69 50 52�2 50 177 19 0 0 0 19 3834B T 2012 WT 11/30 - 12/09 100 39 100 87�2 91 460 0 0 19 0 19 2134B T 2013 WT 11/29 - 12/08 100 19 97 100 79 362 0 0 6 0 6 834B T 2014 WT 11/28 - 12/07 100 25 100 100 92 350 0 0 16 0 16 1734B T 2015 WT 11/27 - 12/06 100 21 100 100 88 388 0 0 27 0 27 3134B T 2016 WT 11/25 - 12/04 100 36 100 100 78 356 0 0 34 0 34 4434B E 2012 WT 10/26 - 11/01 100 23 100 100 85 248 0 0 29 0 29 3434B E 2013 WT 10/25 - 10/31 100 52 100 96�2 86 345 0 0 27 0 27 3134B E 2014 WT 10/24 - 10/30 100 46 100 100 87 342 0 0 15 0 15 1734B E 2015 WT 10/23 - 10/29 100 35 100 94�3 89 349 0 0 14 0 14 1634B E 2016 WT 10/21 - 10/27 100 52 100 100 91 400 0 0 17 0 17 1934B M 2012 WT 11/09 - 11/15 100 46 100 91�3 85 349 0 0 14 0 14 1634B M 2013 WT 11/08 - 11/14 100 43 100 95�3 97 413 0 0 10 0 10 1034B M 2014 WT 11/07 - 11/13 100 36 100 100 76 416 0 0 4 0 4 534B M 2015 WT 11/06 - 11/12 100 31 100 100 88 317 0 0 27 0 27 3134B M 2016 WT 11/04 - 11/10 100 33 100 87�9 96 313 0 0 21 0 21 2234B L 2012 WT 12/14 - 12/31 40 106 40 17 36 142 0 0 11 0 11 3134B L 2013 WT 12/13 - 12/31 40 125 40 20�8 33 215 0 0 12 0 12 3634B L 2014 WT 12/12 - 12/31 40 155 40 15�5 35 209 0 0 14 0 14 4034B L 2015 WT 12/11 - 12/31 40 173 40 13�9 37 220 0 0 26 0 26 7034B L 2016 WT 12/09 - 12/31 40 224 40 13�4 35 200 0 0 21 0 21 6035A T 2012 WT 11/30 - 12/09 300 61 300 88�5 265 1257 0 0 45 0 45 1735A T 2013 WT 11/29 - 12/08 300 69 297 84�1 271 1289 0 0 61 0 61 2335A T 2014 WT 11/28 - 12/07 325 60 324 96�7 288 1378 0 0 65 0 65 2335A T 2015 WT 11/27 - 12/06 325 74 325 91�9 275 1306 0 0 84 0 84 3135A T 2016 WT 11/25 - 12/04 325 66 325 97 302 1528 0 0 122 0 122 4035A E 2012 WT 10/26 - 11/01 350 119 351 95 290 1021 0 0 102 0 102 3535A E 2013 WT 10/25 - 10/31 350 141 347 94�3 306 1158 0 0 78 0 78 2535A E 2014 WT 10/24 - 10/30 375 144 375 95�8 316 1242 0 0 43 0 43 1435A E 2015 WT 10/23 - 10/29 375 160 375 91�9 350 1217 0 0 131 0 131 3735A E 2016 WT 10/21 - 10/27 375 127 375 94�5 348 1237 0 0 125 0 125 3635A M 2012 WT 11/09 - 11/15 350 48 348 100 315 1297 0 0 53 0 53 1735A M 2013 WT 11/08 - 11/14 350 67 349 100 319 1408 0 0 66 0 66 2135A M 2014 WT 11/07 - 11/13 375 88 372 100 353 1510 0 0 42 0 42 1235A M 2015 WT 11/06 - 11/12 375 66 375 100 338 1365 0 0 79 0 79 2335A M 2016 WT 11/04 - 11/10 375 50 375 98 329 1462 0 0 54 0 54 1635A L 2012 WT 12/14 - 12/31 40 262 40 11�5 38 260 0 0 18 0 18 4735A L 2013 WT 12/13 - 12/31 40 338 40 8�9 37 326 0 0 11 0 11 3035A L 2014 WT 12/12 - 12/31 40 415 40 9�6 38 253 0 0 11 0 11 2935A L 2015 WT 12/11 - 12/31 40 383 40 9�1 37 247 0 0 30 0 30 8135A L 2016 WT 12/09 - 12/31 40 423 40 8�3 40 244 0 0 22 0 22 5535B T 2012 WT 11/30 - 12/09 350 180 350 91�7 323 1579 0 0 63 0 63 2035B T 2013 WT 11/29 - 12/08 350 116 350 94 322 1539 0 0 69 0 69 2135B T 2014 WT 11/28 - 12/07 350 122 350 100 333 1516 0 0 116 0 116 3535B T 2015 WT 11/27 - 12/06 350 154 350 92�2 301 1376 0 0 95 0 95 3235B T 2016 WT 11/25 - 12/04 350 175 350 97�7 322 1606 0 0 92 0 92 2935B E 2012 WT 10/26 - 11/01 425 188 425 98�4 396 1484 0 0 112 0 112 2835B E 2013 WT 10/25 - 10/31 425 189 424 91 384 1545 0 0 108 0 108 2835B E 2014 WT 10/24 - 10/30 425 195 426 95�4 374 1461 0 0 78 0 78 2135B E 2015 WT 10/23 - 10/29 425 140 425 96�4 372 1432 0 0 89 0 89 2435B E 2016 WT 10/21 - 10/27 425 232 425 93�5 385 1518 0 0 129 0 129 3435B M 2012 WT 11/09 - 11/15 425 117 425 100 379 1453 0 0 94 0 94 2535B M 2013 WT 11/08 - 11/14 425 137 424 100 378 1438 0 0 62 0 62 1635B M 2014 WT 11/07 - 11/13 425 178 425 97�8 374 1407 0 0 78 0 78 2135B M 2015 WT 11/06 - 11/12 425 160 425 100 388 1416 0 0 115 0 115 30

Hunt Arizona 2017 33
Deer Harvest Data
Unit Year HuntType Dates Permits
Authorized1st ChoiceApplicants
PermitsIssued
DrawOdds Hunters Hunters
DaysHarvest Hunt
SuccessMD-Buck MD-Aless WT- Buck WT-Aless TotalGENERAL 35B M 2016 WT 11/04 - 11/10 425 194 425 100 383 1501 0 0 74 0 74 1935B L 2012 WT 12/14 - 12/31 40 258 40 9�3 38 225 0 0 13 0 13 3435B L 2013 WT 12/13 - 12/31 40 282 40 8�5 40 196 0 0 31 0 31 7835B L 2014 WT 12/12 - 12/31 40 366 40 9�3 38 200 0 0 19 0 19 5035B L 2015 WT 12/11 - 12/31 40 442 40 4�3 38 266 0 0 21 0 21 5535B L 2016 WT 12/09 - 12/31 40 390 40 7�7 37 240 0 0 18 0 18 4936A E 2012 MD 11/02 - 11/08 300 466 300 52�8 292 1035 62 0 0 0 62 2136A E 2013 MD 11/01 - 11/07 300 606 300 38�4 290 1142 76 0 0 0 76 2636A E 2014 MD 10/31 - 11/06 300 633 300 39 284 1123 45 0 0 0 45 1636A E 2015 MD 10/30 - 11/05 300 596 300 42�1 276 1103 92 0 0 0 92 3336A E 2016 MD 10/28 - 11/03 300 691 300 35�9 282 1095 58 0 0 0 58 2136A L 2012 MD 11/16 - 11/22 325 185 325 89�2 311 1253 51 0 0 0 51 1636A L 2013 MD 11/15 - 11/21 325 275 325 71�3 308 1225 49 0 0 0 49 1636A L 2014 MD 11/14 - 11/20 325 301 324 66�4 287 1142 53 0 0 0 53 1836A L 2015 MD 11/13 - 11/19 300 362 300 55�8 277 927 88 0 0 0 88 3236A L 2016 MD 11/11 - 11/17 275 300 275 52�3 245 1013 68 0 0 0 68 2836A T 2012 WT 11/30 - 12/09 400 74 400 94�6 368 1635 0 0 86 0 86 2336A T 2013 WT 11/29 - 12/08 400 60 400 100 362 1759 0 0 77 0 77 2136A T 2014 WT 11/28 - 12/07 400 72 400 94�4 362 1815 0 0 75 0 75 2136A T 2015 WT 11/27 - 12/06 450 57 450 100 412 1659 0 0 130 0 130 3236A T 2016 WT 11/25 - 12/04 450 65 450 92�3 409 1877 0 0 143 0 143 3536A E 2012 WT 10/26 - 11/01 450 142 450 96�5 417 1416 0 0 107 0 107 2636A E 2013 WT 10/25 - 10/31 450 128 448 95�3 402 1395 0 0 115 0 115 2936A E 2014 WT 10/24 - 10/30 450 165 450 91�5 410 1414 0 0 97 0 97 2436A E 2015 WT 10/23 - 10/29 450 125 450 98�4 395 1374 0 0 188 0 188 4836A E 2016 WT 10/21 - 10/27 400 190 400 88�4 355 1384 0 0 139 0 139 3936A M 2012 WT 11/09 - 11/15 500 80 500 100 440 1520 0 0 109 0 109 2536A M 2013 WT 11/08 - 11/14 500 83 496 100 483 1627 0 0 126 0 126 2636A M 2014 WT 11/07 - 11/13 500 69 500 100 448 1613 0 0 119 0 119 2736A M 2015 WT 11/06 - 11/12 500 96 500 100 453 1608 0 0 132 0 132 2936A M 2016 WT 11/04 - 11/10 425 88 425 100 378 1430 0 0 103 0 103 2736A L 2012 WT 12/14 - 12/31 40 272 40 9�9 40 253 0 0 12 0 12 3036A L 2013 WT 12/13 - 12/31 40 244 40 12�7 38 292 0 0 24 0 24 6336A L 2014 WT 12/12 - 12/31 40 283 40 9�5 40 218 0 0 31 0 31 7836A L 2015 WT 12/11 - 12/31 40 342 40 7�3 40 292 0 0 22 0 22 5536A L 2016 WT 12/09 - 12/31 40 385 40 7�5 38 228 0 0 14 0 14 3736B E 2012 MD 11/02 - 11/08 150 314 150 45�2 147 568 35 0 0 0 35 2436B E 2013 MD 11/01 - 11/07 150 327 150 33�3 143 544 46 0 0 0 46 3236B E 2014 MD 10/31 - 11/06 150 318 150 40�3 144 565 35 0 0 0 35 2436B E 2015 MD 10/30 - 11/05 150 363 150 34�7 139 428 73 0 0 0 73 5336B E 2016 MD 10/28 - 11/03 150 389 150 36�8 131 592 51 0 0 0 51 3936B L 2012 MD 11/16 - 11/22 150 66 150 80�3 139 453 28 0 0 0 28 2036B L 2013 MD 11/15 - 11/21 150 93 150 82�8 139 520 35 0 0 0 35 2536B L 2014 MD 11/14 - 11/20 150 134 150 61�2 143 556 51 0 0 0 51 3636B L 2015 MD 11/13 - 11/19 150 197 150 53�8 139 565 40 0 0 0 40 2936B L 2016 MD 11/11 - 11/17 150 186 150 51�1 112 403 59 0 0 0 59 5336B T 2012 WT 11/30 - 12/09 750 129 750 100 691 2902 0 0 152 0 152 2236B T 2013 WT 11/29 - 12/08 750 147 743 100 685 3092 0 0 209 0 209 3136B T 2014 WT 11/28 - 12/07 750 220 750 94�5 696 3182 0 0 202 0 202 2936B T 2015 WT 11/27 - 12/06 750 253 750 96�4 681 3007 0 0 271 0 271 4036B T 2016 WT 11/25 - 12/04 750 288 750 97�9 697 3172 0 0 253 0 253 3636B E 2012 WT 10/26 - 11/01 800 364 800 86�5 737 2769 0 0 234 0 234 3236B E 2013 WT 10/25 - 10/31 800 453 788 94�7 729 2608 0 0 179 0 179 2536B E 2014 WT 10/24 - 10/30 800 415 800 97�1 726 2711 0 0 182 0 182 2536B E 2015 WT 10/23 - 10/29 800 470 800 97�4 731 2607 0 0 251 0 251 3436B E 2016 WT 10/21 - 10/27 800 524 800 93�3 731 2762 0 0 223 0 223 3136B M 2012 WT 11/09 - 11/15 800 192 800 98�4 753 2725 0 0 163 0 163 2236B M 2013 WT 11/08 - 11/14 800 248 787 98 741 3369 0 0 144 0 144 1936B M 2014 WT 11/07 - 11/13 800 278 800 98�2 697 2721 0 0 186 0 186 2736B M 2015 WT 11/06 - 11/12 800 324 800 98�5 724 2711 0 0 240 0 240 3336B M 2016 WT 11/04 - 11/10 800 352 800 99�7 719 2772 0 0 231 0 231 3236B L 2012 WT 12/14 - 12/31 40 391 40 7�7 37 168 0 0 30 0 30 8136B L 2013 WT 12/13 - 12/31 40 600 40 4�8 40 277 0 0 25 0 25 6336B L 2014 WT 12/12 - 12/31 40 580 40 5�5 40 217 0 0 25 0 25 6336B L 2015 WT 12/11 - 12/31 40 661 40 5�7 36 250 0 0 17 0 17 4736B L 2016 WT 12/09 - 12/31 40 613 40 5�1 40 213 0 0 27 0 27 6836C E 2012 MD 11/02 - 11/08 100 162 100 51�9 91 348 25 0 0 0 25 2736C E 2013 MD 11/01 - 11/07 100 156 100 48�7 94 383 19 0 0 0 19 20
5-Year: 2012-2016 Harvest
AA = Any Antlered Deer, MD = Mule Deer, WT = Whitetail Deer, ALS = Antlerless, CN = Camp Navajo, FTHU = Fort Huachuca, C = CHAMP Hunt; in the unit column, E = early or 1st season, M = 2nd season, T = 3rd season, and L = late or 4th season�

34 Hunt Arizona 2017
Deer Harvest Data
5-Year: 2012-2016 Harvest
AA = Any Antlered Deer, MD = Mule Deer, WT = Whitetail Deer, ALS = Antlerless, CN = Camp Navajo, FTHU = Fort Huachuca, C = CHAMP Hunt; in the unit column, E = early or 1st season, M = 2nd season, T = 3rd season, and L = late or 4th season�
Unit Year HuntType Dates Permits
Authorized1st ChoiceApplicants
PermitsIssued
DrawOdds Hunters Hunters
DaysHarvest Hunt
SuccessMD-Buck MD-Aless WT- Buck WT-Aless TotalGENERAL 36C E 2014 MD 10/31 - 11/06 100 100 100 68 92 382 18 0 0 0 18 2036C E 2015 MD 10/30 - 11/05 100 94 100 66 84 360 16 0 0 0 16 1936C E 2016 MD 10/28 - 11/03 100 107 100 69�2 86 409 26 0 0 0 26 3036C L 2012 MD 11/16 - 11/22 100 73 100 86�3 90 350 19 0 0 0 19 2136C L 2013 MD 11/15 - 11/21 100 45 100 100 87 392 21 0 0 0 21 2436C L 2014 MD 11/14 - 11/20 100 89 100 70�8 93 398 22 0 0 0 22 2436C L 2015 MD 11/13 - 11/19 100 71 100 90�1 100 397 32 0 0 0 32 3236C L 2016 MD 11/11 - 11/17 100 96 100 85�4 88 373 28 0 0 0 28 3236C T 2012 WT 11/30 - 12/09 175 44 175 81�8 161 705 0 0 43 0 43 2736C T 2013 WT 11/29 - 12/08 175 43 173 86 157 686 0 0 60 0 60 3836C T 2014 WT 11/28 - 12/07 175 33 175 84�8 161 644 0 0 71 0 71 4436C T 2015 WT 11/27 - 12/06 175 55 175 83�6 171 751 0 0 51 0 51 3036C T 2016 WT 11/25 - 12/04 175 81 175 86�4 164 737 0 0 76 0 76 4636C E 2012 WT 10/26 - 11/01 175 75 175 100 151 469 0 0 65 0 65 4336C E 2013 WT 10/25 - 10/31 175 96 173 87�5 162 532 0 0 52 0 52 3236C E 2014 WT 10/24 - 10/30 175 104 175 100 166 597 0 0 56 0 56 3436C E 2015 WT 10/23 - 10/29 175 85 175 94�1 155 525 0 0 40 0 40 2636C E 2016 WT 10/21 - 10/27 175 81 175 95�1 171 609 0 0 58 0 58 3436C M 2012 WT 11/09 - 11/15 175 92 175 97�8 158 644 0 0 42 0 42 2736C M 2013 WT 11/08 - 11/14 175 65 174 100 156 634 0 0 50 0 50 3236C M 2014 WT 11/07 - 11/13 175 52 175 88�5 158 497 0 0 35 0 35 2236C M 2015 WT 11/06 - 11/12 175 56 175 100 164 607 0 0 76 0 76 4636C M 2016 WT 11/04 - 11/10 175 60 175 96�7 156 745 0 0 60 0 60 3836C L 2012 WT 12/14 - 12/31 125 388 125 19�1 113 725 0 0 48 0 48 4236C L 2013 WT 12/13 - 12/31 125 376 125 21�8 108 625 0 0 54 0 54 5036C L 2014 WT 12/12 - 12/31 125 520 125 14�2 108 613 0 0 68 0 68 6336C L 2015 WT 12/11 - 12/31 125 551 125 18�9 106 581 0 0 56 0 56 5336C L 2016 WT 12/09 - 12/31 125 530 125 14�9 116 664 0 0 50 0 50 4337A E 2014 AA 10/31 - 11/06 75 258 75 25�6 73 295 23 0 0 0 23 3237A E 2015 AA 10/30 - 11/05 75 308 75 23�4 68 280 20 0 0 0 20 2937A E 2016 AA 10/28 - 11/03 75 279 75 24�7 68 277 21 0 2 0 23 3437A L 2014 AA 11/14 - 11/20 75 173 75 25�4 75 248 18 0 0 0 18 2437A L 2015 AA 11/13 - 11/19 75 179 75 30�7 67 249 21 0 0 0 21 3137A L 2016 AA 11/11 - 11/17 75 207 75 28 72 286 33 0 0 0 33 4637A E 2012 MD 11/02 - 11/08 75 199 75 32�7 66 295 23 0 0 0 23 3537A E 2013 MD 11/01 - 11/07 75 304 75 24 68 245 22 0 0 0 22 3237A L 2012 MD 11/16 - 11/22 75 87 75 49�4 65 229 20 0 0 0 20 3137A L 2013 MD 11/15 - 11/21 75 111 75 36�9 68 286 28 0 0 0 28 4137B E 2012 AA 11/02 - 11/08 450 818 450 49�5 423 1746 81 0 0 0 81 1937B E 2013 AA 11/01 - 11/07 500 929 500 45�3 456 1856 104 0 0 0 104 2337B E 2014 AA 10/31 - 11/06 500 884 500 51�5 472 1902 101 0 0 0 101 2137B E 2015 AA 10/30 - 11/05 500 785 500 54�5 488 1939 108 0 6 0 114 2337B E 2016 AA 10/28 - 11/03 500 799 500 50�7 429 1855 86 0 0 0 86 2037B L 2012 AA 11/16 - 11/22 450 388 450 69�8 422 1726 79 0 0 0 79 1937B L 2013 AA 11/15 - 11/21 500 371 500 76 468 2057 72 0 0 0 72 1537B L 2014 AA 11/14 - 11/20 500 436 500 64�2 476 2095 87 0 0 0 87 1837B L 2015 AA 11/13 - 11/19 500 523 500 66�7 472 1938 79 0 3 0 82 1737B L 2016 AA 11/11 - 11/17 500 443 499 72�5 466 1978 132 0 0 0 132 2839/40 2015 AA 11/06 - 11/15 425 512 425 68�2 396 2026 122 0 0 0 122 3139/40 2016 AA 11/04 - 11/13 450 543 450 67�2 399 1794 137 0 0 0 137 3439/40 E 2012 AA 10/26 - 11/01 150 350 150 35�4 144 522 22 0 0 0 22 1539/40 E 2013 AA 10/25 - 10/31 150 340 150 40 142 595 30 0 0 0 30 2139/40 E 2014 AA 10/24 - 10/30 175 351 175 45 159 719 29 0 0 0 29 1839/40 L 2012 AA 11/02 - 11/08 200 117 200 70�1 155 679 21 0 0 0 21 1439/40 L 2013 AA 11/01 - 11/07 200 123 200 61 190 766 27 0 0 0 27 1439/40 L 2014 AA 10/31 - 11/06 225 110 225 78�2 213 826 37 0 0 0 37 1741 2012 AA 11/02 - 11/11 500 746 500 59�4 450 1978 72 0 0 0 72 1641 2013 AA 11/01 - 11/10 500 710 500 61�5 448 2040 123 0 0 0 123 2741 2014 AA 10/31 - 11/09 550 759 550 64�2 502 2239 143 0 0 0 143 2841 2015 AA 11/06 - 11/15 550 894 547 55 502 2171 150 0 6 0 156 3141 2016 AA 11/04 - 11/13 550 988 550 50 504 2241 215 0 0 0 215 4342 2012 AA 11/02 - 11/11 250 320 249 57�5 216 873 21 0 0 0 21 1042 2013 AA 11/01 - 11/10 250 370 250 53�8 241 1163 34 0 0 0 34 1442 2014 AA 10/31 - 11/09 250 269 250 68�4 231 1093 38 0 0 0 38 1642 2015 AA 11/06 - 11/15 275 305 275 66�6 255 1188 65 0 0 0 65 2542 2016 AA 11/04 - 11/13 275 309 275 70�2 256 1228 80 0 0 0 80 3143/44 2012 AA 11/02 - 11/11 500 618 500 64�9 446 2572 44 0 0 0 44 1043/44 2013 AA 11/01 - 11/10 500 596 500 70�3 457 2386 68 0 0 0 68 15

Hunt Arizona 2017 35
Deer Harvest Data
Unit Year HuntType Dates Permits
Authorized1st ChoiceApplicants
PermitsIssued
DrawOdds Hunters Hunters
DaysHarvest Hunt
SuccessMD-Buck MD-Aless WT- Buck WT-Aless TotalGENERAL 43/44 2014 AA 10/31 - 11/09 500 627 500 69�9 459 2331 100 0 0 0 100 2243/44 2015 AA 11/06 - 11/15 500 623 500 65�8 453 2125 147 0 0 0 147 3243/44 2016 AA 11/04 - 11/13 450 654 450 60�9 393 1942 127 0 0 0 127 3245 2012 AA 11/02 - 11/11 275 325 275 69�8 243 1153 49 0 0 0 49 2045 2013 AA 11/01 - 11/10 275 352 275 70�5 224 1090 38 0 0 0 38 1745 2014 AA /31 - 11/09 275 324 275 71 236 1058 88 0 0 0 88 3745 2015 AA 11/06 - 11/15 275 330 275 63�9 245 1205 69 0 0 0 69 2845 2016 AA 11/04 - 11/13 275 317 275 70 251 1282 79 0 0 0 79 31FTHU 2015 11/20 - 11/29 12 15 12 66�7 10 58 3 0 0 0 3 30FTHU 2016 11/18 - 12/31 100 50 90 100 76 356 0 4 32 0 36 47FTHU 2016 12/16 - 12/31 80 84 80 86�9 78 441 0 0 48 0 48 62FTHU 2012 AM 11/16 - 11/25 10 27 10 33�3 10 63 8 0 0 0 8 80FTHU 2013 AM 11/22 - 12/01 10 18 9 50 9 39 5 0 0 0 5 56FTHU 2012 AW 11/16 - 11/25 55 26 55 100 52 237 4 0 8 0 12 23FTHU 2012 AW 12/14 - 12/31 135 129 135 91�5 117 748 25 0 25 0 50 43FTHU 2013 AW 11/22 - 12/01 55 27 55 100 49 212 0 0 24 0 24 49FTHU 2013 AW 12/13 - 12/31 135 110 134 93�6 106 681 0 0 53 0 53 50FTHU 2015 11/20 - 11/29 70 26 38 - 35 145 0 0 14 0 14 40FTHU 2015 12/11 - 12/31 130 88 117 - 104 670 0 0 54 0 54 52YOUTH ONLY-GENERAL3A/3C 2012 AA 11/09 - 11/15 25 315 25 7�3 25 59 16 0 0 0 16 645 2015 AA 10/23 - 10/29 94 240 94 30�4 79 267 39 0 0 0 39 495 2015 AA 10/23 - 10/29 6 3 6 100 6 20 4 0 0 0 4 676B 2016 AA 10/07 - 10/13 75 189 75 34�9 73 203 58 0 0 0 58 797 2012 AA 10/12 - 10/18 150 227 150 45�4 146 379 93 0 0 0 93 647 2013 AA 10/11 - 10/17 151 405 151 31�9 142 400 84 0 0 0 84 597 2014 AA 10/10 - 10/16 150 369 150 36�3 144 466 105 0 0 0 105 7310 2012 AA 10/12 - 10/21 75 94 75 52�1 70 297 27 0 0 0 27 3910 2013 AA 10/04 - 10/13 51 109 51 34�9 46 242 23 0 0 0 23 5010 2014 AA 10/03 - 10/12 40 141 40 24�8 37 117 17 0 0 0 17 4610 2015 AA 10/02 - 10/11 40 184 40 20�1 40 168 12 0 0 0 12 3010 2016 AA 10/07 - 10/16 40 148 40 23 38 173 18 0 0 0 18 4712AW 2012 ALS 10/12 - 10/15 100 290 99 32�4 96 223 0 79 0 0 79 8212AW 2013 ALS 10/11 - 10/14 151 276 151 47�1 149 284 0 133 0 0 133 8912AW 2013 ALS 11/08 - 11/11 101 89 101 56�2 95 208 0 60 0 0 60 6312AW 2014 ALS 10/10 - 10/13 250 373 250 53�4 237 438 0 213 0 0 213 9012AW 2014 ALS 11/07 - 11/10 100 108 100 61�1 95 187 0 79 0 0 79 8312AW 2015 ALS 10/09 - 10/12 400 596 400 56�5 376 771 0 315 0 0 315 8412AW 2016 ALS 10/07 - 10/10 400 658 400 54�4 361 667 0 331 0 0 331 9212AW 2016 ALS 11/11 - 11/14 175 145 175 62�1 163 348 0 126 0 0 126 7717A/17B 2012 AA 10/12 - 10/21 100 148 100 52 97 454 36 0 0 0 36 3717A/17B 2013 AA 10/04 - 10/13 101 163 101 52�1 95 328 67 0 0 0 67 7117B/19A/19B/20A 2014 AA 10/03 - 10/12 200 562 200 31�9 186 621 124 0 0 0 124 6717B/19A/19B/20A 2015 AA 10/02 - 10/11 200 536 200 33�6 189 595 132 0 0 0 132 7017B/19A/19B/20A 2016 AA 10/07 - 10/16 200 503 200 33�6 186 638 140 0 0 0 140 7518B 2012 AA 11/23 - 12/02 75 145 75 40 72 251 33 0 0 0 33 4618B 2013 AA 11/22 - 12/01 76 130 76 49�2 65 219 22 0 0 0 22 3418B 2014 AA 11/21 - 11/30 75 135 75 41�5 72 244 35 0 0 0 35 4918B 2015 AA 11/20 - 11/29 65 144 65 34 65 276 22 0 0 0 22 3418B 2016 AA 11/18 - 11/27 65 138 65 37 65 249 25 0 0 0 25 3820A 2012 AA 10/12 - 10/21 100 122 100 63�9 98 343 32 0 0 0 32 3320A 2013 AA 10/04 - 10/13 101 115 101 60 94 308 51 0 0 0 51 5420B 2016 AA 10/07 - 10/13 50 10 50 100 41 109 18 0 0 0 18 4420B/21 2012 AA 10/12 - 10/18 50 169 50 27�8 43 125 18 0 0 0 18 4220B/21 2013 AA 10/11 - 10/17 51 151 51 33�8 48 128 23 0 9 0 32 6720B/21 2014 AA 10/10 - 10/16 50 133 50 27�8 46 152 24 0 4 0 28 6120B/21 2015 AA 10/09 - 10/16 50 119 50 34�5 50 141 32 0 0 0 32 6420C 2012 AA 11/23 - 12/02 150 95 150 95�8 133 423 30 0 0 0 30 2320C 2013 AA 11/22 - 12/01 151 73 151 97�3 140 566 34 0 2 0 36 2620C 2014 AA 11/21 - 11/30 200 71 200 97�2 193 775 68 0 0 0 68 3520C 2015 AA 11/20 - 11/29 250 37 250 100 219 921 48 0 0 0 48 2220C 2015 AA 12/18 - 12/31 50 303 50 14�2 50 197 37 0 0 0 37 7420C 2016 AA 11/18 - 11/27 300 48 300 100 253 868 83 0 0 0 83 3320C 2016 AA 12/16 - 12/31 50 326 50 14�1 41 221 35 0 0 0 35 8521 2016 AA 10/07 - 10/13 50 91 50 31�9 41 126 21 0 9 0 30 7322 2012 AA 10/12 - 10/18 100 215 100 32�6 97 277 49 0 4 0 53 5522 2013 AA 10/11 - 10/17 101 305 101 30�8 101 314 19 0 29 0 48 4822 2014 AA 10/10 - 10/16 100 293 100 29�7 97 286 19 0 53 0 72 74
5-Year: 2012-2016 Harvest
AA = Any Antlered Deer, MD = Mule Deer, WT = Whitetail Deer, ALS = Antlerless, CN = Camp Navajo, FTHU = Fort Huachuca, C = CHAMP Hunt; in the unit column, E = early or 1st season, M = 2nd season, T = 3rd season, and L = late or 4th season�

36 Hunt Arizona 2017
Deer Harvest Data
Unit Year HuntType Dates Permits
Authorized1st ChoiceApplicants
PermitsIssued
DrawOdds Hunters Hunters
DaysHarvest Hunt
SuccessMD-Buck MD-Aless WT- Buck WT-Aless TotalGENERAL 22 2015 AA 10/09 - 10/15 100 339 100 26�3 96 298 44 0 0 0 44 4622 2016 AA 10/07 - 10/13 100 332 100 26�2 91 287 9 0 48 0 57 6323 2012 AA 10/12 - 10/18 175 442 175 29�2 153 503 64 0 5 0 69 4523 2013 AA 10/11 - 10/17 176 409 176 35�9 169 530 60 0 22 0 82 4923 2014 AA 10/10 - 10/16 175 522 175 26�8 164 495 82 0 5 0 87 5323 2015 AA 10/09 - 10/15 175 562 175 25�4 170 592 100 0 0 0 100 5923 2016 AA 10/07 - 10/13 175 523 175 29�3 151 685 74 0 21 0 95 6327 2012 AA 10/12 - 10/18 150 373 150 33�2 147 447 88 0 0 0 88 6027 2013 AA 10/11 - 10/17 126 405 126 29�6 123 288 84 0 7 0 91 7427 2014 AA 10/10 - 10/16 100 580 100 16 98 276 59 0 5 0 64 6527 2015 AA 10/09 - 10/15 75 524 75 12�6 73 214 62 0 0 0 62 8527 2016 AA 10/07 - 10/13 75 513 75 13�6 71 221 61 0 0 0 61 8628/29/30/31/32 2012 AA 10/12 - 10/18 150 430 150 31�9 147 425 75 0 3 0 78 5328/29/30/31/32 2013 AA 10/11 - 10/17 151 462 151 27�5 148 477 63 0 21 0 84 5728/29/30/31/32 2014 AA 10/10 - 10/16 150 512 150 24�8 139 383 56 0 40 0 96 6928/29/30/31/32 2015 AA 10/07 - 10/13 200 569 200 28�8 188 536 112 0 44 0 156 8328/29/30/31/32 2016 AA 10/09 - 10/15 150 566 150 22�6 138 369 93 0 0 0 93 6733 2012 AA 10/12 - 10/18 150 298 150 43 145 429 49 0 20 0 69 4833 2012 AA 11/23 - 11/29 175 128 175 76�6 170 532 66 0 8 0 74 4433 2013 AA 10/11 - 10/17 151 371 151 36�7 146 396 32 0 62 0 94 6433 2013 AA 11/22 - 11/28 176 174 176 53�4 162 566 12 0 50 0 62 3833 2014 AA 10/10 - 10/16 150 436 150 31 147 393 13 0 61 0 74 5033 2014 AA 11/21 - 11/27 150 155 150 56�8 147 500 3 0 47 0 50 3433 2015 AA 10/09 - 10/15 150 341 150 35�8 141 369 90 0 0 0 90 6433 2015 AA 11/20 - 11/26 150 140 150 54�3 141 428 57 0 0 0 57 4033 2016 AA 10/07 - 10/13 150 341 150 38�1 137 490 27 0 62 0 89 6533 2016 AA 11/18 - 11/24 175 156 175 62�8 161 473 11 0 66 0 77 4834A 2016 AA 10/07 - 10/13 75 125 74 48 68 238 10 0 29 0 39 5736A 2012 AA 10/12 - 10/18 50 116 50 37�1 40 107 19 0 0 0 19 4836A 2012 AA 11/23 - 11/29 150 51 150 86�3 146 425 36 0 4 0 40 2736A 2013 AA 10/11 - 10/17 51 129 51 31 51 129 19 0 12 0 31 6136A 2013 AA 11/22 - 11/28 151 63 151 90�5 146 456 51 0 0 0 51 3536A 2014 AA 11/21 - 11/27 200 139 200 97�8 190 648 41 0 45 0 86 4536A 2015 AA 11/20 - 11/26 175 146 175 78�8 150 539 86 0 0 0 86 5736A 2016 AA 11/18 - 11/24 175 144 175 82�6 160 506 29 0 53 0 82 5136B 2012 AA 11/23 - 11/29 125 41 125 100 115 373 29 0 3 0 32 2836B 2013 AA 11/22 - 11/28 126 41 123 100 120 411 42 0 0 0 42 3536B 2014 AA 11/21 - 11/27 125 102 125 89�2 116 346 20 0 32 0 52 4536B 2015 AA 11/20 - 11/26 125 141 125 67�4 111 323 54 0 0 0 54 4936B 2016 AA 11/18 - 11/24 125 104 125 92�3 108 337 37 0 27 0 64 5941 2016 ALS 11/18 - 11/27 30 30 30 83�3 26 49 0 27 0 0 27 10442 2012 AA 11/23 - 12/02 75 59 75 91�5 67 217 16 0 0 0 16 2442 2013 AA 11/22 - 12/01 76 49 76 100 63 298 19 0 0 0 19 3042 2014 AA 11/21 - 11/30 75 57 75 93 73 380 15 0 0 0 15 2142 2015 AA 11/20 - 11/29 75 39 75 92�3 65 305 25 0 0 0 25 3842 2016 AA 11/18 - 11/27 75 39 75 87�2 63 242 35 0 0 0 35 56FTHU 2016 11/11 - 11/27 20 11 12 100 8 80 0 0 4 0 4 50FTHU 2012 AA 11/09 - 11/25 15 14 15 100 15 72 6 0 2 0 8 53FTHU 2013 AA 11/15 - 12/01 15 14 15 100 14 61 1 0 5 0 6 43FTHU 2015 AA 11/13 - 11/29 11 12 13 91�7 0 0 0 0 0 0 0 -MUZZLELOADER3B 2012 AA 10/26 - 11/04 100 131 100 48�1 96 500 17 0 0 0 17 183B 2013 AA 10/25 - 11/03 100 141 100 44�7 98 504 19 0 0 0 19 193B 2014 AA 10/24 - 11/02 100 129 100 39�5 90 500 15 0 0 0 15 173B 2015 AA 10/23 - 11/01 100 111 100 55�9 90 445 16 0 0 0 16 183B 2016 AA 10/21 - 10/30 100 137 100 45�3 90 504 21 0 0 0 21 235 2014 AA 12/12 - 12/31 14 210 14 4�8 14 68 5 0 0 0 5 365 (Hopi) 2014 AA 12/12 - 12/31 1 2 1 0 0 0 0 0 0 0 0 -6B 2012 AA 11/09 - 11/15 275 191 275 93�7 255 1131 55 0 4 0 59 236B 2013 AA 10/25 - 10/31 275 199 275 88�9 266 1145 76 0 0 0 76 296B 2014 AA 10/24 - 10/30 275 234 275 83�3 261 1098 53 0 8 0 61 236B 2015 AA 10/23 - 10/29 275 216 275 75 247 1117 58 0 6 0 64 266B 2016 AA 10/21 - 10/27 275 255 275 83�1 253 1232 74 0 0 0 74 298 2015 AA 12/11 - 12/31 15 344 15 4�1 13 85 8 0 0 0 8 629 2014 AA 11/07 - 11/13 25 26 25 61�5 20 96 7 0 0 0 7 359 2015 AA 11/06 - 11/12 25 45 25 20 19 73 2 0 0 0 2 119 2016 AA 11/04 - 11/10 25 17 25 76�5 19 75 0 0 0 0 0 0
5-Year: 2012-2016 Harvest
YOUTH ONLY – GENERAL
AA = Any Antlered Deer, MD = Mule Deer, WT = Whitetail Deer, ALS = Antlerless, CN = Camp Navajo, FTHU = Fort Huachuca, C = CHAMP Hunt; in the unit column, E = early or 1st season, M = 2nd season, T = 3rd season, and L = late or 4th season�

Hunt Arizona 2017 37
Deer Harvest Data
Unit Year HuntType Dates Permits
Authorized1st ChoiceApplicants
PermitsIssued
DrawOdds Hunters Hunters
DaysHarvest Hunt
SuccessMD-Buck MD-Aless WT- Buck WT-Aless TotalGENERAL 12AE 2012 AA 10/26 - 11/04 50 337 50 9�5 50 277 21 0 0 0 21 4212AE 2014 AA 11/07 - 11/13 30 158 30 10�1 26 147 14 0 0 0 14 5412AE 2015 AA 11/06 - 11/12 50 135 50 20 50 229 29 0 0 0 29 5812AE 2016 AA 11/04 - 11/10 50 174 50 14�4 44 221 23 0 0 0 23 5212BW 2013 AA 11/08 - 11/14 50 196 30 9�7 27 95 19 0 0 0 19 7012BW 2014 AA 11/07 - 11/13 20 104 20 11�5 19 105 15 0 0 0 15 7912BW 2015 AA 11/06 - 11/12 25 183 25 8�7 25 111 20 0 0 0 20 8012BW 2016 AA 11/04 - 11/10 15 147 15 6�1 14 66 14 0 0 0 14 10015 2012 AA 10/26 - 11/01 200 131 200 100 186 936 59 0 0 0 59 3215 2013 AA 10/25 - 11/03 200 150 200 97�3 178 923 54 0 0 0 54 3015 2014 AA 10/24 - 11/02 200 125 200 96 178 918 43 0 0 0 43 2415 2015 AA 10/23 - 11/01 200 137 200 96�4 194 909 65 0 0 0 65 3415 2016 AA 10/21 - 10/30 200 119 200 100 184 930 49 0 0 0 49 2715 2016 AA 11/04 - 11/10 50 50 50 64 33 167 8 0 0 0 8 2420B 2012 AA 10/26 - 11/01 150 35 150 100 131 482 19 0 0 0 19 1520B 2013 AA 10/25 - 10/31 150 40 149 100 121 440 14 0 0 0 14 1220B 2014 AA 10/24 - 10/30 110 11 110 100 94 338 8 0 0 0 8 920B 2015 AA 10/23 - 10/29 110 25 110 100 98 379 14 0 0 0 14 1420B 2016 AA 10/21 - 10/27 110 17 110 100 86 314 16 0 0 0 16 1933 2012 AA 11/16 - 11/22 200 26 200 100 173 617 11 0 8 0 19 1133 2013 AA 11/15 - 11/21 200 48 198 100 163 587 4 0 14 0 18 1133 2014 AA 11/14 - 11/20 200 40 200 100 167 638 14 0 14 0 28 1733 2015 AA 11/13 - 11/19 200 27 200 100 173 582 4 0 29 0 33 1933 2016 AA 11/11 - 11/17 200 28 200 100 172 632 21 0 0 0 21 1234A 2012 AA 11/16 - 11/22 75 40 75 90 70 300 9 0 0 0 9 1334A 2013 AA 11/15 - 11/21 25 39 25 35�9 25 114 6 0 3 0 9 3634A 2014 AA 11/14 - 11/20 25 41 25 39 23 93 11 0 0 0 11 4834A 2015 AA 11/13 - 11/19 25 35 25 20 25 108 5 0 3 0 8 3234A 2016 AA 11/11 - 11/17 25 37 25 37�8 20 86 9 0 0 0 9 4535 2014 AA 10/31 - 11/06 80 29 80 86�2 76 400 4 0 0 0 4 535 2014 AA 12/12 - 12/31 20 134 20 13�4 15 60 0 0 0 0 0 035 2016 AA 10/28 - 11/03 40 31 40 51�6 38 179 4 0 0 0 4 1135 2016 AA 12/09 - 12/31 10 114 10 7 5 38 3 0 0 0 3 6035 E 2012 AA 11/02 - 11/08 50 22 50 86�4 44 200 4 0 2 0 6 1435 E 2013 AA 11/01 - 11/07 80 33 80 72�7 67 276 12 0 0 0 12 1835 E 2015 AA 10/30 - 11/05 20 21 40 66�7 35 169 9 0 3 0 12 3435 L 2012 AA 12/14 - 12/31 50 162 50 21 50 268 32 0 2 0 34 6835 L 2013 AA 12/13 - 12/31 20 193 20 8�8 20 173 10 0 0 0 10 5035 L 2015 AA 12/11 - 12/31 10 125 10 6�4 10 98 2 0 3 0 5 5036A 2016 WT 10/07 - 10/13 75 21 75 95�2 52 188 0 0 33 0 33 6339/40/41/42 2012 AA 12/14 - 12/31 50 402 50 9�7 48 338 12 0 0 0 12 2539/40/41/42 2013 AA 12/13 - 12/31 50 374 50 9�9 46 363 23 0 0 0 23 5039/40/41/42 2014 AA 12/12 - 12/31 50 398 50 9�3 45 305 26 0 0 0 26 5839/40/41/42 2015 AA 12/11 - 12/31 50 417 50 8�9 50 388 13 0 0 0 13 2639/40/41/42 2016 AA 12/09 - 12/31 50 393 50 10�7 47 370 13 0 0 0 13 28FTHU 2015 12/11 - 12/31 8 8 8 75 8 60 2 0 0 0 2 25FTHU 2016 10/21 - 12/31 10 7 7 85�7 5 33 5 0 0 0 5 100FTHU 2016 10/21 - 10/30 10 11 13 90�9 13 66 0 0 6 0 6 46FTHU 2012 AA 12/14 - 12/31 13 14 13 85�7 13 83 3 0 0 0 3 23FTHU 2012 AA 11/16 - 11/25 7 3 7 100 5 19 0 0 0 0 0 0FTHU 2013 AA 12/13 - 12/31 13 14 13 92�9 11 78 4 0 2 0 6 55FTHU 2013 AA 11/22 - 12/01 7 1 7 100 7 37 2 0 5 0 7 10015 2012 AA 11/23 - 12/02 20 22 19 13�6 19 95 10 0 0 0 10 5315 2013 AA 11/22 - 12/01 21 11 21 90�9 21 72 9 0 0 0 9 4315 2014 AA 11/21 - 11/30 20 7 20 42�9 13 44 7 0 0 0 7 5415 2015 AA 11/20 - 11/29 20 9 20 88�9 20 88 8 0 0 0 8 4015 2016 AA 11/18 - 11/27 20 21 20 66�7 20 104 12 0 0 0 12 6016A 2012 AA 12/21 - 12/31 25 56 26 39�3 26 121 17 0 0 0 17 6516A 2013 AA 12/20 - 12/31 26 83 26 28�9 23 133 13 0 0 0 13 5716A 2014 AA 12/19 - 12/31 25 64 25 29�7 21 125 7 0 0 0 7 3316A 2015 AA 12/18 - 12/31 25 54 25 35�2 22 128 13 0 0 0 13 5916A 2016 AA 12/16 - 12/31 25 41 25 39 25 81 19 0 0 0 19 7616A 2015 AA 12/18-12/31 25 54 25 35�2 22 128 13 0 0 0 13 59
5-Year: 2012-2016 Harvest
AA = Any Antlered Deer, MD = Mule Deer, WT = Whitetail Deer, ALS = Antlerless, CN = Camp Navajo, FTHU = Fort Huachuca, C = CHAMP Hunt; in the unit column, E = early or 1st season, M = 2nd season, T = 3rd season, and L = late or 4th season�
MUZZLELOADER

38 Hunt Arizona 2017
Deer Harvest Data
5-Year: 2012-2016 Archery Deer Harvest (Over-the-Counter hunts only) 2015 data not availble
Unit Year HuntersHunterDays
DEER HARVEST PercentSuccess
Mule Deer Whitetail TotalBuck Antlerless Buck Antlerless1 2012 538 2516 35 0 0 0 35 71 2013 384 2192 16 0 0 0 16 41 2014 466 2306 12 0 0 0 12 31 2016 321 1944 16 0 0 0 16 52 2012 50 186 5 0 0 0 5 102 2013 38 141 0 0 0 0 0 02 2014 37 159 6 0 0 0 6 162 2016 39 204 0 0 0 0 0 003A/03C 2014 140 914 27 0 0 0 27 1903A/03C 2016 57 414 17 0 0 0 17 3003B 2012 247 1273 0 0 0 0 0 003B 2013 162 909 5 0 0 0 5 303B 2014 178 791 12 0 0 0 12 703B 2016 102 596 8 0 0 0 8 803C 2014 25 147 6 0 0 0 6 244 2012 438 1953 5 0 0 0 5 14 2013 395 1894 0 0 0 0 0 04 2014 325 1496 6 0 0 0 6 24 2016 165 956 0 0 0 0 0 05 2012 850 4126 15 0 10 0 25 35 2013 471 2116 16 0 0 0 16 35 2014 441 2042 12 0 6 0 18 45 2016 400 2093 8 0 0 0 8 206A 2012 1485 7060 10 0 10 0 20 106A 2013 893 5065 11 0 11 0 22 206A 2014 742 3673 0 0 6 0 6 106A 2016 627 2876 16 0 16 0 32 506B 2012 473 2184 15 0 0 0 15 306B 2013 357 2073 11 0 22 0 33 906B 2014 337 1502 12 0 0 0 12 406B 2016 353 1826 71 0 0 0 71 2006B South 2014 31 141 0 0 0 0 0 07 2012 1167 5621 35 0 0 0 35 37 2013 801 4232 70 0 0 0 70 97 2014 932 4795 74 0 0 0 74 87 2016 698 3833 47 0 0 0 47 78 2012 835 4106 15 0 0 0 15 28 2013 660 3447 5 0 0 0 5 18 2014 583 3244 55 0 0 0 55 98 2016 408 2187 8 0 0 0 8 2
5-Year: 2012-2016 Harvest
Unit Year HuntType Dates Permits
Authorized1st ChoiceApplicants
PermitsIssued
DrawOdds Hunters Hunters
DaysHarvest Hunt
SuccessMD-Buck MD-Aless WT- Buck WT-Aless TotalARCHERY3A/3C 2012 AA 8/24 - 9/13 200 133 200 91 186 1255 26 0 0 0 26 143A/3C 2013 AA 8/23 - 9/12 200 230 200 63 182 1261 29 0 0 0 29 163A/3C 2014 AA 8/22 - 9/11 150 254 151 40�2 140 914 27 0 0 0 27 193A/3C 2015 AA 8/21 - 9/10 100 337 100 20�2 94 632 29 0 0 0 29 313A/3C 2016 AA 8/19 - 9/08 75 344 74 15�1 57 414 17 0 0 0 17 3011M 2016 AA 8/19 - 9/08 80 103 80 49�5 53 451 10 0 0 0 10 1912 2014 AA 8/22 - 9/11 800 913 800 65�1 725 4717 218 0 0 0 218 3012 2016 AA 8/19 - 9/08 475 1131 473 31�7 427 2957 150 0 0 0 150 3512A/12B 2012 AA 8/24 - 9/13 700 849 704 60 623 4557 103 0 0 0 103 1712A/12B 2013 AA 8/23 - 9/12 700 779 700 63�4 645 4498 157 0 0 0 157 2412A/12B 2015 AA 8/21 - 9/10 550 1025 550 39�3 531 3778 191 0 0 0 191 3613A 2012 AA 8/24 - 9/13 30 232 30 7�8 26 190 14 0 0 0 14 5413A 2013 AA 8/23 - 9/12 30 193 30 9�3 28 338 10 0 0 0 10 3613A 2014 AA 8/22 - 9/11 30 194 30 7�7 28 252 16 0 2 0 18 6413A 2015 AA 8/21 - 9/10 30 309 30 4�9 30 353 11 0 0 0 11 3713A 2016 AA 8/19 - 9/08 25 174 24 5�2 22 206 14 0 0 0 14 6413B 2012 AA 8/24 - 9/13 25 345 25 6�1 25 310 10 0 0 0 10 4013B 2013 AA 8/23 - 9/12 25 330 25 6�1 23 252 10 0 0 0 10 4313B 2014 AA 8/22 - 9/11 25 395 25 4�1 23 152 16 0 0 0 16 7013B 2015 AA 8/21 - 9/10 25 518 25 4�1 25 248 15 0 0 0 15 6013B 2016 AA 8/19 - 9/08 25 636 24 3�3 24 248 18 0 0 0 18 75

Hunt Arizona 2017 39
Deer Harvest Data
5-Year: 2012-2016 Archery Deer Harvest (Over-the-Counter hunts only) 2015 data not availble
Unit Year HuntersHunterDays
DEER HARVEST PercentSuccess
Mule Deer Whitetail TotalBuck Antlerless Buck Antlerless9 2012 136 599 0 0 0 0 0 09 2013 168 942 5 0 0 0 5 39 2014 147 717 18 0 0 0 18 129 2016 133 839 24 0 0 0 24 1810 2012 639 3085 10 0 0 0 10 210 2013 579 3182 27 0 0 0 27 510 2014 809 3839 31 0 0 0 31 410 2016 470 3472 31 0 0 0 31 711M 2012 674 3538 45 0 5 0 50 711M 2013 482 2581 65 0 0 0 65 1311M 2014 521 3164 67 0 0 0 67 1311M 2016 53 451 10 0 0 0 10 1911M 2016 24 86 0 0 0 0 0 012 2014 725 4717 218 0 0 0 218 3013A 2014 28 252 16 0 2 0 18 6413B 2014 23 152 16 0 0 0 16 7015A/15B 2012 131 810 15 0 0 0 15 1115A/15B 2013 249 1916 32 0 0 0 32 1315AB 2014 276 1950 31 0 0 0 31 1115AB 2016 157 1199 31 0 0 0 31 2015C/15D 2012 10 75 0 0 0 0 0 015CD 2014 12 61 0 0 0 0 0 015CD 2016 31 78 8 0 0 0 8 2616A 2012 176 745 15 0 0 0 15 916A 2013 200 915 22 0 0 0 22 1116A 2014 159 687 18 0 0 0 18 1116A 2016 125 682 0 0 0 0 0 017A 2012 292 1404 40 0 0 0 40 1417A 2013 325 1954 16 0 0 0 16 517A 2014 386 2870 37 0 0 0 37 1017A 2016 86 839 8 0 0 0 8 917B 2012 367 1993 15 0 0 0 15 417B 2013 574 3864 60 0 0 0 60 1017B 2014 656 4709 49 0 0 0 49 717B 2016 447 3104 63 0 0 0 63 1418A 2012 262 1178 0 0 0 0 0 018A 2013 319 1894 32 0 0 0 32 1018A 2014 392 2385 6 0 0 0 6 218A 2016 259 1599 39 0 0 0 39 1518B 2012 267 1610 15 0 0 0 15 618B 2013 319 1818 11 0 0 0 11 318B 2014 343 1925 18 0 0 0 18 518B 2016 251 1238 8 0 0 0 8 319A 2012 513 2642 20 0 0 0 20 419A 2013 639 3929 54 0 5 0 59 919A 2014 693 3918 43 0 6 0 49 719A 2016 619 3574 78 0 0 0 78 1319B 2012 216 1384 15 0 0 0 15 719B 2013 254 1921 16 0 0 0 16 619B 2014 294 1889 25 0 0 0 25 919B 2016 157 1035 8 0 0 0 8 520A 2012 584 2727 0 0 0 0 0 020A 2013 676 3886 87 0 0 0 87 1320A 2014 644 3606 55 0 0 0 55 920A 2016 455 3057 55 0 0 0 55 1220B 2012 337 1600 5 0 0 0 5 120B 2013 384 1927 16 0 0 0 16 420B 2014 417 1913 12 0 0 0 12 320B 2016 361 1599 8 0 0 0 8 220C 2012 231 1283 10 0 0 0 10 420C 2013 276 1694 11 0 0 0 11 420C 2014 368 2146 37 0 0 0 37 1020C 2016 384 2265 16 0 0 0 16 421 2012 1052 4927 20 0 5 0 25 221 2013 1499 8875 38 0 11 0 49 321 2014 1423 7671 37 0 37 0 74 521 2016 682 3151 0 0 31 0 31 522 2012 1117 5173 5 0 40 0 45 422 2013 1261 7117 11 0 87 0 98 8

40 Hunt Arizona 2017
Deer Harvest Data
5-Year: 2012-2016 Archery Deer Harvest (Over-the-Counter hunts only) 2015 data not availble
Unit Year HuntersHunterDays
DEER HARVEST PercentSuccess
Mule Deer Whitetail TotalBuck Antlerless Buck Antlerless22 2014 1190 6733 12 0 49 0 61 522 2016 1097 5667 8 0 63 0 71 622N 2014 6 37 0 0 6 0 6 10022S 2014 6 18 0 0 0 0 0 023 2012 1253 6255 25 0 25 0 50 423 2013 1288 6121 38 0 43 0 81 623 2014 1349 7205 31 0 43 0 74 523 2016 1011 6286 102 0 63 0 165 1624A 2012 528 2949 5 0 25 0 30 624A 2013 676 4140 22 0 27 0 49 724A 2014 662 3796 0 0 43 0 43 624A 2016 368 2014 8 0 16 0 24 724B 2012 679 3492 20 0 0 0 20 324B 2013 931 5515 5 0 11 0 16 224B 2014 742 4807 37 0 25 0 62 824B 2016 541 3394 31 0 8 0 39 725M 2013 103 520 11 0 0 0 11 1125M 2014 147 583 12 0 0 0 12 825M 2016 102 831 31 0 0 0 31 3026M 2012 171 1097 0 0 0 0 0 026M 2013 108 871 11 0 0 0 11 1026M 2014 202 1269 18 0 0 0 18 926M 2016 133 690 31 0 0 0 31 2327 2012 906 4433 35 0 15 0 50 627 2013 768 5076 32 0 22 0 54 727 2014 865 5096 49 0 37 0 86 1027 2016 713 4397 78 0 31 0 109 1528 2012 196 1022 0 0 0 0 0 028 2013 271 1661 5 0 0 0 5 228 2014 172 773 0 0 0 0 0 028 2016 110 502 24 0 0 0 24 2229 2012 247 1595 10 0 25 0 35 1429 2013 227 1429 16 0 27 0 43 1929 2014 184 1012 6 0 43 0 49 2729 2016 243 1089 8 0 55 0 63 2630A 2012 166 956 10 0 10 0 20 1230A 2013 211 1607 0 0 27 0 27 1330A 2014 270 1711 18 0 6 0 24 930A 2016 259 1474 16 0 8 0 24 930B 2012 267 1550 35 0 15 0 50 1930B 2013 487 3572 38 0 16 0 54 1130B 2014 441 3336 25 0 12 0 37 830B 2016 321 2571 39 0 24 0 63 2031 2012 352 1942 5 0 10 0 15 431 2013 336 1786 11 0 0 0 11 331 2014 429 2624 12 0 25 0 37 931 2016 235 1160 24 0 8 0 32 1432 2012 347 1620 10 0 5 0 15 432 2013 487 2506 0 0 22 0 22 532 2014 441 2949 12 0 0 0 12 332 2016 259 1505 0 0 8 0 8 333 2012 1107 6466 0 0 50 0 50 533 2013 1753 11127 16 0 70 0 86 533 2014 1410 9173 31 0 74 0 105 733 2016 862 5424 16 0 55 0 71 834A 2012 629 3548 0 0 35 0 35 634A 2013 936 6186 27 0 32 0 59 634A 2014 926 5721 25 0 80 0 105 1134A 2016 666 4154 24 0 63 0 87 1334B 2012 186 866 0 0 15 0 15 834B 2013 319 2224 0 0 16 0 16 534B 2014 288 2753 12 0 12 0 24 834B 2016 172 1089 8 0 16 0 24 1435A 2012 307 2053 5 0 15 0 20 735A 2013 552 4654 5 0 22 0 27 535A 2014 435 3808 12 0 55 0 67 1535A 2016 353 2469 0 0 24 0 24 735B 2012 171 946 0 0 5 0 5 335B 2013 189 1407 0 0 16 0 16 835B 2014 178 816 0 0 25 0 25 14

Hunt Arizona 2017 41
Deer Harvest Data
Unit Year HuntersHunterDays
DEER HARVEST PercentSuccess
Mule Deer Whitetail TotalBuck Antlerless Buck Antlerless35B 2016 243 1646 0 0 39 0 39 1636A 2012 589 3613 25 0 20 0 45 836A 2013 909 6115 38 0 11 0 49 536A 2014 987 6224 48 0 14 0 62 636A 2016 698 4452 16 0 0 0 16 236B 2012 387 1822 15 0 5 0 20 536B 2013 639 3669 22 0 5 0 27 436B 2014 625 3501 43 0 12 0 55 936B 2016 525 3143 24 0 16 0 40 836C 2012 196 926 5 0 0 0 5 336C 2013 373 2029 5 0 5 0 10 336C 2014 386 1981 12 0 6 0 18 536C 2016 196 1254 0 0 16 0 16 837A 2012 262 1474 10 0 0 0 10 437A 2013 547 3231 22 0 0 0 22 437A 2014 497 2992 25 0 0 0 25 537A 2016 384 1858 8 0 0 0 8 237B 2012 689 3840 5 0 5 0 10 137B 2013 1142 6316 54 0 5 0 59 537B 2014 1165 6212 37 0 0 0 37 337B 2016 862 6255 31 0 0 0 31 438M 2012 242 1590 15 0 0 0 15 638M 2013 368 2874 54 0 0 0 54 1538M 2014 392 2281 31 0 6 0 37 938M 2016 157 1160 16 0 8 0 24 1539/40 2012 156 795 0 0 0 0 0 039/40 2013 276 1688 16 0 0 0 16 639/40 2014 233 1177 12 0 0 0 12 539/40 2016 196 1129 8 0 0 0 8 441 2012 211 1454 5 0 0 0 5 241 2013 390 2105 5 0 0 0 5 141 2014 435 2624 37 0 0 0 37 941 2016 282 2171 0 0 0 0 0 042 2012 156 765 5 0 0 0 5 342 2013 271 1304 11 0 0 0 11 442 2014 313 1680 18 0 0 0 18 642 2016 243 1560 24 0 0 0 24 1043/44 2012 176 1152 5 0 0 0 5 343/44 2013 260 1900 27 0 0 0 27 1043/44 2014 300 2220 12 0 0 0 12 443/44 2016 204 1489 31 0 0 0 31 1545 2012 40 226 0 0 0 0 0 045 2013 76 292 0 0 0 0 0 045 2014 49 331 0 0 0 0 0 045 2016 47 204 8 0 0 0 8 1747M 2012 10 55 0 0 0 0 0 047M 2012 35 201 0 0 0 0 0 047M 2012 5 60 0 0 0 0 0 045 2012 40 226 0 0 0 0 0 045 2013 76 292 0 0 0 0 0 045 2014 49 331 0 0 0 0 0 045 2016 47 204 8 0 0 0 8 1747M 2012 10 55 0 0 0 0 0 047M 2012 35 201 0 0 0 0 0 047M 2012 5 60 0 0 0 0 0 0
5-Year: 2012-2016 Archery Deer Harvest (Over-the-Counter hunts only) 2015 data not availble
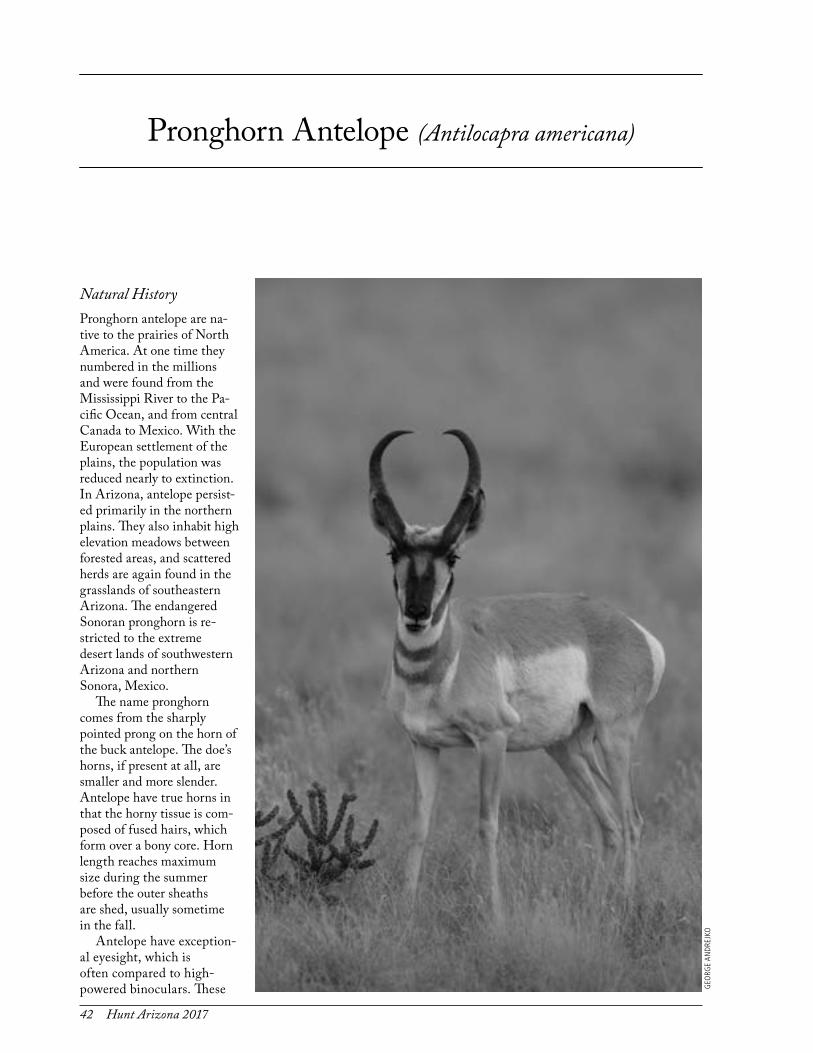
42 Hunt Arizona 2017
Natural HistoryPronghorn antelope are na-tive to the prairies of North America. At one time they numbered in the millions and were found from the Mississippi River to the Pa-cific Ocean, and from central Canada to Mexico. With the European settlement of the plains, the population was reduced nearly to extinction. In Arizona, antelope persist-ed primarily in the northern plains. They also inhabit high elevation meadows between forested areas, and scattered herds are again found in the grasslands of southeastern Arizona. The endangered Sonoran pronghorn is re-stricted to the extreme desert lands of southwestern Arizona and northern Sonora, Mexico.
The name pronghorn comes from the sharply pointed prong on the horn of the buck antelope. The doe’s horns, if present at all, are smaller and more slender. Antelope have true horns in that the horny tissue is com-posed of fused hairs, which form over a bony core. Horn length reaches maximum size during the summer before the outer sheaths are shed, usually sometime in the fall.
Antelope have exception-al eyesight, which is often compared to high-powered binoculars. These
Pronghorn Antelope (Antilocapra americana)
GEO
RGE
AN
DRE
JKO

Hunt Arizona 2017 43
“prairie goats” are also one of the fastest mammals, being able to run in excess of 60 mph. Despite their speed, antelope are reluctant to jump over objects, preferring to crawl under or through fences rather than leap over them.
A conspicuous characteristic of the antelope is the white rump patch. When an animal is alarmed, its rump hairs stand erect and appear as a white flash that can be seen for miles. The dominant body color is an apricot tan, with sharply contrasting white markings on the belly, head, and neck. The top of the buck’s muz-zle is brown or black, and below the ear he will usually have a triangular black cheek patch, which is lacking on the doe. A short mane is present along the top of the neck. Shedding is continuous, with the individu-al hairs being loosely attached to the skin, making the
hide nearly worth-less. Since the hairs are hollow and can be erected at will, prong-horns are able to adjust to great extremes in temperature.
Adult bucks usually weigh be-tween 90 and 120 pounds. The does are about 20 pounds lighter. Antelope are pri-marily browsers,
feeding mostly on weeds and short browse plants, with grass being only a minor food source. Because of Ari-zona’s mild winters, antelope tend to live longer than the six to eight year average life span of their northern cousins, one reason that a disproportionate number of Arizona bucks are trophy animals with horns in excess of 15 inches in length.
Antelope are gregarious and usually seen in mixed herds, except in the spring when the bucks are alone or in small bachelor groups. Later, in the summer and early fall, these same bucks will collect harems of does, which may number up to 15 animals, which they then defend from other bucks. Antelope breed in August and September, and the young are born in May and
June. A doe will typically produce one or two fawns. The young are not spotted like the fawns of the deer family, but instead have markings similar to those of adults. The fawns remain hidden, with the doe feed-ing them several times a day, until they are about two to three weeks old and strong enough to travel with the adults. During this time, pronghorn fawns, or “kids,” are the most vulnerable to coyotes, which may take 75 percent or more of the year’s production. Adult ante-lope are taken by mountain lions, as well as by coyotes.
Hunt HistoryOnce second only to deer as a game animal, Arizona’s antelope were first given a closed season in 1893. The response must have been less than satisfactory, however, as the season was completely closed in 1905. By 1922, the state’s antelope population was estimated to be less than 1,000 animals.
Then, for reasons that still are not fully understood, pronghorn antelope began to make a comeback. Aid-ed by a closed season, government predator control programs, and the abandonment of numerous home-steads, pronghorn numbers steadily increased until fears were expressed that some northern Arizona popu-lations were in danger of exceeding their food supply. Accordingly, a limited hunt of 400 buck permits was authorized for northern Arizona in 1941.
After a closed season from 1944 to 1948, ante-lope hunting in Arizona recommenced in 1949. Hunts were liberalized gradually, until 1954 when 1,600 per-mits were issued and 1,146 bucks were taken. Despite the issuance of a number of antlerless antelope per-mits between 1961 and 1975, this level of harvest has never again been equaled. Annual harvests since 1990 have varied between 500 and 700 bucks, with archers taking a proportionally larger percent of the harvest in recent years. Plagued by encroaching subdivisions, increasing highway construction, and other land-use changes, maintaining even the present number of an-telope is dependent on citizen involvement and an aggressive translocation program.
Antelope distribution

44 Hunt Arizona 2017
Pronghorn Antelope Survey Data
Year Bucks Does Fawns Unclassified Total Bucks/100 Does Fawns/100 Does 1948 943 1944 1536 0 4423 49 791949 1302 2153 1397 0 4852 60 651950 1208 2280 1550 0 5038 53 681951 1134 2007 1089 0 4230 57 541952 1130 2312 1840 0 5282 49 801953 1119 2230 1040 0 4389 50 471954 1098 2086 1344 0 4528 53 641955 1148 2283 969 0 4400 50 421956 862 2056 891 0 3809 42 431957 782 2169 806 0 3757 36 371958 819 2396 1096 0 4311 34 461959 994 2545 1631 0 5170 39 641960 1006 2745 1689 0 5440 37 621961 835 2180 1067 123 4205 38 491962 817 2711 1158 37 4723 30 431963 893 2699 1386 30 5008 33 511964 874 2905 1410 12 5201 30 491965 1014 2948 1040 0 5002 34 351966 969 2851 1181 44 5045 34 411967 1060 3086 1329 22 5497 34 431968 590 2249 938 0 3777 26 421969 799 2472 1053 2 4326 32 431970 866 2730 1728 1 5325 32 631971 993 2559 636 2 4190 39 251972 749 2028 841 23 3641 37 411973 1211 3005 1275 14 5505 40 421974 1006 2878 941 6 4831 35 331975 910 2926 1086 0 4922 31 371976 950 3347 932 1 5230 28 281977 936 3177 727 0 4840 29 231978 937 3473 1352 0 5762 27 391979 1071 3706 1204 1 5982 29 321980 1190 3750 1173 0 6113 32 311981 1292 3833 899 0 6024 34 231982 1029 3388 1300 5 5722 30 381983 1157 3753 1471 3 6384 31 391984 1264 3611 1190 12 6077 35 331985 1563 4881 1477 1 7922 32 301986 1800 5327 1610 0 8737 34 301987 1685 5249 1632 2 8568 32 311988 1915 6013 1413 0 9341 32 241989 1572 4967 1131 4 7674 32 231990 1731 5738 1323 3 8795 30 231991 1581 5326 1825 9 8741 30 341992 1916 5663 1831 1 9411 34 321993 2133 6187 2294 34 10648 34 371994 2019 5809 1427 0 9255 35 251995 2236 6638 1787 14 10675 34 271996 2036 5498 435 7 7976 37 81997 1998 6426 2037 28 10489 31 321998 1997 6152 1651 11 9811 32 271999 1814 5420 1076 8 8318 33 202000 1455 4453 1002 7 6917 33 232001 1739 5702 1773 15 9229 31 312002 1503 4305 353 8 6169 35 82003 1313 4484 1459 1 7257 29 332004 1353 4502 1494 1 7350 30 332005 1292 3626 1485 16 6419 36 412006 1205 3006 596 16 4823 40 402007 952 2778 620 16 4366 34 222008 1014 2816 538 12 4380 36 192009 892 2883 520 4 4299 31 182010 913 3182 869 6 4970 29 272011 811 3047 891 3 4752 27 292012 1006 3082 879 5 4972 33 29
Historic Summary of Antelope Survey Data

Hunt Arizona 2017 45
Pronghorn Antelope Survey Data
5-year: 2012-2016 Antelope Survey Data
Unit Year Bucks Does Fawns Unclassified Total Bucks/100 does Fawns/100 Does 1 2012 30 138 36 0 204 22 261 2013 57 158 39 0 254 36 251 2014 45 147 43 0 235 31 291 2015 55 194 36 0 285 28 191 2016 58 166 29 0 253 35 172A 2012 24 51 3 1 79 47 62A 2013 21 76 13 0 110 28 172A 2014 42 113 29 0 184 37 262A 2015 44 132 45 0 221 33 342A 2016 50 149 37 0 236 34 252B 2012 14 70 17 0 101 20 242B 2013 20 73 14 0 107 27 192B 2014 27 111 16 0 154 24 142B 2015 12 62 23 0 97 19 372B 2016 19 105 26 0 150 18 252C 2012 30 66 7 3 106 45 112C 2013 28 105 2 0 135 27 22C 2014 20 98 11 0 129 20 112C 2015 29 96 13 0 138 30 142C 2016 14 108 11 0 133 13 103A 2012 43 125 34 0 202 34 273A 2013 60 196 25 0 281 31 133A 2014 61 181 45 0 287 34 253A 2015 60 183 18 0 261 33 103A 2016 8 74 22 0 104 11 303B North 2012 8 41 5 0 54 20 123B North 2013 4 30 7 0 41 13 233B North 2014 9 37 10 0 56 24 273B North 2015 13 36 12 0 61 36 333B North 2016 8 27 9 0 44 30 333B South 2012 12 29 11 0 52 41 383B South 2013 20 26 12 0 58 77 463B South 2014 21 38 5 0 64 55 133B South 2015 15 39 9 0 63 38 233B South 2016 14 32 6 0 52 44 193C 2012 11 101 18 0 130 11 183C 2013 29 93 17 0 139 31 183C 2014 22 73 37 0 132 30 513C 2015 42 93 12 0 147 45 133C 2016 26 95 17 0 138 27 184A 2012 45 134 72 0 251 34 544A 2013 44 87 40 0 171 51 464A 2014 65 157 101 0 323 41 644A 2015 56 128 51 0 235 44 404A 2016 34 70 10 2 116 49 144B 2012 32 69 24 0 125 46 354B 2013 36 122 54 0 212 30 444B 2014 43 114 45 0 202 38 394B 2015 31 68 29 0 128 46 434B 2016 46 153 18 0 217 30 125A 2012 15 82 36 1 134 18 445A 2013 16 47 19 0 82 34 405A 2014 18 89 44 0 151 20 495A 2015 13 63 24 0 100 21 385A 2016 35 97 24 0 156 36 25
Year Bucks Does Fawns Unclassified Total Bucks/100 Does Fawns/100 Does 2013 1106 3070 884 8 5068 36 292014 1106 3417 1066 0 5559 32 302015 1109 3269 1067 30 5475 34 332016 1128 3362 796 18 5304 34 24
Historic Summary of Antelope Survey Data (continued)

46 Hunt Arizona 2017
Pronghorn Antelope Survey Data
5-year: 2012-2016 Antelope Survey DataUnit Year Bucks Does Fawns Unclassified Total Bucks/100 does Fawns/100 Does
5B 2012 38 154 47 0 239 25 315B 2013 45 141 47 0 233 32 335B 2014 52 183 49 0 284 28 275B 2015 70 196 73 0 339 36 375B 2016 70 191 67 0 328 37 356A 2012 6 15 14 0 35 40 936A 2013 8 17 15 0 40 47 886A 2014 6 30 11 0 47 20 376A 2015 16 52 21 0 89 31 406A 2016 13 19 5 0 37 68 266B 2012 11 48 12 0 71 23 256B 2013 12 46 17 0 75 26 376B 2014 8 35 11 0 54 23 316B 2015 7 29 7 0 43 24 246B 2016 7 33 13 0 53 21 397 2012 60 159 40 0 259 38 257 2013 79 173 77 0 329 46 457 2014 77 238 71 0 386 32 307 2015 50 156 60 7 273 32 387 2016 54 137 27 0 218 39 208 2012 40 113 62 0 215 35 558 2013 47 107 45 0 199 44 428 2014 44 127 36 0 207 35 288 2015 19 56 23 0 98 34 418 2016 35 77 32 0 144 45 429 2012 35 72 46 0 153 49 649 2013 43 75 45 0 163 57 609 2014 45 101 26 0 172 45 269 2015 30 106 43 0 179 28 419 2016 33 63 21 8 125 52 3310 2012 116 375 133 0 624 31 3510 2013 123 322 95 0 540 38 3010 2014 162 453 150 0 765 36 3310 2015 133 287 125 5 550 46 4410 2016 108 276 36 0 420 39 1312 2012 7 24 5 0 36 29 2112 2013 11 16 3 0 30 69 1912 2014 17 29 13 0 59 59 4512 2015 7 34 18 0 59 21 5312 2016 12 40 11 0 63 30 2813A 2012 13 87 4 0 104 15 513A 2013 31 128 16 0 175 24 1313A 2014 20 85 21 0 126 24 2513A 2015 11 70 21 0 102 16 3013A 2016 22 71 10 0 103 31 1413B 2012 16 43 8 0 67 37 1913B 2013 16 53 11 0 80 30 2113B 2014 21 47 16 0 84 45 3413B 2015 23 60 32 0 115 38 5313B 2016 24 54 20 0 98 44 3715A 2013 1 2 2 0 5 50 10015B 2012 4 4 3 0 11 100 7515B 2013 3 11 3 0 17 27 2715B 2014 1 9 4 0 14 11 4415B 2015 2 6 2 0 10 33 3315B 2016 7 7 5 0 19 100 7117A 2012 14 63 2 0 79 22 317A 2013 4 50 4 0 58 8 817A 2014 6 50 1 0 57 12 217A 2015 6 63 6 0 75 10 1017A 2016 8 33 2 0 43 24 617B 2012 12 46 8 0 66 26 1717B 2013 14 50 9 0 73 28 1817B 2014 6 13 0 0 19 46 0

Hunt Arizona 2017 47
Pronghorn Antelope Survey Data
5-year: 2012-2016 Antelope Survey DataUnit Year Bucks Does Fawns Unclassified Total Bucks/100 does Fawns/100 Does
17B 2015 7 20 1 0 28 35 517B 2016 9 44 7 0 60 20 1618A 2012 13 23 4 0 40 57 1718A 2013 19 64 12 0 95 30 1918A 2014 17 29 10 0 56 59 3418A 2015 31 97 20 0 148 32 2118A 2016 30 148 31 0 209 20 2118B 2012 23 134 19 0 176 17 1418B 2013 25 75 14 0 114 33 1918B 2014 13 84 23 0 120 15 2718B 2015 38 130 28 0 196 29 2218B 2016 21 129 17 0 167 16 1319A 2012 150 277 61 0 488 54 2219A 2013 123 339 85 0 547 36 2519A 2014 85 327 97 0 509 26 3019A 2015 98 344 97 0 539 28 2819A 2016 96 259 76 0 431 37 2919B 2012 97 283 86 0 466 34 3019B 2013 81 122 60 8 271 66 4919B 2014 49 112 26 0 187 44 2319B 2015 75 160 53 18 306 47 3319B 2016 65 101 29 4 199 64 2921 2012 33 87 15 0 135 38 1721 2013 22 89 43 0 154 25 4821 2014 20 109 28 0 157 18 2621 2015 30 75 37 0 142 40 4921 2016 13 77 16 0 106 17 2127 2012 1 6 2 0 9 17 3327 2013 2 6 4 0 12 33 6727 2014 1 5 0 0 6 20 028 2013 1 0 0 0 1 - -28 South 2012 3 1 0 0 4 300 030A 2012 19 48 4 0 71 40 830A 2013 26 55 4 0 85 47 730A 2014 26 41 9 0 76 63 2230A 2015 24 70 48 0 142 34 6930A 2016 39 120 38 0 197 33 3231/32 2012 19 36 11 0 66 53 3131/32 2013 20 47 7 0 74 43 1531/32 2014 17 36 14 0 67 47 3931/32 2015 24 58 19 0 101 41 3331/32 2016 20 68 32 0 120 29 4734B 2012 5 33 10 0 48 15 3034B 2013 5 26 6 0 37 19 2334B 2014 10 36 14 0 60 28 3934B 2015 8 21 7 0 36 38 3334B 2016 12 38 17 0 67 32 4535 2012 5 43 20 0 68 12 4735 2013 9 43 18 0 70 21 4235 2014 30 80 20 0 130 38 2535 2015 30 85 54 0 169 35 6435 2016 44 156 39 0 239 28 2536B 2012 2 2 0 0 4 100 036B 2013 1 0 0 0 1 - -

48 Hunt Arizona 2017
Pronghorn Antelope Hunt Data
Historic Summary of General Antelope Hunts (Youth-Only Hunts listed separately)
Year1st Choice Applicants
Permits Issued Hunters Hunter Days
Harvest Percent SuccessBucks Does/Fawns1 Total
1941 – 400 387 – 286 0 286 741942 – 750 721 – 487 0 487 681943 – 1072 991 – 522 0 522 531949 – 606 575 – 437 0 437 761950 – 520 502 – 382 0 382 761951 – 835 794 – 548 0 548 691952 – 1233 1201 – 739 0 739 621953 – 1340 1283 – 828 0 828 651954 – 1600 1561 – 1146 0 1146 731955 – 955 914 – 578 0 578 631956 – 445 430 – 297 0 297 691957 – 305 296 – 205 0 205 691958 – 490 476 – 317 0 317 671959 – 990 974 – 589 0 589 611960 – 1200 1174 – 722 0 722 621961 – 1411 1373 – 687 68 755 551962 – 1215 1173 – 559 53 612 521963 – 1281 1257 – 690 39 729 581964 – 1413 1377 – 724 125 849 621965 – 1278 1248 – 652 25 677 541966 6781 1180 1150 – 542 20 562 491967 5895 1336 1297 – 667 27 694 541968 4291 800 782 – 352 2 354 451969 5178 810 791 – 406 0 406 511970 6769 1124 1103 – 589 28 617 561971 6493 909 896 – 559 0 559 621972 5594 997 972 – 480 20 500 511973 6161 1219 1205 – 642 21 663 551974 6435 1213 1181 2445 685 31 716 611975 6340 1196 1163 2293 652 18 670 581976 7680 974 937 1983 522 0 522 561977 9138 970 796 1713 425 0 425 531978 9751 880 849 1955 415 0 415 491979 9557 844 810 1816 427 0 427 531980 9493 713 683 1513 444 0 444 651981 9888 730 713 1502 456 0 456 641982 9571 835 814 1904 506 0 506 621983 7978 834 795 1816 521 0 521 661984 7357 841 810 1701 558 0 558 691985 7965 780 768 1621 584 0 584 761986 8354 740 728 1526 533 0 533 731987 8682 591 571 1177 426 0 426 751988 9035 647 640 1374 489 0 489 761989 8988 647 633 1341 488 0 488 771990 8812 601 587 1366 424 0 424 721991 9047 574 565 1225 442 0 442 781992 10095 528 507 1105 417 0 417 821993 11204 645 633 1496 484 0 484 761994 11888 652 640 1411 521 0 521 811995 12933 656 650 1427 534 0 534 821996 14116 651 630 1308 540 0 540 861997 15138 556 545 1214 435 0 435 801998 16728 543 534 1248 427 0 427 801999 17168 497 484 1088 407 0 407 842000 16989 459 454 943 402 0 402 892001 16450 450 442 898 356 0 356 812002 20082 437 428 929 357 0 357 832003 22727 360 350 807 295 0 295 842004 25822 353 345 825 283 0 283 82
1 Harvest classifications prior to 1968 are unavailable for some hunts� In these cases, all harvest has been listed as bucks�

Hunt Arizona 2017 49
Pronghorn Antelope Hunt Data
Historic Summary of Youth-Only Antelope Hunts
Year1st Choice Applicants
Permits Issued
Hunters Hunter DaysHarvest Percent
SuccessBucks Does/Fawns Total1999 443 15 15 29 13 0 13 872000 485 15 15 41 12 0 12 802001 509 15 15 22 13 0 13 872002 664 15 15 26 14 0 14 932003 761 12 12 39 8 0 8 672004 776 12 12 39 5 0 5 42
2009 to 2016 No youth hunts offered
Historic Summary of Muzzleloader Antelope Hunts
Year 1st Choice Applicants
Permits Issued Hunters Hunter Days
Harvest Percent SuccessBucks Does/Fawns Total
1982 89 40 40 154 13 0 13 331983 87 45 44 135 13 0 13 301984 132 75 68 181 23 0 23 341985 181 65 60 166 19 0 19 321986 246 78 78 206 32 0 32 411987 358 123 117 361 40 0 40 341988 365 122 119 316 58 0 58 491989 454 147 144 378 64 0 64 441990 528 145 135 370 68 0 68 501991 608 143 138 441 55 0 55 401992 587 143 141 481 61 0 61 431993 628 153 149 486 80 0 80 541994 729 148 146 495 67 0 67 461995 821 142 136 460 53 0 53 391996 824 106 103 302 62 0 62 601997 831 91 91 261 57 0 57 631998 865 96 95 254 56 0 56 591999 988 91 89 245 57 0 57 642000 1027 99 97 289 59 0 59 612001 1017 93 92 212 62 0 62 672002 1319 94 94 199 72 0 72 772003 1561 87 83 240 55 0 55 662004 1746 92 89 292 50 0 50 562005 1446 97 91 297 56 0 56 622006 1618 103 103 336 68 0 68 662007 2154 103 94 320 67 0 67 712008 1691 113 108 413 76 0 76 70
Year1st Choice Applicants
Permits Issued Hunters Hunter Days
Harvest Percent SuccessBucks Does/Fawns1 Total
2005 18627 422 413 976 356 0 356 862006 23632 455 440 1083 389 0 389 882007 28042 473 466 1257 414 0 414 892008 18931 503 485 1226 432 0 432 892009 17480 525 506 1490 432 0 432 852010 16382 502 496 1451 427 0 427 862011 16272 436 431 1491 346 0 346 802012 19980 428 399 1198 347 0 347 872013 21460 424 403 1111 329 0 329 822014 22006 456 445 1178 385 0 385 872015 23415 476 465 1303 401 0 401 862016 24343 486 459 1253 423 0 423 92
1 Harvest classifications prior to 1968 are unavailable for some hunts� In these cases, all harvest has been listed as bucks�
Historic Summary of General Antelope Hunts (Youth-Only Hunts listed separately)

50 Hunt Arizona 2017
Pronghorn Antelope Hunt Data
Historic Summary of Archery Antelope Hunts
Year 1st Choice Applicants
Permits Issued Hunters Hunter Days
Harvest Percent SuccessBucks Does/Fawns Total
1974 16 50 37 168 2 0 2 5�41975 17 50 25 62 0 0 0 �01976 36 100 57 209 3 0 3 5�31977 84 119 93 405 5 1 6 6�51978 106 160 142 498 11 2 13 9�21979 116 210 170 683 7 6 13 7�61980 203 225 214 1133 21 0 21 9�81981 364 225 203 1203 13 0 13 6�41982 338 236 218 1370 15 0 15 6�91983 249 289 268 1357 20 2 22 8�21984 298 339 315 1543 33 3 36 11�41985 332 364 345 1791 32 1 33 9�61986 385 423 401 2175 31 3 34 8�51987 483 473 451 2315 32 0 32 7�11988 468 497 475 2596 52 1 53 11�21989 564 508 475 2565 54 0 54 11�41990 625 484 456 2490 53 0 53 11�61991 678 549 521 2999 46 0 46 8�81992 831 657 631 3646 75 0 75 11�91993 1046 666 615 3391 111 0 111 18�01994 1183 683 621 3474 116 0 116 18�71995 1233 671 617 3580 106 0 106 17�21996 1373 611 568 3160 101 0 101 17�81997 1497 585 549 3065 106 0 106 19�31998 1582 587 560 3155 110 0 110 19�61999 1812 588 562 3417 97 0 97 17�32000 1933 558 516 3102 70 0 70 13�62001 1943 536 503 3156 82 0 82 16�32002 2319 514 493 2667 143 0 143 29�02003 2482 433 408 2557 57 0 57 14�02004 2502 416 388 2622 73 0 73 18�82005 2069 415 392 2452 59 0 59 15�02006 2376 400 361 2383 71 0 71 20�02007 2697 399 370 2420 89 0 89 24�02008 2074 394 371 2432 111 0 111 30�02009 2007 380 343 2123 119 0 119 352010 1880 360 334 2249 101 0 101 302011 1832 321 293 1786 101 0 101 342012 2084 314 307 2132 84 0 84 272013 2265 302 284 2016 71 0 71 252014 2324 294 273 1869 101 0 101 372015 2410 281 254 1744 102 0 102 402016 2626 283 273 1801 102 0 102 37
Year 1st Choice Applicants
Permits Issued Hunters Hunter Days
Harvest Percent SuccessBucks Does/Fawns Total
2009 1399 106 103 358 70 0 70 682010 1208 87 87 407 49 0 49 562011 1011 73 69 212 41 0 41 592012 1142 64 63 184 40 0 40 632013 1242 68 67 175 50 0 50 752014 1259 72 66 207 60 0 60 912015 1432 67 61 220 50 0 50 822016 1518 67 63 202 51 0 51 81
Historic Summary of Muzzleloader Antelope Hunts (continued)

Hunt Arizona 2017 51
Pronghorn Antelope Harvest Data
5-Year: 2012-2016 Harvest
Unit Year Dates Permits Authorized
1st Choice Applicants
Permits Issued Draw Odds Hunters Hunter Days Harvest Hunt
Success
FIREARMS1 2012 9/07- 9/16 20 2148 20 �8 20 56 16 801 2013 9/06- 9/15 20 2400 20 �8 20 51 18 901 2014 9/05- 9/14 20 2392 20 �8 20 45 17 851 2015 9/04- 9/13 25 2672 25 �9 25 54 24 961 2016 9/02- 9/11 25 2589 25 1�0 25 41 25 1002A 2012 9/07- 9/16 20 447 20 2�2 18 62 16 892A 2013 9/06- 9/15 20 432 20 3�2 15 37 13 872A 2014 9/05- 9/14 20 461 20 2�0 18 50 16 892A 2015 9/04- 9/13 25 461 25 3�5 25 43 25 1002A 2016 9/02- 9/11 25 609 25 2�5 23 68 20 872C 2012 9/07- 9/16 15 383 15 3�1 15 49 15 1002C 2013 9/06- 9/15 15 595 15 1�2 15 43 11 732C 2014 9/05- 9/14 15 472 15 2�1 15 39 13 872C 2015 9/04- 9/13 10 368 10 1�9 10 13 7 702C 2016 9/02- 9/11 10 387 10 1�8 10 35 10 1003A 2012 9/07- 9/16 15 534 15 1�5 15 44 14 933A 2013 9/06- 9/15 20 598 20 2�8 20 58 16 803A 2014 9/05- 9/14 20 763 20 1�6 20 45 19 953A 2015 9/04- 9/13 25 701 25 2�7 23 58 18 783A 2016 9/30-10/09 25 855 25 2�7 23 67 19 833C 2012 9/07- 9/16 2 89 2 2�2 2 4 2 1003C 2013 9/06- 9/15 1 111 1 0�9 1 1 1 1003C 2014 9/05- 9/14 3 144 3 2�1 3 3 3 1003C 2015 9/04- 9/13 3 216 3 �5 3 3 2 673C 2016 9/02- 9/11 7 247 7 2�4 7 11 7 1004A 2012 9/07- 9/16 12 700 12 1�6 11 23 11 1004A (Hopi) 2012 9/07- 9/16 3 8 3 37�5 3 3 2 674A 2013 9/06- 9/15 13 849 13 1�4 13 15 12 924A (Hopi) 2013 9/06- 9/15 4 14 4 28�6 4 8 0 04A 2014 9/05- 9/14 16 933 16 1�6 16 35 15 944A (Hopi) 2014 9/05- 9/14 4 9 4 11�1 4 8 2 504A 2015 9/04- 9/13 20 1169 20 1�7 20 43 20 1004A (Hopi) 2015 9/04- 9/13 5 18 5 22�2 5 5 5 1004A 2016 9/02- 9/11 21 1410 21 1�3 19 34 19 1004A (Hopi) 2016 9/02- 9/11 6 17 6 29�4 5 11 5 1004B 2012 9/07- 9/16 20 680 20 1�9 20 64 16 804B 2013 9/06- 9/15 26 781 26 1�7 25 71 21 844B 2014 9/05- 9/14 26 806 26 2�6 26 104 22 854B 2015 9/04- 9/13 30 970 30 1�6 30 99 24 804B 2016 9/02- 9/11 30 924 30 1�8 28 83 26 935A 2012 9/07- 9/16 7 345 7 1�7 7 16 7 1005A (Hopi) 2012 9/07- 9/16 3 2 3 50�0 3 9 3 1005A 2013 9/06- 9/15 6 342 6 0�6 6 12 5 835A (Hopi) 2013 9/06- 9/15 2 2 2 100�0 0 0 0 -5A 2014 9/05- 9/14 6 401 6 �2 6 20 5 835A (Hopi) 2014 9/05- 9/14 2 5 2 40�0 2 10 2 1005A 2015 9/04- 9/13 7 416 7 1�4 7 13 7 1005A (Hopi) 2015 9/04- 9/13 2 4 2 50�0 0 0 0 -5A 2016 9/02- 9/11 6 488 6 1�0 6 14 5 835A (Hopi) 2016 9/02- 9/11 3 6 3 33�3 3 3 3 1005B 2012 9/07- 9/16 26 1969 26 1�3 24 90 14 585B (Hopi) 2012 9/07- 9/16 4 21 4 19�0 2 10 0 05B 2013 9/06- 9/15 17 2002 17 0�8 17 77 15 885B (Hopi) 2013 9/06- 9/15 3 11 3 27�3 3 9 2 675B 2014 9/05- 9/14 21 2565 21 0�8 21 50 18 865B (Hopi) 2014 9/05- 9/14 3 18 4 22�2 4 12 4 1005B 2015 9/04- 9/13 18 2768 18 �7 18 60 16 895B (Hopi) 2015 9/04- 9/13 3 17 3 17�6 3 6 3 1005B 2016 9/02- 9/11 18 3063 18 0�6 18 54 18 1005B (Hopi) 2016 9/02- 9/11 3 11 3 18�2 3 3 3 1006A 2012 9/07- 9/16 6 262 6 1�5 6 26 6 1006A 2013 9/06- 9/15 7 339 7 1�2 7 14 6 86

52 Hunt Arizona 2017
Pronghorn Antelope Harvest Data
5-Year: 2012-2016 Harvest
Unit Year Dates Permits Authorized
1st Choice Applicants
Permits Issued Draw Odds Hunters Hunter Days Harvest Hunt
Success
6A 2014 9/05- 9/14 6 346 7 1�4 7 23 7 1006A 2015 9/04- 9/13 7 406 7 1�0 7 32 3 436A 2016 9/02- 9/11 8 501 8 �8 8 12 8 1006B South 2012 9/07- 9/16 2 55 2 3�6 0 0 0 -6B South 2013 9/06- 9/15 2 93 2 1�1 2 2 2 1006B South 2014 9/05- 9/14 2 44 2 4�5 0 0 0 -6B South 2015 9/04- 9/13 1 96 1 1�0 1 1 1 1006B South 2016 9/02- 9/11 1 69 1 1�4 0 0 0 -7 2012 9/07- 9/16 40 1644 40 1�8 40 118 35 887 2013 9/06- 9/15 40 1869 40 1�9 38 83 38 1007 2014 9/05- 9/14 48 2012 48 2�1 48 139 39 817 2015 9/04- 9/13 48 2234 48 1�9 48 211 37 777 2016 9/30-10/09 48 2226 48 1�8 48 141 39 819 2012 9/07- 9/16 27 1098 27 2�5 24 78 24 1009 2013 9/06- 9/15 30 1623 30 1�6 30 55 28 939 2014 9/05- 9/14 40 1946 40 1�7 39 105 37 959 2015 9/04- 9/13 40 1733 40 1�8 40 126 31 789 2016 9/30-10/09 40 1795 40 1�8 40 152 37 9310 2012 9/07- 9/16 70 5384 70 1�2 67 228 60 9010 2013 9/06- 9/15 80 5036 80 1�4 74 256 51 6910 2014 9/05- 9/14 90 4557 90 1�8 88 205 78 8910 2015 9/04- 9/13 100 5060 100 1�6 100 252 96 9610 2016 9/02- 9/11 100 4831 100 1�7 95 280 90 9512 2012 9/07- 9/16 2 65 2 0�0 0 0 0 -12 2013 9/06- 9/15 2 46 2 0�0 0 0 0 -12 2014 9/05- 9/14 2 60 2 1�7 2 2 2 10012 2015 9/04- 9/13 2 51 2 3�9 2 10 2 10012A/12B 2016 9/02- 9/11 2 88 2 2�3 2 5 2 10013A 2012 9/07- 9/16 15 315 15 3�5 13 45 8 6213A 2013 9/06- 9/15 10 246 10 2�8 10 30 8 8013A 2014 9/05- 9/14 10 214 10 3�7 10 33 8 8013A 2015 9/04- 9/13 10 228 10 2�6 10 29 9 9013A 2016 9/02- 9/11 10 201 10 3�5 10 34 6 6013B 2012 9/07- 9/16 5 75 5 4�0 5 18 3 6013B 2013 9/06- 9/15 5 78 5 2�6 5 11 4 8013B 2014 9/05- 9/14 5 67 5 4�5 5 10 5 10013B 2015 9/04- 9/13 10 127 10 1�6 10 53 8 8013B 2016 9/02- 9/11 10 132 10 3�8 3 3 3 10017A 2012 9/07- 9/16 4 171 4 1�8 4 13 4 10017A 2013 9/06- 9/15 3 191 3 0�5 3 13 2 6717A 2014 9/05- 9/14 3 172 3 1�7 3 6 3 10017A 2015 9/04- 9/13 3 174 3 0�6 3 8 3 10017A 2016 9/02- 9/11 2 136 2 1�5 2 6 2 10018A 2012 9/14- 9/20 10 270 10 2�2 10 21 10 10018A 2013 9/13- 9/19 10 324 10 2�2 10 30 8 8018A 2014 9/12- 9/18 10 359 10 2�5 10 28 9 9018A 2015 9/11- 9/17 10 395 10 2�3 10 15 10 10018A 2016 9/02- 9/15 10 413 10 1�7 10 31 9 9018B 2012 9/07- 9/16 25 608 25 3�3 21 44 21 10018B 2013 9/06- 9/15 21 563 21 2�7 21 56 17 8118B 2014 9/05- 9/14 20 685 20 2�5 20 58 14 7018B 2015 9/04- 9/13 15 499 16 2�8 13 45 8 6218B 2016 9/02- 9/11 15 511 15 2�7 10 23 10 10019A North 2012 9/14-9/20 30 1018 30 2�5 27 56 25 9319A North 2013 9/13- 9/19 30 1157 30 1�8 27 54 24 8919A North 2014 9/12- 9/18 30 1054 30 2�2 28 58 25 8919A 2015 9/11- 9/17 30 1144 30 2�3 30 56 24 8019A North 2016 9/09- 9/15 30 1134 30 1�8 30 77 29 9719B 2014 9/12- 9/18 5 374 5 1�1 5 8 5 10019B 2015 9/11- 9/17 5 491 5 0�8 0 0 0 -19B 2016 9/09- 9/15 5 476 5 0�8 5 10 5 10019B North 2012 9/14- 9/20 5 351 5 0�9 4 6 3 7519B North 2013 9/06- 9/19 5 312 5 1�6 5 9 5 100

Hunt Arizona 2017 53
Pronghorn Antelope Harvest Data
5-Year: 2012-2016 Harvest
Unit Year Dates Permits Authorized
1st Choice Applicants
Permits Issued Draw Odds Hunters Hunter Days Harvest Hunt
Success
21 2012 9/07- 9/16 25 630 25 2�9 23 75 20 8721 2013 9/06- 9/15 20 719 20 1�9 20 75 11 5521 2014 9/05- 9/14 17 623 17 2�1 17 58 10 5921 2015 9/04- 9/13 13 516 13 1�7 13 43 9 6921 2016 9/02- 9/11 13 541 13 1�8 13 38 10 7730A 2012 9/07- 9/16 10 257 10 1�6 10 30 7 7030A 2013 9/06- 9/15 7 194 7 1�5 7 11 6 8630A 2014 9/05- 9/14 6 192 6 3�1 4 9 3 7530A 2015 9/04- 9/13 6 172 6 1�7 6 17 6 10030A 2016 9/02- 9/11 6 136 6 2�2 6 10 6 10031/32 2012 9/07- 9/16 3 218 3 0�9 3 8 3 10031/32 2013 9/06- 9/15 3 253 3 0�4 3 27 3 10031/32 2014 9/05- 9/14 3 290 3 1�0 3 12 3 10031/32 2015 9/04- 9/13 3 309 3 1�0 3 8 3 10031/32 2016 9/02- 9/11 4 269 4 1�5 4 4 4 10034B 2012 9/07- 9/16 1 194 1 0�5 1 1 1 10034B 2013 9/06- 9/15 1 224 1 0�4 1 1 1 10035A/35B 2016 9/02- 9/11 3 278 3 0�7 3 3 3 100FTHU 2012 9/07- 9/16 1 39 1 2�6 1 1 1 100FTHU 2013 9/06- 9/15 1 56 1 1�8 1 2 1 100FTHU 2014 9/05- 9/14 1 42 1 0�0 1 3 1 100MUZZLELOADER2B 2012 9/07- 9/16 10 184 10 3�8 10 23 10 1002B 2013 9/06- 9/15 10 195 10 3�1 9 23 3 332B 2014 9/05- 9/14 10 199 10 2�5 10 50 6 602B 2015 9/04- 9/13 10 158 10 4�4 10 25 10 1002B 2016 9/02- 9/11 10 172 10 1�7 9 31 6 673B North 2012 9/07- 9/16 5 73 5 2�7 5 28 2 403B North 2013 9/06- 9/15 5 67 5 3�0 5 13 3 603B North 2014 9/05- 9/14 2 31 2 3�2 2 2 2 1003B North 2015 9/04- 9/13 2 54 2 0�0 0 0 0 -3B North 2016 9/02- 9/11 2 36 2 5�6 2 4 2 1003B South 2014 9/05- 9/14 2 60 2 3�3 2 14 2 1003B South 2015 9/04- 9/13 2 54 2 3�7 2 6 2 1003B South 2016 9/02- 9/11 2 78 2 1�3 2 2 2 1008 2012 9/07- 9/16 20 475 20 2�5 20 71 11 558 2013 9/06- 9/15 25 474 25 3�6 25 70 20 808 2014 9/05- 9/14 30 539 30 5�2 28 74 28 1008 2015 9/04- 9/13 30 700 30 2�6 28 120 18 648 2016 9/02- 9/11 30 743 30 3�2 29 114 21 7215A/15B 2012 9/07- 9/16 2 63 2 3�2 2 6 0 015A/15B 2013 9/06- 9/15 2 34 2 2�9 2 13 1 5015A/15B 2014 9/05- 9/14 2 24 2 0�0 0 0 0 -15A/15B 2015 9/04- 9/13 2 30 2 6�7 0 0 0 -15A/15B 2016 9/02- 9/11 2 54 2 1�9 2 2 2 10017B 2012 9/07- 9/16 2 30 2 3�3 2 3 2 10017B/19B 2013 9/06- 9/12 6 88 6 5�7 6 15 5 8317B/19B 2014 9/05- 9/11 6 121 6 5�0 6 14 6 10017B/19B 2015 9/04- 9/10 6 131 6 3�8 6 16 6 10017B/19B 2016 9/02- 9/08 6 160 6 3�1 6 9 6 10018A 2012 9/07- 9/13 5 88 5 4�5 4 10 1 2518A 2013 9/06- 9/12 5 120 5 3�3 5 13 5 10018A 2014 9/05- 9/11 5 75 5 5�3 5 15 3 6018A 2015 9/04- 9/10 5 118 5 3�4 5 22 5 10018A 2016 9/02- 9/08 5 84 5 1�2 5 13 5 10019A North 2012 9/07- 9/13 15 176 15 4�5 15 33 9 6019A North 2013 9/06- 9/12 15 269 15 3�3 15 28 13 8719A North 2014 9/05- 9/11 15 210 15 4�3 13 38 13 10019A North 2015 9/04- 9/10 10 187 10 3�2 10 31 9 9019A North 2016 9/02- 9/08 10 191 10 4�2 8 27 7 8819B North 2012 9/02- 9/13 5 53 5 3�8 5 10 5 100

54 Hunt Arizona 2017
Pronghorn Antelope Harvest Data
5-Year: 2012-2016 Harvest
Unit Year Dates Permits Authorized
1st Choice Applicants
Permits Issued Draw Odds Hunters Hunter Days Harvest Hunt
Success
ARCHERY1 2012 8/24- 9/06 30 220 30 10�0 30 216 9 301 2013 8/23- 9/05 30 226 30 10�6 28 188 4 141 2014 8/22- 9/04 30 250 30 8�8 22 212 2 91 2015 8/21- 9/03 30 269 30 7�4 30 219 9 301 2016 8/19- 9/01 30 283 30 8�5 28 224 2 73A 2012 8/24- 9/06 10 44 10 11�4 10 55 0 03A 2013 8/23- 9/05 10 50 10 14�0 10 84 0 03A 2014 8/22- 9/04 10 66 10 9�1 7 33 0 03A 2015 8/21- 9/03 10 42 10 2�4 10 70 2 203A 2016 8/12- 8/25 10 33 10 9�1 10 70 10 1003B North 2012 8/24- 9/06 10 28 10 28�6 10 65 0 03B North 2013 8/09- 8/22 10 56 10 12�5 9 60 3 333B North 2014 8/22- 9/04 5 23 5 17�4 5 20 0 03B North 2015 8/21- 9/03 5 47 5 10�6 5 28 0 03B North 2016 8/19- 9/01 5 23 5 13�0 3 32 0 03B South 2012 8/10- 8/23 5 42 5 9�5 5 33 2 403B South 2012 8/24- 9/06 5 8 5 12�5 5 47 2 403B South 2013 8/23- 9/05 5 41 5 7�3 5 42 0 03B South 2013 8/23- 9/05 5 14 5 21�4 5 60 0 03B South 2014 8/08- 8/21 5 50 5 6�0 5 30 3 603B South 2014 8/22- 9/04 5 25 5 8�0 5 23 3 603B South 2015 8/07- 8/20 5 31 5 12�9 5 45 0 03B South 2015 8/21- 9/03 5 14 5 7�1 0 0 0 -3B South 2016 8/05- 8/18 5 90 5 3�3 5 50 0 03B South 2016 8/19- 9/01 5 24 5 0�0 5 28 2 404A 2013 8/23- 9/05 4 42 4 4�8 4 38 0 04A (Hopi) 2013 8/23- 9/05 1 0 1 - 1 10 0 04A 2014 8/22- 9/04 4 32 4 9�4 4 22 2 504A (Hopi) 2014 8/22- 9/04 1 0 1 - 1 10 0 04A 2015 8/21- 9/03 5 55 5 9�1 5 20 3 604A (Hopi) 2015 8/21- 9/03 1 2 1 0�0 0 0 0 -4A 2016 8/19- 9/01 5 88 5 3�4 5 23 3 604A (Hopi) 2016 8/19- 9/01 2 1 2 100�0 2 7 2 1004B 2012 8/24- 9/06 20 98 20 10�2 20 158 0 04B 2013 8/23- 9/05 15 73 15 8�2 15 118 3 204B 2014 8/22- 9/04 15 65 15 10�8 14 112 3 214B 2015 8/21- 9/03 15 92 15 10�9 15 84 0 04B 2016 8/19- 9/01 15 104 15 6�7 15 101 8 535A 2012 8/24- 9/06 4 70 4 5�7 4 48 2 505A (Hopi) 2012 8/24- 9/06 1 1 1 100�0 0 0 0 -5A 2013 8/23- 9/05 4 33 4 12�1 4 26 0 05A (Hopi) 2013 8/23- 9/05 1 1 1 100�0 1 7 0 05A 2014 8/22- 9/04 4 56 4 7�1 4 14 4 1005A (Hopi) 2014 8/22- 9/04 1 0 1 - 0 0 0 -5A 2015 8/21- 9/03 4 42 4 4�8 4 52 0 05A (Hopi) 2015 8/21- 9/03 1 1 1 100�0 1 7 0 05A 2016 8/19- 9/01 3 68 3 2�9 3 24 0 05A (Hopi) 2016 8/19- 9/01 2 1 2 100�0 2 10 0 05B 2012 8/24- 9/06 13 150 13 6�7 13 110 2 155B (Hopi) 2012 8/24- 9/06 2 3 2 66�7 2 10 0 05B 2013 8/23- 9/05 9 149 9 2�7 8 68 2 255B (Hopi) 2013 8/23- 9/05 1 0 1 - 0 0 0 -5B 2014 8/22- 9/04 9 177 9 5�1 9 86 4 445B (Hopi) 2014 8/22- 9/04 1 0 1 - 1 11 0 05B 2015 8/21- 9/03 9 195 9 4�1 9 72 0 05B (Hopi) 2015 8/21- 9/03 1 1 1 0�0 0 0 0 -5B 2016 8/19- 9/01 8 197 8 1�5 8 74 2 255B (Hopi) 2016 8/19- 9/01 2 2 2 100�0 2 13 1 506B North 2012 8/24- 9/06 10 35 10 17�1 10 80 0 06B North 2013 8/23- 9/05 10 32 10 6�3 10 85 0 06B North 2014 8/22- 9/04 10 31 10 25�8 10 83 0 06B North 2015 8/21- 9/03 10 40 10 20�0 10 71 1 10

Hunt Arizona 2017 55
Pronghorn Antelope Harvest Data
5-Year: 2012-2016 Harvest
Unit Year Dates Permits Authorized
1st Choice Applicants
Permits Issued Draw Odds Hunters Hunter Days Harvest Hunt
Success
6B North 2016 8/19- 9/01 10 26 10 11�5 8 29 1 137 2012 8/24- 9/06 5 50 5 8�0 5 58 0 07 2013 8/23- 9/05 5 78 5 6�4 3 35 0 07 2014 8/22- 9/04 10 113 10 7�1 10 73 6 607 2015 8/21- 9/03 10 120 10 5�0 10 80 5 507 2016 8/12- 8/25 10 120 10 5�0 10 73 6 609 2012 8/24- 9/06 5 74 5 2�7 5 46 1 209 2013 8/23- 9/05 5 64 5 6�3 3 22 0 09 2014 8/22- 9/04 5 66 5 6�1 5 25 3 609 2015 8/21- 9/03 5 91 5 2�2 5 40 5 1009 2016 8/12- 8/25 5 103 5 4�9 5 60 5 10010 2012 8/24- 9/06 60 440 60 8�2 58 388 16 2810 2013 8/23- 9/05 65 458 65 9�4 59 457 13 2210 2014 8/22- 9/04 65 381 65 9�7 65 453 20 3110 2015 8/21- 9/03 70 436 70 8�7 65 541 19 2910 2016 8/19- 9/01 70 426 70 7�7 70 483 27 3911M 2012 8/24- 9/13 5 30 5 13�3 4 28 0 011M 2013 8/23- 9/12 5 40 5 5�0 5 30 2 4011M 2014 8/22- 9/11 5 65 5 7�7 5 53 0 011M 2015 8/21- 9/10 5 71 5 4�2 4 29 1 2511M 2016 8/21- 9/08 5 62 5 4�8 5 52 0 012 2012 8/24- 9/06 3 11 3 18�2 3 13 1 3312 2013 8/23- 9/05 3 8 3 25�0 2 11 0 012 2014 8/22- 9/04 3 25 3 4�0 3 24 0 012 2015 8/21- 9/03 3 13 3 15�4 3 38 2 6712A/12B 2016 8/19- 9/01 3 17 3 11�8 3 15 0 015A/15B 2012 8/24- 9/06 4 26 4 11�5 4 28 4 10015A/15B 2013 8/23- 9/05 3 31 3 9�7 3 18 0 015A/15B 2014 8/22- 9/04 2 31 2 6�5 2 11 1 5015A/15B 2015 8/21- 9/03 2 20 2 5�0 0 0 0 -15A/15B 2016 8/19- 9/01 2 19 2 10�5 2 10 2 10017B 2012 8/10- 8/23 3 23 3 8�7 3 20 2 6717B 2012 8/24- 9/06 3 11 3 18�2 3 12 2 6717B/19B 2013 8/09- 8/22 5 80 5 5�0 5 18 5 10017B/19B 2013 8/23- 9/05 5 33 5 12�1 5 20 5 10017B/19B 2014 8/08- 8/21 5 89 5 4�5 5 33 5 10017B/19B 2014 8/22- 9/04 5 40 5 0�0 5 20 5 10017B/19B 2015 8/07- 8/20 5 112 5 3�6 5 26 3 6017B/19B 2015 8/21- 9/03 5 38 5 7�9 5 30 3 6017B/19B 2016 8/05- 8/18 5 167 5 3�0 5 18 5 10018A 2012 8/24- 9/06 10 51 10 17�6 10 44 6 6018A 2013 8/23- 9/05 10 62 10 8�1 10 48 2 2018A 2014 8/22- 9/04 10 69 10 11�6 10 42 0 018A 2015 8/21- 9/03 10 67 10 10�4 8 48 8 10018A (early) 2016 8/19- 9/01 10 79 10 12�7 10 48 8 8018B (early) 2012 8/24- 9/06 15 45 15 15�6 14 92 5 3618B (early) 2013 8/23- 9/05 5 34 5 5�9 5 31 3 6018B (early) 2014 8/22- 9/04 5 39 5 5�1 5 27 2 4018B (early) 2015 8/21- 9/03 5 55 5 7�3 5 28 5 10018B (early) 2016 8/19- 9/01 5 43 5 7�0 3 22 0 019A (early) 2012 8/10- 8/23 30 320 30 8�1 30 183 15 5019A (late) 2012 8/24- 9/06 30 96 30 16�7 30 205 7 2319A (early) 2013 8/09- 8/22 30 423 30 5�9 30 144 16 5319A (late) 2013 8/23- 9/05 30 107 30 9�3 30 183 13 4319A (early) 2014 8/08- 8/21 30 399 30 6�8 30 146 21 7019A (late) 2014 8/22- 9/04 30 80 30 12�5 26 182 12 4619A (early) 2015 8/07- 8/20 20 332 20 5�4 20 100 14 7019A (late) 2015 8/21- 9/03 20 114 20 3�5 17 65 15 8819A (early) 2016 8/19- 8/25 20 358 20 3�9 18 69 7 3919A (late) 2016 8/26- 9/01 20 59 20 13�6 20 103 3 1519B/19B 2016 8/19- 9/01 5 54 5 0�0 5 15 3 6019B North 2012 8/24- 9/06 5 61 5 4�9 5 25 5 10021 2012 8/24- 9/06 15 76 15 13�2 15 123 3 20
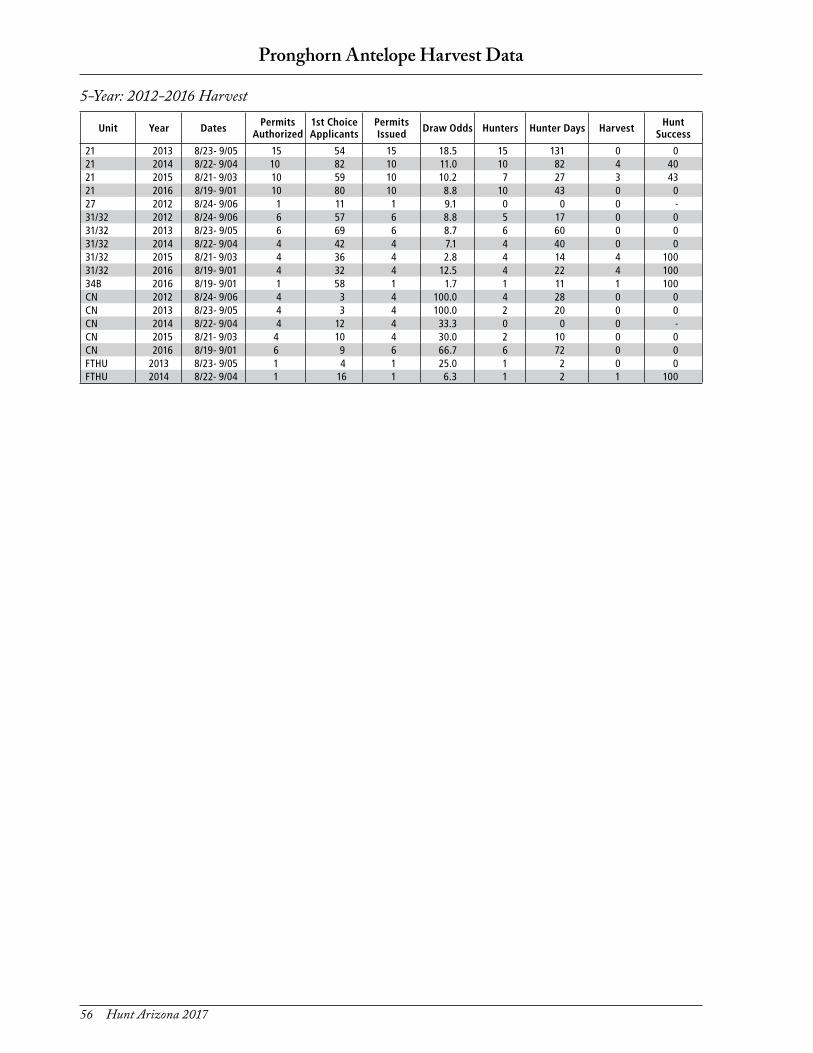
56 Hunt Arizona 2017
Pronghorn Antelope Harvest Data
Unit Year Dates Permits Authorized
1st Choice Applicants
Permits Issued Draw Odds Hunters Hunter Days Harvest Hunt
Success
21 2013 8/23- 9/05 15 54 15 18�5 15 131 0 021 2014 8/22- 9/04 10 82 10 11�0 10 82 4 4021 2015 8/21- 9/03 10 59 10 10�2 7 27 3 4321 2016 8/19- 9/01 10 80 10 8�8 10 43 0 027 2012 8/24- 9/06 1 11 1 9�1 0 0 0 -31/32 2012 8/24- 9/06 6 57 6 8�8 5 17 0 031/32 2013 8/23- 9/05 6 69 6 8�7 6 60 0 031/32 2014 8/22- 9/04 4 42 4 7�1 4 40 0 031/32 2015 8/21- 9/03 4 36 4 2�8 4 14 4 10031/32 2016 8/19- 9/01 4 32 4 12�5 4 22 4 10034B 2016 8/19- 9/01 1 58 1 1�7 1 11 1 100CN 2012 8/24- 9/06 4 3 4 100�0 4 28 0 0CN 2013 8/23- 9/05 4 3 4 100�0 2 20 0 0CN 2014 8/22- 9/04 4 12 4 33�3 0 0 0 -CN 2015 8/21- 9/03 4 10 4 30�0 2 10 0 0CN 2016 8/19- 9/01 6 9 6 66�7 6 72 0 0FTHU 2013 8/23- 9/05 1 4 1 25�0 1 2 0 0FTHU 2014 8/22- 9/04 1 16 1 6�3 1 2 1 100
5-Year: 2012-2016 Harvest

Hunt Arizona 2017 57
Elk (Cervus elaphus)
Natural HistoryElk were at one time thinly distributed in Arizona from the White and Blue mountains westward along the Mogollon Rim to near the San Francisco Peaks. These native elk were eliminated sometime prior to 1900. In February 1913, private conservationists released 83 elk from Yellowstone National Park into Cabin Draw near Chevelon Creek. These, and two other transplants of Yellowstone elk in the 1920s—one south of Alpine, and another north of Williams—were great successes, and Arizona’s elk population has now grown to approx-imately 30,000-35,000 post-hunt adults.
Mountain meadows, ponderosa pine woodlands, spruce-fir forests, and other high elevation habitats be-tween 7,000 and 10,500 feet elevation constitute the elk’s principal summer range. Elk are rarely found more than one-half mile from water and tend to stay on the summer range as long as possible, arriving early in the year and remaining until forced down by deep snow. Their winter range, which is usually between 5,500 and 6,500 feet elevation, is more limited in extent and may only comprise about 10 percent of the animal’s total habitat. Here, in the pinyon-juniper zone, elk remain until melting snows allow them to migrate upward.
Elk have distinct summer and winter coats, which they shed in late summer and spring, respectively. In winter, the head, belly, neck, and legs are dark brown, and the sides and back are a grayish-brown; the rump patch is a yellowish color bordered by a dark brownish stripe. While females are usually somewhat lighter in color than bulls, both sexes have heavy dark manes. In summer, the coat becomes a deep reddish brown. Elk have little to no undercoat, giving them a sleek, muscu-lar appearance.
Calves are born between late May and early June after an 8-month gestation period. They are dark russet in color with white spots on the back and sides. Newly born calves weigh an average of nearly 30 pounds, with males averag-ing 4 pounds more than females. Twins are extremely rare.
When the time comes to give birth, a cow will drive off her previous year’s calf and separate from the herd to seek out an area of dense cover for a nursery. With-in hours after birth, the newborn is able to move and is led from the birthing spot to a safer place. After a week,
the mother will band with other cow elk, and after two to three weeks, the calves, now able to run, will join the herd. Some of these matriarchal bands may number in the hundreds. By September, the calves will have shed their spotted coats and will be behaving much like their mothers.
An elk’s natural life span is about 14 to 16 years for males and 15 to 17 for females, even though tagged ani-mals of more than 25 years old have been documented.
Antler development and size is a function of age, the older, larger bulls having the most developed antlers. Old bulls shed their antlers between January and March, and yearling males sometime between March and June. As soon as antlers are shed, new ones begin growing, so it is possible to see yearlings with old spikes and bulls in vel-vet at the same time. The antlers continue to grow for a
GEO
RGE
AN
DRE
JKO

58 Hunt Arizona 2017
period ranging from 90 days for yearlings to 150 days for adult bulls.
By early August, antler growth is complete. The now dry velvet is stripped off the hardened antlers in a mat-ter of hours as the bull polishes them against trees. By early September, the bull is in the rut, and bugling and harem formation occurs. Harems may number up to 30, depending on the size and vigor of the bull, but usually average 15 to 20.
A large bull may weigh up to 1,200 pounds, but most range between 600 to 800 pounds. The live weight of ma-ture cows ranges from 450 to 600 pounds. Elk evolved as distance runners and can approach speeds of 40 mph for short periods, and maintain speeds of nearly 30 mph for longer periods. They are also strong swimmers—even calves can swim more than a mile—and high jumpers; a
10-foot fence may not stop an adult.
Elk are grass-eating animals, and one of the require-ments of feeding in open country is to always be on the alert for danger. As herd animals, some elk can always be watching for predators while the others feed.
Hunt HistoryAs with many game species in Arizona, elk hunting has had its ups and downs. With native elk having been extirpated, the closed season imposed by the territorial legislature in 1893 was too little too late. The releases of Yellowstone elk between 1913 and 1929 were success-ful, however, and in 1935 the population was deemed sufficient to support a limited, 266-permit bull hunt. One hundred and forty-five elk were harvested, and hunts were continued every year through 1943.
Because of World War II, no season was conducted in 1944 or 1945, but a limited hunt, which included the is-suance of the first cow elk permits, was again authorized in 1946. Elk hunting opportunities expanded almost an-nually as biologists and ranchers feared that Arizona’s elk population might now “rise out of control.” These con-cerns culminated in 1953 when 6,288 permits were issued and 1,558 elk were taken—more than 1,000 of which were cows. Because of concerns about the “slaughter,” elk permits were greatly curtailed in 1954 and remained be-low 5,000 until 1965, when more than 6,000 permits were again authorized. By 1967, elk permit numbers were ex-ceeding 7,000, and the annual harvest exceeded 1,500 elk.
Once again, elk permits were gradually lowered, although new hunts, including archery hunts, were being initiated.
By the mid-1980s, elk, and elk permit numbers, were again headed upward. This trend culminated in 1994, when nearly 11,000 elk were harvested—a number un-imaginable just 20 years earlier. Since then, elk numbers and harvests have remained at a high level with about 9,000 elk taken each year. This situation is expected to continue for the foreseeable future as wildlife managers and land managers continue to balance habitat quality and elk-livestock competition.
Elk
Elk distribution
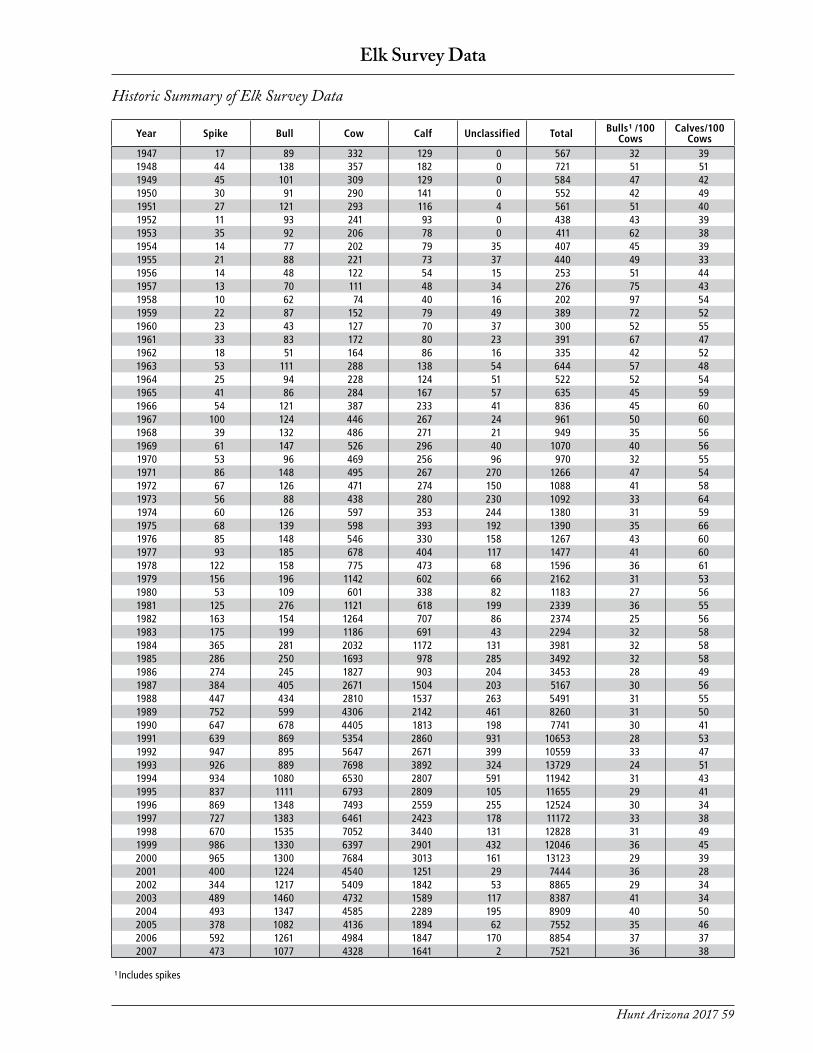
Hunt Arizona 2017 59
Year Spike Bull Cow Calf Unclassified Total Bulls ¹ /100 Cows
Calves/100 Cows
1947 17 89 332 129 0 567 32 391948 44 138 357 182 0 721 51 511949 45 101 309 129 0 584 47 421950 30 91 290 141 0 552 42 491951 27 121 293 116 4 561 51 401952 11 93 241 93 0 438 43 391953 35 92 206 78 0 411 62 381954 14 77 202 79 35 407 45 391955 21 88 221 73 37 440 49 331956 14 48 122 54 15 253 51 441957 13 70 111 48 34 276 75 431958 10 62 74 40 16 202 97 541959 22 87 152 79 49 389 72 521960 23 43 127 70 37 300 52 551961 33 83 172 80 23 391 67 471962 18 51 164 86 16 335 42 521963 53 111 288 138 54 644 57 481964 25 94 228 124 51 522 52 541965 41 86 284 167 57 635 45 591966 54 121 387 233 41 836 45 601967 100 124 446 267 24 961 50 601968 39 132 486 271 21 949 35 561969 61 147 526 296 40 1070 40 561970 53 96 469 256 96 970 32 551971 86 148 495 267 270 1266 47 541972 67 126 471 274 150 1088 41 581973 56 88 438 280 230 1092 33 641974 60 126 597 353 244 1380 31 591975 68 139 598 393 192 1390 35 661976 85 148 546 330 158 1267 43 601977 93 185 678 404 117 1477 41 601978 122 158 775 473 68 1596 36 611979 156 196 1142 602 66 2162 31 531980 53 109 601 338 82 1183 27 561981 125 276 1121 618 199 2339 36 551982 163 154 1264 707 86 2374 25 561983 175 199 1186 691 43 2294 32 581984 365 281 2032 1172 131 3981 32 581985 286 250 1693 978 285 3492 32 581986 274 245 1827 903 204 3453 28 491987 384 405 2671 1504 203 5167 30 561988 447 434 2810 1537 263 5491 31 551989 752 599 4306 2142 461 8260 31 501990 647 678 4405 1813 198 7741 30 411991 639 869 5354 2860 931 10653 28 531992 947 895 5647 2671 399 10559 33 471993 926 889 7698 3892 324 13729 24 511994 934 1080 6530 2807 591 11942 31 431995 837 1111 6793 2809 105 11655 29 411996 869 1348 7493 2559 255 12524 30 341997 727 1383 6461 2423 178 11172 33 381998 670 1535 7052 3440 131 12828 31 491999 986 1330 6397 2901 432 12046 36 452000 965 1300 7684 3013 161 13123 29 392001 400 1224 4540 1251 29 7444 36 282002 344 1217 5409 1842 53 8865 29 342003 489 1460 4732 1589 117 8387 41 342004 493 1347 4585 2289 195 8909 40 502005 378 1082 4136 1894 62 7552 35 462006 592 1261 4984 1847 170 8854 37 372007 473 1077 4328 1641 2 7521 36 38
¹ Includes spikes
Elk Survey Data
Historic Summary of Elk Survey Data

60 Hunt Arizona 2017
Elk Survey Data
Historic Summary of Elk Survey DataYear Spike Bull Cow Calf Unclassified Total Bulls ¹ /100
CowsCalves/100
Cows2008 336 1186 3764 1448 29 6763 40 382009 446 1133 4698 1858 75 8210 34 402010 415 816 3508 1199 4 5942 35 342011 321 977 4324 1764 284 7670 30 412012 493 1300 4829 1964 358 8944 37 412013 585 1313 5274 2139 195 9506 36 412014 509 1109 4553 1647 214 8032 36 362015 757 1437 6667 2547 225 11633 33 382016 534 1071 4917 1708 99 8329 33 35
¹ Includes spikes
5-Year: 2012-2016 Elk Survey Data
Unit Year Spike Adult Bull Cow Calf Unclassified TotalBulls¹/
100 CowsCalves/
100 Cows1 2012 75 240 817 331 0 1463 39 411 2013 88 184 849 345 145 1611 32 411 2014 101 181 645 313 98 1338 44 491 2015 102 187 863 363 128 1643 33 421 2016 76 125 497 144 1 843 40 292A/2B 2014 1 7 24 16 0 48 33 673A/3C 2012 10 32 100 51 0 193 42 513A/3C 2013 32 74 287 122 0 515 37 433A/3C 2014 8 17 125 67 0 217 20 543A/3C 2015 38 73 448 186 0 745 25 423A/3C 2016 28 64 293 133 62 580 31 453B 2012 12 41 119 43 0 215 45 363B 2013 21 30 205 54 0 310 25 263B 2014 11 41 69 29 0 150 75 423B 2015 14 11 58 29 0 112 43 503B 2016 13 34 117 55 0 219 40 474A 2012 37 39 271 124 0 471 28 464A 2013 17 44 312 108 0 481 20 354A 2014 47 54 297 111 2 511 34 374A 2015 23 27 208 87 50 395 24 424A 2016 21 29 188 77 1 316 27 414B 2012 4 20 63 38 0 125 38 604B 2013 8 19 61 36 0 124 44 594B 2015 17 33 127 64 0 241 39 505A 2012 26 61 258 96 1 442 34 375A 2013 22 54 195 84 3 358 39 435A 2014 20 66 165 69 8 328 52 425A 2015 28 51 193 66 23 361 41 345A 2016 31 51 318 128 3 531 26 405B 2012 46 74 536 204 0 860 22 385B 2013 12 115 440 185 0 752 29 425B 2014 61 75 719 193 0 1048 19 275B 2015 141 233 1252 430 0 2056 30 345B 2016 99 198 812 239 0 1348 37 296A 2012 5 57 219 104 6 391 28 476A 2013 12 17 238 88 0 355 12 376A 2014 15 30 192 71 0 308 23 376A 2015 51 65 456 121 1 694 25 276A 2016 16 53 300 107 3 479 23 366B 2012 22 84 197 83 139 525 54 426B 2013 29 22 223 76 0 350 23 346B 2014 21 26 152 51 0 250 31 346B 2015 17 26 167 68 0 278 26 416B 2016 13 12 239 80 1 345 10 337 East 2012 13 28 63 28 0 132 65 447 East 2013 27 85 190 90 24 416 59 477 East 2014 11 36 75 41 13 176 63 557 East 2015 1 28 19 11 1 60 153 587 West 2012 17 18 102 43 0 180 34 42

Hunt Arizona 2017 61
Elk Survey Data
5-Year: 2012-2016 Elk Survey Data
¹ Include spikesCN = Camp Navajo
Unit Year Spike Adult Bull Cow Calf Unclassified TotalBulls¹/
100 CowsCalves/
100 Cows7 West 2013 40 63 179 89 0 371 58 507 West 2014 17 24 128 49 0 218 32 387 West 2015 16 59 132 74 0 281 57 567 West 2016 22 19 76 51 0 168 54 678 2012 55 64 397 212 0 728 30 538 2013 70 108 440 212 0 830 40 488 2014 31 27 215 77 66 416 27 368 2015 40 77 314 156 0 587 37 508 2016 15 16 92 35 25 183 34 389 2012 29 56 180 78 0 343 47 439 2013 32 66 228 92 0 418 43 409 2014 19 77 100 47 19 262 96 479 2015 13 109 147 49 2 320 83 339 2016 13 80 185 63 3 344 50 3410 2012 23 69 265 84 202 643 35 3210 2013 29 83 229 99 0 440 49 4310 2014 8 54 117 42 0 221 53 3610 2015 28 102 360 136 18 644 36 3810 2016 16 54 300 100 0 470 23 3316A 2013 3 6 26 13 0 48 35 5016A 2015 0 1 3 0 0 4 33 018B 2013 9 0 79 30 0 118 11 3819A 2013 1 1 20 7 0 29 10 3521 2012 4 18 77 37 0 136 29 4821 2013 5 20 27 6 0 58 93 2221 2014 5 26 28 2 0 61 111 721 2016 5 15 20 0 0 40 100 022 2012 56 122 424 146 1 749 42 3422 2013 48 108 440 182 2 780 35 4122 2014 39 120 478 134 0 771 33 2822 2015 49 73 349 143 0 614 35 4122 2016 72 113 477 167 0 829 39 3523 2012 25 93 256 79 0 453 46 3123 2013 17 87 40 110 19 573 31 3223 2014 29 106 438 134 0 707 31 3123 2015 48 73 444 145 0 710 27 3323 2016 38 119 435 155 0 747 36 3624A 2016 0 1 0 0 0 1 - -27 2012 34 184 485 183 9 895 45 3827 2013 63 127 266 111 2 569 71 4227 2014 50 119 461 147 0 777 37 3227 2015 101 163 579 229 0 1072 46 4027 2016 31 66 276 79 0 452 35 29CN 2012 42 22 482 217 1 764 13 45CN 2013 16 13 378 148 50 605 8 39CN 2014 15 23 125 54 8 225 30 43CN 2015 30 46 548 190 2 816 14 35CN 2016 25 22 292 95 0 434 16 33CN 2012 42 22 482 217 1 764 13 45CN 2013 16 13 378 148 50 605 8 39CN 2014 15 23 125 54 8 225 30 43CN 2015 30 46 548 190 2 816 14 35

62 Hunt Arizona 2017
Year 1st Choice Applicants
Permits Issued Hunters Hunter
DaysHarvest ¹ Percent
SuccessBulls Spikes Cows Calves Total1935 – – 266 – 137 8 0 0 145 551936 – – 249 – 76 9 0 0 85 341937 – – 230 – 47 18 0 0 65 281938 – – 169 – 68 17 0 0 85 501939 – – 238 – 77 27 6 0 110 461940 – – 229 – 76 19 0 0 95 411941 – – 581 – 114 19 0 0 133 231942 – – 1167 – 223 96 0 0 319 271943 – – 2047 – 152 98 0 0 250 121946 – – 498 – 103 0 13 0 116 231947 – – 1616 – 246 0 255 0 501 311948 – – 2200 – 453 0 467 0 920 421949 – 2850 2675 – 290 0 566 0 856 321950 – 4250 3685 – 413 1 1070 0 1484 401951 – 6023 5788 – 467 41 1185 0 1693 291952 – 5476 5192 – 302 42 845 0 1189 231953 – 6288 6015 – 380 124 1054 0 1558 261954 – 2985 2846 – 176 58 395 0 629 221955 – 2225 2096 – 207 58 347 0 612 291956 – 1750 1581 – 115 29 119 39 302 191957 – 1275 1074 – 123 0 0 0 123 111958 – 1483 1321 – 181 0 0 0 181 141959 – – 1136 – 282 0 0 0 282 251960 – – 1661 – 312 93 131 54 590 361961 – – 1492 – 343 104 107 34 588 391962 – – 2266 – 402 110 172 86 770 341963 – – 3184 – 528 180 339 107 1154 361964 – – 4060 – 566 163 338 126 1193 291965 – – 4941 – 590 185 426 168 1369 281966 7811 – 5687 – 709 241 500 188 1638 291967 7730 – 6526 – 745 304 442 191 1682 261968 8379 – 5845 – 613 279 376 135 1403 241969 9843 – 5771 – 551 266 355 87 1259 221970 11888 – 5208 – 500 239 202 77 1018 201971 10812 – 4866 – 742 407 330 105 1584 331972 12644 5561 5177 – 423 279 267 84 1053 201973 16078 5675 5321 – 460 296 295 91 1142 211974 18623 5972 5685 27227 437 368 309 72 1186 211975 19504 5758 5088 21248 443 317 172 44 976 191976 20511 5915 5528 23808 478 438 343 89 1348 241977 23198 6145 5792 26294 556 376 406 71 1409 241978 26745 5935 5502 22409 571 510 425 95 1601 291979 27041 5800 5456 24344 534 485 390 65 1474 271980 28198 5850 5479 26554 584 499 422 68 1573 291981 28286 5385 5093 22952 796 606 390 81 1873 371982 26507 5720 5522 24529 816 735 400 96 2047 371983 29572 6060 5757 24741 732 776 405 96 2009 351984 28780 6005 5791 24496 995 1031 442 74 2542 441985 31121 6730 6450 25782 1159 1169 867 220 3415 531986 33437 6385 6202 27613 1155 1115 592 126 2988 481987 34995 6300 6164 26477 1209 1010 693 91 3003 491988 37289 6955 6785 25600 1376 1165 1162 224 3927 581989 38965 7975 7796 28980 1473 1144 1069 184 3870 501990 41616 8585 8389 29148 1790 1233 1510 188 4721 561991 41415 9718 9349 30811 2047 1207 1784 271 5309 571992 49054 10491 10207 34757 2028 1351 2067 262 5708 561993 51919 11579 11309 38157 2011 962 3106 445 6524 581994 60849 14683 14382 46962 2201 1121 4867 630 8819 611995 63582 14891 14613 50862 2368 794 4132 522 7816 531996 63003 14229 13897 46444 2553 936 4262 512 8263 591997 66013 11683 11398 41591 2590 583 2490 306 6269 551998 66823 12110 11832 43552 2423 664 2744 385 6216 53
¹ In some years prior to 1960, spikes and calves were not differentiated from bulls and cows�
Elk Hunt Data
Historic Summary of General Elk Hunts

Hunt Arizona 2017 63
Historic Summary of General Elk Hunts (continued)
Elk Hunt Data
Year 1st Choice Applicants
Permits Issued Hunters Hunter
DaysHarvest ¹ Percent
SuccessBulls Spikes Cows Calves Total1999 71839 15538 15158 55291 2082 724 4037 556 7399 492000 66652 15460 14940 54195 2260 724 3956 475 7415 502001 70809 18285 17628 66564 2214 393 4348 375 7330 422002 69798 16265 15767 62497 2276 282 3482 309 6349 402003 71514 13402 12983 52398 1949 313 2690 288 5240 402004 76542 14967 14399 56288 2159 357 3191 405 6112 422005 64684 15856 15254 63702 2077 367 3034 376 5585 382006 66873 16321 15773 68255 2303 532 3369 340 6544 412007 65190 16848 16189 72481 2412 496 3221 373 6502 402008 52044 17756 16968 77827 2712 444 3188 371 6715 402009 50032 18174 17408 77711 2505 413 3396 427 6741 392010 51137 18900 18021 83439 2640 414 2303 217 5574 312011 52139 16613 15815 71832 2729 321 2975 276 6301 402012 59231 15982 15178 70774 2307 378 2797 253 5735 382013 62356 17097 16180 73139 2441 343 3077 262 6123 382014 62993 17092 15986 74869 2711 367 2992 221 6291 392015 67985 16741 15946 71812 2608 421 3222 333 6584 412016 70146 16526 15439 70804 2590 606 3348 240 6784 44
¹ In some years prior to 1960, spikes and calves were not differentiated from bulls and cows�
Historic Summary of Youth-Only Elk Hunts
Year 1st Choice Applicants
Permits Issued Hunters Hunter
DaysHarvest Percent
SuccessBulls Spikes Cows Calves Total1994 269 75 75 233 0 0 23 8 31 411995 291 100 100 233 0 0 59 6 65 651996 409 175 173 466 0 0 94 9 103 601997 654 200 195 526 0 0 101 14 115 591998 927 400 391 1061 0 0 208 31 239 611999 1372 1185 1162 3017 0 0 574 88 662 572000 2022 1200 1173 2959 0 0 638 68 706 602001 2416 1370 1352 3744 0 0 543 50 593 432002 2705 1088 1066 2923 0 0 498 51 549 522003 2744 1076 1054 2891 0 0 470 62 532 502003 2744 1076 1054 2891 0 0 470 62 532 502004 2668 1025 996 2555 0 0 532 76 608 612005 2462 1161 1123 3139 0 0 459 68 527 472006 2580 1142 1100 3286 0 0 532 53 585 532007 3017 1181 1100 3286 0 0 618 59 677 602008 2817 1335 1288 3786 0 0 573 92 665 522009 2998 1335 1273 3862 0 0 658 103 761 602010 3581 1347 1309 4081 0 0 547 46 593 452011 3773 1139 1105 3616 0 0 562 55 617 562012 3699 1030 986 2973 0 0 538 77 615 622013 3967 1160 1121 3475 0 0 553 81 634 572014 4671 1143 722 2763 0 0 97 0 97 132015 4840 1218 1166 3628 0 0 192 18 490 642016 4839 1218 860 2500 0 0 663 7 670 78
Historic Summary of Muzzleloader Elk Hunts
Year 1st Choice Applicants
Permits Issued Hunters Hunter
DaysHarvest Percent
SuccessBulls Spikes Cows Calves Total1980 138 80 77 429 1 1 6 0 8 101981 98 50 49 200 6 0 0 0 6 121982 381 200 194 805 43 7 0 0 50 261983 420 130 124 518 37 2 0 0 39 311984 854 150 149 535 36 9 21 10 76 511985 880 200 197 811 37 8 11 3 59 301986 1030 200 200 753 57 12 25 1 95 481987 1307 200 194 805 51 16 17 3 87 451988 1215 225 222 809 56 12 69 4 141 641989 1089 225 225 766 42 12 74 10 138 611990 1389 225 223 886 47 3 37 10 97 43
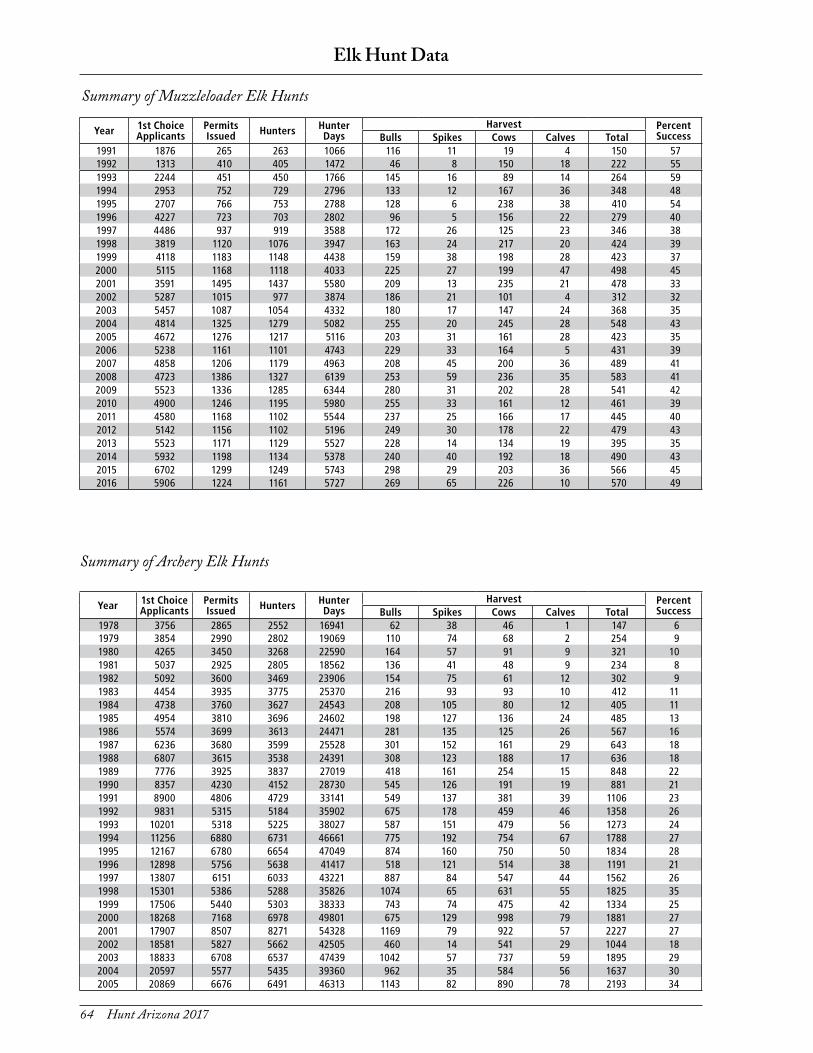
64 Hunt Arizona 2017
Page Heads
Year 1st Choice Applicants
Permits Issued Hunters Hunter
DaysHarvest Percent
SuccessBulls Spikes Cows Calves Total1991 1876 265 263 1066 116 11 19 4 150 571992 1313 410 405 1472 46 8 150 18 222 551993 2244 451 450 1766 145 16 89 14 264 591994 2953 752 729 2796 133 12 167 36 348 481995 2707 766 753 2788 128 6 238 38 410 541996 4227 723 703 2802 96 5 156 22 279 401997 4486 937 919 3588 172 26 125 23 346 381998 3819 1120 1076 3947 163 24 217 20 424 391999 4118 1183 1148 4438 159 38 198 28 423 372000 5115 1168 1118 4033 225 27 199 47 498 452001 3591 1495 1437 5580 209 13 235 21 478 332002 5287 1015 977 3874 186 21 101 4 312 322003 5457 1087 1054 4332 180 17 147 24 368 352004 4814 1325 1279 5082 255 20 245 28 548 432005 4672 1276 1217 5116 203 31 161 28 423 352006 5238 1161 1101 4743 229 33 164 5 431 392007 4858 1206 1179 4963 208 45 200 36 489 412008 4723 1386 1327 6139 253 59 236 35 583 412009 5523 1336 1285 6344 280 31 202 28 541 422010 4900 1246 1195 5980 255 33 161 12 461 392011 4580 1168 1102 5544 237 25 166 17 445 402012 5142 1156 1102 5196 249 30 178 22 479 432013 5523 1171 1129 5527 228 14 134 19 395 352014 5932 1198 1134 5378 240 40 192 18 490 432015 6702 1299 1249 5743 298 29 203 36 566 452016 5906 1224 1161 5727 269 65 226 10 570 49
Elk Hunt Data
Year 1st Choice Applicants
Permits Issued Hunters Hunter
DaysHarvest Percent
SuccessBulls Spikes Cows Calves Total1978 3756 2865 2552 16941 62 38 46 1 147 61979 3854 2990 2802 19069 110 74 68 2 254 91980 4265 3450 3268 22590 164 57 91 9 321 101981 5037 2925 2805 18562 136 41 48 9 234 81982 5092 3600 3469 23906 154 75 61 12 302 91983 4454 3935 3775 25370 216 93 93 10 412 111984 4738 3760 3627 24543 208 105 80 12 405 111985 4954 3810 3696 24602 198 127 136 24 485 131986 5574 3699 3613 24471 281 135 125 26 567 161987 6236 3680 3599 25528 301 152 161 29 643 181988 6807 3615 3538 24391 308 123 188 17 636 181989 7776 3925 3837 27019 418 161 254 15 848 221990 8357 4230 4152 28730 545 126 191 19 881 211991 8900 4806 4729 33141 549 137 381 39 1106 231992 9831 5315 5184 35902 675 178 459 46 1358 261993 10201 5318 5225 38027 587 151 479 56 1273 241994 11256 6880 6731 46661 775 192 754 67 1788 271995 12167 6780 6654 47049 874 160 750 50 1834 281996 12898 5756 5638 41417 518 121 514 38 1191 211997 13807 6151 6033 43221 887 84 547 44 1562 261998 15301 5386 5288 35826 1074 65 631 55 1825 351999 17506 5440 5303 38333 743 74 475 42 1334 252000 18268 7168 6978 49801 675 129 998 79 1881 272001 17907 8507 8271 54328 1169 79 922 57 2227 272002 18581 5827 5662 42505 460 14 541 29 1044 182003 18833 6708 6537 47439 1042 57 737 59 1895 292004 20597 5577 5435 39360 962 35 584 56 1637 302005 20869 6676 6491 46313 1143 82 890 78 2193 34
Summary of Muzzleloader Elk Hunts
Summary of Archery Elk Hunts

Hunt Arizona 2017 65
Elk Harvest Data
5-Year: 2012-2016 Harvest
Unit HerdUnit Year Hunt
Type Dates PermitsAuthorized
1st Choice Applicants
PermitsIssued
DrawOdds Hunters Hunter
DaysHarvest Hunt
SuccessBull Spike Cow Calf TotalGeneral1 AM 2012 ALS 8/03-8/12 10 16 10 43�8 6 38 0 0 2 0 2 331 AM 2013 ALS 8/02 -8/11 10 9 10 66�7 10 33 0 0 5 0 5 501 AM 2014 ALS 8/01 -8/31 5 10 5 40 3 13 0 0 0 0 0 01 AM 2012 ALS 8/17 -8/26 10 2 10 100 10 40 0 0 5 5 10 1001 AM 2013 ALS 8/16 -8/25 10 2 10 100 8 28 0 0 2 0 2 251 AM 2012 ALS 8/31 -9/09 10 2 10 100 10 44 0 0 1 0 1 101 AM 2013 ALS 8/30 -9/08 10 7 10 42�9 8 30 0 0 5 0 5 631 AM 2012 ALS 9/28 -10/07 10 7 10 71�4 10 50 0 0 0 2 2 201 AM 2013 ALS 9/27 -10/06 10 14 10 42�9 10 41 0 0 1 1 2 201 AM 2014 ALS 10/03 -10/26 5 3 5 100 5 18 0 0 0 0 0 01 AM 2015 ALS 10/02 -10/25 5 8 5 50 3 13 0 0 3 0 3 1001 AM 2012 ALS 10/12 -10/21 10 2 10 100 5 35 0 0 0 0 0 01 AM 2013 ALS 10/11-10/20 10 7 10 57�1 10 33 0 0 0 0 0 01 AM 2012 ALS 10/26 -11/04 10 2 10 100 10 55 0 0 0 0 0 01 AM 2013 ALS 10/25 -11/03 10 5 10 60 10 62 0 0 0 0 0 01 AM 2015 ALS 7/31 -8/30 5 8 5 50 0 0 0 0 0 0 0 -1 AM 2016 ALS 7/29 -8/28 5 6 5 50 4 78 0 0 0 0 0 01 AM 2016 ALS 9/30 -10/23 5 3 5 100 5 25 0 0 3 0 3 601 ES 2012 ALS 12/07 -12/13 75 41 75 48�8 72 305 0 0 23 0 23 321 ES 2013 ALS 12/06 -12/12 75 59 75 72�9 66 270 0 0 6 0 6 91 ES 2014 ALS 12/05 -12/11 75 42 75 71�4 75 269 0 0 35 0 35 471 ES 2015 ALS 12/04 -12/10 75 47 75 76�6 66 272 0 0 40 5 45 681 ES 2016 ALS 12/02 -12/08 75 51 75 66�7 72 263 0 0 38 0 38 531 FT 2012 ALS 8/03 -8/12 5 3 5 100 4 14 0 0 0 0 0 01 FT 2012 ALS 8/17 -8/26 5 1 5 100 5 25 0 0 0 0 0 01 FT 2012 ALS 8/31 -9/09 5 0 5 - 0 0 0 0 0 0 0 -1 FT 2012 ALS 9/28 -10/07 5 1 5 100 5 23 0 0 0 0 0 01 FT 2012 ALS 10/12 -10/21 5 0 5 - 5 13 0 0 0 0 0 01 FT 2012 ALS 10/26 -11/04 5 1 5 100 0 0 0 0 0 0 0 -1 FT 2012 ALS 12/07 -12/16 5 3 5 100 0 0 0 0 0 0 0 -1 FT 2012 ALS 12/21 -12/31 5 3 5 100 5 14 0 0 0 0 0 01 CH 2012 AE 10/19 -10/25 10 110 10 8�2 10 27 6 1 3 0 10 1001 CH 2013 AE 10/18 -10/24 10 117 10 6 10 31 7 0 0 0 7 701 CH 2014 AE 10/17 -10/23 10 134 10 6�7 10 30 7 0 0 0 7 701 CH 2015 AE 10/16 -10/22 10 141 10 6�4 10 37 7 0 0 0 7 701 CH 2016 AE 10/14 -10/20 10 171 10 5�3 0 0 0 0 0 0 0 -
BE = Early Bull, B = Bull, ALS = Antlerless, AE = Any Elk, CN = Camp Navajo, CH = CHAMP Hunt, DV = Disabled Veteran, WW = Wounded Warrior
Herd-Units: AM = Antelope Mountain Hunt Area in Unit 1, CC= Canyon Creek in Unit 23, CC = Coon Canyon and Flat Top Hunt Areas in Unit 1, CF = Coon Canyon and Flat Top Hunt Areas in Unit 1, DL= Dry Lake, ES (Unit 1) = Escudilla, FT = Flat Top Hunt Areas in Unit 1, HM = Hutch Mtn�, M=Martinez, ML = Marshall Lake, MM = Melatone Mesa, P = Peaks Hunt Area in Unit 7 East, RV = Round Valley, SM = East Sunset/West Sunset/Meteor Crater, ST = East Sunset/West Sunset, TT= Twin Arrows/Two Guns/Grapevine, VV = Verde Valley�
Year 1st Choice Applicants
Permits Issued Hunters Hunter
DaysHarvest Percent
SuccessBulls Spikes Cows Calves Total2006 22653 6510 6367 45887 919 55 776 43 1793 282007 24684 5132 4963 38251 910 62 458 33 1463 292008 21625 5883 5675 44982 1241 73 357 23 1694 302009 20494 5891 5669 47879 954 73 356 27 1410 252010 19423 5714 5554 43636 979 60 253 21 1313 242011 19699 5716 5516 46516 760 62 143 13 978 182012 21464 5587 5239 41807 1408 104 282 10 1804 342013 23039 6257 6005 48723 1292 117 212 19 16402014 23416 5904 5622 46366 1261 146 223 12 1642 292015 24971 5976 5741 47268 1349 84 229 35 1697 302016 25263 5918 5610 45177 1335 164 244 13 1756 31
Summary of Archery Elk Hunts

66 Hunt Arizona 2017
Elk Harvest Data
5-Year: 2012-2016 Harvest
Unit HerdUnit Year Hunt
Type Dates PermitsAuthorized
1st Choice Applicants
PermitsIssued
DrawOdds Hunters Hunter
DaysHarvest Hunt
SuccessBull Spike Cow Calf TotalGeneral1/2B/2C 2015 BE 9/25 -10/01 40 7140 40 0�5 40 89 37 0 0 0 37 931/2B/2C 2013 BE 9/27 -10/03 50 6715 50 0�7 50 162 50 0 0 0 50 1001/2B/2C 2012 B 11/30 -12/06 365 2870 365 8 362 1536 183 24 0 0 207 571/2B/2C 2013 B 11/29 -12/05 375 2290 375 7�7 364 1513 161 22 0 0 183 501/2B/2C 2014 B 11/28 -12/04 375 3137 375 7�8 365 1440 216 22 0 0 238 651/2B/2C 2012 ALS 12/07 -12/13 315 977 315 18�9 301 1015 0 0 166 14 180 601/2B/2C 2013 ALS 12/06 -12/12 375 1002 375 20�8 345 1261 0 0 136 6 142 411/2B/2C 2013 ALS 12/13 -12/19 225 151 225 47 207 818 0 0 108 4 112 541/2B/2C 2014 ALS 12/05 -12/11 375 941 375 24�7 350 1301 0 0 176 10 186 531/2B/2C 2015 ALS 12/04 -12/10 300 1187 300 15�3 292 1021 0 0 171 14 185 631/2B/2C 2015 ALS 12/11-12/17 150 171 150 32�2 145 510 0 0 69 5 74 511/2B/2C 2016 ALS 12/02 -12/08 300 930 300 20�5 282 1087 0 0 195 10 205 731/2B/2C 2016 ALS 12/09 -12/31 200 550 200 24�2 188 792 0 0 134 8 142 761/2B/2C ES 2014 ALS 12/12 -12/18 225 203 225 37�4 0 0 0 0 0 0 0 -1/2B/2C 2015 B 11/27 -12/03 325 2785 325 6�2 315 1262 184 36 0 0 220 701/2B/2C 2016 B 11/25 -12/01 325 3444 325 6�2 308 1040 198 38 0 0 236 772A/2B 2013 ALS 10/11-10/20 30 0 30 - 24 129 0 0 6 0 6 252A/2B 2014 ALS 10/10 -10/19 30 0 30 - 21 102 0 0 0 0 0 02A/2B 2015 ALS 10/09 -10/18 30 0 30 - 27 93 0 0 3 3 6 222A/2B 2012 ALS 9/14 -9/23 40 7 40 100 40 200 0 0 14 4 18 452A/2B 2012 ALS 9/28 -10/07 40 5 40 100 34 145 0 0 6 0 6 182A/2B 2012 ALS 10/12 -10/21 30 6 30 100 25 115 0 0 3 0 3 122A/2B 2013 ALS 9/13 -9/22 40 14 40 100 35 165 0 0 15 0 15 432A/2B 2013 ALS 9/27 -10/06 40 10 40 80 38 177 0 0 2 2 4 112A/2B 2014 ALS 9/12 -9/21 55 11 55 90�9 43 313 0 0 2 2 4 92A/2B 2014 ALS 9/26 -10/05 50 3 50 100 41 193 0 0 7 0 7 172A/2B 2015 ALS 9/11-9/20 55 10 55 100 50 283 0 0 0 0 10 202A/2B 2015 ALS 9/25 -10/04 50 8 50 100 50 274 0 0 3 3 6 122A/2B 2015 ALS 9/11-9/20 25 116 25 11�2 23 88 0 0 0 0 0 02A/2B 2016 ALS 9/09 -9/18 55 13 55 84�6 50 261 0 0 11 0 11 222A/2B 2016 ALS 9/23 -10/02 50 2 50 100 48 289 0 0 16 2 18 382A/2B 2016 ALS 10/07 -10/16 30 6 30 100 25 199 0 0 8 0 8 322A/2B 2012 AE 9/14 -9/23 20 102 20 13�7 20 100 11 2 0 0 13 652A/2B 2012 AE 9/28 -10/07 20 95 20 9�5 20 80 13 0 0 0 13 652A/2B 2012 AE 10/12 -10/21 15 13 15 30�8 15 65 5 0 0 0 5 332A/2B 2013 AE 9/13 -9/22 20 86 20 8�1 20 92 12 0 0 0 12 602A/2B 2013 AE 9/27 -10/06 20 75 20 16 18 120 10 0 0 0 10 562A/2B 2013 AE 10/11-10/20 15 27 15 11�1 13 71 0 0 0 0 0 02A/2B 2014 AE 9/26 -10/05 25 58 25 12�1 25 143 20 0 0 0 20 802A/2B 2014 AE 10/10 -10/19 15 4 15 50 15 53 8 0 0 0 8 532A/2B 2015 AE 9/25 -10/04 25 90 25 16�7 25 86 14 0 0 0 14 562A/2B 2015 AE 10/09 -10/18 15 24 15 25 15 58 10 0 3 0 13 872A/2B 2016 AE 9/09 -9/18 25 95 25 5�3 23 158 10 0 0 0 10 432A/2B 2016 AE 9/23 -10/02 25 154 25 11�7 25 115 15 0 0 0 15 602A/2B 2016 AE 10/07 -10/16 15 46 15 10�9 15 69 6 0 0 0 6 402A/2B CC 2014 AE 9/12 -9/21 25 107 25 7�5 25 148 11 0 0 0 11 443A/3C 2015 BE 9/25 -10/01 25 2598 25 0�7 25 80 24 0 0 0 24 963A/3C 2016 BE 9/23 -9/29 25 3711 25 0�6 22 75 22 0 0 0 22 1003A/3C 2012 BE 9/28 -10/04 40 3274 40 1�2 40 176 33 0 0 0 33 833A/3C 2013 BE 9/27 -10/03 30 2313 30 1�2 30 104 28 0 0 0 28 933A/3C 2014 BE 9/26 -10/02 30 3370 30 0�8 30 130 23 1 0 0 24 803A/3C 2012 B 11/30 -12/06 325 908 325 16�5 311 1544 60 21 0 0 81 263A/3C 2013 B 11/29 -12/05 300 863 300 17�5 292 1436 62 16 0 0 78 273A/3C 2014 B 11/28 -12/04 300 928 300 16�8 287 1406 81 39 0 0 120 42
BE = Early Bull, B = Bull, ALS = Antlerless, AE = Any Elk, CN = Camp Navajo, CH = CHAMP Hunt, DV = Disabled Veteran, WW = Wounded Warrior
Herd-Units: AM = Antelope Mountain Hunt Area in Unit 1, CC= Canyon Creek in Unit 23, CC = Coon Canyon and Flat Top Hunt Areas in Unit 1, CF = Coon Canyon and Flat Top Hunt Areas in Unit 1, DL= Dry Lake, ES (Unit 1) = Escudilla, FT = Flat Top Hunt Areas in Unit 1, HM = Hutch Mtn�, M=Martinez, ML = Marshall Lake, MM = Melatone Mesa, P = Peaks Hunt Area in Unit 7 East, RV = Round Valley, SM = East Sunset/West Sunset/Meteor Crater, ST = East Sunset/West Sunset, TT= Twin Arrows/Two Guns/Grapevine, VV = Verde Valley�

Hunt Arizona 2017 67
Elk Harvest Data
5-Year: 2012-2016 Harvest
Unit HerdUnit Year Hunt
Type Dates PermitsAuthorized
1st Choice Applicants
PermitsIssued
DrawOdds Hunters Hunter
DaysHarvest Hunt
SuccessBull Spike Cow Calf TotalGeneral3A/3C 2015 B 11/27 -12/03 275 889 275 15�6 269 1316 79 33 0 0 112 423A/3C 2016 B 11/25 -12/01 275 1042 275 14�7 259 1182 77 44 0 0 121 473A/3C 2012 ALS 10/19 -10/25 350 1255 350 20�2 340 1291 0 0 140 26 166 493A/3C 2013 ALS 10/18 -10/24 350 1415 350 18�4 332 1481 0 0 141 9 150 453A/3C 2014 ALS 10/17 -10/23 350 1550 350 17�2 337 1550 0 0 145 2 147 443A/3C 2015 ALS 10/16 -10/22 350 1640 350 16 339 1419 0 0 149 15 164 483A/3C 2016 ALS 10/14 -10/20 350 1678 350 16�4 328 1494 0 0 144 9 153 473A/4B 2015 ALS 8/07 -8/16 15 9 15 77�8 14 57 0 0 2 3 5 363A/4B DL 2014 ALS 8/08 -8/17 15 13 15 69�2 12 102 0 0 9 0 9 753A/4B DL 2016 ALS 8/05 -8/14 25 23 25 56�5 23 67 0 0 13 2 15 653A/4BN DL 2012 ALS 8/10 -8/19 15 10 15 60 15 98 0 0 8 0 8 533A/4BN DL 2013 ALS 8/09 -8/18 15 4 15 100 15 88 0 0 6 0 6 404A 2012 B 11/30 -12/06 414 926 414 29 393 1922 68 21 0 0 89 234A (Hopi) 2012 B 11/30 -12/06 11 8 11 100 11 40 0 0 0 0 0 04A 2013 B 11/29 -12/05 366 727 366 27�9 353 1629 53 15 0 0 68 194A (Hopi) 2013 B 11/29 -12/05 9 9 9 66�7 8 27 0 3 0 0 3 384A 2014 B 11/28 -12/04 253 657 253 25�4 241 1068 72 22 0 0 94 394A (Hopi) 2014 B 11/28 -12/04 9 1 7 100 7 32 4 0 0 0 4 574A 2015 B 11/27 -12/03 268 780 268 23�6 261 1131 70 15 0 0 85 334A (Hopi) 2015 B 11/27 -12/03 7 7 7 28�6 7 16 0 0 0 0 0 04A 2016 B 11/25 -12/01 253 783 253 20�4 245 1052 63 38 0 0 101 414A (Hopi) 2016 B 11/25 -12/01 7 3 7 66�7 7 42 0 0 0 0 0 04A 2012 ALS 10/19 -10/25 122 470 122 18�5 117 452 0 0 49 3 52 444A 2013 ALS 10/18 -10/24 195 527 196 23�7 190 675 0 0 103 4 107 564A 2014 ALS 10/17 -10/23 97 521 97 17�9 95 351 0 0 50 2 52 554A 2015 ALS 10/16 -10/22 97 553 97 13�9 95 370 0 0 49 4 53 564A 2016 ALS 10/14 -10/20 97 537 97 14�5 91 316 0 0 53 4 57 634AN 2014 ALS 8/08 -8/17 13 5 13 100 10 21 0 0 8 0 8 804AN (Hopi) 2014 ALS 8/08 -8/17 13 0 13 - 13 49 0 0 13 0 13 1004AN 2014 ALS 12/12 -12/31 13 1 13 100 10 24 0 0 10 0 10 1004AN (Hopi) 2014 ALS 12/12 -12/31 13 0 13 - 13 59 0 0 8 0 8 624AN 2015 ALS 8/07 -8/16 13 24 13 45�8 10 36 0 0 3 5 8 804AN (Hopi) 2015 ALS 8/07 -8/16 13 3 13 100 9 26 0 0 2 2 4 444AN 2015 ALS 12/11-12/31 13 17 13 47�1 9 22 0 0 4 0 4 444AN (Hopi) 2015 ALS 12/11-12/31 13 0 13 - 13 20 0 0 13 0 13 1004AN 2016 ALS 12/16 -12/31 20 20 20 50 18 65 0 0 10 0 10 564AN (Hopi) 2016 ALS 12/16 -12/31 20 1 20 100 20 60 0 0 20 0 20 1004B 2012 BE 9/28 -10/04 50 1098 50 2�6 50 204 40 0 0 0 40 804B 2013 BE 9/27 -10/03 35 927 35 2 35 141 23 1 0 0 24 694B 2012 B 11/30 -12/06 300 524 300 30�9 300 1447 33 4 0 0 37 124B 2013 B 11/29 -12/05 250 387 250 29�2 229 1064 31 5 0 0 36 164B 2014 B 11/28 -12/04 250 381 250 36�2 232 1151 42 6 0 0 48 214B 2015 B 11/27 -12/03 175 345 175 23�8 173 826 28 9 0 0 37 214B 2016 B 11/25 -12/01 150 337 150 22�3 148 665 46 7 0 0 53 364B 2012 ALS 10/19 -10/25 50 114 50 26�3 50 230 0 0 17 0 17 344B 2013 ALS 10/18 -10/24 50 142 50 24�6 48 182 0 0 23 0 23 484B 2014 ALS 10/17 -10/23 50 151 50 17�2 50 185 0 0 27 8 35 704B 2015 ALS 10/16 -10/22 50 172 50 16�3 48 143 0 0 22 2 24 504B 2016 ALS 10/14 -10/20 50 201 50 21�9 50 226 0 0 24 0 24 485A 2015 BE 9/25 -10/01 24 1484 24 1�3 22 86 21 0 0 0 21 955A (Hopi) 2015 BE 9/25 -10/01 1 11 1 9�1 0 0 0 0 0 0 0 -5A 2012 B 11/30 -12/06 291 802 291 25�3 278 1354 52 13 0 0 65 235A (Hopi) 2012 B 11/30 -12/06 9 1 10 100 10 32 4 0 0 0 4 405A 2013 B 11/29 -12/05 291 872 291 23�3 280 1333 53 4 0 0 57 20
BE = Early Bull, B = Bull, ALS = Antlerless, AE = Any Elk, CN = Camp Navajo, CH = CHAMP Hunt, DV = Disabled Veteran, WW = Wounded Warrior
Herd-Units: AM = Antelope Mountain Hunt Area in Unit 1, CC= Canyon Creek in Unit 23, CC = Coon Canyon and Flat Top Hunt Areas in Unit 1, CF = Coon Canyon and Flat Top Hunt Areas in Unit 1, DL= Dry Lake, ES (Unit 1) = Escudilla, FT = Flat Top Hunt Areas in Unit 1, HM = Hutch Mtn�, M=Martinez, ML = Marshall Lake, MM = Melatone Mesa, P = Peaks Hunt Area in Unit 7 East, RV = Round Valley, SM = East Sunset/West Sunset/Meteor Crater, ST = East Sunset/West Sunset, TT= Twin Arrows/Two Guns/Grapevine, VV = Verde Valley�

68 Hunt Arizona 2017
Elk Harvest Data
5-Year: 2012-2016 Harvest
Unit HerdUnit Year Hunt
Type Dates PermitsAuthorized
1st Choice Applicants
PermitsIssued
DrawOdds Hunters Hunter
DaysHarvest Hunt
SuccessBull Spike Cow Calf TotalGeneral5A (Hopi) 2013 B 11/29 -12/05 9 6 9 100 9 44 0 0 0 0 0 05A 2014 B 11/28 -12/04 315 831 315 25�3 305 1443 90 13 0 0 103 345A (Hopi) 2014 B 11/28 -12/04 9 2 10 100 10 10 10 0 0 0 10 1005A 2015 B 11/27 -12/03 315 778 315 27�4 298 1382 69 28 0 0 97 335A (Hopi) 2015 B 11/27 -12/03 10 10 10 50 10 48 0 0 0 0 0 05A 2016 B 11/25 -12/01 412 1015 413 26�1 387 1936 77 19 0 0 96 255A (Hopi) 2016 B 11/25 -12/01 13 7 13 100 13 49 5 5 0 0 10 775A 2012 ALS 10/19 -10/25 121 582 121 17 116 421 0 0 56 5 61 535A (Hopi) 2012 ALS 10/19 -10/25 4 5 4 80 4 5 0 0 3 1 4 1005A 2013 ALS 10/11-10/17 121 618 121 17�8 119 407 0 0 63 9 72 615A (Hopi) 2013 ALS 10/11-10/17 4 5 4 80 0 0 0 0 0 0 0 -5A 2014 ALS 10/10 -10/16 97 540 97 14�4 95 361 0 0 44 9 53 565A (Hopi) 2014 ALS 10/10 -10/16 4 3 3 100 3 13 0 0 1 0 1 335A 2015 ALS 10/09 -10/15 97 588 97 13�9 95 279 0 0 72 5 77 815A (Hopi) 2015 ALS 10/09 -10/15 3 1 3 100 3 9 0 0 3 0 3 1005A 2016 ALS 10/07 -10/13 97 597 97 14�9 94 312 0 0 62 4 66 705A (Hopi) 2016 ALS 10/07 -10/13 3 4 3 75 3 9 0 0 0 0 0 05A ST 2016 ALS 10/14 -10/20 15 8 15 75 15 75 0 0 8 0 8 535A (Hopi) 2016 ALS 10/14 -10/20 15 0 15 - 0 0 0 0 0 0 0 -5A SM 2015 ALS 10/16 -10/22 15 10 15 100 15 58 0 0 10 0 10 675A (Hopi) 2015 ALS 10/16 -10/22 15 0 15 - 15 40 0 0 15 0 15 1005A/5BN ST 2012 ALS 10/19 -10/25 37 31 37 45�2 31 123 0 0 6 2 8 265A/5BN (Hopi) 2012 ALS 10/19 -10/25 38 0 38 - 34 141 0 0 14 0 14 415A/5BN ST 2013 ALS 10/18 -10/24 62 50 62 62 52 204 0 0 22 0 22 425A/5BN (Hopi) 2013 ALS 10/18 -10/24 63 12 63 100 53 126 0 0 11 0 11 215A/5BN ST 2014 ALS 10/17 -10/23 37 29 37 44�8 31 113 0 0 15 2 17 555A/5BN (Hopi) 2014 ALS 10/17 -10/23 63 20 38 90 35 131 0 0 14 3 17 495A/5BN (Hopi) 2012 AE 10/19 -10/25 25 56 25 42�9 25 100 6 3 11 3 23 925A/5BN ST 2012 AE 10/19 -10/25 25 159 25 11�9 25 123 12 0 0 0 12 485B 2012 B 11/30 -12/06 757 2982 757 18�5 728 3365 231 56 0 0 287 395B (Hopi) 2012 B 11/30 -12/06 18 20 18 75 18 90 12 0 0 0 12 675B 2013 B 11/29 -12/05 611 2909 611 17�2 594 2808 136 32 0 0 168 285B (Hopi) 2013 B 11/29 -12/05 14 26 14 50 14 49 0 4 0 0 4 295B 2014 B 11/28 -12/04 614 2909 614 16�8 576 2617 204 38 0 0 242 425B (Hopi) 2014 B 11/28 -12/04 14 23 14 56�5 14 49 4 0 0 0 4 295B 2015 B 11/27 -12/03 590 2720 590 16�8 585 2694 177 41 0 0 218 375B (Hopi) 2015 B 11/27 -12/03 10 20 10 50 10 60 0 0 0 0 0 05B 2016 B 11/25 -12/01 590 2532 590 15�2 570 2405 212 65 0 0 277 495B (Hopi) 2016 B 11/25 -12/01 10 18 10 50 10 42 0 2 0 0 2 205BN 2012 ALS 10/12 -10/18 285 680 283 26�5 262 1043 0 0 107 7 114 445BN (Hopi) 2012 ALS 10/12 -10/18 10 9 10 100 10 25 0 0 0 0 0 05BN 2013 ALS 10/11-10/17 285 632 285 24�5 276 1096 0 0 110 10 120 435BN (Hopi) 2013 ALS 10/11-10/17 10 8 10 75 10 25 0 0 3 0 3 305BN 2014 ALS 10/10 -10/16 241 726 241 20�9 228 847 0 0 108 13 121 535BN (Hopi) 2014 ALS 10/10 -10/16 10 9 9 44�4 9 39 0 0 6 0 6 675BN 2015 ALS 10/09 -10/15 241 803 241 19�8 228 939 0 0 106 19 125 555BN (Hopi) 2015 ALS 10/09 -10/15 9 9 9 66�7 9 25 0 0 7 0 7 785BN 2016 ALS 10/07 -10/13 193 973 193 15�9 181 663 0 0 112 7 119 665BN (Hopi) 2016 ALS 10/07 -10/13 7 14 7 42�9 7 34 0 0 1 0 1 145BN TT 2015 ALS 10/16 -10/22 37 41 37 61 35 140 0 0 14 0 14 405BN (Hopi) 2015 ALS 10/16 -10/22 38 4 38 100 36 134 0 0 16 0 16 445BN TT 2016 ALS 10/14 -10/20 30 41 30 43�9 28 112 0 0 7 0 7 255BN (Hopi) 2016 ALS 10/14 -10/20 30 8 30 100 30 180 0 0 0 0 0 05BS 2016 BE 9/23 -9/29 25 2833 25 0�5 23 108 19 0 0 0 19 83
BE = Early Bull, B = Bull, ALS = Antlerless, AE = Any Elk, CN = Camp Navajo, CH = CHAMP Hunt, DV = Disabled Veteran, WW = Wounded Warrior
Herd-Units: AM = Antelope Mountain Hunt Area in Unit 1, CC= Canyon Creek in Unit 23, CC = Coon Canyon and Flat Top Hunt Areas in Unit 1, CF = Coon Canyon and Flat Top Hunt Areas in Unit 1, DL= Dry Lake, ES (Unit 1) = Escudilla, FT = Flat Top Hunt Areas in Unit 1, HM = Hutch Mtn�, M=Martinez, ML = Marshall Lake, MM = Melatone Mesa, P = Peaks Hunt Area in Unit 7 East, RV = Round Valley, SM = East Sunset/West Sunset/Meteor Crater, ST = East Sunset/West Sunset, TT= Twin Arrows/Two Guns/Grapevine, VV = Verde Valley�

Hunt Arizona 2017 69
Elk Harvest Data
5-Year: 2012-2016 Harvest
Unit HerdUnit Year Hunt
Type Dates PermitsAuthorized
1st Choice Applicants
PermitsIssued
DrawOdds Hunters Hunter
DaysHarvest Hunt
SuccessBull Spike Cow Calf TotalGeneral5BS 2012 ALS 10/12 -10/18 450 2182 450 17�7 431 1674 0 0 175 12 187 435BS 2013 ALS 10/11-10/17 450 2125 450 18�4 431 1512 0 0 222 30 252 585BS 2014 ALS 10/10 -10/16 450 2235 450 16�6 438 1695 0 0 202 16 218 505BS 2015 ALS 10/09 -10/15 450 2388 450 16�8 435 1516 0 0 245 17 262 605BS 2016 ALS 10/14 -10/20 300 1943 300 12�7 283 1043 0 0 157 10 167 596A 2012 B 10/26 -10/29 125 2970 125 3�3 123 414 48 4 0 0 52 426A 2012 B 11/30 -12/06 900 4477 900 14�5 874 4296 218 45 0 0 263 306A 2013 B 11/29 -12/05 825 4889 825 13�8 785 3316 246 49 0 0 295 386A 2014 B 11/28 -12/04 825 5112 825 14�1 804 3822 184 50 0 0 234 296A 2015 B 11/27 -12/03 825 5257 825 14 793 3601 227 60 0 0 287 366A 2016 B 11/25 -12/01 700 4943 700 12�1 646 2795 180 76 0 0 256 406A 2012 ALS 10/19 -10/25 500 2371 500 14�6 464 2032 0 0 127 10 137 306A 2013 ALS 10/18 -10/24 525 2431 525 16�5 505 2194 0 0 174 22 196 396A 2014 ALS 10/17 -10/23 475 2639 475 14�9 454 1851 0 0 127 11 138 306A 2015 ALS 10/16 -10/22 475 2748 475 15 451 1833 0 0 182 9 191 426A 2016 ALS 10/14 -10/20 350 2640 350 11�6 326 1184 0 0 146 20 166 516A CH 2012 AE 11/23 -11/29 25 91 25 19�8 0 0 0 0 0 0 0 -6A CH 2014 AE 10/24 -10/30 25 124 25 13�7 23 102 6 3 6 2 17 746A CH 2015 AE 10/23 -10/29 25 140 25 12�1 23 129 7 0 2 0 9 396A CH 2016 AE 10/21 -10/27 25 153 25 11�1 25 50 0 0 13 0 13 526AN CH 2013 AE 10/25 -10/31 25 92 25 20�7 24 94 1 4 0 0 5 216AS/6AW 2013 B 10/25 -10/28 225 1542 225 11�2 215 771 55 12 0 0 67 316B 2015 BE 9/25 -10/01 25 1024 25 2 25 113 21 0 0 0 21 846B 2012 B 11/30 -12/06 190 538 190 24�3 185 830 60 11 0 0 71 386B 2013 B 11/29 -12/05 175 479 175 24 169 710 67 13 0 0 80 476B 2014 B 11/28 -12/04 175 567 175 21�5 172 745 65 10 0 0 75 446B 2015 B 11/27 -12/03 130 491 130 16�3 126 526 27 13 0 0 40 326B 2016 B 11/25 -12/01 175 472 175 26�3 168 639 73 17 0 0 90 546B 2012 ALS 12/07 -12/13 200 204 200 38�7 185 838 0 0 79 9 88 486B 2013 ALS 12/06 -12/15 300 274 300 63�1 272 1327 0 0 74 8 82 306B 2014 ALS 12/05 -12/14 300 371 300 38 278 1213 0 0 116 7 123 446B 2015 ALS 12/04 -12/10 300 356 300 44�9 291 1215 0 0 91 15 106 366B 2016 ALS 12/02 -12/08 300 433 300 39�5 271 1065 0 0 104 20 124 467E 2012 B 11/30 -12/06 325 637 325 34�2 311 1454 38 26 0 0 64 217E 2013 B 11/29 -12/05 400 712 400 36�1 386 1853 85 22 0 0 107 287E 2014 B 11/28 -12/04 400 661 400 33�4 376 1795 87 7 0 0 94 257E 2015 B 11/27 -12/03 550 718 550 44�3 532 2507 121 25 0 0 146 277E 2016 B 11/25 -12/01 550 705 550 41�6 483 2297 64 26 0 0 90 197E P 2012 B 9/28 -10/04 30 329 30 8�2 30 137 15 0 0 0 15 507E P 2012 B 10/05 -10/11 30 96 30 14�6 30 100 22 0 0 0 22 737E P 2012 B 10/12 -10/18 30 38 30 34�2 30 131 17 1 0 0 18 607E 2015 ALS 9/25 -10/01 20 161 20 10�6 20 97 0 0 3 6 9 457E 2016 ALS 9/23 -9/29 20 99 20 13�1 20 62 0 0 10 2 12 607E 2012 ALS 12/07 -12/13 125 131 125 42 123 598 0 0 39 4 43 357E 2012 ALS 9/28 -10/04 10 67 10 14�9 10 33 0 0 0 0 0 07E 2012 ALS 10/05 -10/11 10 20 10 25 10 50 0 0 4 0 4 407E 2012 ALS 10/12 -10/18 10 8 10 0 10 55 0 0 7 0 7 707E 2012 ALS 10/19 -10/28 10 24 10 29�2 8 50 0 0 3 0 3 387E 2013 ALS 12/06 -12/15 250 160 254 76�3 230 1059 0 0 116 4 120 527E 2013 ALS 9/27 -10/03 10 59 10 11�9 10 28 0 0 8 0 8 807E 2013 ALS 10/04 -10/10 10 17 10 35�3 10 37 0 0 5 2 7 707E 2013 ALS 10/11-10/17 10 6 10 33�3 10 43 0 0 3 0 3 307E 2013 ALS 10/18 -10/27 10 17 10 11�8 10 57 0 0 4 0 4 407E 2014 ALS 12/05 -12/11 210 196 210 59�7 190 815 0 0 54 5 59 31
BE = Early Bull, B = Bull, ALS = Antlerless, AE = Any Elk, CN = Camp Navajo, CH = CHAMP Hunt, DV = Disabled Veteran, WW = Wounded Warrior
Herd-Units: AM = Antelope Mountain Hunt Area in Unit 1, CC= Canyon Creek in Unit 23, CC = Coon Canyon and Flat Top Hunt Areas in Unit 1, CF = Coon Canyon and Flat Top Hunt Areas in Unit 1, DL= Dry Lake, ES (Unit 1) = Escudilla, FT = Flat Top Hunt Areas in Unit 1, HM = Hutch Mtn�, M=Martinez, ML = Marshall Lake, MM = Melatone Mesa, P = Peaks Hunt Area in Unit 7 East, RV = Round Valley, SM = East Sunset/West Sunset/Meteor Crater, ST = East Sunset/West Sunset, TT= Twin Arrows/Two Guns/Grapevine, VV = Verde Valley�

70 Hunt Arizona 2017
Elk Harvest Data
5-Year: 2012-2016 Harvest
Unit HerdUnit Year Hunt
Type Dates PermitsAuthorized
1st Choice Applicants
PermitsIssued
DrawOdds Hunters Hunter
DaysHarvest Hunt
SuccessBull Spike Cow Calf TotalGeneral7E 2014 ALS 9/26 -10/02 20 83 20 20�5 18 67 0 0 9 2 11 617E 2014 ALS 10/03 -10/09 20 30 20 40 19 61 0 0 10 3 13 687E 2014 ALS 10/10 -10/16 20 30 20 53�3 20 83 0 0 8 0 8 407E 2014 ALS 10/17 -10/23 20 19 20 36�8 20 67 0 0 9 7 16 807E 2015 ALS 12/04 -12/10 300 252 300 61�1 290 1317 0 0 88 2 90 317E 2015 ALS 10/02 -10/08 20 68 20 11�8 20 105 0 0 8 0 8 407E 2015 ALS 10/09 -10/15 20 39 20 33�3 20 98 0 0 8 0 8 407E 2015 ALS 10/16 -10/22 20 37 20 24�3 18 94 0 0 0 0 0 07E 2016 ALS 12/02 -10/08 300 265 300 53�6 273 1243 0 0 86 0 86 327E 2016 ALS 9/30 -10/06 20 45 20 22�2 18 82 0 0 9 0 9 507E 2016 ALS 10/07 -10/13 20 55 20 21�8 20 81 0 0 10 3 13 657E 2016 ALS 10/14 -10/20 20 48 20 22�9 20 89 0 0 9 0 9 457E P 2012 ALS 9/28 -10/04 75 75 75 53�3 73 255 0 0 45 9 54 747E P 2012 ALS 10/05 -10/11 75 18 75 72�2 72 307 0 0 21 2 23 327E P 2012 ALS 10/12 -10/18 75 9 75 100 73 316 0 0 34 0 34 477E P 2012 ALS 10/19 -10/28 75 14 75 100 70 445 0 0 16 5 21 307E P 2013 ALS 9/27 -10/03 75 123 75 40�7 70 233 0 0 28 2 30 437E P 2013 ALS 10/04 -10/10 75 32 75 68�8 71 338 0 0 26 4 30 427E P 2013 ALS 10/11-10/17 75 23 75 100 75 349 0 0 29 7 36 487E P 2013 ALS 10/18 -10/27 75 10 75 100 73 364 0 0 26 0 26 367E P 2014 ALS 10/24 -10/30 75 6 75 100 64 287 0 0 15 2 17 277E P 2014 ALS 9/26 -10/02 75 138 75 35�5 73 282 0 0 37 7 44 607E P 2014 ALS 10/03 -10/09 75 27 75 51�9 67 290 0 0 20 2 22 337E P 2014 ALS 10/10 -10/16 75 44 75 79�5 68 311 0 0 27 5 32 477E P 2014 ALS 10/17 -10/23 75 10 75 90 73 341 0 0 12 0 12 167E P 2015 ALS 9/25 -10/01 75 85 75 48�2 71 280 0 0 6 14 20 287E P 2015 ALS 10/02 -10/08 75 31 75 90�3 71 360 0 0 24 0 24 347E P 2015 ALS 10/09 -10/15 75 24 75 100 73 330 0 0 19 2 21 297E P 2015 ALS 10/16 -10/22 75 11 75 81�8 72 338 0 0 14 3 17 247E P 2015 ALS 10/23 -10/29 75 16 75 100 73 343 0 0 23 0 23 327E P 2016 ALS 9/23 -9/29 75 117 75 43�6 69 325 0 0 27 0 27 397E P 2016 ALS 9/30 -10/06 75 44 75 45�5 71 337 0 0 11 2 13 187E P 2016 ALS 10/07 -10/13 75 27 75 92�6 73 330 0 0 12 3 15 217E P 2016 ALS 10/14 -10/20 75 11 75 100 69 421 0 0 10 0 10 147E P 2016 ALS 10/21 -10/27 75 11 75 100 66 380 0 0 12 0 12 187E P 2013 AE 9/27 -10/03 30 280 30 6�4 29 100 18 0 0 0 18 627E P 2013 AE 10/04 -10/10 30 90 30 12�2 30 120 12 2 2 0 16 537E P 2013 AE 10/11-10/17 30 65 30 23�1 30 93 15 0 0 0 15 507E P 2014 AE 10/24 -10/30 30 25 30 96 30 136 12 2 2 0 16 537E P 2014 AE 9/26 -10/02 30 221 30 8�6 27 89 17 2 2 0 21 787E P 2014 AE 10/03 -10/09 30 68 30 17�6 27 113 10 0 1 0 11 417E P 2014 AE 10/10 -10/16 30 46 30 34�8 30 148 9 2 2 0 13 437E P 2014 AE 10/17 -10/23 30 27 30 51�9 30 133 15 0 3 5 23 777E P 2015 AE 9/25 -10/01 30 283 30 8�8 30 104 19 0 0 0 19 637E P 2015 AE 10/02 -10/08 30 110 30 10�9 30 117 23 0 0 0 23 777E P 2015 AE 10/09 -10/15 30 93 30 10�8 30 158 8 0 3 0 11 377E P 2015 AE 10/16 -10/22 30 51 30 33�3 30 120 0 3 9 0 12 407E P 2015 AE 10/23 -10/29 30 65 30 35�4 27 120 11 0 5 0 16 597E P 2016 AE 9/23 -9/29 30 297 30 7�7 29 104 20 0 1 0 21 727E P 2016 AE 9/30 -10/06 30 68 30 14�7 28 123 8 0 8 0 16 577E P 2016 AE 10/07 -10/13 30 44 30 43�2 27 115 5 5 0 0 10 377E P 2016 AE 10/14 -10/20 30 61 30 26�2 30 146 8 0 2 0 10 337E P 2016 AE 10/21 -10/27 30 57 30 33�3 29 146 4 0 4 0 8 287W 2013 BE 9/27 -10/03 25 2111 25 0�9 25 98 19 0 0 0 19 76
BE = Early Bull, B = Bull, ALS = Antlerless, AE = Any Elk, CN = Camp Navajo, CH = CHAMP Hunt, DV = Disabled Veteran, WW = Wounded Warrior
Herd-Units: AM = Antelope Mountain Hunt Area in Unit 1, CC= Canyon Creek in Unit 23, CC = Coon Canyon and Flat Top Hunt Areas in Unit 1, CF = Coon Canyon and Flat Top Hunt Areas in Unit 1, DL= Dry Lake, ES (Unit 1) = Escudilla, FT = Flat Top Hunt Areas in Unit 1, HM = Hutch Mtn�, M=Martinez, ML = Marshall Lake, MM = Melatone Mesa, P = Peaks Hunt Area in Unit 7 East, RV = Round Valley, SM = East Sunset/West Sunset/Meteor Crater, ST = East Sunset/West Sunset, TT= Twin Arrows/Two Guns/Grapevine, VV = Verde Valley�

Hunt Arizona 2017 71
Elk Harvest Data
5-Year: 2012-2016 Harvest
Unit HerdUnit Year Hunt
Type Dates PermitsAuthorized
1st Choice Applicants
PermitsIssued
DrawOdds Hunters Hunter
DaysHarvest Hunt
SuccessBull Spike Cow Calf TotalGeneral7W 2012 B 11/30 -12/06 275 1060 275 19 263 1311 58 16 0 0 74 287W 2013 B 11/29 -12/05 245 849 245 17�1 237 1083 89 15 0 0 104 447W 2014 B 11/28 -12/04 350 1181 350 20�7 336 1727 108 14 0 0 122 367W 2015 B 11/27 -12/03 400 1597 400 18�6 386 1815 125 33 0 0 158 417W 2016 B 11/25 -12/01 400 1516 400 20�2 372 1633 160 33 0 0 193 527W 2012 ALS 10/19 -10/25 550 1238 550 30�5 530 2171 0 0 202 20 222 427W 2012 ALS 12/07 -12/13 100 172 100 35�5 94 377 0 0 47 2 49 527W 2013 ALS 10/18 -10/24 550 1470 550 25�4 532 2237 0 0 191 24 215 407W 2013 ALS 12/06 -12/12 200 234 200 42�7 181 745 0 0 83 4 87 487W 2014 ALS 10/17 -10/23 550 1511 550 25�8 533 2266 0 0 212 9 221 417W 2014 ALS 12/05 -12/11 250 274 250 48�9 248 1132 0 0 68 10 78 317W 2015 ALS 10/16 -10/22 550 1624 550 24�8 522 2135 0 0 195 20 215 417W 2015 ALS 12/04 -12/10 300 429 300 41�3 290 1148 0 0 119 10 129 447W 2016 ALS 10/14 -10/20 550 1767 550 21�5 513 2136 0 0 227 14 241 477W 2016 ALS 12/02 -12/08 300 359 300 43�7 288 1200 0 0 135 5 140 498 2012 B 11/30 -12/06 500 1569 500 22�6 481 2344 132 28 0 0 160 338 2013 B 11/29 -12/05 475 1699 475 19�8 471 2257 145 35 0 0 180 388 2014 B 11/28 -12/04 500 1766 500 20�9 475 2155 167 25 0 0 192 408 2015 B 11/27 -12/03 500 1901 500 17�9 474 2225 152 19 0 0 171 368 2016 B 11/25 -12/01 500 2002 500 18�8 478 2372 158 44 0 0 202 428 2012 ALS 12/07 -12/13 475 614 475 41�4 456 1952 0 0 211 19 230 508 2013 ALS 12/06 -12/12 525 691 525 46�2 496 2211 0 0 167 14 181 368 2014 ALS 12/05 -12/11 550 843 550 41�8 529 2292 0 0 212 12 224 428 2015 ALS 12/04 -12/10 500 946 500 32�9 483 2032 0 0 204 13 217 458 2016 ALS 12/02 -12/08 500 1103 500 31�8 463 2002 0 0 181 15 196 429 2016 BE 9/23 -9/29 35 4549 35 0�7 33 138 29 0 0 0 29 889 2012 BE 9/28 -10/04 25 3196 25 0�8 25 75 23 0 0 0 23 929 2014 BE 9/26 -10/02 25 4428 25 0�6 25 92 23 0 0 0 23 929 2012 B 11/30 -12/06 275 763 275 21�1 270 1333 100 19 0 0 119 449 2013 B 11/29 -12/05 275 1069 275 17 263 1371 45 2 0 0 47 189 2014 B 11/28 -12/04 325 864 325 21�9 303 1398 117 12 0 0 129 439 2015 B 11/27 -12/03 325 1017 325 22�7 306 1541 86 6 0 0 92 309 2016 B 11/25 -12/01 325 953 325 22�7 300 1467 121 18 0 0 139 469 2012 ALS 10/19 -10/25 250 614 250 29�5 244 963 0 0 125 11 136 569 2012 ALS 12/07 -12/13 250 218 250 55 228 954 0 0 102 2 104 469 2013 ALS 10/18 -10/24 275 698 275 27�4 267 1114 0 0 123 13 136 519 2013 ALS 12/06 -12/12 275 212 275 51�9 264 1061 0 0 138 7 145 559 2014 ALS 10/17 -10/23 300 692 300 30�5 281 1228 0 0 126 2 128 469 2014 ALS 12/05 -12/11 300 246 300 56�9 283 1247 0 0 99 2 101 369 2015 ALS 10/16 -10/22 300 855 300 26�5 278 1121 0 0 98 11 109 399 2015 ALS 12/04 -12/10 300 299 300 53�8 290 1154 0 0 120 5 125 439 2016 ALS 10/14 -10/20 300 748 300 27�4 291 1135 0 0 161 12 173 599 2016 ALS 12/02 -12/08 300 266 300 53�8 277 1187 0 0 105 15 120 4310 2015 BE 9/25 -10/01 100 4690 100 1�6 96 411 70 0 0 0 70 7310 2016 BE 9/23 -9/29 40 2749 40 0�9 39 183 34 0 0 0 34 8710 2012 BE 9/28 -10/04 75 4694 75 1 74 296 53 0 0 0 53 7210 2013 BE 9/27 -10/03 75 4404 75 1�5 74 349 50 0 0 0 50 6810 2014 BE 9/26 -10/02 100 3967 100 1�6 100 457 69 0 0 0 69 6910 2012 B 11/30 -12/06 575 1378 575 23�7 549 2834 137 19 0 0 156 2810 2013 B 11/29 -12/05 550 1387 550 21�3 505 2445 170 11 0 0 181 3610 2014 B 11/28 -12/04 550 1111 550 24�9 518 2553 157 8 0 0 165 3210 2015 B 11/27 -12/03 550 1329 550 21�4 518 2358 175 22 0 0 197 3810 2016 B 11/25 -12/01 500 1266 500 21�3 474 2369 170 17 0 0 187 3910 2012 ALS 10/19 -10/25 825 790 825 53�7 769 3775 0 0 196 15 211 27
BE = Early Bull, B = Bull, ALS = Antlerless, AE = Any Elk, CN = Camp Navajo, CH = CHAMP Hunt, DV = Disabled Veteran, WW = Wounded Warrior
Herd-Units: AM = Antelope Mountain Hunt Area in Unit 1, CC= Canyon Creek in Unit 23, CC = Coon Canyon and Flat Top Hunt Areas in Unit 1, CF = Coon Canyon and Flat Top Hunt Areas in Unit 1, DL= Dry Lake, ES (Unit 1) = Escudilla, FT = Flat Top Hunt Areas in Unit 1, HM = Hutch Mtn�, M=Martinez, ML = Marshall Lake, MM = Melatone Mesa, P = Peaks Hunt Area in Unit 7 East, RV = Round Valley, SM = East Sunset/West Sunset/Meteor Crater, ST = East Sunset/West Sunset, TT= Twin Arrows/Two Guns/Grapevine, VV = Verde Valley�

72 Hunt Arizona 2017
Elk Harvest Data
5-Year: 2012-2016 Harvest
Unit HerdUnit Year Hunt
Type Dates PermitsAuthorized
1st Choice Applicants
PermitsIssued
DrawOdds Hunters Hunter
DaysHarvest Hunt
SuccessBull Spike Cow Calf TotalGeneral10 2012 ALS 12/07 -12/13 800 472 800 82 762 3975 0 0 205 18 223 2910 2013 ALS 10/18 -10/24 850 873 850 50�7 790 3561 0 0 168 13 181 2310 2013 ALS 12/06 -12/15 825 595 825 74�5 768 3918 0 0 216 29 245 3210 2014 ALS 10/17 -10/23 850 885 850 53�6 797 3754 0 0 139 11 150 1910 2014 ALS 12/05 -12/14 825 395 825 91�1 778 4038 0 0 191 21 212 2710 2015 ALS 10/16 -10/22 800 829 800 43�3 737 3462 0 0 123 19 142 1910 2015 ALS 12/04 -12/13 800 502 800 69�5 767 4116 0 0 231 39 270 3510 2016 ALS 10/14 -10/20 800 878 800 46 742 3587 0 0 152 25 177 2410 2016 ALS 12/02 -12/11 800 469 800 77 750 4106 0 0 186 25 211 2810 CH 2012 AE 11/09 -11/15 10 17 10 23�5 8 20 2 2 3 0 7 8810 CH 2013 AE 11/08 -11/14 10 16 10 25 9 31 3 0 0 0 3 3310 CH 2014 AE 11/07 -12/11 10 23 10 26�1 10 37 6 0 0 0 6 6010 CH 2015 AE 11/06 -11/12 15 30 15 30 13 51 6 2 0 0 8 6210 CH 2016 AE 11/04 -11/10 15 42 15 19 0 0 0 0 0 0 0 -15A/15B/18A 2012 B 10/05 -10/18 25 164 25 11 25 155 9 0 0 0 9 3615A/15B/18A 2013 B 10/04 -10/17 25 200 25 10 25 137 16 0 0 0 16 6415A/15B/18A 2014 B 10/03 -10/16 25 152 25 10�5 21 148 11 0 0 0 11 5215A/15B/18A 2015 B 10/02 -10/15 25 177 25 8�5 25 103 16 0 0 0 16 6415A/15B/18A 2016 B 9/23 -10/06 25 257 25 6�2 25 94 22 0 0 0 22 8815A/15B/18A 2012 ALS 11/09 -12/13 200 20 204 100 186 1288 0 0 41 2 43 2315A/15B/18A 2013 ALS 11/08 -12/12 200 25 200 100 182 1774 0 0 5 0 5 315A/15B/18A 2014 ALS 11/07 -12/11 200 27 200 100 177 1694 0 0 26 6 32 1815A/15B/18A 2015 ALS 11/06 -12/10 200 18 200 100 175 1578 0 0 36 3 39 2215A/15B/18A 2016 ALS 11/04 -12/08 200 28 200 100 192 1608 0 0 35 4 39 2015A/15B/18A 2012 AE 11/09 -12/13 150 142 150 45�1 142 1408 21 6 18 2 47 3315A/15B/18A 2013 AE 11/08 -12/12 150 237 150 40�1 138 1269 25 0 2 0 27 2015A/15B/18A 2014 AE 11/07 -12/11 150 193 150 49�7 143 1533 35 2 0 0 37 2615A/15B/18A 2015 AE 11/06 -12/10 150 160 150 44�4 136 1069 36 0 19 5 60 4415A/15B/18A 2016 AE 11/04 -12/08 150 211 150 32�7 142 1195 20 0 13 0 33 2317/18B/19B/20AC 2012 B 10/05 -10/18 35 171 35 14 33 167 14 0 0 0 14 4217/18B/19B/20AC 2013 B 10/04 -10/17 35 156 35 14�7 33 147 25 2 0 0 27 8217/18B/19B/20AC 2014 B 10/03 -10/16 35 211 35 11�4 32 194 19 0 0 0 19 5917/18B/19B/20A 2015 B 10/02 -10/15 35 247 35 8�9 33 110 28 0 0 0 28 8517/18B/19B/20A 2016 B 9/23 -10/06 35 287 35 5�9 35 198 19 1 0 0 20 5717/18B/19B/20AC 2012 ALS 10/05 -10/18 150 25 150 100 133 763 0 0 24 0 24 1817/18B/19B/20AC 2012 ALS 11/09 -12/13 250 15 251 100 221 1618 0 0 32 0 32 1417/18B/19B/20AC 2013 ALS 10/04 -10/17 150 33 150 100 143 720 0 0 5 0 5 317/18B/19B/20AC 2013 ALS 11/08 -12/12 250 10 250 100 206 1628 0 0 5 0 5 217/18B/19B/20AC 2014 ALS 10/03 -10/16 150 38 150 94�7 131 884 0 0 38 0 38 2917/18B/19B/20A 2015 ALS 10/02 -10/15 150 30 150 100 131 775 0 0 27 5 32 2417/18B/19B/20AC 2014 ALS 11/07 -12/11 250 22 250 100 205 2362 0 0 19 0 19 917/18B/19B/20A 2015 ALS 11/06 -12/10 250 28 250 100 227 1912 0 0 40 3 43 1917/18B/19B/2OA 2016 ALS 9/23 -10/06 150 21 150 100 134 713 0 0 34 3 37 2817/18B/19B/20A 2016 ALS 11/04 -12/08 250 45 250 97�8 231 1842 0 0 52 0 52 2317/18B/19B/20AC 2012 AE 11/09 -12/13 150 173 150 46�8 129 988 33 4 12 0 49 3817/18B/19B/20AC 2013 AE 11/08 -12/12 150 256 150 29�7 124 924 30 0 0 0 30 2417/18B/19B/20AC 2014 AE 11/07 -12/11 150 217 150 38�2 141 1232 34 9 15 0 58 4117/18B/19B/20A 2015 AE 11/06 -12/10 150 191 150 31�4 130 1017 44 2 18 0 64 4917/18B/19B/20A 2016 AE 11/04 -12/08 150 224 150 27�7 132 949 43 2 13 0 58 4419A 2012 B 11/30 -12/06 30 64 29 35�9 29 106 12 0 0 0 12 4119A 2013 B 11/29 -12/05 30 67 30 26�9 28 101 13 2 0 0 15 5419A 2014 B 11/28 -12/04 30 84 30 19 27 130 13 0 0 0 13 4819A 2015 B 11/27 -12/03 35 124 35 16�1 35 105 24 0 0 0 24 69
BE = Early Bull, B = Bull, ALS = Antlerless, AE = Any Elk, CN = Camp Navajo, CH = CHAMP Hunt, DV = Disabled Veteran, WW = Wounded Warrior
Herd-Units: AM = Antelope Mountain Hunt Area in Unit 1, CC= Canyon Creek in Unit 23, CC = Coon Canyon and Flat Top Hunt Areas in Unit 1, CF = Coon Canyon and Flat Top Hunt Areas in Unit 1, DL= Dry Lake, ES (Unit 1) = Escudilla, FT = Flat Top Hunt Areas in Unit 1, HM = Hutch Mtn�, M=Martinez, ML = Marshall Lake, MM = Melatone Mesa, P = Peaks Hunt Area in Unit 7 East, RV = Round Valley, SM = East Sunset/West Sunset/Meteor Crater, ST = East Sunset/West Sunset, TT= Twin Arrows/Two Guns/Grapevine, VV = Verde Valley�

Hunt Arizona 2017 73
Elk Harvest Data
5-Year: 2012-2016 Harvest
Unit HerdUnit Year Hunt
Type Dates PermitsAuthorized
1st Choice Applicants
PermitsIssued
DrawOdds Hunters Hunter
DaysHarvest Hunt
SuccessBull Spike Cow Calf TotalGeneral19A 2016 B 11/25 -12/01 35 113 35 22�1 35 172 18 0 0 0 18 5119A 2012 ALS 10/19 -10/25 30 30 30 40 23 95 0 0 3 0 3 1319A 2012 ALS 12/07 -12/13 20 6 20 100 18 92 0 0 6 0 6 3319A 2013 ALS 10/18 -10/24 30 22 30 63�6 30 122 0 0 6 0 6 2019A 2013 ALS 12/06 -12/15 20 16 20 56�3 17 81 0 0 7 0 7 4119A 2014 ALS 10/17 -10/23 30 38 30 52�6 27 117 0 0 3 0 3 1119A 2014 ALS 12/05 -12/14 20 10 20 80 18 102 0 0 5 0 5 2819A 2015 ALS 10/16 -10/22 30 34 30 47�1 30 108 0 0 10 0 10 3319A 2015 ALS 12/04 -12/13 20 28 20 35�7 16 49 0 0 7 0 7 4419A 2016 ALS 10/14 -10/20 40 42 40 54�8 36 158 0 0 14 0 14 3919A 2016 ALS 12/02 -12/11 35 17 35 76�5 31 184 0 0 7 0 7 2321 2012 B 11/30 -12/06 20 74 20 17�6 17 87 10 0 0 0 10 5921 2013 B 11/29 -12/05 25 87 25 14�9 20 65 10 0 0 0 10 5021 2014 B 11/28 -12/04 25 114 25 14 25 104 11 0 0 0 11 4421 2015 B 11/27 -12/03 30 118 30 16�9 27 115 19 0 0 0 19 7021 2016 B 11/25 -12/01 40 99 40 26�3 31 129 9 3 0 0 12 3921 2012 ALS 10/19 -10/25 25 13 25 100 25 108 0 0 8 5 13 5221 2013 ALS 10/18 -10/24 50 49 50 51 50 182 0 0 11 2 13 2621 2014 ALS 10/17 -10/23 25 53 25 34 25 110 0 0 4 0 4 1621 2015 ALS 10/16 -10/22 25 22 25 40�9 23 93 0 0 3 0 3 1321 2016 ALS 10/14 -10/20 25 30 25 46�7 20 95 0 0 7 0 7 3522N 2015 BE 9/25 -10/01 30 1402 30 1�5 30 113 28 0 0 0 28 9322N 2016 BE 9/23 -9/29 30 1404 30 1�6 30 124 22 2 0 0 24 8022N 2012 BE 9/28 -10/04 30 1088 30 1�7 30 105 28 0 0 0 28 9322N 2013 BE 9/27 -10/03 30 1198 30 1�6 30 99 24 0 0 0 24 8022N 2014 BE 9/26 -10/02 30 1439 30 1�5 30 122 21 2 0 0 23 7722N 2012 B 11/30 -12/06 450 947 450 29�3 436 2112 101 18 0 0 119 2722N 2012 B 12/07 -12/13 100 158 100 27�8 94 435 37 6 0 0 43 4622N 2013 B 11/29 -12/05 475 866 475 30�4 445 1980 130 25 0 0 155 3522N 2013 B 12/06 -12/12 350 298 350 49�7 339 1440 119 15 0 0 134 4022N 2014 B 11/28 -12/04 475 906 475 33�1 453 1731 150 26 0 0 176 3922N 2014 B 12/05 -12/11 400 806 400 31�4 384 1793 76 31 0 0 107 2822N 2015 B 11/27 -12/03 450 1186 450 22�7 439 1943 143 35 0 0 178 4122N 2015 B 12/04 -12/10 375 471 375 37�4 357 1658 66 15 0 0 81 2322N 2016 B 11/25 -12/01 475 974 475 28�1 452 1934 128 50 0 0 178 3922N 2016 B 12/02 -12/08 375 539 375 36�4 343 1597 62 53 0 0 115 3422N 2012 ALS 10/19 -10/25 275 498 275 34�1 261 1000 0 0 104 12 116 4422N 2013 ALS 10/18 -10/24 275 659 275 27�9 273 1016 0 0 138 10 148 5422N 2014 ALS 10/17 -10/23 275 739 275 27�1 268 917 0 0 152 13 165 6222N 2015 ALS 10/16 -10/22 275 842 275 24�5 266 954 0 0 122 9 131 4922N 2016 ALS 10/14 -10/20 275 947 275 20�2 267 1036 0 0 140 4 144 5422S 2012 B 11/30 -12/06 30 144 30 11�8 28 103 17 2 0 0 19 6822S 2013 B 11/29 -12/05 60 202 60 23�3 51 131 43 0 0 0 43 8422S 2014 B 11/28 -12/04 60 184 60 19�6 60 259 30 5 0 0 35 5822S 2015 B 11/27 -12/03 60 171 60 21�6 56 246 24 4 0 0 28 5022S 2016 B 11/25 -12/01 60 241 60 16�6 58 240 34 2 0 0 36 6222S 2012 ALS 10/19 -10/25 25 49 25 26�5 23 50 0 0 14 5 19 8322S 2013 ALS 10/18 -10/24 25 79 25 22�8 25 75 0 0 15 0 15 6022S 2014 ALS 10/17 -10/23 35 82 35 28 33 111 0 0 19 0 19 5822S 2015 ALS 10/16 -10/22 35 87 35 24�1 31 95 0 0 21 2 23 7422S 2016 ALS 10/14 -10/20 35 100 35 21 33 93 0 0 23 0 23 7023 2014 BE 9/26 -10/02 20 2058 20 0�9 20 82 16 0 0 0 16 80
BE = Early Bull, B = Bull, ALS = Antlerless, AE = Any Elk, CN = Camp Navajo, CH = CHAMP Hunt, DV = Disabled Veteran, WW = Wounded Warrior
Herd-Units: AM = Antelope Mountain Hunt Area in Unit 1, CC= Canyon Creek in Unit 23, CC = Coon Canyon and Flat Top Hunt Areas in Unit 1, CF = Coon Canyon and Flat Top Hunt Areas in Unit 1, DL= Dry Lake, ES (Unit 1) = Escudilla, FT = Flat Top Hunt Areas in Unit 1, HM = Hutch Mtn�, M=Martinez, ML = Marshall Lake, MM = Melatone Mesa, P = Peaks Hunt Area in Unit 7 East, RV = Round Valley, SM = East Sunset/West Sunset/Meteor Crater, ST = East Sunset/West Sunset, TT= Twin Arrows/Two Guns/Grapevine, VV = Verde Valley�

74 Hunt Arizona 2017
Elk Harvest Data
5-Year: 2012-2016 Harvest
Unit HerdUnit Year Hunt
Type Dates PermitsAuthorized
1st Choice Applicants
PermitsIssued
DrawOdds Hunters Hunter
DaysHarvest Hunt
SuccessBull Spike Cow Calf TotalGeneral23 2012 B 11/30 -12/06 200 786 200 14�1 183 853 74 2 0 0 76 4223 2013 B 11/29 -12/05 225 1024 225 13�9 215 954 92 8 0 0 100 4723 2014 B 11/28 -12/04 200 987 200 11�2 189 733 91 5 0 0 96 5123 2015 B 11/27 -12/03 200 1146 200 9�9 192 752 121 0 0 0 121 6323 2016 B 11/25 -12/01 150 1258 150 6�9 132 453 92 5 0 0 97 7323 2012 ALS 12/07 -12/13 200 180 200 36�7 187 739 0 0 69 5 74 4023 2013 ALS 12/06 -12/12 200 225 200 40�4 192 779 0 0 63 0 63 3323 2014 ALS 12/05 -12/11 200 278 200 33�8 193 753 0 0 87 4 91 4723 2015 ALS 12/04 -12/10 200 321 200 33�6 188 688 0 0 90 8 98 5223 2016 ALS 12/02 -12/08 200 333 200 35�4 182 689 0 0 68 8 76 4223N 2015 BE 9/25 -10/01 15 1759 15 0�8 15 56 14 0 0 0 14 9323N 2016 BE 9/23 -9/29 15 2217 15 0�6 15 58 12 0 0 0 12 8023N 2012 BE 9/28 -10/04 20 1297 20 1�4 19 76 19 0 0 0 19 10023N 2013 BE 9/27 -10/03 20 1368 20 1�2 20 63 19 0 0 0 19 9523N 2012 ALS 10/19 -10/25 25 117 25 12�8 24 75 0 0 15 0 15 6323N 2013 ALS 10/18 -10/24 50 194 50 18�6 46 146 0 0 27 2 29 6323N 2014 ALS 10/14 -10/23 50 251 50 13�9 48 173 0 0 17 0 17 3523N 2015 ALS 10/16 -10/22 50 206 50 14�1 48 170 0 0 27 2 29 6023N 2016 ALS 10/14 -10/20 50 262 50 15�6 46 198 0 0 22 0 22 4823S 2015 BE 9/25 -10/01 5 409 5 1�2 5 16 5 0 0 0 5 10023S 2016 BE 9/23 -9/29 5 532 5 0�9 5 22 5 0 0 0 5 10023S 2012 ALS 10/19 -10/25 25 22 25 31�8 23 88 0 0 10 0 10 4323S 2013 ALS 10/18 -10/24 25 28 25 39�3 25 68 0 0 13 3 16 6423S 2014 ALS 10/17 -10/23 50 67 50 26�9 46 202 0 0 12 0 12 2623S 2015 ALS 10/16 -10/22 50 73 50 34�2 46 175 0 0 15 0 15 3323S 2016 ALS 10/14 -10/20 50 61 50 36�1 46 213 0 0 13 0 13 2824A 2015 ALS 12/04 -12/11 5 1 5 100 5 18 0 0 3 0 3 6024A 2016 ALS 12/02 -12/09 5 10 5 30 5 26 0 0 0 0 0 024A 2012 AE 9/21 -9/27 5 32 5 12�5 5 17 0 0 0 0 0 024A 2013 AE 9/27 -10/06 5 35 5 14�3 5 45 0 0 0 0 0 024A 2014 AE 9/26 -10/05 5 54 5 9�3 5 24 4 0 0 0 4 8024A 2014 AE 10/10 -10/19 5 9 5 22�2 5 35 2 0 0 0 2 4024A 2015 AE 9/25 -10/04 5 49 5 10�2 5 35 4 0 0 0 4 8024A 2015 AE 10/09 -10/18 5 19 5 15�8 5 30 5 0 0 0 5 10024A 2016 AE 9/23 -10/02 5 74 5 5�4 5 48 2 0 0 0 2 4024A 2016 AE 10/07 -10/16 5 26 5 11�5 5 30 0 0 0 0 0 027 2016 BE 9/09 -9/15 40 3662 41 1�1 38 170 36 0 0 0 36 9527 2012 BE 9/28 -10/04 25 2046 25 1�1 25 105 13 3 0 0 16 6427 2014 BE 9/26 -10/02 40 3167 40 1�2 40 163 33 0 0 0 33 8327 2012 B 11/30 -12/06 400 918 400 19�2 383 1559 223 17 0 0 240 6327 2013 B 11/29 -12/05 400 1248 400 17�7 387 1399 237 17 0 0 254 6627 2014 B 11/28 -12/04 500 1471 500 15�4 489 2008 290 11 0 0 301 6227 2015 B 11/27 -12/03 400 1749 400 12�6 388 1427 217 20 0 0 237 6127 2016 B 11/25 -12/01 460 1744 460 12�9 440 1674 265 32 0 0 297 6827 2012 ALS 10/19 -10/25 305 533 305 28�3 292 1181 0 0 120 9 129 4427 2013 ALS 10/18 -10/24 300 651 300 28�1 283 1233 0 0 105 10 115 4127 2013 ALS 10/25 -10/31 200 65 200 50�8 186 856 0 0 64 6 70 3827 2014 ALS 10/17 -10/23 300 719 300 27�4 285 1170 0 0 104 6 110 3927 2014 ALS 10/24 -10/30 200 143 200 40�6 185 783 0 0 67 0 67 3627 2015 ALS 10/16 -10/22 375 869 375 25�5 354 1494 0 0 152 6 158 4527 2016 ALS 10/14 -10/20 350 951 350 24�2 321 1394 0 0 144 2 146 4527 2016 ALS 10/21 -10/27 150 73 150 52�1 150 750 0 0 75 0 75 5027 M 2012 ALS 8/10 -9/23 25 2 25 100 22 128 0 0 0 0 0 0
BE = Early Bull, B = Bull, ALS = Antlerless, AE = Any Elk, CN = Camp Navajo, CH = CHAMP Hunt, DV = Disabled Veteran, WW = Wounded Warrior
Herd-Units: AM = Antelope Mountain Hunt Area in Unit 1, CC= Canyon Creek in Unit 23, CC = Coon Canyon and Flat Top Hunt Areas in Unit 1, CF = Coon Canyon and Flat Top Hunt Areas in Unit 1, DL= Dry Lake, ES (Unit 1) = Escudilla, FT = Flat Top Hunt Areas in Unit 1, HM = Hutch Mtn�, M=Martinez, ML = Marshall Lake, MM = Melatone Mesa, P = Peaks Hunt Area in Unit 7 East, RV = Round Valley, SM = East Sunset/West Sunset/Meteor Crater, ST = East Sunset/West Sunset, TT= Twin Arrows/Two Guns/Grapevine, VV = Verde Valley�

Hunt Arizona 2017 75
Elk Harvest Data
5-Year: 2012-2016 Harvest
Unit HerdUnit Year Hunt
Type Dates PermitsAuthorized
1st Choice Applicants
PermitsIssued
DrawOdds Hunters Hunter
DaysHarvest Hunt
SuccessBull Spike Cow Calf TotalGeneral27/28 CC 2013 ALSS 8/09 -8/22 25 0 25 - 23 79 0 0 4 0 4 1727/28 CC 2014 ALS 8/08 -8/21 25 2 25 100 25 103 0 0 0 0 0 027S 2012 ALS 8/10 -9/23 50 4 50 100 45 216 0 0 11 0 11 2427S 2013 ALS 8/09 -8/22 25 3 25 100 25 103 0 0 3 0 3 1227S 2014 ALS 8/08 -8/21 25 4 25 100 22 144 0 0 8 0 8 3627S 2015 ALS 8/07 -8/20 25 8 25 100 21 50 0 0 9 5 14 6727S 2016 ALS 8/05 -8/18 25 13 25 92�3 23 100 0 0 5 0 5 2228/31/32 2012 AE 10/05 -11/01 10 24 10 33�3 8 32 2 0 0 0 2 2528/31/32 2013 AE 10/04 -10/31 10 25 10 36 8 25 5 0 0 0 5 6328/31/32 2014 AE 10/03 -10/30 10 3 10 33�3 10 25 10 0 0 0 10 10028/31/32 2015 AE 10/02 -10/29 10 23 10 8�7 8 28 3 0 0 0 3 3828/31/32 2016 AE 9/30 -10/27 10 22 10 27�3 10 36 2 0 0 0 2 20CN 2012 ALS 10/01 -10/07 5 2 5 0 5 12 0 0 2 0 2 40CN 2012 ALS 10/01 -10/07 2 7 2 28�6 2 2 0 0 2 0 2 100CN 2012 ALS 11/23 -12/13 35 9 35 100 33 165 0 0 18 0 18 55CN 2012 ALS 11/23 -12/13 5 2 5 100 3 8 0 0 2 0 2 67CN 2013 ALS 9/30 -10/06 5 1 5 0 5 9 0 0 2 1 3 60CN 2013 ALS 9/30 -10/06 2 5 2 40 2 4 0 0 2 0 2 100CN 2013 ALS 11/22 -12/12 35 21 35 100 32 152 0 0 15 0 15 47CN 2013 ALS 11/22 -12/12 5 15 5 33�3 5 47 0 0 2 0 2 40CN 2014 ALS 9/26 -10/02 12 36 12 25 11 35 0 0 5 0 5 45CN 2014 ALS 9/26 -10/02 6 16 6 31�3 5 23 0 0 0 0 0 0CN 2014 ALS 10/17 -10/23 15 14 15 35�7 12 51 0 0 9 0 9 75CN 2014 ALS 10/17 -10/23 7 8 7 25 7 49 0 0 0 0 0 0CN 2014 ALS 11/21 -12/14 8 10 8 40 8 43 0 0 5 0 5 63CN 2014 ALS 11/21 -12/14 2 0 2 - 1 1 0 0 1 0 1 100CN 2016 ALS 9/16 -9/22 2 8 2 - 2 2 0 0 2 0 2 100CN 2016 ALS 9/23 -9/29 12 13 12 38�5 10 38 0 0 9 0 9 90CN 2016 ALS 9/23 -9/29 6 8 6 50 6 15 0 0 6 0 6 100CN 2016 ALS 10/14 -10/20 15 21 15 42�9 15 68 0 0 5 2 7 47CN 2016 ALS 10/14 -10/20 7 3 7 66�7 7 20 0 0 4 0 4 57CN 2016 ALS 10/21 -10/27 5 0 5 - 5 30 0 0 0 0 0 0CN 2016 ALS 10/21 -10/27 5 2 5 100 5 25 0 0 0 0 0 0CN 2016 ALS 11/18 -12/11 10 9 10 55�6 8 35 0 0 5 0 5 63CN 2016 ALS 11/18 -12/11 5 5 5 100 4 38 0 0 3 0 3 75CN CN 2015 ALS 9/18 -9/24 2 10 15 50 13 56 0 0 4 0 4 31CN CN 2015 ALS 9/18 -9/24 15 2 2 50 2 12 0 0 0 0 0 0CN CN 2015 ALS 9/25 -10/01 12 19 12 26�3 12 40 0 0 8 0 8 67CN CN 2015 ALS 9/25 -10/01 6 14 6 14�3 6 24 0 0 3 0 3 50CN CN 2015 ALS 10/16 -10/22 15 8 15 75 15 68 0 0 0 0 0 0CN CN 2015 ALS 10/16 -10/22 7 5 7 60 7 35 0 0 0 0 0 0CN CN 2015 ALS 10/23 -10/29 5 3 5 100 5 10 0 0 0 0 0 0CN CN 2015 ALS 10/23 -10/29 5 3 5 100 0 0 0 0 0 0 0 -CN CN 2015 ALS 11/20 -12/13 10 16 10 50 8 45 0 0 3 3 6 75CN CN 2015 ALS 11/20 -12/13 5 5 5 20 5 40 0 0 3 2 5 100CN DV 2012 ALS 10/19 -10/25 20 4 20 75 16 76 0 0 7 0 7 44CN DV 2013 ALS 10/18 -10/24 20 8 20 75 18 77 0 0 7 0 7 39CN DV 2014 ALS 9/19 -9/25 15 16 15 50 15 45 0 0 9 0 9 60CN WW 2016 ALS 9/16 -9/22 15 8 15 75 12 60 0 0 8 0 8 67CN 2012 AE 10/01 -10/07 8 86 8 9�3 8 36 0 0 2 0 2 25CN 2012 AE 10/01 -10/07 3 52 3 5�8 3 3 0 0 0 3 3 100CN 2012 AE 10/26 -11/01 23 14 23 50 21 97 2 2 2 0 6 29
BE = Early Bull, B = Bull, ABE = Early Bull, B = Bull, ALS = Antlerless, AE = Any Elk, CN = Camp Navajo, CH = CHAMP Hunt, DV = Disabled Veteran, WW = Wounded Warrior
Herd-Units: AM = Antelope Mountain Hunt Area in Unit 1, CC= Canyon Creek in Unit 23, CC = Coon Canyon and Flat Top Hunt Areas in Unit 1, CF = Coon Canyon and Flat Top Hunt Areas in Unit 1, DL= Dry Lake, ES (Unit 1) = Escudilla, FT = Flat Top Hunt Areas in Unit 1, HM = Hutch Mtn�, M=Martinez, ML = Marshall Lake, MM = Melatone Mesa, P = Peaks Hunt Area in Unit 7 East, RV = Round Valley, SM = East Sunset/West Sunset/Meteor Crater, ST = East Sunset/West Sunset, TT= Twin Arrows/Two Guns/Grapevine, VV = Verde Valley�

76 Hunt Arizona 2017
Elk Harvest Data
5-Year: 2012-2016 Harvest
Unit HerdUnit Year Hunt
Type Dates PermitsAuthorized
1st Choice Applicants
PermitsIssued
DrawOdds Hunters Hunter
DaysHarvest Hunt
SuccessBull Spike Cow Calf TotalGeneralCN 2012 AE 10/26 -11/01 4 7 4 28�6 4 20 0 0 0 0 0 0CN 2013 AE 9/30 -10/06 8 80 8 8�8 8 26 2 2 2 0 6 75CN 2013 AE 9/30 -10/06 3 64 3 3�1 3 19 1 0 0 0 1 33CN 2013 AE 10/25 -10/31 23 20 23 50 20 82 3 5 3 0 11 55CN 2013 AE 10/25 -10/31 4 9 4 22�2 4 16 0 0 0 0 0 0CN 2014 AE 9/26 -10/02 4 68 4 5�9 4 8 4 0 0 0 4 100CN 2014 AE 9/26 -10/02 1 26 1 3�8 1 1 1 0 0 0 1 100CN 2014 AE 10/24 -10/30 3 7 3 28�6 0 0 0 0 0 0 0 -CN 2015 AE 9/25 -10/01 4 60 4 6�7 4 17 4 0 0 0 4 100CN 2015 AE 9/25 -10/01 2 28 2 7�1 2 6 0 0 0 0 0 0CN 2015 AE 10/23 -10/29 3 9 3 0 3 21 0 0 0 0 0 0CN 2016 AE 9/23 -9/29 4 54 4 7�4 4 12 2 0 0 0 2 50CN 2016 AE 9/23 -9/29 2 33 2 6�1 2 4 1 0 0 0 1 50CN 2016 AE 10/21 -10/27 3 14 3 14�3 3 10 0 1 1 0 2 67CN DV 2012 AE 10/19 -10/25 7 29 7 20�7 7 46 0 2 0 0 2 29CN DV 2013 AE 10/18 -10/24 7 31 7 19�4 7 32 1 0 0 0 1 14CN DV 2014 AE 9/12 -9/18 10 68 10 13�2 10 40 7 0 0 0 7 70CN DV 2015 AE 9/11-9/17 10 73 10 11 0 0 0 0 0 0 0 -CN DV 2015 AE 10/23 -10/29 4 6 4 0 0 0 0 0 0 0 0 -CN WW 2014 AE 9/12 -9/18 6 8 6 37�5 6 6 6 0 0 0 6 100CN WW 2014 AE 10/24 -10/30 6 0 6 - 6 30 3 0 0 0 3 50CN WW 2015 AE 9/11-9/17 6 7 6 57�1 6 18 6 0 0 0 6 100CN WW 2015 AE 10/23 -10/29 6 2 6 100 6 6 3 0 3 0 6 100CN WW 2016 AE 9/09 -9/15 16 82 16 15�9 15 55 9 1 3 0 13 87CN WW 2016 AE 10/21 -10/27 10 7 10 28�6 10 53 3 0 0 0 3 30Youth Only1/2C 2015 ALS 10/09 -10/15 175 1088 175 15�2 154 350 0 0 119 14 133 861/2C 2016 ALS 10/27 -10/13 175 930 175 16�3 175 350 0 0 175 0 175 1001/2C 2012 ALS 10/12 -10/18 150 778 150 17�4 148 398 0 0 108 14 122 821/2C 2013 ALS 10/11-10/17 175 821 175 18�8 175 456 0 0 124 6 130 741/2C 2014 ALS 10/10 -10/16 175 1039 175 15�5 175 350 0 0 0 0 0 03A/3C 2015 ALS 10/09 -10/15 200 763 200 20�8 195 605 0 0 131 15 146 753A/3C 2016 ALS 10/07 -10/13 200 653 200 22�4 0 0 0 0 0 0 0 -3A/3C 2012 ALS 10/12 -10/18 200 573 200 24�6 195 581 0 0 104 12 116 593A/3C 2013 ALS 10/11-10/17 200 613 200 26�1 197 643 0 0 93 11 104 533A/3C 2014 ALS 10/10 -10/16 200 692 200 22�4 0 0 0 0 0 0 0 -4A 2012 ALS 10/12 -10/18 97 309 96 26�9 89 238 0 0 57 7 64 724A (Hopi) 2012 2012 ALS 10/12 -10/18 6 6 6 100 5 9 0 0 5 0 5 1004A 2013 ALS 10/11-10/17 146 402 146 29�4 136 428 0 0 65 13 78 574A (Hopi) 2013 2013 ALS 10/11-10/17 9 8 9 100 9 27 0 0 5 0 5 564A 2014 ALS 10/10 -10/16 97 426 97 20�4 97 388 0 0 97 0 97 1004A (Hopi) 2014 2014 ALS 10/10 -10/16 9 7 6 85�7 0 0 0 0 0 0 0 -4A 2015 ALS 10/09 -10/15 97 303 97 23�8 92 208 0 0 74 5 79 864A (Hopi) 2015 2015 ALS 10/09 -10/15 6 5 6 100 0 0 0 0 0 0 0 -4A 2016 ALS 10/07 -10/13 97 362 97 19�6 97 388 0 0 97 0 97 1004A (Hopi) 2016 2016 ALS 10/07 -10/13 6 6 6 83�3 0 0 0 0 0 0 0 -5B/6A 2016 ALS 10/07 -10/13 450 2114 450 19�6 450 1170 0 0 360 0 360 806A 2015 ALS 10/09 -10/15 450 1994 450 21 445 1484 0 0 203 20 223 506A 2012 ALS 10/12 -10/18 500 1825 498 24�8 472 1551 0 0 216 42 258 556A 2013 ALS 10/11-10/17 500 1758 500 25�9 474 1460 0 0 217 51 268 576A 2014 ALS 10/10 -10/16 450 2075 450 20�5 450 2025 0 0 0 0 0 010 2015 ALS 10/09 -10/15 75 194 75 25�3 71 296 0 0 25 4 29 4110 2016 ALS 10/07 -10/13 75 214 75 20�6 75 375 0 0 0 0 0 022 2015 ALS 10/09 -10/15 150 293 150 33�8 144 431 0 0 94 0 94 65
BE = Early Bull, B = Bull, ALS = Antlerless, AE = Any Elk, CN = Camp Navajo, CH = CHAMP Hunt, DV = Disabled Veteran, WW = Wounded Warrior
Herd-Units: AM = Antelope Mountain Hunt Area in Unit 1, CC= Canyon Creek in Unit 23, CC = Coon Canyon and Flat Top Hunt Areas in Unit 1, CF = Coon Canyon and Flat Top Hunt Areas in Unit 1, DL= Dry Lake, ES (Unit 1) = Escudilla, FT = Flat Top Hunt Areas in Unit 1, HM = Hutch Mtn�, M=Martinez, ML = Marshall Lake, MM = Melatone Mesa, P = Peaks Hunt Area in Unit 7 East, RV = Round Valley, SM = East Sunset/West Sunset/Meteor Crater, ST = East Sunset/West Sunset, TT= Twin Arrows/Two Guns/Grapevine, VV = Verde Valley�

Hunt Arizona 2017 77
5-Year: 2012-2016 Harvest
Elk Harvest Data
Unit HerdUnit Year Hunt
Type Dates PermitsAuthorized
1st Choice Applicants
PermitsIssued
DrawOdds Hunters Hunter
DaysHarvest Hunt
SuccessBull Spike Cow Calf TotalGeneral22 2016 ALS 10/07 -10/13 150 347 150 25�1 0 0 0 0 0 0 0 -22 2012 ALS 11/09 -11/15 50 132 50 28�8 47 131 0 0 28 0 28 6022 2013 ALS 11/08 -11/14 100 243 100 27�6 100 368 0 0 39 0 39 3922 2014 ALS 11/07 -11/13 150 279 150 34�4 0 0 0 0 0 0 0 �23 2015 ALS 10/09 -10/15 65 200 65 25�5 65 254 0 0 41 6 47 7223 2016 ALS 10/07 -10/13 65 213 65 23�5 63 217 0 0 31 7 38 6023 2012 ALS 11/09 -11/15 30 76 30 28�9 30 65 0 0 20 2 22 7323 2013 ALS 11/08 -11/14 30 122 30 18�9 30 93 0 0 10 0 10 3323 2014 ALS 11/07 -11/13 65 153 65 30�1 0 0 0 0 0 0 0 -Muzzleloader1/2B/2C 2012 BE 9/28 -10/04 45 1536 45 2�1 44 171 35 0 0 0 35 801/2B/2C 2014 BE 9/26 -10/02 45 2029 45 2 44 162 38 0 0 0 38 861/2B/2C 2016 BE 9/23 -9/29 40 1938 40 1�7 40 216 30 0 0 0 30 753B 2012 BE 9/28 -10/04 25 367 25 3�8 25 92 22 0 0 0 22 883B 2012 BE 11/30 -12/06 200 231 200 37�2 185 920 55 13 0 0 68 373B 2013 BE 9/27 -10/03 25 504 25 3�2 25 106 18 0 0 0 18 723B 2013 BE 11/29 -12/05 200 244 200 38�9 193 1004 28 4 0 0 32 173B 2014 BE 9/26 -10/02 25 459 25 3�1 25 103 20 0 0 0 20 803B 2014 BE 11/28 -12/04 200 247 200 38�5 190 941 45 14 0 0 59 313B 2015 BE 9/25 -10/01 25 509 25 3�9 25 107 16 0 0 0 16 643B 2015 BE 11/27 -12/03 200 194 200 57�2 189 891 27 16 0 0 43 233B 2016 BE 9/23 -9/29 25 491 25 3�3 25 122 16 0 0 0 16 643B 2016 B 11/25 -12/01 200 201 200 45�3 191 919 48 24 0 0 72 383B 2012 ALS 12/14 -12/31 250 194 250 68�6 234 1250 0 0 95 17 112 483B 2013 ALS 12/13 -12/31 200 210 200 49 189 1171 0 0 36 0 36 193B 2014 ALS 12/12 -12/31 200 229 200 61�1 192 1294 0 0 70 10 80 423B 2015 ALS 12/11-12/31 200 235 200 56�2 195 1173 0 0 103 20 123 633B 2016 ALS 12/09 -12/31 200 306 200 46�7 188 1179 0 0 113 5 118 633BN 2013 ALS 8/02 -8/15 15 5 15 60 15 68 0 0 8 8 16 1073BN 2013 AE 10/04 -10/17 15 59 15 20�3 15 105 9 2 2 0 13 873BN 2015 ALS 7/31 -8/13 30 39 30 48�7 30 165 0 0 15 2 17 573BN 2016 ALS 7/29 -8/11 30 18 30 83�3 21 79 0 0 6 2 8 383BN 2014 ALS 8/01 -8/14 30 4 30 100 28 105 0 0 10 3 13 463BN 2015 AE 10/02 -10/15 20 105 20 9�5 20 76 12 0 0 0 12 603BN 2016 AE 9/30 -10/13 20 63 20 17�5 20 82 13 0 4 0 17 853BN 2014 AE 10/03 -10/16 20 60 20 20 0 0 0 0 0 0 0 -5B 2014 BE 9/26 -10/02 24 833 24 2 24 98 14 0 0 0 14 585BN (Hopi) 2014 B 9/26 -10/02 1 5 1 20 0 0 0 0 0 0 0 -6A 2012 BE 9/28 -10/04 50 1286 50 2�9 48 218 23 2 0 0 25 526A 2012 BE 11/16 -11/22 300 712 300 22�6 293 1415 80 12 0 0 92 316A 2013 BE 11/15 -11/21 300 1000 300 20�6 290 1401 59 4 0 0 63 226A 2014 BE 11/14 -11/20 300 922 300 23�8 287 1281 81 24 0 0 105 376A 2015 BE 11/13 -11/19 300 955 300 22�8 287 1183 115 13 0 0 128 456A 2016 B 11/11-11/17 300 877 300 23�7 281 1361 75 41 0 0 116 416A 2012 ALS 11/16 -11/22 75 100 75 29 72 318 0 0 20 2 22 316A 2013 ALS 11/15 -11/21 75 122 75 27 73 324 0 0 10 4 14 196A 2014 ALS 11/14 -11/20 75 86 75 37�2 75 317 0 0 15 0 15 206A 2015 ALS 11/13 -11/19 75 109 75 25�7 75 263 0 0 29 0 29 396A 2016 ALS 11/11-11/17 75 99 75 40�4 72 362 0 0 26 0 26 368 2016 BE 9/23 -9/29 25 813 25 2�3 25 107 20 0 0 0 20 808 2012 ALS 9/28 -10/04 120 347 120 20�5 116 426 0 0 60 3 63 548 2013 ALS 9/27 -10/03 150 376 150 27�7 140 593 0 0 67 7 74 538 2014 ALS 9/26 -10/02 175 407 175 25�6 172 630 0 0 93 5 98 578 2015 ALS 9/25 -10/01 150 464 150 22 146 571 0 0 54 14 68 47
BE = Early Bull, B = Bull, ALS = Antlerless, AE = Any Elk, CN = Camp Navajo, CH = CHAMP Hunt, DV = Disabled Veteran, WW = Wounded Warrior
Herd-Units: AM = Antelope Mountain Hunt Area in Unit 1, CC= Canyon Creek in Unit 23, CC = Coon Canyon and Flat Top Hunt Areas in Unit 1, CF = Coon Canyon and Flat Top Hunt Areas in Unit 1, DL= Dry Lake, ES (Unit 1) = Escudilla, FT = Flat Top Hunt Areas in Unit 1, HM = Hutch Mtn�, M=Martinez, ML = Marshall Lake, MM = Melatone Mesa, P = Peaks Hunt Area in Unit 7 East, RV = Round Valley, SM = East Sunset/West Sunset/Meteor Crater, ST = East Sunset/West Sunset, TT= Twin Arrows/Two Guns/Grapevine, VV = Verde Valley�
Youth Only

78 Hunt Arizona 2017
5-Year: 2012-2016 Harvest
Elk Harvest Data
Unit HerdUnit Year Hunt
Type Dates PermitsAuthorized
1st Choice Applicants
PermitsIssued
DrawOdds Hunters Hunter
DaysHarvest Hunt
SuccessBull Spike Cow Calf TotalGeneral8 2016 ALS 9/23 -9/29 150 354 150 21�8 146 569 0 0 72 3 75 519 2013 BE 9/27 -10/03 25 1828 25 1�3 25 102 20 0 0 0 20 809 2015 BE 9/11-9/17 25 2360 25 1�1 25 132 16 0 0 0 16 6410 2013 BE 11/08 -11/14 25 169 25 10�1 25 109 11 2 0 0 13 5210 2014 BE 11/07 -12/11 25 133 25 10�5 25 119 10 0 0 0 10 4010 2015 BE 11/06 -11/12 150 259 150 29�7 142 675 48 0 0 0 48 3410 2016 B 11/04 -11/10 75 204 75 15�2 71 383 21 0 0 0 21 3016A 2012 BE 9/28 -10/04 3 10 3 20 3 4 3 0 0 0 3 10016A 2013 BE 9/27 -10/03 3 17 3 11�8 3 15 0 0 0 0 0 016A 2014 BE 9/26 -10/02 3 25 3 4 0 0 0 0 0 0 0 -16A 2015 BE 9/25 -10/08 3 13 3 7�7 0 0 0 0 0 0 0 -16A 2016 BE 9/23 -10/06 3 18 3 16�7 3 12 3 0 0 0 3 10021 2012 BE 9/28 -10/04 5 85 5 2�4 5 23 4 0 0 0 4 8021 2013 BE 9/27 -10/03 5 75 5 4 5 16 3 0 0 0 3 6021 2014 BE 9/26 -10/02 5 111 5 2�7 5 33 2 0 0 0 2 4021 2015 BE 9/25 -10/01 10 104 10 3�8 8 28 8 0 0 0 8 10021 2016 BE 9/29 -9/29 10 78 10 10�3 10 35 8 0 0 0 8 8022S 2012 BE 9/28 -10/04 40 235 40 10�6 40 171 27 0 0 0 27 6822S 2013 BE 9/27 -10/03 50 333 50 11�1 50 194 40 0 0 0 40 8022S 2014 BE 9/26 -10/02 50 356 50 8�1 48 200 30 2 0 0 32 6722S 2015 BE 9/25 -10/01 50 380 50 8�2 50 215 32 0 0 0 32 6422S 2016 BE 9/23 -9/29 50 432 50 8�8 47 195 35 0 0 0 35 7427 2013 BE 9/27 -10/03 40 545 40 3�9 40 173 30 2 0 0 32 8027 2015 BE 9/25 -10/01 40 947 40 1�4 40 189 24 0 0 0 24 60CN 2012 ALS 10/12 -10/18 25 5 25 100 21 118 0 0 0 0 0 0CN 2012 ALS 10/12 -10/18 5 3 5 66�7 5 35 0 0 3 0 3 60CN 2013 ALS 10/11-10/17 25 6 25 100 23 77 0 0 11 0 11 48CN 2013 ALS 10/11-10/17 5 4 5 100 5 30 0 0 0 0 0 0CN 2014 ALS 10/10 -10/16 10 5 10 40 10 58 0 0 4 0 4 40CN 2014 ALS 10/10 -10/16 5 8 5 50 5 25 0 0 0 0 0 0CN 2014 ALS 10/10 -10/16 4 11 4 18�2 4 12 0 0 0 0 0 0CN 2015 ALS 10/09 -10/15 10 6 10 66�7 10 43 0 0 0 0 0 0CN 2015 ALS 10/09 -10/15 5 5 5 80 5 20 0 0 2 0 2 40CN 2016 ALS 10/07 -10/13 10 4 10 100 10 60 0 0 2 0 2 20CN 2016 ALS 10/07 -10/13 5 4 5 75 5 20 0 0 1 0 1 20CN 2012 AE 10/12 -10/18 10 15 10 26�7 8 32 0 0 0 0 0 0CN 2012 AE 10/12 -10/18 3 16 3 18�8 3 3 0 3 0 0 3 100CN 2013 AE 10/11-10/17 10 11 10 36�4 10 30 10 0 0 0 10 100CN 2013 AE 10/11-10/17 3 15 3 6�7 3 9 0 0 0 0 0 0CN 2014 AE 10/10 -10/16 1 2 1 0 0 0 0 0 0 0 0 -CN 2015 AE 10/09 -10/15 2 6 2 0 2 12 0 0 0 0 0 0CN 2016 AE 10/07 -10/13 4 4 4 50 4 24 0 0 0 0 0 0CN 2016 AE 10/07 -10/13 2 2 2 50 2 2 0 0 2 0 2 100CN WW 2015 AE 10/09 -10/15 4 12 4 8�3 0 0 0 0 0 0 0 -Archery1 CC 2012 ALS 9/28 -10/07 30 0 29 - 26 150 0 0 5 0 5 191 AM 2012 ALS 9/14 -9/23 10 2 10 100 0 0 0 0 0 0 0 -1 AM 2013 ALS 9/13 -9/22 10 0 10 - 10 42 0 0 0 0 0 01 AM 2014 ALS 9/05 -9/28 10 1 10 100 10 103 0 0 0 0 0 01 AM 2015 ALS 9/04 -9/27 10 0 10 - 0 0 0 0 0 0 0 -1 AM 2016 ALS 9/02 -9/25 10 0 10 - 10 68 0 0 0 0 0 01 CC 2012 ALS 8/03 -8/12 30 0 30 - 0 0 0 0 0 0 0 -1 CC 2012 ALS 9/07 -9/30 30 0 30 - 0 0 0 0 0 0 0 -1 CC 2012 ALS 10/05 -10/28 15 0 15 - 13 71 0 0 0 0 0 0
Muzzleloader
BE = Early Bull, B = Bull, ALS = Antlerless, AE = Any Elk, CN = Camp Navajo, CH = CHAMP Hunt, DV = Disabled Veteran, WW = Wounded Warrior
Herd-Units: AM = Antelope Mountain Hunt Area in Unit 1, CC= Canyon Creek in Unit 23, CC = Coon Canyon and Flat Top Hunt Areas in Unit 1, CF = Coon Canyon and Flat Top Hunt Areas in Unit 1, DL= Dry Lake, ES (Unit 1) = Escudilla, FT = Flat Top Hunt Areas in Unit 1, HM = Hutch Mtn�, M=Martinez, ML = Marshall Lake, MM = Melatone Mesa, P = Peaks Hunt Area in Unit 7 East, RV = Round Valley, SM = East Sunset/West Sunset/Meteor Crater, ST = East Sunset/West Sunset, TT= Twin Arrows/Two Guns/Grapevine, VV = Verde Valley�

Hunt Arizona 2017 79
5-Year: 2012-2016 Harvest
Elk Harvest Data
Unit HerdUnit Year Hunt
Type Dates PermitsAuthorized
1st Choice Applicants
PermitsIssued
DrawOdds Hunters Hunter
DaysHarvest Hunt
SuccessBull Spike Cow Calf TotalGeneral1 CC 2012 ALS 11/02 -11/11 15 0 9 - 0 0 0 0 0 0 0 -1 CC 2012 ALS 11/16 -11/25 15 1 7 100 5 18 0 0 0 0 0 01 CC 2012 ALS 11/30 -12/23 15 0 2 - 0 0 0 0 0 0 0 -1 CF 2013 ALS 8/02 -8/25 10 1 10 100 8 60 0 0 0 0 0 01 CF 2013 ALS 9/06 -9/29 10 0 10 - 10 73 0 0 0 2 2 201 CF 2013 ALS 10/04 -10/27 10 0 10 - 10 50 0 0 0 0 0 01 CF 2013 ALS 11/01 -11/24 10 0 10 - 0 0 0 0 0 0 0 -1 CF 2013 ALS 12/06 -12/29 10 0 10 - 0 0 0 0 0 0 0 -1 CF 2014 ALS 8/01 -8/31 5 1 5 100 5 30 0 0 0 0 0 01 CF 2014 ALS 9/05 -9/28 5 2 5 100 2 37 0 0 0 0 0 01 CF 2014 ALS 10/03 -10/26 5 0 5 - 5 18 0 0 2 2 4 801 CF 2014 ALS 10/31 -11/23 5 1 5 100 5 20 0 0 0 0 0 01 CF 2014 ALS 12/05 -12/28 5 0 5 - 5 13 0 0 0 0 0 01 CF 2015 ALS 7/31 -8/30 5 0 5 - 0 0 0 0 0 0 0 -1 CF 2015 ALS 9/04 -9/27 5 0 5 - 5 90 0 0 0 0 0 01 CF 2015 ALS 10/02 -10/25 5 0 5 - 5 18 0 0 2 0 2 401 CF 2015 ALS 11/06 -11/29 5 0 5 - 0 0 0 0 0 0 0 -1 CF 2015 ALS 12/04 -12/27 5 0 5 - 5 20 0 0 0 0 0 01 CF 2016 ALS 7/29 -8/28 5 1 5 100 0 0 0 0 0 0 0 -1 CF 2016 ALS 9/02 -9/25 5 3 5 100 5 15 0 0 0 0 0 01 CF 2016 ALS 9/30 -10/23 5 0 5 - 5 70 0 0 3 0 3 601 CF 2016 ALS 11/04 -11/27 5 0 5 - 0 0 0 0 0 0 0 -1 CF 2016 ALS 12/02 -12/25 5 0 5 - 0 0 0 0 0 0 0 -1 FT 2012 ALS 9/14 -9/23 5 0 5 - 0 0 0 0 0 0 0 -1 FT 2012 ALS 11/09 -11/18 5 0 2 - 0 0 0 0 0 0 0 -1 FT 2012 ALS 11/23 -12/02 5 0 0 - 0 0 0 0 0 0 0 -1/2B/2C 2012 B 9/14 -9/27 245 2321 245 8�3 239 1792 142 2 0 0 144 601/2B/2C 2012 B 11/16 -11/29 25 35 25 22�9 23 179 0 0 0 0 0 01/2B/2C 2013 B 9/13 -9/26 350 3179 350 8�3 346 3078 163 6 0 0 169 491/2B/2C 2013 B 11/15 -11/28 25 36 25 25 23 138 5 0 0 0 5 221/2B/2C 2014 B 9/12 -9/25 300 3247 302 7�4 298 2660 143 8 0 0 151 511/2B/2C 2014 B 11/14 -11/27 25 48 25 25 23 188 5 0 0 0 5 221/2B/2C 2015 B 9/11-9/24 300 3547 300 6�3 296 2702 104 2 0 0 106 361/2B/2C 2015 B 11/06 -11/19 30 44 30 34�1 28 203 5 0 0 0 5 181/2B/2C 2016 B 9/09 -9/22 300 3500 300 6�9 284 2531 116 2 0 0 118 421/2B/2C 2016 B 11/04 -11/17 30 60 30 15 26 169 8 0 0 0 8 311/2B/2C 2012 ALS 9/14 -9/27 75 62 75 32�3 68 453 0 0 14 3 17 251/2B/2C 2013 ALS 9/13 -9/26 75 77 75 27�3 70 490 0 0 8 3 11 161/2B/2C 2014 ALS 9/12 -9/25 75 80 75 36�3 69 480 0 0 16 0 16 231/2B/2C 2015 ALS 9/11-9/24 75 94 75 35�1 65 489 0 0 27 5 32 491/2B/2C 2016 ALS 9/09 -9/22 75 80 75 37�5 69 556 0 0 17 0 17 253A/3C 2012 B 9/14 -9/27 125 1065 125 8�1 125 948 65 0 0 0 65 523A/3C 2012 B 11/16 -11/29 25 15 25 73�3 23 157 0 0 0 0 0 03A/3C 2013 B 9/13 -9/26 150 1085 150 9�3 150 1194 87 0 0 0 87 583A/3C 2013 B 11/15 -11/28 25 22 25 36�4 19 103 0 6 0 0 6 323A/3C 2014 B 9/12 -9/25 150 1163 150 9�2 142 1272 72 4 0 0 76 543A/3C 2014 B 11/14 -11/27 25 34 25 35�3 21 171 0 0 0 0 0 03A/3C 2015 B 9/11-9/24 125 1359 125 6 121 1107 64 0 0 0 64 533A/3C 2015 B 11/06 -11/19 30 26 30 53�8 30 240 4 2 0 0 6 203A/3C 2016 B 9/09 -9/22 125 1441 125 5�9 123 1155 53 4 0 0 57 463A/3C 2016 B 11/04 -11/17 30 15 30 60 30 263 4 0 0 0 4 133A/3C 2012 ALS 9/14 -9/27 50 44 50 29�5 47 320 0 0 13 0 13 283A/3C 2013 ALS 9/13 -9/26 50 45 50 42�2 43 268 0 0 18 0 18 423A/3C 2014 ALS 9/12 -9/25 50 61 50 41 45 248 0 0 10 3 13 29
Muzzleloader
BE = Early Bull, B = Bull, ALS = Antlerless, AE = Any Elk, CN = Camp Navajo, CH = CHAMP Hunt, DV = Disabled Veteran, WW = Wounded Warrior
Herd-Units: AM = Antelope Mountain Hunt Area in Unit 1, CC= Canyon Creek in Unit 23, CC = Coon Canyon and Flat Top Hunt Areas in Unit 1, CF = Coon Canyon and Flat Top Hunt Areas in Unit 1, DL= Dry Lake, ES (Unit 1) = Escudilla, FT = Flat Top Hunt Areas in Unit 1, HM = Hutch Mtn�, M=Martinez, ML = Marshall Lake, MM = Melatone Mesa, P = Peaks Hunt Area in Unit 7 East, RV = Round Valley, SM = East Sunset/West Sunset/Meteor Crater, ST = East Sunset/West Sunset, TT= Twin Arrows/Two Guns/Grapevine, VV = Verde Valley�
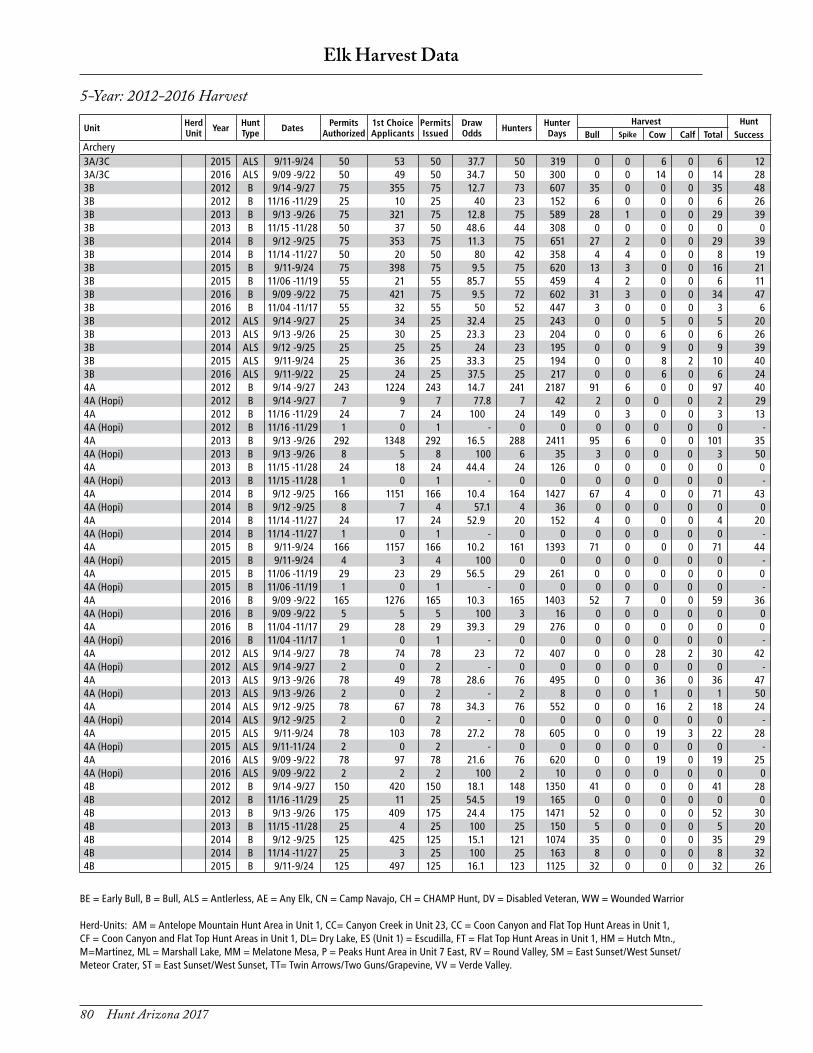
80 Hunt Arizona 2017
5-Year: 2012-2016 Harvest
Elk Harvest Data
Unit HerdUnit Year Hunt
Type Dates PermitsAuthorized
1st Choice Applicants
PermitsIssued
DrawOdds Hunters Hunter
DaysHarvest Hunt
SuccessBull Spike Cow Calf TotalGeneral3A/3C 2015 ALS 9/11-9/24 50 53 50 37�7 50 319 0 0 6 0 6 123A/3C 2016 ALS 9/09 -9/22 50 49 50 34�7 50 300 0 0 14 0 14 283B 2012 B 9/14 -9/27 75 355 75 12�7 73 607 35 0 0 0 35 483B 2012 B 11/16 -11/29 25 10 25 40 23 152 6 0 0 0 6 263B 2013 B 9/13 -9/26 75 321 75 12�8 75 589 28 1 0 0 29 393B 2013 B 11/15 -11/28 50 37 50 48�6 44 308 0 0 0 0 0 03B 2014 B 9/12 -9/25 75 353 75 11�3 75 651 27 2 0 0 29 393B 2014 B 11/14 -11/27 50 20 50 80 42 358 4 4 0 0 8 193B 2015 B 9/11-9/24 75 398 75 9�5 75 620 13 3 0 0 16 213B 2015 B 11/06 -11/19 55 21 55 85�7 55 459 4 2 0 0 6 113B 2016 B 9/09 -9/22 75 421 75 9�5 72 602 31 3 0 0 34 473B 2016 B 11/04 -11/17 55 32 55 50 52 447 3 0 0 0 3 63B 2012 ALS 9/14 -9/27 25 34 25 32�4 25 243 0 0 5 0 5 203B 2013 ALS 9/13 -9/26 25 30 25 23�3 23 204 0 0 6 0 6 263B 2014 ALS 9/12 -9/25 25 25 25 24 23 195 0 0 9 0 9 393B 2015 ALS 9/11-9/24 25 36 25 33�3 25 194 0 0 8 2 10 403B 2016 ALS 9/11-9/22 25 24 25 37�5 25 217 0 0 6 0 6 244A 2012 B 9/14 -9/27 243 1224 243 14�7 241 2187 91 6 0 0 97 404A (Hopi) 2012 B 9/14 -9/27 7 9 7 77�8 7 42 2 0 0 0 2 294A 2012 B 11/16 -11/29 24 7 24 100 24 149 0 3 0 0 3 134A (Hopi) 2012 B 11/16 -11/29 1 0 1 - 0 0 0 0 0 0 0 -4A 2013 B 9/13 -9/26 292 1348 292 16�5 288 2411 95 6 0 0 101 354A (Hopi) 2013 B 9/13 -9/26 8 5 8 100 6 35 3 0 0 0 3 504A 2013 B 11/15 -11/28 24 18 24 44�4 24 126 0 0 0 0 0 04A (Hopi) 2013 B 11/15 -11/28 1 0 1 - 0 0 0 0 0 0 0 -4A 2014 B 9/12 -9/25 166 1151 166 10�4 164 1427 67 4 0 0 71 434A (Hopi) 2014 B 9/12 -9/25 8 7 4 57�1 4 36 0 0 0 0 0 04A 2014 B 11/14 -11/27 24 17 24 52�9 20 152 4 0 0 0 4 204A (Hopi) 2014 B 11/14 -11/27 1 0 1 - 0 0 0 0 0 0 0 -4A 2015 B 9/11-9/24 166 1157 166 10�2 161 1393 71 0 0 0 71 444A (Hopi) 2015 B 9/11-9/24 4 3 4 100 0 0 0 0 0 0 0 -4A 2015 B 11/06 -11/19 29 23 29 56�5 29 261 0 0 0 0 0 04A (Hopi) 2015 B 11/06 -11/19 1 0 1 - 0 0 0 0 0 0 0 -4A 2016 B 9/09 -9/22 165 1276 165 10�3 165 1403 52 7 0 0 59 364A (Hopi) 2016 B 9/09 -9/22 5 5 5 100 3 16 0 0 0 0 0 04A 2016 B 11/04 -11/17 29 28 29 39�3 29 276 0 0 0 0 0 04A (Hopi) 2016 B 11/04 -11/17 1 0 1 - 0 0 0 0 0 0 0 -4A 2012 ALS 9/14 -9/27 78 74 78 23 72 407 0 0 28 2 30 424A (Hopi) 2012 ALS 9/14 -9/27 2 0 2 - 0 0 0 0 0 0 0 -4A 2013 ALS 9/13 -9/26 78 49 78 28�6 76 495 0 0 36 0 36 474A (Hopi) 2013 ALS 9/13 -9/26 2 0 2 - 2 8 0 0 1 0 1 504A 2014 ALS 9/12 -9/25 78 67 78 34�3 76 552 0 0 16 2 18 244A (Hopi) 2014 ALS 9/12 -9/25 2 0 2 - 0 0 0 0 0 0 0 -4A 2015 ALS 9/11-9/24 78 103 78 27�2 78 605 0 0 19 3 22 284A (Hopi) 2015 ALS 9/11-11/24 2 0 2 - 0 0 0 0 0 0 0 -4A 2016 ALS 9/09 -9/22 78 97 78 21�6 76 620 0 0 19 0 19 254A (Hopi) 2016 ALS 9/09 -9/22 2 2 2 100 2 10 0 0 0 0 0 04B 2012 B 9/14 -9/27 150 420 150 18�1 148 1350 41 0 0 0 41 284B 2012 B 11/16 -11/29 25 11 25 54�5 19 165 0 0 0 0 0 04B 2013 B 9/13 -9/26 175 409 175 24�4 175 1471 52 0 0 0 52 304B 2013 B 11/15 -11/28 25 4 25 100 25 150 5 0 0 0 5 204B 2014 B 9/12 -9/25 125 425 125 15�1 121 1074 35 0 0 0 35 294B 2014 B 11/14 -11/27 25 3 25 100 25 163 8 0 0 0 8 324B 2015 B 9/11-9/24 125 497 125 16�1 123 1125 32 0 0 0 32 26
Archery
BE = Early Bull, B = Bull, ALS = Antlerless, AE = Any Elk, CN = Camp Navajo, CH = CHAMP Hunt, DV = Disabled Veteran, WW = Wounded Warrior
Herd-Units: AM = Antelope Mountain Hunt Area in Unit 1, CC= Canyon Creek in Unit 23, CC = Coon Canyon and Flat Top Hunt Areas in Unit 1, CF = Coon Canyon and Flat Top Hunt Areas in Unit 1, DL= Dry Lake, ES (Unit 1) = Escudilla, FT = Flat Top Hunt Areas in Unit 1, HM = Hutch Mtn�, M=Martinez, ML = Marshall Lake, MM = Melatone Mesa, P = Peaks Hunt Area in Unit 7 East, RV = Round Valley, SM = East Sunset/West Sunset/Meteor Crater, ST = East Sunset/West Sunset, TT= Twin Arrows/Two Guns/Grapevine, VV = Verde Valley�
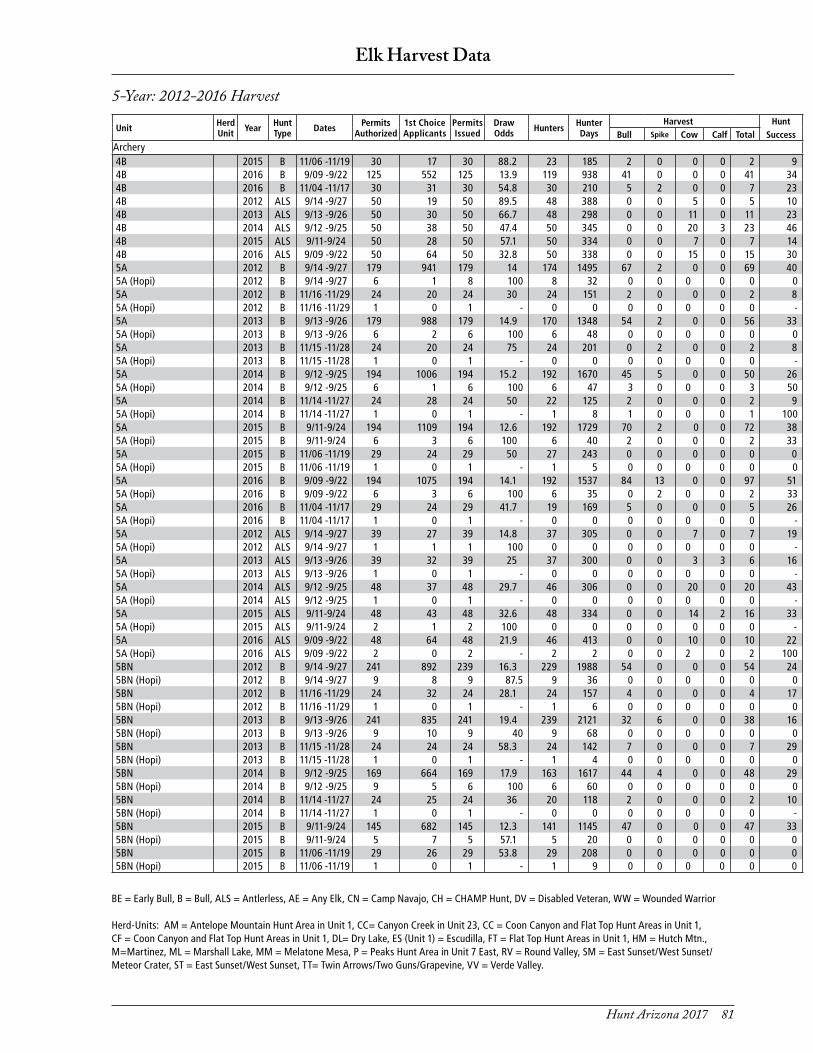
Hunt Arizona 2017 81
Elk Harvest Data
5-Year: 2012-2016 Harvest
Unit HerdUnit Year Hunt
Type Dates PermitsAuthorized
1st Choice Applicants
PermitsIssued
DrawOdds Hunters Hunter
DaysHarvest Hunt
SuccessBull Spike Cow Calf TotalGeneral4B 2015 B 11/06 -11/19 30 17 30 88�2 23 185 2 0 0 0 2 94B 2016 B 9/09 -9/22 125 552 125 13�9 119 938 41 0 0 0 41 344B 2016 B 11/04 -11/17 30 31 30 54�8 30 210 5 2 0 0 7 234B 2012 ALS 9/14 -9/27 50 19 50 89�5 48 388 0 0 5 0 5 104B 2013 ALS 9/13 -9/26 50 30 50 66�7 48 298 0 0 11 0 11 234B 2014 ALS 9/12 -9/25 50 38 50 47�4 50 345 0 0 20 3 23 464B 2015 ALS 9/11-9/24 50 28 50 57�1 50 334 0 0 7 0 7 144B 2016 ALS 9/09 -9/22 50 64 50 32�8 50 338 0 0 15 0 15 305A 2012 B 9/14 -9/27 179 941 179 14 174 1495 67 2 0 0 69 405A (Hopi) 2012 B 9/14 -9/27 6 1 8 100 8 32 0 0 0 0 0 05A 2012 B 11/16 -11/29 24 20 24 30 24 151 2 0 0 0 2 85A (Hopi) 2012 B 11/16 -11/29 1 0 1 - 0 0 0 0 0 0 0 -5A 2013 B 9/13 -9/26 179 988 179 14�9 170 1348 54 2 0 0 56 335A (Hopi) 2013 B 9/13 -9/26 6 2 6 100 6 48 0 0 0 0 0 05A 2013 B 11/15 -11/28 24 20 24 75 24 201 0 2 0 0 2 85A (Hopi) 2013 B 11/15 -11/28 1 0 1 - 0 0 0 0 0 0 0 -5A 2014 B 9/12 -9/25 194 1006 194 15�2 192 1670 45 5 0 0 50 265A (Hopi) 2014 B 9/12 -9/25 6 1 6 100 6 47 3 0 0 0 3 505A 2014 B 11/14 -11/27 24 28 24 50 22 125 2 0 0 0 2 95A (Hopi) 2014 B 11/14 -11/27 1 0 1 - 1 8 1 0 0 0 1 1005A 2015 B 9/11-9/24 194 1109 194 12�6 192 1729 70 2 0 0 72 385A (Hopi) 2015 B 9/11-9/24 6 3 6 100 6 40 2 0 0 0 2 335A 2015 B 11/06 -11/19 29 24 29 50 27 243 0 0 0 0 0 05A (Hopi) 2015 B 11/06 -11/19 1 0 1 - 1 5 0 0 0 0 0 05A 2016 B 9/09 -9/22 194 1075 194 14�1 192 1537 84 13 0 0 97 515A (Hopi) 2016 B 9/09 -9/22 6 3 6 100 6 35 0 2 0 0 2 335A 2016 B 11/04 -11/17 29 24 29 41�7 19 169 5 0 0 0 5 265A (Hopi) 2016 B 11/04 -11/17 1 0 1 - 0 0 0 0 0 0 0 -5A 2012 ALS 9/14 -9/27 39 27 39 14�8 37 305 0 0 7 0 7 195A (Hopi) 2012 ALS 9/14 -9/27 1 1 1 100 0 0 0 0 0 0 0 -5A 2013 ALS 9/13 -9/26 39 32 39 25 37 300 0 0 3 3 6 165A (Hopi) 2013 ALS 9/13 -9/26 1 0 1 - 0 0 0 0 0 0 0 -5A 2014 ALS 9/12 -9/25 48 37 48 29�7 46 306 0 0 20 0 20 435A (Hopi) 2014 ALS 9/12 -9/25 1 0 1 - 0 0 0 0 0 0 0 -5A 2015 ALS 9/11-9/24 48 43 48 32�6 48 334 0 0 14 2 16 335A (Hopi) 2015 ALS 9/11-9/24 2 1 2 100 0 0 0 0 0 0 0 -5A 2016 ALS 9/09 -9/22 48 64 48 21�9 46 413 0 0 10 0 10 225A (Hopi) 2016 ALS 9/09 -9/22 2 0 2 - 2 2 0 0 2 0 2 1005BN 2012 B 9/14 -9/27 241 892 239 16�3 229 1988 54 0 0 0 54 245BN (Hopi) 2012 B 9/14 -9/27 9 8 9 87�5 9 36 0 0 0 0 0 05BN 2012 B 11/16 -11/29 24 32 24 28�1 24 157 4 0 0 0 4 175BN (Hopi) 2012 B 11/16 -11/29 1 0 1 - 1 6 0 0 0 0 0 05BN 2013 B 9/13 -9/26 241 835 241 19�4 239 2121 32 6 0 0 38 165BN (Hopi) 2013 B 9/13 -9/26 9 10 9 40 9 68 0 0 0 0 0 05BN 2013 B 11/15 -11/28 24 24 24 58�3 24 142 7 0 0 0 7 295BN (Hopi) 2013 B 11/15 -11/28 1 0 1 - 1 4 0 0 0 0 0 05BN 2014 B 9/12 -9/25 169 664 169 17�9 163 1617 44 4 0 0 48 295BN (Hopi) 2014 B 9/12 -9/25 9 5 6 100 6 60 0 0 0 0 0 05BN 2014 B 11/14 -11/27 24 25 24 36 20 118 2 0 0 0 2 105BN (Hopi) 2014 B 11/14 -11/27 1 0 1 - 0 0 0 0 0 0 0 -5BN 2015 B 9/11-9/24 145 682 145 12�3 141 1145 47 0 0 0 47 335BN (Hopi) 2015 B 9/11-9/24 5 7 5 57�1 5 20 0 0 0 0 0 05BN 2015 B 11/06 -11/19 29 26 29 53�8 29 208 0 0 0 0 0 05BN (Hopi) 2015 B 11/06 -11/19 1 0 1 - 1 9 0 0 0 0 0 0
Archery
BE = Early Bull, B = Bull, ALS = Antlerless, AE = Any Elk, CN = Camp Navajo, CH = CHAMP Hunt, DV = Disabled Veteran, WW = Wounded Warrior
Herd-Units: AM = Antelope Mountain Hunt Area in Unit 1, CC= Canyon Creek in Unit 23, CC = Coon Canyon and Flat Top Hunt Areas in Unit 1, CF = Coon Canyon and Flat Top Hunt Areas in Unit 1, DL= Dry Lake, ES (Unit 1) = Escudilla, FT = Flat Top Hunt Areas in Unit 1, HM = Hutch Mtn�, M=Martinez, ML = Marshall Lake, MM = Melatone Mesa, P = Peaks Hunt Area in Unit 7 East, RV = Round Valley, SM = East Sunset/West Sunset/Meteor Crater, ST = East Sunset/West Sunset, TT= Twin Arrows/Two Guns/Grapevine, VV = Verde Valley�
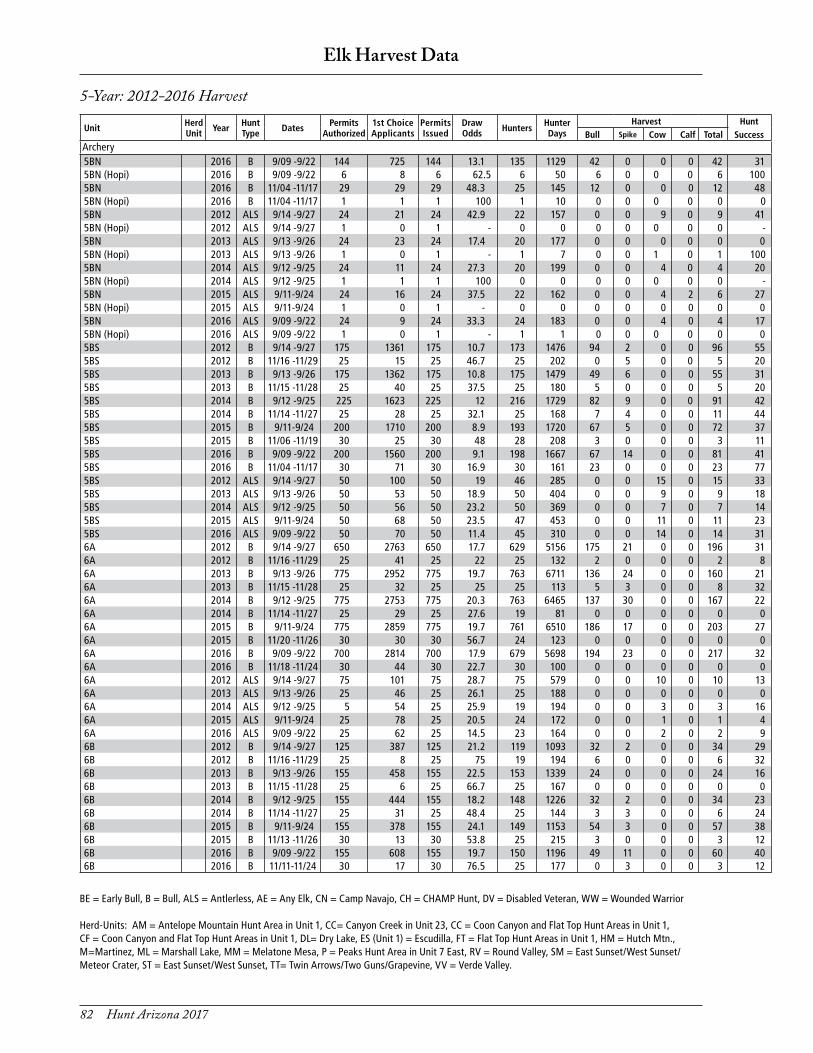
82 Hunt Arizona 2017
Elk Harvest Data
5-Year: 2012-2016 Harvest
Unit HerdUnit Year Hunt
Type Dates PermitsAuthorized
1st Choice Applicants
PermitsIssued
DrawOdds Hunters Hunter
DaysHarvest Hunt
SuccessBull Spike Cow Calf TotalGeneral5BN 2016 B 9/09 -9/22 144 725 144 13�1 135 1129 42 0 0 0 42 315BN (Hopi) 2016 B 9/09 -9/22 6 8 6 62�5 6 50 6 0 0 0 6 1005BN 2016 B 11/04 -11/17 29 29 29 48�3 25 145 12 0 0 0 12 485BN (Hopi) 2016 B 11/04 -11/17 1 1 1 100 1 10 0 0 0 0 0 05BN 2012 ALS 9/14 -9/27 24 21 24 42�9 22 157 0 0 9 0 9 415BN (Hopi) 2012 ALS 9/14 -9/27 1 0 1 - 0 0 0 0 0 0 0 -5BN 2013 ALS 9/13 -9/26 24 23 24 17�4 20 177 0 0 0 0 0 05BN (Hopi) 2013 ALS 9/13 -9/26 1 0 1 - 1 7 0 0 1 0 1 1005BN 2014 ALS 9/12 -9/25 24 11 24 27�3 20 199 0 0 4 0 4 205BN (Hopi) 2014 ALS 9/12 -9/25 1 1 1 100 0 0 0 0 0 0 0 -5BN 2015 ALS 9/11-9/24 24 16 24 37�5 22 162 0 0 4 2 6 275BN (Hopi) 2015 ALS 9/11-9/24 1 0 1 - 0 0 0 0 0 0 0 05BN 2016 ALS 9/09 -9/22 24 9 24 33�3 24 183 0 0 4 0 4 175BN (Hopi) 2016 ALS 9/09 -9/22 1 0 1 - 1 1 0 0 0 0 0 05BS 2012 B 9/14 -9/27 175 1361 175 10�7 173 1476 94 2 0 0 96 555BS 2012 B 11/16 -11/29 25 15 25 46�7 25 202 0 5 0 0 5 205BS 2013 B 9/13 -9/26 175 1362 175 10�8 175 1479 49 6 0 0 55 315BS 2013 B 11/15 -11/28 25 40 25 37�5 25 180 5 0 0 0 5 205BS 2014 B 9/12 -9/25 225 1623 225 12 216 1729 82 9 0 0 91 425BS 2014 B 11/14 -11/27 25 28 25 32�1 25 168 7 4 0 0 11 445BS 2015 B 9/11-9/24 200 1710 200 8�9 193 1720 67 5 0 0 72 375BS 2015 B 11/06 -11/19 30 25 30 48 28 208 3 0 0 0 3 115BS 2016 B 9/09 -9/22 200 1560 200 9�1 198 1667 67 14 0 0 81 415BS 2016 B 11/04 -11/17 30 71 30 16�9 30 161 23 0 0 0 23 775BS 2012 ALS 9/14 -9/27 50 100 50 19 46 285 0 0 15 0 15 335BS 2013 ALS 9/13 -9/26 50 53 50 18�9 50 404 0 0 9 0 9 185BS 2014 ALS 9/12 -9/25 50 56 50 23�2 50 369 0 0 7 0 7 145BS 2015 ALS 9/11-9/24 50 68 50 23�5 47 453 0 0 11 0 11 235BS 2016 ALS 9/09 -9/22 50 70 50 11�4 45 310 0 0 14 0 14 316A 2012 B 9/14 -9/27 650 2763 650 17�7 629 5156 175 21 0 0 196 316A 2012 B 11/16 -11/29 25 41 25 22 25 132 2 0 0 0 2 86A 2013 B 9/13 -9/26 775 2952 775 19�7 763 6711 136 24 0 0 160 216A 2013 B 11/15 -11/28 25 32 25 25 25 113 5 3 0 0 8 326A 2014 B 9/12 -9/25 775 2753 775 20�3 763 6465 137 30 0 0 167 226A 2014 B 11/14 -11/27 25 29 25 27�6 19 81 0 0 0 0 0 06A 2015 B 9/11-9/24 775 2859 775 19�7 761 6510 186 17 0 0 203 276A 2015 B 11/20 -11/26 30 30 30 56�7 24 123 0 0 0 0 0 06A 2016 B 9/09 -9/22 700 2814 700 17�9 679 5698 194 23 0 0 217 326A 2016 B 11/18 -11/24 30 44 30 22�7 30 100 0 0 0 0 0 06A 2012 ALS 9/14 -9/27 75 101 75 28�7 75 579 0 0 10 0 10 136A 2013 ALS 9/13 -9/26 25 46 25 26�1 25 188 0 0 0 0 0 06A 2014 ALS 9/12 -9/25 5 54 25 25�9 19 194 0 0 3 0 3 166A 2015 ALS 9/11-9/24 25 78 25 20�5 24 172 0 0 1 0 1 46A 2016 ALS 9/09 -9/22 25 62 25 14�5 23 164 0 0 2 0 2 96B 2012 B 9/14 -9/27 125 387 125 21�2 119 1093 32 2 0 0 34 296B 2012 B 11/16 -11/29 25 8 25 75 19 194 6 0 0 0 6 326B 2013 B 9/13 -9/26 155 458 155 22�5 153 1339 24 0 0 0 24 166B 2013 B 11/15 -11/28 25 6 25 66�7 25 167 0 0 0 0 0 06B 2014 B 9/12 -9/25 155 444 155 18�2 148 1226 32 2 0 0 34 236B 2014 B 11/14 -11/27 25 31 25 48�4 25 144 3 3 0 0 6 246B 2015 B 9/11-9/24 155 378 155 24�1 149 1153 54 3 0 0 57 386B 2015 B 11/13 -11/26 30 13 30 53�8 25 215 3 0 0 0 3 126B 2016 B 9/09 -9/22 155 608 155 19�7 150 1196 49 11 0 0 60 406B 2016 B 11/11-11/24 30 17 30 76�5 25 177 0 3 0 0 3 12
Archery
BE = Early Bull, B = Bull, ALS = Antlerless, AE = Any Elk, CN = Camp Navajo, CH = CHAMP Hunt, DV = Disabled Veteran, WW = Wounded Warrior
Herd-Units: AM = Antelope Mountain Hunt Area in Unit 1, CC= Canyon Creek in Unit 23, CC = Coon Canyon and Flat Top Hunt Areas in Unit 1, CF = Coon Canyon and Flat Top Hunt Areas in Unit 1, DL= Dry Lake, ES (Unit 1) = Escudilla, FT = Flat Top Hunt Areas in Unit 1, HM = Hutch Mtn�, M=Martinez, ML = Marshall Lake, MM = Melatone Mesa, P = Peaks Hunt Area in Unit 7 East, RV = Round Valley, SM = East Sunset/West Sunset/Meteor Crater, ST = East Sunset/West Sunset, TT= Twin Arrows/Two Guns/Grapevine, VV = Verde Valley�

Hunt Arizona 2017 83
Elk Harvest Data
5-Year: 2012-2016 Harvest
Unit HerdUnit Year Hunt
Type Dates PermitsAuthorized
1st Choice Applicants
PermitsIssued
DrawOdds Hunters Hunter
DaysHarvest Hunt
SuccessBull Spike Cow Calf TotalGeneral6B 2012 ALS 9/14 -9/27 50 14 50 64�3 50 306 0 0 22 3 25 506B 2013 ALS 9/13 -9/26 75 33 75 24�2 66 484 0 0 6 4 10 156B 2014 ALS 9/12 -9/25 75 42 75 40�5 70 496 0 0 11 0 11 166B 2015 ALS 9/11-9/24 75 32 75 59�4 73 616 0 0 9 5 14 196B 2016 ALS 9/09 -9/22 75 34 75 44�1 73 491 0 0 18 0 18 257E 2012 B 9/14 -9/27 110 333 110 20�1 105 892 34 2 0 0 36 347E 2012 B 11/16 -11/29 25 6 25 100 23 183 5 0 0 0 5 227E 2013 B 9/13 -9/26 125 383 125 18�8 121 1140 35 2 0 0 37 317E 2013 B 11/15 -11/28 25 15 25 86�7 23 190 5 0 0 0 5 227E 2014 B 9/12 -9/25 125 415 125 23�9 121 1168 22 9 0 0 31 267E 2014 B 11/14 -11/27 25 15 25 60 25 154 8 0 0 0 8 327E 2015 B 9/11-9/24 150 448 150 20�3 150 1278 51 5 0 0 56 377E 2015 B 11/06 -11/19 55 17 55 100 53 363 13 0 0 0 13 257E 2016 B 9/09 -9/22 150 355 150 19�7 148 1265 21 6 0 0 27 187E 2016 B 11/04 -11/17 55 43 55 69�8 55 380 9 5 0 0 14 257E 2012 ALS 9/14 -9/27 50 29 50 55�2 50 357 0 0 12 0 12 247E 2013 ALS 9/13 -9/26 55 23 55 78�3 51 462 0 0 2 0 2 47E 2014 ALS 9/12 -9/25 55 30 55 33�3 53 458 0 0 7 0 7 137E 2015 ALS 9/11-9/24 55 17 55 76�5 50 369 0 0 13 0 13 267E 2016 ALS 9/09 -9/22 55 15 55 73�3 49 350 0 0 4 0 4 87W 2012 B 9/14 -9/27 100 803 100 8�7 96 898 57 2 0 0 59 617W 2012 B 11/16 -11/29 25 27 25 44�4 23 162 3 3 0 0 6 267W 2013 B 9/13 -9/26 130 877 130 10 128 1126 52 0 0 0 52 417W 2013 B 11/15 -11/28 25 34 25 35�3 25 142 6 0 0 0 6 247W 2014 B 9/12 -9/25 150 1089 150 9�3 146 1415 49 4 0 0 53 367W 2014 B 11/14 -11/27 25 22 25 45�5 25 200 4 4 0 0 8 327W 2015 B 9/11-9/24 175 1040 175 10�4 169 1605 50 2 0 0 52 317W 2015 B 11/06 -11/19 55 36 55 52�8 49 342 12 2 0 0 14 297W 2016 B 9/09 -9/22 175 1082 175 10�9 175 1544 76 0 0 0 76 437W 2016 B 11/04 -11/17 55 55 55 52�7 55 446 13 0 0 0 13 247W 2012 ALS 9/14 -9/27 50 34 50 50 45 335 0 0 13 0 13 297W 2013 ALS 9/13 -9/26 50 39 50 41 48 426 0 0 5 2 7 157W 2014 ALS 9/12 -9/25 50 57 50 33�3 50 365 0 0 13 0 13 267W 2015 ALS 9/11-9/24 50 60 50 35 50 416 0 0 6 0 6 127W 2016 ALS 9/09 -9/22 50 53 50 20�8 41 315 0 0 11 2 13 328 2012 B 9/14 -9/27 150 761 150 14�1 143 1364 37 5 0 0 42 298 2012 B 11/16 -11/29 25 35 25 34�3 23 184 0 5 0 0 5 228 2013 B 9/13 -9/26 200 808 200 17 198 1731 44 10 0 0 54 278 2013 B 11/15 -11/28 25 15 25 46�7 20 200 5 0 0 0 5 258 2014 B 9/12 -9/25 200 865 200 15�3 196 1804 62 8 0 0 70 368 2014 B 11/14 -11/27 25 13 25 76�9 25 200 0 0 0 0 0 08 2015 B 9/11-9/24 150 801 150 11�7 148 1454 43 2 0 0 45 308 2015 B 11/06 -11/19 30 57 30 21�1 30 247 10 0 0 0 10 338 2016 B 9/09 -9/22 175 840 175 12�3 168 1488 53 2 0 0 55 338 2016 B 11/04 -11/17 30 38 30 39�5 30 300 0 0 0 0 0 08 2012 ALS 9/14 -9/27 50 35 50 48�6 41 328 0 0 12 0 12 298 2013 ALS 9/13 -9/26 50 33 50 27�3 40 375 0 0 10 0 10 258 2014 ALS 9/12 -9/25 50 35 50 40 46 321 0 0 10 0 10 228 2015 ALS 9/11-9/24 50 51 50 47�1 48 367 0 0 6 4 10 218 2016 ALS 9/09 -9/22 50 37 50 37�8 47 350 0 0 10 0 10 219 2012 B 9/14 -9/27 100 2046 100 3�9 98 829 77 4 0 0 81 839 2012 B 11/16 -11/29 25 49 25 18�4 25 214 11 0 0 0 11 449 2013 B 9/13 -9/26 100 2798 100 3�2 98 980 50 0 0 0 50 519 2013 B 11/15 -11/28 25 49 25 32�7 20 161 5 0 0 0 5 25
Archery
BE = Early Bull, B = Bull, ALS = Antlerless, AE = Any Elk, CN = Camp Navajo, CH = CHAMP Hunt, DV = Disabled Veteran, WW = Wounded Warrior
Herd-Units: AM = Antelope Mountain Hunt Area in Unit 1, CC= Canyon Creek in Unit 23, CC = Coon Canyon and Flat Top Hunt Areas in Unit 1, CF = Coon Canyon and Flat Top Hunt Areas in Unit 1, DL= Dry Lake, ES (Unit 1) = Escudilla, FT = Flat Top Hunt Areas in Unit 1, HM = Hutch Mtn�, M=Martinez, ML = Marshall Lake, MM = Melatone Mesa, P = Peaks Hunt Area in Unit 7 East, RV = Round Valley, SM = East Sunset/West Sunset/Meteor Crater, ST = East Sunset/West Sunset, TT= Twin Arrows/Two Guns/Grapevine, VV = Verde Valley�

84 Hunt Arizona 2017
Elk Harvest Data
Unit HerdUnit Year Hunt
Type Dates PermitsAuthorized
1st Choice Applicants
PermitsIssued
DrawOdds Hunters Hunter
DaysHarvest Hunt
SuccessBull Spike Cow Calf TotalGeneral9 2014 B 9/12 -9/25 100 2373 99 3�4 95 862 56 2 0 0 58 619 2014 B 11/14 -11/27 50 52 50 38�5 45 308 26 3 0 0 29 649 2015 B 9/18 -10/01 100 2248 100 3�4 100 857 77 0 0 0 77 779 2015 B 11/13 -11/26 55 74 55 29�7 43 308 15 0 0 0 15 359 2016 B 9/16 -9/29 100 2439 100 3�3 98 939 53 4 0 0 57 589 2016 B 11/11-11/24 100 92 100 40�2 94 797 16 0 0 0 16 1710 2012 B 9/14 -9/27 200 1962 200 5�9 198 1908 72 2 0 0 74 3710 2012 B 11/16 -11/29 30 28 30 35�7 25 180 5 0 0 0 5 2010 2013 B 9/13 -9/26 200 1175 200 8�8 193 1776 58 0 0 0 58 3010 2013 B 11/15 -11/28 30 15 30 33�3 28 240 8 3 0 0 11 3910 2014 B 9/12 -9/25 200 1083 200 9�3 196 1833 70 0 0 0 70 3610 2014 B 11/14 -11/27 30 29 30 44�8 25 194 3 3 0 0 6 2410 2015 B 9/11-9/24 200 1106 200 9�4 200 1971 61 3 0 0 64 3210 2015 B 11/13 -11/26 35 46 35 34�8 33 235 3 0 0 0 3 910 2016 B 9/09 -9/22 125 894 125 8�6 116 1142 34 2 0 0 36 3110 2016 B 11/11-11/24 35 32 35 50 27 241 4 0 0 0 4 1510 2012 ALS 9/14 -9/27 75 62 72 48�4 55 353 0 0 2 0 2 410 2013 ALS 11/15 -11/28 25 3 25 100 19 112 0 0 0 0 0 010 2014 ALS 11/14 -11/27 25 12 25 100 25 161 0 0 0 0 0 010 2015 ALS 11/13 -11/26 25 6 25 100 25 200 0 0 0 0 0 010 2016 ALS 11/11-11/24 25 2 25 100 25 175 0 0 0 0 0 011M 2012 B 9/14 -9/27 80 315 80 20�6 80 660 35 7 0 0 42 5311M 2012 B 9/28 -10/11 80 199 80 22�1 78 778 18 2 0 0 20 2611M 2013 B 9/13 -9/26 80 341 80 17�3 80 660 21 9 0 0 30 3811M 2013 B 9/27 -10/10 80 211 80 19�4 80 582 17 2 0 0 19 2411M 2014 B 9/12 -9/25 80 371 80 16�7 76 770 13 0 0 0 13 1711M 2014 B 9/26 -10/09 80 216 80 19�9 76 728 12 2 0 0 14 1811M 2015 B 9/11-9/24 80 363 80 16 76 576 24 2 0 0 26 3411M 2015 B 9/25 -10/08 80 260 80 18�1 78 636 10 2 0 0 12 1511M 2016 B 9/09 -9/22 80 309 80 20�4 74 613 16 6 0 0 22 3011M 2016 B 9/23 -10/06 80 237 80 21�5 80 677 25 0 0 0 25 3111M 2012 ALS 9/14 -9/27 80 69 80 40�6 80 571 0 0 29 0 29 3611M 2012 ALS 9/28 -10/11 80 39 80 46�2 80 553 0 0 33 0 33 4111M 2013 ALS 9/13 -9/26 80 96 80 38�5 76 528 0 0 26 2 28 3711M 2013 ALS 9/27 -10/10 80 70 80 57�1 76 597 0 0 20 0 20 2611M 2014 ALS 9/12 -9/25 80 98 80 41�8 73 518 0 0 21 0 21 2911M 2014 ALS 9/26 -10/09 80 61 80 62�3 78 611 0 0 13 0 13 1711M 2015 ALS 9/11-9/24 80 101 80 52�5 75 657 0 0 19 2 21 2811M 2015 ALS 9/25 -10/08 80 64 80 50 77 604 0 0 25 3 28 3611M 2016 ALS 9/09 -9/22 80 107 80 39�3 78 657 0 0 24 0 24 3111M 2016 ALS 9/23 -10/06 80 66 80 53 77 534 0 0 23 6 29 3815A/15B/18A 2012 B 9/14 -10/04 25 80 25 17�5 25 211 11 0 0 0 11 4415A/15B/18A 2013 B 9/13 -10/03 25 78 25 17�9 23 258 10 0 0 0 10 4315A/15B/18A 2014 B 9/12 -10/02 25 77 25 16�9 25 214 11 0 0 0 11 4415A/15B/18A 2015 B 9/11-9/24 25 84 25 17�9 25 193 7 0 0 0 7 2815A/15B/18A 2016 B 9/09 -9/22 25 93 25 21�5 18 189 7 0 0 0 7 3916A 2012 B 9/14 -9/27 4 11 4 9�1 4 18 4 0 0 0 4 10016A 2013 B 9/13 -9/26 4 21 4 19 4 19 4 0 0 0 4 10016A 2014 B 9/12 -9/25 4 21 4 14�3 4 19 3 0 0 0 3 7516A 2015 B 9/11-9/24 4 25 4 8 4 10 3 0 0 0 3 7516A 2016 B 9/09 -9/22 4 20 4 10 4 12 2 0 0 0 2 5017/18B/19B/20AC 2012 B 9/14 -10/04 35 83 35 15�7 35 340 20 0 0 0 20 5717/18B/19B/20AC 2013 B 9/13 -10/03 35 96 35 18�8 32 235 22 0 0 0 22 6917/18B/19B/20AC 2014 B 9/12 -10/02 35 114 35 19�3 35 233 16 0 0 0 16 46
5-Year: 2012-2016 Harvest
BE = Early Bull, B = Bull, ALS = Antlerless, AE = Any Elk, CN = Camp Navajo, CH = CHAMP Hunt, DV = Disabled Veteran, WW = Wounded Warrior
Herd-Units: AM = Antelope Mountain Hunt Area in Unit 1, CC= Canyon Creek in Unit 23, CC = Coon Canyon and Flat Top Hunt Areas in Unit 1, CF = Coon Canyon and Flat Top Hunt Areas in Unit 1, DL= Dry Lake, ES (Unit 1) = Escudilla, FT = Flat Top Hunt Areas in Unit 1, HM = Hutch Mtn�, M=Martinez, ML = Marshall Lake, MM = Melatone Mesa, P = Peaks Hunt Area in Unit 7 East, RV = Round Valley, SM = East Sunset/West Sunset/Meteor Crater, ST = East Sunset/West Sunset, TT= Twin Arrows/Two Guns/Grapevine, VV = Verde Valley�
Archery

Hunt Arizona 2017 85
Elk Harvest Data
Unit HerdUnit Year Hunt
Type Dates PermitsAuthorized
1st Choice Applicants
PermitsIssued
DrawOdds Hunters Hunter
DaysHarvest Hunt
SuccessBull Spike Cow Calf TotalGeneral17/18B/19B/20AC 2012 ALS 9/14 -10/04 35 1 35 100 29 229 0 0 2 0 2 717/18B/19B/20AC 2013 ALS 9/13 -10/03 35 1 35 100 35 267 0 0 0 0 0 017/18B/19B/20AC 2014 ALS 9/12 -9/25 35 5 35 100 35 237 0 0 5 0 5 1417/18B/19B/20AC 2015 B 9/11-9/24 35 99 35 21�2 35 317 11 0 0 0 11 017/18B/19B/20AC 2016 B 9/09 -9/22 35 99 35 13�1 33 191 12 2 0 0 14 4217/18B/19B/20AC 2015 ALS 9/11-10/01 35 6 35 100 35 280 0 0 0 0 0 017/18B/19B/20AC 2016 ALS 9/09 -9/22 35 1 35 100 31 239 0 0 4 0 4 1319A 2012 B 9/14 -9/27 15 33 15 36�4 13 118 6 0 0 0 6 4619A 2013 B 9/13 -9/26 15 41 15 19�5 15 120 5 0 0 0 5 3319A 2014 B 9/12 -9/25 15 31 15 25�8 10 130 3 0 0 0 3 3019A 2015 B 9/11-9/24 15 53 15 20�8 15 96 9 0 0 0 9 6019A 2016 B 9/09 -9/22 15 43 15 16�3 11 86 2 0 0 0 2 1821 2012 B 9/14 -9/27 10 60 10 11�7 10 70 5 0 0 0 5 5021 2013 B 9/13 -9/26 15 62 15 16�1 15 83 11 0 0 0 11 7321 2014 B 9/12 -9/25 15 116 15 8�6 14 104 3 2 0 0 5 3621 2015 B 9/11-9/24 15 98 15 7�1 15 84 13 0 0 0 13 8721 2016 B 9/09 -9/22 10 47 10 19�1 10 73 8 0 0 0 8 8022 2012 B 9/14 -9/27 25 250 25 7�2 25 136 16 0 0 0 16 6422 2013 B 9/13 -9/26 25 235 25 8�5 25 177 18 0 0 0 18 7222 2014 B 9/12 -9/25 25 287 25 5�9 25 196 12 0 0 0 12 4822 2015 B 9/11-9/24 25 383 25 5�5 25 132 18 0 0 0 18 7222 2016 B 9/09 -9/22 25 314 25 6�4 22 113 18 0 0 0 18 8222 2012 ALS 11/16 -11/29 70 59 70 61 64 435 0 0 21 0 21 3322 2013 ALS 11/15 -11/28 70 52 70 73�1 65 475 0 0 15 3 18 2822 2014 ALS 11/14 -11/27 70 57 70 73�7 67 541 0 0 16 0 16 2422 2015 ALS 11/13 -11/26 70 49 70 61�2 64 331 0 0 31 0 31 4822 2016 ALS 11/11-11/24 70 69 70 60�9 64 391 0 0 18 3 21 3322N 2012 B 11/16 -11/29 275 102 275 90�2 262 1887 31 18 0 0 49 1922N 2013 B 11/15 -11/28 375 109 375 100 352 2400 23 18 0 0 41 1222N 2014 B 11/14 -11/27 375 78 375 98�7 354 2408 34 21 0 0 55 1622N 2015 B 11/13 -11/26 355 125 355 99�2 338 2541 36 14 0 0 50 1522N 2016 B 11/11-11/24 375 121 375 100 332 2250 37 40 0 0 77 2322S 2012 B 11/16 -11/29 30 18 30 50 30 259 11 0 0 0 11 3722S 2013 B 11/15 -11/28 60 19 60 100 56 447 2 2 0 0 4 722S 2014 B 11/14 -11/27 60 34 60 76�5 56 364 0 4 0 0 4 722S 2015 B 11/13 -11/26 65 14 65 100 65 375 12 6 0 0 18 2822S 2016 B 11/11-11/24 65 17 65 100 56 429 4 4 0 0 8 1423 2012 B 11/16 -11/29 200 75 200 90�7 193 1307 30 9 0 0 39 2023 2013 B 11/15 -11/28 275 71 275 98�6 258 1937 5 2 0 0 7 323 2014 B 11/14 -11/27 200 102 200 79�4 158 1145 39 3 0 0 42 2723 2015 B 11/13 -11/26 205 133 205 77�4 191 1275 32 5 0 0 37 1923 2016 B 11/11-11/24 205 146 205 54�8 198 1401 26 7 0 0 33 1723 2012 ALS 11/16 -11/29 25 13 25 76�9 25 235 0 0 8 0 8 3223 2013 ALS 11/15 -11/28 25 22 25 86�4 21 125 0 0 6 0 6 2923 2014 ALS 11/14 -11/27 25 17 25 76�5 20 150 0 0 5 0 5 2523 2015 ALS 11/13 -11/26 25 21 25 76�2 25 165 0 0 6 0 6 2423 2016 ALS 11/11-11/24 25 31 25 58�1 23 190 0 0 10 0 10 4323N 2012 B 9/14 -9/27 15 318 15 4�1 13 92 9 0 0 0 9 6923N 2013 B 9/13 -9/26 15 292 15 4�5 15 65 15 0 0 0 15 10023N 2014 B 9/12 -9/25 15 444 15 2�7 15 169 9 0 0 0 9 6023N 2015 B 9/11-9/24 15 851 15 1�5 14 132 11 0 0 0 11 7923N 2016 B 9/09 -9/22 15 773 15 1�3 15 73 13 0 0 0 13 8723S 2012 B 9/14 -9/27 15 217 15 6�5 15 135 9 0 0 0 9 6023S 2013 B 9/13 -9/26 15 210 15 5�2 15 116 13 0 0 0 13 87
5-Year: 2012-2016 Harvest
BE = Early Bull, B = Bull, ALS = Antlerless, AE = Any Elk, CN = Camp Navajo, CH = CHAMP Hunt, DV = Disabled Veteran, WW = Wounded Warrior
Herd-Units: AM = Antelope Mountain Hunt Area in Unit 1, CC= Canyon Creek in Unit 23, CC = Coon Canyon and Flat Top Hunt Areas in Unit 1, CF = Coon Canyon and Flat Top Hunt Areas in Unit 1, DL= Dry Lake, ES (Unit 1) = Escudilla, FT = Flat Top Hunt Areas in Unit 1, HM = Hutch Mtn�, M=Martinez, ML = Marshall Lake, MM = Melatone Mesa, P = Peaks Hunt Area in Unit 7 East, RV = Round Valley, SM = East Sunset/West Sunset/Meteor Crater, ST = East Sunset/West Sunset, TT= Twin Arrows/Two Guns/Grapevine, VV = Verde Valley�
Archery

86 Hunt Arizona 2017
Elk Harvest Data
Unit HerdUnit Year Hunt
Type Dates PermitsAuthorized
1st Choice Applicants
PermitsIssued
DrawOdds Hunters Hunter
DaysHarvest Hunt
SuccessBull Spike Cow Calf TotalGeneral23S 2014 B 9/12 -9/25 15 212 15 4�7 15 128 15 0 0 0 15 10023S 2015 B 9/11-9/24 15 244 15 3�3 15 118 13 0 0 0 13 8723S 2016 B 9/09 -9/22 15 362 15 1�9 15 159 6 0 0 0 6 4027 2012 B 9/14 -9/27 150 752 150 10�2 144 1131 75 2 0 0 77 5327 2012 B 11/16 -11/29 25 18 25 38�9 20 190 0 0 0 0 0 027 2013 B 9/13 -9/26 225 989 225 12�7 223 1925 98 0 0 0 98 4427 2013 B 11/15 -11/28 25 24 25 33�3 22 159 6 0 0 0 6 2727 2014 B 9/12 -9/25 225 1253 225 13 221 2101 57 0 0 0 57 2627 2014 B 11/14 -11/27 25 37 25 35�1 25 192 8 0 0 0 8 3227 2015 B 9/11-9/24 225 1284 225 8�6 222 2165 67 3 0 0 70 3227 2015 B 11/06 -11/19 30 43 30 39�5 27 183 12 0 0 0 12 4427 2016 B 9/16 -9/29 225 1380 225 10 221 1938 62 0 0 0 62 2827 2016 B 11/04 -11/17 30 29 30 51�7 30 304 8 0 0 0 8 2727 2012 ALS 9/14 -9/27 50 37 50 35�1 40 231 0 0 6 0 6 1527 2013 ALS 9/13 -9/26 100 35 101 77�1 98 818 0 0 14 0 14 1427 2014 ALS 9/12 -9/25 100 56 100 60�7 96 604 0 0 14 2 16 1727 2015 ALS 9/11-9/24 100 66 100 53 94 658 0 0 11 3 14 1527 2016 ALS 9/16 -9/29 100 43 100 76�7 89 741 0 0 7 2 9 1028/31/32 2012 AE 9/14 -9/27 5 3 5 66�7 0 0 0 0 0 0 0 -28/31/32 2013 AE 9/13 -9/26 5 2 5 100 0 0 0 0 0 0 0 -28/31/32 2014 AE 9/12 -9/25 5 5 5 60 5 23 0 0 0 0 0 028/31/32 2015 AE 9/11-9/24 5 4 5 50 5 28 1 0 0 0 1 2028/31/32 2016 AE 9/09 -9/22 5 9 5 44�4 4 18 1 0 0 0 1 25CN 2012 ALS 10/12 -10/18 20 0 20 - 14 71 0 0 3 0 3 21CN 2012 ALS 10/12 -10/18 3 3 3 66�7 3 12 0 0 0 0 0 0CN 2012 ALS 9/21 -9/30 20 2 20 100 13 100 0 0 0 0 0 0CN 2012 ALS 9/21 -9/30 3 1 3 100 3 17 0 0 0 0 0 0CN 2012 ALS 11/09 -11/22 10 0 10 - 8 64 0 0 0 2 2 25CN 2012 ALS 11/09 -11/22 3 0 3 - 3 16 0 0 0 0 0 0CN 2013 ALS 9/13 -9/19 20 0 20 - 20 77 0 0 13 0 13 65CN 2013 ALS 9/13 -9/19 3 0 3 - 3 6 0 0 0 0 0 0CN 2013 ALS 9/20 -9/29 20 0 20 - 20 135 0 0 0 0 0 0CN 2013 ALS 9/20 -9/29 3 1 3 100 3 30 0 0 0 0 0 0CN 2013 ALS 11/08 -11/21 10 0 10 - 0 0 0 0 0 0 0 -CN 2013 ALS 11/08 -11/21 3 0 3 - 0 0 0 0 0 0 0 -CN 2014 ALS 9/12 -9/18 5 0 5 - 0 0 0 0 0 0 0 -CN 2014 ALS 10/03 -10/09 5 4 5 100 5 25 0 0 0 0 0 0CN 2014 ALS 10/17 -10/23 5 0 5 - 5 35 0 0 0 0 0 0CN 2014 ALS 10/24 -10/30 5 0 5 - 0 0 0 0 0 0 0 -CN 2015 ALS 9/11-9/17 7 4 7 100 0 0 0 0 0 0 0 0CN 2015 ALS 10/02 -10/08 7 1 7 100 7 35 0 0 0 0 0 0CN 2015 ALS 10/02 -10/08 7 5 7 100 7 39 0 0 4 0 4 57CN 2015 ALS 10/16 -10/22 7 0 7 - 0 0 0 0 0 0 0 -CN 2015 ALS 10/23 -10/29 5 0 5 - 5 35 0 0 0 0 0 0CN 2016 ALS 9/09 -9/15 7 0 7 - 7 47 0 0 0 0 0 0CN 2016 ALS 9/30 -10/06 9 2 9 50 9 36 0 0 5 0 5 56CN 2016 ALS 9/30 -10/06 7 1 7 100 7 35 0 0 4 0 4 57CN 2016 ALS 10/14 -10/20 7 0 7 - 0 0 0 0 0 0 0 -CN 2016 ALS 10/21 -10/27 5 0 5 - 0 0 0 0 0 0 0 -CN 2012 AE 9/14 -9/20 17 19 17 78�9 17 60 6 0 6 0 12 71CN 2012 AE 9/14 -9/20 2 8 2 12�5 0 0 0 0 0 0 0 -CN 2012 AE 9/21 -9/30 17 18 17 72�2 17 128 3 0 0 0 3 18CN 2012 AE 9/21 -9/30 2 10 2 10 0 0 0 0 0 0 0 -CN 2012 AE 11/09 -11/22 8 0 8 - 8 38 0 0 2 0 2 25
5-Year: 2012-2016 Harvest
Archery
BE = Early Bull, B = Bull, ALS = Antlerless, AE = Any Elk, CN = Camp Navajo, CH = CHAMP Hunt, DV = Disabled Veteran, WW = Wounded Warrior
Herd-Units: AM = Antelope Mountain Hunt Area in Unit 1, CC= Canyon Creek in Unit 23, CC = Coon Canyon and Flat Top Hunt Areas in Unit 1, CF = Coon Canyon and Flat Top Hunt Areas in Unit 1, DL= Dry Lake, ES (Unit 1) = Escudilla, FT = Flat Top Hunt Areas in Unit 1, HM = Hutch Mtn�, M=Martinez, ML = Marshall Lake, MM = Melatone Mesa, P = Peaks Hunt Area in Unit 7 East, RV = Round Valley, SM = East Sunset/West Sunset/Meteor Crater, ST = East Sunset/West Sunset, TT= Twin Arrows/Two Guns/Grapevine, VV = Verde Valley�

Hunt Arizona 2017 87
Elk Harvest Data
Unit HerdUnit Year Hunt
Type Dates PermitsAuthorized
1st Choice Applicants
PermitsIssued
DrawOdds Hunters Hunter
DaysHarvest Hunt
SuccessBull Spike Cow Calf TotalGeneralCN 2012 AE 11/09 -11/22 2 0 2 - 0 0 0 0 0 0 0 -CN 2013 AE 9/13 -9/19 17 21 17 57�1 17 83 2 5 2 0 9 53CN 2013 AE 9/13 -9/19 2 7 2 0 2 14 0 0 0 0 0 0CN 2013 AE 9/20 -9/29 17 41 17 31�7 17 138 2 2 0 0 4 24CN 2013 AE 9/20 -9/29 2 13 2 7�7 2 12 0 0 0 0 0 0CN 2013 AE 11/08 -11/21 8 0 8 - 8 88 0 0 0 0 0 0CN 2013 AE 11/08 -11/21 2 0 2 - 2 14 0 0 0 0 0 0CN 2014 AE 9/12 -9/18 5 24 5 20�8 0 0 0 0 0 0 0 -CN 2014 AE 9/19 -9/25 5 10 5 20 5 13 0 1 1 0 2 40CN 2014 AE 9/26 -10/02 5 9 5 33�3 5 23 3 1 0 0 4 80CN 2014 AE 10/10 -10/16 5 5 5 20 5 27 0 0 0 0 0 0CN 2015 AE 9/11-9/17 7 21 7 28�6 7 25 4 0 0 0 4 57CN 2015 AE 9/18 -9/24 7 17 7 35�3 7 30 0 0 0 2 2 29CN 2015 AE 9/18 -9/24 5 17 5 23�5 5 28 0 0 0 0 0 0CN 2015 AE 9/25 -10/01 5 10 5 40 5 23 0 0 0 2 2 40CN 2015 AE 10/09 -10/15 10 9 10 88�9 10 56 0 2 0 0 2 20CN 2016 AE 9/09 -9/15 7 17 7 35�3 7 35 4 2 0 0 6 86CN 2016 AE 9/16 -9/22 7 15 7 33�3 7 37 5 0 0 0 5 71CN 2016 AE 9/23 -9/29 5 12 5 25 5 35 0 0 0 0 0 0CN 2016 AE 9/30 -10/06 5 3 5 66�7 5 35 0 0 0 0 0 0CN 2016 AE 9/30 -10/06 5 12 5 25 5 10 0 0 0 0 0 0CN 2016 AE 10/07 -10/13 10 9 10 - 10 55 5 0 0 0 5 50
Archery
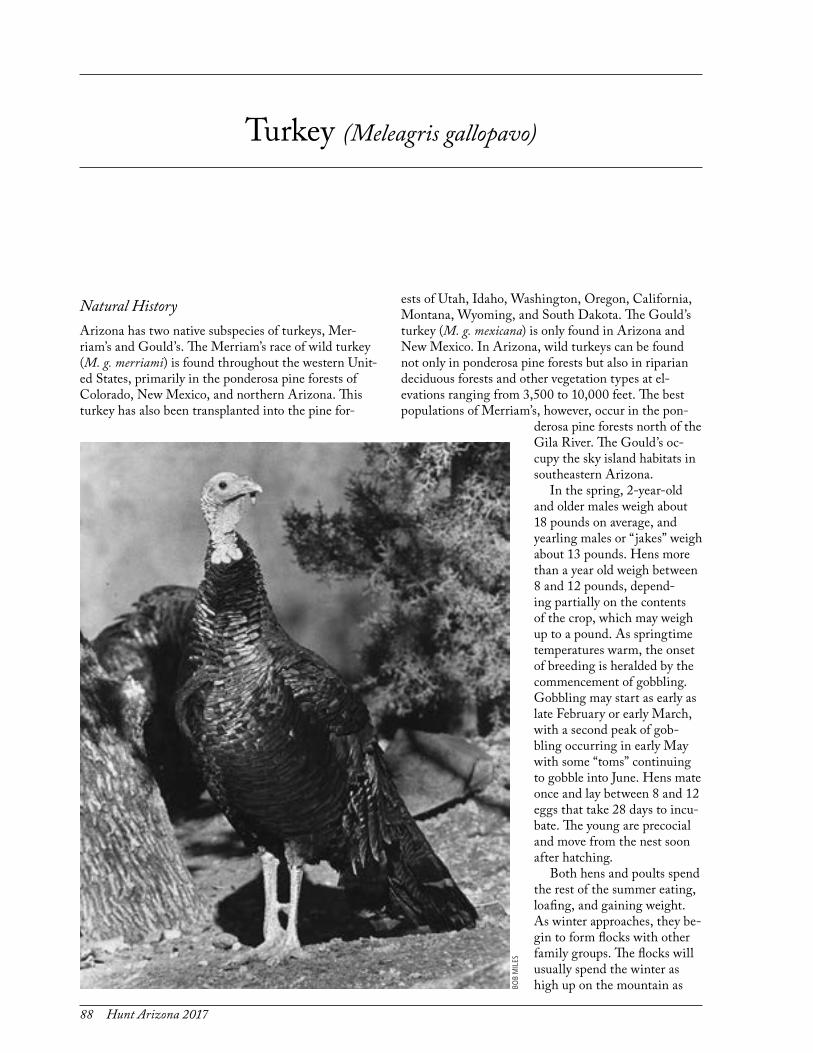
88 Hunt Arizona 2017
Turkey (Meleagris gallopavo)
Natural HistoryArizona has two native subspecies of turkeys, Mer-riam’s and Gould’s. The Merriam’s race of wild turkey (M. g. merriami) is found throughout the western Unit-ed States, primarily in the ponderosa pine forests of Colorado, New Mexico, and northern Arizona. This turkey has also been transplanted into the pine for-
ests of Utah, Idaho, Washington, Oregon, California, Montana, Wyoming, and South Dakota. The Gould’s turkey (M. g. mexicana) is only found in Arizona and New Mexico. In Arizona, wild turkeys can be found not only in ponderosa pine forests but also in riparian deciduous forests and other vegetation types at el-evations ranging from 3,500 to 10,000 feet. The best populations of Merriam’s, however, occur in the pon-
derosa pine forests north of the Gila River. The Gould’s oc-cupy the sky island habitats in southeastern Arizona.
In the spring, 2-year-old and older males weigh about 18 pounds on average, and yearling males or “ jakes” weigh about 13 pounds. Hens more than a year old weigh between 8 and 12 pounds, depend-ing partially on the contents of the crop, which may weigh up to a pound. As springtime temperatures warm, the onset of breeding is heralded by the commencement of gobbling. Gobbling may start as early as late February or early March, with a second peak of gob-bling occurring in early May with some “toms” continuing to gobble into June. Hens mate once and lay between 8 and 12 eggs that take 28 days to incu-bate. The young are precocial and move from the nest soon after hatching.
Both hens and poults spend the rest of the summer eating, loafing, and gaining weight. As winter approaches, they be-gin to form flocks with other family groups. The flocks will usually spend the winter as high up on the mountain as BO
B M
ILES

Hunt Arizona 2017 89
snow permits. The gobblers, too, have a defined wintering area in which they will flock together. Dur-ing the winter, turkeys congregate in the pinyon pine-oak habitats just below the interface with the pon-derosa pine forest. Following the snow line, both hen and tom turkey flocks work their way upslope to where gobbling toms attempt to accrue a harem of several hens. After mating, the hens often continue upslope into denser habitats to lay and incubate their eggs. Toms and hens are not usually seen together during the remainder of the year, although they may both frequent similar habitats.
During the summer months, the hens and poults spend much of their time searching for bugs and seeds in small meadows and forest openings. As winter ap-proaches, the turkeys feed increasingly on acorns, pinyon nuts, and other mast crops. Later, with the on-set of winter, the birds follow pine stringers downslope to snow-free areas where they feed on the seeds of pon-derosa pine, junipers, pinyons, and other plants.
Hunt HistoryWild turkeys have been classified as big game since 1913 when the first state legislature established a bag limit of three birds to be taken between October 1 and December 15. Turkey populations appeared to hold up fairly well, at least in northern Arizona, as the season was still a month long and the bag limit was only re-duced to two in the new “game code” of 1929. After World War II, however, hunt pressure gradually in-
creased, and hunt regulations became more stringent. Fall hunting was the only turkey hunting al-lowed, and by 1950 a hunter had to draw a permit to even hunt turkeys. Annual har-vests ranged from a few hundred birds to more than 1,300.
Turkey popu-lations were fairly robust in the early
1960s, and the permit requirement was dropped in 1963; tag sales jumped from 8,050 in 1962 to 17,479 in 1963, but the turkey harvest only increased from 1,363 to 1,462. The first spring gobbler hunt was authorized in 1965 (100 permits), and by 1969 the annual turkey harvest had climbed to 2,480 birds, with another 138 turkeys taken earlier that spring. That number remains an annual high.
Wild turkey populations have since been in a gen-eral decline. Current estimates number the population between 15,000 and 20,000 birds, depending on con-ditions. Fall hunting is again by permit-only, and in the spring the number of gobblers taken is equal to or greater than the fall harvest.
Arizona’s turkey distribution

90 Hunt Arizona 2017
Turkey Survey Data
Historic Summary of Turkey Survey DataYear Tom Hen Poult Unclassified Total Poults/Hen Percent Young11960 343 267 544 31 1185 2�0 471961 297 260 634 64 1255 2�4 531962 248 293 847 28 1416 2�9 611963 273 374 1058 58 1763 2�8 621964 191 288 881 42 1402 3�1 651965 193 290 905 77 1465 3�1 651966 286 311 1034 34 1665 3�3 631967 337 413 809 111 1670 2�0 521968 299 295 978 188 1760 3�3 621969 236 304 1152 30 1722 3�8 681970 207 345 667 81 1300 1�9 551971 224 369 654 131 1378 1�8 521972 205 264 678 75 1222 2�6 591973 129 207 641 89 1066 3�1 661974 155 193 729 73 1150 3�8 681975 125 368 1406 351 2250 3�8 741976 98 262 1138 121 1619 4�3 761977 87 299 1391 74 1851 4�7 781978 179 307 1190 91 1767 3�9 711979 100 129 421 24 674 3�3 651980 42 111 401 81 635 3�6 721981 82 120 626 158 986 5�2 761982 105 157 586 17 865 3�7 691983 64 153 517 0 734 3�4 701984 156 202 664 159 1181 3�3 651985 88 332 1033 125 1578 3�1 711986 136 300 926 62 1424 3�1 681987 137 251 735 141 1264 2�9 651988 63 225 610 172 1070 2�7 681989 183 332 704 84 1303 2�1 581990 121 210 527 109 967 2�5 611991 117 176 389 162 844 2�2 571992 170 219 707 113 1209 3�2 651993 295 495 1148 120 2058 2�3 591994 251 381 559 24 1215 1�5 471995 130 306 527 12 975 1�7 551996 68 289 292 16 665 1�0 451997 37 270 708 15 1030 2�6 701998 122 228 497 4 851 2�2 591999 103 212 567 32 914 2�7 642000 144 198 303 50 695 1�5 472001 62 237 520 88 907 2�2 632002 86 44 25 85 240 0�6 162003 105 373 1156 50 1684 3�1 712004 124 144 202 37 507 1�4 432005 183 360 783 46 1372 2�2 592006 77 217 361 38 693 1�7 552007 102 192 298 25 617 1�6 502008 139 282 334 18 772 1�2 442009 149 327 733 28 1237 2�2 612010 126 179 358 14 677 2�0 542011 66 236 304 51 657 1�3 502012 56 195 544 15 810 2�8 682013 88 160 355 14 617 2�2 592014 59 122 208 12 401 1�7 532015 81 176 261 27 545 1�5 502016 44 199 375 26 644 1�9 61
1 Percent young is calculated from classified birds only�

Hunt Arizona 2017 91
Turkey Survey Data
1 Percent young is calculated from classified birds only�
5-Year: 2012-2016 Turkey Survey DataUnit Year Tom Hen Poult Unclassified Total Poults/Hen Percent Young1
1 2012 14 64 164 1 243 2�6 681 2013 21 72 171 0 264 2�4 651 2014 33 49 59 6 147 1�2 421 2015 52 85 121 27 285 1�4 471 2016 16 52 193 7 268 3�7 743B 2012 12 0 0 0 12 - 03B 2013 17 0 0 0 17 - 03B 2014 0 1 3 0 4 3�0 753B 2015 0 4 11 0 15 2�8 733B 2016 11 13 0 0 24 �0 03C 2012 10 4 10 14 38 2�5 423C 2013 7 2 3 0 12 1�5 253C 2015 0 15 15 0 30 1�0 504A 2012 6 0 0 0 6 - 04 2013 3 31 38 0 72 1�2 534 2014 14 11 6 0 31 �6 194 2015 3 20 21 0 44 1�1 484 2016 0 19 0 0 19 �0 05A 2012 0 11 33 0 44 3�0 755A 2013 15 8 16 0 39 2�0 415A 2014 6 7 12 5 30 1�7 485A 2015 0 8 11 0 19 1�4 585A 2016 12 25 13 0 50 �5 265B 2015 0 3 9 0 12 3�0 755BS 2012 0 8 18 0 26 2�3 696A 2012 0 11 32 0 43 2�9 746A 2014 0 3 7 0 10 2�3 706A 2015 0 12 28 0 40 2�3 706A 2016 0 6 0 0 6 �0 0B 2015 10 0 0 0 10 - 0B 2016 0 6 13 19 38 2�2 687 2013 0 2 8 0 10 4�0 8012A 2012 2 19 96 0 117 5�1 8212A 2013 7 21 99 0 127 4�7 7812A 2014 2 21 71 0 94 3�4 7612A 2015 5 8 15 0 28 1�9 5412A 2016 5 42 141 0 188 3�4 7512AW 2012 2 0 0 0 2 - 021 2013 7 17 0 14 38 �0 021 2014 4 4 0 1 9 �0 027 2012 10 78 191 0 279 2�5 6827 2013 11 7 20 0 38 2�9 5327 2014 0 26 50 0 76 1�9 6627 2015 11 21 30 0 62 1�4 4827 2016 0 36 15 0 51 �4 2929 2015 77 13 0 0 90 �0 031 2015 12 38 0 0 50 �0 032 2015 28 63 0 0 91 �0 033 2015 15 9 0 0 24 �0 034A 2015 19 40 0 0 59 �0 0

92 Hunt Arizona 2017
Turkey Hunt Data
Historic Summary of General Spring Turkey Hunts (Youth-only listed separately)
Year Permits Authorized
1st ChoiceApplicants Permits Issued Hunters Hunter Days Total Harvest Percent Success
1965 100 – – 79 134 30 38�01966 500 – – 417 716 58 13�91967 1100 – – 878 – 151 17�21968 1600 – – 1096 2440 98 8�91969 2200 – – 1673 3719 138 8�21970 2600 – – 1935 4579 215 11�11971 2650 – – 2021 4702 260 12�91972 2800 – – 1941 4674 153 7�91973 2550 – – 1225 2705 71 5�81974 2550 – 2550 1747 4145 151 8�61975 3450 – 3450 2284 5582 205 9�01976 4001 – 4001 1869 4642 220 11�81977 4600 – 4600 2679 6848 326 12�21978 4865 – 4865 2952 7568 399 13�51979 4970 6275 3397 2853 7516 317 11�11980 4950 7894 4594 2692 7225 234 8�71981 4900 9143 4654 2542 8100 399 15�71982 4960 9444 4821 2648 8366 390 14�71983 4960 5106 4415 3073 10270 473 15�41984 4620 4725 4107 3455 11511 780 22�61985 4620 5863 4409 3382 11649 688 20�31986 4620 6663 4548 3581 12421 746 20�81987 4915 7132 4834 3734 13474 830 22�21988 4710 8216 4688 3736 13089 697 18�71989 4660 8171 4562 3691 12998 619 16�81990 4595 8553 4577 3684 13457 727 19�71991 4595 8044 4976 3994 15731 617 15�41992 4725 6413 4701 3757 14563 723 19�21993 4735 7260 4732 3820 15006 771 20�21994 4805 7730 4793 3795 14543 768 20�21995 4840 8591 4822 3806 14038 769 20�21996 5020 9258 5007 3820 13826 631 16�51997 5115 9312 5115 4021 15179 660 16�41998 4719 9460 4724 3722 13503 671 18�01999 4501 10260 4476 3497 12637 730 212000 4840 11120 4840 3833 13474 916 242001 5251 12815 5251 4232 15258 987 232002 5471 12643 5470 4301 16420 760 182003 5096 13819 5183 4234 16633 878 212004 5157 16020 5158 4055 15880 788 192005 5307 16355 5375 4264 16119 1155 272006 5593 14945 5599 4548 17705 1129 252007 6263 13583 6269 5092 19543 1269 252008 7007 13281 7001 5660 22725 1040 182009 7289 11885 7284 6108 25429 1110 182010 7130 11715 7125 5595 23584 999 182011 7273 13160 7266 5731 23411 813 142012 4974 9846 4967 3772 15335 617 162013 4723 10417 4720 3678 14886 692 192014 4959 10745 4955 3889 15519 698 182015 4843 12882 4843 3858 14976 961 252016 5043 12027 5574 4358 17467 837 19
1In 1997, the General season became a Shotgun-Shooting Shot season�
Historic Summary of Youth-only Spring Turkey HuntsYear Permits
Authorized1st ChoiceApplicants Permits Issued Hunters Hunter Days Total Harvest Percent Success
1999 175 120 163 150 666 30 202000 175 202 175 155 603 34 222001 180 307 180 156 523 30 192002 180 254 177 137 486 27 202003 150 290 153 125 443 23 182004 150 341 150 119 373 23 19

Hunt Arizona 2016 93
Turkey Hunt Data
Historic Summary of Youth-only Spring Turkey Hunts
Year1 PermitsAuthorized
1st ChoiceApplicants
PermitsIssued Hunters Hunter
Days Total
HarvestPercentSuccess
1946 9747 – – 5406 – 526 9�71947 2147 – – 1465 – 296 20�21948 2697 – – 1990 – 403 20�31949 1243 – – 945 – 307 32�51950 1657 – – 1377 – 365 26�51951 3305 – – 2780 – 549 19�71952 3454 – – 2961 – 782 26�41953 4672 – – 4096 – 1216 29�71954 5134 – – 4448 – 971 21�81955 3012 – – 2760 – 887 32�11956 4800 – – 4218 – 1367 32�41957 2600 – – 2138 – 647 30�31958 2800 – – 2340 4308 569 24�31959 5700 – – 4341 – 1050 24�21960 8150 – – 6607 12058 1262 19�11961 – – – 7374 18216 1218 16�51962 – – – 9296 21543 1308 14�11963 – – 17479 15847 35711 1434 9�01964 – – 14803 13733 33614 1655 12�11965 – – 15470 14367 34846 2001 13�91966 – – 15681 14381 34353 1762 12�31967 – – 17388 14626 37391 1601 10�91968 – – 16782 15063 38754 1518 10�11969 – – 18330 14768 37735 2392 16�21970 – – 19222 15673 43147 2002 12�81971 – – 17002 13176 34196 1200 9�11972 – – – 9584 26422 794 8�31973 – – – 13142 36597 2050 15�61974 – – – 12262 36634 1040 8�51975 – – – 9542 27676 1464 15�31976 – – – 8208 24754 508 6�21977 – – – 8652 28320 997 11�51978 – – – 9119 25395 1427 15�61979 – – – 8775 28646 856 9�81980 – – – 12578 34546 1192 9�51981 – – – 10640 36027 1390 13�11982 – – – 9923 34692 1496 15�11983 – – – 9286 31185 893 9�61984 – – 7737 9302 30146 1236 13�31985 – – 8271 9975 32701 1125 11�31986 – – 7510 8740 29245 941 10�81 Archery data are included in hunters, hunter days, and harvest from 1969-1990�2 In 2008, the General season became a Shotgun-Shooting Shot season�
Year Permits Authorized
1st ChoiceApplicants Permits Issued Hunters Hunter Days Total Harvest Percent Success
2005 150 327 153 122 450 24 202006 165 461 165 143 493 51 362007 225 563 225 202 636 105 522008 350 582 350 295 1094 82 282009 OTC - - 1574 4612 324 212010 OTC - - 1316 4477 222 172011 425 198 374 294 984 33 112011 OTC - - 885 2467 146 162012 460 340 460 344 1083 77 222012 OTC - - 351 1188 12 32013 460 453 460 390 1204 91 232013 OTC - - 438 1244 100 232014 360 293 360 290 844 47 162014 OTC - - 313 867 79 252015 310 338 310 258 785 56 222016 295 259 316 246 760 40 16
Historic Summary of General Fall Turkey Hunts (Youth-only listed separately)

94 Hunt Arizona 2017
Turkey Hunt Data
Historic Summary of General Fall Turkey Hunts (Youth-only listed separately) continued
Year1 PermitsAuthorized
1st ChoiceApplicants
PermitsIssued Hunters Hunter
Days Total
HarvestPercentSuccess
1987 – – 8914 10912 37068 1935 17�71988 – – 8259 10425 32224 1459 14�01989 – – 9289 11156 32410 1927 17�31990 – – 7836 9609 29003 982 10�21991 9280 3951 6332 5076 14330 955 18�81992 8730 5497 6731 5310 14563 1008 19�01993 8740 6123 7822 6310 17505 1048 16�61994 6965 6850 6921 5435 15051 1009 18�61995 6245 7322 6237 4857 13447 1034 21�31996 5350 7721 5350 4188 12203 486 11�61997 4050 7766 4050 3080 8492 511 16�61998 3700 7226 3700 2775 7648 508 181999 4160 8972 4160 3283 8935 872 272000 4760 9417 4760 3689 10660 793 212001 4635 9451 4635 3623 9723 1213 332002 5085 12240 5085 3933 11904 407 102003 4260 12774 4260 3199 8955 875 272004 4785 14455 4785 3676 11390 539 152005 4830 11563 4832 3811 10720 1117 292006 5310 14910 5302 3970 11224 640 162007 5870 9922 5868 4664 14317 1087 2320082 6100 7820 5883 4659 14096 902 192009 6120 6649 5860 4667 13759 1653 352010 6820 6172 6374 5009 15748 676 132011 5320 5388 4822 3734 11525 620 172012 5300 5561 4836 3781 11599 889 242013 5300 6265 4967 4104 12328 1007 252014 5475 6237 4973 3838 12866 511 132015 5050 6203 4753 3630 10995 841 232016 5050 6215 4756 3586 14351 583 161 Archery data are included in hunters, hunter days, and harvest from 1969-1990�2 In 2008, the General season became a Shotgun-Shooting Shot season�
Year Permits Authorized
1st ChoiceApplicants Permits Issued Hunters Hunter Days Total Harvest Percent Success
1998 100 59 89 76 197 8 111999 100 105 100 86 236 21 242000 100 169 100 81 218 13 162001 125 164 125 96 264 33 342002 125 241 125 91 282 6 72003 125 240 125 103 231 18 172004 100 250 100 72 196 4 62005 100 137 100 71 191 16 232006 150 246 148 100 262 19 192007 150 179 150 114 304 12 112008 OTC – 336 317 929 37 12
2009 to 2016 OTC No SurveyOTC = Over the counter nonpermit-tags�
Year Permits Authorized
1st Choice Applicants Permits Issued Hunters Hunter Days Total Harvest Percent Success
1991 – – 1289 1072 4331 20 1�91992 – – 1337 1245 4692 19 1�51993 – – 1760 1465 6804 55 3�81994 – – 1808 1533 7258 59 3�81995 – – 1784 1426 7011 26 1�81996 – – 1939 1479 7684 37 2�51997 – – 1891 1390 7194 44 3�21998 – – 2133 1739 8435 96 5�61999 – – 2523 2082 10913 103 4�5
Historic Summary of Archery Fall Turkey Hunts
Historic Summary of Youth-only Fall Turkey Hunts

Hunt Arizona 2017 95
Turkey Hunt Data
Year Permits Authorized
1st Choice Applicants Permits Issued Hunters Hunter Days Total Harvest Percent Success
2000 – – 3084 2539 13320 120 4�72001 – – 3115 2722 13838 190 7�02002 – – 3117 2583 12627 138 5�32003 – – 2914 2485 12507 71 2�92004 – – 3223 2630 12890 160 6�12005 – – 3450 2586 12725 174 6�72006 – – 3941 2820 13818 140 5�02007 – – 4660 2719 14036 221 8�12008 – – 3844 2151 10468 103 4�82009 – – 3559 1073 5405 81 7�52010 – – 3381 1711 8058 113 6�62011 – – 3242 1878 9655 111 62012 – – 3432 2463 12249 148 62013 – – 3827 2508 14061 133 52014 – – 3464 1524 8375 52 32015 data unavailable2016 2764 1483 9003 90 6
Turkey Harvest Data
Unit Year Dates PermitsAuthorized
1st ChoiceApplicants
PermitsIssued
DrawOdds Hunters Hunter
Days Harvest HuntSuccess
SPRING SHOTGUN-SHOOTING SHOT1 2012 4/27- 5/03 200 1099 200 17�7 164 632 49 301 2012 5/04- 5/24 200 137 200 43�8 159 629 31 191 2013 4/26- 5/02 200 1293 200 14�3 159 554 53 331 2013 5/03- 5/23 200 157 200 35�7 157 543 36 231 2014 4/25-5/01 300 1496 300 18�5 252 933 67 271 2014 5/02- 5/22 250 147 250 38�1 196 818 41 211 2015 4/24- 5/21 300 1777 300 16�0 251 806 101 401 2015 5/01- 5/21 250 183 250 25�1 198 765 45 231 2016 4/22 - 5/19 325 1606 397 18�4 349 1363 104 301 2016 4/29 - 5/19 275 242 284 40�5 207 700 45 223B 2012 4/27-5/03 220 125 34�1 99 410 15 15 153B 2012 4/29- 5/19 125 28 125 100�0 99 452 5 53B 2013 4/27- 5/03 125 220 125 34�1 99 410 15 153B 2013 5/04- 5/24 100 33 100 93�9 71 276 7 103B 2014 4/26- 5/02 125 235 125 39�1 101 471 12 123B 2014 5/03- 5/23 100 17 100 94�1 75 359 3 43B 2015 4/25- 5/01 125 223 125 40�8 94 418 28 303B 2015 5/02- 5/22 100 38 100 89�5 73 284 16 223B 2016 4/22 - 5/19 125 207 131 31�9 108 402 23 213B 2016 4/29 - 5/19 100 36 101 83�3 77 361 2 33C 2012 4/22- 4/28 175 861 175 19�4 156 584 25 163C 2012 5/04- 5/24 175 66 175 56�1 151 678 22 153C 2013 4/26- 5/02 175 554 175 28�2 144 666 37 263C 2013 5/03- 5/23 175 66 175 71�2 144 617 11 83C 2014 4/25- 5/01 175 517 175 29�0 146 534 12 83C 2014 5/02- 5/22 175 43 175 76�7 145 673 10 73C 2015 4/24- 5/21 150 534 150 22�7 132 518 26 203C 2015 5/01- 5/21 125 85 125 51�8 99 392 14 143C 2016 4/22 - 5/19 150 479 178 27�8 152 730 8 53C 2016 4/29 - 5/19 125 102 134 41�2 114 536 5 44 2012 4/27- 5/03 175 549 175 28�6 136 537 23 174 2012 5/04- 5/24 175 107 175 54�2 124 510 11 94 2013 4/26- 5/02 150 568 150 23�8 120 484 18 154 2013 5/03- 5/23 150 98 150 43�9 124 566 3 24 2014 4/25- 5/01 150 550 150 22�9 116 491 9 84 2014 5/02- 5/22 150 63 150 55�6 124 437 8 64 2015 4/24- 5/21 125 550 125 21�6 98 388 13 134 2015 5/01- 5/21 125 83 125 42�2 100 398 13 13
5-Year: 2012-2016 Harvest
Historic Summary of Archery Fall Turkey Hunts (continued)

96 Hunt Arizona 2017
Turkey Harvest Data
5-Year: 2012-2016 Harvest
Unit Year Dates PermitsAuthorized
1st ChoiceApplicants
PermitsIssued
DrawOdds Hunters Hunter
Days Harvest HuntSuccess
SPRING SHOTGUN-SHOOTING SHOT4 2016 4/22 - 5/19 100 500 121 18�2 84 239 23 274 2016 4/29 - 5/19 100 96 104 34�4 80 371 9 115A 2012 4/27- 5/03 150 466 150 30�7 130 538 5 45A 2012 5/04- 5/24 200 133 200 55�6 141 647 5 45A 2013 4/26- 5/02 100 465 100 20�0 74 339 17 235A 2013 5/03- 5/23 150 102 150 47�1 131 481 3 25A 2014 4/25- 5/01 100 431 100 20�2 84 297 5 65A 2014 5/02- 5/22 100 82 100 31�7 80 307 9 115A 2015 4/24- 5/21 100 527 100 18�6 67 270 12 185A 2015 5/01- 5/21 100 83 100 42�2 85 312 21 255A 2016 4/22 - 5/19 100 419 127 22�9 102 384 19 195A 2016 4/29 - 5/19 100 135 113 30�4 100 442 13 135B 2012 4/27- 5/03 100 334 100 28�7 69 290 10 145B 2012 5/04- 5/24 100 55 100 60�0 73 341 6 85B 2013 4/26- 5/02 100 325 100 27�1 73 298 15 215B 2013 5/03- 5/23 100 35 100 77�1 83 353 13 165B 2014 4/25- 5/01 100 309 100 28�2 84 339 10 125B 2014 5/02- 5/22 100 54 100 77�8 94 578 9 105B 2015 4/24- 5/21 75 438 75 15�8 58 170 20 345B 2015 5/01- 5/21 75 62 75 40�3 60 241 9 155B 2016 4/22 - 5/19 75 356 101 20�5 70 281 13 195B 2016 4/29 - 5/19 75 126 84 19�8 60 273 11 186A 2012 4/27- 5/03 250 1156 250 21�1 190 723 22 126A 2012 5/04- 5/24 250 171 250 46�2 188 742 25 136A 2013 4/26- 5/02 250 1280 250 18�4 205 827 24 126A 2013 5/03- 5/23 250 200 250 31�5 183 677 14 86A 2014 4/25- 5/01 250 1161 250 20�6 201 763 13 66A 2014 5/02- 5/22 250 199 250 40�7 210 898 19 96A 2015 4/24- 5/21 225 1318 225 16�0 192 836 31 166A 2015 5/01- 5/21 225 221 225 38�0 192 947 33 176A 2016 4/22 - 5/19 225 1173 284 18�2 240 908 50 216A 2016 4/29 - 5/19 225 260 247 31�9 186 756 12 66B 2012 4/27- 5/03 60 191 60 27�7 52 215 11 216B 2012 5/04- 5/24 90 20 90 95�0 61 248 2 36B 2013 4/26- 5/02 60 210 60 22�4 53 195 4 86B 2013 5/03- 5/23 70 25 70 76�0 62 278 2 36B 2014 4/25- 5/01 60 267 60 22�1 47 154 17 366B 2014 5/02- 5/22 70 31 70 58�1 48 205 5 106B 2015 4/24- 5/21 30 270 30 11�1 23 83 7 306B 2015 5/01- 5/21 35 18 35 33�3 21 35 7 336B 2016 4/22 - 5/19 40 191 54 19�4 48 218 2 46B 2016 4/29 - 5/19 45 39 46 15�4 38 153 5 137 2012 4/27- 5/03 100 173 100 31�8 77 360 10 137 2012 5/04- 5/24 125 30 125 100�0 102 470 8 87 2013 4/26- 5/02 100 184 100 32�6 67 194 33 497 2013 5/03- 5/23 100 34 100 97�1 85 350 27 327 2014 4/25- 5/01 100 274 100 27�0 57 207 4 77 2014 5/02- 5/22 100 40 100 50�0 73 482 9 127 2015 4/24- 5/21 125 285 125 33�0 105 392 12 117 2015 5/01- 5/21 125 27 125 88�9 83 330 14 177 2016 4/22 - 5/19 125 201 133 42�8 106 431 12 117 2016 4/29 - 5/19 125 49 129 83�7 87 395 8 98/10 2012 4/27- 5/03 200 686 200 27�7 156 664 27 178/10 2012 5/04-5/24 100 114 100 29�8 78 282 16 218/10 2013 4/26- 5/02 200 649 200 25�9 165 719 42 258/10 2013 5/03- 5/23 100 88 100 50�0 83 451 6 78/10 2014 4/25- 5/01 200 645 200 29�8 166 663 22 138/10 2014 5/02- 5/22 100 79 100 30�4 71 260 13 188/10 2015 4/24-5/21 200 821 200 22�2 159 586 41 268/10 2015 5/01- 5/21 100 79 100 43�0 84 405 14 178/10 2016 4/22 - 5/19 200 706 231 26�2 202 944 20 108/10 2016 4/29 - 5/19 100 146 114 37�0 82 347 7 9

Hunt Arizona 2017 97
Turkey Harvest Data
5-Year: 2012-2016 Harvest
Unit Year Dates PermitsAuthorized
1st ChoiceApplicants
PermitsIssued
DrawOdds Hunters Hunter
Days Harvest HuntSuccess
SPRING SHOTGUN-SHOOTING SHOT9 2012 4/27- 5/03 50 69 50 46�4 40 148 10 259 2012 5/04- 5/24 40 5 40 100�0 30 113 2 79 2013 4/26- 5/02 50 67 50 56�7 35 162 8 239 2013 5/03- 5/23 40 9 40 100�0 24 104 0 09 2014 4/25- 5/01 50 46 50 84�8 31 108 8 269 2014 5/02-5/22 40 0 40 - 23 169 0 09 2015 4/24- 5/21 50 51 50 78�4 33 131 9 279 2015 5/01- 5/21 40 11 40 100�0 31 163 0 09 2016 4/22 - 5/19 50 47 50 76�6 40 171 10 259 2016 4/29 - 5/19 40 7 40 100�0 28 167 0 012A 2012 4/27- 5/03 275 153 275 84�3 187 798 27 1412A 2012 5/04- 5/24 275 36 275 100�0 174 740 20 1112A 2013 4/26- 5/02 275 162 275 82�1 217 871 49 2312A 2013 5/03- 5/23 275 35 277 100�0 166 612 39 2312A 2014 4/25- 5/01 275 243 275 84�4 206 698 62 3012A 2014 5/02- 5/22 275 42 275 100�0 200 816 42 2112A 2015 4/24- 5/21 325 305 325 86�9 259 902 68 2612A 2015 5/01- 5/21 325 62 325 100�0 244 924 69 2812A 2016 4/22 - 5/19 350 342 363 82�2 277 1102 51 1812A 2016 4/29 - 5/19 350 84 352 100�0 259 1129 52 2013A 2012 4/27- 5/03 25 3 25 100�0 11 32 0 013A 2012 5/04- 5/24 15 1 15 100�0 0 0 0 -13A 2013 4/26- 5/02 25 4 25 100�0 17 52 2 1213A 2013 5/03- 5/23 15 2 15 100�0 8 30 0 013A 2014 4/25- 5/01 5 4 5 100�0 2 6 0 013A 2014 5/02- 5/22 5 0 5 - 0 0 0 -13A 2015 4/24- 5/21 5 2 5 100�0 5 2 1 2013A 2015 5/01- 5/21 5 0 5 - 2 4 0 013A 2016 4/22 - 5/19 5 6 5 66�7 3 10 2 6713A 2016 4/29 - 5/19 5 2 5 100�0 5 5 3 6013B North 2012 4/27- 5/03 1 32 1 3�1 1 1 1 10013B North 2012 5/04- 5/24 1 13 1 �0 0 0 0 -13B North 2013 4/26- 5/02 1 24 1 4�2 1 3 1 10013B North 2013 5/03- 5/23 1 9 1 11�1 - - - -13B North 2014 4/25-5/01 1 20 1 5�0 1 1 1 10013B North 2014 5/02- 5/22 1 7 1 �0 1 4 1 10013B North 2015 4/24- 5/21 2 30 2 6�7 1 1 1 10013B North 2015 5/01- 5/21 2 11 2 �0 2 2 2 10013B North 2016 4/22 - 5/19 2 26 2 7�7 - - - -13B North 2016 4/22 - 5/19 2 8 2 25�0 2 10 0 013B South 2012 4/27- 5/03 20 1 20 100�0 10 23 0 013B South 2012 5/04-5/24 15 1 13 100�0 10 36 3 3013B South 2013 4/26-5/02 20 6 20 100�0 6 9 6 10013B South 2013 5/03- 5/23 15 2 15 100�0 4 17 2 5013B South 2014 4/25-5/01 20 12 20 58�3 7 20 4 5713B South 2014 5/02- 5/22 15 2 15 100�0 7 40 0 013B South 2015 4/24- 5/21 20 13 20 69�2 13 40 5 3813B South 2015 5/01- 5/21 15 2 15 100�0 6 24 0 013B South 2016 4/22 - 5/19 20 3 20 100�0 11 33 4 3613B South 2016 4/29 - 5/19 15 0 15 - 5 20 0 017/18B 2012 4/27- 5/03 10 41 10 24�4 7 80 0 017/18B 2012 5/04- 5/24 10 12 10 33�3 10 35 2 2017/18B 2013 4/26- 5/02 10 42 10 21�4 10 44 0 017/18B 2013 5/03- 5/23 10 1 10 100�0 7 30 0 017/18B 2014 4/25- 5/01 10 37 10 21�6 10 33 2 2017/18B 2014 5/02- 5/22 10 9 10 33�3 5 18 0 017/18B 2015 4/24- 5/21 5 42 5 11�9 3 3 0 017/18B 2015 5/01- 5/21 5 4 5 �0 - - - -17/18B 2016 4/22 - 5/19 5 34 5 14�7 0 0 0 -17/18B 2016 4/29 - 5/19 5 2 5 50�0 0 0 0 -19A 2015 4/24-5/21 5 79 5 6�3 0 0 0 -19A 2015 5/01- 5/21 5 7 5 �0 5 15 5 100

98 Hunt Arizona 2017
Turkey Harvest Data
5-Year: 2012-2016 Harvest
Unit Year Dates PermitsAuthorized
1st ChoiceApplicants
PermitsIssued
DrawOdds Hunters Hunter
Days Harvest HuntSuccess
SPRING SHOTGUN-SHOOTING SHOT19A 2015 4/24 - 5/21 5 79 5 6�3 0 0 0 -19A 2015 5/01 - 5/21 5 7 5 0�0 5 15 5 10019A 2016 4/22 - 5/19 4 56 9 7�1 7 18 2 2919A 2016 4/29 - 5/19 4 11 4 18�2 4 6 4 10020A 2012 4/27-5/03 10 78 10 10�3 10 40 6 6020A 2012 5/04- 5/24 10 22 10 18�2 10 49 0 020A 2013 4/26- 5/02 10 133 10 7�5 - - - -20A 2013 5/03- 5/23 10 14 10 �0 7 23 3 4320A 2014 4/25- 5/01 10 109 10 9�2 7 17 3 4320A 2014 5/02- 5/22 10 16 10 25�0 10 44 4 4020A 2015 4/24- 5/21 10 136 10 7�4 10 27 10 10020A 2015 5/01- 5/21 10 8 10 �0 10 46 6 6020A 2016 4/22 - 5/19 10 129 14 7�0 13 47 8 6220A 2016 4/29 - 5/19 10 35 10 14�3 10 24 6 6021 2014 4/25- 5/01 2 44 2 4�5 2 3 2 10021 2014 5/02- 5/22 2 7 2 �0 - - - -21 2014 5/02- 5/22 10 16 10 25�0 10 44 4 4021 2015 4/24- 5/21 10 136 10 7�4 10 27 10 10021 2016 4/22 - 5/19 2 33 7 6�1 3 6 1 3321 2016 4/22 - 5/19 2 7 2 0�0 2 4 0 022 2012 4/27- 5/03 130 249 130 40�2 101 461 7 722 2012 5/04- 5/24 130 45 130 91�1 88 390 4 522 2013 4/26-5/02 100 238 100 35�7 83 300 3 422 2013 5/03- 5/23 100 34 100 52�9 64 297 6 922 2014 4/25- 5/01 100 216 100 38�9 83 303 14 1722 2014 5/02- 5/22 100 46 100 80�4 77 268 0 022 2015 4/24- 5/21 80 267 80 25�8 46 166 3 722 2015 5/01- 5/21 80 33 80 51�5 53 267 3 622 2016 4/22 - 5/19 80 182 85 39�0 61 234 8 1322 2016 4/29 - 5/19 80 39 80 64�1 57 286 3 523 2012 4/27- 5/03 225 1028 225 21�0 176 642 35 2023 2012 5/04- 5/24 225 106 225 44�3 173 675 28 1623 2013 4/26- 5/02 225 900 225 23�3 193 806 29 1523 2013 5/03- 5/23 225 106 225 39�6 165 702 22 1323 2014 4/25- 5/01 225 978 225 22�1 176 585 32 1823 2014 5/02- 5/22 225 114 225 45�6 185 727 17 923 2015 4/24- 5/21 225 1250 225 17�0 170 698 28 1623 2015 5/01- 5/21 225 126 225 47�6 194 806 25 1323 2016 4/22 - 5/19 225 1065 283 20�2 223 904 25 1123 2016 4/29 - 5/19 225 227 229 39�2 159 575 18 1124A 2012 4/27- 5/03 2 19 2 10�5 1 7 0 024A 2012 5/04- 5/24 2 0 2 - 2 2 2 10024A 2013 4/26- 5/02 2 16 2 12�5 2 6 2 10024A 2013 5/03- 5/23 2 0 2 - 2 19 1 5024A 2014 4/25- 5/01 2 29 2 6�9 2 18 0 024A 2014 5/02- 5/22 2 1 2 100�0 0 0 0 -24A 2015 5/01-5/21 2 4 2 25�0 - - - -24A 2015 5/01- 5/21 2 4 2 25�0 - - - -24A 2016 4/22 - 5/19 2 29 3 6�9 3 8 3 10024A 2016 4/29 - 5/19 2 1 2 0�0 - - - -27 2012 4/27- 5/03 200 502 200 31�1 168 546 70 4227 2012 5/04- 5/24 200 87 200 56�3 149 522 47 3227 2013 4/26- 5/02 200 761 200 20�9 163 611 63 3927 2013 5/03- 5/23 200 68 200 51�5 168 632 49 2927 2014 4/25-5/01 300 728 300 28�0 242 892 83 3427 2014 5/02- 5/22 250 90 250 64�4 190 810 52 2727 2015 4/24-5/21 325 942 325 24�0 270 939 114 4227 2015 5/01- 5/21 275 108 275 55�6 231 879 80 3527 2016 4/22 - 5/19 400 914 455 33�9 381 1453 123 3227 2016 4/29 - 5/19 325 153 331 68�6 244 803 69 2829/30A 2012 4/27- 5/03 2 82 2 2�4 2 4 2 10029/30A 2012 5/04- 5/24 2 19 2 �0 2 6 2 100

Hunt Arizona 2017 99
Turkey Harvest Data
5-Year: 2012-2016 Harvest
CN= Camp Navajo
Unit Year Dates PermitsAuthorized
1st ChoiceApplicants
PermitsIssued
DrawOdds Hunters Hunter
Days Harvest HuntSuccess
SPRING SHOTGUN-SHOOTING SHOT29/30A 2013 4/26- 5/02 5 191 5 2�6 5 10 5 10029/30A 2013 5/03- 5/23 5 43 5 7�0 5 10 5 10029/30A 2014 4/25- 5/01 6 162 6 3�7 6 23 6 10029/30A 2014 5/02- 5/22 6 36 6 2�8 6 21 6 10029/30A 2015 4/24- 5/21 7 195 7 3�6 7 23 7 10029/30A 2015 5/01- 5/21 7 45 7 �0 7 8 7 10029/30A 2016 4/22 - 5/19 7 255 7 2�4 7 26 4 5729/30A 2016 4/29 - 5/19 7 41 7 0�0 7 11 7 10031 2012 4/27 - 5/03 3 121 3 2�5 3 6 2 6731 2012 5/04 - 5/24 3 24 3 4�2 3 15 2 6731 2013 4/26 - 5/02 3 77 3 3�9 3 15 0 031 2013 5/03 - 5/23 3 20 3 15�0 3 14 3 10031 2014 4/25 - 5/01 3 74 3 2�7 3 5 3 10031 2014 5/02 - 5/22 3 16 3 6�3 3 12 2 6731 2015 4/24 - 5/21 3 142 3 2�1 3 3 3 10031 2015 5/01 - 5/21 3 22 3 9�1 3 12 3 10031 2016 4/22 - 5/19 3 93 3 3�2 3 3 3 10031 2016 4/29 - 5/19 3 18 3 11�1 3 5 3 10032 2015 4/24 - 5/21 1 21 1 0�0 1 2 1 10032 2016 4/22 - 5/19 1 24 1 4�2 1 1 1 10033 2012 4/27 - 5/03 3 163 3 1�8 2 7 2 10033 2012 5/04 - 5/24 3 56 3 0�0 3 6 1 3333 2013 4/26 - 5/02 3 217 3 1�4 3 6 3 10033 2013 5/03 - 5/23 3 44 3 2�3 3 5 3 10033 2014 4/25 - 5/01 3 239 3 �8 3 8 3 10033 2014 5/02 - 5/22 3 30 3 3�3 3 8 2 6733 North 2015 5/01 - 5/21 5 271 5 1�5 5 10 5 10033 North 2015 4/24 - 5/21 5 63 5 1�6 5 5 5 10033 North 2016 4/22 - 5/19 5 198 6 2�5 6 15 5 8333 North 2016 4/29 - 5/19 5 56 6 1�8 6 8 3 5033 South 2015 5/01 - 5/21 1 33 1 3�0 - - - -34A 2012 4/27 - 5/03 1 32 1 3�1 1 1 1 10034A 2012 5/04 - 5/24 1 14 1 7�1 1 2 1 10034A 2013 4/26 - 5/02 1 60 1 1�7 1 1 0 034A 2013 5/03 - 5/23 1 15 1 0�0 1 3 1 10034A 2014 4/25 - 5/01 1 48 1 2�1 1 5 0 034A 2014 5/02 - 5/22 1 17 1 5�9 1 1 1 10034A 2015 4/24 - 5/21 1 53 1 1-9 - - - -34A 2015 5/01 - 5/21 1 19 1 0�0 1 4 1 10034A 2016 4/22 - 5/19 1 66 1 0�0 1 3 1 10034A 2016 4/29 - 5/19 1 16 1 6�3 1 1 1 10035A 2012 4/27 - 5/03 5 344 5 0�9 5 10 5 10035A 2012 5/04 - 5/24 5 66 5 6�1 5 14 5 10035A 2013 4/26 - 5/02 5 408 5 1�0 5 10 5 10035A 2013 5/03 - 5/23 5 78 5 1�3 5 25 4 8035A 2014 4/25 - 5/01 8 468 8 1�7 8 22 6 7535A 2014 5/02 - 5/22 8 77 8 5�2 8 24 7 8835A 2015 4/24 - 5/21 11 519 11 2�1 11 18 11 10035A 2015 5/01 - 5/21 11 89 11 4�5 11 53 9 8235A 2015 4/24 - 5/21 3 37 3 8�1 3 27 1 3335A 2016 4/22 - 5/19 11 513 11 2�1 11 35 11 10035A 2016 4/29 - 5/19 11 103 11 2�9 9 20 9 10035A 2016 4/22 - 5/19 3 26 3 11�5 2 6 0 035B 2014 4/25 - 5/01 2 56 2 3�6 2 8 2 10035B 2014 5/02 - 5/22 2 19 2 10�5 2 10 2 10035B 2015 4/24 - 5/21 3 61 3 4�9 3 6 2 6735B 2015 4/24 - 5/21 3 25 3 0�0 3 4 2 6735B 2016 4/22 - 5/19 3 69 4 1�4 4 24 4 10035B 2016 4/29 - 5/19 3 25 3 4�0 3 7 2 67CN 2012 4/27 - 5/24 15 3 10 100�0 5 23 2 40CN 2012 4/27 - 5/24 6 9 6 66�7 6 29 2 33CN 2013 4/26 - 5/23 15 0 9 - 5 14 0 0

100 Hunt Arizona 2017
Turkey Harvest Data
5-Year: 2012-2016 Harvest
Unit Year Dates PermitsAuthorized
1st ChoiceApplicants
PermitsIssued
DrawOdds Hunters Hunter
Days Harvest HuntSuccess
SPRING SHOTGUN-SHOOTING SHOTCN 2013 4/26 - 5/23 6 5 6 100�0 6 12 2 33CN 2014 4/25 - 5/22 15 6 10 100�0 8 30 0 0CN 2014 4/25 - 5/22 6 8 6 75�0 4 18 2 50CN 2015 4/24 - 5/21 8 5 8 100�0 8 16 3 38CN 2015 4/24 - 5/21 2 2 2 100�0 2 4 0 0CN 2015 4/24 - 5/21 2 0 2 - 2 8 0 0CN 2015 4/24 - 5/21 4 3 4 - - - - -CN 2016 4/22 - 5/19 8 7 8 100�0 5 53 0 0CN 2016 4/22 - 5/19 2 0 0 - - - - -CN 2016 4/22 - 5/19 2 1 2 - - - - -CN 2016 4/22 - 5/19 2 0 0 - - - - -CN 2016 4/22 - 5/19 2 0 2 - - - - -CN 2016 4/22 - 5/19 4 0 0 - - - - -CN 2016 4/22 - 5/19 4 5 4 - - - - -FTHU 2012 5/04 - 5/24 2 7 2 28�6 2 9 0 0FTHU 2013 4/26 - 5/23 2 41 3 7�3 3 9 3 100FTHU 2014 4/25 - 5/22 2 40 3 7�5 3 3 3 100SPRING YOUTH-ONLY (OTC= tags issued over-the-counter)1/27 2012 4/20- 4/26 100 123 100 80�5 86 281 22 261/27 2013 4/19- 4/25 100 198 100 49�0 91 270 57 633C 2012 4/20- 4/26 125 54 125 94�4 83 295 16 193C 2013 4/19- 4/25 125 57 125 100�0 120 418 16 133C 2014 4/18- 4/24 125 72 125 100�0 94 292 10 113C 2015 4/17- 5/21 75 76 75 94�7 53 146 9 176A 2011 4/15- 4/21 175 50 147 80�0 105 366 3 36A 2012 4/20- 4/26 110 69 110 92�8 85 272 19 226A 2013 4/19- 4/25 110 93 110 96�8 87 270 10 116A 2014 4/18- 4/24 110 94 110 100�0 94 279 11 126A 2015 4/17- 5/21 110 130 110 82�3 88 288 14 1623 2012 4/20- 4/26 125 94 125 95�7 90 235 20 2223 2013 4/19- 4/25 125 105 125 96�2 92 246 8 923 2014 4/18- 4/24 125 127 125 96�1 102 273 26 2523 2015 4/17- 5/21 125 132 125 89�4 117 351 33 28FALL (SHOTGUN-SHOOTING SHOT SEASON)1 2012 10/05-10/11 200 561 200 35�7 152 429 58 381 2013 10/04-10/10 200 779 200 25�7 167 493 64 381 2015 10/02-10/08 300 827 300 36�2 229 693 65 281 2016 9/30-10/06 350 843 350 41�2 280 901 92 333C 2012 10/05-10/11 125 286 125 38�5 99 261 49 493C 2013 10/04-10/10 150 406 150 30�3 129 402 31 243C 2015 10/02-10/08 125 398 125 31�2 93 289 24 263C 2016 9/30-10/06 125 382 125 32�7 103 305 35 344 2012 10/05-10/11 500 515 500 73�8 411 1381 91 224 2013 10/04-10/10 500 530 500 76�2 425 1328 78 184 2015 10/02-10/08 400 507 400 66�5 304 1026 48 164 2016 9/30-10/06 400 485 400 67�6 293 1044 34 125A 2013 10/05-10/11 350 329 350 85�7 273 895 39 75A 2014 10/04-10/10 350 344 350 80�2 285 921 34 135A 2015 10/02-10/08 250 366 250 65�3 208 581 18 95A 2016 9/30-10/06 200 292 200 67�5 145 457 13 95B South 2012 10/05-10/11 150 203 150 58�6 109 298 36 335B South 2013 10/04-10/10 150 234 150 62�0 138 396 26 195B South 2015 10/02-10/08 200 271 200 71�6 140 371 27 195B South 2016 9/30-10/06 200 329 200 60�5 151 917 39 266A 2012 10/05-10/11 525 897 525 57�1 445 1273 82 186A 2013 10/04-10/10 525 915 524 56�5 430 1212 88 206A 2015 10/02-10/08 575 867 575 64�1 438 1296 57 136A 2016 9/30-10/06 575 964 575 58�0 412 2886 28 76B 2012 10/05-10/11 300 180 300 98�9 226 694 61 276B 2013 10/04-10/10 300 240 300 96�7 257 774 46 186B 2015 10/02-10/08 200 198 200 82�3 169 521 12 76B 2016 9/30-10/06 200 192 200 85�9 143 838 19 13
SPRING SHOTGUN-SHOOTING SHOT

Hunt Arizona 2017 101
Turkey Harvest Data
Unit Year Dates PermitsAuthorized
1st ChoiceApplicants
PermitsIssued
DrawOdds Hunters Hunter
Days Harvest HuntSuccess
SPRING SHOTGUN-SHOOTING SHOT7 2012 10/05-10/11 350 217 350 99�5 269 886 36 137 2013 10/04-10/10 350 244 350 99�6 266 823 66 257 2015 10/02-10/08 250 237 250 85�2 181 549 22 127 2016 9/30-10/06 250 218 250 89�9 206 697 13 68/10 2012 10/05-10/11 600 649 600 85�7 462 1463 66 148/10 2013 10/04-10/10 600 717 600 77�7 504 1655 74 158/10 2015 10/02-10/08 500 617 500 78�9 398 1260 120 308/10 2016 9/30-10/06 500 564 500 83�2 399 1360 19 59 2012 10/05-10/11 100 110 100 88�2 91 309 11 129 2013 10/04-10/10 75 93 75 73�1 65 195 22 349 2015 10/02-10/08 75 76 75 88�2 59 166 10 179 2016 9/30-10/06 75 106 75 67�0 46 133 0 012A 2012 10/05-10/11 1000 275 536 100�0 391 1115 145 3712A 2013 10/04-10/10 1000 322 668 100�0 511 1331 287 5612A 2015 10/02-10/08 1000 467 703 100�0 525 1560 202 3812A 2016 9/30-10/06 1000 458 706 100�0 487 1641 148 3022 2012 10/05-10/11 200 197 200 82�7 148 393 29 2022 2013 10/04-10/10 200 223 200 80�7 168 441 14 822 2015 10/02-10/08 175 178 175 79�2 125 353 26 2122 2016 9/30-10/06 175 206 175 78�2 113 361 2 223 2012 10/05-10/11 600 777 600 73�0 488 1572 109 2223 2013 10/04-10/10 600 775 600 71�1 516 1587 97 1923 2015 10/02-10/08 650 738 650 79�9 498 1513 147 3023 2016 9/30-10/06 650 783 650 76�1 542 1881 64 1227 2012 10/05-10/11 300 365 300 64�9 217 630 77 3527 2013 10/04-10/10 300 443 300 48�5 243 770 80 3327 2015 10/02-10/08 350 456 350 59�4 263 817 63 2427 2016 9/30-10/06 350 393 350 64�6 266 930 77 29
Unit Year Hunters Hunter Days Harvest Hunt Success1 2012 226 934 10 41 2013 268 1207 21 81 2014 241 1083 17 71 2016 300 1427 18 63B 2012 84 352 10 123B 2013 83 464 10 123B 2014 77 284 0 03B 2016 53 229 0 03C 2012 63 247 7 113C 2013 41 206 0 03C 2014 60 232 9 153C 2016 18 88 18 1004 2012 105 373 0 04 2013 196 970 0 04 2014 77 507 0 04 2016 106 634 18 175A 2012 108 537 7 65A 2013 62 299 0 05A 2014 43 189 0 05A 2016 18 88 0 05B 2012 101 369 0 05B 2013 83 279 0 05B 2014 17 52 0 05B 2016 88 599 0 06 2013 10 52 0 06A 2012 411 1753 10 26A 2013 588 2538 10 26A 2014 249 1006 9 46A 2016 335 1744 18 56B 2012 66 282 0 0
Fall Archery-only Turkey 2012-2016 (2015 data unavailable)

Hunt Arizona 2017 102
Unit Year Hunters Hunter Days Harvest Hunt Success6B 2013 83 433 0 06B 2014 86 464 0 06B 2016 18 53 0 07 2012 157 787 0 07 2013 196 1310 10 57 2014 120 619 0 07 2016 176 1357 0 08 2012 153 659 0 08 2013 144 887 0 08 2014 60 559 0 08 2016 53 229 18 349 2012 28 91 0 09 2014 17 43 0 010 2012 45 206 0 010 2013 41 258 10 2410 2014 9 17 0 011M 2012 28 101 0 011M 2013 62 330 0 011M 2014 77 473 0 012A 2012 213 1631 14 712A 2013 155 1032 31 2012A 2014 112 662 0 012A 2016 88 705 0 017 2012 17 216 0 017 2013 10 0 0 017 2014 26 129 0 020A 2012 164 861 17 1020A 2013 21 72 0 020A 2014 26 138 0 020B 2014 9 9 0 022 2012 105 352 0 022 2013 72 289 10 1422 2014 43 129 0 022 2016 35 106 0 023 2012 383 1512 42 1123 2013 382 1857 10 323 2014 215 920 17 823 2016 141 775 0 027 2012 209 808 31 1527 2013 309 1578 21 727 2014 189 860 0 027 2016 176 969 0 0
Fall Archery-only Turkey 2012-2016 (2015 data unavailable)

Hunt Arizona 2017 103
Natural HistoryThe javelina, or collared peccary, is of tropical origin and only recently arrived in the Southwest. Peccary bones are not found in Arizona archaeological sites, and early settlers made infrequent references to the occurrence of javelina. Perhaps the javelina spread northward as scrub and cactus replaced Arizona’s native grasslands. For whatever reason, the range of javelina is still expanding, primarily northwestward. The species occurs in the United States only in Arizona, Texas, and New Mexico, and currently occupies approximately 34 percent of Arizona.
Adult javelina usually weigh between 35 and 60 pounds, the males being slightly heavier than the fe-males. Newborn javelina only weigh about one pound.
These “piglets” are tan or brown in color with a red-dish dorsal stripe. They acquire the salt and pepper appearance of the adults in about three months. The whitish-banded black hairs are up to six inches long, with the hairs on the mane being the darkest and lon-gest. In the winter, when the javelina’s coat is dense and dark, a distinct, lighter-colored “collar” is visible. In summer, when the hair is shorter and lighter, this “col-lar” is less distinct.
Javelina continue to grow until they reach adult height in about 10 months. At this age both sexes are mature. Peccaries breed throughout the year, which, when combined with their early maturity and ability to have two litters per year, gives them the greatest re-productive potential of any North American big-game
mammal. The gestation period is 145 days, with most births occurring in June, July, and August. A smaller birth peak occurs in spring, corresponding with Arizona’s biseasonal rainfall seasons. Unlike other animals, javelina do not lick their offspring at birth, but roll or tumble their young. The usual litter size is two, and the precocial piglets closely follow their mothers from shortly after birth until they are weaned at about six weeks of age.
Although javelina have lived as long as 24 years in captivity, the average life span in the wild is closer to seven or eight years. Coyotes and golden eagles are effective predators of juvenile javelina, and the adults are preyed upon by mountain lions, bobcats, and bears.
Javelina are opportunistic feeders, eat-ing the flowers, fruits, nuts, and berries of a great variety of plants. Prickly pear cactus makes up the major portion of their diet, however, along with agaves, yucca roots, and other desert succulents.
Javelina are social animals with herd sizes averaging eight to nine animals. Ter-ritories are marked by droppings and by an oily secretion produced by the animal’s
Javelina (Tayassu tajacu)
BOB
MIL
ES

104 Hunt Arizona 2017
Javelina
scent gland positioned on its back. Any intruding ja-velina will be met by an aggressive display, which will evolve into a fight unless the interloper withdraws. The size of a herd’s territory varies with the productivity of the habitat, but averages about 750 acres.
Hunt HistoryJavelina were not legally designated as big game un-til 1929, when a season from No-vember 1 through January 31 was authorized and a bag limit of one ja-velina a year was imposed. Hunter
interest gradually increased, particularly among non-residents, and the javelina became an important game animal in Arizona after World War II. By 1950, hunt-ers were purchasing nearly 10,000 javelina tags and taking more than 1,000 animals a year. In 1959, an ar-chery javelina season was initiated, and by 1971 more than 30,000 hunters were harvesting more than 6,000 javelina a year. This pressure was deemed excessive in some game management units, and permit-only fire-arm hunting was instituted in 1972. To further curtail hunt pressure and better distribute hunters, permit-on-ly HAM (handgun, archery, and muzzleloader) hunts were initiated in 1974, and archery hunting was lim-ited to permit-only hunting in 1992. In 1992, juniors only permits were authorized. Today, general firearms, HAM, archery and juniors-only seasons are offered in most units. In some units, there are permits that go unissued.
Javelina distribution

Hunt Arizona 2017 105
Historic Summary of Javelina Survey Data
Javelina Survey Data
Year No� of Herds Observed1
Total Javelina Observed
Average Herd Size1
Classification Young/100 AdultsAdult Young Unclassified
1955 0 511 – 233 74 204 321956 0 324 – 201 75 48 371957 0 447 – 328 115 4 351958 35 346 9�9 258 88 0 341959 31 272 8�8 217 55 0 251960 87 677 7�8 391 120 166 311961 89 700 7�9 392 108 200 281962 109 1003 9�2 667 267 69 401963 123 1086 8�8 654 296 136 451964 114 768 6�7 560 207 1 371965 160 1033 6�5 709 219 105 311966 159 1197 7�5 703 362 132 511967 107 639 6�0 496 86 57 171968 123 872 7�1 613 221 38 361969 113 932 8�3 609 203 120 331970 216 1757 8�1 1266 414 77 331971 220 1666 7�6 1063 480 123 451972 143 1158 8�1 679 255 224 381973 184 1683 9�2 1121 372 190 331974 156 1408 9�0 1035 306 67 301975 234 1830 7�8 1418 332 80 231976 297 2435 8�2 1745 609 81 351977 213 1664 7�8 1119 362 183 321978 321 3051 9�5 2249 667 135 301979 326 3148 9�7 2385 688 75 291980 443 3688 8�3 2865 762 61 271981 384 3503 9�1 2635 807 61 311982 356 3266 9�2 2390 780 96 331983 328 3374 10�3 2502 796 76 321984 404 4074 10�1 3085 946 43 311985 561 5431 9�7 4043 1181 207 291986 536 5051 9�4 3903 1127 21 291987 719 6230 8�7 4923 1205 102 241988 656 5932 9�0 4606 1323 3 291989 663 5662 8�5 4645 1017 0 221990 559 4887 8�7 3839 1034 14 271991 596 5128 8�6 4008 1058 62 261992 571 5247 9�2 4142 1060 45 261993 591 5016 8�5 3969 1019 28 261994 767 6739 8�8 5485 1141 113 211995 682 5870 8�6 4763 1106 1 231996 674 5427 8�0 4582 817 28 181997 579 4684 8�1 3714 967 3 261998 538 4725 8�8 3666 1057 2 291999 553 4715 8�5 3831 807 77 212000 484 3907 8�0 3174 725 8 232001 562 4920 8�7 4007 904 9 232002 411 3058 7�4 2565 490 3 192003 468 3974 8�4 3128 831 15 272004 401 3435 8�5 2775 656 4 242005 450 3525 7�8 2843 675 7 242006 458 3867 8�4 3074 712 81 232007 448 3511 7�8 2913 584 14 202008 379 3237 8�5 2500 726 11 292009 390 3455 8�8 2848 593 14 212010 370 3323 8�9 2537 755 31 302011 451 4028 8�9 3212 765 51 242012 476 3891 8�1 3254 617 20 192013 456 3881 8�5 3103 768 10 252014 110 1029 9�3 858 169 2 202015 84 833 9�9 663 166 4 252016 229 2430 10�6 2040 390 0 19
1 Excluding single animalsNote: The year given represents the beginning of the survey period, which runs from December through March�Thus, surveys listed for 2010 were conducted from December 2010 through March 2011�

106 Hunt Arizona 2017
Javelina Survey Data
5-Year: 2012-2016 Javelina Survey Data
Unit Year No� of Herds Observed¹
Total Javelina Observed
Average Herd Size¹
Classification Young/100 AdultsAdult Young Unclassified
4 2013 4 21 5�3 15 6 0 404 2014 1 12 12�0 9 3 0 334 2015 2 11 5�0 9 2 0 225 2015 2 8 4�0 8 0 0 005A 2013 1 14 14�0 11 3 0 2705A 2015 1 6 6�0 6 0 0 005B 2014 1 9 9�0 6 3 0 5006A 2013 10 71 7�1 61 10 0 1606A 2014 3 44 14�7 36 8 0 2206A 2015 5 55 11�0 40 15 0 3806B 2013 4 24 5�8 21 3 0 1406B 2014 4 35 8�8 26 9 0 3506B 2015 4 23 5�8 18 5 0 2807E 2013 0 1 - 1 0 0 007W 2013 1 3 3�0 3 0 0 08 2013 2 14 7�0 11 3 0 2710 2013 4 20 5�0 13 7 0 5410 2014 2 15 7�5 12 3 0 2510 2015 4 37 9�3 23 14 0 6110 2016 1 3 2�0 3 0 0 015A 2013 1 6 6�0 3 3 0 10015A 2014 1 18 18�0 13 5 0 3815A 2015 1 12 12�0 11 1 0 915B 2013 2 10 5�0 4 6 0 15015B 2014 6 51 8�5 41 10 0 2415B 2015 1 2 2�0 2 0 0 015D 2016 2 20 10�0 17 3 0 1816A 2013 5 39 7�6 31 8 0 2616A 2014 8 102 12�8 78 24 0 3116A 2015 7 97 13�9 69 28 0 4116A 2016 10 106 10�6 88 18 0 2017A 2013 1 2 2�0 2 0 0 017A 2014 4 41 10�0 37 4 0 1117A 2015 2 18 9�0 17 1 0 617A 2016 5 40 8�0 31 9 0 2917B 2013 9 103 11�4 83 20 0 2417B 2014 7 90 12�9 68 22 0 3217B 2015 10 107 10�7 81 26 0 3217B 2016 7 72 10�1 61 11 0 1818A 2013 7 65 9�3 46 19 0 4118A 2014 5 40 8�0 29 11 0 3818A 2015 7 71 10�1 65 6 0 918A 2016 6 74 12�3 55 19 0 3518B 2013 15 116 7�7 92 24 0 2618B 2014 7 85 12�1 75 10 0 1318B 2015 13 135 10�4 114 21 0 1818B 2016 22 299 13�6 251 48 0 1919A 2013 9 98 10�9 66 22 10 3319A 2014 3 16 5�3 12 4 0 3319A 2015 6 59 9�8 42 13 4 3119A 2016 6 51 8�5 46 5 0 1119B 2013 12 129 10�8 104 25 0 2419B 2014 3 22 7�3 18 4 0 2219B 2015 5 35 7�0 31 4 0 1319B 2016 8 63 7�8 47 16 0 3420A 2013 7 60 8�6 50 10 0 2020A 2014 2 16 8�0 14 2 0 1420A 2015 14 121 8�6 97 24 0 2520A 2016 12 106 8�8 80 26 0 3320B 2013 21 183 8�7 146 37 0 2520B 2014 15 144 9�5 108 36 0 3320B 2015 19 225 11�8 177 48 0 27

Hunt Arizona 2017 107
Javelina Survey Data
5-Year: 2012-2016 Javelina Survey Data
Unit Year No� of Herds Observed¹
Total Javelina Observed
Average Herd Size¹
Classification Young/100 AdultsAdult Young Unclassified
20B 2016 29 340 11�7 306 34 0 1120C 2013 34 374 11�0 311 63 0 2020C 2014 37 356 9�6 312 44 0 1420C 2015 39 416 10�6 324 82 10 2520C 2016 34 339 9�9 299 40 0 1321 2013 7 69 9�9 58 11 0 1921 2014 8 66 8�0 51 15 0 2921 2015 8 109 13�6 91 18 0 2021 2016 13 148 11�4 125 23 0 1822 2013 9 98 10�9 81 17 0 2122 2014 6 47 7�8 41 6 0 1522 2015 9 97 10�8 75 22 0 2922 2016 15 187 12�3 151 36 0 2423 2013 18 206 11�4 146 60 0 4123 2014 12 162 13�4 122 40 0 3323 2015 9 101 11�2 80 21 0 2623 2016 10 118 11�8 97 21 0 2224A 2013 12 79 6�6 62 17 0 2724A 2014 12 78 6�4 65 13 0 2024A 2015 8 68 8�5 55 13 0 2424A 2016 8 91 11�4 70 21 0 3024B 2013 12 109 9�0 96 13 0 1424B 2014 19 203 10�6 146 57 0 3924B 2015 18 189 10�5 155 34 0 2224B 2016 12 129 10�8 101 28 0 2825M 2013 6 62 10�3 49 13 0 2725M 2014 12 90 7�5 78 12 0 1525M 2015 7 75 10�7 57 18 0 3227 2013 6 41 6�8 30 11 0 3727 2014 6 51 8�2 46 5 0 1127 2015 4 65 16�3 50 15 0 3027/28 2015 1 5 5�0 5 0 0 028 2013 19 133 7�0 102 31 0 3028 2014 8 61 7�5 51 10 0 2028 2015 9 71 7�8 59 12 0 2029 2013 9 67 7�3 57 10 0 1829 2014 4 28 6�8 20 8 0 4029 2015 10 78 7�8 64 14 0 2230A 2013 19 124 6�5 105 19 0 1830A 2014 25 193 7�7 152 41 0 2730A 2015 27 225 8�3 191 34 0 1830B 2013 9 52 5�8 34 18 0 5330B 2014 1 13 13�0 8 5 0 6330B 2015 18 141 7�8 103 38 0 3731 2013 12 84 7�0 69 15 0 2231 2014 20 187 9�4 155 32 0 2131 2015 11 112 10�2 97 15 0 1532 2013 13 112 8�6 90 22 0 2432 2014 10 76 7�6 61 15 0 2532 2015 17 174 10�2 148 26 0 1833 2013 5 39 7�8 35 4 0 1133 2014 5 30 6�0 25 5 0 2033 2015 1 9 9�0 6 3 0 5034A 2013 15 156 10�4 125 31 0 2534A 2014 10 90 8�9 75 15 0 2034A 2015 14 169 12�1 116 53 0 4634B 2013 9 70 7�8 48 22 0 4634B 2014 3 28 9�3 24 4 0 1734B 2015 11 102 9�3 80 22 0 2835A 2013 14 101 7�2 76 25 0 3335A 2014 10 70 6�9 55 15 0 2735A 2015 18 180 10�0 120 47 13 39

108 Hunt Arizona 2017
Javelina Survey Data
5-Year: 2012-2016 Javelina Survey Data
Unit Year No� of Herds Observed¹
Total Javelina Observed
Average Herd Size¹
Classification Young/100 AdultsAdult Young Unclassified
35B 2013 8 63 7�9 52 11 0 2135B 2014 14 142 10�1 112 30 0 2735B 2015 13 129 9�9 94 27 8 2936A 2013 17 154 9�1 110 44 0 4036A 2014 15 164 10�9 132 32 0 2436A 2015 17 185 10�8 141 44 0 3136B 2013 9 70 7�7 53 17 0 3236B 2014 9 119 13�1 102 17 0 1736B 2015 10 111 11�1 88 23 0 2636C 2013 11 141 12�6 123 18 0 1536C 2014 7 73 10�3 57 16 0 2836C 2015 7 60 8�4 46 14 0 3037A 2013 15 93 6�1 75 18 0 2437A 2014 11 110 10�0 67 43 0 6437A 2015 16 156 9�6 112 44 0 3937B 2013 32 271 8�4 244 27 0 1137B 2014 23 187 8�1 125 45 17 3637B 2015 31 419 13�4 316 79 24 2539/40 2014 0 1 - 0 0 1 -39/41 2013 1 3 3�0 3 0 0 039/41 2014 0 1 - 0 0 1 -40A 2013 2 15 7�0 12 3 0 2540A 2014 1 3 3�0 3 0 0 040A 2015 1 15 14�0 0 0 15 -40A 2016 7 75 10�6 64 11 0 1740B 2015 2 10 5�0 9 1 0 1141 2013 1 3 3�0 3 0 0 041 2014 0 1 - 0 0 1 -42 2013 11 68 6�0 57 11 0 1942 2014 9 55 6�1 44 11 0 2542 2015 7 50 7�1 25 7 18 2842 2016 12 100 8�3 87 13 0 1544A 2013 5 35 6�8 29 6 0 2144A 2014 6 48 7�8 41 7 0 1744A 2015 4 32 8�0 23 4 5 1744A 2016 10 69 6�8 61 8 0 13
Summary of Fall General Javelina HuntsYear Permits
Authorized1st Choice Applicants Permits Issued Hunters Hunter Days Total Harvest Percent Success
2007 920 3154 920 649 2113 122 19
Summary of Fall HAM1 Javelina HuntsYear Permits
Authorized1st Choice Applicants Permits Issued Hunters Hunter Days Total Harvest Percent Success
2007 605 965 605 447 1365 50 11
Summary of Fall Archery Javelina HuntsYear Permits
Authorized1st Choice Applicants Permits Issued Hunters Hunter Days Total Harvest Percent Success
2007 660 458 645 445 1443 21 5
Summary of Youth-Only Archery Javelina Hunts
Year¹ Permits Authorized
1st Choice Applicants Permits Issued Hunters Hunter Days Total Harvest Percent Success
2012 850 552 710 543 1432 130 242013 830 745 800 588 1620 172 292014 805 672 770 582 1688 94 162015 780 714 738 618 1677 157 252016 780 674 723 557 1465 162 29

Hunt Arizona 2017 109
Javelina Survey Data
Year¹ Permits Authorized
1st Choice Applicants Permits Issued Hunters Hunter Days Total Harvest Percent Success
1950 – – 9294 7788 – 1344 171951 – – 9995 8625 – 1851 221952 – – 12581 10496 – 1762 171953 – – 15095 13320 – 2510 191954 – – 15299 14829 – 2661 181955 – – 16832 14778 – 3142 211956 – – 17644 14851 – 2930 201957 – – 18724 16672 – 2236 131958 – – 17156 12344 23716 2172 181959 – – 14279 11900 23434 2725 231960 – – 16070 13857 – 2759 201961 – – 19817 17191 29735 3700 221962 – – 22678 19138 41787 3845 201963 – – 24940 21690 46093 4417 201964 – – 24653 20985 46195 5247 251965 – – 24393 20976 44818 4763 231966 – – 25796 21838 46028 4849 221967 – – 28386 23892 52780 4804 201968 – – 29793 26551 62345 4794 181969 – – 32400 28844 65775 5651 201970 – – 33062 30603 66448 6278 211971 – – 31208 27703 59943 5890 211972 25350 22855 25350 21450 44178 3819 181973 24275 26738 24275 20130 41189 4559 231974 22950 29708 22950 19222 39258 5007 261975 22300 30889 22300 19017 39409 4587 241976 20725 32657 20725 17435 35956 4172 241977 20525 33561 20525 17148 35890 4225 251978 19950 31685 19950 16075 32666 3449 221979 18560 28969 18560 15397 32551 3717 241980 17460 29690 17460 14354 33299 3672 261981 15785 32330 15785 12986 29477 3642 281982 15355 28007 15355 12627 30540 3075 241983 15170 21204 15170 13400 32250 3269 241984 16120 20052 16120 13975 35149 3638 261985 15145 20143 15145 13067 32970 3539 271986 15975 23247 15975 13725 33473 3743 271987 15890 21710 15890 13979 34330 4220 301988 15885 21737 15885 14129 35067 4432 311989 15310 20444 15310 13569 34861 3240 241990 14325 18859 14325 12565 31314 3468 281991 13225 16614 13900 12165 31618 2856 241992 13800 10394 13255 12360 32183 3158 261993 13880 10407 13787 11902 29035 3126 261994 13915 10867 13890 12382 31672 3536 291995 13440 11086 13433 11926 31928 2781 231996 13360 11151 13307 11938 31600 3444 291997 12620 11296 12622 11085 30147 2952 271998 12410 11835 12444 10493 27482 2520 241999 12200 12053 11937 10506 28005 2784 262000 12195 11603 12194 10793 27700 3182 292001 12105 12517 12110 10336 28124 2291 222002 11705 10941 11702 10256 27685 2823 282003 11900 11428 11920 10153 27419 2348 232004 11300 12879 11292 9747 26424 2393 252005 11090 13790 11207 8628 23772 1729 202006 11145 10972 11043 9538 26024 2544 272007 11500 9076 11170 9778 26632 2587 262008 11721 8106 11138 9536 26185 2008 212009 11696 7521 10593 9235 26543 1971 212010 11496 7054 11139 9621 26127 2208 232011 11496 6553 11207 9518 25955 2343 25
Historic Summary of Spring General Javelina Hunts

110 Hunt Arizona 2017
Javelina Hunt Data
Year Permits Authorized
1st Choice Applicants Permits Issued Hunters Hunter Days Total Harvest Percent Success
1992 150 75 120 103 225 20 191993 150 92 140 125 283 31 251994 150 88 148 138 289 49 361995 150 50 89 78 198 16 211996 250 131 197 191 396 65 341997 370 179 256 229 570 84 371998 420 244 324 300 738 74 251999 380 304 338 297 631 111 372000 480 353 444 397 824 159 402001 530 453 509 443 986 110 252002 460 942 460 385 812 149 392003 460 957 460 401 915 124 312004 485 609 485 430 1030 117 272005 535 611 550 447 983 151 342006 670 682 645 522 1241 172 332007 865 896 809 729 1841 314 432008 970 866 818 684 1614 273 402009 990 661 781 702 1865 231 332010 1020 779 886 757 1865 285 382011 1025 860 912 809 1969 311 382012 1050 816 940 804 2070 325 402013 1060 834 994 773 1706 242 312014 1120 972 1098 924 2379 249 272015 1145 1164 1138 922 2349 357 392016 1070 1109 1043 901 2146 338 382017 1145 1299 1145 905 2045 465 51
Historic Summary of Spring HAM1 Javelina Hunts
Year Permits Authorized
1st Choice Applicants Permits Issued Hunters Hunter Days Total Harvest Percent Success
1974 100 302 100 79 166 30 381975 100 246 100 82 127 29 351976 900 1046 900 711 1484 90 131977 925 1117 925 689 1385 104 151978 1700 1348 1700 1290 2623 145 111979 1850 1440 1850 1454 3128 212 151980 3000 2108 3000 2250 5178 367 161981 3750 2755 3750 2986 7545 544 181982 3850 3502 3850 3079 7771 482 161983 5990 3226 5990 4476 11313 824 181984 6375 3517 6375 4436 11775 878 201985 8180 4272 8116 5653 14835 1109 201986 7620 5446 7620 6316 16558 1180 191987 8200 5500 7719 6382 16289 1728 271988 6500 6208 6500 5655 15148 1133 201989 6075 6023 6075 5287 14271 991 191990 6980 6229 6980 5964 16286 1289 22
1 Prior to 1982, hunts were for handgun, handgun/archery, and/or archery/muzzleloader�2 Including special fall archery/shotgun hunts�
Year¹ Permits Authorized
1st Choice Applicants Permits Issued Hunters Hunter Days Total Harvest Percent Success
2012 11571 6983 11342 9964 28222 2363 242013 11721 7229 11712 9953 28424 2892 292014 11696 7637 11664 9914 29207 2222 222015 11493 9339 11481 9995 29325 2220 222016 11471 8601 11270 8620 28125 2280 242017 11471 9568 11390 9483 26838 2875 30
Historic Summary of Spring General Javelina Hunts
Historic Summary of Spring Youth-Only Javelina Hunts

Hunt Arizona 2017 111
Javelina Hunt Data
Historic Summary of Spring Youth-Only Javelina Hunts
Year Permits Authorized
1st Choice Applicants Permits Issued Hunters Hunter Days Total Harvest Percent Success
19912 7340 6433 6991 6159 16796 929 151992 6740 4050 5786 5191 14667 951 181993 7665 4674 6839 5704 14961 973 171994 8150 5081 7875 7081 19553 1587 221995 8070 5553 8004 7034 19908 1186 171996 8210 5888 8012 7033 20053 1456 211997 8360 6088 8155 7229 20571 1387 191998 7685 5888 7531 6462 17451 1014 161999 7760 6184 7176 6287 17805 1281 202000 7260 6321 7262 6360 17621 1311 212001 6775 6034 6738 5812 17175 957 162002 6600 5377 6601 5705 16990 1148 202003 7050 5644 7059 5992 18169 860 142004 6550 5779 6550 5637 16683 1066 192005 6500 5342 6537 5018 14657 692 142006 6400 4868 6040 5226 15810 1141 222007 5465 4763 5205 4510 14278 878 192008 5440 4366 4838 4137 12768 692 172009 5405 3937 4616 3975 12617 730 182010 5510 3739 4950 4314 13563 997 232011 5545 3402 4739 4116 12951 1011 252012 5545 3610 4873 4276 13908 847 202013 5375 3584 5292 4565 15215 1028 232014 5405 3535 5316 4579 15417 891 192015 5420 4003 5401 4650 15944 899 192016 5480 3567 5262 4494 14829 1017 232017 5505 3759 5447 4575 14887 1081 24
1 Prior to 1982, hunts were for handgun, handgun/archery, and/or archery/muzzleloader�2 Including special fall archery/shotgun hunts�
Year¹ Permits Authorized
1st Choice Applicants Permits Issued Hunters Hunter Days Total Harvest Percent Success
1963 – – – 1125 3519 111 101964 – – – 1226 3689 112 91965 – – – 1438 3574 118 81966 – – – 1441 3515 138 101967 – – – 1283 3855 120 91968 – – – 1608 5093 193 121969 – – – 2295 7720 206 91970 – – – 2455 8484 196 81971 – – – 2918 9663 354 121972 – – – 3795 12622 305 81973 – – – 4286 13613 469 111974 100 10 – 3680 13145 500 141975 100 37 – 4804 16129 650 141976 100 28 – 5478 18970 1044 191977 – – – 5472 20475 786 141978 – – – 6725 23940 824 121979 2400 510 – 4342 14722 786 181980 – – – 4902 19288 1222 251981 – – – 6643 36568 1527 231982 – – – 8735 39700 1543 181983 – – 8987 7722 33638 1684 221984 – – 9163 – – – –1985 – – 9599 8883 32259 1946 221986 – – 11088 10379 44358 2232 221987 – – 12236 11200 50479 2870 261988 – – 14625 13493 62771 3436 261989 – – 14785 14011 62250 3605 261990 – – 15104 14161 60256 3723 261991 – – 13658 12504 54558 2263 181992 12926 6670 9490 8735 40906 2330 271993 11990 7239 9697 8657 38263 2439 28
Historic Summary of Spring Archery Javelina Hunts

112 Hunt Arizona 2017
Historic Summary of Spring Archery Javelina Hunts
Javelina Hunt Data
Year¹ Permits Authorized
1st Choice Applicants Permits Issued Hunters Hunter Days Total Harvest Percent Success
1994 10205 7424 9944 9099 43001 2564 281995 10555 7639 10357 9430 45061 2764 291996 10125 7583 9908 8978 42000 2661 301997 9755 7809 9703 8725 40922 2672 311998 9450 8270 9444 8443 42692 2163 261999 9220 8972 9214 8242 41443 2187 272000 9650 8828 9646 8604 41072 2574 302001 9685 9736 9683 8438 41754 1862 222002 9685 9013 9673 8662 41735 2790 322003 9635 9756 9661 8545 43478 2236 262004 9435 10355 9434 8324 40575 2398 292005 9685 10351 9771 8506 42364 2038 242006 10000 9861 9930 8703 43174 2452 282007 9220 8311 8842 7675 34571 2305 302008 9661 8065 8939 7757 35110 2229 292009 9911 6919 8064 7204 33010 1961 272010 9636 6341 8062 7108 30403 2382 342011 9391 5704 7434 6542 27437 2017 312012 9391 5719 7761 6900 32984 2197 322013 9416 5715 8462 7338 31127 2750 372014 9466 6021 8724 7618 36523 2111 282015 9413 6556 8616 7500 34274 2286 302016 9496 6078 8365 7179 32064 2214 312017 9496 6608 8757 7244 31940 2456 34
1 Ft� Huachuca hunt data was gathered using the hunter questionnaire program after 1995�

Hunt Arizona 2017 113
Javelina Harvest Data
5-Year: 2012-2016 Harvest
Unit Year DatesAuthorized
PermitsAuthorized
1st ChoiceApplicants
PermitsIssued
Draw Odds Hunters Hunter
Days Harvest Hunt Success
SPRING GENERAL6A/6B/8 2013 2/22- 2/28 150 311 150 46�0 118 284 41 356A/6B/8 2014 2/21- 2/27 175 320 175 53�4 156 451 19 126A/6B/8 2015 2/20- 2/26 175 329 175 51�4 162 445 23 146A/6B/8 2016 2/19- 2/25 175 330 175 51�5 147 402 30 206A/6B/8 2017 2/24- 3/02 175 331 175 49�6 151 359 57 3810/18A 2013 2/22- 2/28 250 122 250 97�5 190 519 82 4310/18A 2014 2/21- 2/27 200 90 200 100�0 165 518 45 2710/18A 2015 2/20- 2/26 200 139 200 97�8 178 552 48 2710/18A 2016 2/19- 2/25 200 150 193 97�3 165 488 51 3110/18A 2017 2/24- 3/02 200 186 199 94�1 162 429 63 3916A 2013 2/22- 2/28 350 118 350 100�0 275 966 56 2016A 2014 2/21- 2/27 350 116 349 100�0 305 1061 25 816A 2015 2/20- 2/26 350 125 350 100�0 301 859 45 1516A 2016 2/19- 2/25 350 141 345 100�0 296 893 44 1516A 2017 2/24- 3/02 350 119 349 100�0 273 810 85 3117 2013 2/22- 2/28 500 289 500 98�6 430 1488 94 2217 2014 2/21- 2/27 500 232 500 97�0 399 1378 75 1917 2015 2/20- 2/26 500 303 500 99�7 425 1411 63 1517 2016 2/19- 2/25 500 271 478 98�2 416 1381 100 2417 2017 2/24- 3/02 500 311 496 97�1 392 1201 87 2218B 2013 2/22- 2/28 450 234 450 94�4 376 1005 155 4118B 2014 2/21- 2/27 450 294 450 95�9 367 1239 136 3718B 2015 2/20- 2/26 450 377 450 90�5 372 1098 118 3218B 2016 2/19- 2/25 450 317 437 91�2 386 1214 114 3018B 2017 2/24- 3/02 450 335 450 96�7 381 1041 192 5019A 2013 2/22- 2/28 350 157 349 100�0 285 808 61 2119A 2014 2/21- 2/27 350 164 350 93�9 329 1017 35 1119A 2015 2/20- 2/26 350 172 350 98�3 299 905 51 1719A 2016 2/19- 2/25 350 194 346 98�5 286 857 74 2619A 2017 2/24- 3/02 350 254 350 98�0 290 799 80 2819B 2013 2/22- 2/28 250 15 249 100�0 218 591 16 719B 2014 2/21- 2/27 250 29 250 100�0 221 716 31 1419B 2015 2/20- 2/26 250 40 247 100�0 220 524 34 1519B 2016 2/19- 2/25 250 40 248 100�0 218 610 48 2219B 2017 2/24- 3/02 250 48 250 100�0 172 595 9 520A 2013 2/22- 2/28 350 219 350 100�0 334 913 73 2220A 2014 2/21- 2/27 350 204 350 99�0 297 851 63 2120A 2015 2/20- 2/26 350 276 350 97�8 308 991 56 1820A 2016 2/19- 2/25 350 253 344 98�4 288 852 61 2120A 2017 2/24- 3/02 350 292 350 99�3 292 799 81 2820B 2013 2/22- 2/28 625 496 624 99�2 527 1398 159 3020B 2014 2/21- 2/27 625 663 625 86�7 546 1556 69 1320B 2015 2/20- 2/26 625 669 625 81�0 557 1640 98 1820B 2016 2/19- 2/25 625 521 626 98�7 545 1579 104 1920B 2017 2/24- 3/02 625 637 626 87�4 515 1445 106 2120C 2013 2/22- 2/28 275 300 275 89�3 247 693 94 3820C 2014 2/21- 2/27 300 357 300 81�5 250 683 66 2620C 2015 2/20- 2/26 325 363 325 83�5 272 716 71 2620C 2016 2/19- 2/25 325 359 324 85�8 285 760 102 3620C 2017 2/24- 3/02 350 424 350 80�7 310 790 99 3221 2013 2/22- 2/28 550 692 550 75�3 458 1222 127 2821 2014 2/21- 2/27 550 680 550 75�9 462 1365 66 1421 2015 2/20- 2/26 500 841 500 57�4 432 1369 57 1321 2016 2/19- 2/25 500 731 500 65�3 390 1020 75 1921 2017 2/24- 3/02 500 715 500 65�6 366 951 85 2322 2013 2/22- 2/28 550 598 550 77�9 454 1274 84 1922 2014 2/21- 2/27 550 632 550 73�7 454 1274 66 1522 2015 2/20- 2/26 550 781 550 59�9 454 1203 93 2022 2016 2/19- 2/25 550 721 550 69�1 463 1353 82 1822 2017 2/24- 3/02 550 858 550 57�5 488 1193 151 3123 2013 2/22- 2/28 325 502 325 59�6 279 743 89 32

114 Hunt Arizona 2017
Javelina Harvest Data
5-Year: 2012-2016 Harvest
Unit Year DatesAuthorized
PermitsAuthorized
1st ChoiceApplicants
PermitsIssued
Draw Odds Hunters Hunter
Days Harvest Hunt Success
23 2014 2/21- 2/27 350 560 350 59�3 285 848 71 2523 2015 2/20- 2/26 350 722 350 47�4 292 874 82 2823 2016 2/19- 2/25 375 565 375 61�2 321 947 81 2523 2017 2/24- 3/02 375 655 375 55�3 330 890 148 4524A 2013 2/22- 2/28 200 234 200 73�1 166 440 37 2224A 2014 2/21- 2/27 200 197 200 89�9 158 400 44 2824A 2015 2/20- 2/26 200 244 200 69�7 179 504 24 1324A 2016 2/19- 2/25 200 209 200 84�2 159 471 21 1324A 2017 2/24- 3/02 200 202 200 78�7 173 420 35 2024B 2013 2/22- 2/28 225 341 225 63�3 191 486 56 2924B 2014 2/21- 2/27 225 327 225 66�4 209 544 48 2324B 2015 2/20- 2/26 200 363 200 47�4 171 528 53 3124B 2016 2/19- 2/25 200 386 200 51�3 162 424 35 2224B 2017 2/24- 3/02 225 447 225 48�8 153 360 41 2727 2013 2/22- 2/28 125 45 125 95�6 93 301 14 1527 2014 2/21- 2/27 100 42 100 88�1 71 195 27 3827 2015 2/20- 2/26 100 42 100 100�0 82 255 26 3227 2016 2/19- 2/25 100 57 99 100�0 76 218 28 3727 2017 2/24- 3/02 100 68 100 100�0 94 250 22 2328 2013 2/22- 2/28 200 124 200 96�0 174 528 56 3228 2014 2/21- 2/27 200 141 200 88�7 153 462 62 4128 2015 2/20- 2/26 200 167 200 93�4 168 485 55 3328 2016 2/19- 2/25 200 143 196 98�6 161 547 28 1728 2017 2/24- 3/02 200 151 200 98�0 172 456 56 3329 2013 2/22- 2/28 100 24 100 100�0 95 300 30 3229 2014 2/21- 2/27 100 15 70 100�0 53 216 13 2529 2015 2/20- 2/26 100 27 94 100�0 86 274 20 2329 2016 2/19- 2/25 100 16 65 100�0 44 127 14 3229 2017 2/24- 3/02 100 20 67 100�0 54 155 8 1530A 2013 2/22- 2/28 350 91 350 100�0 279 753 142 5130A 2014 2/21- 2/27 350 87 350 100�0 300 854 103 3430A 2015 2/20- 2/26 350 84 350 100�0 306 794 74 2430A 2016 2/19- 2/25 350 101 334 100�0 269 730 106 3930A 2017 2/24- 3/02 350 93 306 100�0 261 796 139 5330B 2013 2/22- 2/28 175 71 175 97�2 160 457 53 3330B 2014 2/21- 2/27 175 57 175 96�5 155 470 42 2730B 2015 2/20- 2/26 175 81 175 98�8 135 470 45 3330B 2016 2/19- 2/25 175 67 170 98�5 140 398 41 2930B 2017 2/24- 3/02 175 87 175 100�0 136 402 55 4031 2013 2/22- 2/28 225 79 223 98�7 176 554 34 1931 2014 2/21- 2/27 225 69 225 100�0 159 494 37 2331 2015 2/20- 2/26 225 96 225 100�0 199 554 40 2031 2016 2/19- 2/25 225 89 224 97�8 164 427 48 2931 2017 2/24- 3/02 225 116 225 98�3 159 470 73 4632 2013 2/22- 2/28 450 221 450 92�8 350 961 138 3932 2014 2/21- 2/27 450 222 450 97�8 375 1024 124 3332 2015 2/20- 2/26 450 268 450 98�1 381 1103 108 2832 2016 2/19- 2/25 450 215 447 95�4 386 1141 102 2632 2017 2/24- 3/02 450 259 450 95�4 376 1147 157 4233 2013 2/22- 2/28 650 293 650 96�9 534 1502 169 3233 2014 2/21- 2/27 600 359 601 93�6 529 1438 106 2033 2015 2/20- 2/26 500 413 500 93�2 414 1307 79 1933 2016 2/19- 2/25 450 347 437 91�4 381 1210 90 2433 2017 2/24- 3/02 400 325 400 96�0 325 975 92 2834A 2013 2/22- 2/28 550 140 550 100�0 479 1220 176 3734A 2014 2/21- 2/27 550 187 550 100�0 460 1313 122 2734A 2015 2/20- 2/26 600 236 597 99�6 542 1455 180 3334A 2016 2/19- 2/25 600 267 593 99�3 492 1480 109 2234A 2017 2/24- 3/02 600 324 600 97�2 519 1462 204 3934B 2013 2/22- 2/28 100 25 100 100�0 59 129 18 3134B 2014 2/21- 2/27 100 37 100 100�0 81 179 28 3534B 2015 2/20- 2/26 100 68 100 89�7 82 241 23 28

Hunt Arizona 2017 115
Javelina Harvest Data
5-Year: 2012-2016 Harvest
Unit Year DatesAuthorized
PermitsAuthorized
1st ChoiceApplicants
PermitsIssued
Draw Odds Hunters Hunter
Days Harvest Hunt Success
34B 2016 2/19- 2/25 100 44 92 100�0 89 207 41 4634B 2017 2/24- 3/02 100 72 100 93�1 91 252 48 5335A 2013 2/22- 2/28 75 43 75 95�4 67 192 17 2535A 2014 2/21- 2/27 75 50 75 96�0 61 154 16 2635A 2015 2/20- 2/26 75 55 75 92�7 67 193 24 3635A 2016 2/19- 2/25 75 53 74 86�8 56 135 23 4135A 2017 2/24- 3/02 75 69 75 100�0 56 154 26 4635B 2013 2/22- 2/28 100 25 100 100�0 92 285 8 935B 2014 2/21- 2/27 100 30 100 93�3 79 228 31 3935B 2015 2/20- 2/26 100 39 100 87�2 93 243 36 3935B 2016 2/19- 2/25 100 50 96 90�0 93 285 21 2335B 2017 2/24- 3/02 100 42 100 100�0 88 200 38 4336A 2013 2/22- 2/28 475 138 475 100�0 421 1276 143 3436A 2014 2/21- 2/27 500 138 500 100�0 461 1416 115 2536A 2015 2/20- 2/26 500 157 500 100�0 420 1277 105 2536A 2016 2/19- 2/25 500 221 489 100�0 416 1257 92 2236A 2017 2/24- 3/02 500 194 500 100�0 425 1315 70 1636 2016 1/22- 1/31 75 28 74 96�4 74 191 25 3436B 2013 2/22- 2/28 475 108 475 100�0 427 1308 149 3536B 2014 2/21- 2/27 475 116 475 100�0 410 1136 124 3036B 2015 2/20- 2/26 475 218 475 93�1 428 1201 86 2036B 2016 2/19- 2/25 475 186 473 96�8 428 1074 98 2336B 2017 2/24- 3/02 475 217 475 95�9 412 1206 177 4336C 2013 2/22- 2/28 275 56 275 100�0 250 732 83 3336C 2014 2/21- 2/27 275 88 275 100�0 249 810 66 2736C 2015 2/20- 2/26 275 68 275 100�0 233 730 59 2536C 2016 2/19- 2/25 275 66 272 100�0 245 775 51 2136C 2017 2/24- 3/02 275 58 275 98�3 246 854 52 2137A 2013 2/22- 2/28 880 352 878 98�9 777 2311 193 2537A 2014 2/21- 2/27 880 278 880 99�3 753 2246 155 2137A 2015 2/20- 2/26 880 403 880 98�8 812 2472 150 1837A 2016 2/19- 2/25 880 437 852 99�3 747 2132 163 2237A 2017 2/24- 3/02 880 483 881 99�2 756 2184 129 1737B 2013 2/22- 2/28 1000 638 1000 94�4 890 2537 221 2537B 2014 2/21- 2/27 1000 761 1000 94�1 882 2394 175 2037B 2015 2/20- 2/26 900 1048 900 78�9 816 2345 187 2337B 2016 2/19- 2/25 900 933 900 87�9 817 2339 189 2337B 2017 2/24- 3/02 900 1036 900 79�7 777 2153 185 2442/44A 2013 2/22- 2/28 100 103 100 92�2 82 248 24 2942/44A 2014 2/21- 2/27 100 68 100 97�1 68 224 14 2142/44A 2015 2/20- 2/26 100 104 100 86�5 76 221 12 1642/44A 2016 2/19- 2/25 100 112 100 86�6 77 275 13 1742/44A 2017 2/24- 3/02 100 115 100 82�6 88 325 25 28FTHU 2013 2/15- 2/21 16 25 14 48�0 0 0 0 -FTHU 2014 2/14- 2/20 16 27 14 48�2 12 53 3 25FTHU 2015 2/13- 2/19 13 21 13 52�4 7 30 4 57FTHU 2016 2/12- 2/18 16 9 16 66�7 16 106 10 63FTHU 2017 2/24- 3/02 16 25 16 60�0 0 0 0 -SPRING YOUTH-ONLY 6A/6B/8 2013 1/25- 2/03 75 68 75 94�1 55 143 22 406A/6B/8 2014 1/24- 2/02 100 76 100 98�7 76 188 21 286A/6B/8 2015 1/23- 2/01 100 76 100 100�0 73 184 32 446A/6B/8 2016 1/22- 1/31 100 78 97 100�0 94 212 36 386A/6B/8 2017 1/27- 2/05 100 83 100 98�8 100 238 38 3810/17/18A/19/20A 2013 1/25- 2/03 100 105 100 81�9 81 169 31 3810/17/18A/19/20A 2014 1/24- 2/02 100 84 100 91�7 83 232 34 4110/17/18A/19/20A 2015 1/23- 2/01 100 100 100 93�0 76 194 35 4610/17/18A/19/20A 2016 1/22- 1/31 100 134 100 70�2 83 191 29 3510/17/18A/19/20A 2017 1/27- 2/05 100 132 100 68�9 64 128 44 6916A 2013 1/25- 2/03 50 8 26 100�0 9 17 0 016A 2014 1/24- 2/02 50 9 36 100�0 36 76 12 33
FTHU = Fort Huachuca

116 Hunt Arizona 2017
Javelina Harvest Data
5-Year: 2012-2016 Harvest
Unit Year DatesAuthorized
PermitsAuthorized
1st ChoiceApplicants
PermitsIssued
Draw Odds Hunters Hunter
Days Harvest Hunt Success
16A 2015 1/23- 2/01 50 20 44 100�0 44 109 9 2016A 2016 1/22- 1/31 50 9 49 100�0 45 71 13 2916A 2017 1/27- 2/05 50 21 50 100�0 40 95 10 2518B 2013 1/25- 2/03 100 23 79 100�0 57 108 0 018B 2014 1/24- 2/02 100 36 99 100�0 84 168 35 4218B 2015 1/23- 2/01 100 49 100 89�8 82 166 32 3918B 2016 1/22- 1/31 100 51 98 94�1 78 180 39 5018B 2017 1/27- 2/05 100 58 100 93�1 95 215 60 6320B/21 2013 1/25- 2/03 125 114 125 94�7 88 197 28 3220B/21 2014 1/24- 2/02 125 148 125 79�1 114 304 22 1920B/21 2015 1/23- 2/01 125 166 125 71�7 107 313 44 4120B/21 2016 1/22- 1/31 125 131 125 83�2 109 266 38 3520B/21 2017 1/27- 2/05 125 137 125 78�1 106 269 67 6320C 2013 1/25- 2/03 100 81 100 100�0 95 223 32 3420C 2014 1/24- 2/02 100 94 100 94�7 90 227 17 1920C 2015 1/23- 2/01 125 112 125 97�3 95 228 47 4920C 2016 1/22- 1/31 125 98 117 94�9 105 237 47 4520C 2017 1/27- 2/05 125 114 125 92�1 86 181 65 7622/23 2013 1/25- 2/03 75 175 75 42�9 56 109 10 1822/23 2014 1/24- 2/02 75 193 75 38�9 66 138 24 3622/23 2015 1/23- 2/01 75 230 75 32�6 54 138 27 5022/23 2016 1/22- 1/31 75 197 75 38�1 56 141 21 3822/23 2017 1/27- 2/05 75 258 75 29�1 51 159 21 4124A/24B 2013 1/25- 2/03 50 54 50 72�2 41 77 14 3424A/24B 2014 1/24- 2/02 60 62 60 66�1 57 150 10 1824A/24B 2015 1/23- 2/01 60 65 60 67�7 53 139 11 2124A/24B 2016 1/22- 1/31 60 73 60 63�0 46 132 19 4124A/24B 2017 1/27- 2/05 60 90 60 43�3 60 87 33 5527 2013 1/25- 2/03 25 10 25 100�0 25 25 0 027 2014 1/24- 2/02 25 4 25 100�0 5 20 0 027 2015 1/23- 2/01 25 13 25 76�9 16 63 3 1927 2016 1/22- 1/31 25 13 25 92�3 25 50 0 027 2017 1/27- 2/05 25 13 25 100�0 7 14 4 5728/29/30/31/32 2013 1/25- 2/03 100 48 95 81�3 63 167 27 4328/29/30/31/32 2014 1/24- 2/02 100 65 100 87�7 79 207 21 2728/29/30/31/32 2015 1/23- 2/01 100 98 100 84�7 81 188 40 4928/29/30/31/32 2016 1/22- 1/31 100 79 97 83�5 78 172 32 4128/29/30/31/32 2017 1/27- 2/05 100 106 100 86�8 50 94 22 4433/37 2013 1/25- 2/03 150 123 150 90�2 131 291 44 3433/37 2014 1/24- 2/02 150 161 150 87�0 131 363 27 2133/37 2015 1/23- 2/01 150 184 150 74�5 125 310 45 3633/37 2016 1/22- 1/31 150 221 150 63�4 133 381 39 2933/37 2017 1/27- 2/05 150 224 150 62�5 127 267 43 3434 2013 1/25- 2/03 40 6 39 100�0 23 31 23 10034 2014 1/24- 2/02 40 12 40 100�0 35 99 11 3134 2015 1/23- 2/01 40 14 40 100�0 37 114 6 1634 2016 1/22- 1/31 40 21 39 90�5 28 72 14 5034 2017 1/27- 2/05 40 24 40 70�8 24 48 12 5035 2013 1/25- 2/03 20 2 5 50�0 5 10 0 035 2014 1/24- 2/02 20 6 13 100�0 10 23 0 035 2015 1/23- 2/01 20 6 19 100�0 16 44 6 3835 2016 1/22- 1/31 20 4 11 100�0 11 29 7 6435 2017 1/27- 2/05 20 6 20 100�0 20 108 4 2036 2013 1/25- 2/03 50 17 50 88�2 44 139 11 2536 2014 1/24- 2/02 75 22 75 86�4 58 184 15 2636 2015 1/23- 2/01 75 31 75 100�0 59 158 12 2036 2017 1/27- 2/05 75 33 75 100�0 75 142 42 56SPRING HAM6A/6B/8 2013 2/08- 2/17 50 129 50 38�8 38 133 13 346A/6B/8 2014 2/07- 2/16 75 129 75 58�1 69 193 13 196A/6B/8 2015 2/06- 2/16 75 120 75 59�2 63 174 19 306A/6B/8 2016 2/05- 2/15 75 102 75 64�7 70 268 16 23

Hunt Arizona 2017 117
Javelina Harvest Data
5-Year: 2012-2016 Harvest
Unit Year DatesAuthorized
PermitsAuthorized
1st ChoiceApplicants
PermitsIssued
Draw Odds Hunters Hunter
Days Harvest Hunt Success
6A/6B/8 2017 2/10- 2/20 75 148 75 50�7 44 103 9 2010/18A 2013 2/08- 2/17 100 46 92 100�0 81 327 32 4010/18A 2014 2/07- 2/16 75 57 75 59�7 64 249 13 2010/18A 2015 2/06- 2/16 75 44 75 97�7 66 210 22 3310/18A 2016 2/05- 2/15 75 51 74 88�2 60 167 25 4210/18A 2017 2/10- 2/20 75 58 71 82�8 56 168 22 3916A 2013 2/08- 2/17 100 23 100 91�3 82 341 6 716A 2014 2/07- 2/16 100 51 100 84�3 90 337 6 716A 2015 2/06- 2/16 100 59 100 88�1 82 265 16 2016A 2016 2/05- 2/15 100 50 95 86�0 77 287 22 2916A 2017 2/10- 2/20 100 32 100 93�8 75 275 9 1217 2013 2/08- 2/17 100 76 100 81�6 83 367 21 2517 2014 2/07- 2/16 100 74 100 94�6 81 269 19 2317 2015 2/06- 2/16 100 131 100 73�3 83 319 19 2317 2016 2/05- 2/15 150 105 140 91�4 109 424 24 2217 2017 2/10- 2/20 150 98 150 94�9 114 271 39 3418B 2013 2/08- 2/17 250 185 250 82�7 220 825 60 2718B 2014 2/07- 2/16 250 140 250 84�3 221 738 52 2418B 2015 2/06- 2/16 250 175 250 87�4 230 823 63 2718B 2016 2/05- 2/15 250 181 240 79�6 212 736 59 2818B 2017 2/10- 2/20 250 189 250 96�3 211 801 66 3119A 2013 2/08- 2/17 100 68 100 100�0 94 390 20 2119A 2014 2/07- 2/16 100 54 100 85�2 80 309 16 2019A 2015 2/06- 2/16 100 83 100 89�2 95 323 15 1619A 2016 2/05- 2/15 100 72 97 93�1 85 228 21 2519A 2017 2/10- 2/20 100 73 100 87�7 76 280 24 3219B 2013 2/08- 2/17 100 6 100 100�0 80 240 20 2519B 2014 2/07- 2/16 100 9 100 100�0 85 241 11 1319B 2015 2/06- 2/16 100 10 100 100�0 82 234 24 2919B 2016 2/05- 2/15 100 3 100 100�0 84 246 16 1919B 2017 2/10- 2/20 100 14 100 100�0 95 376 19 2020A 2013 2/08- 2/17 150 89 150 94�4 130 383 28 2220A 2014 2/07- 2/16 150 84 150 100�0 117 379 31 2720A 2015 2/06- 2/16 150 97 150 93�8 115 398 6 520A 2016 2/05- 2/15 150 87 146 97�7 121 431 25 2120A 2017 2/10- 2/20 150 94 150 96�8 133 351 30 2320B 2013 2/08- 2/17 325 232 325 99�6 301 1044 36 1220B 2014 2/07- 2/16 325 257 325 99�6 292 935 35 1220B 2015 2/06- 2/16 325 317 325 94�0 293 1045 35 1220B 2016 2/05- 2/15 325 207 316 98�6 260 833 42 1620B 2017 2/10- 2/20 325 199 325 98�0 271 818 54 2020C 2013 2/08- 2/17 325 269 325 95�2 283 996 72 2520C 2014 2/07- 2/16 325 262 300 97�7 254 843 57 2220C 2015 2/06- 2/16 325 361 325 86�2 288 996 63 2220C 2016 2/05- 2/15 325 305 316 91�2 268 934 58 2220C 2017 2/10- 2/20 350 271 350 100�0 314 978 68 2221 2013 2/08- 2/17 225 295 225 71�5 190 651 24 1321 2014 2/07- 2/16 225 284 225 71�1 183 637 28 1521 2015 2/06- 2/16 200 280 200 66�8 164 523 36 2221 2016 2/05- 2/15 200 283 200 67�8 179 587 42 2321 2017 2/10- 2/20 200 206 200 81�1 170 365 17 1022 2013 2/08- 2/17 350 316 350 86�1 291 959 40 1422 2014 2/07- 2/16 350 297 350 91�9 311 967 41 1322 2015 2/06- 2/16 350 347 350 79�3 306 1022 42 1422 2016 2/05- 2/15 350 327 350 79�5 307 1030 57 1922 2017 2/10- 2/20 350 346 350 80�6 296 992 38 1323 2013 2/08- 2/17 200 360 200 53�6 173 545 25 1423 2014 2/07- 2/16 250 365 250 62�7 215 717 38 1823 2015 2/06- 2/16 250 371 250 58�5 224 922 37 1723 2016 2/05- 2/15 250 362 250 62�7 214 743 46 2223 2017 2/10- 2/20 250 364 250 58�2 205 573 35 1724A 2013 2/08- 2/17 125 104 125 96�2 97 310 28 29

118 Hunt Arizona 2017
Javelina Harvest Data
5-Year: 2012-2016 Harvest
Unit Year DatesAuthorized
PermitsAuthorized
1st ChoiceApplicants
PermitsIssued
Draw Odds Hunters Hunter
Days Harvest Hunt Success
24A 2014 2/07- 2/16 135 86 135 98�8 125 385 46 3724A 2015 2/06- 2/16 135 88 135 94�3 114 432 21 1824A 2016 2/05- 2/15 135 65 134 95�4 104 372 21 2024A 2017 2/10- 2/20 135 91 135 92�3 130 427 32 2524B 2013 2/08- 2/17 100 151 100 62�3 76 190 18 2424B 2014 2/07- 2/16 100 120 100 73�3 76 229 12 1624B 2015 2/06- 2/16 100 137 100 55�5 92 356 18 2024B 2016 2/05- 2/15 100 148 100 64�9 85 298 18 2124B 2017 2/10- 2/20 100 135 100 69�6 85 327 23 2727 2013 2/08- 2/17 50 11 50 100�0 38 124 6 1627 2014 2/07- 2/16 50 8 40 100�0 35 108 15 4327 2015 2/06- 2/16 50 15 50 100�0 45 179 5 1127 2016 2/05- 2/15 50 19 50 100�0 33 97 13 3927 2017 2/10- 2/20 50 24 50 100�0 30 85 5 1728 2013 2/08- 2/17 85 54 85 98�2 85 307 26 3128 2014 2/07- 2/16 85 57 85 94�7 74 234 27 3628 2015 2/06- 2/16 85 52 85 94�2 72 205 21 2928 2016 2/05- 2/15 85 48 83 100�0 77 232 25 3228 2017 2/10- 2/20 85 65 85 93�9 81 259 36 4429 2013 2/08- 2/17 40 8 23 50�0 23 84 15 6529 2014 2/07- 2/16 40 4 14 100�0 14 31 3 2129 2015 2/06- 2/16 40 15 32 80�0 25 76 0 029 2016 2/05- 2/15 40 11 18 100�0 18 63 5 2829 2017 2/10- 2/20 40 4 4 100�0 0 0 0 -30A 2013 2/08- 2/17 100 28 79 100�0 69 212 15 2230A 2014 2/07- 2/16 100 36 97 91�7 82 263 23 2830A 2015 2/06- 2/16 100 27 89 96�3 71 205 20 2830A 2016 2/05- 2/15 100 44 72 90�9 66 203 42 6430A 2017 2/10- 2/20 100 42 82 97�6 54 169 18 3330B 2013 2/08- 2/17 75 30 75 100�0 56 181 25 4530B 2014 2/07- 2/16 75 26 75 100�0 73 267 23 3230B 2015 2/06- 2/16 75 16 75 100�0 61 307 0 030B 2016 2/05- 2/15 75 18 62 100�0 50 133 22 4430B 2017 2/10- 2/20 75 31 75 87�1 62 172 4 631 2013 2/08- 2/17 80 26 80 84�6 75 295 15 2031 2014 2/07- 2/16 80 23 80 82�6 63 205 8 1331 2015 2/06- 2/16 80 28 80 100�0 72 288 17 2431 2016 2/05- 2/15 80 38 80 76�3 74 290 12 1631 2017 2/10- 2/20 80 46 80 100�0 77 268 25 3232 2013 2/08- 2/17 250 136 250 97�1 210 656 80 3832 2014 2/07- 2/16 250 144 250 93�8 218 819 42 1932 2015 2/06- 2/16 250 164 250 98�8 215 649 42 2032 2016 2/05- 2/15 250 135 248 93�3 215 683 26 1232 2017 2/10- 2/20 250 125 250 92�0 206 659 60 2933 2013 2/08- 2/17 380 150 380 94�0 300 915 75 2533 2014 2/07- 2/16 350 159 350 100�0 292 1081 70 2433 2015 2/06- 2/16 350 179 350 97�8 290 917 63 2233 2016 2/05- 2/15 300 107 296 93�5 238 743 56 2433 2017 2/10- 2/20 300 114 300 99�1 251 913 53 2134A 2013 2/08- 2/17 285 77 285 94�8 247 727 43 1734A 2014 2/07- 2/16 285 83 285 100�0 238 748 30 1334A 2015 2/06- 2/16 300 97 300 100�0 265 898 53 2034A 2016 2/05- 2/15 300 98 281 100�0 248 766 50 2034A 2017 2/10- 2/20 300 99 300 99�0 240 738 92 3834B 2013 2/08- 2/17 30 9 30 100�0 30 68 15 5034B 2014 2/07- 2/16 30 4 30 100�0 28 55 18 6434B 2015 2/06- 2/16 30 21 30 71�4 17 60 7 4134B 2016 2/05- 2/15 30 14 28 100�0 28 102 3 1134B 2017 2/10- 2/20 30 11 30 90�9 30 75 11 3735A 2013 2/08- 2/17 80 19 80 100�0 60 190 10 1735A 2014 2/07- 2/16 80 41 78 100�0 66 177 17 2635A 2015 2/06- 2/16 80 18 80 88�9 71 197 9 13

Hunt Arizona 2017 119
Javelina Harvest Data
5-Year: 2012-2016 Harvest
Unit Year DatesAuthorized
PermitsAuthorized
1st ChoiceApplicants
PermitsIssued
Draw Odds Hunters Hunter
Days Harvest Hunt Success
35A 2016 2/05- 2/15 80 11 68 100�0 63 197 15 2435A 2017 2/10- 2/20 80 24 80 100�0 65 259 23 3535B 2013 2/08- 2/17 80 18 65 100�0 52 165 13 2535B 2014 2/07- 2/16 80 17 80 100�0 65 247 26 4035B 2015 2/06- 2/16 80 28 80 100�0 60 198 23 3835B 2016 2/05- 2/15 80 26 67 100�0 60 148 26 4335B 2017 2/10- 2/20 80 47 80 100�0 69 236 22 3236A 2013 2/08- 2/17 115 37 115 100�0 109 326 38 3536A 2014 2/07- 2/16 115 51 115 100�0 106 336 21 2036A 2015 2/06- 2/16 140 54 140 100�0 128 389 16 1336A 2016 2/05- 2/15 200 67 199 97�0 187 619 37 2036A 2017 2/10- 2/20 200 52 200 100�0 180 560 52 2936B 2013 2/08- 2/17 150 46 150 100�0 139 428 26 1936B 2014 2/07- 2/16 150 52 150 100�0 122 406 21 1736B 2015 2/06- 2/16 150 76 150 88�2 108 379 15 1436B 2016 2/05- 2/15 150 70 147 94�3 117 324 27 2336B 2017 2/10- 2/20 150 86 150 88�4 125 415 40 3236C 2013 2/08- 2/17 115 10 93 100�0 87 244 6 736C 2014 2/07- 2/16 115 13 92 100�0 81 240 7 936C 2015 2/06- 2/16 115 18 115 100�0 106 345 12 1136C 2016 2/05- 2/15 115 14 90 100�0 90 230 25 2836C 2017 2/10- 2/20 115 15 115 100�0 115 368 19 1737A 2013 2/08- 2/17 360 150 360 92�7 324 1120 89 2737A 2014 2/07- 2/16 360 170 360 98�8 304 1108 56 1837A 2015 2/06- 2/16 360 149 360 93�3 308 1085 64 2137A 2016 2/05- 2/15 360 180 359 97�8 295 956 70 2437A 2017 2/10- 2/20 360 168 360 100�0 305 1135 55 1837B 2013 2/08- 2/17 500 426 500 94�4 442 1472 88 2037B 2014 2/07- 2/16 500 378 500 96�3 455 1664 66 1537B 2015 2/06- 2/16 500 426 500 96�5 439 1525 96 2237B 2016 2/05- 2/15 500 319 481 95�9 410 1456 78 1937B 2017 2/10- 2/20 500 488 500 94�7 410 1471 81 20SPRING ARCHERYRegions 3 & 4 Units 2013 1/01- 1/24 1000 376 816 99�7 675 2857 289 43Regions 3 & 4 Units 2014 1/01- 1/23 1000 369 944 100�0 821 3899 179 22Regions 3 & 4 Units 2015 1/01- 1/22 1000 361 847 100�0 737 3139 215 29Regions 3 & 4 Units 2016 1/01- 1/21 1000 257 753 100�0 632 2440 203 32Regions 3 & 4 Units 2017 1/01- 1/26 1000 271 840 100�0 661 2704 197 306A/6B 2013 1/01- 1/24 500 332 500 95�5 434 1790 166 386A/6B 2014 1/01- 1/23 525 400 525 95�8 488 2193 88 186A/6B 2015 1/01- 1/22 525 437 525 95�9 436 1840 152 356A/6B/8 2016 1/01- 1/21 525 408 486 93�1 417 1823 117 286A/6B/8 2017 1/01- 1/26 525 419 525 92�8 400 1769 120 3017/18B/19/20A 2013 1/01- 1/24 1500 988 1500 93�1 1293 5560 536 4117/18B/19/20A 2014 1/01- 1/23 1500 936 1500 91�4 1286 6287 419 3317/18B/19/20A 2015 1/01- 1/22 1500 1081 1500 92�5 1289 5856 394 3117/18B/19 /20A 2016 1/01- 1/21 1500 981 1436 96�3 1229 5710 393 3217/18B/19/20A 2017 1/01- 1/26 1500 1090 1500 96�5 1230 5330 405 3320B 2013 1/01- 1/24 475 389 475 100�0 416 1745 89 2120B 2014 1/01- 1/23 475 404 475 98�5 418 1783 91 2220B 2015 1/01- 1/22 475 404 475 97�8 418 1783 77 1820B 2016 1/01- 1/21 475 306 463 97�1 404 1568 98 2420B 2017 1/01- 1/26 475 330 475 100�0 361 1534 100 2820C 2013 1/01- 1/24 300 291 300 90�4 265 967 134 5120C 2014 1/01- 1/23 300 346 300 86�1 273 1126 112 4120C 2015 1/01- 1/22 325 388 325 83�3 277 1201 96 3520C 2016 1/01- 1/21 325 356 320 87�6 272 1149 93 3420C 2017 1/01- 1/26 325 379 351 89�2 282 1290 110 3921 2013 1/01- 1/24 400 468 400 81�6 346 1269 84 2421 2014 1/01- 1/23 400 454 400 83�5 338 1450 79 2321 2015 1/01- 1/22 350 453 350 74�4 286 1186 73 2621 2016 1/01- 1/21 350 435 349 74�5 293 1215 56 19

120 Hunt Arizona 2017
Javelina Harvest Data
5-Year: 2012-2016 Harvest
Unit Year DatesAuthorized
PermitsAuthorized
1st ChoiceApplicants
PermitsIssued
Draw Odds Hunters Hunter
Days Harvest Hunt Success
21 2017 1/01- 1/26 350 498 350 66�9 287 1020 76 2622 2013 1/01- 1/24 450 425 450 80�7 391 1518 149 3822 2014 1/01- 1/23 450 510 450 73�5 393 1755 114 2922 2015 1/01- 1/22 450 512 450 72�5 379 1566 86 2322 2016 1/01- 1/21 450 548 450 67�0 368 1501 110 3022 2017 1/01- 1/26 450 612 450 64�4 395 1630 132 3323 2013 1/01- 1/24 200 478 200 41�8 167 662 80 4823 2014 1/01- 1/23 250 515 250 48�2 207 860 52 2523 2015 1/01- 1/22 250 571 250 42�6 192 841 65 3423 2016 1/01- 1/21 300 584 300 51�4 247 828 66 2723 2017 1/01- 1/26 300 624 300 47�4 219 861 86 3924A 2013 1/01- 1/24 125 215 125 50�7 115 428 60 5224A 2014 1/01- 1/23 100 228 100 43�4 90 347 27 3024A 2015 1/01- 1/22 100 207 100 45�9 88 391 36 4124A 2016 1/01- 1/21 100 208 100 48�1 77 423 19 2524A 2017 1/01- 1/26 100 199 100 50�3 85 345 35 4124B 2013 1/01- 1/24 175 198 175 68�7 164 627 71 4324B 2014 1/01- 1/23 175 242 175 61�6 156 719 46 2924B 2015 1/01- 1/22 150 302 150 47�7 129 667 46 3624B 2016 1/01- 1/21 150 259 150 55�2 133 655 40 3024B 2017 1/01- 1/26 150 284 150 51�1 124 501 59 4827 2013 1/01- 1/24 75 19 74 89�5 61 229 20 3327 2014 1/01- 1/23 75 15 75 100�0 65 416 3 527 2015 1/01- 1/22 75 41 75 97�6 71 308 26 3727 2016 1/01- 1/21 75 46 73 95�7 61 248 26 4327 2017 1/01- 1/26 75 44 74 95�5 60 328 14 2328/29/30/31/32 2013 1/01- 1/24 1200 429 897 99�3 762 3237 343 4528/29/30/31/32 2014 1/01- 1/23 1200 400 868 99�0 744 3773 298 4028/29/30/31/32 2015 1/01- 1/22 1200 401 925 100�0 837 3916 299 3628/29/30/31/32 2016 1/01- 1/21 1200 423 900 99�5 796 3528 278 3528/29/30/31/32 2017 1/01- 1/26 1200 377 897 99�7 770 3647 341 4433/37B 2013 1/01- 1/24 1200 590 1202 95�6 1062 4545 317 3033/37B 2014 1/01- 1/23 1200 690 1199 92�6 1027 5223 225 2233/37B 2015 1/01- 1/22 1200 746 1200 97�3 1072 4724 295 2833/37B 2016 1/01- 1/21 1200 680 1171 95�9 1041 4814 296 2833/37B 2017 1/01- 1/26 1200 787 1200 95�8 1038 4652 342 3334A/37A 2013 1/01- 1/24 700 262 697 96�6 607 2729 216 3634A/37A 2014 1/01- 1/23 700 268 700 97�4 645 3252 166 2634A/37A 2015 1/01- 1/22 700 328 700 97�6 623 2994 194 3134A/37A 2016 1/01- 1/21 700 295 669 97�0 564 2571 184 3334A/37A 2017 1/01- 1/26 700 287 700 97�9 610 2628 203 3334B/35 2013 1/01- 1/24 300 107 202 91�6 186 777 89 4834B/35 2014 1/01- 1/23 300 84 202 98�8 181 765 56 3134B/35 2015 1/01- 1/22 300 106 189 95�3 168 815 72 4334B/35 2016 1/01- 1/21 300 108 214 94�4 182 938 90 4934B/35 2017 1/01- 1/26 300 116 196 91�4 163 748 75 4636 2013 1/01- 1/24 800 133 435 100�0 394 2187 107 2736 2014 1/01- 1/23 800 137 547 100�0 472 2561 150 3236 2015 1/01- 1/22 800 191 542 100�0 498 3047 160 3236 2016 1/01- 1/21 800 168 509 100�0 461 2494 146 3236 2017 1/01- 1/26 800 266 622 99�3 559 2953 161 29FTHU 2013 1/01- 1/31 16 15 14 86�7 0 0 0 -FTHU 2014 1/01- 1/23 16 23 14 60�9 14 114 6 43FTHU 2015 1/01- 1/22 13 27 13 48�2 0 0 0 -FTHU 2016 1/31- 1/31 16 16 16 75�0 5 21 3 60FTHU 2016 1/31- 1/31 30 0 6 - 6 74 5 83FTHU 2017 1/01- 1/31 30 0 11 - 0 0 0 -
FTHU = Fort Huachuca

Hunt Arizona 2017 121
Javelina Harvest Data
Unit Year DatesAuthorized
PermitsAuthorized
1st ChoiceApplicants
PermitsIssued
Draw Odds Hunters Hunter
Days Harvest Hunt Success
FALL YOUTH ONLY16A 2013 10/04-10/13 30 13 30 100�0 15 45 0 016A 2014 11/21-11/30 30 18 26 77�8 22 78 4 1816A 2015 11/20-11/29 30 18 30 100�0 23 47 10 4316A 2016 11/18-11/27 30 26 30 100�0 23 70 10 4317A/17B 2013 10/04-10/13 100 112 100 89�3 89 250 18 2017B/19/20A 2014 10/03-10/12 200 191 200 91�6 162 536 9 617B/19/20A 2015 10/02-10/11 200 197 200 98�5 155 429 24 1517B/19/20A 2016 10/07-10/16 200 214 200 93�0 155 410 19 1218B 2013 11/22-12/01 75 89 75 75�3 55 164 32 5818B 2014 11/21-11/30 75 100 75 75�0 56 139 19 3418B 2015 11/20-11/29 75 108 75 69�4 75 216 38 5118B 2016 11/18-11/27 75 82 75 91�5 59 146 36 6120A 2013 10/04-10/13 75 103 75 72�8 55 162 4 728/29/30/31/32 2013 11/22-11/28 100 103 100 96�1 73 209 30 4128/29/30/31/32 2014 11/21-11/27 100 86 100 97�7 57 168 11 1928/29/30/31/32 2015 11/20-11/26 100 103 100 95�2 81 205 28 3528/29/30/31/32 2016 11/18-11/24 100 81 80 90�1 57 109 34 6033 2013 11/22-11/28 75 88 75 84�1 61 188 7 1133 2014 11/21-11/27 75 77 75 89�6 56 164 9 1633 2015 11/20-11/26 75 60 72 95�0 54 137 14 2633 2016 11/18-11/24 75 60 75 96�7 52 178 5 1034/35 2013 10/11-10/17 50 15 40 100�0 13 53 7 5434/35 2013 11/22-11/28 50 17 32 100�0 18 28 0 034/35 2014 10/10-10/16 50 26 45 100�0 40 98 11 2834/35 2014 11/21-11/27 50 19 31 89�5 18 58 9 5034/35 2015 10/09-10/15 50 26 34 92�3 31 110 0 034/35 2015 11/20-11/26 50 25 27 100�0 27 57 11 4134/35 2016 10/07-10/13 50 30 40 100�0 35 123 8 2334/35 2016 11/18-11/24 50 16 26 93�8 17 43 9 5336 2013 10/11-10/17 50 40 49 92�5 34 103 15 4437 2013 10/11-10/17 100 62 100 96�8 68 164 23 3437 2013 11/22-11/28 100 84 100 100�0 88 196 31 3537 2016 10/07-10/13 100 71 97 90�1 79 220 12 1537 2016 11/18-11/24 100 94 100 91�5 80 166 29 3637 2014 10/10-10/16 100 61 100 95�1 82 188 18 2237 2014 11/21-11/27 100 81 100 92�6 71 200 4 637 2015 11/09-10/15 100 76 100 100�0 96 271 21 2237 2015 11/20-11/26 100 101 100 97�0 76 205 11 1439/40 2014 11/07-11/16 25 13 18 100�0 18 59 0 039/41 2013 11/08-11/17 25 19 24 100�0 19 58 5 26
5-Year: 2012-2016 Harvest

122 Hunt Arizona 2017
Bighorn Sheep (Ovis canadensis)
Bighorn distribution
Natural HistoryArizona’s bighorn sheep population, consisting of both Rocky Mountain and desert subspecies, is currently estimated at about 5,000 animals—a severe reduc-tion from the numbers thought to once be present. The causes for this decline, which occurred primarily be-tween 1860 and 1920, were exposure to livestock-borne parasites and diseases. Now, thanks to livestock-free refuges and an aggressive translocation program, big-horn sheep numbers are gradually edging upward.
Desert bighorn sheep weights vary considerably be-tween the sexes. Adult rams weigh 160 to 200 pounds, with a maximum weight of 225 pounds. Adult ewes range from 75 to 130 pounds and average 110 pounds. The biggest visual difference between the two sexes is the horns. Ewe horns are generally 10 to 13 inch-es long with a circumference of 3-6 inches. An adult ram’s horns may measure up to 40 inches along the outside curl with a basal circumference between 13 and 16 inches. The horn core is honeycombed with cham-bers, or sinuses, which reduce the weight of the skull.
Newborn bighorn lambs weigh from 8 to 10 pounds, have dark eyes and fuzzy, dark-gray hair, and are ac-tive within minutes of birth. As the lambs mature, their eyes take on the characteristic amber color of the adult’s eyes. After several months, they also take on the adult’s pale buff to dark, chocolate-brown coloration. This overall coat color is accentuated by a white muzzle, a white rump patch, light-colored eye rings, and a white edging on the rear legs. The tail is black, bordered in white.
Bighorn sheep have a life expectancy of 10 to 12 years, but may attain an age of 17 years or older. Usually one, rarely two, lambs are born. The youngsters typically stay with their mothers until two years of age. The young rams then leave the nursery herds of ewes and lambs and join a bachelor herd. The adults usually remain segregated according to sex except during the summer breeding sea-son, and sometimes during the spring with the sprouting of early vegetation.
Sexual maturity varies, both physiologically and behav-iorally. Although rams as young as 6 months of age may be capable of breeding, they refrain due to the dominance
of older rams. Ewes do not breed until they are about two-years old, and rams usually not until at least three years of age. The breeding season extends from early June through October, but the peak rutting activity takes place in August. The gestation period is about six months, and most lambs are born in late winter or early spring.
Bighorn sheep are diurnal animals and are usual-ly found in small groups, although herds of 50 or more are sometimes seen. Native grasses are important in the bighorn’s diet, although the animals also feed heavily on jojoba and other woody plants. Pincushion, barrel, and saguaro cactuses provide needed moisture. Pre-ferred plants vary with habitat quality, locality, and species availability. Mountain lions are the principal predator although golden eagles and bobcats have been observed taking lambs.
Hunt HistoryTotally protected by the territorial legislature in 1893, bighorn sheep were not legal game in Arizona until 1953, when it was determined that the limited hunting of tro-phy rams might be the only way to save these animals. Two limited hunts of 20 permits each were authorized, and 20 bighorn were taken. Since then, permit numbers, the number of units open to hunting, the number of rams taken, and hunt success have gradually increased. Between 80-100 rams, most-ly desert bighorn, are now being taken each year. This number will only increase, however, when the disease problem and other limiting factors are brought under control.

Hunt Arizona 2017 123
Bighorn Survey Data
Historic Summary of Desert Bighorn Sheep Survey DataYear Ram Ewe Lamb Yearling Unclassified Total
Number Per 100 EwesRams Lambs Yearlings
1951 56 46 30 0 9 141 122 65 01952 48 36 15 0 8 107 133 42 01953 59 48 24 0 17 148 123 50 01955 159 129 29 0 41 358 123 22 01956 95 129 29 0 4 257 74 22 01957 43 48 0 0 0 91 90 0 01958 43 77 34 0 3 157 56 44 01959 15 46 10 26 5 102 33 22 571960 26 57 29 13 0 125 46 51 231961 47 106 46 1 0 200 44 43 11962 59 104 43 7 8 221 57 41 71963 47 109 48 6 8 218 43 44 61964 57 181 90 0 18 346 31 50 01965 75 134 69 0 41 319 56 51 01966 111 228 89 0 13 441 49 39 01967 109 341 145 0 46 641 32 43 01968 143 382 207 0 0 732 37 54 01969 142 407 152 0 2 703 35 37 01970 142 464 182 0 9 797 31 39 01971 131 264 138 0 20 553 50 52 01972 132 275 107 0 26 540 48 39 01973 95 214 76 0 7 392 44 36 01974 119 288 137 0 10 554 41 48 01975 213 418 170 0 12 813 51 41 01976 261 542 240 0 4 1047 48 44 01977 304 567 269 0 30 1170 54 47 01978 343 604 284 0 29 1260 57 47 01979 310 713 306 0 39 1368 43 43 01980 443 1073 459 0 3 1978 41 43 01981 374 775 272 0 1 1422 48 35 01982 478 892 301 0 9 1680 54 34 01983 554 934 278 0 4 1770 59 30 01984 527 819 212 173 0 1731 64 26 211985 590 1026 308 164 3 2091 58 30 161986 652 1137 383 220 2 2394 57 34 191987 648 1102 450 257 0 2457 59 41 231988 711 1306 470 259 0 2746 54 36 201989 571 1095 291 183 0 2140 52 27 171990 655 980 303 187 4 2129 67 31 191991 562 1008 301 190 9 2070 56 30 191992 696 1124 283 209 7 2319 62 25 191993 686 1051 264 167 5 2173 65 25 161994 789 1502 298 241 8 2838 53 20 161995 624 1224 299 107 6 2260 51 24 91996 474 870 134 96 4 1578 54 15 111997 742 1375 402 134 1 2654 54 29 101998 325 733 152 97 3 1310 44 21 131999 344 660 132 102 2 1240 52 20 152000 404 803 197 109 5 1518 50 25 142001 366 812 322 90 5 1595 45 40 112002 249 443 103 73 5 874 56 23 162003 288 739 224 84 3 1338 39 30 112004 197 443 179 43 1 863 44 40 102005 213 388 110 54 11 776 55 28 142006 381 635 154 71 8 1249 60 24 112007 396 690 215 93 9 1403 57 31 132008 433 764 260 99 7 1563 57 34 132009 516 980 323 115 1 1935 53 33 122010 414 773 195 154 1 1537 54 25 202011 493 954 312 97 3 1859 52 33 102012 701 1301 358 176 7 2543 54 28 142013 472 935 246 67 2 1722 50 26 72014 1004 1667 490 263 32 3456 60 29 162015 897 1569 445 173 8 2381 57 28 112016 515 944 177 147 16 1799 55 19 16

124 Hunt Arizona 2017
Bighorn Survey Data
Year Ram Ewe Lamb Yearling Unclassified TotalNumber Per 100 Ewes
Rams Lambs Yearlings1984 20 26 25 13 0 84 77 96 501985 16 22 9 3 0 50 73 41 141986 56 65 36 42 0 199 86 55 651987 54 54 14 40 76 238 100 26 741988 40 66 35 40 0 181 61 53 611989 50 69 41 50 0 210 72 59 721990 62 109 34 23 0 228 57 31 211991 43 68 27 18 0 156 63 40 261992 65 129 72 36 0 302 50 56 281993 75 157 82 18 0 332 48 52 111994 101 186 77 19 0 383 54 41 101995 68 171 82 24 0 345 40 48 141996 72 201 45 31 0 349 36 22 151997 71 150 69 20 12 322 47 46 131998 102 162 72 30 3 369 63 44 191999 65 188 71 25 0 349 35 38 132000 70 202 61 17 2 352 35 30 82001 75 190 60 11 0 336 39 32 62002 84 184 60 29 2 359 46 33 162003 11 25 5 2 0 43 44 20 82004 45 84 32 8 0 169 54 38 102005 89 155 49 17 38 348 57 32 112006 83 172 65 9 2 331 48 38 52007 59 115 62 17 0 253 51 54 152008 117 296 119 44 1 577 40 40 152009 52 95 46 7 9 209 55 48 72010 48 126 44 22 0 240 38 35 172011 97 255 97 21 0 470 38 38 82012 157 240 88 34 3 522 65 37 142013 43 47 12 0 0 102 91 26 02014 130 300 112 50 4 596 43 37 172015 128 249 67 26 15 373 51 27 102016 90 179 68 17 1 355 50 38 10
Historic Summary of Combined Bighorn Sheep Survey Data
Year Ram Ewe Lamb Yearling Unclassified TotalNumber Per 100 Ewes
Rams Lambs Yearlings1984 547 845 237 186 0 1815 65 28 221985 606 1048 317 167 3 2141 58 30 161986 708 1202 419 262 2 2593 59 35 221987 702 1156 464 297 76 2695 61 40 261988 751 1372 505 299 0 2927 55 37 221989 621 1164 332 233 0 2350 53 29 201990 717 1089 337 210 4 2357 66 31 191991 605 1076 328 208 9 2226 56 30 191992 761 1253 355 245 7 2621 61 28 201993 761 1208 346 185 5 2505 63 29 151994 890 1688 375 260 8 3221 53 22 151995 692 1395 381 131 6 2605 50 27 91996 546 1071 179 127 4 1927 51 17 121997 813 1525 471 154 13 2976 53 31 101998 427 895 224 127 6 1679 48 25 141999 409 848 203 127 2 1589 48 24 152000 474 1005 258 126 7 1870 47 26 132001 441 1002 382 101 5 1931 44 38 102002 333 627 163 102 8 1233 53 26 162003 299 764 229 86 3 1381 39 30 112004 242 527 211 51 1 1032 46 40 102005 302 543 159 71 49 1124 56 29 132006 464 807 219 80 10 1580 58 27 102007 455 805 277 110 9 1656 57 34 142008 550 1060 379 143 8 2140 52 36 13
Historic Summary of Rocky Mountain Bighorn Sheep Survey Data

Hunt Arizona 2017 125
Bighorn Survey Data
5-Year: 2012-2016 Desert Bighorn Sheep Survey Data
Unit Year Ram Ewe Lamb Yearling Unclassified TotalNumber per 100 Ewes
Rams Lambs Yearlings10 2015 16 39 12 2 0 69 41 31 512A/12B West 2013 21 22 7 1 0 51 95 32 512A/12B West 2014 8 13 3 3 0 27 62 23 2312B East 2014 29 73 35 1 0 138 40 48 113A 2013 12 26 13 1 0 52 46 50 413A 2014 12 12 5 6 0 35 100 42 5013B North 2014 20 57 6 5 0 88 35 11 913B South 2014 5 24 5 2 0 36 21 21 815A/15B East 2014 4 11 3 0 1 19 36 27 015B West 2012 68 107 50 16 0 241 64 47 1515B West 2013 50 105 30 11 0 196 48 29 1015B West 2014 39 86 27 5 6 163 45 31 615B West 2015 41 83 34 9 0 167 49 41 1115B West 2016 23 71 8 0 0 102 32 11 015C North 2012 62 103 31 7 0 203 60 30 715C North 2013 38 91 23 10 0 162 42 25 1115C North 2015 10 27 6 3 0 46 37 22 1115C North 2016 11 42 1 1 0 55 26 2 215C South 2012 27 39 7 1 0 74 69 18 315C South 2013 13 27 11 1 0 52 48 41 415C South 2015 9 2 1 0 0 12 450 50 015C South 2016 6 9 0 0 0 15 67 0 015D 2012 137 273 77 0 0 487 50 28 015D 2013 124 322 80 0 0 526 39 25 015D 2014 116 195 49 14 0 374 59 25 715D 2015 171 293 96 20 0 580 58 33 715D 2016 90 110 4 0 0 204 82 4 015D North 2014 72 134 27 11 0 244 54 20 815D South 2014 45 62 22 3 0 132 73 35 516A 2013 1 3 0 1 0 5 33 0 3316A 2014 9 20 3 0 0 32 45 15 016A 2015 7 29 6 0 0 42 24 21 016A 2016 2 4 2 0 0 8 50 50 016A South 2014 1 3 0 1 0 5 33 0 3316A South 2015 7 29 6 0 0 42 24 21 016A South 2016 7 19 9 1 0 36 37 47 516B 2014 8 14 10 2 0 34 57 71 1418B 2012 11 21 9 1 0 42 52 43 518B 2013 23 37 8 6 0 74 62 22 1618B 2014 22 48 10 0 1 81 46 21 018B 2016 18 49 13 1 0 81 37 27 222 2012 57 76 27 16 3 179 75 36 2122 2015 37 74 20 2 0 133 50 27 324B 2012 44 69 20 12 0 145 64 29 1724B 2015 47 95 25 8 0 175 49 26 828 South 2013 15 22 8 4 0 49 68 36 1828 South 2016 22 37 8 2 0 69 59 22 531/32 2012 12 19 8 3 0 42 63 42 1631/32 2013 17 34 14 8 0 73 50 41 2431/32 2014 19 30 7 7 0 63 63 23 23
Historic Summary of Combined Bighorn Sheep Survey Data
Year Ram Ewe Lamb Yearling Unclassified TotalNumber Per 100 Ewes
Rams Lambs Yearlings2009 568 1075 369 122 10 2144 53 34 112010 462 899 238 176 1 1777 51 27 202011 590 1209 409 118 1 2329 49 34 102012 858 1541 446 210 10 3065 56 29 142013 515 982 258 67 2 1824 52 26 72014 1134 1967 602 313 36 4052 58 31 162015 1025 1818 512 199 23 3577 56 28 112016 605 1123 245 164 17 2154 54 22 15

126 Hunt Arizona 2017
Bighorn Survey Data
5-Year: 2012-2016 Desert Bighorn Sheep Survey Data (continued)
Unit Year Ram Ewe Lamb Yearling Unclassified TotalNumber per 100 Ewes
Rams Lambs Yearlings31/32 2015 30 43 14 8 0 95 70 33 1933 2015 3 16 7 1 0 27 19 44 633 2016 11 22 0 4 0 37 50 0 1837A 2014 20 59 33 20 1 133 34 56 3437A 2015 40 77 17 33 0 167 52 22 4337A 2016 55 85 5 33 3 181 65 6 3937B 2012 14 24 10 4 0 52 58 42 1737B 2013 19 28 8 3 0 58 68 29 1137B 2014 8 16 5 0 0 29 50 31 037B 2015 33 64 12 2 00 111 52 19 339 2013 9 11 2 1 0 23 82 18 939 East 2012 14 21 5 7 0 47 67 24 3339 East 2015 20 18 8 4 0 50 111 44 2239 East 2016 5 4 0 3 0 12 125 0 7539 West 2012 21 33 11 5 0 70 64 33 1539 West 2015 19 41 5 9 0 74 46 12 2240A 2011 14 25 8 4 0 51 56 32 1640A 2014 14 25 3 5 0 47 56 12 2040A North 2011 7 9 3 0 0 19 78 33 040A North 2014 5 6 0 0 0 11 83 0 040A South 2011 7 16 5 4 0 32 44 31 2540A South 2014 9 19 3 5 0 36 47 16 2640B East 2012 9 13 3 1 0 26 69 23 840B West 2012 57 88 18 21 2 186 65 20 2440B West Gila Mtns 2015 32 42 6 3 3 86 75 14 740B West Mohawk 2015 21 31 3 1 1 57 68 10 340B West Tinajas 2015 21 27 5 4 2 59 78 19 1541 North Gila Mtns 2014 2 12 3 3 0 20 17 25 2541 East 2012 18 42 9 6 0 75 43 21 1441 East 2015 25 59 20 8 0 112 42 34 1441 West 2012 13 29 8 4 1 55 45 28 1441 West 2015 23 30 3 5 0 61 77 10 1742 2012 7 28 6 3 0 44 25 21 1142 2013 16 25 5 4 0 50 64 20 1642 2016 4 15 2 1 0 22 27 13 742/44A East 2016 14 28 5 4 0 51 50 18 1443A 2013 17 24 4 3 1 49 71 17 1343A 2016 11 23 7 4 0 45 48 30 1743B 2013 68 127 24 9 1 229 54 19 743B 2016 38 100 17 19 3 177 38 17 1943B Laguna Mtns 2014 5 8 3 1 0 17 63 38 1344A East 2013 24 25 8 4 0 61 96 32 1644A East 2016 22 25 8 5 0 60 88 32 2044AE South 2013 3 7 2 1 0 13 43 29 1444AE South 2016 10 13 3 3 0 29 77 23 2344A West 2013 5 6 1 0 0 12 83 17 044A West 2016 3 10 4 4 0 21 30 40 4044B North 2014 41 73 16 13 1 144 56 22 1844B North 2016 37 68 19 13 7 144 54 28 1944B South 2014 24 30 11 11 0 76 80 37 3745A 2012 24 60 19 13 0 116 40 32 2245A 2014 48 85 16 18 2 169 56 19 2145A 2015 60 103 28 16 0 207 58 27 1645A 2016 51 83 25 17 3 179 61 30 2045B 2012 16 28 5 6 1 56 57 18 2145B 2014 28 37 8 7 2 82 76 22 1945B 2015 25 34 5 4 0 68 71 15 1245B 2016 32 36 13 8 0 89 89 36 2245C 2012 25 64 10 13 0 112 39 16 2045C 2014 28 47 9 6 3 93 60 19 1345C 2015 36 49 16 11 2 114 73 33 2245C 2016 29 63 19 20 0 131 46 30 3246AE 2011 14 20 4 3 0 41 70 20 15

Hunt Arizona 2017 127
Bighorn Survey Data
5-Year: 2012-2016 Rocky Mountain Bighorn Sheep Survey Data
Unit Year Ram Ewe Lamb Yearling Unclassified TotalNumber per 100 Ewes
Rams Lambs Yearlings1/27 North 2012 15 40 20 6 0 81 38 50 151/27 North 2013 11 7 2 0 0 20 157 29 01/27 North 2014 8 56 20 8 2 94 14 36 141/27 North 2015 5 29 13 8 4 59 17 45 281/27 North 2016 15 86 33 8 1 143 17 38 96A 2012 26 59 18 0 0 103 44 31 06A/22 North 2014 23 34 20 2 2 81 68 59 66A/22 North 2015 21 22 2 0 0 45 95 9 027 2012 17 12 7 3 0 39 142 58 2527 North 2012 20 44 14 5 0 83 45 32 1127 North 2013 18 22 5 0 0 45 82 23 027 North 2014 53 76 20 8 0 157 70 26 1127 North 2015 43 49 9 4 1 106 88 18 827 North 2016 46 60 17 6 0 129 77 28 1027 South 2012 22 9 2 4 0 37 244 22 4427 South 2013 14 18 5 0 0 37 78 28 027 South 2015 1 5 3 2 0 11 20 60 4027 South 2016 25 31 16 3 0 75 81 52 1027 South/28 North 2014 46 134 52 32 0 264 34 39 2427 South/28 North 2015 58 144 40 12 10 264 40 28 828 2016 4 2 2 0 0 8 200 100 0
Unit Year Ram Ewe Lamb Yearling Unclassified TotalNumber per 100 Ewes
Rams Lambs Yearlings46AE 2014 21 20 10 5 2 58 105 50 2546AW 2011 12 22 10 4 0 48 55 45 1846AW 2014 22 35 10 5 0 72 63 29 1446BE 2011 26 42 6 3 0 77 62 14 746BE 2014 38 44 16 14 3 115 86 36 3246BW 2011 51 54 14 15 0 134 94 26 2846BW 2014 40 57 20 14 0 131 70 35 25
5-Year: 2012-2016 Desert Bighorn Sheep Survey Data (continued)

128 Hunt Arizona 2017
Bighorn Hunt Data
Historic Summary of Bighorn Sheep Hunts¹
Year Permits Authorized
1st Choice Applicants Permits Issued Hunters Hunter Days Total Harvest Percent Success
1953 37 – 37 37 218 20 54�11954 20 – 20 19 103 12 63�21955 20 – 20 20 132 5 25�01956 20 – 20 19 112 6 31�61957 20 – 20 20 130 6 30�01958 40 – 40 37 – 18 48�61959 65 – 65 62 – 19 30�61960 80 – 80 80 – 24 30�01961 85 – 85 84 – 26 31�01962 90 – 90 89 – 27 30�31963 81 – 81 79 – 32 40�51964 78 – 78 76 – 25 32�91965 90 573 90 83 – 42 50�61966 84 601 84 84 – 35 41�71967 84 888 84 83 – 31 37�31968 81 1170 81 77 – 47 61�01969 86 1376 86 84 – 42 50�01970 79 1540 79 76 – 39 51�31971 82 1658 82 79 – 29 36�71972 71 1454 71 71 – 34 47�91973 65 1397 65 62 – 37 59�71974 57 1361 57 55 – 36 65�51975 54 1203 54 51 391 30 58�81976 55 1461 55 55 344 40 72�71977 51 1630 51 51 331 44 86�31978 52 1842 52 48 235 39 81�31979 52 1937 52 52 341 41 78�81980 50 2230 50 50 343 39 78�01981 45 2635 45 43 293 34 79�11982 42 2585 42 42 224 36 85�71983 48 2159 48 47 233 44 93�61984 55 2259 55 55 349 51 92�71985 56 2461 56 56 306 52 92�91986 65 2699 65 64 358 56 87�51987 72 3065 72 72 370 68 94�41988 78 3281 78 78 361 75 96�21989 82 3693 82 81 442 74 91�41990 78 3734 78 77 425 68 88�31991 85 4174 85 84 497 78 92�91992 82 4407 83 83 441 74 89�21993 99 4946 99 99 501 92 92�91994 112 5673 112 109 580 100 91�71995 113 6256 114 114 622 109 95�61996 108 6843 108 108 754 100 92�61997 99 7077 99 99 721 92 92�91998 109 7790 109 109 907 98 89�91999 111 8408 111 110 745 104 94�52000 105 8471 106 106 691 101 95�32001 105 8767 105 104 748 96 92�32002 104 13013 105 101 674 92 91�12003 99 16049 99 95 764 87 91�62004 84 18927 84 84 663 68 80�92005 82 11266 82 81 681 73 90�12006 96 16332 96 95 673 87 91�62007 99 10930 99 97 698 92 94�82008 93 9017 94 94 702 86 91�52009 90 8500 90 89 533 87 97�82010 100 8206 100 100 589 92 92�02011 99 8315 99 99 589 96 97�02012 98 12233 96 96 556 96 100�02013 109 13488 109 107 652 103 96�02014 107 14236 104 103 640 102 99�02015 120 15758 120 119 760 115 97�02016 107 16314 107 105 634 103 98�0

Hunt Arizona 2017 129
Unit Year Dates PermitsAuthorized
1st Choice Applicants
2nd Choice Applicants
PermitsIssued
DrawOdds Hunters Hunter-
Days Harvest Hunt Success
1/27 2015 11/01-11/30 1 166 122 1 0�6 1 7 1 1001/27 2016 11/01-11/30 1 180 106 1 0�6 1 1 1 1006A 2012 12/01-12/31 2 650 299 2 0�3 2 3 2 1006A (early) 2013 12/01-12/15 2 694 323 2 0�3 2 6 2 1006A (late) 2013 12/16-12/31 2 196 620 2 0�5 2 2 2 1006A/22 North (early) 2014 12/01-12/15 2 932 374 2 0�2 2 13 2 1006A/22 North (early) 2016 11/18-12/08 2 1056 559 2 0�1 2 3 2 1006A/22 North (late) 2014 12/16-12/31 2 269 766 2 0�0 2 3 2 1006A/22 North (late) 2016 12/09-12/31 2 748 1053 2 0�1 2 3 2 1006A/22 North 2015 12/01-12/31 4 1439 717 4 0�3 4 10 4 1009/10 2012 10/01-12/31 1 67 47 1 1�5 1 4 1 1009/10 2013 10/01-12/31 1 65 46 1 0�0 1 5 1 1009/10 2014 10/01-12/31 1 64 57 1 1�6 1 4 1 1009/10 2015 12/01-12/31 1 90 50 1 0�0 1 4 1 1009/10 2016 10/01-12/31 1 113 59 1 0�0 1 1 1 10012A/12B West 2012 12/01-12/31 1 52 57 1 1�9 1 1 1 10012A/12B West 2013 12/01-12/31 1 43 49 1 2�3 1 6 1 10012A/12B West 2014 12/01-12/31 1 52 49 1 1�9 1 3 1 10012A/12B West 2015 12/01-12/31 1 54 58 1 1�9 1 6 1 10012A/12B West 2016 12/01-12/31 1 70 64 1 1�4 1 6 1 10012B East 2012 12/01-12/31 3 347 324 3 0�6 3 16 3 10012B East 2013 12/01-12/31 3 261 233 3 1�1 3 12 3 10012B East 2014 12/01-12/31 3 203 202 3 0�5 2 26 2 10012B East 2015 12/01-12/31 4 321 388 4 0�6 4 24 4 10012B East 2016 12/01-12/31 4 460 556 4 0�4 4 23 3 7513A 2012 12/01-12/31 1 43 58 1 0�0 1 1 1 10013A 2013 12/01-12/31 1 61 62 1 1�6 1 12 0 013A 2014 12/01-12/31 1 61 55 1 1�6 1 13 1 10013A 2015 12/01-12/31 1 59 50 1 1�7 1 4 1 10013A 2016 12/01-12/31 1 84 82 1 0�0 1 4 1 10013B North 2012 12/01-12/31 3 430 358 3 0�5 3 5 3 10013B North 2013 12/01-12/31 3 448 269 3 0�7 3 38 2 6713B North 2014 12/01-12/31 3 403 295 3 0�7 2 6 2 10013B North 2015 12/01-12/31 3 478 336 3 0�4 3 27 3 10013b North 2016 12/01-12/31 3 729 419 3 0�0 3 16 3 10013B South 2012 11/16-12/31 1 28 52 1 3�6 1 8 1 10013B South 2013 11/16-12/31 1 32 68 1 3�1 1 14 1 10013B South 2014 11/16-12/31 1 25 39 1 0�0 1 8 0 013B South 2015 11/16-12/31 1 36 46 1 0�0 1 6 0 013B South 2016 11/16-12/31 1 38 62 1 0�0 1 1 1 10015A/15B East 2012 12/01-12/31 1 28 47 1 0�0 1 9 1 10015B West 2012 12/01-12/31 2 95 179 2 1�1 2 23 2 10015B West 2013 12/01-12/31 4 279 347 4 0�4 4 24 4 10015B West 2014 12/01-12/31 3 184 245 3 1�1 3 11 3 10015B West 2015 12/01-12/31 3 164 253 3 0�6 3 17 3 10015B West 2016 12/01-12/31 1 96 57 1 1�0 1 4 1 10015C North 2012 12/01-12/31 6 445 807 6 0�7 6 14 6 10015C North 2013 12/01-12/31 6 989 763 6 0�5 5 26 5 10015C North 2014 12/01-12/31 3 328 281 3 0�9 3 21 3 10015C North 2015 12/01-12/31 3 255 193 3 0�8 3 5 3 10015C North 2016 12/01-12/31 1 88 121 1 0�0 1 1 1 10015C South 2012 12/01-12/31 2 126 319 2 0�8 2 3 2 10015C South 2013 12/01-12/31 2 104 172 2 0�0 2 2 2 10015C South 2014 12/01-12/31 2 192 335 2 0�5 2 13 2 10015C South 2015 12/01-12/31 2 161 296 2 0�6 2 14 2 10015C South 2016 12/01-12/31 1 45 111 1 2�2 1 8 1 10015D 2012 12/01-12/31 9 1311 867 9 0�5 9 46 8 8915D North 2013 11/22-12/11 5 807 622 5 0�5 5 10 5 10015D North 2013 12/12-12/31 6 637 899 6 0�3 6 19 6 10015D North 2014 12/01-12/31 8 2023 1066 8 0�3 8 39 8 10015D North 2015 12/01-12/31 8 2125 1184 8 0�3 8 25 8 10015D North 2016 12/01-12/31 6 1127 769 6 0�4 6 44 6 10015D South 2013 12/01-12/31 4 166 253 4 1�8 4 19 4 100
Bighorn Harvest Data
5-Year: 2012-2016 Harvest

130 Hunt Arizona 2017
Unit Year Dates PermitsAuthorized
1st Choice Applicants
2nd Choice Applicants
PermitsIssued
DrawOdds Hunters Hunter-
Days Harvest Hunt Success
15D South 2014 12/01-12/31 4 308 839 4 0�3 4 33 4 10015D South 2015 12/01-12/31 4 359 939 4 0�6 4 20 4 10016A 2012 12/01-12/31 2 185 128 2 0�0 2 10 2 10016A 2013 12/01-12/31 2 190 118 2 0�5 2 6 2 10016A 2014 12/01-12/31 3 315 268 3 0�0 3 5 3 10016A 2015 12/01-12/31 3 154 250 3 0�6 3 44 2 6716A 2016 12/01-12/31 2 104 259 2 1�0 2 19 2 10016AS/18B 2016 12/01-12/31 1 69 65 1 1�4 1 2 1 10016B 2012 12/01-12/31 2 68 145 2 1�5 2 6 2 10016B 2013 12/01-12/31 2 149 247 2 0�7 2 18 2 10016B 2014 12/01-12/31 2 131 142 2 1�5 2 6 2 10016B 2015 12/01-12/31 1 42 54 1 2�4 1 3 1 10016B 2016 12/01-12/31 1 64 66 1 1�6 1 2 1 10018B 2013 12/01-12/31 1 55 20 1 0�0 1 2 1 10018B 2014 12/01-12/31 1 59 40 1 0�0 1 7 1 10018B 2015 12/01-12/31 1 38 44 1 2�6 1 1 1 10022 2012 12/01-12/31 3 1642 457 3 0�2 3 5 3 10022 2013 12/01-12/31 3 1775 467 3 0�2 3 27 3 10022 2014 12/01-12/31 3 1761 471 3 0�1 3 11 3 10022 2015 12/01-12/31 4 1868 669 4 0�2 4 51 3 7522 2016 12/01-12/31 2 1537 528 2 0�1 2 4 2 10023/24A 2015 12/01-12/31 1 156 184 1 0�0 1 3 1 10023/24A 2016 12/01-12/31 1 181 129 1 0�6 1 16 1 10024B Superstition Wild� 2013 12/01-12/31 1 142 144 1 0�7 1 21 1 10024B Superstition Wild� 2014 12/01-12/31 1 140 129 1 0�0 1 12 1 10024B Superstition Wild� 2015 12/01-12/31 1 222 165 1 0�0 1 5 1 10024B Superstition Wild� 2016 12/01-12/31 1 236 137 1 0�0 1 12 1 10024B North 2012 12/01-12/31 1 223 253 1 0�4 1 16 1 10024B North 2013 12/01-12/31 1 183 274 1 0�5 1 20 1 10024B North 2014 12/01-12/31 1 167 275 1 0�6 1 9 1 10024B North 2015 12/01-12/31 1 156 290 1 0�0 1 3 1 10024B North 2016 12/01-12/31 1 203 293 1 0�0 0 0 0 -24B South 2012 12/01-12/31 1 232 242 1 0�4 1 19 1 10024B South 2013 12/01-12/31 2 376 505 2 0�3 2 7 2 10024B South 2014 12/01-12/31 2 745 617 2 0�3 2 16 2 10024B South 2015 12/01-12/31 2 413 589 2 0�2 2 14 2 10024B South 2016 12/01-12/31 1 210 228 1 0�5 1 13 1 10027 Bear Canyon 2012 12/01-12/31 1 90 125 1 1�1 1 5 1 10027 Upper Blue River 2013 12/01-12/31 2 296 267 2 0�7 2 5 2 10027 Upper Blue River 2014 12/01-12/31 3 363 418 3 0�6 3 46 2 6727 Upper Blue River 2015 12/01-12/31 5 531 710 5 0�8 5 30 5 10027 Lower Blue River 2012 12/01-12/31 1 59 102 1 1�7 1 1 1 10027 Lower Blue River 2013 12/01-12/31 3 288 351 3 0�7 2 5 2 10027 Lower Blue River 2014 12/01-12/31 3 316 410 3 0�6 3 14 3 10027 Lower Blue River 2015 12/01-12/31 2 139 285 2 1�4 2 11 2 10027/28 2016 11/18-12/08 3 393 520 3 0�0 3 9 3 10027/28 2016 12/09-12/31 2 269 670 2 0�4 2 14 2 10027N Foote Creek 2012 12/01-12/31 3 492 333 3 0�2 3 13 2 6727N Upper Blue 2016 11/18-12/08 3 435 327 3 0�7 3 18 3 10027N 2016 12/09-12/31 2 199 357 2 1�0 2 14 2 10027S/28N (early) 2012 12/01-12/15 3 649 526 3 0�5 3 11 3 10027S/28N (late) 2012 12/16-12/31 3 323 898 3 0�6 3 27 3 10027S/28N (early) 2013 12/01-12/15 4 761 576 4 0�4 4 17 4 10027S/28N (late) 2013 12/16-12/31 3 225 618 3 0�4 3 8 3 10027S/28N (early) 2014 12/01-12/15 4 645 439 4 0�6 3 11 3 10027S/28N (late) 2014 12/16-12/31 3 187 618 3 1�6 3 8 3 10027S/28N 2015 12/01-12/31 5 621 788 5 0�6 5 24 5 10028 Peloncillo Mtns 2012 12/01-12/31 1 78 91 1 1�3 1 2 1 10028 Peloncillo Mtns 2013 12/01-12/31 1 123 95 1 0�0 1 2 1 10028 Peloncillo Mtns 2014 12/01-12/31 1 137 104 1 0�0 1 3 1 10028 Peloncillo Mtns 2015 12/01-12/31 1 132 116 1 0�8 1 1 1 10028 Peloncillo Mtns 2016 12/01-12/31 1 156 113 1 0�6 0 0 0 -31/32 2012 12/01-12/31 3 1172 922 3 0�3 3 7 3 100
Bighorn Harvest Data
5-Year: 2012-2016 Harvest (continued)

Hunt Arizona 2017 131
Unit Year Dates PermitsAuthorized
1st Choice Applicants
2nd Choice Applicants
PermitsIssued
DrawOdds Hunters Hunter-
Days Harvest Hunt Success
31/32 2013 12/01-12/31 2 890 486 2 0�2 2 14 2 10031/32 2014 12/01-12/31 2 609 401 2 0�3 2 12 2 10031/32 2015 12/01-12/31 2 551 348 2 0�4 2 6 2 10031/32 2016 12/01-12/31 3 859 677 3 0�1 3 46 3 10037A 2012 12/01-12/31 1 322 154 1 0�3 1 3 1 10037A 2013 12/01-12/31 2 399 285 2 0�3 2 18 2 10037A 2014 12/01-12/31 1 280 119 1 0�0 1 8 1 10037A 2015 12/01-12/31 2 654 414 2 0�3 2 8 2 10037A 2016 12/01-12/31 2 715 580 2 0�1 2 10 2 10037B 2013 12/01-12/31 1 170 132 1 0�6 1 4 1 10037B 2014 12/01-12/31 1 119 141 1 0�8 1 1 1 10037B 2015 12/01-12/31 1 124 170 1 0�0 1 11 1 10037B 2016 12/01-12/31 1 180 183 1 0�6 1 1 1 10039 2016 12/01-12/31 1 70 62 1 0�0 1 1 1 10039 West 2012 12/01-12/31 2 214 149 2 0�9 2 8 2 10039 West 2013 12/01-12/31 2 248 207 2 0�4 2 17 2 10039 West 2014 12/01-12/31 2 212 252 2 0�9 2 21 2 10039 West 2015 12/01-12/31 2 221 187 2 0�5 2 4 2 10039 East 2013 12/01-12/31 1 44 51 1 0�0 1 9 1 10039 East 2014 12/01-12/31 1 42 55 1 2�4 1 15 1 10039 East 2015 12/01-12/31 1 46 67 1 0�0 1 2 1 10039 East 2016 12/01-12/31 2 170 230 2 0�6 2 18 2 10040A 2014 12/01-12/31 1 60 32 1 1�7 1 26 1 10040A 2015 12/01-12/31 2 116 103 2 1�7 2 28 2 10040A 2016 12/01-12/31 2 280 206 2 0�7 2 34 2 10040B W Gila Mtns 2012 12/01-12/31 2 92 155 2 1�1 2 8 2 10040B W Gila Mtns 2013 12/01-12/31 2 89 238 2 1�1 2 43 1 5040B W Gila Mtns 2014 12/01-12/31 2 143 206 2 0�0 2 10 2 10040B W Gila Mtns 2015 12/01-12/31 2 134 141 2 0�7 2 9 2 10040B W Gila Mtns 2016 12/01-12/31 4 263 434 4 0�4 4 13 4 10040B W Mohawk/Copper 2012 12/01-12/31 2 99 211 2 1�0 2 22 2 10040B W Mohawk/Copper 2013 12/01-12/31 3 204 352 3 1�0 3 26 3 10040B W Mohawk/Copper 2014 12/01-12/31 3 174 354 3 0�6 3 10 3 10040B W Mohawk/Cooper 2015 12/01-12/31 3 166 315 3 1�2 3 38 3 10040B W Mohawk/Cooper 2016 12/01-12/31 2 95 171 2 �21 2 12 2 10040B W Tinajas Atlas 2012 12/01-12/31 2 217 192 2 0�5 2 11 2 10040B W Tinajas Atlas 2013 12/01-12/31 1 46 66 1 2�2 1 3 1 10040B W Tinajas Atlas 2014 12/01-12/31 1 46 60 1 2�2 1 2 1 10040B W Tinajas Atlas 2015 12/01-12/31 1 60 75 1 1�7 1 1 1 10040B W Tinajas Atlas 2016 12/01-12/31 2 151 202 2 0�0 2 8 2 10041E 2012 12/01-12/31 2 198 168 2 1�0 2 32 2 10041E 2013 12/01-12/31 1 66 75 1 1�5 1 4 1 10041E 2014 12/01-12/31 1 95 90 1 1�1 1 9 1 10041E 2015 12/01-12/31 1 101 88 1 0�0 1 6 1 10041E 2016 12/01-12/31 2 159 183 2 1�3 2 43 1 5041W 2012 12/01-12/31 2 44 136 2 0�0 2 5 2 10041W 2013 12/01-12/31 1 34 60 1 0�0 1 3 1 10041W 2014 12/01-12/31 1 32 62 1 3�1 1 5 1 10041W 2015 12/01-12/31 1 43 60 1 2�3 1 8 1 10041W 2016 12/01-12/31 2 169 289 2 0�6 2 18 2 10042 2013 12/01-12/31 1 71 61 1 1�4 1 1 1 10042/44A South 2014 12/01-12/31 2 233 172 2 0�4 1 6 2 20042/44A South 2015 12/01-12/31 2 240 148 2 0�8 2 45 1 5042/44A South 2016 12/01-12/31 1 150 80 1 0�7 1 1 1 10043A 2012 12/01-12/31 1 44 55 1 0�0 1 6 1 10043A 2013 12/01-12/31 1 39 39 1 2�6 1 7 1 10043A 2014 12/01-12/31 1 75 56 1 0�0 1 2 1 10043A 2015 12/01-12/31 1 79 64 1 1�3 1 2 1 10043A 2016 12/01-12/31 1 139 63 1 0�7 1 4 1 10043B 2012 12/01-12/31 6 662 565 6 0�5 6 40 6 10043B 2013 12/01-12/31 6 715 580 6 0�4 6 34 5 8343B 2014 12/01-12/31 7 743 698 7 0�7 7 53 7 10043B 2015 12/01-12/31 7 682 563 7 0�9 7 17 7 100
Bighorn Harvest Data
5-Year: 2012-2015 Harvest (continued)

132 Hunt Arizona 2017
Unit Year Dates PermitsAuthorized
1st Choice Applicants
2nd Choice Applicants
PermitsIssued
DrawOdds Hunters Hunter-
Days Harvest Hunt Success
43B 2016 12/01/-12/31 7 1318 912 7 0�5 7 21 7 10044A East 2012 12/01-12/31 1 77 61 1 0�0 1 2 1 10044A East 2013 12/01-12/31 1 68 64 1 1�5 1 21 1 10044A East 2014 12/01-12/31 1 40 37 1 2�5 1 2 1 10044A East 2015 12/01-12/31 1 52 55 1 1�9 1 3 1 10044A East 2016 12/01-12/31 1 57 51 1 0�0 1 8 1 10044A West 2012 12/01-12/31 1 86 74 1 1�2 1 3 1 10044A West 2013 12/01-12/31 1 47 77 1 2�1 1 2 1 10044A West 2014 12/01-12/31 1 74 51 1 1�4 1 1 1 10044A West 2015 12/01-12/31 1 58 75 1 0�0 1 8 1 10044A West 2016 12/01-12/31 1 77 85 1 1�3 1 19 1 10044B North 2012 12/01-12/31 2 586 338 2 0�3 2 2 2 10044B North 2013 12/01-12/31 2 466 306 2 0�2 2 6 2 10044B North 2014 12/01-12/31 2 603 578 2 0�0 2 7 2 10044B North 2015 12/01-12/31 4 1108 595 4 0�3 4 31 4 10044B North 2016 12/01-12/31 4 1070 657 4 0�4 4 5 4 10044B South 2012 12/01-12/31 1 53 87 1 1�9 1 1 1 10044B South 2013 12/01-12/31 1 43 84 1 2�3 1 5 1 10044B South 2014 12/01-12/31 1 53 81 1 1�9 1 1 1 10044B South 2015 12/01-12/31 2 250 401 2 0�4 1 1 1 10044B South 2016 12/01-12/31 2 292 274 2 0�7 2 11 2 10045A 2012 12/01-12/31 1 47 48 1 2�1 1 11 1 10045A 2013 12/01-12/31 1 47 42 1 2�1 1 4 1 10045A 2014 12/01-12/31 1 37 46 1 2�7 1 6 1 10045A 2015 12/01-12/31 3 304 241 3 0�7 3 25 3 10045A 2016 12/01-12/31 3 285 321 3 0�7 3 20 3 10045B 2012 12/01-12/31 1 23 71 1 0�0 1 15 1 10045B 2013 12/01-12/31 1 26 52 1 0�0 1 20 1 10045B 2014 12/01-12/31 1 32 50 1 0�0 1 2 1 10045B 2015 12/01-12/31 2 100 168 2 1�0 2 22 2 10045B 2016 12/01-12/31 2 73 155 2 0�0 2 30 2 10045C 2012 12/01-12/31 3 168 159 3 1�2 3 14 3 10045C 2013 12/01-12/31 1 79 55 1 1�3 1 1 1 10045C 2014 12/01-12/31 1 92 52 1 1�1 1 28 1 10045C 2015 12/01-12/31 1 67 49 1 1�5 1 4 1 10045C 2016 12/01-12/31 2 192 99 2 0�5 2 12 2 10046A 2012 12/01-12/31 2 145 198 2 1�4 2 20 1 5046A 2013 12/01-12/31 2 93 139 2 0�0 2 27 2 10046A 2014 12/01-12/31 2 111 177 2 0�0 2 6 2 10046A East 2015 12/01-12/31 2 84 151 2 1�2 2 12 2 10046A East 2016 12/01-12/31 2 99 187 2 1�0 2 4 2 10046A West 2015 12/01-12/31 2 37 105 2 0�0 2 13 2 10046A West 2016 12/01-12/31 2 64 112 2 0�0 2 15 2 10046B 2012 12/01-12/31 7 321 493 7 0�9 7 44 7 10046B 2013 12/01-12/31 7 259 349 7 0�8 7 42 7 10046B 2014 12/01-12/31 7 321 535 7 0�9 7 58 7 10046B East 2015 12/01-12/31 4 156 222 4 1�3 4 25 4 10046B East 2016 12/01-12/31 4 165 245 4 1�2 4 9 4 10046B West 2015 12/01-12/31 4 146 260 4 0�7 4 27 4 10046B West 2016 12/01-12/31 4 333 392 4 0�9 4 29 4 100
Bighorn Harvest Data
5-Year: 2012-2015 Harvest (continued)

Hunt Arizona 2017 133
Hunt Curl(Inches) Base(Inches)
Name Unit Left Right Left Right Maximum-Spread TiptoTip Age Arizo-
naScoreGreen Score
Special tag 15D 29 7/8 34 4/8 14 7/8 14 7/8 25 6/8 25 6/8 10 94 1/8 164 7/8Special tag 43A 41 2/8 39 6/8 13 6/8 13 5/8 21 21 13 108 3/8 181 2/86001 10 28 4/8 32 2/8 13 5/8 13 5/8 18 7/8 21 3/8 7 88 152 6002 12A/12BW 29 2/8 30 1/8 13 2/8 13 1/8 26 4/8 26 4/8 3 85 6/8 136 1/86003 12BE 27 4/8 27 3/8 14 2/8 14 6/8 21 2/8 21 2/8 7 83 7/8 149 3/86003 12BE 30 2/8 25 7/8 13 7/8 14 23 22 5/8 7 84 149 5/86003 12BE 32 6/8 28 7/8 14 6/8 14 4/8 26 7/8 26 7/8 6 90 7/8 147 7/86004 13A 33 7/8 34 4/8 14 2/8 14 4/8 25 25 7 97 1/8 164 3/86005 13BN 33 33 2/8 14 2/8 14 2/8 22 2/8 22 2/8 4 94 6/8 148 4/86005 13BN 32 3/8 32 4/8 14 1/8 14 2/8 22 21 9 93 2/8 161 1/86005 13BN 33 1/8 35 16 16 1/8 22 5/8 23 2/8 6 100 2/8 172 7/86006 13BS 30 6/8 31 1/8 14 1/8 14 2/8 21 7/8 21 7/8 5 90 2/8 148 7/86007 15BW 30 6/8 30 2/8 14 2/8 14 1/8 21 2/8 21 2/8 10 89 3/8 152 6/86008 15CN 35 6/8 36 3/8 13 5/8 13 4/8 22 7/8 22 7/8 9 99 2/8 163 5/86009 15CS 33 1/8 35 1/8 14 6/8 14 6/8 24 5/8 24 5/8 6 97 6/8 162 2/86010 15D 30 32 7/8 14 4/8 14 7/8 25 6/8 25 6/8 8 92 2/8 164 7/86010 15D 33 6/8 33 4/8 14 2/8 14 26 1/8 26 1/8 9 95 4/8 162 4/86010 15D 33 6/8 34 1/8 14 6/8 14 7/8 22 3/8 22 4/8 4 97 4/8 167 1/86010 15D 31 2/8 28 4/8 13 3/8 13 1/8 26 6/8 26 6/8 10 86 2/8 147 6010 15D 32 3/8 32 1/8 14 14 2/8 22 7/8 22 7/8 9 92 6/8 161 2/86010 15D 33 7/8 33 14 3/8 14 4/8 17 7/8 17 7/8 6 95 6/8 151 3/86011 16A 36 6/8 34 4/8 14 1/8 14 1/8 19 4/8 17 4/8 7 99 4/8 167 6/86011 16A 32 5/8 31 1/8 13 5/8 13 5/8 18 16 4/8 8 91 154 2/86012 18B 35 2/8 35 5/8 15 3/8 15 7/8 21 1/8 21 1/8 5 102 1/8 171 3/86013 16B 32 4/8 33 6/8 12 4/8 12 4/8 21 2/8 18 2/8 9 91 2/8 156 6014 22 35 2/8 35 6/8 14 4/8 14 4/8 21 4/8 16 4/8 7 100 170 2/86014 22 36 5/8 36 7/8 16 1/8 16 2/8 20 5/8 15 7/8 8 105 7/8 181 6015 24BW 36 2/8 36 3/8 16 2/8 16 25 4/8 20 4/8 9 104 7/8 178 7/86017 24BS 39 2/8 36 3/8 16 4/8 16 4/8 24 4/8 24 4/8 7 108 5/8 185 1/86019 31 34 5/8 36 5/8 15 3/8 15 2/8 26 25 4/8 8 101 7/8 165 6/86019 31/32 33 6/8 34 13 5/8 13 5/8 20 5/8 22 2/8 11 95 157 4/86019 31/32 35 7/8 38 4/8 14 5/8 14 4/8 24 23 1/8 9 103 4/8 173 7/86020 37A 32 5/8 32 4/8 15 3/8 15 5/8 18 7/8 15 5/8 10 96 1/8 162 3/86020 37A 33 3/8 35 3/8 16 16 21 1/8 17 4/8 9 100 6/8 170 4/86021 37B 34 2/8 34 2/8 15 15 1/8 23 2/8 22 5/8 6 98 5/8 167 6/86022 39E 35 2/8 33 3/8 15 6/8 15 6/8 22 2/8 16 7 100 1/8 171 1/86023 39W 31 2/8 31 2/8 13 4/8 13 3/8 22 3/8 17 4/8 7 89 3/8 153 6/86023 39W 34 2/8 34 14 1/8 14 2/8 21 3/8 19 4/8 7 96 5/8 161 2/86024 40A 34 5/8 33 6/8 15 2/8 15 21 2/8 18 4/8 6 98 5/8 166 3/86024 40A 29 2/8 28 6/8 14 14 21 2/8 22 6 86 143 2/86025 40BWG 33 32 4/8 14 4/8 14 5/8 19 19 8 94 5/8 159 6/86025 40BWG 31 6/8 35 1/8 15 15 18 3/8 16 1/8 9 96 7/8 161 3/86025 40BWG 33 33 2/8 15 1/8 15 1/8 21 5/8 17 4/8 8 96 4/8 169 6/86025 40BWG 28 1/8 30 6/8 14 7/8 14 2/8 20 18 7/8 6 88 143 1/86026 40BWM 29 27 5/8 14 1/8 14 1/8 16 6/8 14 6/8 3 84 7/8 135 5/86026 40BWM 34 34 1/8 15 2/8 15 2/8 19 3/8 16 9 98 5/8 168 3/86027 40BWT 36 6/8 37 4/8 15 4/8 15 7/8 21 4/8 16 5/8 9 105 5/8 176 4/86027 40BWT 32 2/8 34 4/8 14 2/8 14 2/8 18 3/8 15 3/8 6 95 2/8 155 2/86028 41E 32 32 6/8 14 7/8 15 21 20 4/8 8 94 5/8 164 2/86029 41W 38 3/8 37 5/8 14 3/8 14 3/8 20 1/8 20 10 104 6/8 178 4/86029 41W 29 5/8 30 4/8 14 2/8 14 4/8 17 7/8 14 6/8 7 88 7/8 155 5/86030 42 35 32 15 1/8 14 7/8 20 6/8 20 7/8 6 97 165 2/86031 43A 31 7/8 33 6/8 14 2/8 14 3/8 20 5/8 15 3/8 8 94 2/8 164 5/86032 43B 31 2/8 31 3/8 13 4/8 13 4/8 19 2/8 18 6/8 6 89 5/8 152 5/86032 43B 33 4/8 33 4/8 14 2/8 14 2/8 21 5/8 20 4/8 8 95 4/8 161 4/86032 43B 30 1/8 30 1/8 14 1/8 14 2/8 20 18 9 88 5/8 157 6/86032 43B 35 2/8 35 3/8 15 4/8 15 2/8 20 1/8 19 7/8 8 101 3/8 169 3/86032 43B 32 32 4/8 13 1/8 13 2/8 20 15 2/8 7 90 7/8 156 6032 43B 29 31 6/8 13 2/8 13 4/8 19 3/8 16 3/8 8 87 4/8 145 4/86032 43B 33 35 6/8 14 14 2/8 21 5/8 19 3/8 9 97 167 6033 44AE 35 5/8 32 2/8 14 2/8 14 3/8 21 7/8 20 6/8 8 96 4/8 161 7/8
Successful Hunters and the Measurements of their Bighorn Sheep - 2016 Season
Successful Hunter Scores

134 Hunt Arizona 2017
Hunt Curl(Inches) Base(Inches)
Name Unit Left Right Left Right Maximum-Spread TiptoTip Age Arizo-
naScoreGreen Score
6034 44AW 30 6/8 31 3/8 14 4/8 14 3/8 20 18 4/8 6 91 161 1/86035 44BN 30 5/8 32 1/8 13 3/8 13 4/8 22 2/8 19 4/8 5 89 5/8 150 6035 44BN 33 32 2/8 14 14 20 4/8 20 4/8 6 93 2/8 154 6035 44BN 32 4/8 36 15 15 1/8 22 2/8 18 3/8 7 98 5/8 166 6/86035 44BN 35 3/8 36 15 15 21 7/8 18 6/8 8 101 3/8 169 3/86036 44BS 32 4/8 33 15 2/8 15 1/8 20 6/8 16 6/8 8 95 7/8 170 6036 44BS 34 3/8 35 2/8 17 2/8 17 2/8 21 2/8 19 7 104 1/8 178 3/86037 45A 33 3/8 33 6/8 14 3/8 14 3/8 21 1/8 20 6/8 8 95 7/8 162 5/86037 45A 30 2/8 31 6/8 14 2/8 14 1/8 20 3/8 20 1/8 5 90 3/8 144 2/86037 45A 35 3/8 35 6/8 15 2/8 15 2/8 20 4/8 20 4/8 11 101 5/8 174 3/86038 45B 32 5/8 33 14 5/8 14 6/8 20 6/8 19 7/8 9 95 165 1/86038 45B 33 3/8 31 4/8 13 7/8 13 7/8 23 2/8 22 7 92 5/8 156 7/86039 45C 35 4/8 36 4/8 14 7/8 15 2/8 23 1/8 20 6/8 8 102 1/8 171 6039 45C 28 6/8 27 3/8 13 2/8 13 21 1/8 18 6/8 9 82 3/8 149 3/86040 46AE 38 6/8 35 7/8 15 3/8 15 4/8 20 5/8 17 4/8 8 105 4/8 173 7/86040 46AE 35 5/8 36 15 2/8 15 20 4/8 20 4/8 9 101 7/8 171 7/86041 46AW 36 4/8 37 6/8 15 4/8 15 4/8 21 19 4/8 8 105 2/8 176 4/86041 46AW 35 2/8 34 1/8 14 5/8 14 4/8 20 7/8 18 7/8 9 98 4/8 167 1/86042 46BE 32 5/8 32 4/8 14 6/8 14 4/8 19 6/8 17 7/8 8 94 3/8 156 5/86042 46BE 31 4/8 32 1/8 13 4/8 13 4/8 20 1/8 17 1/8 7 90 5/8 152 1/86042 46BE 31 1/8 31 6/8 15 15 1/8 20 1/8 19 2/8 8 93 158 7/86042 46BE 34 3/8 34 1/8 15 3/8 15 2/8 21 4/8 19 2/8 8 99 1/8 171 6043 46BW 28 1/8 27 4/8 13 7/8 14 2/8 18 3/8 19 7/8 5 83 6/8 134 5/86043 46BW 32 3/8 32 2/8 14 5/8 14 7/8 21 5/8 20 5/8 6 94 1/8 155 5/86043 46BW 29 4/8 31 1/8 13 3/8 13 5/8 19 1/8 14 5/8 9 87 5/8 151 7/86043 46BW 34 1/8 32 3/8 15 7/8 15 6/8 21 4/8 21 2/8 8 98 1/8 164 4/86051 01/27N 41 7/8 41 5/8 16 6/8 16 4/8 27 27 7 116 6/8 190 4/86052 06A/22N 36 2/8 36 1/8 15 4/8 15 7/8 21 19 7/8 9 103 6/8 182 5/86052 06A/22N 39 2/8 37 6/8 15 7/8 16 22 1/8 20 2/8 9 108 7/8 183 2/86053 06A/22N 35 6/8 35 4/8 14 5/8 14 5/8 18 4/8 17 6/8 8 100 4/8 175 4/86053 06A/22N 35 6/8 35 14 3/8 14 3/8 23 2/8 18 4/8 8 99 4/8 170 4/86054 23/24A 25 4/8 37 5/8 14 4/8 14 5/8 23 4/8 23 4/8 8 92 2/8 138 1/86055 27N 35 4/8 36 16 6/8 16 7/8 22 2/8 17 4/8 7 105 1/8 187 4/86055 27N 31 32 5/8 14 7/8 14 6/8 21 6/8 19 7 93 2/8 164 3/86055 27N 32 4/8 35 15 4/8 16 23 4/8 22 8 99 174 6056 27N 33 1/8 33 1/8 15 3/8 15 1/8 22 4/8 15 2/8 6 96 6/8 164 2/86056 27N 32 7/8 33 16 1/8 16 2/8 22 2/8 20 4/8 7 98 2/8 174 3/86057 27/28 33 7/8 33 2/8 15 6/8 15 4/8 22 4/8 20 4/8 4 98 3/8 162 3/86057 27/28 36 1/8 39 6/8 14 2/8 14 2/8 22 5/8 17 4/8 7 104 3/8 174 5/86057 27/28 33 2/8 37 4/8 14 7/8 14 7/8 21 3/8 20 7/8 5 100 4/8 171 2/86058 27/28 34 6/8 35 4/8 13 6/8 14 21 17 3/8 8 98 167 4/86058 27/28 33 32 3/8 15 1/8 15 3/8 18 7/8 15 1/8 6 95 7/8 162 1/8
Average 33 2/8 33 5/8 14 5/8 14 5/8 21 4/8 19 7/8 7 96 2/8 163Maximum 41 7/8 41 5/8 17 2/8 17 2/8 27 27 13 116 6/8 190 4/8Minimum 25 4/8 25 7/8 12 4/8 12 4/8 16 6/8 14 5/8 3 82 3/8 134 5/8
Successful Hunters and the Measurements of their Bighorn Sheep - 2016 Season (continued)
Successful Hunter Scores

Hunt Arizona 2017 135
Measurement Data
Bighorn Sheep Horn Measurements
YearArizona Score¹
Outside Curl Average Basal Circumference
Average B&C Green ScoreLargest Head Smallest Head Average Head
1953 102-1/8 56-2/8 85-2/8 29-1/8 13-4/8 –1954 97 65-5/8 83-5/8 28-4/8 13-2/8 –1955 93-6/8 66 84-6/8 28-2/8 14 –1956 93-4/8 65-2/8 80 27-3/8 12-5/8 –1957 82 60-2/8 73-5/8 24-6/8 12-1/8 –1958 102-6/8 74 86-3/8 29-3/8 13-7/8 –1959 100-2/8 63-4/8 84 28-4/8 13-4/8 –1960 100-2/8 68-4/8 86-6/8 29-4/8 13-7/8 –1961 110-5/8 63-2/8 84-1/8 28-5/8 13-3/8 –1962 101-2/8 63-6/8 83-7/8 28-3/8 13-4/8 –1963 105-4/8 60 82-2/8 27-6/8 13-3/8 –1964 102-2/8 72-4/8 88-3/8 30-1/8 14-1/8 –1965 113-1/8 71-4/8 89 30-1/8 14-3/8 –1966 108-6/8 74 91-2/8 31 14-5/8 –1967 104-5/8 76-2/8 91-4/8 31 14-6/8 –1968 103-5/8 68-2/8 89-1/8 30 14-4/8 –1969 106-2/8 71 89-2/8 30-2/8 14-3/8 –1970 104-6/8 76-2/8 89-5/8 30-4/8 14-2/8 –1971 103-6/8 70-2/8 87-3/8 29-3/8 14-2/8 –1972 106-2/8 72-1/8 89 30 14-4/8 147-4/81973 103-5/8 72-7/8 89-5/8 30-5/8 14-2/8 150-3/81974 111-2/8 68-3/8 91 31-1/8 14-3/8 152-2/81975 106-6/8 74-4/8 89 30-4/8 14 148-7/81976 104-4/8 74-7/8 91-6/8 31-2/8 14-5/8 154-6/81977 104-1/8 75 91-5/8 31-3/8 14-3/8 153-6/81978 108 74-3/8 92-3/8 31-4/8 14-5/8 155-7/81979 108-4/8 71-3/8 91-3/8 31-2/8 14-4/8 153-1/81980 105 82-1/8 92-4/8 31-5/8 14-4/8 153-3/81981 110-3/8 82-6/8 94-3/8 32-2/8 15 160-2/81982 114-4/8 81-4/8 92-4/8 31-6/8 14-4/8 154-5/81983 112-3/8 71-5/8 93-3/8 32 14-5/8 156-7/81984 111-5/8 79-3/8 94 32-3/8 14-5/8 159-1/81985 107-6/8 74-4/8 92-6/8 31-7/8 14-4/8 156-2/81986 110-2/8 80-7/8 94-4/8 32-4/8 14-6/8 160-2/81987 110 77 94-3/8 32-5/8 14-5/8 159-4/81988 117-2/8 51-2/8 93-1/8 32 14-4/8 157-2/81989 103-4/8 78-6/8 92-6/8 31-7/8 14-3/8 157-4/81990 113-2/8 58-4/8 93-5/8 32-1/8 14-5/8 157-7/81991 107-2/8 67-1/8 92-7/8 31-6/8 14-5/8 157-5/81992 108-6/8 65 92-4/8 31-7/8 14-3/8 155-3/81993 112-3/8 69-2/8 92-4/8 31-7/8 14-3/8 156-3/81994 110-2/8 77-3/8 94-2/8 32-5/8 14-4/8 159-6/81995 110-3/8 77-2/8 92-5/8 31-7/8 14-3/8 156-3/81996 114-4/8 66-6/8 93 32-1/8 14-4/8 156-6/81997 108-3/8 69-2/8 92-1/8 31-6/8 14-4/8 156-5/81998 112 61-1/8 91-4/8 31-4/8 14-4/8 155-7/81999 109 63-6/8 91-6/8 31-5/8 14-4/8 156-7/82000 110-4/8 65-6/8 92-6/8 31-7/8 14-4/8 157-1/82001 107-6/8 73-6/8 91-6/8 31-5/8 14-3/8 1552002 107-7/8 53-3/8 90-4/8 31-1/8 14-2/8 153-3/82003 108-6/8 66-7/8 89-3/8 30-5/8 14-2/8 151-6/82004 106-5/8 73-2/8 91-5/8 31-4/8 14-3/8 155-7/82005 104-3/8 69-2/8 90-6/8 31 14-2/8 152-3/82006 109-4/8 63 92-1/8 31-5/8 14-4/8 156-1/82007 113-5/8 74-3/8 93 32-1/8 14-3/8 156-5/82008 109-4/8 58-5/8 92-7/8 32 14-4/8 155-6/82009 116-2/8 64-1/8 92-3/8 31-5/8 14-5/8 156-7/82010 114-3/8 75-7/8 96 33-5/8 14-6/8 162-4/82011 106-2/8 58-5/8 93-4/8 33-5/8 32-4/8 1582012 111-5/8 57-5/8 94 32-3/8 14-5/8 159-4/82013 112-3/8 73-7/8 95-7/8 33-2/8 14-6/8 163-2/82014 108-7/8 74-1/8 97-3/8 33-1/8 14-7/8 1642015 114-3/8 62-3/8 94-6/8 32-5/8 14-5/8 1612016 116-6/8 82-3/8 96-2/8 33-3/8 14-5/8 163
¹ Arizona score = sums of the 2 bases and the 2 curls�

Hunt Application Data
2016 Bighorn Sheep Hunt Applications
Hunt No� Unit Permits
Authorized
First Choice Second Choice
Applicants % Drawn Applicants % Drawn
6001 09/10 1 90 0�0 50 2�06002 12A/12BW 1 54 1�9 58 0�06003 12BE 4 321 0�6 388 0�56004 13A 1 59 1�7 50 0�06005 13BN 3 478 0�4 336 0�36006 13BS 1 36 0�0 46 2�26007 15BW 3 164 0�6 253 0�86008 15CN 3 255 0�8 193 0�56009 15CS 2 161 0�6 296 0�36010 15D North 8 2125 0�3 1184 0�26011 15D South 4 359 0�6 939 0�26012 16A 3 154 0�6 250 0�86013 16B 1 42 2�4 54 0�06014 18B 1 38 2�6 44 0�06015 22 4 1868 0�2 669 0�06016 24B Superstition Wilderness 1 222 0�0 165 0�66017 24B North 1 156 0�0 290 0�36018 24B South 2 413 0�2 589 0�26019 28S 1 132 0�8 116 0�06020 31/32 2 551 0�4 348 0�06021 37A 2 654 0�3 414 0�06022 37B 1 124 0�0 170 0�66023 39 East 1 46 0�0 67 1�56024 39 West 2 221 0�5 187 0�56025 40A 2 116 1�7 103 0�06026 40B West Gila Mtns 2 134 0�7 141 0�76027 40B West Mohawk/Copper 3 166 1�2 315 0�36028 40B West Tinajas Altas 1 60 1�7 75 0�06029 41E 1 101 0�0 88 1�16030 41W 1 43 2�3 60 0�06031 42/44A South 2 240 0�8 148 0�06032 43A 1 79 1�3 64 0�06033 43B 7 682 0�9 563 0�26034 44A East 1 52 1�9 55 0�06035 44A West 1 58 0�0 75 1�36036 44B North 4 1108 0�3 595 0�26037 44B South 2 250 0�4 401 0�26038 45A 3 304 0�7 241 0�46039 45B 2 100 1�0 168 0�66040 45C 1 67 1�5 49 0�06041 46A East 2 84 1�2 151 0�76042 46A West 2 37 0�0 105 1�96043 46B East 4 156 1�3 222 0�96044 46B West 4 146 0�7 260 1�26051 01/27 1 166 0�6 122 0�06052 6A/22N 4 1439 0�3 717 0�06053 23/24A 1 156 0�0 184 0�56054 27 Lower Blue 2 139 1�4 285 0�06055 27 Upper Blue 5 531 0�8 710 0�16056 27S/28N 5 621 0�6 788 0�1
97 15758 0�5 13841 0�3

Hunt Arizona 2017 137
Natural HistoryAmerican bison, also known as buffalo, are are native wildlife in Arizona, occuring at the southwest edge of its original historic range. In Arizona, bison can be found at two wildlife areas managed by the Arizona Game and Fish Department: Raymond Ranch Wildlife Area located east of Flagstaff, and House Rock Wildlife Area in House Rock Valley east of the North Kaibab National Forest. Both wildlife areas are managed to provide both viewing and hunting opportunities.
Bison are the largest living member of the cow
family. Live adult weights range from 1,400 to 2,500 pounds for bulls and from 750 to 1,600 pounds for cows. Bulls have massive front quarters with a large hump above the shoulders covered with woolly hair up to 1.5 inches long that also covers the head and fore-legs. This hair turns tan with age and is two to five times thicker than the hair on the hindquarters. The bull’s head has a broad triangular appearance and possesses a beard or bell. Both bulls and cows pos-sess horns, but the male’s are much larger, attaining a length of up to 20 inches. Calves are reddish-tan at birth and change to brown or black in three months.
The senses of smell and hearing are acute, while the
Bison (Bison bison)
GEO
RGE
AN
DRE
JKO

138 Hunt Arizona 2017
bison’s eyesight is poor. Adult bison can run sprints of 35 mph for up to one-quarter mile and are capable of jumping over 6-foot-high fences. Bison are gregari-ous and often form large herds. Although the group composition of these herds changes constantly, the dominant animal is almost always a matriarchal cow. Adult bison eat approximately 35 pounds of forage per day, in general concentrating on the most abundant palatable forage, be it grasses, forbs, or browse. Bison may live as long as 28 years.
Breeding typically takes place from mid-July to early September. The bulls are polygamous, but do not main-tain harems in the usual sense. Most of the breeding is done by mature bulls of five to eight years old. A bull can lose up to 300 pounds during the rut. Gestation ranges from 270 to 285 days, and typically a single calf is born in the spring from late April through May.
Numerous state and federal agencies, as well as private ranchers, have been trying to develop repre-sentative herds of free-ranging bison. Their goal is to maintain bison populations that provide recreation-al hunting, scientific research, and aesthetic uses with minimal management efforts. In these areas, hunting and live-animal sales are necessary to remove excess animals and keep the habitat within carrying capacity.
Hunt HistoryPublic bison hunts have been held at House Rock Ranch since the 1920s. These bison, which were origi-nally brought to Arizona by Charles Jesse “Buffalo” Jones, were sold to the state by Uncle Jimmie Owens after their “cattalo” experiment proved unsuccessful. When the number of bison was judged excessive for
their Forest Ser-vice grazing lands in the mid-1940s, the Arizona Game and Fish Depart-ment moved some of them to the agency’s newly ac-quired Raymond Ranch. Other bi-son were moved to Fort Huachuca, which the De-partment acquired after World War
II. The tenure of these latter animals was short, how-ever, as they had to be disposed of when the Fort was reactivated in the 1950s. Some were sold and sent to the state of Chihuahua, Mexico, and the remainder were removed through a public hunt.
The herds at House Rock and Raymond Ranch wildlife areas remained, however, and the Department set out to manage these herds on a sustained basis. An economic profit proved elusive, however, as it was im-possible to sustain sufficient breeding stock without damaging the range. Moreover, the shooting of bison being driven out of a corral, while making econom-ic sense, became increasingly difficult to justify from a sociological perspective. As a result, both herds were drastically reduced in the early 1970s by hunters who had to take their animals in the field. The management of the bison herds is now more in line with the carrying capacity of their respective ranges, with between 20 and 40 bison being harvested each year.
Bison distribution

Hunt Arizona 2017 139
Bison Survey Data
Historic Summary of Bison Survey Data
Unit YearBulls Cows Unclassified
Calves Total Bulls/100 Cows¹
Calves/100 Cows¹Adults Yearlings Calves Adults Yearlings Calves
Statewide 19532 66 111 – 168 – – – 345 39 –19542 156 100 – 161 – – – 417 97 –19552 – – – – – – – – – –1956 37 86 53 103 – – – 279 34 5119573 12 21 29 60 38 29 – 189 20 9719583 38 28 25 69 27 25 – 212 55 8519593 20 69 33 77 74 32 – 305 26 9419603 36 18 25 85 19 25 – 208 42 591961 75 24 30 131 25 30 – 315 57 4619623 41 29 28 104 23 28 – 253 39 5419633 52 25 28 107 25 28 – 265 49 5219643 49 31 35 99 23 35 – 272 49 7119653 51 32 35 115 31 35 – 299 44 6119663 37 28 25 89 19 25 – 223 42 5619673 43 22 28 97 22 26 – 238 44 5619683 31 22 26 86 23 26 – 214 36 6019693 36 27 30 91 27 30 – 241 40 6619703 24 30 32 91 30 32 – 239 26 7019713 37 21 22 80 21 22 – 203 46 551972 47 30 30 108 30 30 – 275 44 5619733 44 55 57 167 52 57 – 432 26 681974 81 54 40 129 54 52 – 410 63 711975 92 53 18 97 53 18 – 331 95 371976 94 20 23 89 20 19 – 265 106 471977 72 26 23 63 31 23 – 238 114 731978 57 23 17 73 23 16 – 209 78 451979 40 24 22 39 10 21 – 156 103 110
From 1980 to present, data split by Wildlife Area
5B 1980 18 11 13 35 10 10 0 97 51 66Raymond 1981 24 13 13 31 10 12 0 103 77 81Wildlife Area 1982 20 13 10 29 12 7 0 91 69 59
1983 26 10 8 29 7 9 0 89 90 591984 16 8 15 34 10 10 0 93 47 741985 15 14 17 39 10 12 0 107 38 741986 12 16 15 37 12 15 0 107 32 811987 16 15 16 34 15 13 0 109 47 851988 16 16 14 37 13 17 0 113 43 841989 15 14 9 40 17 21 0 116 38 751990 10 9 14 42 21 17 0 113 24 741991 10 14 12 43 17 15 0 111 23 631992 14 12 14 43 15 16 0 114 33 701993 14 14 17 41 16 17 0 119 34 831994 12 17 17 39 17 14 0 116 31 791995 10 15 12 40 18 18 0 113 25 751996 11 0 18 43 0 13 0 85 26 721997 4 0 11 41 3 12 0 71 10 561998 3 8 14 43 12 12 0 92 7 601999 7 13 14 41 14 14 0 103 17 682000 5 14 9 37 14 13 0 92 14 592001 13 10 0 39 8 0 20 90 33 512002 18 12 0 40 9 0 21 100 45 532003 20 11 0 38 11 0 24 104 53 632004 10 10 0 32 9 0 14 75 31 442005 6 3 0 27 – 0 14 50 22 522006 5 8 0 24 – 0 14 51 21 582007 4 4 0 27 7 0 14 56 24 412008 4 0 – 19 4 – 12 39 21 632009 3 3 0 18 6 0 13 43 17 72
1 Based on adult animals only, yearlings excluded�2 Both sexes combined for yearlings and calves�3 Calf numbers are estimates�4 Surveys based on bison herds photographed and classified from the ground�

140 Hunt Arizona 2017
Bison Survey Data
Historic Summary of Bison Survey Data
Unit YearBulls Cows Unclassified
Calves Total Bulls/100 Cows¹
Calves/100 Cows¹Adults Yearlings Calves Adults Yearlings Calves
5B 2010 7 6 0 25 9 0 8 55 28 32Raymond 20114 38 14 0 45 13 0 22 132 84 49Wildlife Area 20124 37 9 0 78 11 0 29 164 47 37
20134 18 7 0 35 6 0 22 88 51 6320144 6 7 0 30 5 0 11 59 20 372015 No survey conducted2016 0 0 0 27 0 0 16 43 - 59
12 1980 14 11 10 45 11 15 0 106 31 56House Rock 1981 18 10 10 34 15 10 0 97 53 59Wildlife Area 1982 17 10 13 40 10 9 0 99 43 55
1983 19 13 11 49 9 13 0 114 39 491984 25 13 9 42 10 0 0 99 60 211985 18 9 0 46 9 0 26 108 39 571986 22 13 0 34 13 0 16 98 65 471987 41 10 0 40 10 0 27 128 103 681988 53 15 0 44 14 0 31 157 120 701989 40 12 0 53 23 0 30 158 75 571990 23 14 0 56 18 0 23 134 41 411991 14 11 0 53 10 0 30 118 26 571992 21 12 0 50 11 0 26 120 42 521993 23 13 0 44 9 0 21 110 52 481994 33 10 15 41 8 17 0 124 80 781995 34 15 14 40 17 14 0 134 85 701996 31 14 14 47 12 14 0 132 66 601997 31 12 0 47 12 0 21 123 66 451998 25 9 0 33 10 0 19 96 76 581999 29 9 9 38 9 9 0 103 76 472000 32 9 14 42 9 14 0 120 76 672001 No Survey Conducted2002 50 15 0 65 15 0 30 175 77 452003 45 15 0 80 15 0 40 195 56 502004 43 9 0 51 7 0 22 132 84 432005 41 21 0 70 11 0 43 185 57 612006 No Survey Conducted2007 No Survey Conducted2008 No Survey Conducted2009 24 7 0 36 7 0 14 88 67 392010 29 10 0 43 10 0 14 106 67 3320114 38 14 0 45 13 0 22 132 84 4920124 37 9 0 78 11 0 29 164 47 3720134 18 7 0 35 6 0 22 88 51 6320144 28 15 0 51 15 0 23 132 55 452015 32 19 27 56 - - 31 165 57 482016 43 17 21 85 21 17 0 204 51 49
1 Based on adult animals only, yearlings excluded�2 Both sexes combined for yearlings and calves�3 Calf numbers are estimates�4 Surveys based on bison herds photographed and classified from the ground�

Hunt Arizona 2017 141141 Hunt Arizona 2017
Bison Harvest Data
Historic Summary of Bison Hunts¹
Year1st ChoiceApplicants2
PermitsIssued Hunters Hunter
Days
HarvestCalves Total Percent
SuccessBulls CowsAdults Yearlings Adults Yearlings
1950 – – – – – – – – – 92 –1951 – – – – – – – – – 92 –1953 – – – – – – – – – 25 –1955 – – – – – – – – – 35 –1956 – – – – – – – – – 30 –1957 – – – – – – – – – 150 –1958 – – – – 28 19 18 20 0 85 –1959 – – – – 7 69 0 74 0 150 –1960 – – – – 26 8 18 8 0 60 –1961 – – – – 65 20 50 20 0 155 –1962 – – – – 29 20 32 15 0 96 –1963 – – – – 42 20 38 20 0 120 –1964 – – – – 39 28 42 21 0 130 –1965 – – – – 41 32 49 28 0 150 –1966 – – – – 28 28 30 14 0 100 –1967 – – – – 34 21 30 20 0 105 –1968 – – – – 21 20 14 20 0 75 –1969 – – – – 25 25 25 25 0 100 –1970 – – – – 12 25 18 25 0 80 –1971 – – – – 24 20 16 20 0 80 –1972 – – – – 32 30 33 30 0 125 –1973 – – – – 15 7 52 22 30 126 –1974 – – – – 9 35 52 34 0 130 –1975 – – – – 10 40 37 32 0 119 –1976 – – – – 7 18 34 16 0 75 –1977 – – – – 15 17 12 12 0 56 –1978 – – – – 26 18 5 9 0 58 –1979 – – – – 14 13 12 0 0 39 –1980 545 57 57 – 23 6 21 5 0 55 96�51981 329 46 46 – 17 10 19 0 0 46 100�01982 198 38 38 51 28 0 9 0 0 37 97�41983 202 43 43 97 17 7 14 2 0 40 93�01984 209 40 40 76 24 5 9 2 0 40 100�01985 238 59 54 119 5 15 22 6 0 48 88�91986 225 47 43 108 18 5 12 4 0 39 90�71987 217 41 39 69 2 17 3 13 0 35 89�71988 366 61 58 154 11 19 15 5 0 50 86�21989 449 85 82 251 25 20 8 15 0 68 82�91990 417 91 89 369 13 11 14 17 0 55 61�81991 414 50 50 127 5 13 17 12 0 47 94�01992 551 65 64 210 9 9 15 16 0 49 76�61993 680 65 65 233 10 12 8 16 0 46 70�81994 742 64 60 176 8 16 7 16 0 47 78�31995 1075 95 90 352 10 20 8 23 0 61 67�81996 1175 71 71 273 14 10 8 13 0 45 63�41997 1193 61 61 152 11 12 20 15 0 58 95�11998 1431 64 64 216 11 9 8 15 0 41 64�11999 1380 49 45 131 3 15 6 12 0 36 80�02000 1325 54 52 164 3 12 7 10 1 33 63�52001 1360 72 70 432 4 8 11 6 0 29 41�42002 3316 50 48 198 20 14 1 3 0 38 79�22003 5154 53 52 203 10 1 27 1 0 39 75�02004 7788 97 84 380 9 20 7 5 0 41 48�82005 3043 26 24 37 4 4 12 2 0 22 91�72006 2640 21 21 70 3 1 9 5 0 18 85�72007 1232 28 28 151 5 10 8 0 0 23 82�12008 868 29 27 93 11 10 2 4 0 26 96�22009 545 20 20 144 10 4 4 1 0 19 95�02010 640 23 23 226 6 6 2 1 0 15 65�22011 978 26 26 176 11 5 4 3 0 23 88�52012 1320 27 27 211 11 4 3 1 0 19 70�32013 2048 25 25 177 13 2 6 1 1 23 92�02014 2539 87 84 598 27 7 32 4 1 71 85�02015 2494 150 142 1719 21 10 24 3 0 58 41�02016 3349 165 154 1309 35 10 45 3 1 94 61�0

142 Hunt Arizona 2017 Hunt Arizona 2017 142
Bison Harvest Data
Population Management Season Results - Unit 12A
Year Season1 PermitsIssued Hunters Hunter
Days
HarvestCalves Total Percent
SuccessBulls CowsAdults Yearlings Adults Yearlings
2005 Companion 106 106 -- 3 0 1 0 0 4 3�82005 Standard 20 19 39 5 5 0 2 0 12 63�22006 Companion 28 28 -- 7 0 0 0 0 7 25�02006 Standard 25 24 52 4 1 1 3 0 9 37�52007 Companion 59 59 20 5 2 1 0 0 8 13�62007 Standard 8 7 10 0 0 3 1 0 4 57�12008 Companion 97 97 32 7 1 3 0 0 12 12�42008 Standard 16 12 16 0 3 7 0 0 10 83�32009 Companion 70 11 52 0 0 6 5 0 11 15�72009 Standard 14 14 16 1 2 10 1 0 14 100�02010 Companion 100 10 44 1 1 7 1 0 10 10�02010 Standard No hunts offered2011 Companion 66 12 44 1 3 6 2 0 12 18�22011 Standard No hunts offered2012 Companion 93 4 22 1 0 2 0 0 4 NA2012 Standard 6 6 4 0 0 0 0 4 66�72013 Companion 106 12 45 9 0 3 0 0 12 NA2013 Standard 10 10 25 9 0 0 0 0 9 90�0
2014 No hunts offered 2015 No hunts offered 2016 No hunts offered
5-Year: 2012-2016 Harvest
1 Designates the type of Population Management Season offered� “Companion” denotes tags issued to hunters with corresponding Kaibab deer hunts� “Standard” denotes seasons authorized through the typical Population Management Season process�
Yrl = Yearling, CY = Cow or Yearling, Any = Any Bison, SP = Special raffle/auction permit�
Unit Year Season Dates PermitsAuthorized
1st ChoiceApplicants
2nd ChoiceApplicants
DrawOdds
PermitsIssued Hunters Hunter
DaysBull
HarvestCow
HarvestTotal
HarvestHunt
Success
5B 2013 Bull 10/04 - 10/06 0 0 0 - 2 2 2 2 0 2 1005B 2014 Bull 9/26 - 9/28 1 792 67 0�1 1 1 1 1 0 1 1005B 2014 Bull 2/10 - 2/12 2 400 110 0�5 2 2 2 2 0 2 1005B 2016 Bull 1/29 - 2/18 2 466 109 0�4 2 2 2 2 0 2 1005B 2012 Cow 1/13 - 1/15 0 0 0 - 2 2 4 3 3 6 3005B 2013 Cow 9/06 - 9/08 0 0 0 - 2 2 3 0 2 2 1005B 2013 Cow 11/08 – 11/10 0 0 0 - 2 2 3 2 4 6 3005B 2014 Cow 9/26 - 9/28 2 188 375 0�0 2 2 2 0 2 2 1005B 2014 Cow 11/07 - 11/09 2 156 225 0�0 2 2 2 0 2 2 1005B 2016 Cow 1/08 - 1/28 5 149 207 2�0 5 5 5 0 5 5 1005B 2016 Cow 9/09 - 9/15 3 283 60 1�1 3 3 3 0 3 3 1005B 2016 Cow 9/23 - 9/29 3 110 280 0�9 3 3 3 0 3 3 1005B 2016 Cow 10/07 - 10/13 3 135 95 2�2 3 3 3 0 3 3 1005B 2016 Cow 10/21 - 10/27 3 93 126 1�1 3 3 3 0 3 3 1005B 2016 Cow 11/04 - 11/10 3 166 95 1�8 3 3 3 0 3 3 1005B 2016 CY 11/18 - 11/24 2 87 146 2�3 2 2 2 0 2 2 1005B 2016 CY 12/02 - 12/08 2 116 83 1�7 2 2 2 0 2 2 1005B 2012 Yrl 10/05 - 10/07 0 0 0 - 2 2 0 0 0 0 05B 2012 Yrl 11/09 - 11/11 0 0 0 - 2 2 6 1 0 1 505B 2012 Yrl 2/03 - 2/05 0 0 0 - 2 2 4 0 1 1 505B 2012 Yrl 3/02 - 3/04 0 0 0 - 2 2 2 2 0 2 1005B 2013 Yrl 2/08 - 2/10 0 0 0 - 2 2 2 0 1 2 1005B 2013 Yrl 3/08 - 3/10 0 0 0 - 2 2 2 2 1 4 2005B 2014 Yrl 2/07 - 2/09 2 160 162 1�3 2 2 2 4 0 4 2005B 2014 Yrl 3/07 - 3/09 2 92 196 1�1 2 2 2 3 1 4 2005B 2015 Yrl 1/09 - 1/11 2 209 62 1�0 2 2 2 2 0 2 1005B 2015 Yrl 1/30 - 2/01 2 73 207 0�0 2 2 4 2 0 2 1005B 2015 Yrl 2/20 - 2/22 2 94 147 2�1 2 2 2 0 2 2 1005B 2015 Yrl 3/13 - 3/15 2 145 101 1�4 2 2 2 0 2 2 1005B 2016 Yrl 1/29 - 2/18 3 70 72 2�9 3 3 3 2 1 3 1005B 2016 Yrl 2/19 - 3/10 3 30 95 10�0 3 3 3 3 0 3 1005B 2016 Yrl 3/11 - 3/31 4 96 100 2�1 5 5 6 4 1 5 1005B 2016 Yrl 4/01 - 4/21 3 41 64 4�9 3 3 3 0 0 1 335B 2016 Any 2/19 - 3/10 2 17 25 5�9 2 2 2 2 0 2 10012A 2015 Cow 9/25 - 10/08 8 66 36 9�1 8 8 57 0 5 5 63

Hunt Arizona 2017 143
Bison Harvest Data
5-Year: 2012-2016 Harvest
Unit Year Season Dates PermitsAuthorized
1st ChoiceApplicants
2nd ChoiceApplicants
DrawOdds
PermitsIssued Hunters Hunter
DaysBull
HarvestCow
HarvestTotal
HarvestHunt
Success
12A 2015 Cow 10/09 - 10/22 8 13 40 38�5 8 8 70 1 2 3 3812A 2015 Cow 10/23 - 11/05 8 17 20 23�5 8 8 62 0 0 0 012A 2015 Cow 11/06 - 11/19 10 53 46 15�1 10 10 113 0 0 0 012A 2015 Cow 11/20 - 12/31 10 49 54 18�4 10 8 93 0 0 0 012A 2015 Cow 9/11 - 12/03 8 28 40 14�3 8 7 84 0 1 1 1412A 2015 Cow 9/11 - 9/24 8 9 29 11�1 8 7 53 0 4 4 5712A 2015 Cow 8/14 - 8/27 8 12 14 25�0 8 8 43 1 6 7 8812A 2015 Cow 8/28 - 9/10 8 6 8 66�7 8 7 79 0 0 0 012A 2016 Cow 7/15 - 7/28 8 8 27 37�5 8 7 42 0 7 7 10012A 2016 Cow 7/29 - 8/11 8 8 20 62�5 8 8 88 0 1 1 1312A 2016 Cow 9/23 - 10/06 8 38 25 10�5 8 7 86 1 0 1 1412A 2016 Cow 10/07 - 10/20 8 18 33 38�9 8 8 84 1 2 3 3812A 2016 Cow 10/21 - 11/03 8 10 25 20�0 8 8 78 0 0 0 012A 2016 Cow 11/04 - 12/31 8 27 35 22�2 8 6 61 0 2 2 3312A 2016 Cow 9/09 - 9/22 8 16 21 25�0 8 7 76 0 0 0 012A 2016 Cow 8/12 - 8/25 8 17 18 35�3 8 8 53 0 4 4 5012A 2016 Cow 8/26 - 9/08 8 8 20 50�0 8 6 59 0 2 2 3312A 2014 CY 9/12 - 9/25 7 69 31 7�3 7 7 38 0 6 6 8612A 2014 CY 9/26 - 10/09 7 18 60 11�1 7 7 57 0 2 3 4312A 2014 CY 10/10 - 10/23 7 19 25 31�6 7 7 26 2 5 7 10012A 2014 CY 10/24 - 11/06 7 8 21 50�0 7 6 19 1 5 6 10012A 2014 CY 11/07 - 11/20 7 20 30 35�0 7 7 54 0 6 6 8612A 2014 CY 11/21 - 12/04 7 31 22 12�9 7 5 19 0 3 3 6012A 2014 CY 8/15 - 8/28 7 34 13 14�7 7 7 60 0 2 2 2912A 2014 CY 8/29 - 9/11 7 10 33 0�0 7 7 34 1 5 6 8612A 2015 CY 7/03 - 7/16 7 31 48 12�9 7 6 56 1 0 1 1712A 2015 CY 7/17 - 7/30 7 4 27 25�0 7 7 64 2 3 5 7112A 2015 CY 7/31 - 8/13 7 9 18 44�4 7 6 54 0 0 0 012A 2012 Any 1/1 - 6/14 0 0 0 - 14 14 195 10 1 11 7912A 2013 Any 1/1 - 6/14 0 0 0 - 14 14 151 10 2 12 8612A 2014 Any 1/01 - 6/14 20 542 122 3�5 20 20 280 20 0 20 10012A 2015 Any 7/19 - 7/19 1 0 0 - 1 1 25 1 0 1 10012A 2015 Any 9/25 - 10/08 2 356 79 0�6 2 2 16 1 0 1 5012A 2015 Any 10/09 - 10/22 2 86 249 0�0 2 2 15 1 0 1 5012A 2015 Any 10/23 - 11/08 2 105 95 0�0 2 2 25 1 1 2 10012A 2015 Any 9/11 - 12/03 2 180 96 1�1 2 2 43 0 0 0 012A 2015 Any 9/11 - 9/24 2 90 55 2�2 2 1 6 1 0 1 10012A 2015 Any 8/14 - 8/27 2 103 25 1�9 2 2 18 1 0 1 5012A 2015 Any 8/28 - 9/10 2 17 59 5�9 2 2 19 1 1 2 10012A 2015 Any 1/01 - 5/31 30 739 41 4�1 30 30 714 15 0 15 5012A 2016 Any 1/01 - 6/30 30 518 90 5�2 33 32 502 20 4 24 7512A 2016 Any 7/15 - 7/28 2 60 99 3�3 2 2 13 1 0 1 5012A 2016 Any 7/29 - 8/11 2 16 42 0�0 2 2 21 2 0 2 10012A 2016 Any 9/23 - 10/06 2 235 68 0�9 2 2 24 2 0 2 10012A 2016 Any 10/07 - 10/20 2 70 164 0�0 2 0 0 0 0 0 -12A 2016 Any 10/21 - 11/03 2 52 76 1�9 2 2 28 0 0 0 012A 2016 Any 11/04 - 12/31 2 152 72 1�3 2 1 8 1 0 1 10012A 2016 Any 9/09 - 9/22 2 84 32 2�4 2 2 11 2 0 2 10012A 2016 Any 8/12 - 8/25 2 122 28 0�8 2 2 11 1 0 1 5012A 2016 Any 8/26 - 9/08 2 31 71 0�0 2 2 21 1 0 1 5012A 2013 SP - 0 0 0 - 3 1 1 2 0 2 200TOTAL - SUMMARY FOR RAYMOND WILDLIFE AREA5B 2012 - 0 0 0 - 10 10 16 6 4 10 1005B 2013 - 0 0 0 - 10 10 12 6 8 16 1605B 2014 - 11 1788 1135 �3 11 11 11 10 5 15 1365B 2015 - 8 521 517 1�2 8 8 10 4 4 8 1005B 2016 - 41 1859 1557 1�6 42 42 43 13 26 40 95TOTAL SUMMARY FOR HOUSE ROCK WILDLIFE AREA ( INCLUDES POPULATION MANAGEMENT SEASON AND SPECIAL TAG SEASON DATA)12A 2012 - 0 0 0 - 14 14 195 10 1 11 7912A 2013 - 0 0 0 - 17 15 152 12 2 14 9312A 2014 - 76 751 357 6�9 76 73 587 24 34 59 8112A 2015 - 142 1973 1079 4�7 142 134 1709 27 23 50 3712A 2016 - 120 1490 966 5�2 123 112 1266 32 22 54 48

144 Hunt Arizona 2017
Natural HistoryBlack bears in Arizona are found in a variety of habi-tats, including subalpine and montane conifer forests, riparian forests, evergreen woodlands, and chaparral. An interesting footnote to black bear distribution in the state is the absence of any sizeable population of black bears north of the Colorado River.
Cubs are born in winter dens during January, usu-ally in pairs, but larger litters are not uncommon. Cubs weigh only 6 to 12 ounces at birth and are helpless, but they grow and develop rapidly, emerging from the den with their mother in April. The mother stays with her cubs through the first summer and fall, and dens with them again the following winter. Female black bears in Arizona usually reach reproductive age in their fourth
year, and generally breed every other year. Nor-mal reproductive cycles in Arizona black bears may be adversely affected by drought, and/or poor physi-ological condition. Adult males weigh up to 350 pounds and adult females up to 250 pounds. Black bears are relatively long-lived animals, with some individuals exceeding 20 years of age.
Black bears are normal-ly shy, secretive animals displaying high levels of in-telligence and exploratory behavior. Although bears are generally most active in the early morning and late evening, they may al-ter their activity pattern to exploit sources of artificial food, becoming nocturnal at campgrounds and dump-sites. Nuisance activities are nearly always associated with artificial food sourc-es (beehives, campgrounds, and livestock).
Bears are usually solitary animals; the exceptions are family groups (mother and cubs), breeding pairs, and congregations at feeding
Black Bear (Ursus americanus)
BOB
MIL
ES
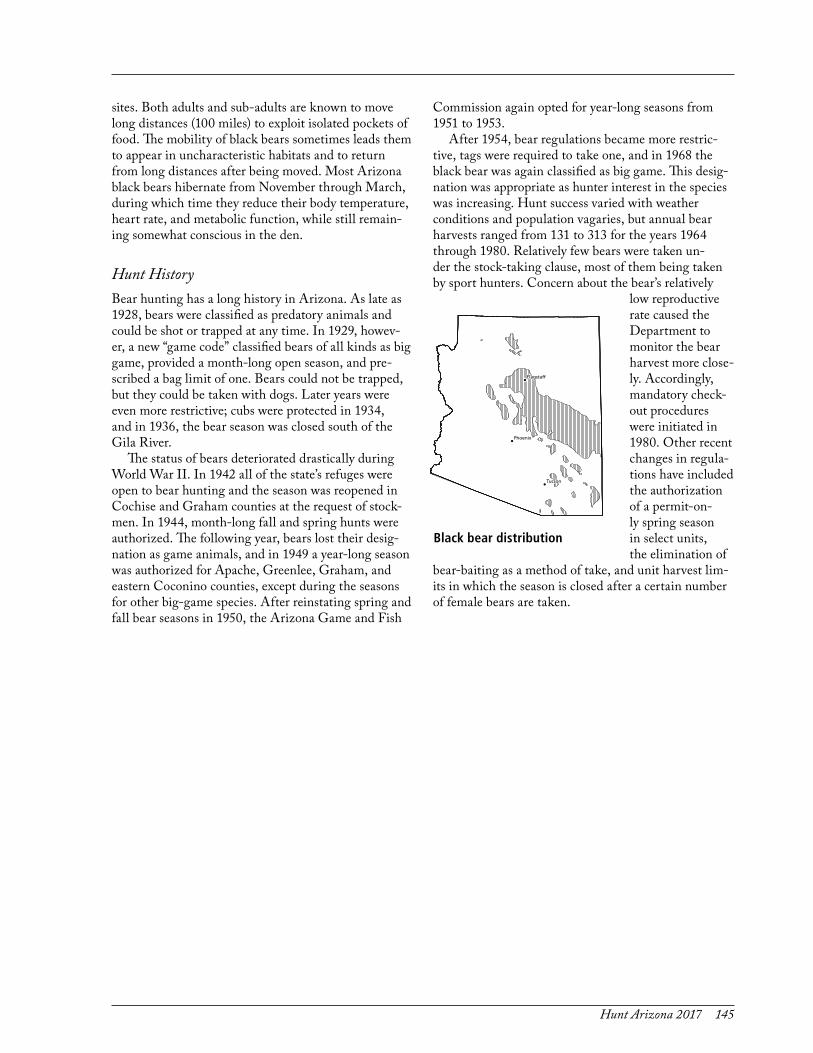
Hunt Arizona 2017 145
sites. Both adults and sub-adults are known to move long distances (100 miles) to exploit isolated pockets of food. The mobility of black bears sometimes leads them to appear in uncharacteristic habitats and to return from long distances after being moved. Most Arizona black bears hibernate from November through March, during which time they reduce their body temperature, heart rate, and metabolic function, while still remain-ing somewhat conscious in the den.
Hunt HistoryBear hunting has a long history in Arizona. As late as 1928, bears were classified as predatory animals and could be shot or trapped at any time. In 1929, howev-er, a new “game code” classified bears of all kinds as big game, provided a month-long open season, and pre-scribed a bag limit of one. Bears could not be trapped, but they could be taken with dogs. Later years were even more restrictive; cubs were protected in 1934, and in 1936, the bear season was closed south of the Gila River.
The status of bears deteriorated drastically during World War II. In 1942 all of the state’s refuges were open to bear hunting and the season was reopened in Cochise and Graham counties at the request of stock-men. In 1944, month-long fall and spring hunts were authorized. The following year, bears lost their desig-nation as game animals, and in 1949 a year-long season was authorized for Apache, Greenlee, Graham, and eastern Coconino counties, except during the seasons for other big-game species. After reinstating spring and fall bear seasons in 1950, the Arizona Game and Fish
Commission again opted for year-long seasons from 1951 to 1953.
After 1954, bear regulations became more restric-tive, tags were required to take one, and in 1968 the black bear was again classified as big game. This desig-nation was appropriate as hunter interest in the species was increasing. Hunt success varied with weather conditions and population vagaries, but annual bear harvests ranged from 131 to 313 for the years 1964 through 1980. Relatively few bears were taken un-der the stock-taking clause, most of them being taken by sport hunters. Concern about the bear’s relatively
low reproductive rate caused the Department to monitor the bear harvest more close-ly. Accordingly, mandatory check-out procedures were initiated in 1980. Other recent changes in regula-tions have included the authorization of a permit-on-ly spring season in select units, the elimination of
bear-baiting as a method of take, and unit harvest lim-its in which the season is closed after a certain number of female bears are taken.
Black bear distribution

146 Hunt Arizona 2017
Black Bear Hunt Data
Historic Summary of Black Bear Hunt DataHarvest
Year Tags Issued Hunter2 Depredation Other3 Total Harvest1964 6638 178 0 0 1781965 5974 131 0 0 1311966 5798 134 0 0 1341967 6344 219 0 0 2191968 8264 242 0 0 2421969 8978 268 0 0 2681970 8454 236 0 0 2361971 8042 241 33 0 2741972 6009 187 17 0 2041973 7162 225 2 0 2271974 6839 202 12 0 2141975 6746 224 9 0 2331976 7055 265 10 0 2751977 8707 309 4 0 3131978 8985 264 6 0 2701979 8833 251 2 0 2531980 7820 255 2 0 2571981 8494 287 5 0 2921982 7178 260 8 0 2681983 6183 273 1 0 2741984 5258 246 5 0 2511985 4917 251 6 0 2571986 4816 182 7 0 1891987 5117 302 9 0 3111988 4272 146 7 2 1551989 4714 271 18 3 2921990 3711 149 11 1 1611991 2843 96 4 1 1011992 3217 121 1 0 1221993 3329 117 1 3 1211994 4376 236 2 14 2521995 4586 197 1 0 1981996 4462 254 5 19 2781997 4093 224 2 6 2321998 4461 142 0 13 1551999 4163 181 0 5 1862000 4413 320 2 46 3682001 4293 178 6 6 1842002 4535 230 1 16 2522003 4525 214 5 34 2492004 4521 160 5 11 1762005 4850 158 0 2 1602006 4840 197 1 40 2382007 6110 217 2 19 2382008 5925 179 1 13 1932009 5371 239 1 26 2662010 5266 235 2 17 2542011 2099 291 4 27 3222012 5347 301 4 37 3422013 5463 226 3 20 2492014 5371 221 2 25 2482015 4902 240 0 14 2542016 4994 274 0 24 298
1 Data from Indian Reservations are included through 1987 and excluded thereafter�2 Estimated from a mail questionnaire from 1964-1987 and from mandatory check-outs from 1988-present�3 Includes known kills other than hunter harvest or depredation (e�g�, highway mortality, capture mortality, and
illegal take)�

Hunt Arizona 2017 147
Black Bear Harvest Data
5-Year: 2012-2016 Black Bear Harvest Data¹
1 Excluding data from Indian Reservations�2 For Archery-Only Spring Bear hunts ending in August or September, bear harvest occurring in August or September will be reflected in the appropriate month of harvest column� All other spring harvest will be reflected in the Spring column�
Unit Year
HarvestHunter Harv�Using Dogs
Sex of Hunter Harv� Month of Hunter Harvest Fem�Med�Age Hunter Depredation Other Male Female Spring2 Aug� Sept� Oct� Nov� Dec� Unk�
1 2012 26 0 1 19 22 4 0 11 4 9 1 0 0 41 2013 19 0 4 11 12 7 0 14 1 3 1 0 0 41 2014 20 0 0 16 11 9 0 13 2 4 1 0 0 91 2015 16 0 1 13 9 7 0 14 0 2 0 0 0 61 2016 24 0 3 21 10 14 0 15 1 8 0 0 0 42B 2016 0 0 1 - - - - - - - - - - -3B 2012 10 0 5 4 8 2 1 3 1 4 0 1 0 143B 2013 1 0 2 1 0 1 0 0 1 0 0 0 0 43B 2014 5 0 3 5 3 2 0 1 1 3 0 0 0 43B 2015 1 0 3 0 1 0 0 1 0 0 0 0 0 -3B 2016 9 0 3 7 6 3 0 5 1 3 0 0 0 2�53C 2012 6 0 4 2 3 3 2 0 2 2 0 0 0 33C 2013 4 0 2 0 2 2 1 1 0 1 1 0 0 53C 2014 3 1 5 1 0 3 0 1 1 1 0 0 0 33C 2016 3 0 3 0 1 2 0 0 1 2 0 0 0 14A 2012 0 0 2 - - - - - - - - - - -4A 2013 5 0 0 5 3 2 0 0 0 0 5 0 0 14A 2014 3 0 0 2 1 2 0 0 0 0 2 1 0 54A 2016 4 0 0 2 0 4 0 0 0 1 3 0 0 34B 2012 4 0 1 3 2 2 0 0 2 2 0 0 0 124B 2013 2 0 0 1 2 0 0 0 0 1 1 0 0 -4B 2014 1 0 2 1 0 1 0 0 1 0 0 0 0 64B 2015 3 0 0 2 0 3 0 1 1 1 0 0 0 54B 2016 1 0 0 0 0 1 0 0 0 0 0 1 0 -5A 2012 11 0 0 9 9 2 0 1 0 0 10 0 0 55A 2013 10 0 1 9 7 3 0 0 0 0 10 0 0 35A 2014 2 0 0 0 1 1 0 0 0 1 1 0 0 25A 2015 3 0 0 1 2 1 0 0 0 0 3 0 0 65A 2016 7 0 1 5 4 3 0 0 0 6 1 0 0 35B 2012 8 0 0 4 5 3 0 0 0 7 0 0 0 55B 2013 3 0 0 3 0 3 0 0 0 3 0 0 0 65B 2014 8 0 2 7 6 2 0 0 0 5 3 0 0 35B 2015 3 0 0 3 1 2 0 0 0 3 0 0 0 85B 2016 12 0 0 10 10 1 1 0 0 10 1 0 0 106A 2012 15 0 2 5 9 6 0 7 0 8 0 0 0 10�56A 2013 11 0 0 1 4 7 0 7 0 4 0 0 0 46A 2014 17 0 0 1 12 5 0 7 3 6 1 0 0 56A 2015 12 0 0 3 7 5 0 3 0 5 4 0 0 36A 2016 12 0 0 2 8 4 1 5 0 6 0 0 0 56B 2012 5 0 0 1 2 3 0 5 0 0 0 0 0 26B 2013 8 0 0 0 5 3 0 8 0 0 0 0 0 56B 2014 5 0 1 0 3 2 0 5 0 0 0 0 0 36B 2015 5 0 0 2 1 4 0 5 0 0 0 0 0 56B 2016 6 0 0 0 2 4 0 6 0 0 0 0 0 27 2012 5 0 1 3 2 3 0 0 0 5 0 0 0 57 2013 8 1 0 4 6 2 0 2 0 6 0 0 0 37 2014 7 0 1 2 4 3 0 0 0 5 2 0 0 187 2015 6 0 1 2 4 2 0 0 0 3 2 1 0 67 2016 6 0 1 3 3 3 0 0 2 4 0 0 0 18 2013 14 0 0 2 12 2 0 0 0 14 0 0 0 10�58 2014 12 0 1 6 9 3 1 0 0 9 1 1 0 78 2015 13 0 1 3 9 4 0 0 1 12 0 0 0 88 2016 13 0 0 4 7 6 0 0 2 11 0 0 0 49 2012 1 0 0 1 0 1 0 0 0 1 0 0 0 159 2014 1 0 0 0 0 1 0 0 0 0 1 0 0 79 2016 1 0 0 1 0 1 0 0 0 0 0 1 0 610 2016 1 0 0 0 1 0 0 0 0 0 1 0 0 -11M 2012 1 0 2 1 0 1 0 1 0 0 0 0 0 3

148 Hunt Arizona 2017
Black Bear Harvest Data
5-Year: 2012-2016 Black Bear Harvest Data¹
Unit Year
HarvestHunter Harv�Using Dogs
Sex of Hunter Harv� Month of Hunter Harvest Fem�Med�Age Hunter Depredation Other Male Female Spring2 Aug� Sept� Oct� Nov� Dec� Unk�
11M 2013 1 0 0 0 0 1 0 1 0 0 0 0 0 211M 2014 1 0 0 0 0 1 0 1 0 0 0 0 0 1511M 2016 1 0 0 0 1 0 1 0 0 0 0 0 0 -13B 2015 0 0 1 - - - - - - - - - - -17A 2012 1 0 0 0 1 0 0 0 0 1 0 0 0 -17B 2013 1 0 0 1 0 1 0 1 0 0 0 0 0 417B 2014 2 0 0 0 1 1 0 0 0 2 0 0 0 -17B 2016 1 0 0 1 1 0 0 0 1 0 0 0 0 -18A 2014 0 0 1 - - - - - - - - - - -18B 2012 3 0 0 3 1 2 0 1 1 1 0 0 0 11�518B 2013 4 0 0 4 3 1 1 0 1 2 0 0 0 518B 2014 0 0 1 - - - - - - - - - - -18B 2015 0 0 1 - - - - - - - - - - -18B 2016 1 0 0 0 1 0 0 0 0 0 1 0 0 -19A 2012 3 0 0 1 2 1 0 0 1 1 1 0 0 719A 2013 4 0 1 0 1 3 0 2 0 2 0 0 0 6�519A 2014 4 0 0 2 1 3 0 0 1 3 0 0 0 319A 2015 5 0 0 2 1 4 0 1 0 4 0 0 0 919A 2016 8 0 0 0 3 5 2 1 1 4 0 0 0 3�520A 2012 2 0 0 1 2 0 0 0 1 1 0 0 0 -20A 2013 2 0 0 1 2 0 0 0 0 2 0 0 0 -20A 2014 1 0 0 0 1 0 0 0 0 1 0 0 0 -20A 2015 3 0 0 1 1 2 0 2 0 0 1 0 0 220A 2016 2 0 1 1 2 0 0 0 0 1 1 0 0 -20B 2013 0 0 1 - - - - - - - - - - -20B 2015 0 0 1 - - - - - - - - - - -21 2012 6 0 0 0 4 2 0 0 0 6 0 0 0 821 2013 4 0 0 0 3 1 0 0 0 3 1 0 0 1421 2014 4 0 0 0 2 2 0 0 0 3 1 0 0 4�521 2015 10 0 0 0 6 4 0 0 0 10 0 0 0 421 2016 6 0 0 0 4 2 0 0 1 4 1 0 0 7�522N 2012 15 0 4 4 13 2 1 4 1 6 3 0 0 422N 2013 7 0 0 4 5 2 0 0 0 6 1 0 0 1022N 2014 10 0 0 4 7 3 1 1 2 4 0 2 0 722N 2015 15 0 0 7 11 4 3 2 0 9 1 0 0 622N 2016 20 0 2 4 10 10 3 3 0 14 0 0 0 822S 2012 14 0 0 0 9 5 1 9 1 3 0 0 0 13�522S 2013 4 0 2 0 0 4 1 3 0 0 0 0 0 5�522S 2014 6 0 1 0 4 2 1 3 0 2 0 0 0 222S 2015 7 0 1 0 4 3 0 5 1 1 0 0 0 322S 2016 4 0 0 0 3 1 1 2 0 1 0 0 0 423 2015 1 0 0 0 1 0 1 0 0 0 0 0 0 -23 2016 4 0 2 1 4 0 1 2 0 1 0 0 0 -23N 2012 15 0 0 9 6 9 1 3 0 11 0 0 0 823N 2013 16 0 0 9 10 6 1 3 2 10 0 0 0 723N 2014 24 0 2 11 16 8 3 7 1 11 2 0 0 6�523N 2015 16 0 1 12 9 7 1 4 1 7 3 0 0 623N 2016 13 0 1 4 5 8 0 2 2 9 0 0 0 723S 2012 24 0 0 1 12 12 0 24 0 0 0 0 0 1123S 2013 20 0 0 1 14 6 0 11 6 2 1 0 0 3�523S 2014 20 0 0 1 9 11 0 20 0 0 0 0 0 623S 2015 27 0 0 4 16 11 0 25 2 0 0 0 0 323S 2016 24 0 0 5 13 11 0 14 2 8 0 0 0 524A 2012 17 0 2 0 10 7 2 11 0 4 0 0 0 424A 2013 7 0 2 0 7 0 1 1 2 2 0 1 0 -24A 2014 10 0 3 0 4 5 1 7 0 2 0 0 0 824A 2015 8 0 0 0 5 3 3 3 0 1 1 0 0 324A 2016 10 0 0 1 4 6 0 8 1 1 0 0 0 5
1 Excluding data from Indian Reservations�2 For Archery-Only Spring Bear hunts ending in August or September, bear harvest occurring in August or September will be reflected in the appropriate month of harvest column� All other spring harvest will be reflected in the Spring column�

Hunt Arizona 2017 149
Black Bear Harvest Data
5-Year: 2012-2016 Black Bear Harvest Data¹
Unit Year
HarvestHunter Harv�Using Dogs
Sex of Hunter Harv� Month of Hunter Harvest Fem�Med�Age Hunter Depredation Other Male Female Spring2 Aug� Sept� Oct� Nov� Dec� Unk�
24B 2012 2 0 0 0 1 1 0 2 0 0 0 0 0 424B 2013 0 0 1 - - - - - - - - - - 2024B 2014 1 0 0 0 0 1 0 1 0 0 0 0 0 724B 2016 2 0 1 0 2 0 0 0 0 1 0 1 0 1627 2012 45 1 2 5 26 19 1 4 9 30 0 0 0 6�527 2013 21 0 1 5 14 7 0 5 1 9 4 2 0 5�527 2014 19 0 0 5 11 8 1 7 0 9 2 0 0 1227 2015 34 0 1 7 21 13 0 11 1 18 4 0 0 627 2016 42 0 2 12 27 15 3 8 5 22 4 0 0 628 2012 3 0 0 0 3 0 0 0 0 2 1 0 0 -28 2013 1 0 0 0 0 1 0 0 0 1 0 0 0 328 2015 1 0 0 0 0 1 0 0 0 1 0 0 0 -28 2016 4 0 0 0 3 1 1 0 1 2 0 0 0 229 2012 6 0 3 2 3 3 0 0 0 6 0 0 0 1229 2013 18 0 1 7 7 11 0 1 1 16 0 0 0 14�529 2014 7 0 0 0 3 4 0 1 0 5 1 0 0 6�529 2015 14 0 2 4 6 8 0 1 1 12 0 0 0 1329 2016 5 0 0 1 3 2 0 0 1 4 0 0 0 7�530A 2012 5 0 2 0 2 3 0 0 0 5 0 0 0 430A 2013 1 0 0 0 0 1 1 0 0 0 0 0 0 1630A 2014 1 0 0 0 0 1 0 0 0 1 0 0 0 1230A 2015 3 0 0 0 0 3 1 0 0 2 0 0 0 630A 2016 6 0 0 0 5 1 0 0 0 5 1 0 0 -30B 2016 0 0 1 - - - - - - - - - - -31 2012 7 0 1 0 4 3 0 0 0 7 0 0 0 531 2013 7 0 0 0 3 4 0 0 0 7 0 0 0 331 2014 8 1 1 0 4 4 0 0 0 8 0 0 0 831 2015 11 0 0 0 5 6 0 0 0 11 0 0 0 731 2016 4 0 0 0 3 1 1 0 1 2 0 0 0 -32 2012 11 3 0 1 8 3 0 1 0 9 1 0 0 432 2013 7 2 0 0 5 2 1 1 1 1 3 0 0 1332 2014 8 0 0 0 6 2 0 2 1 4 1 0 0 9�532 2015 7 0 0 0 5 2 1 1 0 4 0 1 0 6�532 2016 4 0 0 0 3 0 1 0 1 2 0 0 0 -33 2012 1 0 2 0 1 0 1 0 0 0 0 0 0 -33 2013 1 0 0 0 1 0 1 0 0 0 0 0 0 -33 2016 6 0 0 0 3 3 3 0 0 3 0 0 0 334A 2012 11 0 0 0 9 2 4 3 4 0 0 0 0 334A 2013 8 0 1 2 6 2 2 2 2 1 0 0 0 1434A 2014 7 0 0 0 4 3 6 0 1 0 0 0 0 1034A 2015 7 0 0 2 5 2 4 3 0 0 0 0 0 934A 2016 5 0 0 0 3 2 2 2 0 0 1 0 0 1235A 2012 5 0 3 0 1 4 5 0 0 0 0 0 0 535A 2013 5 0 0 0 1 4 4 1 0 0 0 0 0 935A 2014 4 0 0 0 1 3 3 1 0 0 0 0 0 1335A 2015 9 0 0 1 3 6 6 2 1 0 0 0 0 1035A 2016 3 0 2 0 3 0 2 1 0 0 0 0 0 335B 2012 1 0 0 0 1 0 1 0 0 0 0 0 0 -35B 2013 2 0 0 0 1 1 0 0 2 0 0 0 0 1135B 2014 0 0 1 - - - - - - - - - - -36C 2012 1 0 0 1 0 1 0 0 0 0 1 0 0 -41W 2016 0 0 0 - - - - - - - - - - -Total 2012 301 4 37 81 189 112 20 90 27 142 18 1 0Total 2013 226 3 20 71 136 90 14 64 20 96 28 3 0Total 2014 221 2 25 64 124 96 17 78 14 89 19 4 0Total 2015 240 0 14 69 133 107 20 84 9 - 19 2 0Total 2016 274 0 24 85 158 114 23 74 24 135 15 3 0Percent 2012 27 63 37 7 30 9 47 6 0Percent 2013 31 60 40 6 28 9 42 12 1Percent 2014 29 56 44 8 35 6 40 9 2Percent 2015 29 55 45 8 35 4 44 8 1Percent 2016 31 58 42 8 27 9 49 5 1

150 Hunt Arizona 2017
Black Bear Hunt Data
This page intentionally left blank�

Hunt Arizona 2017 151
Mountain Lion (Felis concolor)
Natural HistoryIn Arizona, mountain lions are absent only from
those areas heavily impacted by human development. In general, the distribution of mountain lions in the state corresponds with the distribution of major prey species, mule and white-tailed deer. Suitable habitat typically consists of desert and forested mountains with broken terrain, canyons, and rocky slopes.
Mountain lions may breed at any time of the year, and consequently litters may be born in any month. However, summer is the peak period of kitten births with litter sizes of two to four being common. The kit-tens remain with their mother for 15 to 22 months learning the skills necessary for survival. Young males
tend to disperse long distances compared to the rela-tively short distances for young females. Mountain lions are essentially solitary animals. Adult females may be accompanied by kittens, but are normally not associated with other adult animals except for mating purposes. Adult females weigh up to 100 pounds while adult males may reach 150 pounds.
While deer are the principal mountain lion prey spe-cies in Arizona, javelina, elk, bighorn, pronghorn, and livestock can be major components of their diet. Moun-tain lions are stalk and ambush predators that hunt primarily at night. They prefer to stalk from above, using rock ledges and steep terrain. Uneaten por-tions of a kill are often hidden or covered with leaves, dirt, or other debris. An entire deer can be consumed
GEO
RGE
AN
DRE
JKO

152 Hunt Arizona 2017
Mountain Lion
by an adult mountain lion in two nights. An experi-enced observer is usually able to detect the presence of a mountain lion in an area through the presence of tracks and scrapes, scat, and kills.
Hunt HistoryLions were clas-
sified as a “predatory animal” by the terri-torial legislature and were subject to a statewide bounty of $50 dollars in 1919. This status contin-ued until 1970 when the mountain lion was classified as a big-game animal and a tag was re-quired to take one,
even though ranchers and their agents could still take a depredating lion. A mandatory checkout procedure and other reporting requirements were instituted in 1982. Reporting information indicates that lion harvests have gradually increased over time. Recently, the an-nual kill has ranged between 250 and 350 animals, of which about 10-12 percent are taken by predator con-trol agents.
Mountain lion distribution
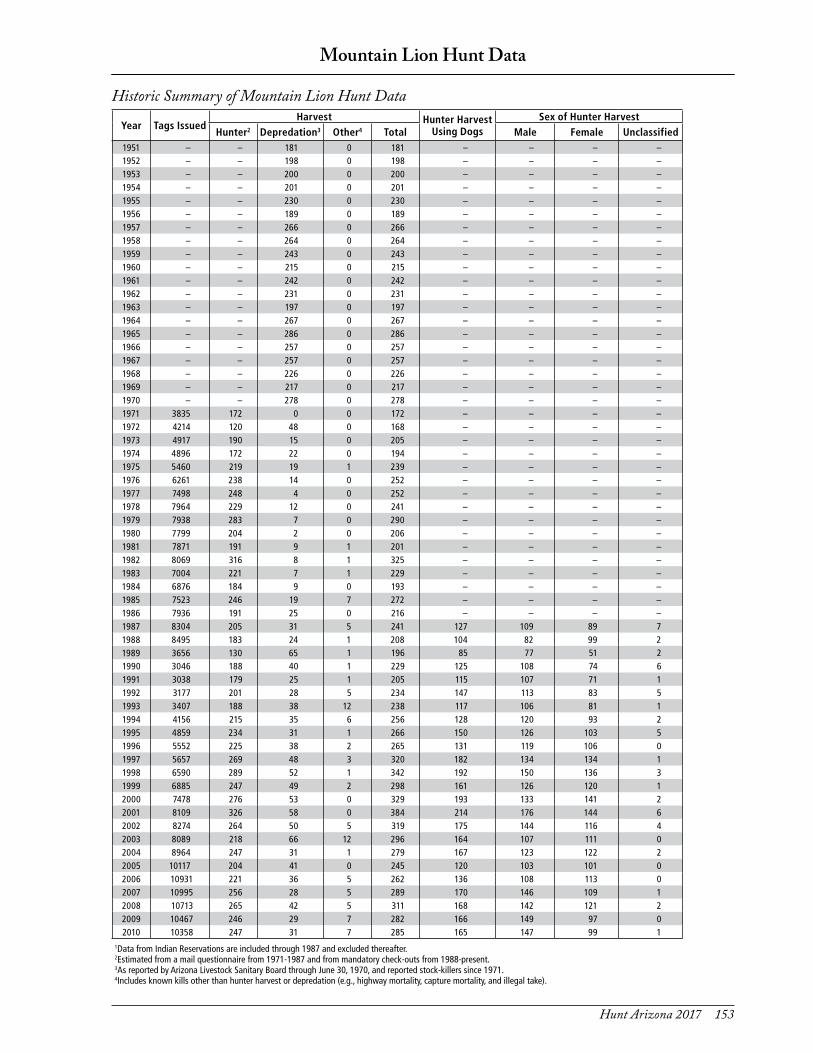
Hunt Arizona 2017 153
Mountain Lion Hunt Data
Year Tags IssuedHarvest Hunter Harvest
Using DogsSex of Hunter Harvest
Hunter2 Depredation3 Other4 Total Male Female Unclassified1951 – – 181 0 181 – – – –1952 – – 198 0 198 – – – –1953 – – 200 0 200 – – – –1954 – – 201 0 201 – – – –1955 – – 230 0 230 – – – –1956 – – 189 0 189 – – – –1957 – – 266 0 266 – – – –1958 – – 264 0 264 – – – –1959 – – 243 0 243 – – – –1960 – – 215 0 215 – – – –1961 – – 242 0 242 – – – –1962 – – 231 0 231 – – – –1963 – – 197 0 197 – – – –1964 – – 267 0 267 – – – –1965 – – 286 0 286 – – – –1966 – – 257 0 257 – – – –1967 – – 257 0 257 – – – –1968 – – 226 0 226 – – – –1969 – – 217 0 217 – – – –1970 – – 278 0 278 – – – –1971 3835 172 0 0 172 – – – –1972 4214 120 48 0 168 – – – –1973 4917 190 15 0 205 – – – –1974 4896 172 22 0 194 – – – –1975 5460 219 19 1 239 – – – –1976 6261 238 14 0 252 – – – –1977 7498 248 4 0 252 – – – –1978 7964 229 12 0 241 – – – –1979 7938 283 7 0 290 – – – –1980 7799 204 2 0 206 – – – –1981 7871 191 9 1 201 – – – –1982 8069 316 8 1 325 – – – –1983 7004 221 7 1 229 – – – –1984 6876 184 9 0 193 – – – –1985 7523 246 19 7 272 – – – –1986 7936 191 25 0 216 – – – –1987 8304 205 31 5 241 127 109 89 71988 8495 183 24 1 208 104 82 99 21989 3656 130 65 1 196 85 77 51 21990 3046 188 40 1 229 125 108 74 61991 3038 179 25 1 205 115 107 71 11992 3177 201 28 5 234 147 113 83 51993 3407 188 38 12 238 117 106 81 11994 4156 215 35 6 256 128 120 93 21995 4859 234 31 1 266 150 126 103 51996 5552 225 38 2 265 131 119 106 01997 5657 269 48 3 320 182 134 134 11998 6590 289 52 1 342 192 150 136 31999 6885 247 49 2 298 161 126 120 12000 7478 276 53 0 329 193 133 141 22001 8109 326 58 0 384 214 176 144 62002 8274 264 50 5 319 175 144 116 42003 8089 218 66 12 296 164 107 111 02004 8964 247 31 1 279 167 123 122 22005 10117 204 41 0 245 120 103 101 02006 10931 221 36 5 262 136 108 113 02007 10995 256 28 5 289 170 146 109 12008 10713 265 42 5 311 168 142 121 22009 10467 246 29 7 282 166 149 97 02010 10358 247 31 7 285 165 147 99 1
1Data from Indian Reservations are included through 1987 and excluded thereafter�2Estimated from a mail questionnaire from 1971-1987 and from mandatory check-outs from 1988-present�3As reported by Arizona Livestock Sanitary Board through June 30, 1970, and reported stock-killers since 1971�4Includes known kills other than hunter harvest or depredation (e�g�, highway mortality, capture mortality, and illegal take)�
Historic Summary of Mountain Lion Hunt Data

154 Hunt Arizona 2017
Mountain Lion Harvest Data
5-Year: 2012-2016 Mountain Lion Harvest Data
Historic Summary of Mountain Lion Harvest¹
Year Tags IssuedHarvest Hunter Harvest
Using DogsSex of Hunter Harvest
Hunter2 Depredation3 Other4 Total Male Female Unclassified2011 10292 287 38 4 329 199 159 1252012 10942 235 37 4 276 155 128 1072013 10951 302 41 1 344 219 162 1362014 11128 233 33 2 268 164 112 1192015 10940 324 33 3 360 247 170 152
1Data from Indian Reservations are included through 1987 and excluded thereafter�2Estimated from a mail questionnaire from 1971-1987 and from mandatory check-outs from 1988-present�3As reported by Arizona Livestock Sanitary Board through June 30, 1970, and reported stock-killers since 1971�4Includes known kills other than hunter harvest or depredation (e�g�, highway mortality, capture mortality, and illegal take)�
Unit YearHarvest Hunter
HarvestUsing Dogs
Sex of Hunter Harvest Adult
Females>=3
Month of Hunter Harvest
Hunter Depredation Other Male Female Jan� to March
Apr� to June
July to Sept�
Oct to Dec�
1 2012 5 0 0 3 5 0 0 1 0 1 31 2013 2 0 0 1 1 1 1 0 0 1 11 2014 5 0 0 5 2 3 0 2 1 0 21 2015 16 0 0 15 11 5 2 6 0 0 101 2016 4 0 0 3 3 1 1 0 1 0 32A 2014 1 0 0 0 0 1 1 0 0 0 12B 2013 1 0 0 0 0 1 1 0 0 0 12B 2015 2 0 0 2 1 1 0 2 0 0 02B 2016 1 0 0 0 1 0 0 1 0 0 03B 2012 0 0 1 - - - - - - - -3B 2013 1 0 0 0 0 1 0 0 0 0 13B 2016 4 0 0 3 3 1 0 3 1 0 03C 2012 6 0 0 5 2 4 1 1 0 0 53C 2013 2 0 0 0 0 2 2 0 0 0 23C 2014 1 0 0 0 1 0 0 0 0 1 03C 2015 5 0 0 5 4 1 0 2 0 0 33C 2016 2 0 0 1 1 1 0 0 1 0 14A 2013 6 0 0 6 2 4 3 6 0 0 04A 2014 1 0 0 1 0 1 0 0 0 0 14A 2016 5 0 0 2 2 3 0 1 1 1 24B 2012 4 0 0 3 2 2 0 1 0 1 24B 2013 3 0 0 1 1 2 0 1 0 0 24B 2015 1 0 0 1 1 0 0 0 0 0 14B 2016 1 0 0 1 1 0 0 0 0 0 15A 2012 1 0 0 0 0 1 1 1 0 0 05A 2013 1 0 0 1 1 0 0 1 0 0 05A 2014 1 0 0 1 1 0 0 0 1 0 05A 2015 1 0 0 1 0 1 0 0 0 0 15A 2016 2 0 0 2 2 0 0 1 0 0 15B 2012 7 0 0 5 5 2 1 5 0 1 15B 2013 2 0 0 2 2 0 0 0 0 0 25B 2014 4 0 0 2 2 2 0 2 0 1 15B 2015 7 0 0 5 2 5 2 4 0 0 35B 2016 4 0 0 1 1 3 1 0 0 2 25BN 2016 4 0 0 3 2 2 2 1 0 1 25BS 2016 1 0 0 0 0 1 0 0 0 1 06A 2012 4 0 0 3 2 2 0 0 0 1 36A 2013 14 0 0 8 6 8 3 10 0 0 46A 2014 8 0 0 6 4 4 1 3 1 2 26A 2015 6 0 0 2 3 3 2 2 0 1 36A 2016 8 0 0 5 6 2 0 2 1 0 56AS 2012 5 0 0 4 2 3 2 5 0 0 06B 2013 1 0 0 0 1 0 0 0 0 0 16B 2015 1 0 0 0 1 0 0 1 0 0 06B 2016 1 0 0 1 1 0 0 1 0 0 07 2012 3 0 0 2 2 1 0 2 0 0 1

Hunt Arizona 2017 155
Mountain Lion Harvest Data
5-Year: 2012-2016 Mountain Lion Harvest Data
Unit YearHarvest Hunter
HarvestUsing Dogs
Sex of Hunter Harvest Adult
Females>=3
Month of Hunter Harvest
Hunter Depredation Other Male Female Jan� to March
Apr� to June
July to Sept�
Oct to Dec�
7 2013 2 0 0 2 2 0 0 1 0 0 17 2014 1 0 0 1 1 0 0 1 0 0 07 2015 3 0 0 3 2 1 1 3 0 0 07 2016 1 0 0 1 0 1 0 1 0 0 08 2012 4 0 1 2 2 2 1 1 0 0 38 2013 7 0 0 4 5 2 1 3 0 0 48 2014 5 0 0 4 2 3 0 3 1 1 08 2015 7 0 0 6 4 3 2 4 1 0 28 2016 3 0 0 2 2 1 0 1 0 0 29 2012 8 0 0 6 5 3 1 4 0 0 49 2013 9 0 0 6 4 5 2 6 0 0 39 2014 1 0 0 1 1 0 0 0 0 0 19 2015 7 0 0 6 4 3 1 3 0 0 49 2016 2 0 0 1 0 2 1 1 0 0 110 2012 11 0 0 7 7 4 2 6 1 2 210 2013 8 0 0 6 4 4 0 6 0 1 110 2014 8 1 0 4 3 5 1 4 1 1 210 2015 2 0 0 2 1 1 0 2 0 0 010 2016 10 0 0 6 5 5 2 7 0 0 311M 2012 1 0 0 1 1 0 0 0 0 0 111M 2015 2 0 0 1 0 2 2 1 0 1 012 2016 1 0 0 0 1 0 0 1 0 0 012A 2012 4 0 0 4 2 2 0 0 0 0 412A 2013 12 0 0 11 7 5 4 6 1 0 512A 2014 16 0 0 15 6 10 5 5 2 0 912A 2015 20 0 0 19 9 11 4 11 2 0 712A 2016 9 0 0 9 8 1 0 2 1 0 612B 2014 2 0 0 2 2 0 0 0 0 0 213A 2012 1 0 0 1 1 0 0 0 0 0 113A 2013 8 0 0 8 3 5 1 4 0 0 413A 2014 1 0 0 1 1 0 0 0 0 0 113A 2015 2 0 0 1 1 1 1 0 0 0 213A 2016 8 0 0 5 3 5 0 4 0 0 413B 2013 1 0 0 0 1 0 0 1 0 0 013B 2014 2 0 0 1 1 1 0 0 0 1 113B 2015 8 0 0 5 4 4 2 3 0 0 513B 2016 2 0 0 2 2 0 0 1 0 0 113BS 2016 2 0 0 2 1 1 1 2 0 0 015A 2013 1 0 0 0 0 1 1 0 0 0 115A 2014 1 0 0 0 0 1 1 0 0 0 115A 2015 1 0 0 1 1 0 0 0 0 0 115A 2016 1 0 0 0 0 1 0 0 0 0 115B 2013 2 0 0 1 1 0 0 1 0 0 115B 2014 1 0 0 0 0 1 0 0 1 0 015B 2016 1 0 0 1 1 0 0 1 0 0 015CS 2016 1 0 0 1 0 1 0 1 0 0 015D 2012 0 0 1 - - - - - - - -16A 2012 1 0 0 1 0 1 1 1 0 0 016A 2013 2 0 0 1 1 1 0 2 0 0 016A 2014 1 0 0 1 1 0 0 0 0 0 116A 2015 1 0 0 0 1 0 0 1 0 0 016AN 2015 3 0 1 3 2 1 0 0 0 0 316AN 2016 6 0 0 4 3 3 1 1 2 0 316AS 2012 2 0 0 1 0 2 0 1 0 0 116AS 2013 2 0 0 2 2 0 0 1 1 0 016AS 2015 1 0 0 1 1 0 0 1 0 0 017A 2012 3 0 0 1 1 2 1 2 0 0 117A 2013 4 0 0 3 3 1 1 2 2 0 017A 2014 3 0 0 1 1 2 2 1 1 0 117A 2015 5 0 0 4 2 3 1 1 0 0 417A 2016 2 0 0 1 0 2 0 0 0 0 217B 2012 5 0 0 5 2 3 1 4 0 0 1

156 Hunt Arizona 2017
Mountain Lion Harvest Data
5-Year: 2012-2016 Mountain Lion Harvest Data
Unit YearHarvest Hunter
HarvestUsing Dogs
Sex of Hunter Harvest Adult
Females>=3
Month of Hunter Harvest
Hunter Depredation Other Male Female Jan� to March
Apr� to June
July to Sept�
Oct to Dec�
17B 2013 10 0 0 9 7 3 1 4 0 0 617B 2014 5 0 0 5 3 2 2 2 0 0 317B 2015 13 0 0 13 10 3 2 10 2 0 117B 2016 17 0 0 15 7 10 4 5 4 1 718A 2012 2 0 0 0 2 0 0 1 0 0 118A 2013 2 0 0 2 1 1 0 2 0 0 018A 2014 4 1 0 2 1 3 1 2 1 0 118A 2015 7 0 0 7 4 3 1 6 0 0 118A 2016 4 0 0 4 3 1 0 0 1 0 318B 2013 3 0 0 1 0 3 0 1 0 0 218B 2014 3 2 0 3 1 2 2 1 1 0 118B 2015 4 5 0 4 2 2 0 3 0 0 118B 2016 4 0 0 2 1 3 1 2 0 1 118BS 2012 1 0 0 1 1 0 0 1 0 0 018BS 2014 2 0 0 2 1 1 0 1 0 0 118BS 2015 1 0 0 0 0 1 0 1 0 0 018BS 2016 4 0 0 2 1 3 1 0 1 0 319A 2012 1 0 0 0 1 0 0 1 0 0 019A 2014 5 0 0 4 3 2 0 3 2 0 019A 2015 5 1 0 4 2 3 2 1 1 2 119A 2016 5 0 0 2 3 2 1 4 0 0 119B 2012 1 0 0 0 0 1 0 0 0 0 119B 2013 3 0 0 2 2 1 0 2 1 0 019B 2014 1 0 0 1 1 0 0 1 0 0 019B 2015 6 0 0 4 3 3 0 3 0 1 219B 2016 3 0 0 2 2 1 1 1 1 0 120A 2012 4 0 0 3 1 3 1 3 0 1 020A 2013 4 0 0 3 1 3 1 3 0 1 020A 2014 5 0 0 5 3 2 1 2 2 0 120A 2015 1 0 0 0 0 1 1 0 0 0 120A 2016 4 0 0 4 2 2 2 2 0 0 220B 2012 3 0 0 2 2 1 0 1 0 0 220B 2013 5 0 0 4 3 2 2 0 0 1 420B 2014 1 0 1 1 0 1 1 0 1 0 020B 2015 3 0 0 2 3 0 0 1 0 0 220B 2016 4 0 0 4 2 2 1 4 0 0 020C 2012 5 0 0 4 1 4 1 3 1 0 120C 2013 5 0 0 3 3 2 1 2 0 0 320C 2014 2 0 0 2 2 0 0 0 0 1 120C 2015 3 0 0 3 2 1 1 1 1 1 020C 2016 2 0 0 2 1 1 0 1 0 0 121 2012 10 0 0 6 4 6 1 6 0 1 321 2013 4 1 0 3 3 1 1 2 0 0 221 2014 6 0 0 1 2 4 1 1 1 0 421 2015 7 0 0 1 2 4 0 0 0 0 721 2016 5 0 0 3 0 5 1 3 0 1 122 2012 7 0 0 7 5 2 0 2 2 0 322 2013 6 0 1 2 1 5 1 3 0 0 322 2014 3 0 0 2 2 1 1 3 0 0 022 2015 10 0 0 7 7 3 0 7 0 0 322 2016 6 0 0 3 1 5 1 2 0 1 322N 2016 1 0 0 1 1 0 0 0 0 0 122S 2012 3 0 0 1 1 2 1 1 0 1 122S 2013 3 0 0 2 1 2 1 2 0 0 122S 2016 2 0 0 1 1 1 0 0 0 0 223 2012 18 0 0 14 2 6 5 7 4 4 323 2013 16 0 0 14 9 7 0 7 0 5 423 2014 7 0 0 4 4 3 0 2 1 1 323 2015 18 0 0 17 11 7 1 9 2 0 723 2016 15 0 1 10 7 8 2 8 2 0 523N 2016 2 0 0 1 1 1 0 0 1 0 123S 2013 1 0 0 0 0 1 0 0 0 0 1

Hunt Arizona 2017 157
Mountain Lion Harvest Data
5-Year: 2012-2016 Mountain Lion Harvest Data
Unit YearHarvest Hunter
HarvestUsing Dogs
Sex of Hunter Harvest Adult
Females>=3
Month of Hunter Harvest
Hunter Depredation Other Male Female Jan� to March
Apr� to June
July to Sept�
Oct to Dec�
24A 2012 5 0 0 2 2 3 1 1 0 0 424A 2013 9 0 0 9 7 2 1 6 1 0 224A 2014 8 0 0 4 5 3 2 2 2 2 224A 2015 9 0 2 5 6 3 1 3 0 1 524A 2016 11 0 0 4 7 4 2 7 0 2 224B 2012 2 0 0 1 1 1 1 1 0 0 124B 2013 9 0 0 9 5 4 2 5 3 0 124B 2014 2 1 0 1 2 0 0 0 1 0 124B 2015 1 0 0 1 1 0 0 0 0 0 124B 2016 8 0 0 4 2 6 1 4 0 0 426M 2013 1 0 0 0 0 1 0 0 0 0 127 2012 13 6 0 9 6 7 2 3 1 2 627 2013 7 1 0 5 6 1 0 5 1 1 027 2014 13 2 0 10 5 8 5 6 0 1 627 2015 10 1 0 7 8 2 1 3 1 0 627 2016 16 2 0 9 6 10 2 7 1 1 727L 2013 5 0 0 3 3 2 0 3 1 0 127L 2014 2 0 0 2 1 1 0 2 0 0 027L 2015 1 0 0 1 0 1 1 1 0 0 027L 2016 3 0 0 3 2 1 0 0 2 0 127U 2014 5 0 0 5 2 3 1 0 1 3 127U 2015 2 0 0 2 1 1 0 2 0 0 027U 2016 8 0 0 7 3 5 2 5 0 1 228 2012 3 9 0 3 1 2 0 0 1 0 228 2013 1 3 0 0 0 1 0 0 0 0 128 2014 3 6 0 3 1 2 1 1 1 0 128 2015 1 10 0 1 0 1 1 1 0 0 028 2016 8 4 0 6 5 3 1 5 0 1 228L 2014 2 0 0 0 0 2 0 1 0 1 028L 2015 1 0 0 1 0 1 0 0 1 0 029 2012 2 0 0 2 1 1 1 2 0 0 029 2013 2 0 0 1 1 1 0 2 0 0 029 2014 4 0 0 2 1 3 1 0 1 1 229 2015 4 0 0 4 2 2 1 4 0 0 029 2016 9 1 0 3 1 8 2 4 1 0 430A 2012 4 0 0 3 3 1 0 1 0 0 330A 2013 6 0 0 5 2 4 3 2 4 0 030A 2014 4 0 0 4 2 2 1 3 0 0 130A 2015 8 0 0 6 3 5 2 6 0 0 230A 2016 2 0 0 0 1 1 1 1 0 0 130B 2012 3 0 0 0 2 1 0 0 0 0 330B 2013 1 0 1 0 0 1 0 0 0 0 130B 2014 6 0 0 2 3 3 1 3 0 2 130B 2015 3 0 0 2 1 2 0 1 2 0 030B 2016 6 0 0 2 5 1 0 2 1 1 231 2012 5 3 0 4 3 2 2 5 0 0 031 2013 3 14 0 1 0 3 2 0 0 0 331 2014 3 8 0 2 2 1 1 2 1 0 031 2015 6 5 0 6 4 2 1 0 2 0 431 2016 3 3 0 2 3 0 0 0 0 2 131AG 2013 4 0 0 2 2 2 0 3 0 1 031AG 2014 1 0 0 1 1 0 0 1 0 0 032 2012 10 9 1 6 5 5 1 3 0 3 432 2013 9 11 0 8 5 4 2 5 0 1 332 2014 8 9 0 7 6 2 1 1 0 1 632 2015 11 11 0 10 6 5 1 7 1 0 332 2016 13 5 0 8 6 7 2 6 0 2 532AG 2013 14 0 0 14 8 6 4 9 4 0 132AG 2014 8 0 0 6 5 3 2 5 3 0 033 2012 22 0 0 16 13 9 2 11 2 1 833 2013 20 0 0 12 10 10 6 4 3 2 1133 2014 13 1 1 7 8 5 1 6 2 1 4

158 Hunt Arizona 2017
Mountain Lion Harvest Data
5-Year: 2012-2016 Mountain Lion Harvest Data
Unit YearHarvest Hunter
HarvestUsing Dogs
Sex of Hunter Harvest Adult
Females>=3
Month of Hunter Harvest
Hunter Depredation Other Male Female Jan� to March
Apr� to June
July to Sept�
Oct to Dec�
33 2015 21 0 0 14 8 12 5 9 1 2 933 2016 19 0 0 10 8 11 2 6 3 3 734A 2012 5 0 0 4 3 2 1 0 1 1 334A 2013 13 0 0 10 8 5 3 8 1 2 234A 2014 7 1 0 7 4 3 1 4 1 1 134A 2015 10 0 0 4 4 6 3 2 0 1 734A 2016 13 0 0 10 8 5 3 7 0 0 634B 2012 3 0 0 3 2 1 1 0 1 1 134B 2013 2 0 0 2 2 0 0 1 1 0 034B 2014 4 0 0 4 2 2 0 3 0 0 134B 2015 4 0 0 3 3 1 1 1 0 0 334B 2016 5 0 1 4 3 2 1 0 0 1 435A 2012 7 0 0 4 2 5 4 4 0 1 235A 2013 7 0 0 6 5 2 1 3 1 0 335A 2014 4 0 0 3 2 2 2 1 1 0 235A 2015 9 0 0 5 4 5 1 2 3 1 335A 2016 4 0 0 3 3 1 0 2 0 0 235B 2012 2 0 0 2 2 0 0 1 0 0 135B 2013 6 0 0 6 3 3 2 2 3 0 135B 2014 2 0 0 2 0 2 0 0 0 1 135B 2015 8 0 0 6 4 4 2 4 1 0 335B 2016 8 0 0 7 4 4 3 6 1 0 136A 2012 3 0 0 1 0 3 0 1 1 0 136A 2013 8 0 0 7 4 4 1 3 1 2 236A 2014 9 1 0 7 5 3 2 2 3 1 336A 2015 6 0 1 4 5 1 1 2 1 0 336A 2016 4 0 0 2 3 1 0 0 0 0 436B 2013 6 1 0 0 3 3 0 0 0 0 636B 2014 7 0 0 4 3 4 2 1 2 0 436B 2015 7 0 0 4 2 5 1 0 2 1 436B 2016 7 0 0 2 4 3 0 4 0 0 336C 2012 5 0 0 3 4 1 1 3 0 0 236C 2013 7 0 0 6 5 2 0 3 0 0 436C 2014 1 0 0 0 0 1 0 1 0 0 036C 2015 8 0 0 7 3 5 3 4 1 0 336C 2016 8 0 0 4 3 5 3 4 0 0 437A 2012 1 0 0 0 0 1 1 0 1 0 037A 2013 1 0 0 0 0 1 0 0 0 1 037A 2014 1 0 0 0 0 1 0 1 0 0 037B 2012 3 0 0 1 3 0 0 0 0 0 337B 2013 6 0 0 6 6 0 0 3 1 0 237B 2014 5 0 0 4 1 4 2 2 2 0 137B 2015 11 0 0 9 3 8 2 6 1 0 437B 2016 1 0 0 1 1 0 0 1 0 0 037BN 2012 1 0 0 0 1 0 0 0 1 0 037BN 2013 1 0 0 1 0 1 0 1 0 0 038M 2016 0 0 1 - - - - - - - -39 2012 2 0 0 0 1 1 0 1 0 0 139 2014 1 0 0 0 0 1 0 0 1 0 039 2015 1 0 0 1 1 0 0 1 0 0 041 2014 1 0 0 0 0 1 0 1 0 0 041W 2016 1 0 0 1 0 1 0 1 0 0 042 2012 2 0 0 1 1 1 1 2 0 0 042 2014 1 0 0 0 0 1 1 0 0 1 042 2015 2 0 0 0 0 2 2 2 0 0 042 2016 1 0 0 0 1 0 0 0 0 0 144A 2012 1 0 0 1 1 0 0 0 1 0 044A 2013 2 0 0 2 1 1 0 2 0 0 044A 2014 1 0 0 0 0 1 0 0 0 0 144A 2015 2 0 0 0 1 1 0 1 0 1 044AE 2012 1 0 0 1 0 1 1 1 0 0 0

Hunt Arizona 2017 159
Mountain Lion Harvest Data
Unit YearHarvest Hunter
HarvestUsing Dogs
Sex of Hunter Harvest Adult
Females>=3
Month of Hunter Harvest
Hunter Depredation Other Male Female Jan� to March
Apr� to June
July to Sept�
Oct to Dec�
Total 2012 235 37 4 159 128 107 41 101 18 22 93Total 2013 303 41 2 223 164 138 55 149 30 19 105Total 2014 233 33 2 165 113 119 47 88 40 25 80Total 2015 325 33 4 248 171 152 58 151 26 13 135Total 2016 322 15 3 205 161 161 49 137 27 23 135Percent 2012 85 13 1 68 54 46 38 43 8 9 40Percent 2013 88 12 1 74 54 46 40 49 10 6 35Percent 2014 87 12 1 71 49 51 39 38 17 11 34Percent 2015 90 9 1 76 53 47 38 46 8 4 42Percent 2016 95 4 1 64 50 50 30 43 8 7 42
1 Multiple Bag Limit area descriptions: 16AN = 16A North; 16AS = 16A South; 18BS = 18B South; 21; 27L = Lower Blue River Hunt Area in Unit 27; 27U = Upper Blue River Hunt Area in Unit 27; 28S = 28 South; 37B north of the Gila River� ** Statewide harvest trends will be managed to keep adult (≥3 year old) female harvest <35% of the total take within the standard management zone� Should 2-year mean female harvest comprise >35% of the harvest for a group of units that biologically may be combined as a subzone, the season may be restricted and female harvest limits may be established to reduce the overall female harvest in that subzone�
5-Year: 2012-2016 Mountain Lion Hunt Data
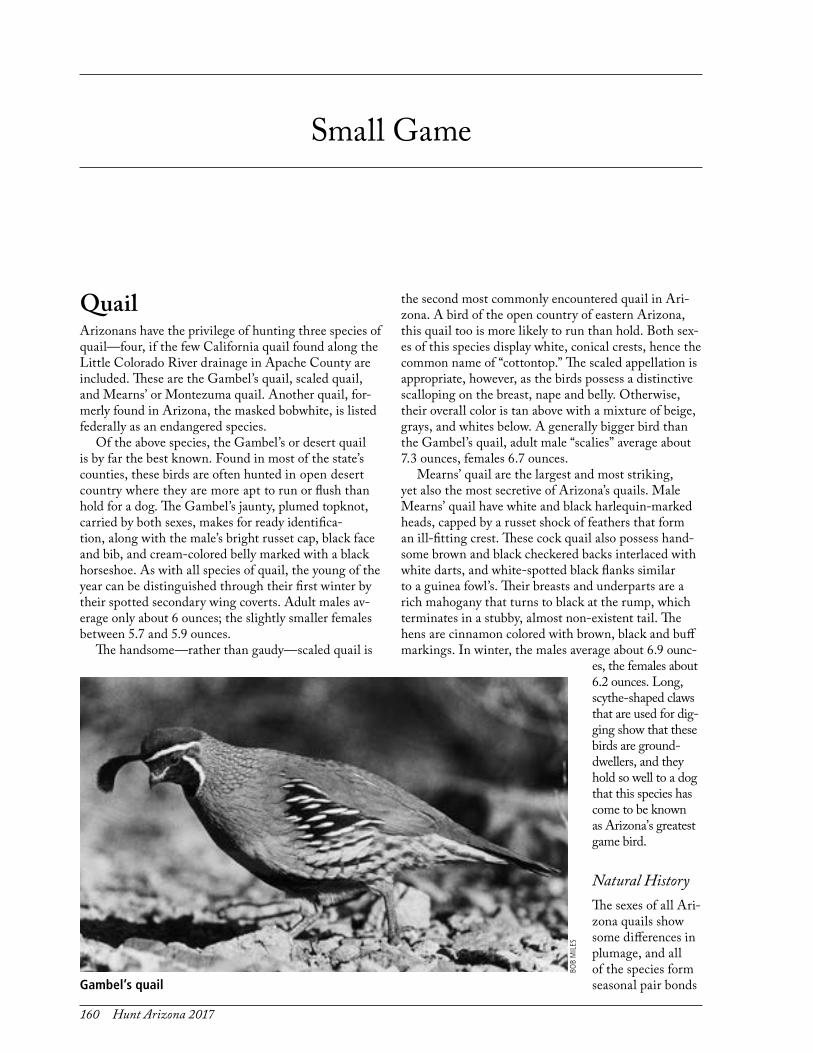
160 Hunt Arizona 2017
Quail Arizonans have the privilege of hunting three species of quail—four, if the few California quail found along the Little Colorado River drainage in Apache County are included. These are the Gambel’s quail, scaled quail, and Mearns’ or Montezuma quail. Another quail, for-merly found in Arizona, the masked bobwhite, is listed federally as an endangered species.
Of the above species, the Gambel’s or desert quail is by far the best known. Found in most of the state’s counties, these birds are often hunted in open desert country where they are more apt to run or flush than hold for a dog. The Gambel’s jaunty, plumed topknot, carried by both sexes, makes for ready identifica-tion, along with the male’s bright russet cap, black face and bib, and cream-colored belly marked with a black horseshoe. As with all species of quail, the young of the year can be distinguished through their first winter by their spotted secondary wing coverts. Adult males av-erage only about 6 ounces; the slightly smaller females between 5.7 and 5.9 ounces.
The handsome—rather than gaudy—scaled quail is
the second most commonly encountered quail in Ari-zona. A bird of the open country of eastern Arizona, this quail too is more likely to run than hold. Both sex-es of this species display white, conical crests, hence the common name of “cottontop.” The scaled appellation is appropriate, however, as the birds possess a distinctive scalloping on the breast, nape and belly. Otherwise, their overall color is tan above with a mixture of beige, grays, and whites below. A generally bigger bird than the Gambel’s quail, adult male “scalies” average about 7.3 ounces, females 6.7 ounces.
Mearns’ quail are the largest and most striking, yet also the most secretive of Arizona’s quails. Male Mearns’ quail have white and black harlequin-marked heads, capped by a russet shock of feathers that form an ill-fitting crest. These cock quail also possess hand-some brown and black checkered backs interlaced with white darts, and white-spotted black flanks similar to a guinea fowl’s. Their breasts and underparts are a rich mahogany that turns to black at the rump, which terminates in a stubby, almost non-existent tail. The hens are cinnamon colored with brown, black and buff markings. In winter, the males average about 6.9 ounc-
es, the females about 6.2 ounces. Long, scythe-shaped claws that are used for dig-ging show that these birds are ground-dwellers, and they hold so well to a dog that this species has come to be known as Arizona’s greatest game bird.
Natural History The sexes of all Ari-zona quails show some differences in plumage, and all of the species form seasonal pair bonds
Small Game
BOB
MIL
ES
Gambel’s quail

Hunt Arizona 2017 161
that last through incubation and brood-raising. Clutch and brood sizes are often large, ranging up to a dozen or more chicks, and both the cock and the hen care for the young. Individual birds have short life spans, how-ever, and population sizes tend to fluctuate widely from year to year. All Arizona species form fall and winter coveys that are likely to remain in the same general area where they were raised.
Each species has its own habitat preferences. The Gambel’s quail is found throughout the Sonoran and
Mojave deserts up-ward in elevation through semi-des-ert grassland and chaparral to the edges of pinyon-juniper woodland and pine for-est—wherever mesquites and other brushy cover occur. The scaled quail is a bird of semidesert grass-lands and the
Chihuahuan desert, preferring open plains and foothills; the Mearns’ quail prefers oak woodlands and oak savan-nas in the southeastern portions of the state where grass cover is abundant enough to conceal its presence.
Although all three major species of Arizona quail have formed pair bonds by March, they each have differ-ent breeding seasons. Gambel’s quail breed typically in spring and early summer, and breeding intensity and suc-cess are directly related to the amount of rainfall received during the previous October through March. The breed-ing season of scaled quail is more complex. They breed in spring after wet winters, but also during the summer months after the monsoons have started. Mearns’ quail nest typically after the summer monsoon season, and often postpone breeding until after the summer solstice when the days are getting shorter. The factors determin-ing the population levels of the various species also differ. The numbers of Gambel’s quail are related more to the success of the hatch than to carry-over from the previ-ous year. Scaled quail numbers are determined by both the success of the hatch and the number of birds surviv-ing from the year before. Mearns’ quail generally have good hatching success, and their highly fluctuating num-bers are determined largely by how many birds survive the winter. All of the birds experience relatively high winter mortality. The scaled and Mearns’ quail are more depen-dent on grass cover for over-winter survival than is the Gambel’s quail, and hence are more sensitive to livestock grazing pressures than the Gambel’s.
Hunt History By the turn of the century, quail hunting had become a popular pastime in Arizona, and a generous season and lack of a bag limit gave the state a reputation for harboring “game-hogs.” Then, in 1909, the territorial legislature limited quail hunting to an open season of October 16 through January 31, an arrangement that was retained in the state game code of 1912 along with a bag limit of 25 quail. In 1929 quail numbers must have been thought to be in need of improvement, as the season was short-ened to November 1 through December 31, and the follow-ing year the newly appointed Arizo-na Game and Fish Commission re-duced the bag limit to 15 quail per day. There was no season on Mearns’ or “fool quail” as this spe-cies was commonly known.Gambel’s quail distribution Scaled quail distribution
BOB
MIL
ES
Scaled quail

162 Hunt Arizona 2017
Small Game
During the years that followed, quail seasons and bag lim-its varied in response to quail numbers and the success of the hatch, which in some years, such as 1946-48, was so poor that no season was autho-rized. It was believed that unless the ra-tio of young to adult quail observed on summer surveys was less than 2.1:1 a hunt could not be justified, and even when there was a season, it might be only two days long with a five-bird bag limit. Then, in the 1950s and early 1960s, research showed that hunting mortality was compensatory to natural mortality, and a stan-dardized season from mid-October through the end of the month, followed by another season from Novem-ber 1 through the end of January, gradually became the norm, along with a 15-bird bag limit. Later, the month of November was also opened to quail hunting and the closing date delayed until mid-February. In 2008, the season was shifted to the Friday of week 40 (early Oc-tober) to accommodate a small game opener.
In 1960 a two-day season on Mearns’ quail was au-thorized for a limited area in the Santa Rita Mountains. Hunting was shown to have a negligible effect on this species also, and this season too was gradually expand-ed. Today, the season opens on Friday of the 49th week in deference to the bird’s late nesting habits, and contin-ues to mid-February. This bird and season has become so popular with bird dog hunters that the daily bag limit
was lowered to 8 birds in 2004 in an effort to spread out harvest.
Quail hunting in Arizona has always had its ups and downs. The top year in recent times was in 1979 when nearly 100,000 hunters reported harvesting more than 2.5 million quail. Since then, quail numbers and hunter in-terest have fallen off, with hunter numbers ranging from 27,000 to 60,000.
White-winged DoveThis bird’s hefty size and rounded off tail give the “white-wing” the appearance of being half dove and half pigeon, hence the older name of “Sonora pigeon.” Whitewings dif-fer from the more widespread mourning dove in having an overall grayer plumage, a white-tipped tail, and the white wing epaulets that give the bird its name. Unless pressed by gunners, the whitewing’s flight also appears slower, less purposeful, and more pigeonlike than the mourn-ing dove’s. Adults can be distinguished by an unfeathered bright blue eye patch, red feet, and eyes that range from yellow-orange to orange-red. By way of contrast, birds of the year have dull purplish-brown feet and are marked mostly in grays, whites, and browns. Adult males are es-pecially handsome birds, their brownish heads crowned in reddish purple with areas on the neck flecked with gold, green, and purple iridescence. The average weight of an adult male is about 5.5 ounces, although birds weighing up to 8 ounces have been recorded.
Natural History There are two types of white-winged dove populations in Arizona, a thinly scattered population found through-out the Sonoran Desert and the surrounding countryside (including towns and residential neighborhoods), and
colonial populations that nest collectively along river bottoms adjacent to agricultural areas. Most of the desert and residential area whitewings nest only once and migrate out of the state prior to the opening of the dove sea-son on September 1. The colonial whitewings, however, usually nest twice before departing for their wintering areas in southwestern Mexico. These are the white-wings that are most often present after September 1, and which contribute most to the harvest.
Males of both populations be-gin courtship as soon as they arrive in Arizona in late April and early May. By late May, nesting is at its
Mearns’ quail distribution
BOB
MIL
ES
Mearns’ quail

Hunt Arizona 2017 163
peak, both sexes sharing in the incubation of the eggs and the feeding and brooding of the two young squabs, most of which hatch toward the end of June. Fed a highly nutri-tious “pigeon-milk” by their parents, the squabs are usually fledged by late June or July. Should grains or other high-en-ergy foods be available, the colonial-nesting birds will now attempt another nesting, while the “desert birds” begin mi-grating south. As the second nesting comes to a close in late July and August, both the juvenile birds and their parents form gregarious flocks in selected roost sites adjacent to fa-
vored feeding fields, which unlike those selected by mourn-ing doves, are often composed of stand-ing crops of barley, maize, and safflow-er. The stimuli for the mass migration from cultivated val-leys that takes place about September 1 are not completely understood. Sum-mer storms, a drop in nighttime tem-
peratures, food shortages, and harassment by hunters have all been suggested as reasons for the movement. Nonethe-less, there have been years when all of these events occurred with little or no influence on the onset of migration. Once migration is underway, the departure is often rapid, the adults usually leaving before the juveniles.
Hunt History A favorable combination of nesting cover and grain crops resulted in two great heydays of white-winged dove hunt-ing in Arizona. The first of these was in the years prior to World War I, and the second was during the years af-ter World War II. So plentiful were these birds that the bag limit was 25 per day and 50 in possession. Numbers peaked in the 1960s when, in 1968, an all-time record harvest of more than 3/4 million was reached. Since then, declining nesting habitat and the virtual replacement of grain farming by cotton and alfalfa have greatly reduced whitewing hunting opportunities. But after reaching a low of 86,000 birds in 1980, whitewing harvests have again gradually increased. Today, hunter numbers range be-tween 15,000 and 30,000, bagging 80,000 to 125,000 whitewings a year.
Mourning DoveThis is the most common and widely occurring game bird in Arizona, and the dove’s trim, streamlined body, accen-tuated by its tiny head and sharply tapered tail is familiar to even the most casual observer of birds. This dove can also be differentiated from its white-winged cousin by its overall brown color, a lack of white on all but the outer tail feathers, the presence of black spots on the upper wing surfaces, and the distinctive rattling whistle that is emitted by the bird’s wing feathers when it takes flight. The more richly colored adult males can usually be distinguished at all times of the year from the browner females by their pinkish rose breasts, flecks of metallic green and other iridescence on the napes of their necks, and their slate blue crowns. Adult males weigh about 4.3 ounces, females about 4
ounces, with an occasional male weighing up to 6 ounces. Juvenile birds can be identified up to 4 or 5 months of age by the white tipping on the margins of their wing feathers.
Natural History Mourning doves occur from the lowest el-evations along the Colorado River upward through forests of ponderosa pines to 8,500 feet. Their staple foods throughout the year are primarily small seeds and cultivated grains. Although some doves can be found nesting on the ground in open prairies, the best nesting habitats are brushlands and woodlands within the Sonoran Desert. Here, the woeful call of breeding males can be heard as early as Febru-ary, and pairs have been known to attempt as many as seven nestings in a single season. Pro-ductivity may therefore be high even though the usual clutch size is only two eggs. Incuba-A
RIZO
NA
GA
ME
AN
D FI
SH D
EPA
RTM
ENT.
White-winged dove
White-winged dove distribution
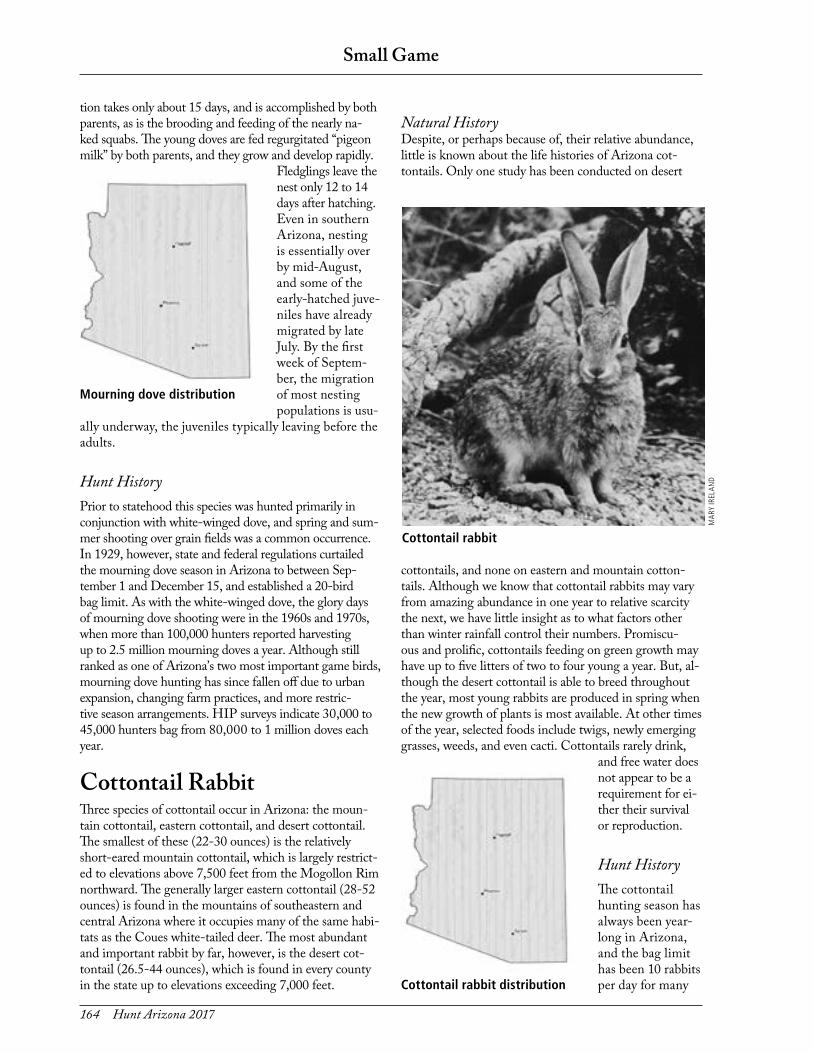
164 Hunt Arizona 2017
Small Game
tion takes only about 15 days, and is accomplished by both parents, as is the brooding and feeding of the nearly na-ked squabs. The young doves are fed regurgitated “pigeon milk” by both parents, and they grow and develop rapidly.
Fledglings leave the nest only 12 to 14 days after hatching. Even in southern Arizona, nesting is essentially over by mid-August, and some of the early-hatched juve-niles have already migrated by late July. By the first week of Septem-ber, the migration of most nesting populations is usu-
ally underway, the juveniles typically leaving before the adults.
Hunt History Prior to statehood this species was hunted primarily in conjunction with white-winged dove, and spring and sum-mer shooting over grain fields was a common occurrence. In 1929, however, state and federal regulations curtailed the mourning dove season in Arizona to between Sep-tember 1 and December 15, and established a 20-bird bag limit. As with the white-winged dove, the glory days of mourning dove shooting were in the 1960s and 1970s, when more than 100,000 hunters reported harvesting up to 2.5 million mourning doves a year. Although still ranked as one of Arizona’s two most important game birds, mourning dove hunting has since fallen off due to urban expansion, changing farm practices, and more restric-tive season arrangements. HIP surveys indicate 30,000 to 45,000 hunters bag from 80,000 to 1 million doves each year.
Cottontail RabbitThree species of cottontail occur in Arizona: the moun-tain cottontail, eastern cottontail, and desert cottontail. The smallest of these (22-30 ounces) is the relatively short-eared mountain cottontail, which is largely restrict-ed to elevations above 7,500 feet from the Mogollon Rim northward. The generally larger eastern cottontail (28-52 ounces) is found in the mountains of southeastern and central Arizona where it occupies many of the same habi-tats as the Coues white-tailed deer. The most abundant and important rabbit by far, however, is the desert cot-tontail (26.5-44 ounces), which is found in every county in the state up to elevations exceeding 7,000 feet.
Natural History Despite, or perhaps because of, their relative abundance, little is known about the life histories of Arizona cot-tontails. Only one study has been conducted on desert
cottontails, and none on eastern and mountain cotton-tails. Although we know that cottontail rabbits may vary from amazing abundance in one year to relative scarcity the next, we have little insight as to what factors other than winter rainfall control their numbers. Promiscu-ous and prolific, cottontails feeding on green growth may have up to five litters of two to four young a year. But, al-though the desert cottontail is able to breed throughout the year, most young rabbits are produced in spring when the new growth of plants is most available. At other times of the year, selected foods include twigs, newly emerging grasses, weeds, and even cacti. Cottontails rarely drink,
and free water does not appear to be a requirement for ei-ther their survival or reproduction.
Hunt History The cottontail hunting season has always been year-long in Arizona, and the bag limit has been 10 rabbits per day for many
Mourning dove distribution
MA
RY IR
ELA
ND
Cottontail rabbit
Cottontail rabbit distribution

Hunt Arizona 2017 165
years. Although some hunters consider cottontail hunt-ing with a .22 rifle as their primary sport, cottontails traditionally have been taken in Arizona in conjunction with dove and quail hunting. As a consequence of the wide fluctuations in both cottontail and quail numbers, the annual take of cottontails is highly erratic, ranging from a reported high of about 850,000 rabbits in 1979 to less than 56,000 in 1998. Today, there are 10,000 to 15,000 hunters taking 45,000 to 120,000 rabbits per year.
Tree SquirrelsNo fewer than four species and eight subspecies of tree squirrels can be found in Arizona’s forests. Of these, the Abert’s or tassel-eared squirrel is the most widespread and contributes most to the annual squirrel harvest. This squirrel, with its easily discernible ear tufts, along with its close relatives, the black-bellied and white-tailed Kai-bab squirrels, are exclusively inhabitants of ponderosa pine forests and the life cycles of the squirrels and the tree are remarkably intertwined. Less well known is the also white-bellied Arizona gray squirrel and its close rela-tive, the rust-colored Chiricahua fox squirrel, both of which inhabit riparian deciduous forests and oak wood-lands south of the Mogollon Rim. Another species is the chicaree or red squirrel (actually more olive or gray than red in Arizona), which is restricted to the higher for-
ests of spruce and fir above 8,500 feet elevation. Both the tassel-eared and gray squirrels aver-age a little under 1.5 pounds in weight, while the diminu-tive red squirrel averages just over 0.5 pounds.
Natural History Tassel-eared squir-
rels have but one breeding season a year, which is closely correlated with the production of the staminate flowers of ponderosa pine in late April, May, or early June. After a lengthy chase, the female comes into es-trus for only one day. She will later give birth to a single litter of from two to four young in a nest made of pine boughs. Throughout the summer, the squirrels feed on the seeds of developing cones as well as on under-ground fungi or truffles that grow under mature pine trees. These foods are the most nutritious for the squir-rel, and only when they are exhausted does the animal resort to feeding on the inner bark of pine twigs—the discarded terminals of which are often seen littering the forest floor. These “clippings” of inner bark are only an emergency food, however, and if deep snow-cover or other factors force the squirrel to rely entirely on this food source, the animal will eventually go into shock and die. Only after years of research was it learned that the periods of tassel-eared squirrel scarcity and abun-dance were related to the amount of snow-cover and the availability of underground fungi. Most squirrel mortality is during the late winter, and when snow cov-ers the ground for 80 or more days, the mortality rate exceeds the squirrel’s rather modest recruitment rate. Hunting apparently has little effect on the animal’s numbers as other research shows the lowest monthly mortality is during the October and November hunt-ing season.
Hunt History
Tree squirrels have an uneven history as game in Arizo-na. Having gone from being totally ignored at the time of statehood, to having a limited season in conjunction with the deer and turkey seasons in the 1920s, the season was closed in 1935 due to a perceived lack of squirrels. Too many squirrels in the 1940s resulted in a re-opening of the season, and squirrel hunt regulations have since been liberalized gradually until every species and most subspe-cies are now subjected to limited hunting. Even the once
Tree squirrel distribution
BOB
MIL
ES
Abert’s Squirrels

166 Hunt Arizona 2017
Small Game
sacrosanct Kaibab squirrel is now hunted, and the only to-tally protected squirrel is the federally endangered Graham Mountain spruce squirrel.
The tassel-eared or Abert’s squirrel is the major game species, however, and the numbers of tree squirrel hunters and harvest depends largely on the vagaries of tassel-eared squirrel numbers. Questionnaire data collected since the early 1960s show that the peak number of hunters was in 1986 when 21,402 squirrel hunters took to the field and bagged nearly 165,000 squirrels for a hunter success of 2.5 squirrels per day. In the 1990s, the number of hunters generally ranged between 12,000 and 18,000 a year with the annual harvest between 50,000 and 100,000 tree squir-rels. Today, there are 6,000 to 11,000 hunters taking 25,000 to 55,000 tree squirrels a year.
Band-tailed PigeonAbout the size of a domestic pigeon, adult bandtails average just a little less than 8 ounces in weight, the females weigh-ing about 0.8 ounces less than the males. Both sexes have an overall blue-gray appearance, and it is only after close in-spection that one notices the male’s rosier breast and more iridescence on the nape of the neck; otherwise, the sexes are similar. In autumn, adults can be differentiated from their young by the adult’s chrome-yellow bills and feet, white crescent at the nape of the neck, and the dark gray band across the top of the tail that gives the bird its name.
Natural HistoryBandtails are birds of the mountains and usually nest in mixed conifer forests, ponderosa pine forests, or in dense stands of evergreen oaks and pines between 4,500 and 9,100 feet elevation. As migratory birds, bandtails are usu-ally only present in Arizona from late March through mid-October. Breeding generally takes place sometime in May and may continue through the summer, with some birds nesting twice and even three times in some years. The normal clutch is one glossy white egg, or occa-sionally two, so that the species’ repro-ductive potential is low. After feeding on acorns and other fall mast crops, most Arizona bandtails migrate southward to the Sierra Madre Occidental in Mex-ico to spend the winter months.
Hunt History Bandtail hunting has an erratic history in Arizona. Af-ter the season was closed in 1951 for a perceived lack of birds, interest in band-tailed pigeons waned until a study was initiated in the “four-corner” states of Ari-zona, New Mexico, Colorado and Utah in the 1960s. These studies included an experimental season, which opened in 1968, and continued through 1972. Hunt information showed a limited but dedicated interest in the band-tailed pigeon as a game bird with the maxi-mum number of hunters and birds harvested being 1,067 hunters and 3,545 pigeons in 1970. The numbers of both pigeons and pigeon hunters has since fallen off with only 146 bandtails reportedly taken in 1996. Now it appears that band-tailed pigeon numbers may again be inching upward.
Blue GrouseBlue grouse are blu-ish-gray, chickenlike birds restricted in Arizona to eleva-tions above 8,500 feet in mixed conifer and aspen forests. As a consequence, these birds are only found in the White, Blue, Escudilla, Chuska, and Buck-skin (North Kaibab) mountains, and on the San Francisco Peaks where they were introduced in the mid-1970s. Males are measur-ably larger than females, 2-year-old “cocks” weighing up to 3 pounds as opposed to the adult female’s average weight of between 1.75 to 2 pounds. In comparison, first-year birds or poults typically weigh only 16 to 28 ounces during the early days of the September hunting season.
Natural History Blue grouse in Arizona do not migrate downhill dur-ing the winter months as they do in the more northern states. Instead, they spend the winter roosting in Douglas-fir trees, subsisting on needles until spring when the males form small “leks” or strutting grounds, which they occupy from April through June. Often-times these leks are located on a fallen log or in a small clearing in the forest, where the cock attempts to en-gage any hen that comes his way with soft “hooting”
Blue grouse distribution
Band-tailed pigeon distribution

Hunt Arizona 2017 167
displays and “flutter flights.” The peak of mating ac-tivity usually takes place during the last part of May or the first week of June, after which the male goes off to leave the hen to nest and raise the chicks on her own. Most broods are hatched between mid-June and mid-July during which time the hen and poults feed primarily on forbs and insects. Four to six is an average brood size, the young staying with the hen through the fall months. Fall usually finds the hens and poults at the edge of mountain meadows and in old burns feed-ing on forbs, while the now solitary males tend to favor aspen thickets and other dense cover.
Hunt History The first legal season on blue grouse in Arizona did not take place until 1964 when 33 hunters spent 49 days to harvest 44 grouse. Since that time, a variety of grouse season dates have been authorized, but the number of grouse hunters has remained low due to the birds gen-eral scarcity and the steep terrain and high elevations of their habitat. Hunter numbers have never reached 800 in any given year, and the annual harvest since 1973 has been only 300 to 700 grouse.
PheasantSeveral attempts have been made to establish these na-tives of Asia as resident game birds in Arizona, the most recent being in the late 1960s and early 1970s when the small white-winged race of the ring-necked pheasant found in Afghanistan was released in farm-lands along the Gila, San Pedro, and other river valleys. A handsome, unmistakable bird, both sexes of this pheasant have long pointed tails, but it is the cocks or roosters that are unrivaled in their plumage. Possessing iridescent green heads offset by ear-tufts and a crimson-wattled cheek patch, the rooster also has a purplish chest, a soot-colored belly, distinctively dotted golden flanks, white wing epaulets, and a hand-
somely barred tail. Cocks usually weigh more than 2.5 pounds, while the beige- and sand-colored hens average between 1.5 and 2 pounds. Both sexes, but es-pecially the males, typically give a cackle on being flushed that once heard is always remembered.
Natural History Pheasant populations persisting in Arizona are largely confined to agricultural areas having a relatively high humidity (e.g., citrus orchards in the Yuma and Mesa areas) or high enough in elevation to escape the des-iccating heat of Sonoran Desert summers (e.g., the Virgin River and Verde River valleys). In such loca-tions, a rooster will acquire a harem of from one to three hens, with mating commencing in early April. By mid-May most of the hens are nesting and of no fur-ther interest to him, and he will abandon his territorial patrols by the end of the month. The peak of hatch-ing is during the last week of May, the most arid time in Arizona, which is one of the reasons why pheasants have not become established here. The youngsters are covered with yellow and brown down, striped in brown and black, and are remarkably self-sufficient. After only about two weeks, they are capable of flight and remain with the hen for only another two months or so before making their own way in the world. Pheas-ants roost on the ground or the low branches of trees, and the typical hiding cover is a patch of rank weeds, a stand of cattails, or a dense jungle of salt-cedars. Pri-mary foods are cultivated greens and grains—alfalfa, barley sprouts, and kernels of maize, barley, and corn.
Hunt History Pheasants have always been a specialty game bird in Arizona, and are only taken by a small cadre of hunt-ers, who either obtain one of the limited hunt permits periodically available, hunt with falcons, or hunt with a bow and arrows. With the cessation of the Depart-ment’s experimental pheasant program in 1973, hunter numbers have never exceeded 100 in any given year and the annual harvest excluding birds taken in game farms has been less than 50 birds.
Ring-necked pheasant distribution

168 Hunt Arizona 2017
Small Game Harvest Data
Summary of Small Game Harvest InformationYear Hunters1 Hunter Days Days/Hunter Licensed Harvest Junior Harvest Total Harvest Harvest/Day2
MOURNING DOVEThe Small Game questionnaire was modified to collect unit specific data� Sample no longer weighted in analysis� The data is not comparable to historic data� In 2004 and 2005, the historic survey format and the new unit specific survey format were run simultaneously� Beginning in 2006, only the new unit specific survey format was used�
2004 36,926 137,049 3�7 835,763 52,051 887,814 6�12005 33,244 131,795 4�0 825,550 75,464 901,014 6�32006 71,497 273,665 3�8 1,803,250 61,324 1,864,574 6�8
Dove were separated from the traditional Small Game questionnaire and surveyed using the new Dove and Band-tailed Pigeon questionnaire in 2007� The sample of hunters surveyed was derived for the list of Migratory Bird Stamp purchasers� The data is not comparable to historic data�
2007 36,506 153,124 4�2 978,577 38,980 1,017,557 6�62008 36,818 153,971 4�2 932,360 36,719 969,079 6�3
Mourning dove data is now obtained from the Harvest Information Program conducted by the U�S� Fish and Wildlife Service� The data is not comparable that obtained from Arizona’s questionnaire�
20093 37,200 130,600 3�5 784,400 --- 784,400 6�020103 40,500 145,300 3�6 941,800 --- 941,800 6�520113 35,400 123,300 3�6 784,600 --- 784,600 6�420123 32,100 110,800 3�5 601,200 --- 601,200 5�420133 36,300 134,300 3�7 774,800 --- 774,800 5�820143 24,200 65,600 2�7 370,000 --- 370,000 5�620153 17,100 53,900 3�2 401,400 --- 401,400 7�4
1 Includes early and late hunters�2 Licensed hunters only; does not include junior harvest� 3 Confidence intervals on harvest from the Harvest Information Program: 2009 +/- 12%; 2010 +/- 15%; 2011+/- 15%; 2012 +/- 16%; 2013 +/- 18%,
2014 +/- 10%, 2015 +/- 7%
Year Hunters Hunter Days Days/Hunter Licensed Harvest Junior Harvest Total Harvest Harvest/Day1
WHITE-WINGED DOVEThe Small Game questionnaire was modified to collect unit specific data� Sample no longer weighted in analysis� The data is not comparable to historic data� In 2004 and 2005, the historic survey format and the new unit specific survey format were run simultaneously� Beginning in 2006, only the new unit specific survey format was used�
2004 13,656 39,865 2�9 68,647 4,103 72,750 1�72005 12,636 36,196 2�9 64,717 7,322 72,039 1�82006 30,017 86,255 2�9 216,138 20,346 236,484 2�5
Dove were separated from the traditional Small Game questionnaire and surveyed using the new Dove and Band-tailed Pigeon questionnaire in 2007� The sample of hunters surveyed was derived for the list of Migratory Bird Stamp purchasers� The data is not comparable to historic data�
2007 14,959 49,893 3�3 85,868 4,994 90,862 1�82008 14,067 47,263 3�4 83,635 7,369 91,004 1�9
White-winged dove data is now obtained from the Harvest Information Program conducted by the U�S� Fish and Wildlife Service� The data is not comparable that obtained from Arizona’s questionnaire�
20092 20,400 68,200 3�3 124,500 --- 124,500 1�820102 17,400 52,400 3�0 84,900 --- 84,900 1�620112 18,100 57,200 3�0 118,900 --- 118,900 2�720122 14,600 47,400 3�0 86,000 --- 86,000 1�820132 18,400 60,500 3�3 100,000 --- 100,000 1�720142 13,300 34,800 2�6 83,800 --- 83,800 2�420153 11,000 33,500 3�0 72,200 --- 72,200 2�2
1 Licensed hunters only; does not include junior harvest�2 Confidence intervals on harvest from the Harvest Information Program: 2009 +/- 19%; 2010 +/- 24%; 2011 +/- 29%; 2012 +/- 22%, 2013 +/- 35%;
2014 +/- 18%, 2015 +/- 7%
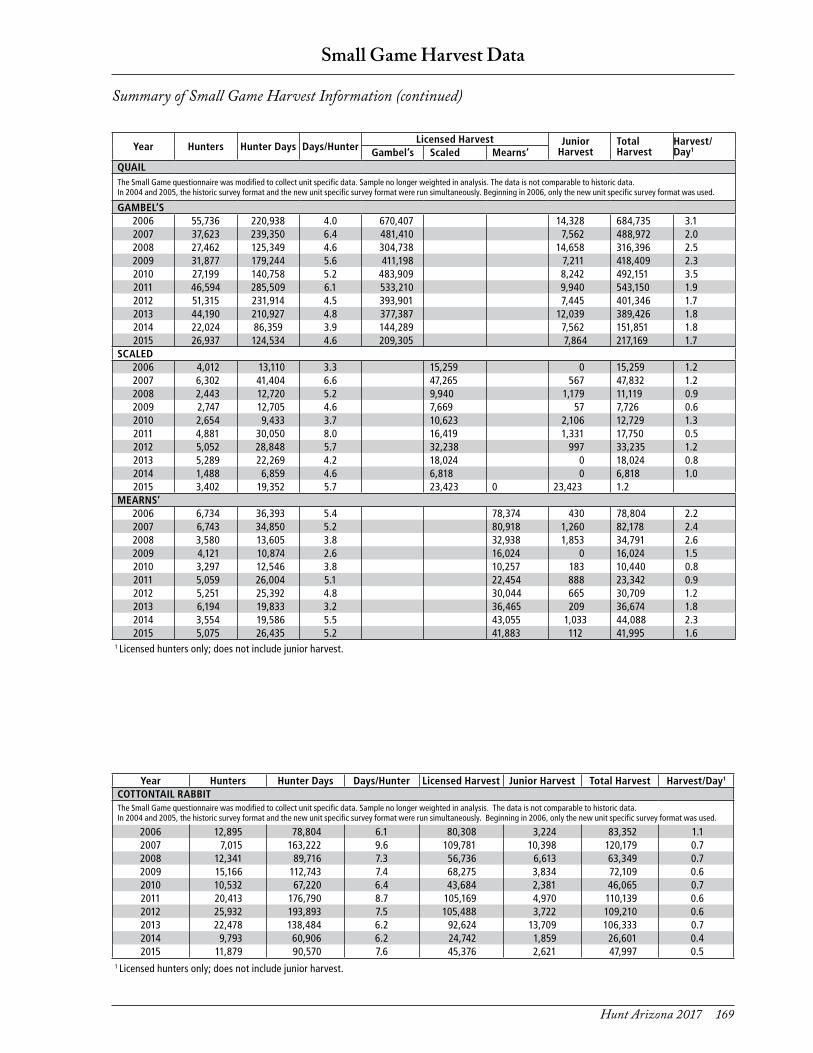
Hunt Arizona 2017 169
Small Game Harvest Data
Summary of Small Game Harvest Information (continued)
Year Hunters Hunter Days Days/HunterLicensed Harvest Junior
HarvestTotal Harvest
Harvest/Day1Gambel’s Scaled Mearns’
QUAILThe Small Game questionnaire was modified to collect unit specific data� Sample no longer weighted in analysis� The data is not comparable to historic data� In 2004 and 2005, the historic survey format and the new unit specific survey format were run simultaneously� Beginning in 2006, only the new unit specific survey format was used�
GAMBEL’S2006 55,736 220,938 4�0 670,407 14,328 684,735 3�12007 37,623 239,350 6�4 481,410 7,562 488,972 2�02008 27,462 125,349 4�6 304,738 14,658 316,396 2�52009 31,877 179,244 5�6 411,198 7,211 418,409 2�32010 27,199 140,758 5�2 483,909 8,242 492,151 3�52011 46,594 285,509 6�1 533,210 9,940 543,150 1�92012 51,315 231,914 4�5 393,901 7,445 401,346 1�72013 44,190 210,927 4�8 377,387 12,039 389,426 1�82014 22,024 86,359 3�9 144,289 7,562 151,851 1�82015 26,937 124,534 4�6 209,305 7,864 217,169 1�7
SCALED2006 4,012 13,110 3�3 15,259 0 15,259 1�22007 6,302 41,404 6�6 47,265 567 47,832 1�22008 2,443 12,720 5�2 9,940 1,179 11,119 0�92009 2,747 12,705 4�6 7,669 57 7,726 0�62010 2,654 9,433 3�7 10,623 2,106 12,729 1�32011 4,881 30,050 8�0 16,419 1,331 17,750 0�52012 5,052 28,848 5�7 32,238 997 33,235 1�22013 5,289 22,269 4�2 18,024 0 18,024 0�82014 1,488 6,859 4�6 6,818 0 6,818 1�02015 3,402 19,352 5�7 23,423 0 23,423 1�2
MEARNS’2006 6,734 36,393 5�4 78,374 430 78,804 2�22007 6,743 34,850 5�2 80,918 1,260 82,178 2�42008 3,580 13,605 3�8 32,938 1,853 34,791 2�62009 4,121 10,874 2�6 16,024 0 16,024 1�52010 3,297 12,546 3�8 10,257 183 10,440 0�82011 5,059 26,004 5�1 22,454 888 23,342 0�92012 5,251 25,392 4�8 30,044 665 30,709 1�22013 6,194 19,833 3�2 36,465 209 36,674 1�82014 3,554 19,586 5�5 43,055 1,033 44,088 2�32015 5,075 26,435 5�2 41,883 112 41,995 1�6
1 Licensed hunters only; does not include junior harvest�
Year Hunters Hunter Days Days/Hunter Licensed Harvest Junior Harvest Total Harvest Harvest/Day1
COTTONTAIL RABBITThe Small Game questionnaire was modified to collect unit specific data� Sample no longer weighted in analysis� The data is not comparable to historic data� In 2004 and 2005, the historic survey format and the new unit specific survey format were run simultaneously� Beginning in 2006, only the new unit specific survey format was used�
2006 12,895 78,804 6�1 80,308 3,224 83,352 1�12007 7,015 163,222 9�6 109,781 10,398 120,179 0�72008 12,341 89,716 7�3 56,736 6,613 63,349 0�72009 15,166 112,743 7�4 68,275 3,834 72,109 0�62010 10,532 67,220 6�4 43,684 2,381 46,065 0�72011 20,413 176,790 8�7 105,169 4,970 110,139 0�62012 25,932 193,893 7�5 105,488 3,722 109,210 0�62013 22,478 138,484 6�2 92,624 13,709 106,333 0�72014 9,793 60,906 6�2 24,742 1,859 26,601 0�42015 11,879 90,570 7�6 45,376 2,621 47,997 0�5
1 Licensed hunters only; does not include junior harvest�

170 Hunt Arizona 2017
Small Game Harvest Data
Year Hunters Hunter Days Days/Hunter Licensed Harvest Junior Harvest Total Harvest Harvest/Day1
BAND-TAILED PIGEON2004 612 1,531 2�5 919 0 919 0�62005 590 886 1�5 1,122 0 1,122 1�32006 501 1,791 3�6 2,006 0 2,006 1�1
Band-tailed pigeons were separated from the traditional Small Game questionnaire and surveyed using the new Dove and Band-tailed Pigeon questionnaire in 2007� The sample of hunters surveyed was derived for the list of Migratory Bird Stamp purchasers� The data is not comparable to historic data�
2007 647 1,595 2�5 1,757 324 2,081 1�32008 819 1,563 1�9 1,191 124 1,315 0�8
Band-tailed pigeon data is now obtained from the Harvest Information Program conducted by the U�S� Fish and Wildlife Service� The data are not comparable that obtained from Arizona’s questionnaire�
20091 1,300 4,100 3�2 2,300 --- 2,300 0�620101 1,800 5,800 3�2 700 --- 700 0�120111 500 900 1�8 1,000 --- 1,000 1�120121 900 3,100 3�4 1,300 --- 1,300 4�220131 400 800 2�0 900 --- 900 1�12014 1,000 1,900 1�9 700 --- 700 0�42015 600 1,700 2�8 500 --- 500 �3
1 Confidence intervals on harvest from the Harvest Information Program: 2009 +/-76%; 2010 +/-110%; 2011 +/- 93%; 2012 +/- 76%; 2013 +/- 125%; 2014 =/- 83%, 2015 +/- 7%
Summary of Small Game Harvest Information (continued)
Year Hunters Hunter Days Days/Hunter Licensed Harvest Harvest/Day1
CHUKAR PARTRIDGEThe Small Game questionnaire was modified to collect unit specific data� The data is not comparable to historic data�
2007 252 819 3�3 189 0�232008 379 758 2�0 84 0�112009 286 454 1�6 57 0�132010 no questionnaire responses2011 266 355 1�3 1065 3�002012 66 133 2�0 0 0�002013 278 1879 6�8 209 0�112014 no questionaire responses2015 390 1,896 4�9 1,338 0�71
Year Hunters Hunter Days Days/Hunter Licensed Harvest Harvest/Day1
BLUE GROUSEThe Small Game questionnaire was modified to collect unit specific data� The data is not comparable to historic data�
2006 860 1,934 2�2 287 0�152007 945 2,899 3�1 630 0�222008 1,306 3,327 2�5 379 0�112009 744 3,720 5�0 858 0�232010 366 916 2�5 92 0�102011 621 2041 3�3 0 0�002012 665 1662 2�5 199 0�122013 835 3688 4�4 1044 0�282014 455 1,281 2�8 537 0�422015 390 2,008 5�1 837 0�42
Year Hunters Hunter Days Days/Hunter Licensed Harvest Junior Harvest Total Harvest Harvest/Day1
TREE SQUIRRELThe Small Game questionnaire was modified to collect unit specific data� Sample no longer weighted in analysis� The data is not comparable to historic data� In 2004 and 2005, the historic survey format and the new unit specific survey format were run simultaneously� Beginning in 2006, only the new unit specific survey format was used�
2006 5,946 14,543 2�4 18,985 3,654 22,639 1�62007 9,138 29,430 3�2 40,018 2,458 42,476 1�42008 8,929 32,938 3�7 43,215 6,908 50,123 1�52009 10,988 35,597 3�2 52,251 3,982 56,233 1�62010 6,227 25,734 4�1 25,093 2,381 27,474 1�12011 7,988 36,920 4�6 38,518 2,219 40,737 1�12012 11,965 41,211 3�4 47,194 1,662 48,856 1�22013 10,439 32,568 3�1 32,359 3,688 36,047 1�12014 6,322 31,775 5�0 26,899 3,347 30,246 1�02015 8,087 42,664 5�3 44,170 3,625 47,795 1�1
1 Licensed hunters only; does not include junior harvest�

Hunt Arizona 2017 171
Small Game Harvest Data
Summary of Willow Springs Quail Check Station Data2012-13 2013-14* 2014-15* 2015-16 2016-17
No� of Hunter Days 105 229 142 150 178No� of Quail Bagged 163 434 103 201 97No� of Gambel’s 159 434 102 200 97No� of Scaled 9 0 1 1 0Quail Per Day 1�5 1�9 0�9 1�3 0�8
Gambel’s Scaled Gambel’s Scaled Gambel’s Scaled Gambel’s Scaled Gambel’s ScaledNo� of Adult Quail Classified
34 2 119 0 44 1 34 1 29 0
No� of Young Quail Classified
52 2 123 0 11 0 91 0 22 0
Percent Young in the Bag
61 - 51 - 20 - 73 - 43 -
1 Willow Springs and Freeman Ranch Quail Check Station data were combined for 2013-2014 a nd 2014-2015.
Summary of Freeman Road Quail Check Station Data2010-11 2011-12 2012-13 2016-17
No� of Hunter Days 95 100 124 77No� of Quail Bagged 380 83 162 97No� of Gambel’s 380 83 162 97No� of Scaled 0 0 0 0Quail Per Day 4�0 0�8 1�3 1�3
Gambel’s Gambel’s Gambel’s Gambel’sNo� of Adult Quail Classified 28 12 10 16No� of Young Quail Classified 67 4 20 19Percent Young in the Bag 71 25 67 54
Summary of Punkin Center Quail Check Station Data2010-11 2011-12 2013-14 2014-15 2015-16
No� of Hunter Days na -- 27 13 discontinuedNo� of Gambel’s na 1 31 28Quail Per Day na -- 1�1 2�2
Gambel’s Gambel’s Gambel’s Gambel’sNo� of Adult Quail Classified na -- 7 16No� of Young Quail Classified na -- 12 12Percent Young in the Bag na -- 0�63 43

172 Hunt Arizona 2017
Small Game Harvest Data
Year # of Birds Harvested # of Hunter Days Birds/Day Hours Hunted % Juvenile Birds/Hour19771978 34 192 77�21979 142 135 1�1 526 59�5 0�2719801981 101 113 0�9 488 84�9 0�211982 90 44 2�0 76�71983 144 0�0 546 83�71984 1047 277 3�8 1173�5 80�9 0�891985 1068 367 2�9 1513�5 68�4 0�711986 509 181 2�8 69�41987 332 188 1�8 764�5 71�5 0�431988 644 305 2�1 1521�5 83�4 0�421989 244 213 1�1 810 55�9 0�301990 421 195 2�2 943 79�7 0�451991 750 319 2�4 1437�3 75�6 0�521992 703 256 2�7 1199 78�4 0�591993 275 172 1�6 814�5 72�9 0�341994 202 133 1�5 590 45�6 0�341995 115 150 0�8 606�5 75�3 0�191996 153 142 1�1 697 75�2 0�221997 166 128 1�3 494�5 71�1 0�341998 236 132 1�8 539 72�7 0�441999 642 226 2�8 1015 75�5 0�632000 1312 414 3�2 1710�25 73�8 0�772001 888 297 3�0 1199�5 79�7 0�742002 361 133 2�7 608 74�1 0�592003 606 218 2�8 937 77�6 0�652004 399 142 2�8 486 73�5 0�822005 591 186 3�2 735 69�4 0�802006 778 217 3�6 766 81�9 1�022007 2295 539 4�3 2044 72�7 1�122008 1198 386 3�1 1460�5 76 0�822009 499 223 2�2 906�75 54�5 0�552010 35 56 0�6 144 63�6 0�242011 67 51 1�3 152�5 63�5 0�442012 386 141 2�7 522�75 70�8 0�742013 616 173 3�6 753�3 68�7 0�822014 1206 319 3�8 1299�45 74�6 0�932015 1383 362 3�8 1501�8 72�7 0�922016 1083 325 3�3 1021�55 60�7 1�06Mean 598 211 2�8 892 72�1 0�67
Mearns’ Quail Wing Barrel Data - Reported Data

Hunt Arizona 2017 173173 Hunt Arizona 2017
Predatory mammals as defined by A.R.S. 17-101 are coyotes, bobcats, foxes, and skunks. Bobcats are the only predator also classified as a furbearer with an ex-port tag required to ship a bobcat pelt out of state. There are no closed seasons or bag limits on any predator.
A word of caution: because of small sample sizes and vagaries in the sample frame of the hunt ques-tionnaires, caution should be used in interpreting the annual hunt harvest of both predators and furbearers. Most of these data are insufficient for making year-to-year comparisons, and are useful only in determining long-term harvest trends.
CoyotesArizona’s premier predator is also an important fur resource. Found throughout Arizona, the coyote is probably the state’s most familiar animal. Even where coyotes are not often seen, campers can hear their cho-ruses of howls, yelps, and barks on almost any night. The animal’s pointed ears, narrow nose, generally brown coat color, and black-tipped tail, which is usu-ally held downward, help differentiate coyotes from dogs and wolves. The head and body length of coyotes is about 2 to 3 feet with the tail add-ing another foot or so. Adult males are larger than females, the two sexes averaging about 21 and 17 pounds, respectively. A very large male may attain a weight of 35 pounds. Con-trary to popular belief, coyotes do not readily interbreed with either dogs or wolves.
Natural HistoryCoyotes are opportunists, feeding mainly on small mammals, but also on carrion, bird eggs, and vegetable matter such as manzanita and juniper berries. They also prey on pronghorn fawns, dead fish, and insects when
such items are available. In urban areas, garbage, do-mestic cats, and small dogs are sometimes taken.
Coyotes form strong pair bonds, usually breeding between mid-January and March 15. After a two-month gestation period, from one to several young are born in a den or burrow; the average litter size being about five pups. The pups are fed regurgitated food by both parents. They leave the den when about 8 to 10 weeks old.
A coyote’s home range may encompass up to 12 square miles during the spring and summer, with in-dividual animals roaming up to 100 miles or more. Besides the ever-present threat of starvation, coy-otes are also susceptible to diseases such as rabies and mange and human-caused mortality.
Hunting and Trapping HistoryThe hunter harvest of coyotes has been relatively stable during the past 10 years, about 13,000 hunters tak-ing an average of 40,000-50,000 coyotes a year. Most of these animals are taken by “varmint calling,” while hunting other game, or simply as opportunities arise.
Predators
Coyote
BOB
MIL
ES

174 Hunt Arizona 2017 Hunt Arizona 2017 174
Predators
Formerly, trappers rivaled hunters in the number of coyotes taken, but the reported take of trapped coyotes during the past 10 years has aver-aged only a little less than 1,000 a year—a far cry from the yearly harvests of 10,000 or more coyotes re-ported in the late 1970s. Although
some of this decline may be due to coyote population vagaries, the principal reason for this reduced take is un-doubtedly a decline in trapping effort.
BobcatsFound throughout the state in broken and brushy coun-try, the bobcat, sometimes called wildcat, while rarely seen, is Arizona’s most common wild feline. Usually an overall orange to gray in color with black markings, these medium-sized cats have a length of from 2 to 2.5
feet and weigh between 12 and 30 pounds. The under-parts are whitish, and small ear tufts are usually present.
The bobcat’s most distinguishing characteristic, how-ever, is its short, 5 inch tail, which is always less than 1/4 of the length of its head and body. This feature, coupled with the animal’s black spotting, can be used to distin-guish bobcats from any other feline in Arizona, wild or domestic.
Natural HistoryLittle is known about Arizona’s bobcats. Their principal prey are cottontail rabbits and jackrabbits, but they also take both smaller mammals such as pack rats and larger mammals including the young of some big game species. Snakes and lizards are also part of the bobcat’s diet.
Bobcats require two years to mature and attain breeding age. The breeding season in Arizona is poorly documented, but appears to be mostly in late winter or early spring. The gestation period is from 50 to 60 days so that the one to three young are usually born in spring or early summer. As in most cats, the female raises the kittens alone, nursing them for two months before teaching them to hunt on their own.
Hunting and Trapping HistoryHunters report harvesting on average 2,500 bobcats per year over the past 10 years. Most of these animals are taken by predator callers or while pursuing other game. This harvest appears relatively stable when compared
to the numbers of bobcats trapped and tagged for export. The average bobcat trapping har-vest over the past 10 years is 1,300. Five years ago the numbers of bobcats reportedly hunt-ed and trapped were about equal, and 15 years ago the number of bobcats trapped was as low as 100. However, in the 1980’s, the number of bobcats trapped was approximately 7 times that taken by hunters. In 1987, the number of bobcats trapped was reported to exceed 6,500, and more than 5,000 export tags were issued to trappers and fur dealers wanting to ship bobcat pelts out of state. Due to recent fluctuations in the international fur market, the numbers of bobcats trapped annually began increasing in 2008 but has declined since 2013 with less than 1,500 bobcats trapped in 2014.
FoxesThere are three species of foxes in Arizona–the red fox, kit fox, and gray fox. Of these, the 5- to 9-pound gray fox with its rust, black, and grizzled coloring and black longitudinally striped tail is by far the most common, occur-ring wherever there are mountains, wooded country, and broken terrain. The yellowish and
Coyote and bobcat distribution
Bobcat
BOB
MIL
ES

Hunt Arizona 2017 175
paler red fox is of similar size (2-foot head and body with a 12 to 16 inch tail) but is uncommon in Arizona, occurring only in the north-east portions of the state and mostly on the Navajo Reservation. It can be dif-ferentiated from other foxes by its white-tipped tail and black ears. The 15 to 20 inch long kit fox has large, out-sized ears, a 9- to 12-inch tail, and weighs less than 4 pounds. This diminutive fox is pale gray or buff in color, with a black-tipped tail. It is most often seen at night in valleys and on sandy plains in the southwestern deserts. For all three species, the sexes are similar in size and pelage.
Natural HistoryGray foxes are the most often seen fox in that they are the most numerous species and are often active during daylight hours. Although they favor brushy habitats, rock piles, and desert washes, they also climb trees and can be found in wooded areas. On the other hand, kit foxes prefer sandy areas, are almost exclusively noctur-nal, and spend much of the day underground.
Hunting and Trapping HistoryMore than 95 percent of the foxes taken and trapped in Arizona are undoubtedly the widely spread gray fox. Although kit foxes are remarkably easy to trap, their fur is of little value. Whatever the species, the annual take of about 7,000 foxes by predator callers and incidental
hunters has been relatively stable in recent years despite any pop-ulation changes due to rabies and other de-bilitating factors. Although the take by trappers once greatly ex-ceeded the total taken by hunt-ers, the average number of foxes trapped during
the past 10 years was far less than the harvest.
SkunksAt least four species of skunks are found in Arizona. All of the species have scent glands on either side of their anal sphincter which secrete a musk that gives them their malodorous reputation. This defensive re-action and their striking white on black color patterns are usually enough to deter all but the most determined predator. Omnivorous, mostly nocturnal foragers, skunks are highly susceptible to the rabies virus. In-deed, early Arizonans so associated rabies with skunks that some species were termed “hydrophobia cats.”
The most common of the species by far is the cat-sized striped skunk that occurs throughout Arizona and constitutes the vast majority of the road-killed mammals seen on the state’s highways. The striped skunk is not only Arizona’s most frequently seen skunk, it is also the largest. Weights range from about 2 pounds for an adult female to an occasional 10 pounds or more for an obese male. The species always displays a thin white stripe on its face, even though the striping pattern may vary between individuals and popula-tions. The usual markings, however, are two lateral stripes that form a chevron, merging toward the back of the head. The tail, which usually shows some white, is always shorter in length than the approximately foot-long body. Although “stripees” live almost everywhere but in the most extreme deserts, they are most often found near water. These skunks are active through-Kit fox distribution
BOB
MIL
ES
Gray fox

176 Hunt Arizona 2017
Predatorsout the year and do not hibernate even in north-ern Arizona; the males instead form communal dens with several females.
The close-ly related hooded skunk is the striped skunk’s Mexi-can counterpart. It is general-ly confined to southeastern Ari-zona, although specimens have
reportedly been taken as far north as Flagstaff and the Mogollon Rim. Somewhat leaner than the striped skunk, hooded skunks weigh from 1 to 2 pounds and have a 12 to 16 inch long body. As for all species of skunks found in Arizona, the males are larger than the females. The white stripes on this animal are often sol-idly joined to form one large white streak down the center of the back, or in some individuals, are so totally separated that the skunk appears nearly solid black. The hooded skunk also differs from the striped skunk in that its foot-long tail is longer than its body. Both animals have the thin white stripe on the face and have the same general preferences for riparian habitats.
There is no problem distinguishing the western spot-ted skunk, also known as the civet. The average length of this diminutive fellow, including the tail, is only about 15 inches. Females average less than a pound; males are about a pound and a half. This skunk is also faster and more agile than its larger cousins. The spot-ted skunk’s overall color is black with a white triangular patch on the forehead and a white spot under each ear. Five or six broken white stripes run down the neck, back, and sides, giving the impres-sion of blotches or spots, and the animal its name. The animal’s hair is finer than that of the other spe-cies, and the tail is tipped in white. Although report-ed from every county in Arizona, the spotted skunk appears to favor rocky, mountain-ous areas.
The large, 2-6 pound hog-nosed skunk is also easily identified by its entirely white back and tail and lack of any stripe on the forehead. Moreover, the elongated and slightly up-turned snout is largely naked, and the long claws on the feet are almost bear-like in appearance. This species occurs primarily in southeastern Arizo-na although specimens have been obtained from as far north as Flagstaff and the Hualapai Mountains.
Natural HistoryAll of the skunks are more or less omnivores, feeding
on grasshoppers and other insects, grubs, worms, mice, lizards, bulbs, carrion, and garbage. Some individu-als even take to raiding hen houses, taking not only the eggs, but chickens as well. Even the hog-nosed skunk, which digs for most of its food, will eat fruits and car-rion on occasion.
The striped, hooded, and hog-nosed skunks all mate in late winter and early spring, and produce from two to four young in April or May. The spotted skunk breeds in late Sep-tember and early October, but the fertilized egg re-mains in a state of arrested develop-ment until March or April when implantation oc-curs with the two to four young be-ing born about a month later. The young of all the skunk species are raised and on their own by early fall. Few skunks live more than a year or two.
Trapping HistoryFormerly a major furbearer, striped skunks in Arizona dropped in average take to fewer than 100 per year since 1995, but have increased in take since 2005. Current average take is 215. This is in some ways unfortunate, as uncontrolled populations of these animals are prone to rabies and constitute a health hazard to other car-nivores, as well as to humans. Although the amount is undoubtedly small, it would be interesting to know what percent of the number of skunks trapped constitutes spotted and hog-nosed skunks.
Gray fox, striped skunk, and spotted skunk distribution
Hooded skunk distribution
Hog-nosed skunk distribution

Hunt Arizona 2017 177
Furbearing mammals are defined as muskrats, rac-coons, otters, weasels, bobcats, beavers, badgers, and ringtails. Of these, only the bobcat is also considered a predator. All mammals not classified as game mam-mals, predators, or furbearers are considered “nongame mammals.” These include opossums, coatis, black-footed ferrets, Gunnison’s prairie dogs, black-tailed prairie dogs, wolves, jaguars, ocelots, and porcupines. Of these, only Gunnison’s prairie dogs and coatis may be taken during an open season, with the bag limit on coatis being one per calendar year. No season for the taking of jaguars, ocelots, wolves, or porcupines exists.
BeaverThere is no mistaking a beaver–no other Arizona ro-dent even comes close to weighing between 30 and 60 pounds and exceeding two feet in length. Moreover, the beaver is uniquely adapted to an aquatic existence with a flattened, naked, 9 to 10 inch long, oar-like tail, webbed hind feet, dense fur, and eyes positioned high on the head. Both sexes are similar in size and pos-sess pungent scent glands called “castors” on either side of their anus. Arizona specimens are typically a light
yellowish cinnamon color in contrast to the browner animals found in other states.
Beavers were at one time found nearly everywhere in Arizona that there was permanent water. With settlement, and the desiccation of the state’s streams, beaver populations declined. This habitat loss, and in some cases, heavy trapping pressure, caused beavers to disappear from such former strongholds as the San Pe-dro and Santa Cruz rivers. Introductions and natural colonizations have since enabled the beaver to recov-er much of its former distribution, if not numbers, and these animals can now be found along several perma-nent streams, some of the larger river stretches, certain shallow lakes, and even a few dirt-lined canals.
Natural HistoryThe beaver’s diet is almost exclusively plant material with the bark of cottonwoods, aspen, and willow trees being especially important. Other reported foods in-clude tamarisk or salt-cedar, mesquite, and the roots of such tuberous aquatic plants as cattail and bulrush. Even in those places where beavers are rarely seen, their activities are conspicuous–chiseled and felled trees, brush dams along small streams and backwa-ters, and stick houses or “lodges” constructed either as a separate residence or within the beaver dam itself. Even more common are “bank houses,” dens excavated in river or canal banks. Whatever its construction, the den will be located above the water line, lined with cattails and grasses, and will provide a nurs-ery area for the two to four “kits” or young beavers born in the spring.
Furbearers
Beaver distribution
GEO
RGE
AN
DRE
JKO
Coati

178 Hunt Arizona 2017
Furbearers
Trapping HistoryThe average annual number of beavers trapped greatly declined since 1991 and is now virtually insignificant. Even if the fur market recovers, this species will prob-ably never again be an important furbearer in Arizona due to the limitations on trapping and the limited areas of quality beaver habitat remaining.
MuskratA large water vole, this rodent is about a foot long with thick, silky fur and a naked, 8 to 11 inch tail flattened on the side. The sexes are similar in size and weigh from 2 to 4 pounds. Most muskrats in Arizona are rusty reddish brown in color; young animals are darker than the adults, some being nearly black. Although the muskrat is highly adapted to an aquatic existence, its hind feet, while comparatively large, are not webbed like those of a beaver’s.
Muskrats can be found along most of Arizo-na’s perennial rivers and per-manent marshes. Although they forsake most small streams, they can also be found along dirt-lined canals. Never particu-larly abundant other than lo-cally (e.g., Montezuma
Well and Peck’s Lake off of the Verde River), muskrats have disappeared from some areas (e.g., the San Pedro River) and invaded others.
Natural HistoryPrimarily a vegetarian, the muskrat feeds on aquatic grasses, pondweed, cattail roots, and the leaves of seep willows. Although many muskrats live in bank bur-rows, these animals also construct distinctive conical houses of shredded cattails and other marsh vegetation in quiet waters. These dens, which may serve as feed-ing areas, shelter areas, or nursery sites are all entered through submerged passageways. The nursery dens are the most elaborate, typically consisting of several chambers, some of which are lined with grass and soft vegetation.
Muskrats in Arizona are reported to breed during every month of the year, but most of the young are born
between March and October. The usual litter size is five or six.
Trapping HistoryMuskrats were never an important fur animal in Arizo-na, and the number trapped has been virtually nil since the late 1980s. Given the low state of the fur market and the limited distribution of this aquatic mammal, this status is likely to continue.
RaccoonThis medium sized carnivore is readily identified by its heavy-set body, grizzled brownish-gray appearance, black facial mask, and banded tail. The sexes are simi-lar and measure from about 1 feet to 2.3 feet in length with an 8 to 12 inch tail that is alternately ringed in light and dark. Weights range from about 12 to 35 pounds.
A relatively common animal along Arizona’s peren-nial streams, lakes, and reservoirs, raccoons can also be found near some of the larger stock tanks and in rural areas where permanent water is available. Although not often seen in the wild because of its nocturnal habits, the raccoon’s distinctive five-toed tracks are common-ly observed in mud around stock tanks and along river courses. These animals are adept climbers as well as swimmers.
Raccoons are omnivores, eating whatever food is available–aquatic insect larvae, beetle grubs, fish, frogs,
Muskrat distribution
PAT
O’B
RIEN
Raccoon

Hunt Arizona 2017 179
crayfish, wild fruits, and even carrion. In cer-tain areas, these animals can be a nuisance, not only raiding gar-bage cans, but also committing depre-dations on poultry houses, corn fields, and fruit trees. Nonetheless, rac-coon meat is considered edible by some people, and the animal is considered more a game species than a furbearer.
Natural HistoryRaccoons have been little studied in Arizona, and their life history here is not well documented. The two to five young are presumably born in spring in a den that may be located in a rocky crevice, brush-pile, or hollow tree. The young remain with the female until the fall when they are left to find their own way in the world.
Trapping and Hunt HistoryBoth pursued with dogs as game and trapped as a fur-bearer, the raccoon is one of only a few species in Arizona that can be legally taken with a firearm at night. Because of their limited distribution near water, “coons” have never been important fur-bearers, and an-nual harvests from trapping have rarely exceeded 1,000 pelts. With the decline in trapping activity over the past 10 years, this take has been reduced to only a few dozen raccoons a year. Al-though its nocturnal habits make for few incidental takings, the raccoon’s status as a game animal appears more stable. Hunt questionnaire data from general li-cense buyers indicate an annual harvest of another 1,200 animals a year. Most of this harvest is undoubtedly by hunters with hounds.
RingtailRingtails have long, slender bodies from 14 to 16 inches in length with bushy, equally long black and white band-ed tails. The fur is a soft grayish brown with black-tipped hairs. Both the ears
and eyes appear oversized, and the latter are outlined in white making them seem even larger. The legs are short, and the hind feet can be rotated 180 degrees like those of a tree squirrel, enabling the animal to descend vertical surfaces. Weights vary from 2 to 3 pounds, the males being slightly larger than the females. Primar-ily a night-time animal, ringtails can be extremely bold and unconcerned about the presence of humans. Calls consist of a repertoire of barks, chirps, growls, howls, and yips.
Ringtails are most common in the rocky regions of southern and western Arizona with the Grand Canyon being especially favored with the presence of these ani-mals. About the only areas devoid of ringtails are flat, alluvial valleys in that the animal prefers rocky hill-sides, canyons, rock-walled houses, and mine shafts.
Natural HistoryThe ringtail’s diet varies with the seasons but usually consists of small mammals, birds, lizards, and insects, as well as plant fruits, e.g., tomatillo berries. In farm areas, the ringtail may be an important predator on chickens and other poultry. Generally, four young are born in the spring.
Trapping HistoryNot having a particularly valuable pelt, the relative-ly easily trapped ringtail is most often trapped during times when fur prices and trapping activity are high. These animals can also be quite common, and in past years ringtails contributed substantially to the state’s fur harvest. The take in ringtails has dropped off sig-nificantly in recent years, however, and now consists of only a couple of dozen animals.
Raccoon and ringtail distribution
BOB
MIL
ES
Ringtail

180 Hunt Arizona 2017
Furbearers
OtterWonderfully adapted to an aquatic existence, the ot-ter’s elongated body terminates in a streamlined tail that tapers from a thick base to a pointed tip. Also contributing to the otter’s fusiform shape is its flat-
tened head and small ears, the openings of which can be closed at will. The legs too are short, and the hind feet are webbed to the toes. The color of the densely furred coat is a rich chocolate brown with whitish un-derparts. Adults generally weigh from 12 to 20 pounds with lengths ranging from about 3 feet to just over 4 feet. The otter’s webbed, rhomboid tracks are easily dis-tinguishable from the also webbed, but elongated hind tracks of the beaver.
Once found throughout the Salt, Verde, Little Colo-rado, and probably also the Gila, and Colorado river systems, this species is now confined to the Verde Riv-er and its major tributaries where it was reintroduced in the early 1980s.
Natural HistoryAlthough most otter activity is at night, hunting is by sight as well as touch, and clear streams appear to be favorite haunts. The otter’s usual fare is fish, water-birds, turtles, eggs, and crawfish, the latter now being the most conspicuous food item in their droppings.
The breeding season in Arizona is uncertain, but otters elsewhere usually breed in late winter or early spring. Mating usually occurs in the water. Pregnancy lasts about two months, but because of delayed implan-tation gestation may take up to a year. Dens are located
in natural shelters under rocks, logs, flood debris, or in river banks. Litter sizes vary, but usually consist of two or three pups. Weaning requires approximately three months, after which the young disperse.
Trapping and Hunt HistoryOtters were never numerous enough in Arizona to pro-vide an important fur resource, although old photos show these animals being trapped and otherwise taken for their pelts prior to 1930. Secondhand reports indi-cate that some otters may also have been killed as fish predators. Whatever its past status, this species is now completely protected in Arizona and has been for many years.
WeaselOnly one species of weasel occurs in Arizona–the long-tailed weasel, which is readily identified by its dark brown coat and orangish underparts. Some white is of-ten present on the head, and some animals may turn all white in winter. Male weasels are larger than the females, the animals ranging in length from 8 to 10 inches with the black-tipped tail adding another 4 to 6 inches. Weights range from 7 to 12 ounces for males and from 3 to 7 ounces for females. Voice is a high-pitched shriek.
Weasels in Arizona are largely restricted to high elevation wooded areas such as the Kaibab Plateau, Mogollon Rim, Chuska-Lukachukai mountains, and southern Arizona’s sky-islands.
Natural HistoryWeasels are voracious predators, taking cottontail rab-bits, hares, and rodents much larger than themselves. They also take birds, snakes, and lizards.
Weasels breed in midsummer, but, because of de-layed implantation, the four to eight young are not born
until the fol-lowing spring. Usually nests in old burrows or under rock piles and other debris.
Trapping HistoryThe number of weasels trapped in Arizona is very low, how-ever, due to the animal’s limited Otter distribution
BOB
MIL
ES
Otter
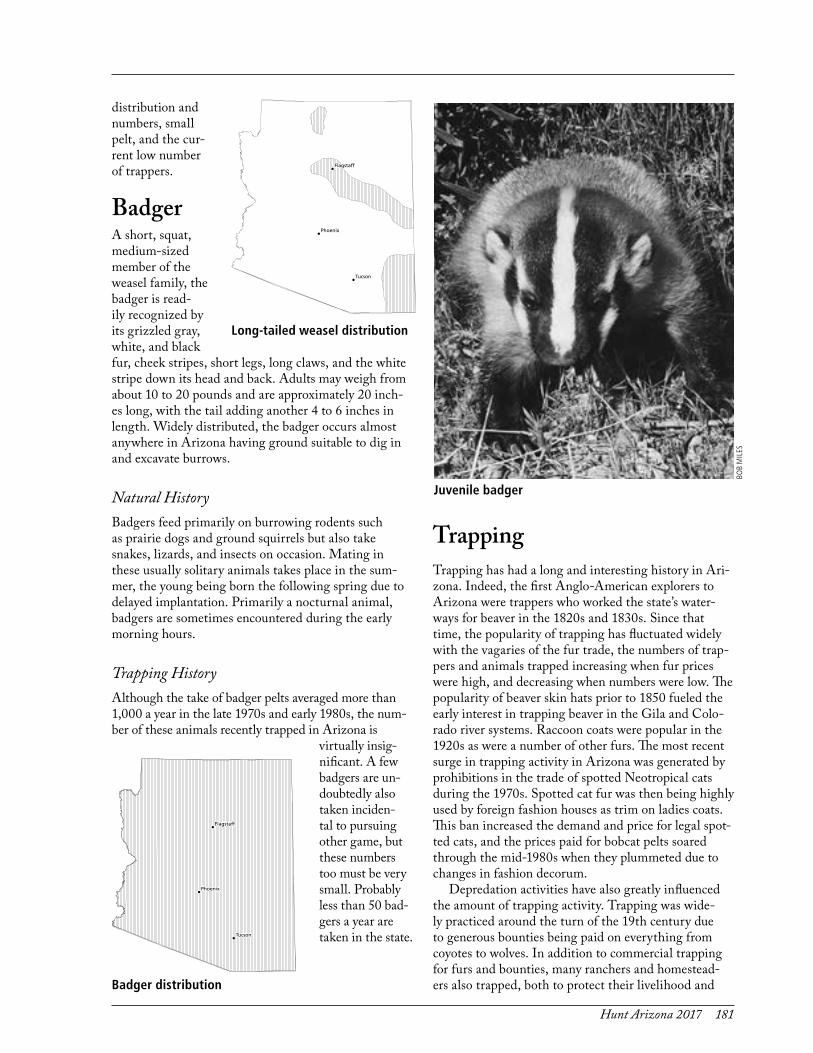
Hunt Arizona 2017 181
distribution and numbers, small pelt, and the cur-rent low number of trappers.
BadgerA short, squat, medium-sized member of the weasel family, the badger is read-ily recognized by its grizzled gray, white, and black fur, cheek stripes, short legs, long claws, and the white stripe down its head and back. Adults may weigh from about 10 to 20 pounds and are approximately 20 inch-es long, with the tail adding another 4 to 6 inches in length. Widely distributed, the badger occurs almost anywhere in Arizona having ground suitable to dig in and excavate burrows.
Natural HistoryBadgers feed primarily on burrowing rodents such as prairie dogs and ground squirrels but also take snakes, lizards, and insects on occasion. Mating in these usually solitary animals takes place in the sum-mer, the young being born the following spring due to delayed implantation. Primarily a nocturnal animal, badgers are sometimes encountered during the early morning hours.
Trapping HistoryAlthough the take of badger pelts averaged more than 1,000 a year in the late 1970s and early 1980s, the num-ber of these animals recently trapped in Arizona is
virtually insig-nificant. A few badgers are un-doubtedly also taken inciden-tal to pursuing other game, but these numbers too must be very small. Probably less than 50 bad-gers a year are taken in the state.
TrappingTrapping has had a long and interesting history in Ari-zona. Indeed, the first Anglo-American explorers to Arizona were trappers who worked the state’s water-ways for beaver in the 1820s and 1830s. Since that time, the popularity of trapping has fluctuated widely with the vagaries of the fur trade, the numbers of trap-pers and animals trapped increasing when fur prices were high, and decreasing when numbers were low. The popularity of beaver skin hats prior to 1850 fueled the early interest in trapping beaver in the Gila and Colo-rado river systems. Raccoon coats were popular in the 1920s as were a number of other furs. The most recent surge in trapping activity in Arizona was generated by prohibitions in the trade of spotted Neotropical cats during the 1970s. Spotted cat fur was then being highly used by foreign fashion houses as trim on ladies coats. This ban increased the demand and price for legal spot-ted cats, and the prices paid for bobcat pelts soared through the mid-1980s when they plummeted due to changes in fashion decorum.
Depredation activities have also greatly influenced the amount of trapping activity. Trapping was wide-ly practiced around the turn of the 19th century due to generous bounties being paid on everything from coyotes to wolves. In addition to commercial trapping for furs and bounties, many ranchers and homestead-ers also trapped, both to protect their livelihood and
Long-tailed weasel distribution
Badger distribution
BOB
MIL
ES
Juvenile badger

182 Hunt Arizona 2017
Furbearers
Year Hunters Hunter DaysHARVEST
Bobcats Coyotes Foxes Raccoons1981 13,004 96,598 1,212 24,877 3,231 01982 11,130 75,258 958 25,062 3,980 01983 11,342 71,954 817 19,780 1,361 01984 12,395 78,797 1,012 19,478 1,391 01985 13,835 85,793 655 26,933 1,555 01986 15,710 114,411 911 36,771 2,960 01987 11,442 82,558 1,011 24,527 1,896 01988 10,595 58,855 408 28,234 1,281 01989 10,558 99,284 676 27,876 1,664 01990 9,521 83,913 317 17,075 952 1,0791991 10,128 76,131 1,274 23,275 1,140 8051992 9,028 81,931 1,262 18,299 1,796 5341993 13,083 86,968 907 30,455 3,156 1,1011994 10,125 93,425q 880 22,378 1,395 2401995 13,910 93,425 791 30,350 2,337 2,2151996 13,997 119,052 547 37,929 3,516 2,9771997 12,279 106,681 3,235 33,469 8,134 3821998 11,134 68,727 630 19,231 2,306 9481999 14,535 100,626 1,463 45,781 4,934 2,3822000 15,385 101,679 1,539 42,526 7,028 9322001 13,570 132,768 1,538 33,589 5,587 1,1642002 10,489 68,404 1,484 22,054 2,239 1232003 12,365 93,589 3,257 46,253 5,566 2482004 13,346 104,243 4,076 35,354 4,272 1142005 19,263 120,712 1,769 46,716 5,014 592
2004 12,615 114,146 2,388 22,107 3,368 2452005 12,695 220,426 2,775 35,960 4,429 1182006 13,970 182,180 2,006 45,133 2,426 2152007 18,969 279,935 2,332 54,701 2,962 3,7812008 15,669 197,922 2,359 31,295 3,749 5902009 18,141 252,213 2,919 40,919 6,410 8012010 12,730 109,805 1,099 20,880 3,388 5492011 20,768 272,019 2,485 55,469 9,585 1,3312012 23,331 414,374 4,520 51,647 8,973 2,9912013 50,662 343,427 3,132 52,888 7,377 2092014 26,155 175,237 1,074 24,792 4,173 9092015 23,479 174,561 781 24,595 1,562 112
to help make ends meet. Nor was all of the trapping carried out in the private sector; both the federal Preda-tory and Rodent Control branch of the U. S. Biological Survey and the state Arizona Game and Fish Com-mission employed professional trappers after 1915, and the federal government continues to do so. One of the oddest situations occurred in the late 1940s and ear-ly 1950s when the price of pelts was low. Plagued by complaints of beaver damaging irrigation canals, the Arizona Game and Fish Department hired crews of beaver trappers to reduce the number of depredation complaints.
Generally speaking, fur prices and trapping activ-ity were high during the 1890s, and again during and shortly after World War I. After declining in the early 1920s, prices again rose in the mid-1920s before again
falling in the 1930s. Prices picked up again during World War II, but collapsed shortly afterward before reaching another bottom in the 1950s. Prices gradu-ally improved through the 1960s, and then accelerated in the early 1970s until the price of coyote and bob-cat pelts peaked in the late 1970s and early 1980s. Since that time, competition from highly realistic faux fur and the declining use of fur in the highly volatile fashion industry have lowered fur prices even further. Another severe blow to the trapping industry was re-ceived in 1994 when a public initiative was passed in Arizona banning the use of leg-hold steel traps on pub-lic lands. Although trapping is still legal on private lands, all of these events served to depress the trapping industry until there are now fewer than 250 licensed trappers in the state of Arizona.
Summary of Predator and Furbearer Hunter Harvest
The Small Game questionnaire was modified to collect unit specific data� Sample no longer weighted in analysis� The data is not comparable to historic data� In 2004 and 2005, the historic survey format and the new unit specific survey format were run simultaneously� Beginning in 2006, only the new unit specific survey format was used�

Hunt Arizona 2017 183
Predator and Furbearer Harvest Data
Summary of Trapping Numbers and Harvest Data For Predators and Furbearers 1
Trapping Year
No� of Licensed Trappers
No� of Trappers
TRAPPING HARVESTCoyote Bobcat Skunk Muskrat Ringtail Badger Raccoon Beaver Fox
1976-77 1,820 1,732 17,963 7,272 3,187 793 642 1,609 5,230 65 14,3341977-78 1,621 1,070 13,732 4,695 554 301 356 595 520 57 12,6481978-79 1,233 1,281 17,882 6,754 1,052 76 1,098 1,316 891 8 17,5851979-80 2,098 1,888 16,605 6,648 4,119 593 2,055 1,065 894 268 21,7801980-81 2,008 1,834 14,858 9,537 4,119 2,949 3,222 1,124 823 83 28,0591981-82 2,219 1,964 25,379 8,036 4,115 14 4,027 1,384 1,127 117 29,1241982-83 1,746 1,609 17,436 5,928 4,164 42 2,964 1,105 690 21 20,8561983-84 1,129 1,006 11,763 4,827 3,275 0 2,371 874 518 0 15,8571984-85 1,127 1,038 13,188 5,399 2,478 235 3,096 705 951 52 20,7761985-86 1,129 1,022 11,263 4,942 3,082 111 2,649 697 735 40 18,0651986-87 1,163 1,029 14,198 6,421 2,400 18 3,851 780 876 87 21,0001987-88 1,315 1,165 13,335 6,609 2,537 23 4,475 748 834 127 22,0091988-89 852 695 6,397 3,174 1,255 25 1,968 281 241 80 14,5161989-90 444 348 3,140 1,253 590 0 1,091 89 190 202 5,2101990-91 222 161 1,135 322 154 0 174 33 67 28 1,8071991-92 265 189 2,214 878 336 0 403 151 84 52 2,8641992-93 234 202 2,372 723 300 0 258 69 49 9 3,4451993-94 194 181 2,683 1,362 271 12 372 44 74 0 5,3121994-95 109 85 654 181 170 0 157 24 24 0 1,6471995-96 34 24 178 55 46 0 12 8 0 0 1441996-97 84 57 1,307 251 89 41 30 11 57 19 6481997-98 86 46 1,437 286 61 3 15 21 49 52 6851998-99 81 57 1,213 312 114 0 8 27 114 16 7981999-00 75 58 1,096 144 144 0 29 17 37 0 4702000-01 64 32 182 109 83 0 19 10 35 3 2402001-02 66 29 305 97 25 0 3 7 7 9 1432002-03 65 13 274 37 35 0 8 2 8 10 542003-04 122 58 635 267 97 0 31 25 23 3 3122004-05 140 82 710 432 72 0 12 70 21 9 4232005-06 122 76 820 742 119 0 17 33 25 13 4842006-07 140 83 670 957 188 1 35 26 19 10 7512007-08 133 94 806 944 123 0 49 41 169 22 1,0082008-09 192 113 707 1,124 268 0 33 35 14 5 1,1732009-10 154 77 345 438 142 0 30 14 36 10 5762010-11 214 161 593 1183 187 0 22 39 46 9 6732011-12 251 149 667 1366 357 0 31 38 60 2 8752012-13 392 267 905 2045 310 0 51 57 120 5 19322013-14 522 343 1278 2250 390 29 52 75 118 9 21512014-15 471 279 1083 1438 378 0 21 52 127 11 14972015-16 378 209 743 867 328 0 5 43 74 4 880
1 Not including Indian Reservations�

184 Hunt Arizona 2017
Natural History
Arizona’s waterfowl can be grouped into two general classes—ducks, geese, and coots that nest in the state, and those that merely winter here or migrate through. The number of waterfowl raised in Arizona each sum-mer, although few, is of great importance because these birds represent our state’s breeding stock. The much more abundant migrants, though present only for limited periods of time between August and March, constitute most of Arizona’s waterfowl harvest. Hunt regulations have been designed to accommodate both groups.
Arizona’s principal waterfowl nesting grounds are the natural and modified marshes found above the Mogollon Rim and in the White Mountains. Most of these marshlands depend on winter precipitation and snow-melt rather than groundwater, are more or less seasonal, and are mostly located above 7,000 feet elevation. Examples include Mormon Lake and Mar-shall Lake on the Coconino Plateau, and Basin Lake and Nelson Reservoir in the White Mountains. Farm ponds and other small wetlands in the southeastern and southern parts of the state can also be expected to
produce a few broods of Mexican ducks and black-bellied whistling ducks each year.
The principal duck spe-cies nesting in Arizona are mallards (especially in the White Mountains), pintails, cinnamon teal, redheads, and ruddy ducks. In addition to these “big five,” smaller numbers of gadwall, green-winged teal, blue-winged teal, and ring-necked ducks are produced in northern Ari-zona marshes. Even less common are the occa-sional pair of canvasbacks, shovelers, and American
widgeon. Most of the ducks that migrate through or winter in Arizona are from the Great Basin or “inter-mountain” states, with significant numbers of pintails and green-winged teal coming from the prairie states and provinces.
Arizona also hosts a few nesting Canada geese or honkers. These birds, which were introduced by the Arizona Game and Fish Department, are found pri-marily on shallow lakes east of the White Mountains between 6,000 and 7,500 feet elevation. Far more im-portant to hunters are the more than 15,000 Canada geese that make their winter home in Arizona. The great majority of these birds are referred to as the Rocky Mountain Population of Canada goose, which nest in the intermountain states. A large goose, the males or ganders typically weigh about 9.75 pounds, the females about 8.25 pounds. The vast majority of these geese, along with several hundred snow geese, winter along the lower Colorado River on Cibola, Havasu, and Im-perial National Wildlife Refuges, and in a few central Arizona locations such as Roosevelt Lake. A few white-fronted geese also pass through the state in September on their way to unknown wintering locales in Mexico.
The numbers of both nesting and wintering water-
Waterfowl
BOB
MIL
ES
Drakes
Hunt Arizona 2017 185
fowl in Arizona vary sporadically from year to year depending on the vagaries of win-ter precipitation in the Great Basin region. Wet years generally see an in-crease in waterfowl production, while drought years re-sult in fewer ducks being produced. A serious prob-
lem facing both nesting and migrating waterfowl is that our wetlands are increasingly difficult to manage for ducks and geese because of the limited occurrence of these habitats and the competing uses resulting from Arizona’s human population boom. Nesting water-fowl require protection from disturbance, and many former nesting sites are no longer productive due to the introduction of predatory game fish and summer-long recreational use. One bright note of late has been the creation of wetlands using treated sewage effluent. These “municipal marshlands” are primarily managed as waterfowl nesting and resting areas. Working in con-junction with the Arizona Game and Fish Department and U.S. Forest Service, cities such as Pinetop-Lake-side, Show Low, and Sedona have developed a number of these nutrient-rich and highly productive wetlands that are heavily used by waterfowl, as well as a variety of other wetland dependent species.
Hunt HistoryWhen Anglo-Americans first arrived in Arizona, they found migrating and wintering waterfowl concentrated along the state’s few major rivers. The lower Colorado and Gila rivers were especially noted as havens for wa-terfowl, with great clouds of the birds seen along the muddy banks by explorers, fur trappers, and steamboat passengers. Nor were nesting waterfowl in short supply; travelers across northern Arizona reported that they flushed a myriad of ducks in the shallow marshes on the San Francisco Plateau.
Unlike other states, early Arizona never experienced market hunting for waterfowl as a major enterprise. Prior to statehood, most duck shooting, when not for sport, was for personal subsistence. Settlers not only hunted waterfowl during spring, fall, and winter, they also gathered the ducks’ eggs in spring. Gradually, with the development of the state’s economies, this subsis-tence hunting gave way to sport-hunting, and irrigation ponds, canals and stock tanks became increasingly im-portant waterfowl hunting locales. By the time that
America entered World War I, waterfowling was one of the state’s most popular outdoor pastimes—one that even attracted the attention of Arizona’s often elected Governor George P. Hunt.
Being migratory birds, ducks and geese came under the protection of the federal government with the pas-sage of the 1918 Migratory Bird Treaty Act. Arizona, unlike a number of other states, did not challenge the federal jurisdiction over migratory birds, and, prior to the Treaty’s enactment, had even passed a number of protective measures for waterfowl. These included clos-ing the hunting season during the spring months and prohibiting the gathering of eggs from nesting birds. All through the 1920s, and even into the drought years of the 1930s, waterfowl hunting was as popular a sport in Arizona as quail or dove hunting, if for no other reason than one got so much more game meat for the number of shells expended.
The drought years of the 1930s were hard on Ameri-ca’s waterfowl populations, and it soon became apparent that nesting and other wetland habitats would have to be purchased and preserved if the public was to con-tinue hunting ducks and geese. In 1934, a federal law was passed requiring persons 16 years of age and older to purchase a “duck stamp” if they wanted to hunt wa-terfowl. Soon after, a program was initiated to create a series of national wildlife refuges, many of which were primarily for waterfowl. From the 1940s through the 1950s Arizona saw the creation of two national wa-terfowl refuges on the Colorado River—Imperial and Havasu—as well as the acquisition of state wildlife ar-eas such as Mittry Lake on the Colorado River, and Arlington and Robbins Butte on the middle Gila River. A number of waterfowl studies also started at this time, and banding investigations showed the value of manag-ing waterfowl by flyways, a concept that was formalized in the hunt regulations in 1948. As a result, Arizona is included in the Pacific Flyway, which includes the Great Basin states as well as those on the Pacific Coast.
Major hunting restrictions incurred during the past 50 years have included limiting the take of such species as canvasbacks and redheads, closing certain portions of refuges and management areas to provide undis-turbed resting and feeding places, and imposing the use of nontoxic steel shot rather than lead shot for the tak-ing of waterfowl. Recently, favorable habitat conditions and resulting waterfowl production throughout the United States and Canadian breeding grounds has led to liberal season lengths and bag limits; although, long-term declines of pintail and scaup have resulted in those species having bag limit restrictions.
The federal government, in conjunction with partici-pating states, coordinates three major waterfowl surveys each year. The first of these, which does not include Arizona, is the “Breeding Ground Survey,” which at-tempts to measure the coming year’s productivity by
Watershed

186 Hunt Arizona 2017
Waterfowl
estimating the number of nesting ducks present on the continent’s major nesting grounds in Alaska, Cana-da, and in the prairie states. The results of this survey are strongly linked to fall forecast flights of ducks and corresponding harvest frameworks. The “Winter Area Survey,” which does include Arizona, is also conduct-ed each year, and tallies the number of waterfowl using major wintering areas in the southern United States and Mexico. The number of birds counted on these sur-veys in Arizona has generally declined from the 1960s, when up to 42,000 ducks were observed in a given year, until the 1980s and ’90s when counts often tallied less than 10,000. Conversely, the total number of Canada geese observed has increased from around 7,500 birds in 1960 to an average of 20,000 geese throughout the 1980s and ’90s. The 1999 and 2000 survey revealed an increase in total ducks observed at about 35,000 with geese decreasing down to around 15,000 birds. The in-crease in ducks corresponds with the recent increase in the breeding ground surveys and the fall flight forecast.
The third survey is the annual hunt questionnaires sent to duck stamp purchasers requesting information on the number of ducks and geese bagged. Since 1979, to better evaluate the data obtained from this survey, Arizona has tried to maintain a standardized waterfowl season of approximately 100 days with a seven-bird bag limit (certain species excepted). As a result, Arizona’s waterfowl regulations do not greatly vary from year-to-year, and bag-limit regulations do not provide for bonus
(or penalty) points for taking certain species of water-fowl. The sample size of the state’s hunt questionnaire survey greatly improved in 1988 when waterfowl hunt-ers were required to purchase an Arizona waterfowl stamp in addition to a federal stamp.
The number of waterfowl hunters has fluctuated over the years, as much in response to duck stamp price in-creases as to any change in waterfowl numbers. Hunter numbers have been in a general downward trend since the mid-1980s, when more than 12,500 hunters took to the field, to the late 1990s when only about half that number participated. Recent estimates indicate that hunter numbers are again headed upward, and the long-term average of between 10,000 and 12,000 duck hunters a year may again be realized. Waterfowl hunting is nonetheless a resource-regulated sport, and Arizona’s limited wetland areas will never accommo-date high densities of hunters.
Annual waterfowl harvest figures are also sporadic. Estimates range from more than 150,000 ducks being harvested during the fall and winter of 1979-80, to less than 18,000 ducks being taken in 1990-91. The average annual take during the past three years has been about 45,000 birds. Goose harvests tend to be more predict-able, with hunters usually claiming between 2,000 and 4,000 Canada geese and a few snows each year.

Hunt Arizona 2017 187
Waterfowl Survey and Harvest Data
Summary of January Waterfowl Survey¹Year Ducks Mergansers Coots Canada Geese Snow Geese1950 27,455 No survey 19,255 7,375 1,2001951 10,965 1,350 4,780 5,155 1,1501952 33,320 1,545 12,155 4,210 1,3951953 25,050 1,335 22,060 3,050 1,4001954 19,665 1,810 41,725 3,515 1,9701955 27,115 965 8,570 2,860 9001956 24,950 995 25,480 2,860 3301957 44,455 610 31,840 3,640 2151958 20,565 1,985 20,385 3,770 2551959 34,700 1,795 24,055 5,865 3351960 42,220 2,775 17,615 6,046 4711961 27,100 4,395 19,055 5,526 5831962 24,465 4,185 19,065 5,940 5201963 22,260 4,145 40,625 6,650 8051964 21,370 4,967 27,752 7,142 5511965 21,304 3,298 15,900 4,431 2291966 32,342 12,963 53,962 5,744 2131967 19,425 3,980 12,278 3,602 1921968 40,091 4,127 27,706 4,370 2591969 11,020 4,854 9,839 3,052 5001970 17,880 7,301 16,674 3,135 2621971 19,212 3,552 15,649 3,502 2211972 23,123 2,584 17,194 4,241 7061973 19,684 4,682 12,935 4,745 5031974 19,785 2,661 24,305 5,357 5021975 9,828 1,775 17,831 2,534 2281976 2,280 1,000 2,800 3,545 01977 4,680 700 1,900 3,511 41978 3,451 32 1,850 4,339 01979 18,326 220 3,160 4,962 71980 29,240 2,110 4,265 13,992 61981 10,550 281 3,033 9,170 2,5001982 4,043 71 1,781 10,835 341983 5,176 202 1,026 13,373 2,5271984 9,450 581 816 16,831 8651985 7,306 830 162 17,619 1,4431986 12,189 3,204 510 23,042 2,6211987 9,623 2,321 1,337 14,131 1,1031988 3,330 1,108 797 23,930 2,2291989 6,317 298 1,409 22,594 1,3031990 4,617 1,061 1,117 26,974 2,8301991 7,114 1,894 1,135 31,897 4,4341992 4,724 1,108 808 18,733 1,2071993 7,961 826 143 22,596 1,2651994 7,605 364 603 22,607 1,6531995 11,933 881 1,051 21,078 2,9411996 10,019 330 1,209 15,326 1,9271997 9,776 220 2,356 18,598 1,3251998 35,0812 1,749 757 14,164 2,96519993 29,979 995 12,036 21,040 2,3522000 29,376 450 12,924 9,169 4462001 36,191 713 17,802 14,670 9762002 20,4984 53 22,053 11,250 9832003 22,489 220 9,517 13,351 2612004 25,895 219 not counted 7,777 34920055 48,186 443 43,185 14,921 1,250
1 In 2001, this summary was revised to include Waterfowl from Cibola, Havasu and Imperial National Wildlife Refuges�Refuge data was collected by Refuge personnel�
2 Resulting from excellent habitat condition�3 In 1999, the biologists conducting the survey changed; therefore, the observation
rate may have changed�4 Resulting from poor habitat conditions (drought)�5 Good late winter precipitation� Several lakes that had been nearly dry for years
(specifically, San Carlos Reservoir) had water�

188 Hunt Arizona 2017
Waterfowl Survey and Harvest Data
Year Ducks Mergansers Coots Canada Geese Snow Geese2006 16,974 633 12,727 13,849 9112007 16,626 329 16,680 17,578 6032008 18,360 292 30,973 7,695 7502009 13,865 339 9,338 10,619 7262010 20,276 109 25,516 7,936 1,4092011 20,694 210 6,514 5,949 1,4702012 10,319 332 4,009 3,059 1,2192013 11,101 209 780 1,031 0 2014 Surveys no longer performed2015 Surveys no longer performed
1 In 2001, this summary was revised to include Waterfowl from Cibola, Havasu and Imperial National Wildlife Refuges�Refuge data was collected by Refuge personnel�
2 Resulting from excellent habitat condition�3 In 1999, the biologists conducting the survey changed; therefore, the observation
rate may have changed�4 Resulting from poor habitat conditions (drought)�5 Good late winter precipitation� Several lakes that had been nearly dry for years
(specifically, San Carlos Reservoir) had water�
Summary of January Waterfowl Survey¹ (continued)
Year Stamps Issued Hunters Hunter DaysHARVEST
Ducks Geese 1981-82 10,904 57,184 81,091 5,1691982-83 10,995 46,356 61,733 3,7141983-84 8,438 39,470 46,820 3,3571984-85 11,636 63,366 109,279 4,3001985-86 12,508 64,508 79,653 4,9941986-87 12,750 76,502 114,753 6,2611987-881 8,299 7,139 53,425 87,400 5,2431988-89 7,104 5,101 33,683 34,662 4,0541989-90 6,750 3,455 20,606 23,576 2,2731990-91 6,292 2,513 16,324 17,683 2,2191991-92 5,264 3,062 19,885 19,703 1,9361992-93 5,383 3,389 22,464 23,241 3,6311993-94 5,371 3,701 23,286 22,907 2,7231994-95 5,107 4,138 30,041 35,971 3,0091995-96 6,598 5,228 34,187 41,390 3,1841996-97 6,908 5,513 35,784 41,603 3,2471997-98 6,957 5,387 36,433 47,363 2,7961998-99 7,951 5,964 42,853 61,685 2,9111999-00 8,521 6,455 39,861 51,028 6,2752000-01 9,019 5,677 44,431 48,788 4,5042001-02 7,733 3,821 28,534 33,950 4,1832002-03 6,775 4,885 35,146 35,128 2,8592003-04 6,733 4,804 32,810 37,211 2,9692004-05 6,334 4,459 31,373 35,421 3,0512005-06 6,519 4,658 30,736 42,450 2,6252006-07 6,776 4,001 28,107 42,771 1,9962007-08 7,071 4,630 33,020 49,782 2,4312008-09 5,580 3,775 30,305 37,494 1,666
Waterfowl data is now obtained from the Harvest Information Program conducted by the U�S� Fish and Wildlife Service� The data is not comparable to that obtained from Arizona’s questionnaire�
2009-10 5,682 3,400 18,800 37,1002 5,3003
2010-11 6,000 3,400 18,200 38,5002 1,8003
2011-12 6,733 4,400 29,600 38,3002 3,7003
2012-13 6,623 3,100 18,200 51,0002 1,6003
2013-144 ---- 4,700 23,200 68,2002 2,7003
2014-154 ---- 3,000 14,100 25,6002 2,3002
2015-16 ----- 2,298 10,300 21,6032 2,4003
1 State waterfowl stamp implemented�2 Confidence intervals on duck harvest from the Harvest Information Program: 2009-10 +/-19%; 2010-11 +/-20%;
2011-12 +/- 56%; 2012-13 +/- 23%; 2013-14 +/- 22%; 2015-14 +/- 15%003 Confidence intervals on goose harvest from the Harvest Information Program: 2009-10 +/-46%; 2010-11 +/-13%;
2011-12 +/- 56%; 2012-13 +/- 35%; 2013-14 +/- 62%; 2014-15 +/- 62%, 2015-2016 +/- 46%4 Stamps now include migratory birds, e�g�, dove and band-tailed pigeon, so numbers are no longer comparable�
Summary of Arizona Waterfowl Harvest

Hunt Arizona 2017 189
Natural HistoryPortions of three distinct populations of sandhill cranes winter in Arizona. Cranes from both the Rocky Moun-tain (RM) and Mid-Continent (M-C) populations winter in the Sulphur Springs and Gila River val-leys in southeastern Arizona. Other sandhills from the
Lower Colorado River Valley (LCRV) population win-ter along the lower Colorado River, primarily on the Colorado River Indian Reservation, Cibola National Wildlife Refuge, and below Gillespie Dam on the Gila River. RM cranes nest primarily in Idaho, Montana, Wyoming, and Utah, while cranes from the LCRV population mostly nest in northeastern Nevada. The
Sandhill Crane (Grus canadensis)
BOB
MIL
ES

190 Hunt Arizona 2017
Sandhill Crane
nesting range of the M-C population includes much of Canada and Alaska. Birds from this latter population pass through the central plains before staging on the Platte River where they continue on to their wintering grounds in Texas, Oklahoma, New Mexico, Arizona, and Mexico.
Wintering areas selected by sandhill cranes fea-ture shallow-water roosting sites with low or sparse vegetation including playa lakes and sandbars along shallow, braided river channels. Another requirement is the close proximity of harvested fields of grain, such as corn and milo. High-energy grains are needed to maintain the birds in sufficient condition to make their return migration in mid-to-late February.
Cranes leave their roosting areas in early morning, usually about sunrise, to fly to feeding areas where they typically spend from three to four hours eating. Dur-ing midday the cranes return to the roost, or go to a nearby loafing area, which is commonly a grassland or wetland. In the late afternoon, cranes sometimes revisit their feeding area before returning to their nighttime roosts.
Sandhill cranes in the western United States nest in high elevation shallow marshes and wet meadows. Adult pairs do not nest until they are at least four or five years old, and typically have very poor success the first year or two. Cranes commonly lay two eggs, but only about one-third of the successful nesters are able to raise two young or “colts.” In dry years, when wet-lands shrink, predators, especially coyotes, take a heavy toll on the flightless young. During recent dry years the proportion of young-of-the-year birds in the fall population has been around four percent. Even in good production years, young-of-the-year birds rarely com-prise more than 12 percent of the fall population.
Depending on habitat conditions, sandhills begin congregating in local agricultural areas, called pre-mi-
gration staging sites, in late Au-gust. Migration to wintering areas be-gins in September, the birds typical-ly migrating in a few, high-altitude flights to tradition-al stopover areas. For cranes of the three populations that winter in Ari-zona, the major stopovers are the
Platte River in Nebraska for the M-C, San Luis Valley in Colorado for the RM, and wetlands near Lund, Nevada, for the LCRV. Cranes begin arriving on their wintering areas between late September and mid-October.
Hunt HistoryA generally uncommon species in Arizona, sand-hill cranes are protected by the Migratory Bird Treaty Act of 1918. In the early 1970s, however, counts of around 1,000 cranes wintering in Sulphur Springs Val-ley prompted concern that these birds might eventually cause crop damage. By 1980 more than 4,000 cranes were being tallied, and a limited hunt of 100 permits was authorized in 1981. This hunt was gradually ex-panded as crane numbers continued to increase and fears that the birds would winter elsewhere subsided. As of 2009, more than 390 permits were being autho-rized and census figures showed a wintering population between 30,000-40,000 sandhill cranes in Sulphur Springs Valley.
Sandhill crane distribution

Hunt Arizona 2017 191
Sandhill Crane Harvest Data
Summary of Sandhill Crane Harvest
YearMid-Winter
Survey1
Permits Authorized
Total Applicants
Permits Issued2
Hunters Afield
Hunter Days
Percent Harvest
Hunter Success
Draw Odds3
1981 4,350 100 234 100 55 119 42 49 42�71982 5,640 100 279 100 55 95 73 78 35�81983 8,550 100 356 100 77 152 55 55 28�11984 8,350 100 239 104 72 110 69 74 41�81985 11,500 150 436 150 121 234 92 46 34�41986 11,450 150 239 150 124 217 138 69 62�81987 11,070 300 378 300 212 406 193 57 79�71988 6,670 300 505 300 228 446 207 58 59�41989 11,730 300 451 300 219 473 158 47 66�51990 11,990 165 512 165 139 275 123 53 32�31991 10,000 300 326 296 255 517 216 54 92�01992 2,4704 300 342 300 258 532 176 48 87�71993 12,740 300 381 300 217 401 174 50 78�71994 9,210 300 390 300 227 464 113 32 76�91995 24,190 270 390 270 211 423 157 48 69�21996 12,500 315 443 315 256 521 141 38 71�11997 21,050 315 389 315 235 430 193 47 81�019985 24,616 310 440 321 232 450 151 40 72�91999 21,650 310 456 309 242 518 113 33 68�02000 21,131 310 383 305 218 389 203 57 80�92001 22,928 310 356 310 235 468 180 52 87�12002 21,327 310 349 310 253 489 239 58 88�82003 31,443 310 397 306 248 497 189 48 77�12004 29,208 325 367 311 263 319 192 59 84�72005 30,570 365 333 333 261 548 277 66 95�82006 28,156 365 353 353 222 559 180 55 97�42007 36,823 365 295 309 254 442 311 72 99�32008 29,103 375 368 318 261 485 162 48 84�52009 41,149 390 356 217 299 628 387 61 84�52010 30,415 399 370 373 312 690 309 48 95�42011 35,530 390 392 357 312 664 185 42 90�32012 29,633 410 352 399 343 734 366 55 100�12013 28,777 340 402 316 269 560 176 42 78�62014 20,832 340 359 306 266 519 223 48 85�22015 32,411 400 383 362 386 810 379 51 90�02016 23,497 535 413 413 386 804 449 57 100�0
1 The Mid-Winter Survey occurs in December and January� The survey conducted in December 2011 and January 2012 is labeled 2011� The data listed is only for the Willcox Playa and surrounding areas�
2 Permits Issued includes any tags via the draw and first-come, first-serve�3 Draw Odds is the number of permits issued through the draw divided by total applicants in the draw�4 Poor survey conditions�5 As of 1998, Sandhill crane check stations will be conducted every 3rd year (2011, 2014, 2017)� Data will be based on the hunter
questionnaire results unless a check station is conducted; then, harvest numbers will be taken from the check station results� Reminder questionnaires were sent if necessary�

Hunt Arizona 2017 197
The Migratory Bird Treaty Act protects all birds except rock doves, European starlings, house sparrows, and all other non-native species. However, the federal gov-ernment permits the states to open a season on certain birds and waterfowl. Mammals that are not classified as big or small game, predators, or furbearers are consid-ered nongame and are managed by the Arizona Game and Fish Commission as “other mammals.” Many of these mammals can be hunted by licensed individuals throughout the calendar year, with notable exceptions presented below. While there are no bag limits on most of these species, most nongame mammals are not hunt-ed. As a result, harvest data for these species are not available.
BirdsPigeon (Rock Dove)Pigeons are closely associated with human devel-opments including towns, parks, and agricultural landscapes. In their native settings, they nest along the seashore on airy cliffs and in rocky crevices or caves. In urban areas, they commonly nest on high-rise build-ings, billboards, bridges and other structures. They average 12.5 inches in length. The coloration is highly variable, the most common being a dark gray head and neck with green and purplish iridescence on the neck, a back of lighter gray, and a whitish rump. The tail has a black band and the wings two black bars. The call is a soft coo familiar to most homeowners.
Natural History and StatusPigeons nest year round in Arizona, building messy nests of sticks and roots. Nests are often placed under an overhang of some sort such as under eaves or bridg-es. The eggs are white. The species can raise four or five broods of one or two young in a single year. As with other pigeons, both sexes feed the young regurgitated “crop milk” exclusively for the first few days. After ap-proximately five days, the young begin eating seeds and
are soon eating the adult diet of grains and sometimes greens and insects. During the nonbreeding season, pi-geons form large roosting and feeding flocks. Pigeons were introduced from Eurasia in the late 1800s and
have become established throughout the United States.
House (English) SparrowHouse sparrows are common residents of cities and farms statewide. These brownish, conical-billed spar-rows are approximately 5 inches in length. The males sport black bibs and beaks, white cheeks, blue-gray caps, chestnut napes, and black-streaked backs. Fe-males are slightly smaller and less distinctive, with grayish, pale underparts, light-buff eye streaks, and striped backs. The house sparrow’s lively calls and songs consist of chirps and cheeps that are familiar to almost every homeowner.
Natural History and StatusHouse sparrows nest from February through early sum-mer, often having three broods per year. The nests, which may contain four to seven white to bluish colored eggs with gray or brown markings, are messy, woven affairs that may be located in eaves, palm fronds, bird
Other Birds and Mammals
GEO
RGE
AN
DRE
JKO
House (English) Sparrow

198 Hunt Arizona 2017
Other Birds and Mammals
houses, or most any other suitable site. House sparrows will nest in cavities and aggressively compete with na-tive species for nest sites. When they are not nesting, house sparrows commonly form flocks of up to a dozen or more birds. Highly adaptable, they feed on a wide variety of seeds, fruits, and insects. This resourceful bird greedily accepts almost any human handout and are commonly encountered foraging for morsels at fast-food restaurants.
House sparrows were introduced to Arizona from Europe via railroad cars from the East, and have been breeding residents since at least the early 1900s. They arrived in Tucson in 1903-04, had reached Winslow, Holbrook, and other railroad towns by 1909, and were widespread throughout the state by 1915. Despite its lack of protection, the species remains widely distribut-ed, wherever humans and agricultural fields are found.
European Starling (Starling)European Starlings are found in a wide variety of habitats, but are most numerous in or near human set-tlements that provide open, grassy areas for foraging and trees or structures for nesting. This dark, 8-inch, meadowlark-sized bird is a common resident of city parks, residential areas and agricultural lands below 7,500 feet elevation. Although usually found in urban, suburban and agricultural settings, starlings are also found in the desert, usually near small towns or dwell-ings. Starlings can be differentiated from other black birds by their short tails, robust build, narrow and light-colored bills, and short, pointed, brown wings. Both sexes are iridescent black in summer, and heavily speckled in winter. Starlings eat a varied diet includ-ing insects, fruits and seeds. When feeding, they walk, rather than hop, from site to site. Their principal call is a guttural squeak, although they also mimic other birdcalls.
Natural History and StatusEuropean starlings reside in Arizo-na year-round and can initiate breed-ing activities as early as mid-January in warm areas of the state. Most breed-ing activity occurs from April to July, but nesting has been reported into early fall. Starlings take up residence in cavi-
ties such as woodpecker holes in saguaros or trees. Like the house sparrow, starlings are considered a pest spe-cies because they compete for nest sites with native species such as purple martins, woodpeckers and blue-birds. European Starlings will even evict nesting birds and destroy their eggs. Starlings typically lay four to six blue eggs and can raise two or three broods each year. When the species is not nesting, they form large com-munal roosts, which may contain hundreds of birds A more recent arrival than the house sparrow, European starlings were first recorded in Arizona in 1946 near Lupton, with the first nest reported near Glendale in 1954. The species is now both a breeding resident and a migrant in the vicinities of Phoenix, Tucson, Kingman, Yuma, and other Arizona cities and towns.
Peach-faced LovebirdIn Africa, peach-faced lovebirds prefer dry, open coun-try including wooded savannas, palm groves, and arid mountain slopes. In Arizona, they are primarily found among the ornamental plantings in desert urban and residential settings. Although locally established in and around the greater Phoenix metropolitan area, they do not venture into the surrounding desert lands. They are small, bright green, parrot-like birds with a pink-ish face and light-colored bill. Regular visitors to many backyard water and feeding stations, they have also been observed feeding on cactus fruit, apples, palm fruit, and seed pods.
Natural History and StatusLike many other parrots, peach-faced lovebirds are cav-ity nesters and will take up residence in woodpecker holes in saguaros, under tile roof openings, and in un-trimmed palm fronds. Lovebirds nest in groups and thus far there has been no evidence that they compete with native birds for nest sites. In Arizona, most nest-ing occurs from April through May. They will lay from three to eight eggs per clutch, possibly rearing two broods per year. The first free-ranging flock of peach-faced lovebirds in the Phoenix area was reported in 1987 near the border of Mesa and Apache Junction, and by the mid-1990s local flocks and colonies of love-birds were discovered throughout the eastern half of the greater Phoenix metropolitan area.
American Crow (Crow)In Arizona, American crows are far outnumbered by their larger and more heat-tolerant relative: the com-mon raven. Crows occur as local breeding residents in the more open areas of the Mogollon Rim, along the South Rim of the Grand Canyon, in the higher por-tions of the Navajo Indian Reservation, and along the
GEO
RGE
AN
DRE
JKO
European starling

Hunt Arizona 2017 199
San Francisco River. This shiny, all black 1.5-foot-long bird can be differentiated from the larger raven by its smaller beak and tail, smoother plumage, and distinc-tive “caw” call. Also unlike ravens, crows rarely soar, but instead flap their wings when flying directly from point to point. Because of crop depredations, an open season on this species is authorized from September 1 through December 31.
Natural History and StatusAmerican crows are native to North America and reach their highest densities in the northeastern United States. They form large communal roosts during much of the year, sometimes in groups large enough to be problematic in towns or industrial areas. During the breeding season, however, the species is most often ob-served in smaller family units. They typically place their nests in well-hidden areas of their nest trees, gener-ally close to the trunk. Nests are made of dead sticks, bark, corn stalks, twine, and cow dung, and lined with soft materials. Crows lay from three to nine bluish-green eggs marked with brown speckles. They feed on a variety of foods including insects, carrion, small mam-
mals and birds, bird eggs and grains, including some agricultural crops. Numbers have probably increased significantly since European settlement because of ag-ricultural developments and timber clearing. Human developments have also enabled breeding range expan-sions into portions of the West and Midwest.
MammalsCoatiThis relative of the raccoon is usually seen individual-ly or in small bands called “troops.” The lone males or “solos” may weigh up to 12 pounds, and greatly exceed the smaller 5.5- to 7-pound females in size. From 2.5 to just over 4 feet in length, coatis are approximately the size of a small dog. They range in color from ochre to cinnamon brown to nearly chocolate. Their most distinctive characteristics, however, are their clown-marked faces and faintly banded, tapered tails that commonly exceed 2 feet in length, giving coatis the su-perficial appearance of monkeys.
Natural History and StatusAlso known as chulos, coatis are semi-arboreal animals rarely found far from trees. Like tree squirrels, coatis have jointed hind feet, allowing the animals to descend the trunks of trees headfirst. These largely diurnal mam-mals are found primarily in mountains and canyons in the southeastern quarter of the state. Their principal habitats are Madrean oak-pine wood-land and riparian deciduous forest. Highly omnivorous, their principal foods are lizards, insect larvae, bird eggs, acorns, fruits, and other mast.
Troops of coatis, which may range in size from one or two to up to 40 animals, are typically composed of fe-males, sub-adults, and weaned young of the year. Males leave the troop when about 2 years old, after which they associate with the females only during the spring breeding season. Nursing females leave the troop for four to six weeks after giving birth. From one to six young are born in June or July. Born helpless in a den or hollow tree, the youngsters remain with their mother until old enough to forage with the troop in the fall.
BOB
MIL
ES
Black-tailed prairie dog
200 Hunt Arizona 2017
Other Birds and Mammals
Coati numbers fluctuate markedly, and at least two major population declines have been reported for Ari-zona. Recently, however, they appear to be expanding their range northward and are now common in such places as Aravaipa Canyon and the Sierra Ancha, where they were unheard of prior to 1970. Current hunt management authorizes a seven-month season, and a bag limit of one coati per calendar year.
Gunnison’s Prairie DogPrairie dogs are robust, diurnal ground squirrels that live in underground colonies called “dogtowns.” Their tails are relatively short, less than 25 percent of the body length. The animals get their name from their doglike barks, which warn the colony of intruders. Male Gunnison’s prairie dogs are just over a foot long, with 2-inch, grayish to white-tipped tails. Adult males weigh about 1.75 pounds and females less than 1.5 pounds. Male and female are similar in appearance, both a pale buff in color. The species is now largely re-stricted to Great Basin grasslands above the Mogollon Rim, although colonies formerly extended south and east of Prescott to the Dewey and Dugas areas, as well as to the San Carlos Indian Reservation.
Natural History and StatusGunnison’s prairie dog colonies tend to be small, and usually contain fewer than 50 animals. Their burrow entrances are not typically built up into craters, unlike those of black-tailed prairie dogs. Gunnison’s prairie dogs enter torpor below ground during winter months, and breed in February-March. The three to four pups typically appear in June. Grasses, forbs, and sedges are the usual dietary items.
Black-tailed Prairie DogSlightly larger than the Gunnison’s prairie dog, this 15-inch-long rodent is yellowish tan in color with a usually dusky-tipped 3-inch tail. Male black-tailed prairie dogs average about 2 pounds; the females about 1.9 pounds. Unlike those of Gunnison’s, the entrances to the burrows of black-tailed prairie dogs often have cratered mounds that can reach up to 3 feet in height. The underground burrow network may be extensive, and black-tailed prairie dog colonies were often large, especially those in the San Pedro and Sulphur Springs valleys
Natural History and StatusBlack-tailed prairie dogs are active all year, and will come out on sunny days even in midwinter. The species breeds in late February; the young are born in March
and appear in May. Dietary items include grass stems, grass roots, and shrubs.
Black-tailed prairie dogs formerly occurred in the semidesert grasslands of southeastern Arizona south of the Gila River, westward to the vicinity of Fort Hua-chuca. They have been extirpated in Arizona since 1959, although a small colony on the Day Ranch 15 miles southeast of Duncan on the Arizona-New Mexico bor-der persisted until 1974. An attempt to reintroduce this animal to the Appleton Research Ranch (near Sonoita) in the summer of 1974 failed. The species has recently been protected in Arizona, in the hope that individuals from three colonies in Sonora within five miles of the United States-Mexico border might recolonize our state.
Specially Protected MammalsThe following mammals are protected at all times be-cause they are endangered species, resemble endangered species, or are otherwise deemed in need of protection due to low numbers or vulnerability.
BatsArizona, with 28 species of bats belonging to four fam-ilies (ghost-faced, leaf-nosed, vesper, and free-tailed), has one of the most diverse bat faunas of any state. Ranging in abundance from the American free-tailed bat, which numbers in the millions, to the seldom-seen ghost-faced bat, Arizona’s bats are highly beneficial. They feed on insects and find their prey by emitting and receiving sonic waves—a process similar to sonar and known as echolocation. Each species has its own high-pitched call, some of which can be heard by hu-man ears. Our largest bat species, the western mastiff bat, is about 7 inches long and has a wingspan of up to 18 inches. The western pipestrelle, at only 2.5-3 inches long is Arizona’s smallest bat. Some species, such as the spotted bat with its death’s-head markings and huge ears, are bizarre in appearance.
Natural History and StatusAlthough nearly all of Arizona’s bats are insectivores, two, the lesser long-nosed bat and the Mexican long-tongued, feed on nectar and pollen. Some species, such as the red bat, are generally solitary, but most roost in colonies, selecting as their daytime retreat a particu-lar cavern, rock fissure, or mine tunnel. Most bats are migratory, although a few over-winter by hibernating. To reduce competition, the various species use different habitats and feeding strategies. Pallid bats, for example, typically feed low to the ground; the western mastiff

Hunt Arizona 2017 201
bat tends to hunt high over water or in the tree canopy. It is also an unfortunate fact that bats transmit rabies, with the result that they expose dozens of people a year to this potentially deadly virus.
All bats are protected in Arizona due to their gener-ally beneficial nature and the rarity of certain species. Colonial roost sites may also be protected, and certain caves have been declared “off-limits” because of their value to these intriguing flying mammals.
Black-footed FerretThis uniquely North American mammal has always been extremely rare in Arizona, with only four speci-mens ever collected in the state. Until a reintroduction program began in 1996, the last ferret reported in Ari-zona was in 1931 when bubonic plague and rodent control programs killed off the ferret’s prairie dog prey. The black-footed ferret is a low slung, weasel-like ani-mal less than 2 feet in length, with sooty black feet. The overall color is a yellow-buff, the face has a distinc-tive black mask, and the approximately 5-inch tail is tipped in black. Males are significantly larger than fe-males, weighing about 2.25 pounds to the female’s 1.5 pounds.
Natural History and StatusFerrets are almost exclusively restricted to prairie dog colonies, which provide most of the animal’s food. The
ferret is primarily a nocturnal species. It breeds dur-ing mid-March or April, and after a gestation of 45 or so days give birth to from two to five young. The kits remain in a nest underground with their mother for 40 days or more and do not disperse to forage on their own until September, attaining breeding maturity at one year of age. The presence of ferrets can be detected by their tracks and diggings, which consist of 4-inch-deep trenches and lengthy piles of soil adjacent to prairie dog holes. Federally designated an endangered species in 1967, black-footed ferrets are the focus of an Arizona Game and Fish Department program to reintroduce captive-reared animals in Aubrey Valley. Although the project is still relatively young, some animals have al-ready reproduced in the wild.
Hualapai Mexican VoleVoles or meadow mice are dark brown, short-tailed (<1.5”) terrestrial rodents with short fur and small, rounded ears. The sexes are nearly identical in pelage and size. The Mexican vole, to which this race belongs, is widely distributed at higher elevations, with popula-tions found in the White Mountains, the San Francisco Peaks, along the Mogollon Rim, and in such isolated ranges as the Sierra Ancha, Bradshaw Mountains, Na-vajo Mountain, and Hualapai Mountains. The latter population, and possibly those on the Hualapai In-dian Reservation to the north, has been described as a separate subspecies due to its isolation. The identifying
characters of this so-called Hualapai vole are not well defined, but are based on its having a smaller relative size, longer hind feet, and more cinnamon under-parts than its closest neighbors.
Natural History and StatusThis 1.25-inch-long ro-dent prefers dry, grassy meadows and canyons in proximity to pon-derosa pines, Gambel’s oaks, pinyon-juniper woodlands, and chap-arral. As with most rodents, numbers may fluctuate from rare to abundant. Not as prolific as some oth-er rodents, their litter
GEO
RGE
AN
DRE
JKO
Townsend’s big-eared bat

202 Hunt Arizona 2017
Other Birds and Mammals
sizes vary from one to four and average about 2.5. This isolated population of Mexican voles is protected as a Federally endangered species.
JaguarMore than 50 of these large, spotted cats have been documented from Arizona since 1900. Although there are some early records of what appear to be young jag-uars, almost all of the animals taken or photographed after 1950 have been wandering males from Sonora, Mexico. The last recorded female in Arizona was taken in 1962.
Borderland jaguars tend to be small when compared to those in South America. The males average from about 125 to 160 pounds; the females are smaller, av-eraging about 110 pounds—approximately the same as mountain lions. Adult jaguars stand about 2.25 feet to 2.5 feet tall at the shoulder. The males average about 7 feet in length and the females about 6 feet. The tail is relatively short, about 17 to 30 inches and less than half of the length of the head and body. Dorsal colors range from a pale yellow-buff to a golden orange. The black spots on the head and shoulders are relatively small, transforming to a complicated series of bars, splotch-es and broken rings or rosettes on the back, flanks, feet and tail. Underneath, the jaguar varies from a very pale gray to snow white with black markings. Although appearing garish in the open, jaguars are in fact won-derfully concealed in the dappled shadows of their wooded and scrubland habitats.
The only New World “roaring cat,” jaguars call to each other by emitting a series of hoarse, rasping grunts.
Natural History and StatusAlthough jaguars have been recorded as far north as the Grand Canyon, most have been recovered or photographed in the borderland mountains in the southeastern quarter of the state. Found primarily in tropical thornscrub and deciduous forest in Mex-ico, most Arizona jaguars have been encountered in Madrean evergreen woodlands and scrub-invaded semidesert grassland. Several jaguars have been taken in proximity to water, and several have been taken in montane conifer forests, at least one above 9,000 feet elevation.
Jaguars hunt mostly at twilight and at night, seek-ing a wide variety of prey. Prey items in Arizona have ranged from frogs to elk, but white-tailed deer, javelina, and coatis appear to be the most important natural prey. Livestock is taken when available, especially calves.
Female jaguars reach sexual maturity at about 2.5 years. For biological and social reasons, most males do not breed until age 3 to 4. The breeding season in
the Southwest borderlands appears to be in January or February, the young being born in spring after a 100-day gestation period. The one or two cubs are weaned at about 22 weeks, but female offspring may remain with the mother for more than a year. The average life span of Sonoran jaguars is thought to be less than 10 years due to the scarcity of game and their persecution as stock-killers. Jaguars have been protected in Arizo-na by state law since 1969, and U.S. populations were declared an endangered species in 1997. Prior to this time, jaguars have at various times been considered as furbearers, predators, or nongame mammals. The De-partment is engaged in a Conservation Team working to conserve jaguars of the Arizona-New Mexico-Mexi-co borderlands.
JaguarundiThese low slung, 10- to 20-pound felines require dense tropical vegetation and are usually found near wa-ter. The animal’s head and ears appear small for a cat, and the 1- to 2-foot tail is less than the body length. Two color phases of these uniformly colored cats oc-cur—cinnamon and charcoal gray. Largely terrestrial, jaguarundis take to trees only when pursued by dogs, at which time they can display much arboreal agility. More diurnal than other wild felids, jaguarundis usu-ally occur alone or in pairs. The species also emits a whistlelike call on occasion.
Natural History and StatusJaguarundis feed on small mammals, such as cotton rats, as well as a variety of birds, lizards, and snakes. The breeding season varies with locality, but the gesta-tion period is from 60 to 70 days after which from one to four kittens are born.
This species has never been documented as occur-ring in our state, or even southward in Sonora, Mexico. Jaguarundis have been protected here since 1972, on the basis of visual reports and the possibility that this animal might occur in Arizona. The species is included here only because it remains federally listed in Arizona.
OcelotThese 18 to 22-pound felines are residents of south-eastern Arizona, mainly in the Sky Islands of the Coronado National Forest. Their background color is a grayish or brownish orange color with black stripes and dots. Solitary and terrestrial, the “gato galavis,” as the species is known in Sonora, is largely nocturnal in its habits. Averaging about 22 pounds, male ocelots are slightly larger than the 19.5 pounds for the average fe-male. The head and body length is approximately 3 to 3.5 feet, with the tail providing another 13 to 14 inches.

Hunt Arizona 2017 203
Natural History and Status Multiple observations of male ocelots dispersing
from Sonora, Mexico have occurred since the turn of the century. In Arizona, they have been documented as far north as Globe, Arizona and west to the mountains near Interstate 19. The life history of the gato galavis in Sonora remains largely uninvestigated, but the litter size in other ocelot populations is one or two. The kit-tens’ eyes are shut for 2.5 weeks and they remain with their mother for 18 to 20 months. Most ocelots do not reach breeding maturity until 2 years old or more.
Ocelots feed mostly on terrestrial mammals, such as cottontails, but reptiles are also taken. Adults may have a home range of 3,000 acres or more. Ocelots have been protected in Arizona since 1969. Any change in the species’ status is therefore difficult to ascertain, as any ocelots taken by trappers and/or predator control agents are unlikely to be reported.
Otter (see Furbearers)
PorcupineThese large, bulky rodents are unmistakable. The large head, long spines intermixed with equally long or lon-ger blackish, brownish, and yellowish hair, and heavy claws make for instant identification. The males are bigger than the females, but the females have longer
tails. Overall, the animal’s total length is about 2.5 feet, of which approximately 8 inches constitutes the tail. Weights range from 7.75 to 40 pounds depending on the porcupine’s age and condition.
Natural History and StatusPossessed of poor vision but with a good sense of smell, porcupines are active mainly at night. Habitats oc-cupied include forested mountains, riparian forests, meadows, semidesert grasslands and even deserts. Dur-ing the winter months, porcupines may feed almost exclusively on the inner bark of pine trees, although the bark of cottonwoods, mesquites, and ocotillos is also taken. Porcupines lose weight when feeding only on in-ner-bark, however, and also eat mistletoe, acorns, fungi, cactus fruit, and other mast when available. During the summer months, the species feeds on the ground and is frequently seen in mountain meadows feeding on grass-es and sedges. Porcupines are fond of salt and will gnaw ax handles and other objects having this mineral.
Solitary animals, porcupines den in hollow trees and burrows as well as in rocky outcrops and mine shafts, often using the same den site year after year.
Females mature in 1 year, males in 2.5. Mating takes place in September and October, often in a tree, and is usually accompanied by highly vocal grunts, squeals, and shrieks. The males are very aggressive at this time and will fight any other males they happen to come upon. Gestation is seven months and the single off-spring is born in late April or early May. The youngster,
weighing about a pound, is highly developed and well able to care for itself, stay-ing with the mother only through its first summer. Probably because of their slow-paced life style, porcu-pines can live up to 9 years of age—a relatively long time for a rodent.
Although totally protected in Arizona, por-cupines were unprotected for many years due to the damage inflicted on both mature ponderosa pines and pine seedlings, as evi-denced by the trees’ girdled trunks and white areas of peeled bark. As recent-ly as the 1950s, hunters were encouraged to kill any porcupines encountered. Densities of porcupines appear to vary with time,
GEO
RGE
AN
DRE
JKO
Porcupine

204 Hunt Arizona 2017
Other Birds and Mammals
however, and the species now appears much reduced in comparison to numbers reported earlier. Nonetheless, porcupines may still cause problems locally and require relocation to other areas.
Gray WolfThe Mexican wolf is the rarest, southern-most occur-ring, and most genetically distinct subspecies of all the North American gray wolves, which was listed under the Endangered Species Act as an endangered sub-species (Canis lupus baileyi) in 1976. Mexican wolves historically inhabited montane woodlands and ad-jacent grasslands in northern Mexico, New Mexico, Arizona, and the Trans-Pecos region of western Texas at elevations of 4,000-5,000 ft. where native ungu-late prey species were numerous. By the early 1970s, the Mexican wolf was considered extirpated from its historical range in the southwestern United States and no Mexican wolves were known to exist in the wild in the United States or Mexico from 1980 until the be-ginning of the Mexican wolf Reintroduction Project in 1998. Southwestern wolves stand about 30 inches high at the shoulder, and differ from the much smaller (less than 35 pounds) coyotes by having heavier, deeper chests, larger broader heads, shorter, thicker muzzles,
larger nose pads, and a thicker neck that shows a ruff or mane when the animal’s hackles are raised. Wolves also have long, slender forelegs and a dark-tipped tail. Coat color varies with season and individuals, some animals being so light as to be nearly white and others so dark as to appear almost black. The usual pelage, however, is a grizzled mixture of grays, browns, blacks, and whites on backs and flanks. Adults are about 4.5 to 5.5 feet long, with 14 to 17 inch tails. The males are about 10 pounds heavier than the fe-males, weighing between 65 and 85 pounds, versus the female’s 55 to 80 pounds.
Perhaps the wolf ’s most distinctive trademark is its mournful howl, which is usually given in late fall and early winter, and which once heard, is never forgotten.
Natural History and StatusWolves are mostly active at night and hunt by trailing and running their prey to ground. Their preferred habitats are rolling woodlands, level forests, open
meadows, and grasslands. Wolves historically fed on deer, elk, pronghorn, cottontails, and mice but readily adapted to taking sheep and cattle when livestock were introduced to Arizona.
For behavioral as well as biological reasons, wolves do not usually reach sexual maturity until they are about 2.5 years old. The breeding season in Arizona is between November and mid-February, and the ges-tation period is 63 days. Den sites are selected by the female, and may consist of an enlarged burrow, hol-low log, or a natural crevice. Four to eight sooty-brown pups are born in the spring and nursed for six to eight weeks. They are cared for by both parents. Although they are weaned in late fall, when they are 2.5 to 3 months old, the young wolves, especially the females, may remain with the parents for another year or so be-fore dispersing.
Wolves are social animals, but packs in Arizona have historically been small, usually consisting of from one or two to seven animals. Wolves can have very large home ranges and travel long distances in search of food and mates. Mexican wolves were reintroduced to the wild in 1998 in Arizona and New Mexico as a nonessential ex-perimental population pursuant to section 10(j) of the Endangered Species Act. A binational captive-breed-
BOB
MIL
ES
Mexican gray wolf

Hunt Arizona 2017 205
ing program between the United States and Mexico was initiated in the late 1970s with the capture of the last remaining Mexican wolves in the wild. The estab-lishment and success of the captive breeding program prevented absolute extinction of the Mexican wolf and, by producing surplus animals, provided a source of Mexican wolves for reintroduction in the wild. All Mexican wolves alive today originated from three lin-eages (Ghost Ranch, 24 Aragon and McBride) and the breeding of these “founding” Mexican wolves and generations of their offspring has produced a captive population approaching 250 wolves in 52 facilities in the United States and Mexico.
A total of 13 captive-bred Mexican wolves were ini-tially released in 1998 into a portion of the Blue Range Wolf Recovery Area (BRWRA), which is part of a larger Mexican Wolf Experimental Population Area (MWEPA) that has been established as the foot-print for the Mexican wolf reintroduction project. The BRWRA serves as the primary Mexican wolf occu-pancy area and is comprised of the Apache and Gila National Forests in Arizona and New Mexico, and is surrounded by the larger MWEPA that extends across Arizona and New Mexico between Interstate Highway 10 to the south and Interstate Highway 40 to the north. Under the 1998 nonessential experimental popula-tion rule, wolves are allowed to be released and disperse within the BRWRA. Mexican wolves entering the MWEPA (leaving the BRWRA) are subject to capture and relocation into the BRWRA. In the seven years from 1998 through 2004 a total of 87 Mexican wolves were initially released from captivity into the wild, with the number of initial releases declining in subsequent years (2007-2013) due, in part, to the wild popula-tion demonstrating natural growth through wild-born wolves. The 2013 year-end population count reflected a minimum estimated population of 83 Mexican wolves in Arizona and New Mexico with the population being entirely comprised of wild-born wolves.
Other Birds and Mammals

Arizona Wildlife Views is filled with stunning photography and informative articles on hunting, fishing, boating and other outdoor recreation opportunities plus in-depth coverage of important wildlife issues� Subscribe today to Arizona’s premier wildlife magazine and begin to enjoy the benefits of the best in outdoor information!
1 YEAR • 6 BIG ISSUES40 FULL-COLOR PAGESONLY $8.50
SUBSCRIBE TODAY!
The official wildlife magazine of the Arizona Game and Fish Department published for outdoor enthusiasts!
Arizona Wildlife Views Magazine
• Wildlife News: Biweekly news about conservation, recreation, department news, and upcoming activities for the public�
• Fishing Report: Weekly updates on fishing conditions around the state�
• Hunting Highlights: Bimonthly news about hunting techniques, outlooks, where to go, and youth/family participation�
• Shooting Sports News: Updates on pistol, rifle, shotgun and archery target shooting and shooting range activities�
• Urban Fishing Bulletin: Biweekly updates on fishing opportunities at urban lakes�
• Endangered Species Updates: News on issues pertaining to conservation of at-risk wildlife�
• Working for Wildlife: Updates to keep the public informed on efforts to secure funding to meet future wildlife conservation needs�
• OHV: Periodic updates for OHV enthusiasts about the Arizona Game and Fish Department’s off-highway vehicle program�
• EdNews: Updates on wildlife education resources for educators, youth group leaders and students�
Send no money now. We’ll bill you later. CALL 1-800-777-0015
SIGN UP FOR FREE Arizona Game and Fish Department e-newsThe Arizona Game and Fish Department wants to communicate with you! Our electronic information newsletters provide you with the latest news and information on wildlife issues and events, outdoor tips, education programs, regulations and more� Just provide us with your e-mail address and this information will come directly to you, free of charge�
SIGN UP TODAY!www.azgfd.gov/signup
To sign up for any of our products, visit www�azgfd�gov/signup and select the e-mail newsletters you would like to receive:

Game Management Unit Map

©2017
Arizona Game and Fish Department5000 W. Carefree Highway • Phoenix, Arizona 85086 • (602) 942-3000
www.azgfd.gov