human resources: annual report - who · human resources management. strategic human resources...
TRANSCRIPT
EXECUTIVE BOARD EB132/38 132nd session 30 November 2012 Provisional agenda item 14.3
Human resources: annual report
Report by the Secretariat
From this year onwards the reports on progress and achievements and on the staffing and “non-1.staff”1 profiles will be grouped together in a single report. The final report, containing all achievements and updated data as at 31 December 2012, will be presented for consideration by the Sixty-sixth World Health Assembly in May 2013.
PROGRESS AND ACHIEVEMENTS
This first section presents information on activities undertaken so far in 2012 in the area of 2.human resources management.
Strategic human resources management
The Department of Human Resources Management continues to contribute to the process of 3.WHO reform for a healthy future by moving ahead with changes to human resources practices designed to increase the effectiveness of WHO’s work. During the past year, road map reviews have been conducted in a number of clusters in order to better align their essential functions with the strategic reform, including in respect of human resources priorities. The reviews were followed by a corresponding reprofiling of the existing functions, with the staff concerned matched to new positions in the resulting structure. Reassignment and separations mainly affected staff at headquarters and in the African Region. Extensive career transition support was offered to all staff concerned; this took the form of clinics for writing curricula vitae, networking workshops and individual sessions. Some 150 staff members availed themselves of such individual support services in-house, with 20 staff participating, in addition, in the services provided by an external company that specializes in career transition.
In the course of 2012, the WHO Global Reassignment Committee has dealt with some 52 cases, 4.involving international staff from all parts of the Organization. Of these, 44% concerned country and regional offices (with the majority ‒ 33% of all cases ‒ coming from the African Region); and 56% involved headquarters. Thirty-seven of these cases were brought forward from 2011, while 15 new cases have arisen to date during 2012. By the end of September 2012 all but 7 cases had been concluded. Over the same period, the Headquarters Reassignment Committee dealt with some 32 cases, 28 of which were carried over from 2011 and 4 cases that were new. With one exception, all of these cases have now been concluded.
1 Those employed by WHO on non-staff individual contracts are engaged within the following arrangements and job categories: Special Services Agreements, Consultants, Agreements for Performance of Work and Junior Professional Officers.
EB132/38
2
In a direct response to the major financial constraints that it has experienced since 2010, the 5.Organization has continued to look critically at its strategic and programmatic objectives in order to align them with the reduced financial resources available. Major restructuring activities have been undertaken across the Organization, with a particular focus on headquarters and the African Region. Table A below shows the changes in the numbers of staff in the Secretariat between 31 December 2010 and 31 July 2012, according to major office and contract type (long term or temporary). Overall, the Organization’s staffing level was reduced by 937 people holding either long-term or temporary contracts during this period, i.e. a reduction of 11.3% across major offices. For headquarters, the number of staff declined by 491 (-19.3%), while for the African Region, the staffing level was reduced by 304 (-11.5%). The remaining reductions were implemented in the other regions.
Table A. A comparison of WHO staff numbers between 31 December 2010 and 31 July 2012
Contract type/office 31 December 2010
31 July 2012
Difference of staff numbers between 31 December 2010
and 31 July 2012
Difference (%)
Long-term staff 7 154 6 559 -595 -8.3
By office Headquartersa 2 168 1 827 -341 -15.7
African Region 2 498 2 241 -257 -10.3
Region of the Americas 155 160 5 3.2
South-East Asia Region 548 541 -7 -1.3
European Region 540 514 -26 -4.8
Eastern Mediterranean Region 684 733 49 7.2
Western Pacific Region 561 543 -18 -3.2
Temporary staff 1 119 777 -342 -30.6
By office Headquarters 381 231 -150 -39.4
African Region 135 88 -47 -34.8
Region of the Americas 21 11 -10 -47.6
South-East Asia Region 214 189 -25 -11.7
European Region 55 39 -16 -29.1
Eastern Mediterranean Region 220 122 -98 -44.5
Western Pacific Region 93 97 4 4.3
Total 8 273 7 336 -937 -11.3 a Including Special programmes and collaborative arrangements.
This has allowed the Organization to record a reduction in its payroll costs of 6.around US$ 7 million per month since March 2012 – an overall saving of 8.5%. For the period 2011‒2012, it is expected that staffing costs will be brought into line with predicted available financial resources. At the time of this report, the restructuring effort is still under way for certain programmes; however, the exercises concerned should have been completed by the end of the biennium. Naturally, the Organization will continue to adapt to changing programmatic and financial imperatives. However, in the immediate future these are not expected to require adjustments on the scale seen during the present biennium.
EB132/38
3
Selection and recruitment
The Secretariat continues to use the Global Roster in order to apply standardized assessment 7.procedures to the selection and recruitment of heads of WHO offices in countries, territories and areas. A similar roster is in preparation for Administrative Officers.
Since its introduction on 1 April 2010, the Global Roster for Heads of WHO Country Offices 8.has enabled over 90 vacancies to be advertised to prequalified staff. A review and evaluation of the Roster, and of the assessment process itself, are currently under way and the results will be submitted to the Global Policy Group before the end of 2012. An Administrative Officer roster, designed to fill vacancies between grades P.2 and P.4, was advertised and attracted about 560 applicants. However, a significant number of positions in this category have been abolished in the regions, reducing the pool of available positions. Before taking any decision on deployment, it was agreed to review the roster towards the end of 2012. In addition, WHO has set up an agreement with the Global Outbreak Alert and Response Network, whereby experts within the Network can be called upon and deployed urgently in response to outbreaks. For humanitarian crises, WHO is seeking to formalize agreements with donor countries and national institutions for the rapid deployment of personnel during emergencies.
Mobility and rotation
In 2010, the Global Policy Group approved in principle a global mobility policy and process for 9.WHO. Now, as part of the reform agenda, the Secretariat has been asked to promote mobility across the entire Organization. The staff of the Organization are vital for the success of this effort and their input and opinions are being sought through a consultative approach. This has included participation in a global questionnaire to examine how mobility could be made an integral part of careers at WHO. Further consultation is also taking place with focus groups, and individual interviews are being carried out to gain a deeper understanding of motivation and concerns of staff members with regard to mobility. A final report will be presented to senior management in late 2012. The Western Pacific Region’s mobility scheme, introduced in 2010, has now been adopted by three additional regions: the African Region; the South-East Asia Region; and the Eastern Mediterranean Region, where it is in its first cycle.
Outreach and diversity
WHO regularly participates in career fairs and similar public information events, and briefs 10.selected visiting groups of students and public health specialists on career opportunities in the Organization. Special focus is given to events and groups whose participants have the potential to further advance WHO’s diversity goals. The Organization continues to increase its visibility by using social media for outreach as these now clearly represent the most common communication channel in use by the under 40s.
In the first part of 2012, WHO provided learning opportunities to about 500 interns of 11.76 different nationalities; 72% of the interns were female. Through this programme WHO is providing an opportunity to talented students to gain professional experience, with the Organization benefitting from the interns’ skills and fresh academic knowledge. At the same time, WHO is able to increase its outreach on a global scale and thus develop an excellent source for new talent.
The current downsizing exercise has also had an impact on WHO’s diversity targets, and the 12.percentage of women in the professional and higher categories has dropped slightly. The recent exercise affected headquarters proportionally more than other offices. The exercise, as such, was strictly gender neutral. However, since the representation of women in this category is traditionally
EB132/38
4
higher at headquarters than elsewhere in the Organization, the relatively higher level of post abolitions at headquarters had a negative effect on the overall number of female staff. Nevertheless, global geographical diversity has not been significantly affected by the downsizing exercise.
Organizational development
With effect from 1 August 2011, WHO introduced the revised classification standard for 13.positions in the general service category, as promulgated by the International Civil Service Commission for use in the United Nations Common System. The new General Service Master Standard significantly reduces the number of factors that must be taken into consideration when establishing the grade level, bringing them down from 13 to four. As a consequence, related processes have been greatly simplified.
The new Master Standard is supported by an online tool that has been introduced throughout the 14.Organization by means of a series of training courses delivered at headquarters and in the regions.
In line with WHO’s continuous effort to further streamline administrative procedures, a revised 15.position description template that is compatible with the new requirements has been developed in the Global Management System. The number of administrative steps required to create and classify a position, which totalled 29 in 2004, has been reduced to six. If required urgently, a position can be created and classified within the same day, allowing significant savings in time to be made for all classification-related processes.
The Secretariat is continuing its focus on the use of more generic position descriptions across 16.the Organization as an important element in the wider use of global rosters and the promotion of mobility. These generic descriptions outline the typical functions found within WHO in the most commonly held positions, taking into account the context and environment.
Managing and developing staff
Building a high performance culture. As part of the Secretariat’s pursuit of an organizational 17.culture change, three initiatives have been undertaken. A pilot project on performance management and development was completed in July 2012. The output of the project included recommendations for the Global Staff/Management Council on strengthening performance management and staff development. In addition, two draft policies have been elaborated, one to recognize and reward excellence and the other to improve performance. The two draft policies draw on qualitative research carried out across the Organization and good human resources management practice. Introduction of the policies is planned for 2014.
Learning activities in support of best practice in performance management and development 18.have been carried out for executive management, supervisors and staff in the following major offices: the Regional Office for South-East Asia, the Regional Office for Europe, headquarters and the Global Service Centre. Complementary distance learning modules, accessible to staff across the Organization, are under development.
The report on global staff development and learning, covering the biennium 2010‒2011, was 19.issued in May 2012 and shared with the members of the Global Learning Committee. The report indicates that during the biennium the Organization invested US$ 23 million on staff development and that over 21 000 places worldwide were taken up by WHO staff members on learning activities coordinated by the staff development network. The report shows that 85% of staff development funds allocated for the biennium were implemented globally through the various learning programmes
EB132/38
5
offered. Staff development funds for the biennium 2012‒2013 were released to all major offices on the basis of the learning proposals submitted.
The range of global development opportunities has been expanded. In line with the proposed 20.WHO reforms, priority has been given to country-level activities (e.g. global induction for newly appointed heads of WHO country offices) and to a greater use of e-learning. Highlights of these efforts include the following global programmes:
• e-learning induction tool for new staff (“New@WHO”)
• Professional administrative learning programme
• “Writing effectively for WHO”, a distance learning course
• Training on the Global Management System in order to prepare regional offices and headquarters for the new version of the global System that is due to be launched worldwide in April 2013
• Global distance language training programme (a provider has been contracted to start offering the programme worldwide as of September 2012).
In the last few months, the Organization has multiplied its efforts and increased its investment 21.in e-learning technologies. This can be seen, in particular, in the plan to create WHO’s first management system for global learning: a global catalogue of online and face-to-face learning content and a staff development administrative tool with extended reporting functionalities across all offices.
In preparing to support the system, the Organization has worked with other United Nations 22.agencies and bodies (such as FAO, UNHCR and the secretariat of the United Nations Framework Convention on Climate Change) in order to identify the most suitable platform. A global pilot project was launched in May 2012 and extended until the end of 2012. WHO is currently working on the contract with a planned launch of the Global Learning Management platform in early 2013.
In parallel, WHO joined Open ECBCheck in May 2012. Open ECBCheck is an accreditation 23.and quality improvement scheme that measures the success of e-learning programmes and allows for continuous improvement through self-assessment, peer collaboration and benchmarking. This accreditation will help WHO meet the highest quality standards in creating online learning materials and courses.
Policy and compensation
In line with the objectives of the WHO reform process, the Secretariat reviewed the 24.Organization’s polices with a view to providing mechanisms for flexibility in the use of existing contractual arrangements, in line with the priority needs and funding constraints of the Organization. This work included the development of guidelines on the use of the existing contractual arrangements concerning non-staff categories of personnel in order to provide management with a user-friendly tool and options when hiring human resources. It is expected that the guidelines will facilitate programme delivery by spelling out the administrative processes to be followed for each category of contract and activity. In October 2012, the Department of Human Resources Management presented proposals on human resources reform, including changes in appointment policies, to the Global Staff/Management Committee. Following this, further consultations were held with staff and management.
EB132/38
6
The relevant provisions of the WHO e-Manual have been given added flexibility in order to 25.facilitate the mobility of locally recruited staff members within their national boundaries. This change, made at the request of regional offices, is intended to promote mobility and career management, while facilitating programme delivery in difficult areas of certain large countries.
WHO e-Manual provisions have also been updated as part of continuing efforts to harmonize 26.the Organization’s business practices with those of the United Nations common system. This work has included the alignment of provisions for repatriation grants and of those for payment of lump sums in respect of travel for rest and recuperation. It has also included the introduction of “danger pay” in place of “hazard pay”.
Work is being done in collaboration with the IT team to enhance the capacity of the Global 27.Management System to retrieve data on the exact location of staff. The objective is to ensure that the Organization can protect its staff following a security incident and that it can report accurately on WHO’s field presence.
A global policy on study leave has been developed, and guidelines created, in collaboration with 28.all regions. Under the policy, staff members may apply for study leave in line with the principle, agreed across the Organization, that all staff members should devote 5% of individual staff time to learning. In addition, in specific cases, special leave of absence may be granted for training or research. The policy and guidelines have been made available on the WHO e-Manual, together with a checklist, a flowchart and standard operating procedures, in order to support staff members worldwide.
Administration of justice
The Secretariat has been working to improve the efficiency of the internal justice system. 29.Internal consultations, which have included the Staff Association at headquarters, have generated several proposals, formulated with a view to increasing efficiency while retaining quality. In addition, the Secretariat has maintained its commitment to strengthening the informal means available for reviewing administrative actions and decisions. This has proved to be a useful tool for resolving certain types of dispute or appeal, while potential shortcomings identified in rules and procedures have been categorized as areas to be tackled. The Department of Human Resources Management continues to represent the Organization in the formal appeals procedure.
Work has continued on the development of an online training course to enable WHO and 30.UNAIDS staff to meet evolving ethical challenges.
Service excellence
In line with the objectives of the new financial control framework, the Secretariat is continuing 31.extensive work on expanding and improving the human resources standard operating procedures. The aim of this effort is to ensure: (i) that the human resources implementation procedures of the Global Service Centre have been fully incorporated; and (ii) that there is cohesion between administrative areas. At the same time, work is being undertaken to identify risks and mitigate them. It is expected that some 85 human resources standard operating procedures will be available by the end of 2012.
New tools for management and staff members have been implemented in the Global 32.Management System in order to facilitate compliance with the data and reporting requirements for constitutional bodies within WHO and the wider United Nations system. This change has improved the accuracy of data analysis, and decision-making has been enhanced as a consequence. New reports to ensure monitoring of staff movements and departures have been designed in order to permit better
EB132/38
7
monitoring, more controls and a more rapid implementation of departure procedures ‒ all with a view to reducing the risk of financial indebtedness. The Human Resources Module is also being improved, with work under way to streamline processes for making and responding to requests for human resources entitlements.
Health and medical services
As part of their global occupational health and safety mandate, the medical services continue to 33.provide preventive medical care as well as clinical and psychological support to all staff (in 2011, 3400 medical and psychosocial consultations and 2050 nurse consultations; in 2012, to date, 3320 medical and social consultations and 1300 nurse consultations). During 2012, the medical services played an active role in the revision of policies on health and well-being at the workplace. The medical services are represented on the interagency HR Network Working Group on Employment of Persons with Disability, chaired by WHO. In parallel, the medical services have been working on the new policy on a smoke-free campus, due to be launched in January 2013, and on the reinforcement of the alcohol abuse policy. The medical services have organized lunch seminars (three in 2012) and a range of training sessions have been conducted at headquarters and in the regions, including workshops on stress reduction, intercultural communication in the workplace and monthly first aid courses and refresher courses. During 2011 and 2012, the medical services facilitated support groups for staff affected by the restructuring of the Organization.
In the course of 2012 the health and medical services have finalized the implementation of the 34.global web-based medical database in the regions and at headquarters. The new database will facilitate the monitoring of staff members’ health worldwide, the production of global statistics and the planning of better adapted preventive measures in the workplace.
The health and medical services support not only WHO, but also UNAIDS, the International 35.Drug Purchasing Facility (UNITAID) and the International Computing Centre. As part of its global responsibilities in the United Nations common system, WHO is responsible for the medical evacuations of local staff (carried out on an exceptional basis) and of international staff (when the evacuation takes place outside the region to which they are assigned). The health and medical services handled 64 cases of medical evacuations for the regions in 2011; a further 51 have been dealt with in 2012 to date. The health and medical services manage all medical cases that are submitted to the Advisory Committee on Compensation Claims for headquarters and the regional offices (64 cases were dealt with in 2011; 120 in 2012 to date). The unit also prepares the medical files to be presented to the WHO Staff Pension Committee for disability cases (39 in 2011; 34 in 2012 to date). The daily interactions between the unit and the offices of the Regional Staff Physician have reinforced the physicians’ network, and as a consequence practices have now been harmonized. Sick leave and sick leave under insurance cover are monitored closely on a monthly basis, in collaboration with the Global Service Centre and the Secretariat departments dealing with staff health insurance and human resources. The continuing follow-up of patients has been shown to facilitate the return to work.
STAFFING PROFILE
Appointment categories
This section presents the Organization’s staffing profile as at 31 July 2012. Using information 36.from human resources annual reports generated over the last 10 years, this section also provides an analysis of some aspects of the evolution of the workforce. The data concerned include details on: appointment categories; staff distribution by sex; geographical representation; age, grade, length of
EB132/38
8
service and turnover of staff; staff mobility; and the distribution of staff in professional and higher category posts across the main occupational groups.
Unless otherwise specified, all data in this section relate to staff holding a fixed-term or a 37.continuing appointment (for ease of reference, both are referred to hereinafter as “long-term appointments” to distinguish them from short-term appointments).
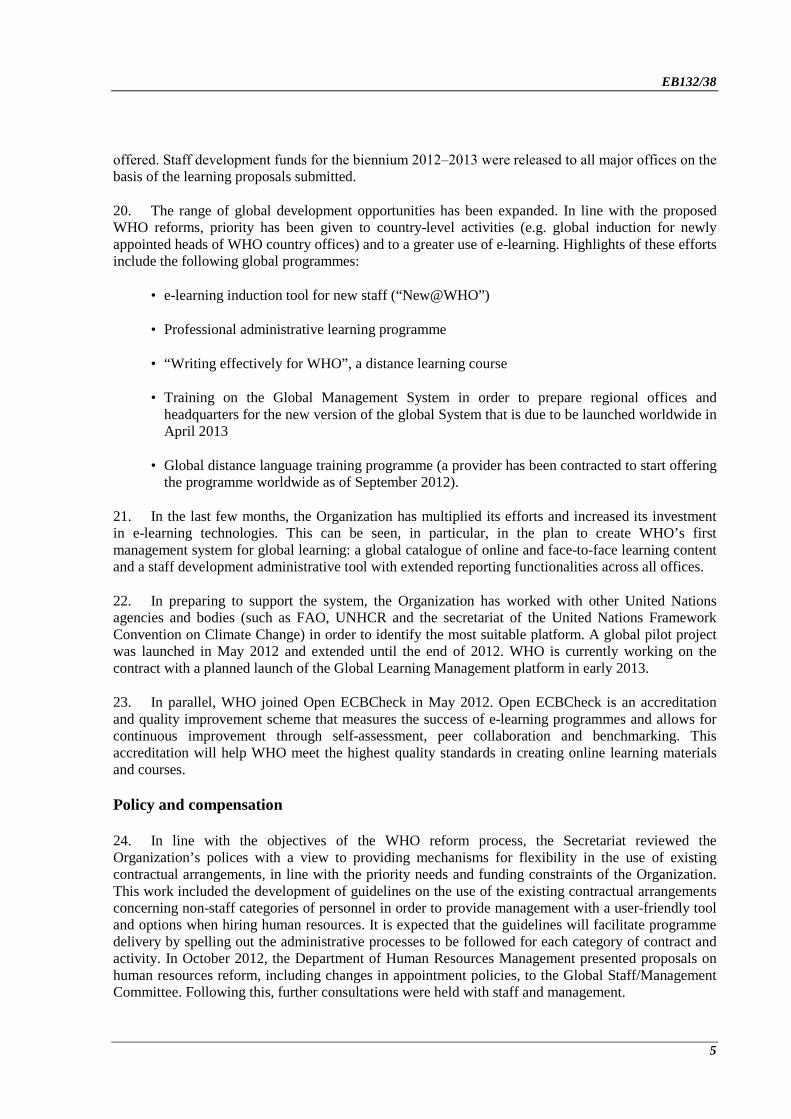
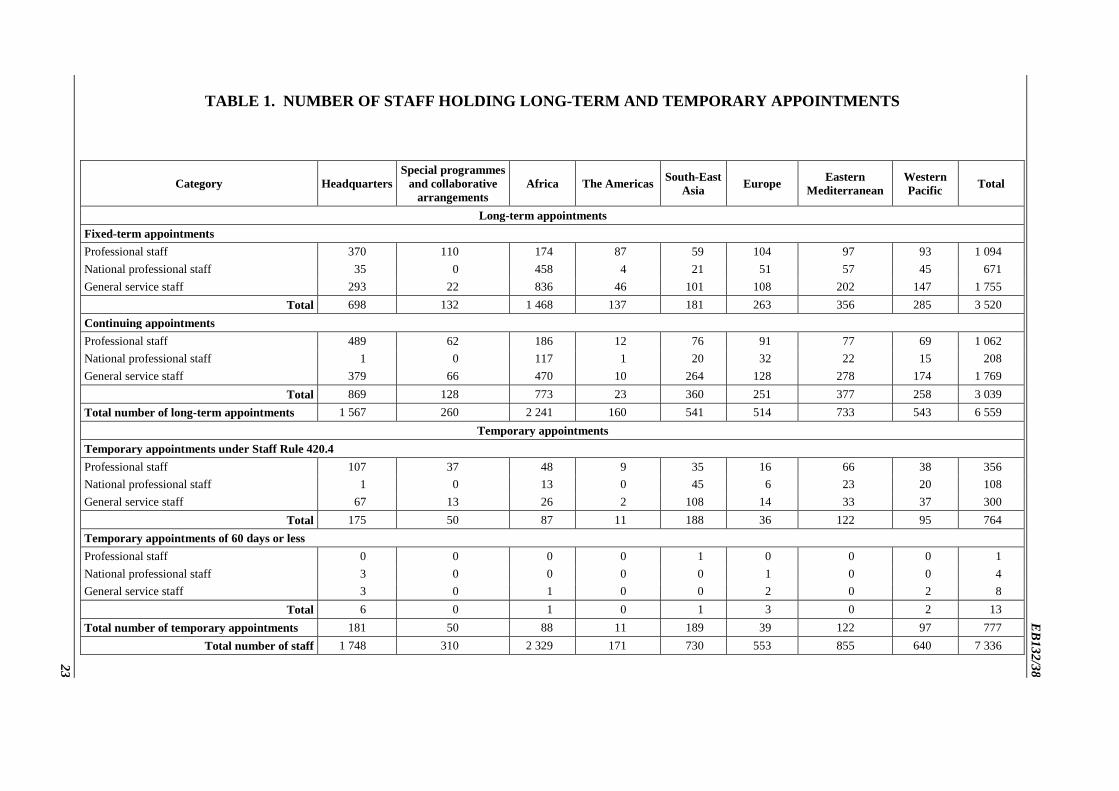
As at 31 July 2012, WHO had a total of 6559 staff members holding long-term appointments.1 38.Of these, 2156 (32.9%) were in the professional and higher categories, 879 (13.4%) were in the national professional officer category and 3524 (53.7%) were in the general service category (see Table 1). The number of staff members holding long-term appointments has decreased by 316 (4.6%) compared with the number reported in the staffing profile as at 31 December 2011.2
Figure 1. Evolution of staff numbers by contract type over the period 2002‒2012
As at 31 July 2012, only 777 staff were on temporary appointments, a decrease of 165 or 17.5% 39.compared with the number shown in the report as at 31 December 2011. Temporary staff currently constitute 10.6% of the total workforce, whereas as at 31 December 2002 there were 5091 temporary staff, representing 58.0% of the workforce.3 The reduction in the use of temporary appointments coincided with the global contract reform within the United Nations common system, and this trend has continued in an inevitable reaction to the recent financial crisis and to the constraints expected in the coming years. In line with the current reform agenda, the Organization is reviewing its existing contract types in order to support a more flexible and mobile workforce.
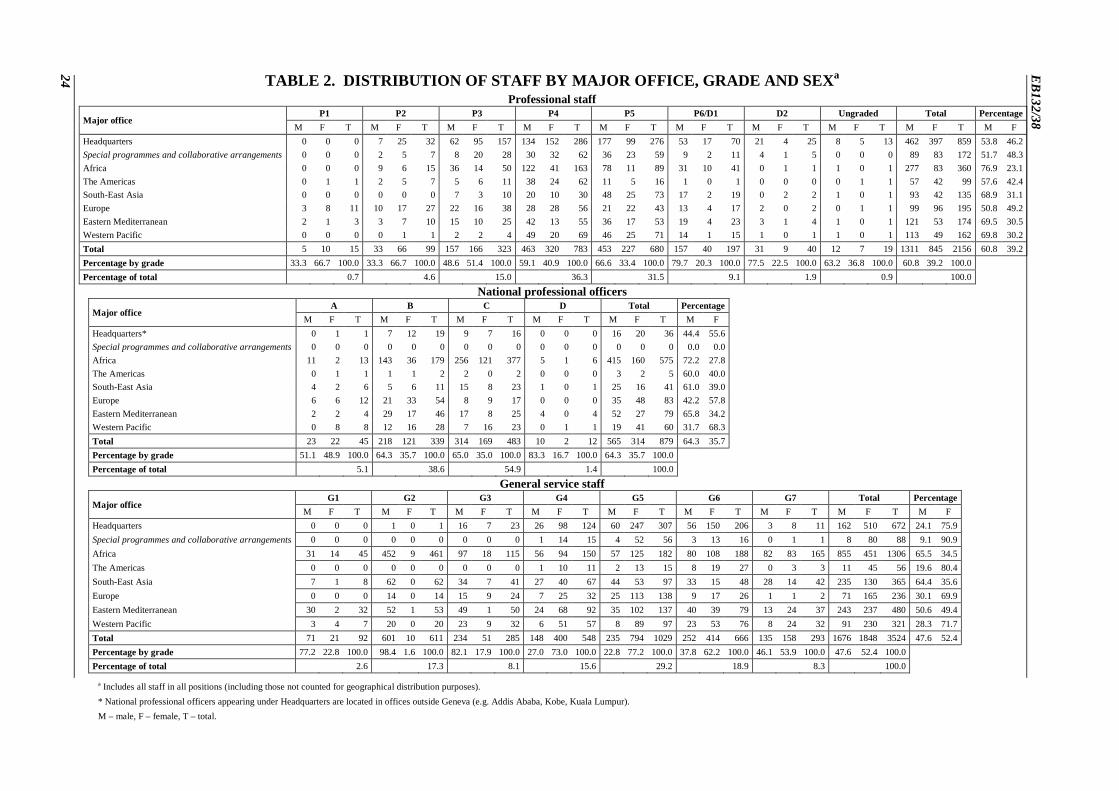
Table 2 sets out the distribution of staff members holding long-term appointments by major 40.office, grade and sex. Within the distribution for the professional and higher categories it can be
1 This figure includes staff in special programmes and collaborative arrangements hosted by WHO. It also includes
WHO-funded PAHO/AMRO staff but does not include PAHO-funded staff members in the Region of the Americas (see details at paragraphs 60 to 63); nor does it include IARC or any agencies administered by WHO.
2 Document A65/34. 3 See document A56/38.
0
1000
2000
3000
4000
5000
6000
7000
8000
9000
10000
2002 2003 2004 2005 2006 2007 2008 2009 2010 2011 2012
Num
ber o
f sta
ff
Temporary contracts
Year Long-term contracts Total
EB132/38
9
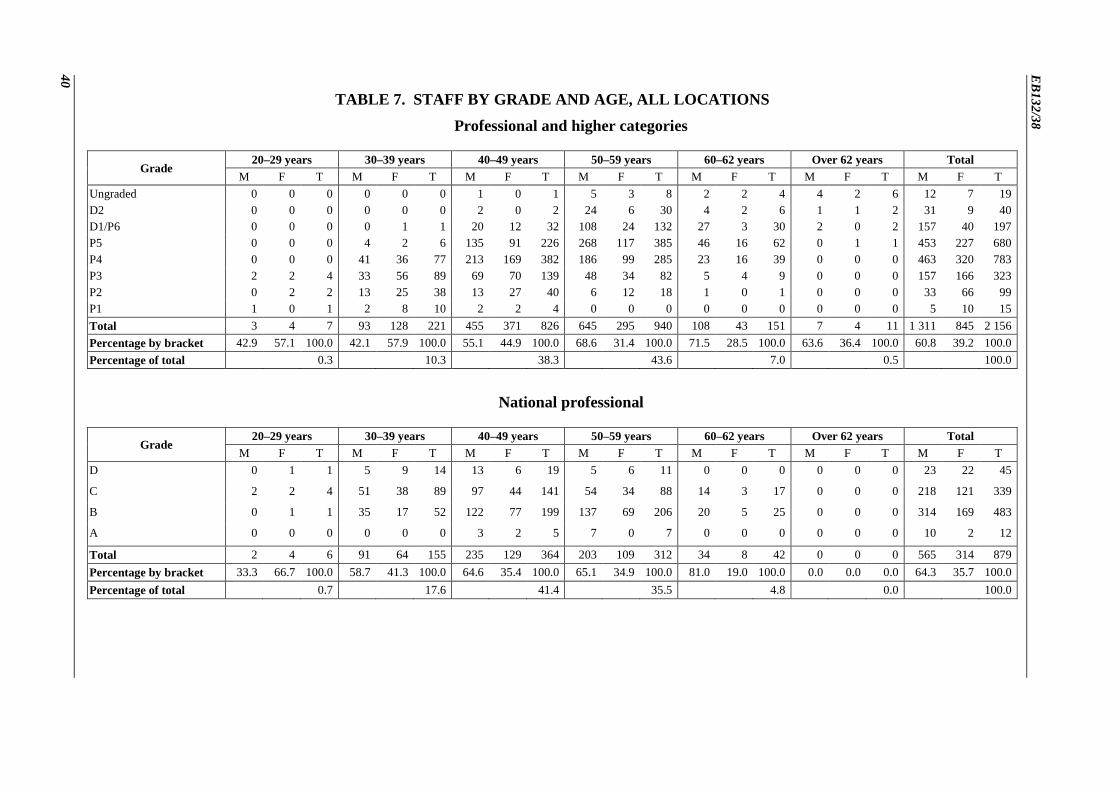
observed that since 2002 the proportion of staff by grade has changed most significantly at grades P.3 to P.5 (P.3: 10.9% to 15.0%; P.4: 27.7% to 36.3%; and P.5: 39.7% to 31.5%) This reflects the continuing practice, in respect of staff in the professional and higher categories, of replacing higher-grade staff members by counterparts at a lower grade. The number of staff holding longer-term contracts decreased from a peak in 2009‒2010 but remained above the levels of 2008. This is explained by the recent review of programmes which resulted in downsizing (see Table 1).
Staff category by major office and office type
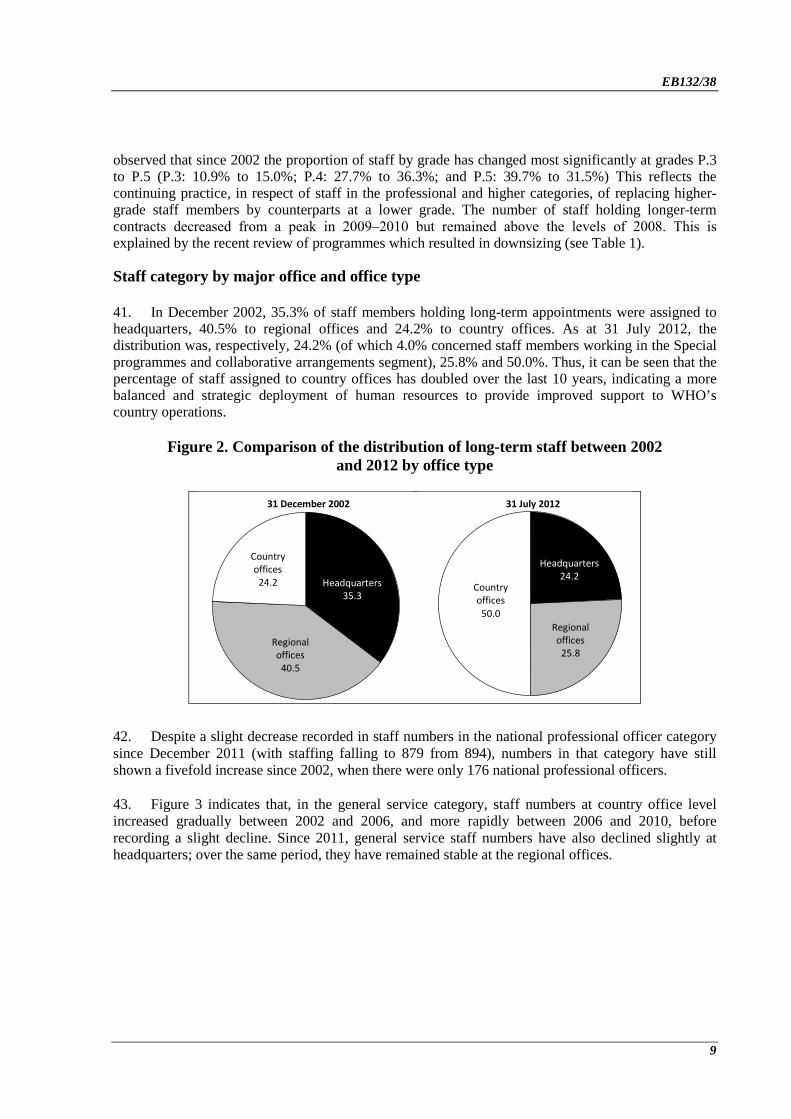
In December 2002, 35.3% of staff members holding long-term appointments were assigned to 41.headquarters, 40.5% to regional offices and 24.2% to country offices. As at 31 July 2012, the distribution was, respectively, 24.2% (of which 4.0% concerned staff members working in the Special programmes and collaborative arrangements segment), 25.8% and 50.0%. Thus, it can be seen that the percentage of staff assigned to country offices has doubled over the last 10 years, indicating a more balanced and strategic deployment of human resources to provide improved support to WHO’s country operations.
Figure 2. Comparison of the distribution of long-term staff between 2002 and 2012 by office type
Despite a slight decrease recorded in staff numbers in the national professional officer category 42.since December 2011 (with staffing falling to 879 from 894), numbers in that category have still shown a fivefold increase since 2002, when there were only 176 national professional officers.
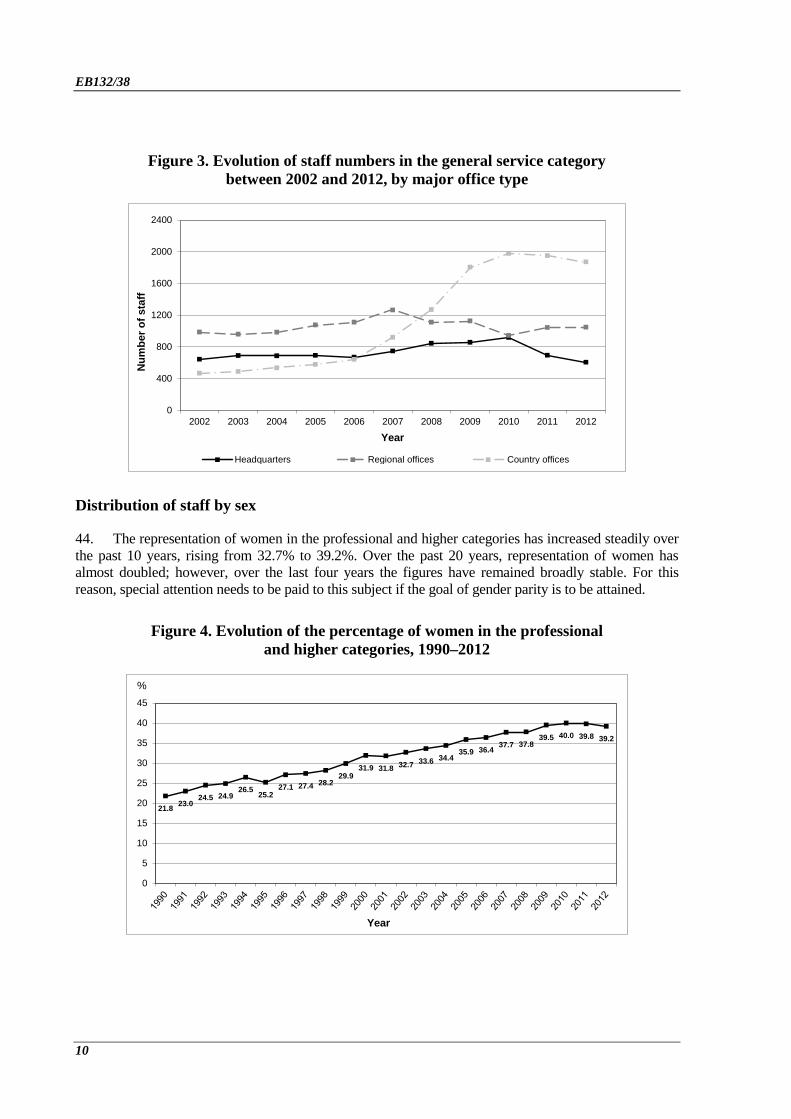
Figure 3 indicates that, in the general service category, staff numbers at country office level 43.increased gradually between 2002 and 2006, and more rapidly between 2006 and 2010, before recording a slight decline. Since 2011, general service staff numbers have also declined slightly at headquarters; over the same period, they have remained stable at the regional offices.
Country offices
24.2 Headquarters 35.3
Regional offices
40.5
Country offices 50.0
Headquarters 24.2
Regional offices
25.8
31 July 2012 31 December 2002
EB132/38
10
Figure 3. Evolution of staff numbers in the general service category between 2002 and 2012, by major office type
Distribution of staff by sex
The representation of women in the professional and higher categories has increased steadily over 44.the past 10 years, rising from 32.7% to 39.2%. Over the past 20 years, representation of women has almost doubled; however, over the last four years the figures have remained broadly stable. For this reason, special attention needs to be paid to this subject if the goal of gender parity is to be attained.
Figure 4. Evolution of the percentage of women in the professional and higher categories, 1990–2012
0
400
800
1200
1600
2000
2400
2002 2003 2004 2005 2006 2007 2008 2009 2010 2011 2012
21.8 23.024.5 24.9
26.5 25.227.1 27.4 28.2
29.931.9 31.8 32.7 33.6 34.4
35.9 36.4 37.7 37.839.5 40.0 39.8 39.2
0
5
10
15
20
25
30
35
40
45
Year
Num
ber o
f sta
ff
Headquarters Regional offices Country offices
Year
%
EB132/38
11
As at 31 July 2012, of the 2156 staff members in the professional and higher categories, 45.1311 (60.8%) were men and 845 (39.2%) were women. From grade P.4 up to the level of ungraded positions, men outnumber women (Table 2), although the number of women has been increasing steadily over time. For example, as at 31 December 2002, 34.3% of staff members in the P.4 grade were women, whereas now they represent 40.9%; over the same period, the percentage of women at grade P.5 rose from 26.4% to 33.4%. At the most senior levels (from grade P.6/D.1 up to the ungraded level), the percentage of women has also increased, rising from 20.7% in December 2002 to 21.9% in July 2012.
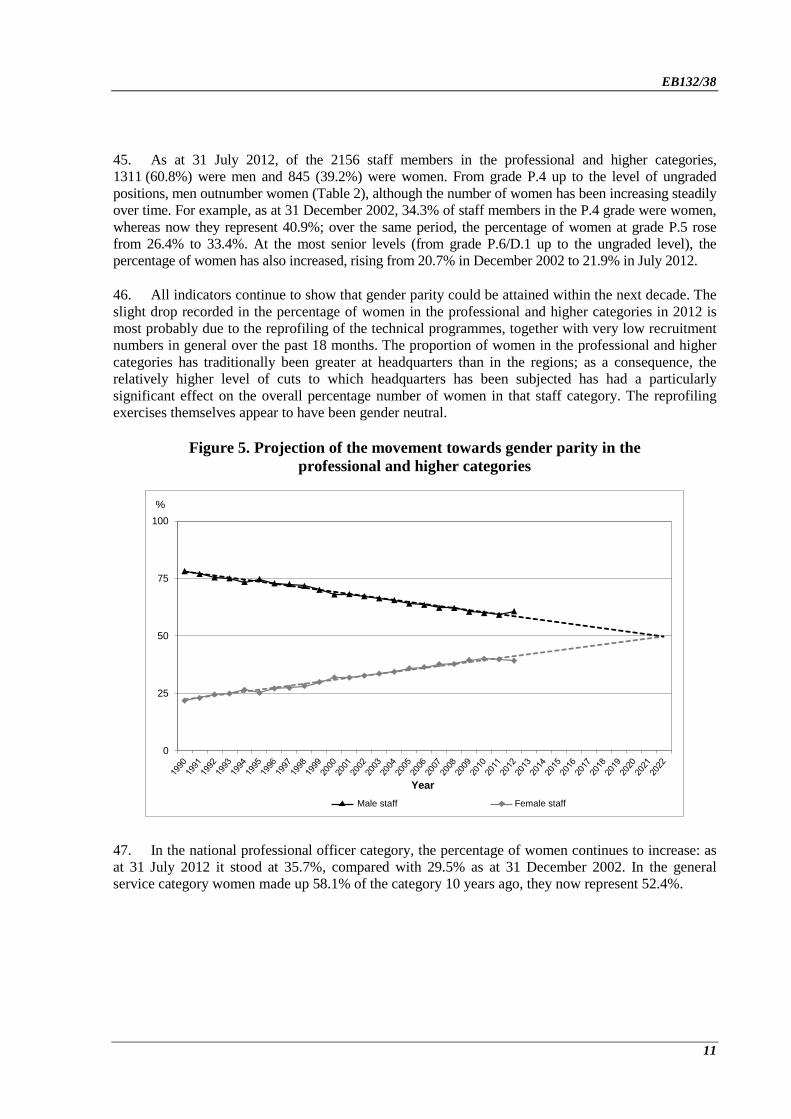
All indicators continue to show that gender parity could be attained within the next decade. The 46.slight drop recorded in the percentage of women in the professional and higher categories in 2012 is most probably due to the reprofiling of the technical programmes, together with very low recruitment numbers in general over the past 18 months. The proportion of women in the professional and higher categories has traditionally been greater at headquarters than in the regions; as a consequence, the relatively higher level of cuts to which headquarters has been subjected has had a particularly significant effect on the overall percentage number of women in that staff category. The reprofiling exercises themselves appear to have been gender neutral.
Figure 5. Projection of the movement towards gender parity in the professional and higher categories
In the national professional officer category, the percentage of women continues to increase: as 47.at 31 July 2012 it stood at 35.7%, compared with 29.5% as at 31 December 2002. In the general service category women made up 58.1% of the category 10 years ago, they now represent 52.4%.
0
25
50
75
100
Year Male staff Female staff
%
EB132/38
12
Geographical representation
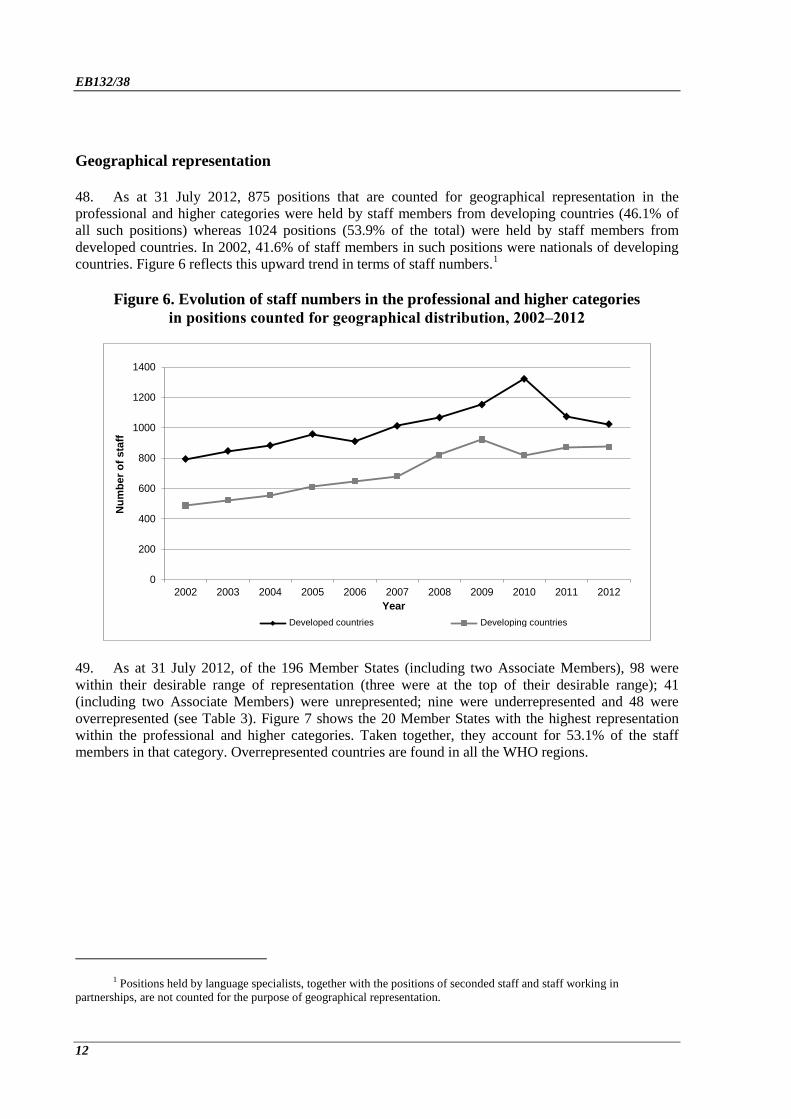
As at 31 July 2012, 875 positions that are counted for geographical representation in the 48.professional and higher categories were held by staff members from developing countries (46.1% of all such positions) whereas 1024 positions (53.9% of the total) were held by staff members from developed countries. In 2002, 41.6% of staff members in such positions were nationals of developing countries. Figure 6 reflects this upward trend in terms of staff numbers.1
Figure 6. Evolution of staff numbers in the professional and higher categories in positions counted for geographical distribution, 2002‒2012
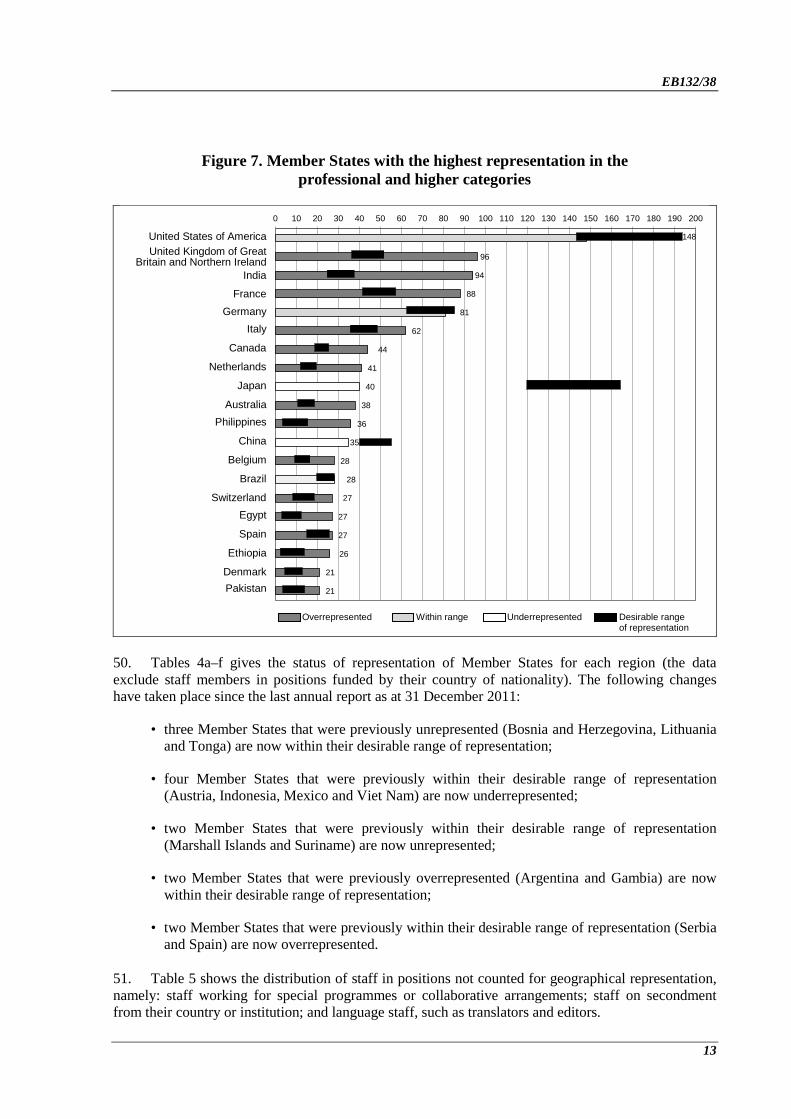
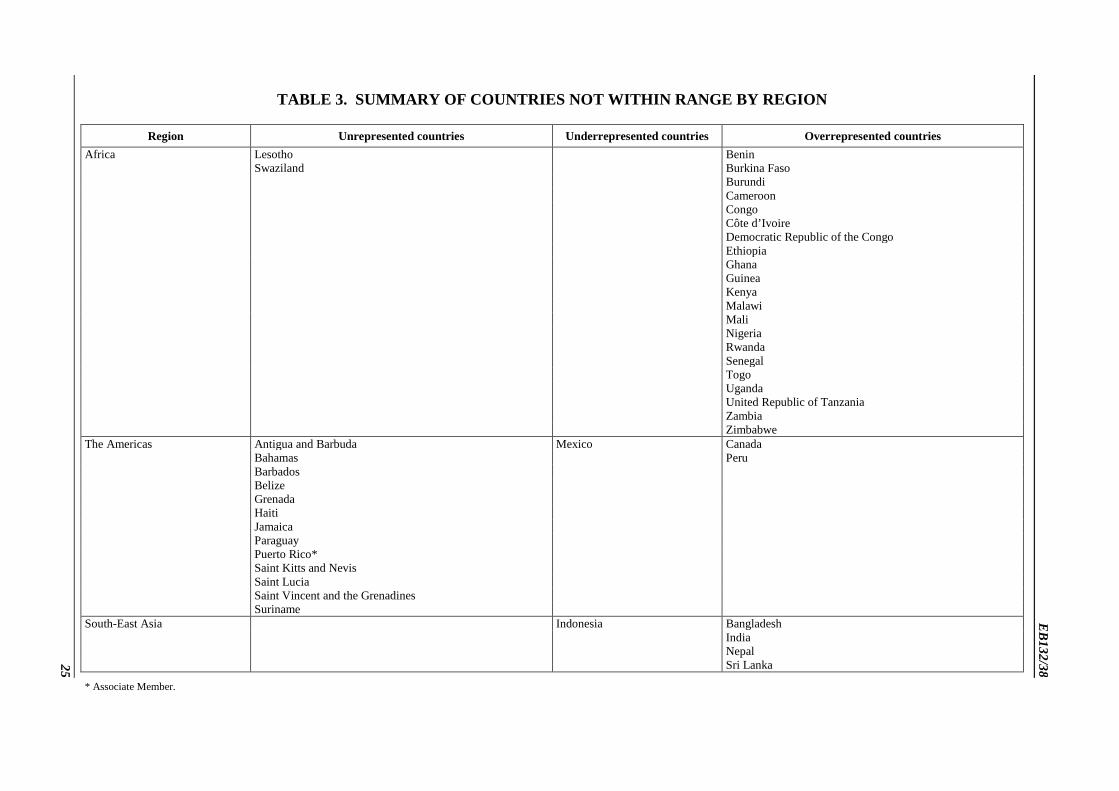
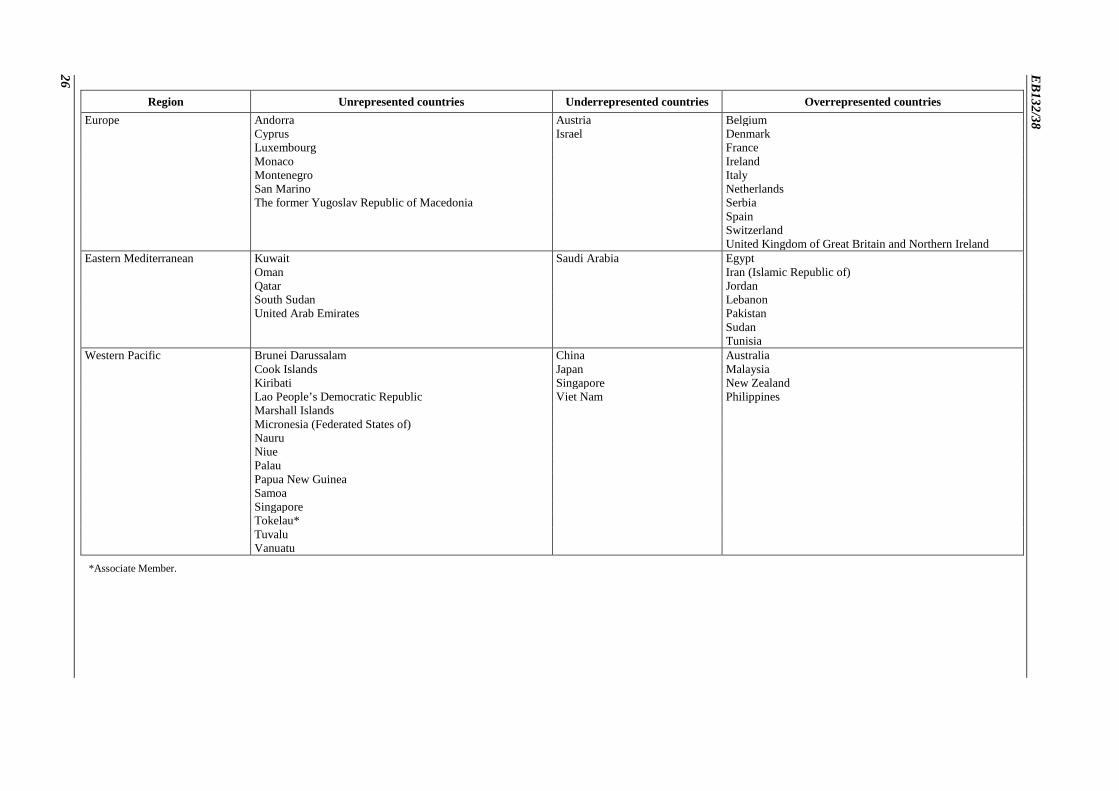
As at 31 July 2012, of the 196 Member States (including two Associate Members), 98 were 49.within their desirable range of representation (three were at the top of their desirable range); 41 (including two Associate Members) were unrepresented; nine were underrepresented and 48 were overrepresented (see Table 3). Figure 7 shows the 20 Member States with the highest representation within the professional and higher categories. Taken together, they account for 53.1% of the staff members in that category. Overrepresented countries are found in all the WHO regions.
1 Positions held by language specialists, together with the positions of seconded staff and staff working in
partnerships, are not counted for the purpose of geographical representation.
0
200
400
600
800
1000
1200
1400
2002 2003 2004 2005 2006 2007 2008 2009 2010 2011 2012
Developed countries Developing countries
Num
ber o
f sta
ff
Year
EB132/38
13
Figure 7. Member States with the highest representation in the professional and higher categories
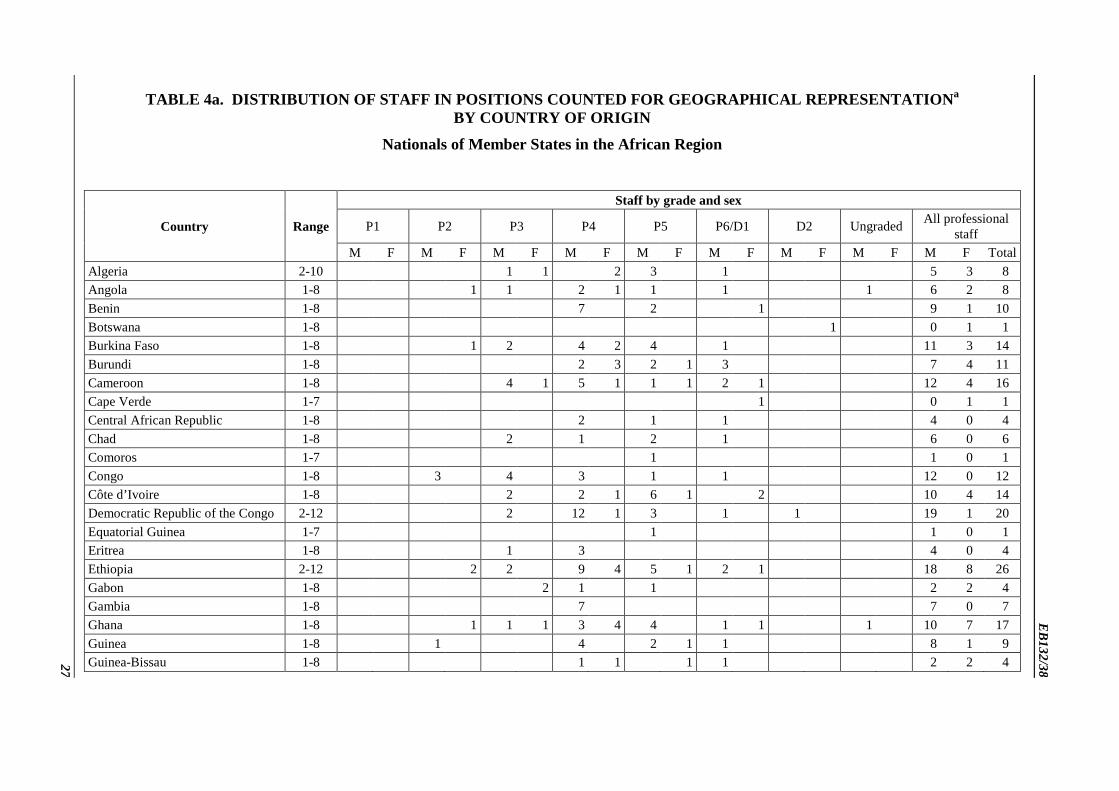
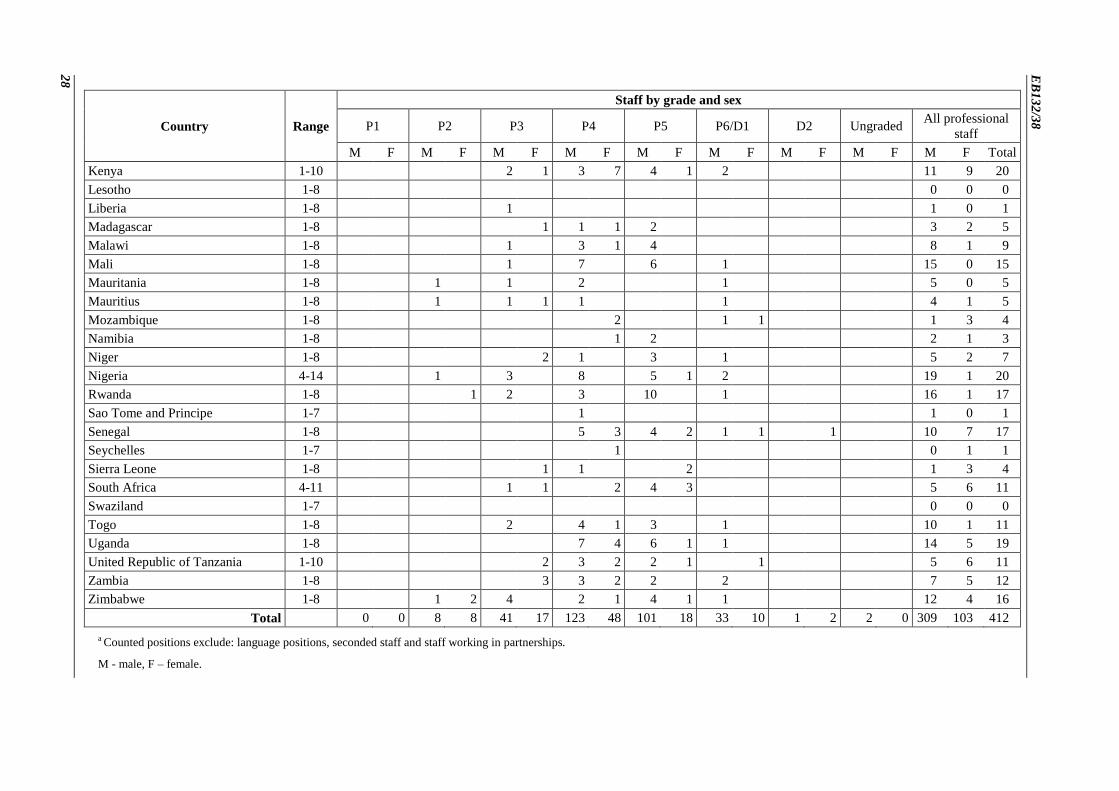
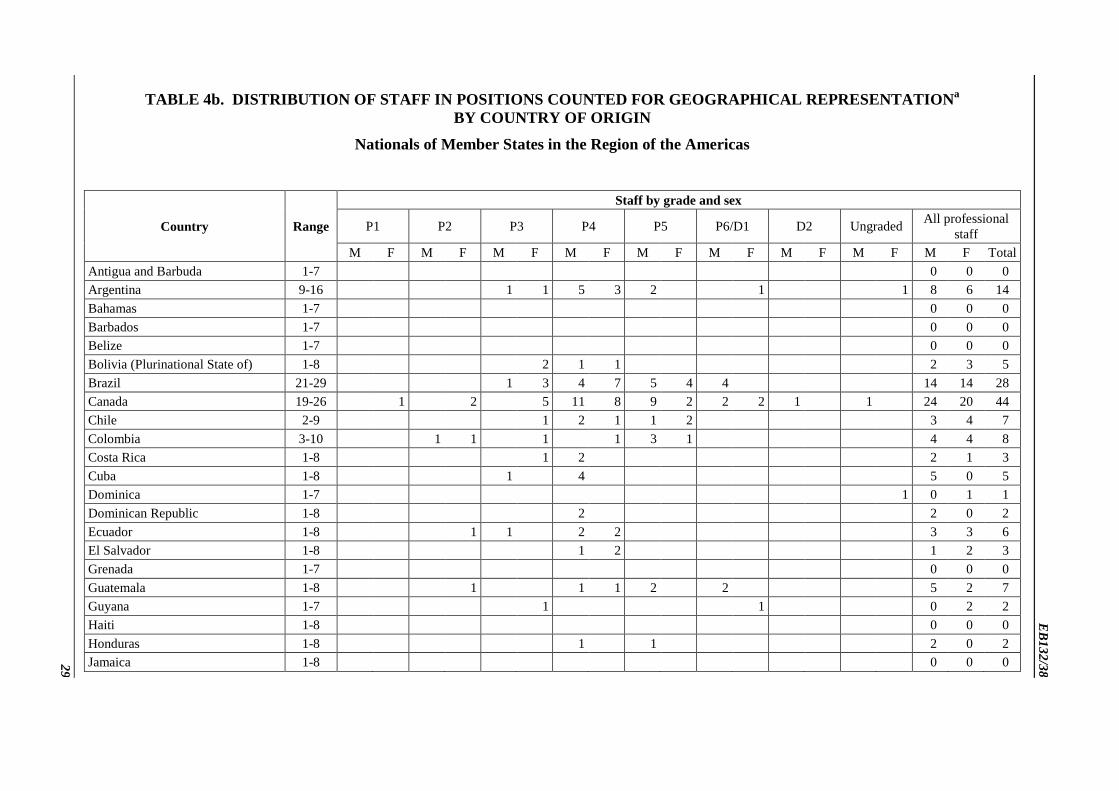
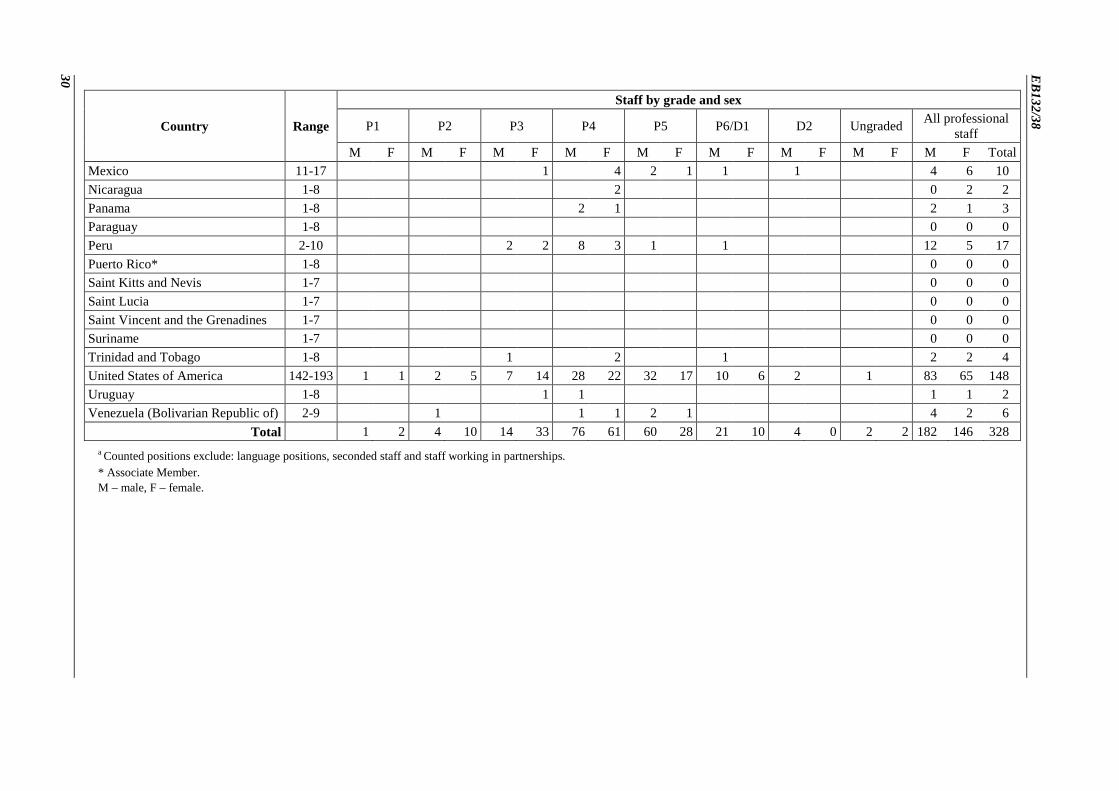
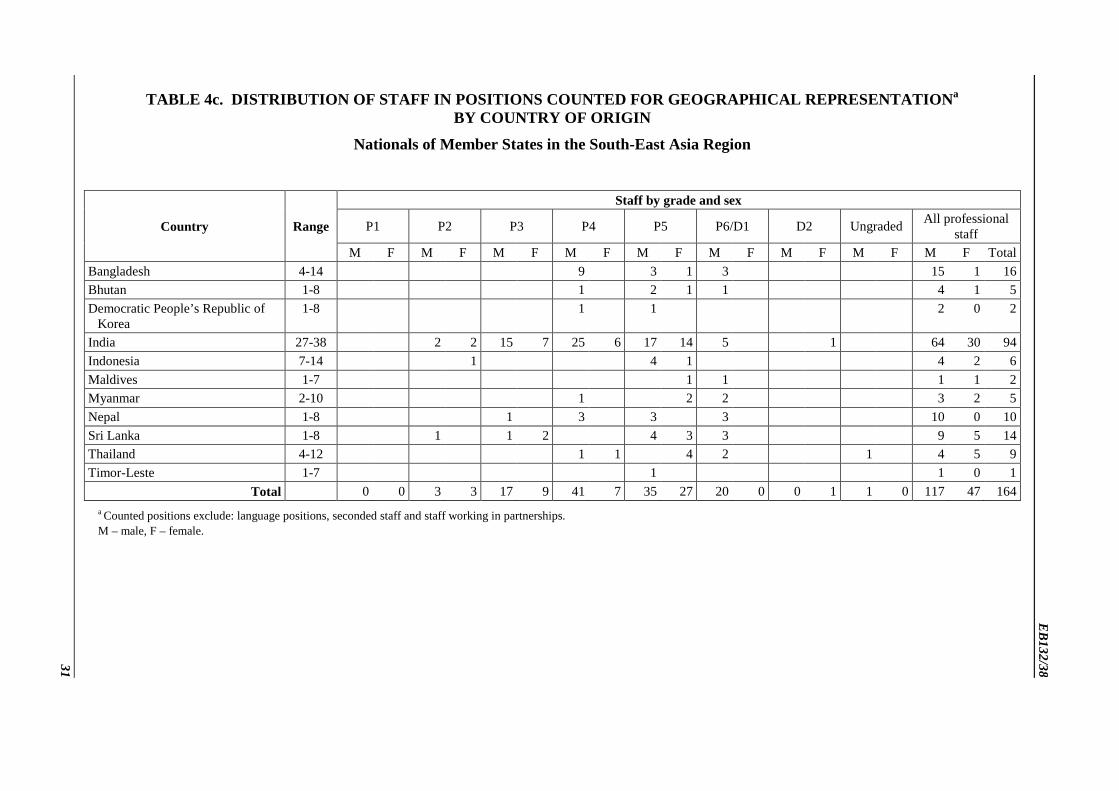
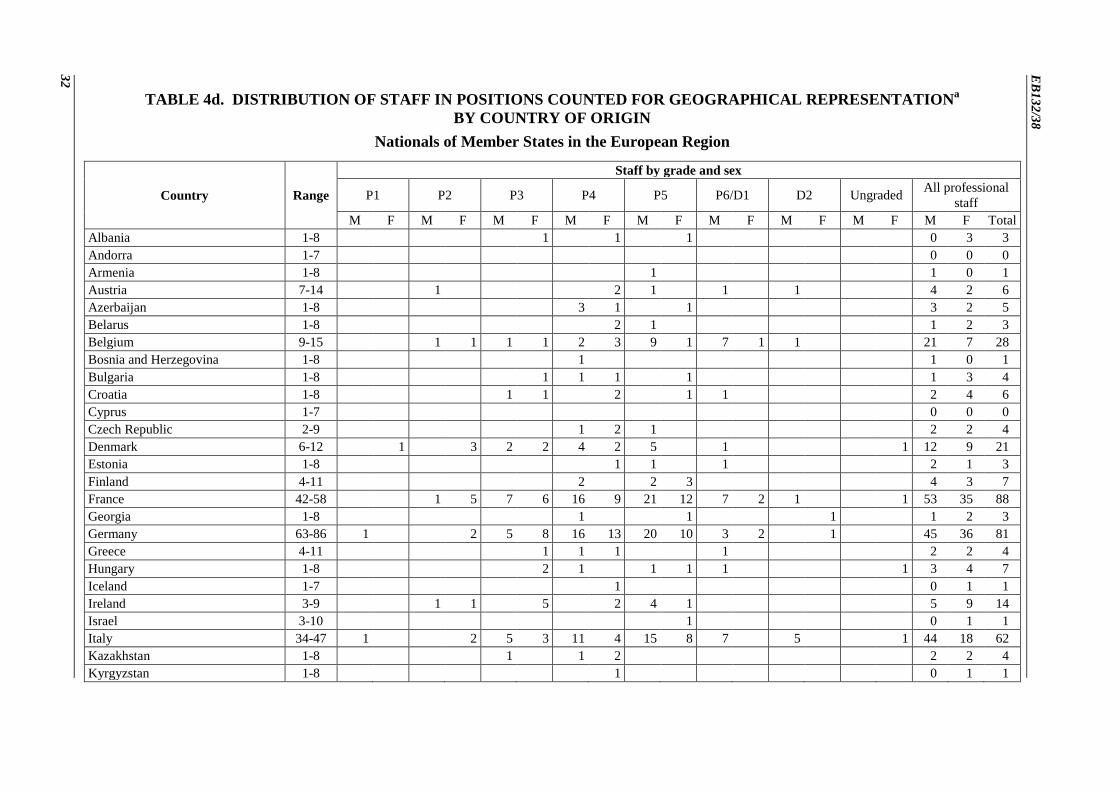
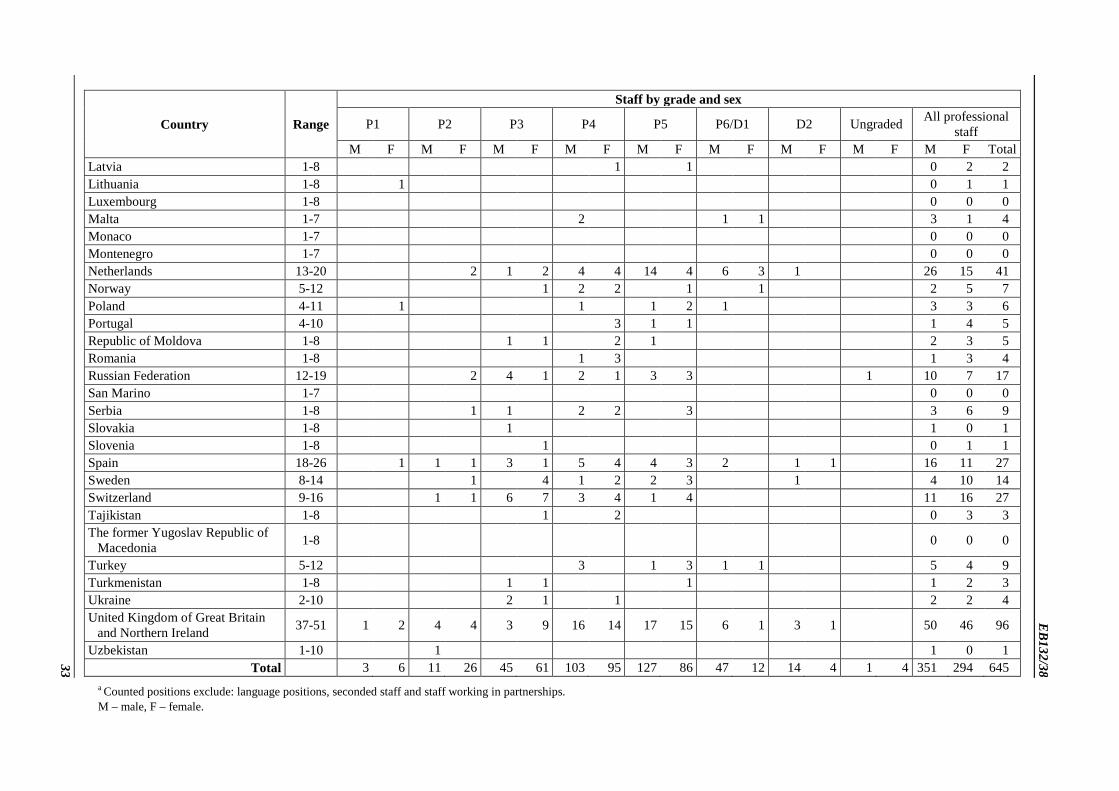
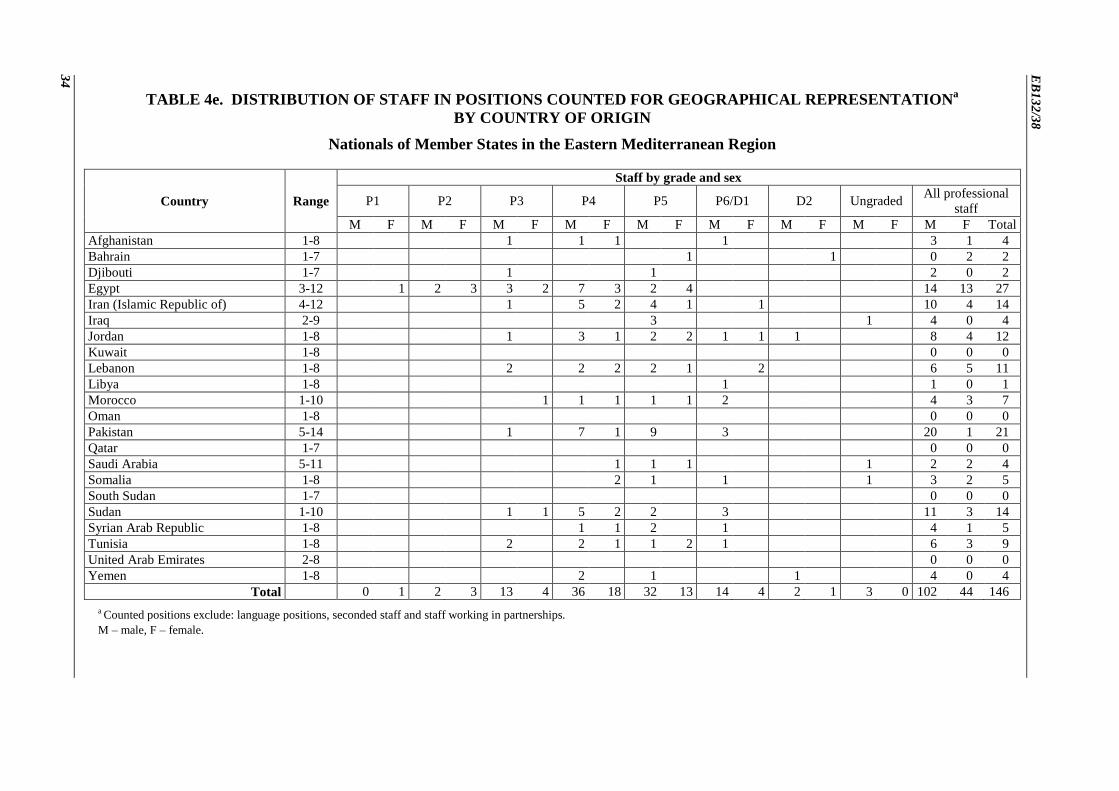
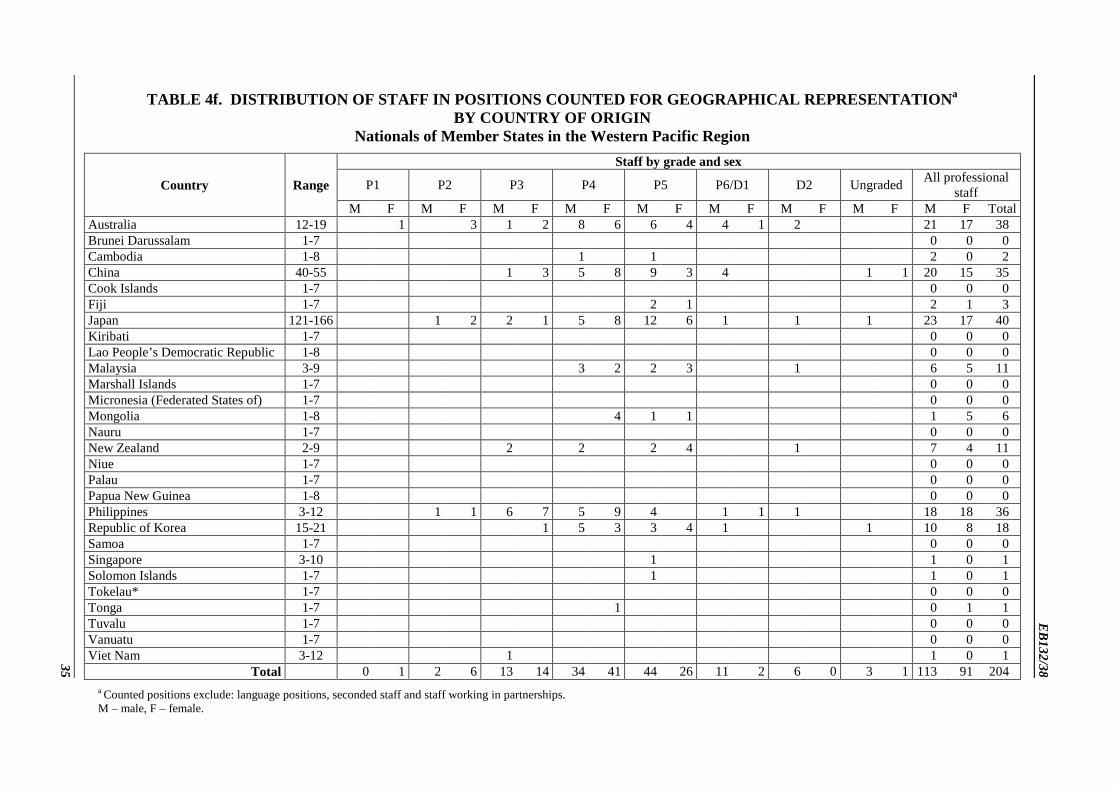
Tables 4a–f gives the status of representation of Member States for each region (the data 50.exclude staff members in positions funded by their country of nationality). The following changes have taken place since the last annual report as at 31 December 2011:
• three Member States that were previously unrepresented (Bosnia and Herzegovina, Lithuania and Tonga) are now within their desirable range of representation;
• four Member States that were previously within their desirable range of representation (Austria, Indonesia, Mexico and Viet Nam) are now underrepresented;
• two Member States that were previously within their desirable range of representation (Marshall Islands and Suriname) are now unrepresented;
• two Member States that were previously overrepresented (Argentina and Gambia) are now within their desirable range of representation;
• two Member States that were previously within their desirable range of representation (Serbia and Spain) are now overrepresented.
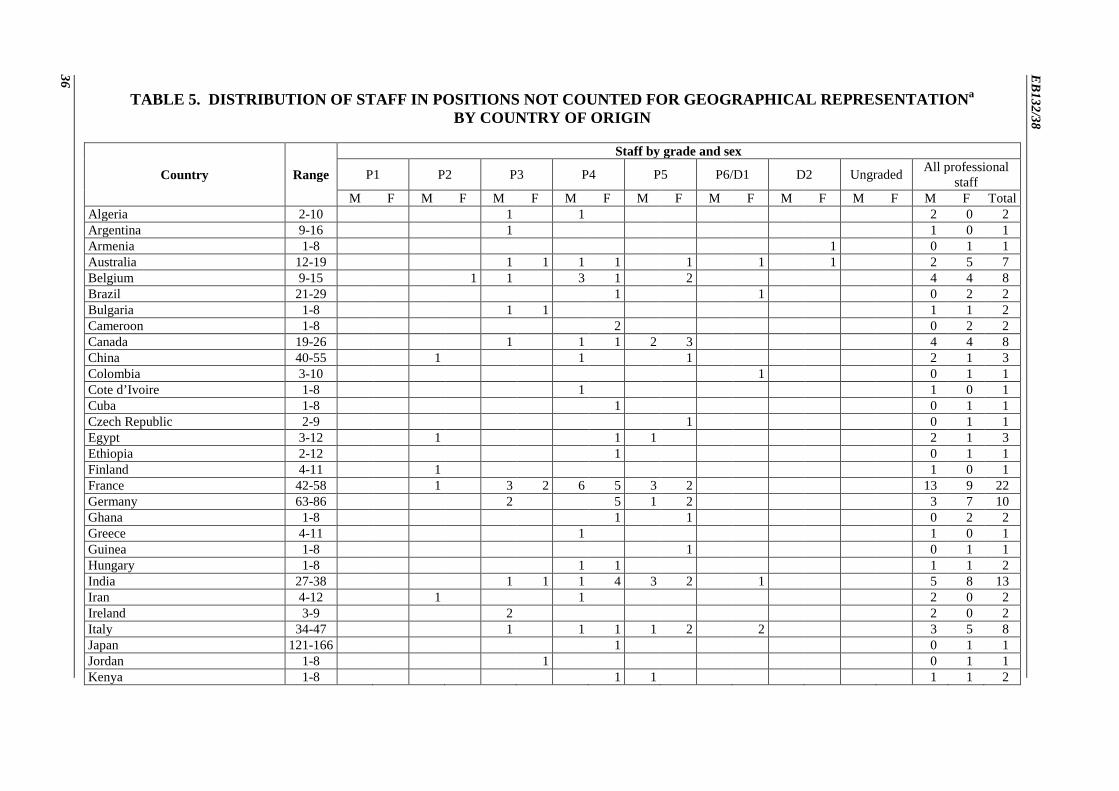
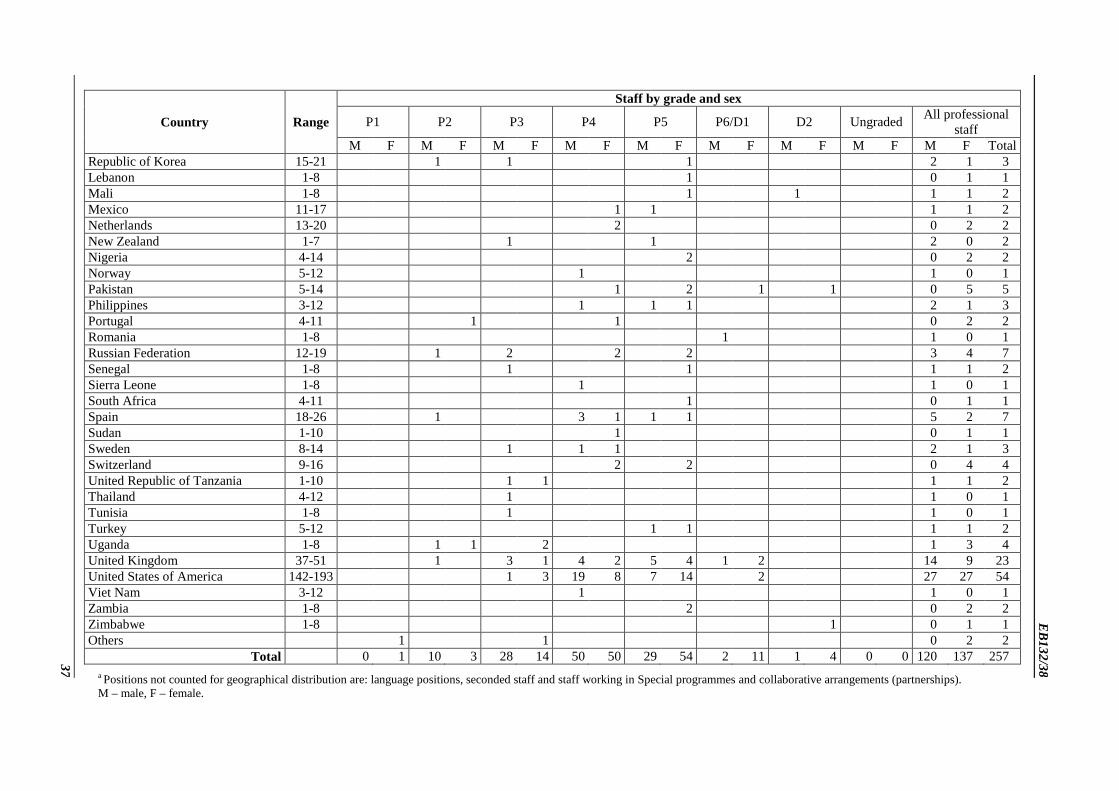
Table 5 shows the distribution of staff in positions not counted for geographical representation, 51.namely: staff working for special programmes or collaborative arrangements; staff on secondment from their country or institution; and language staff, such as translators and editors.
148
96
94
88
81
62
44
41
40
38
36
35
28
28
27
27
27
26
21
21
0 10 20 30 40 50 60 70 80 90 100 110 120 130 140 150 160 170 180 190 200
United States of America United Kingdom of Great
Britain and Northern Ireland India
France Germany
Italy
Canada
Netherlands
Japan
Australia Philippines
China
Belgium
Brazil
Switzerland Egypt
Spain
Ethiopia
Denmark Pakistan
Overrepresented Within range Underrepresented Desirable range of representation
EB132/38
14
Age, grade, length of service and turnover of staff
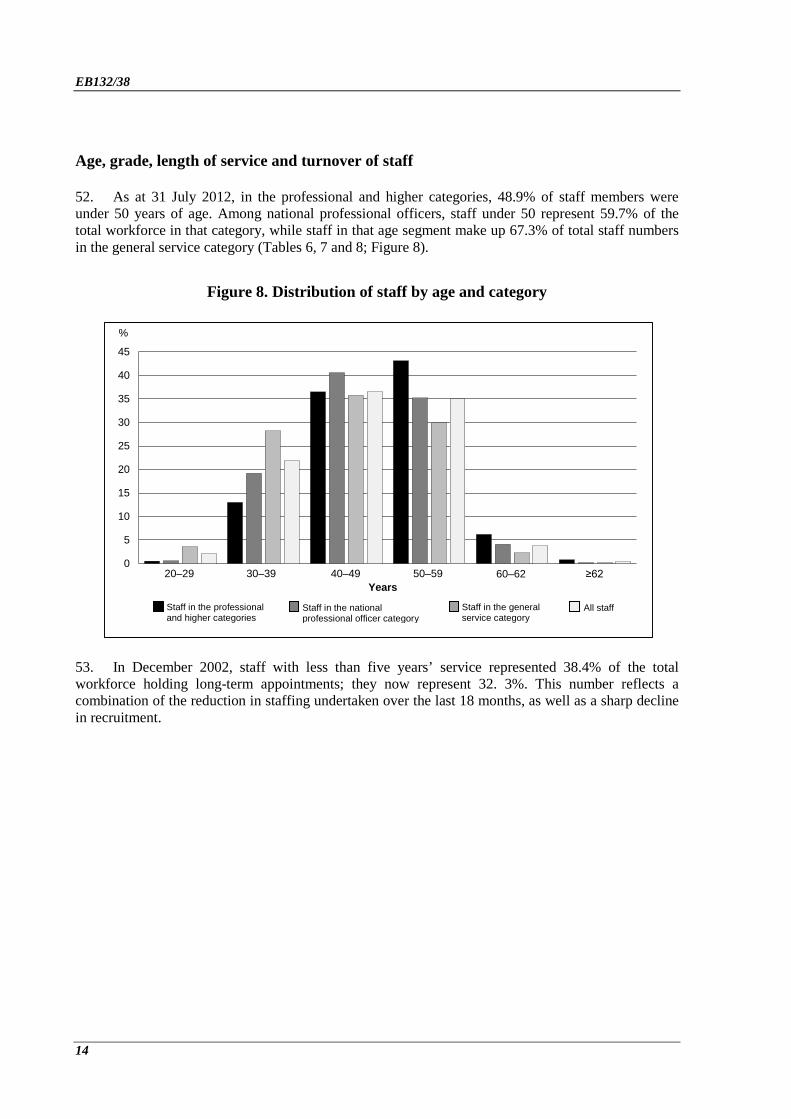
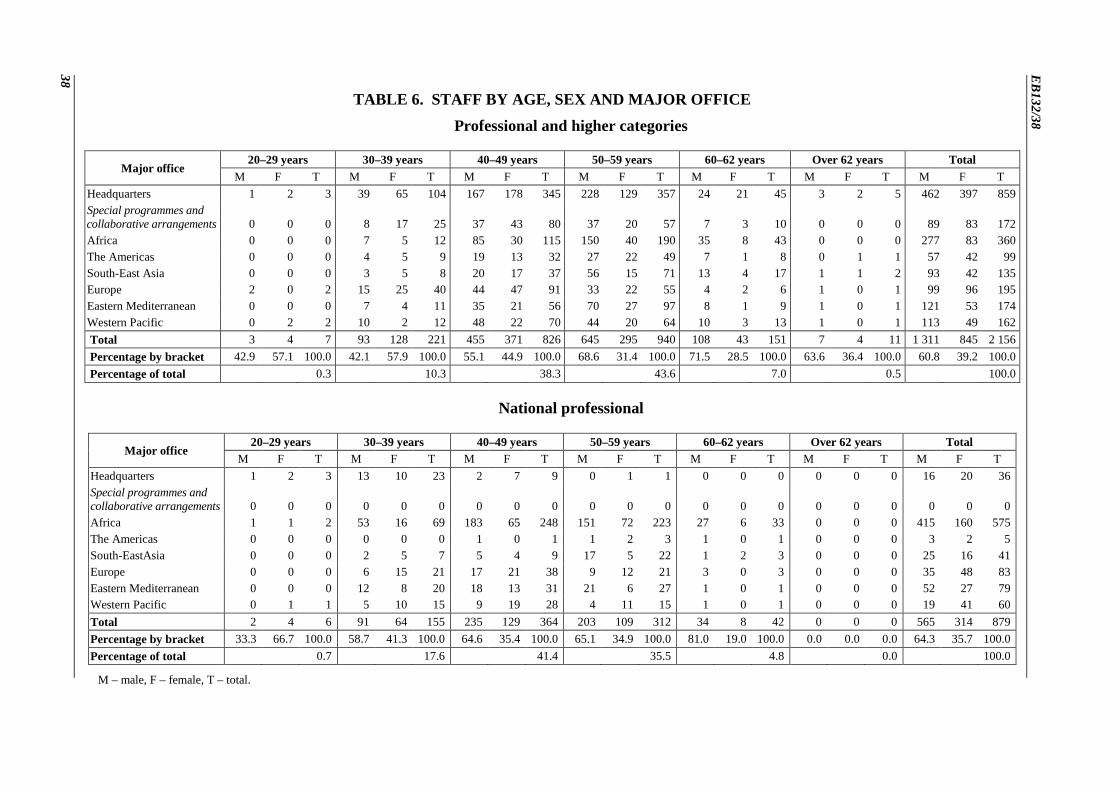
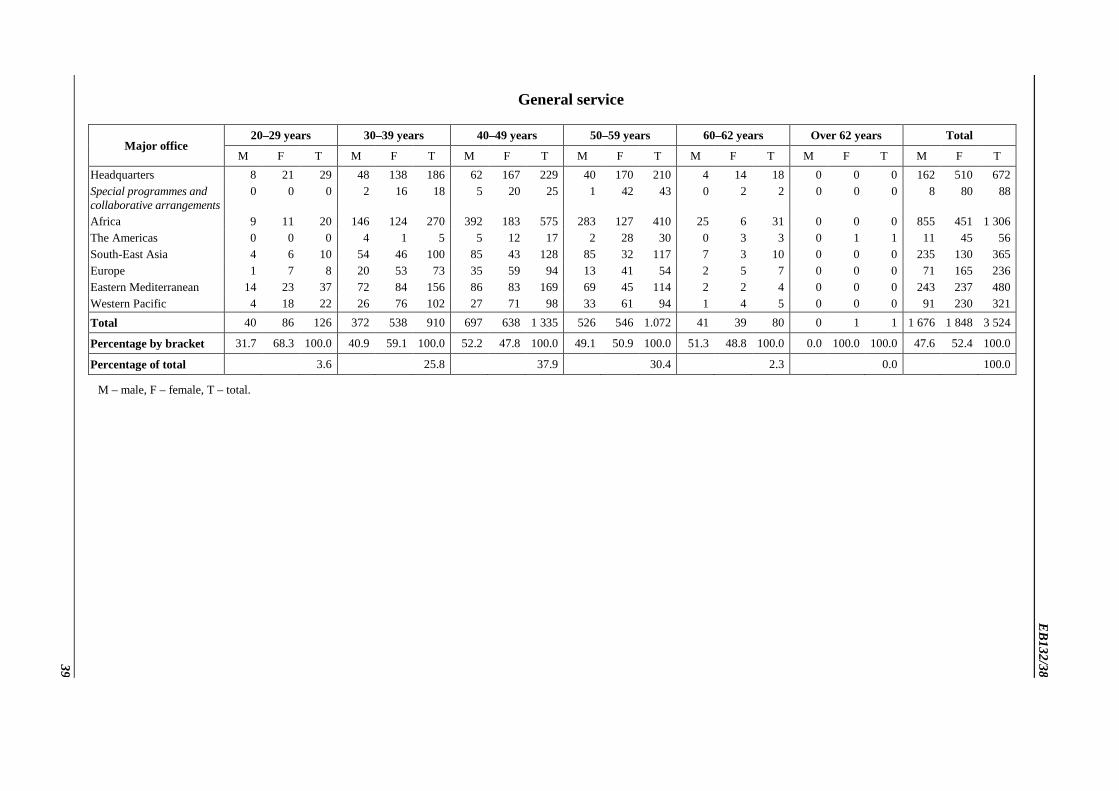
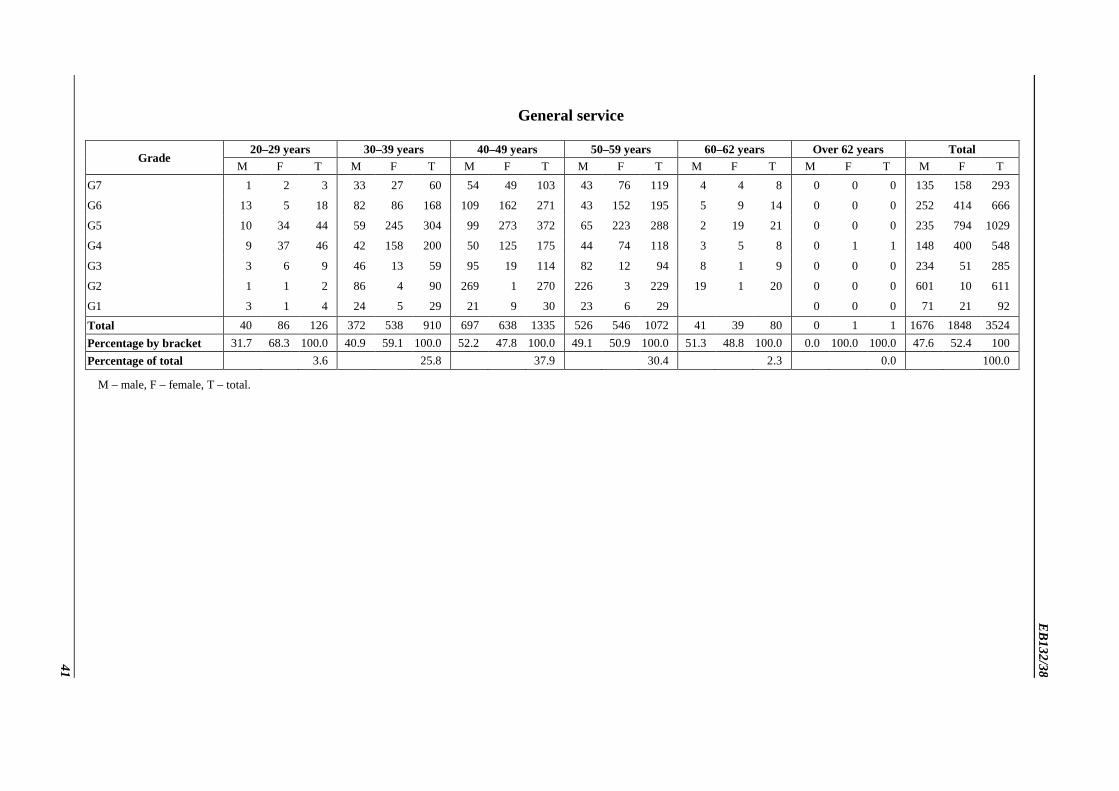
As at 31 July 2012, in the professional and higher categories, 48.9% of staff members were 52.under 50 years of age. Among national professional officers, staff under 50 represent 59.7% of the total workforce in that category, while staff in that age segment make up 67.3% of total staff numbers in the general service category (Tables 6, 7 and 8; Figure 8).
Figure 8. Distribution of staff by age and category
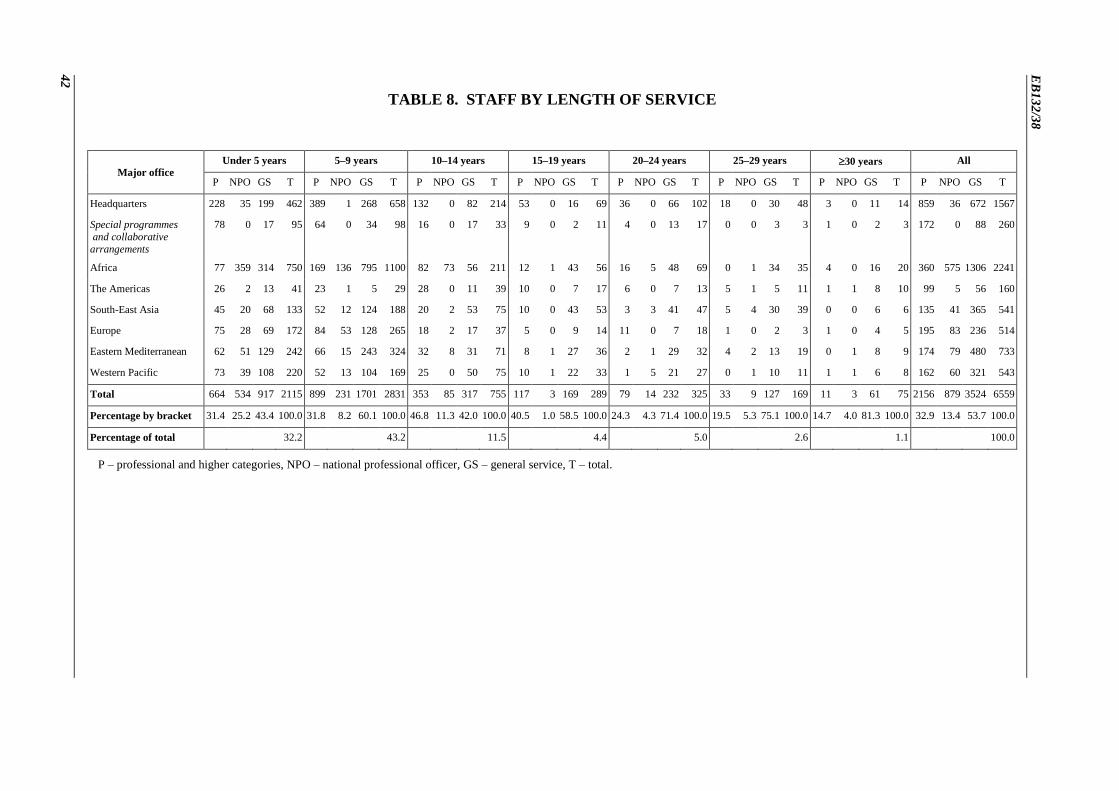
In December 2002, staff with less than five years’ service represented 38.4% of the total 53.workforce holding long-term appointments; they now represent 32. 3%. This number reflects a combination of the reduction in staffing undertaken over the last 18 months, as well as a sharp decline in recruitment.
0
5
10
15
20
25
30
35
40
45
Staff in the professional and higher categories
Staff in the general service category
All staff Staff in the national professional officer category
20–29 30–39 40–49 50–59 60–62 ≥62 Years
%
EB132/38
15
Figure 9. Distribution of staff by length of service and category
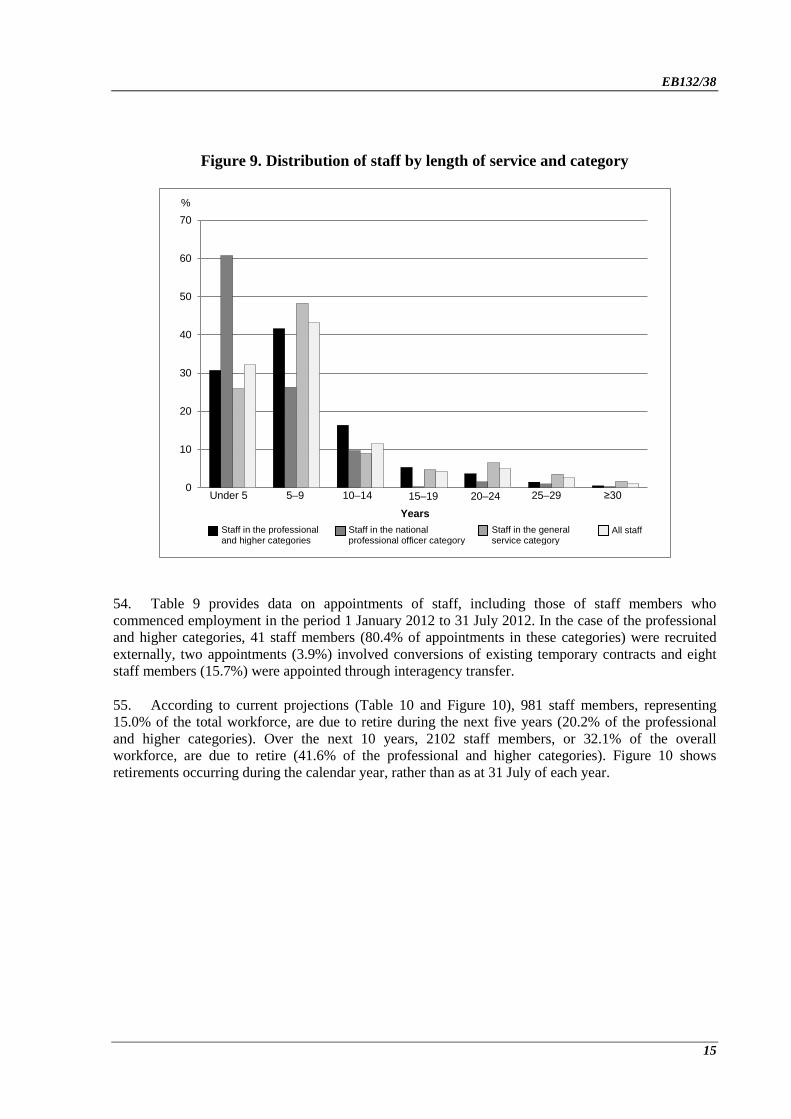
Table 9 provides data on appointments of staff, including those of staff members who 54.commenced employment in the period 1 January 2012 to 31 July 2012. In the case of the professional and higher categories, 41 staff members (80.4% of appointments in these categories) were recruited externally, two appointments (3.9%) involved conversions of existing temporary contracts and eight staff members (15.7%) were appointed through interagency transfer.
According to current projections (Table 10 and Figure 10), 981 staff members, representing 55.15.0% of the total workforce, are due to retire during the next five years (20.2% of the professional and higher categories). Over the next 10 years, 2102 staff members, or 32.1% of the overall workforce, are due to retire (41.6% of the professional and higher categories). Figure 10 shows retirements occurring during the calendar year, rather than as at 31 July of each year.
0
10
20
30
40
50
60
70
Staff in the professional and higher categories
Staff in the general service category
All staff Staff in the national professional officer category
Under 5 5–9 10–14 15–19 20–24 25–29 ≥30
Years
%
EB132/38
16
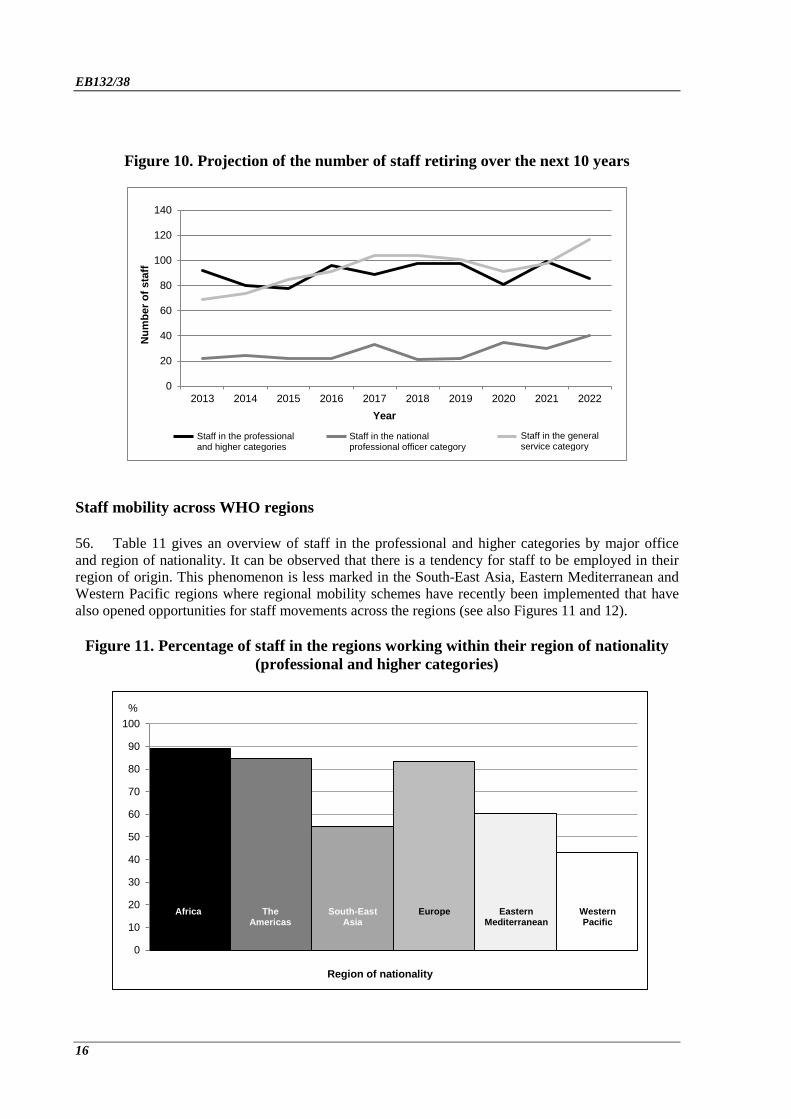
Figure 10. Projection of the number of staff retiring over the next 10 years
Staff mobility across WHO regions
Table 11 gives an overview of staff in the professional and higher categories by major office 56.and region of nationality. It can be observed that there is a tendency for staff to be employed in their region of origin. This phenomenon is less marked in the South-East Asia, Eastern Mediterranean and Western Pacific regions where regional mobility schemes have recently been implemented that have also opened opportunities for staff movements across the regions (see also Figures 11 and 12).
Figure 11. Percentage of staff in the regions working within their region of nationality (professional and higher categories)
0
20
40
60
80
100
120
140
2013 2014 2015 2016 2017 2018 2019 2020 2021 2022
0
10
20
30
40
50
60
70
80
90
100
Staff in the professional and higher categories
Staff in the national professional officer category
Staff in the general service category
Year
Africa The Americas
South-East Asia
Europe Eastern Mediterranean
Western Pacific
Region of nationality
%
Num
ber o
f sta
ff
EB132/38
17
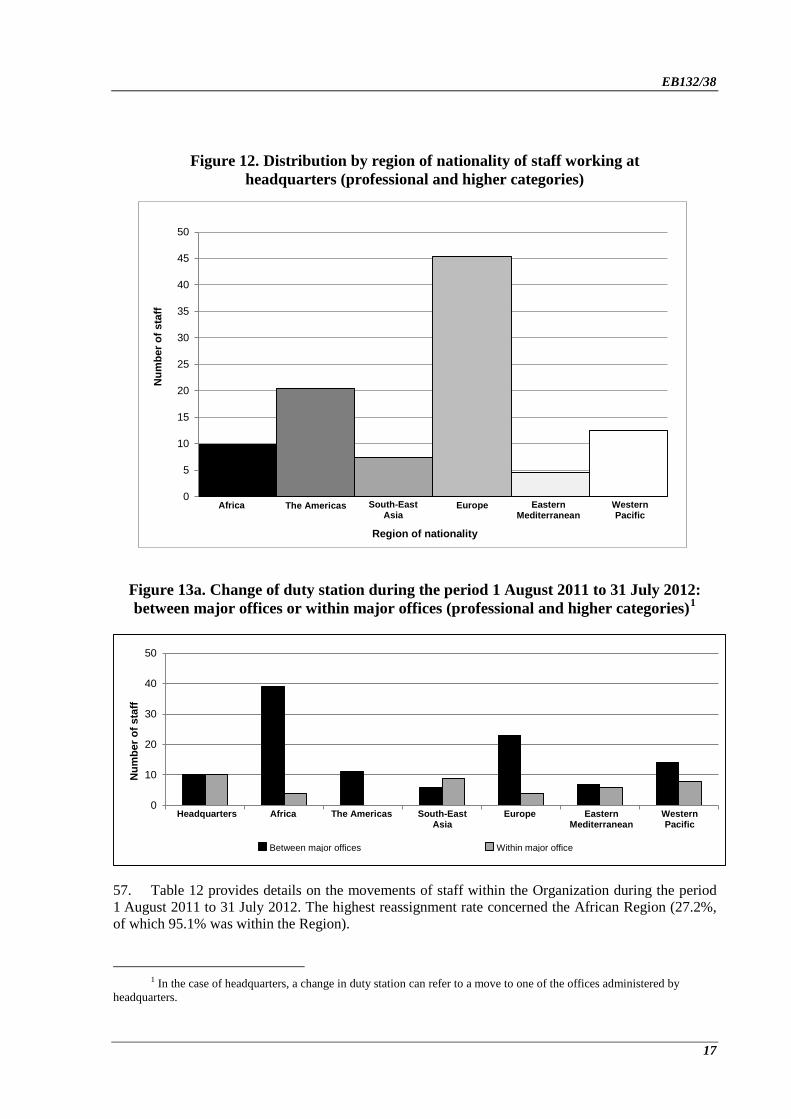
Figure 12. Distribution by region of nationality of staff working at headquarters (professional and higher categories)
Figure 13a. Change of duty station during the period 1 August 2011 to 31 July 2012: between major offices or within major offices (professional and higher categories)1
Table 12 provides details on the movements of staff within the Organization during the period 57.1 August 2011 to 31 July 2012. The highest reassignment rate concerned the African Region (27.2%, of which 95.1% was within the Region).
1 In the case of headquarters, a change in duty station can refer to a move to one of the offices administered by
headquarters.
0
5
10
15
20
25
30
35
40
45
50
0
10
20
30
40
50
Africa The Americas South-East Asia
Europe Eastern Mediterranean
Western Pacific
Region of nationality
Africa The Americas South-East Asia
Europe Eastern Mediterranean
Western Pacific
Headquarters
Between major offices Within major office
Num
ber o
f sta
ff
Num
ber o
f sta
ff
EB132/38
18
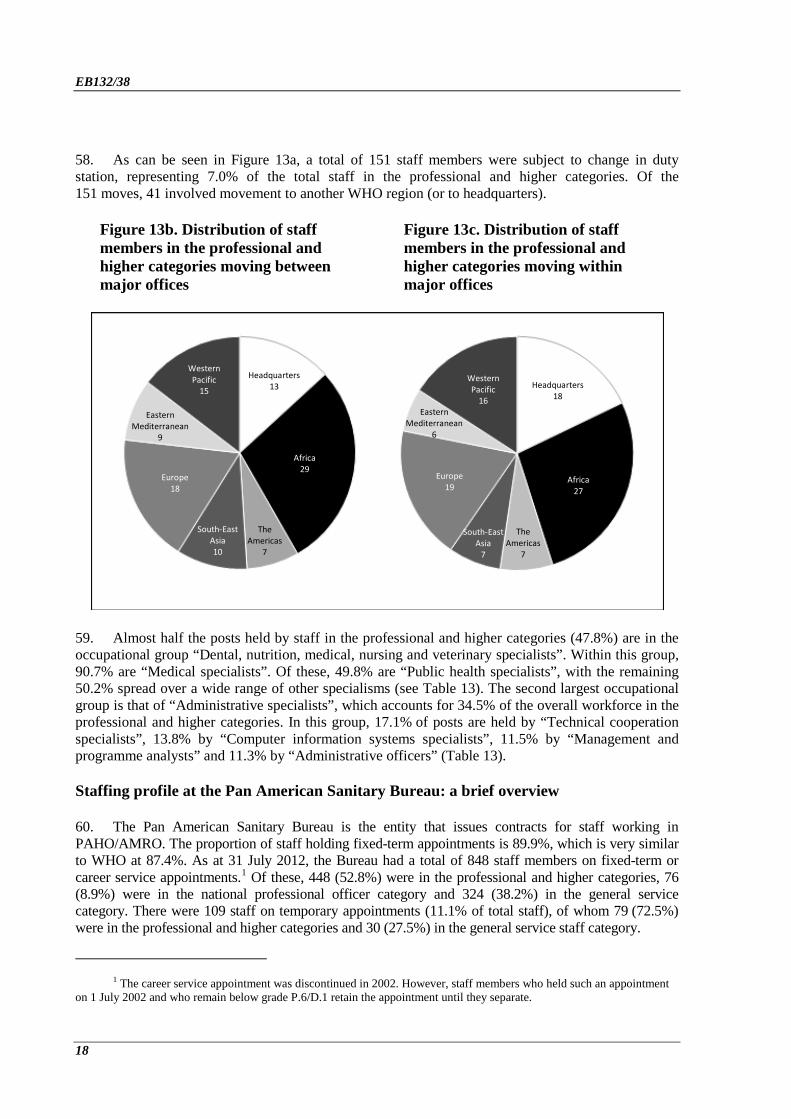
As can be seen in Figure 13a, a total of 151 staff members were subject to change in duty 58.station, representing 7.0% of the total staff in the professional and higher categories. Of the 151 moves, 41 involved movement to another WHO region (or to headquarters).
Figure 13b. Distribution of staff members in the professional and higher categories moving between major offices
Figure 13c. Distribution of staff members in the professional and higher categories moving within major offices
Almost half the posts held by staff in the professional and higher categories (47.8%) are in the 59.occupational group “Dental, nutrition, medical, nursing and veterinary specialists”. Within this group, 90.7% are “Medical specialists”. Of these, 49.8% are “Public health specialists”, with the remaining 50.2% spread over a wide range of other specialisms (see Table 13). The second largest occupational group is that of “Administrative specialists”, which accounts for 34.5% of the overall workforce in the professional and higher categories. In this group, 17.1% of posts are held by “Technical cooperation specialists”, 13.8% by “Computer information systems specialists”, 11.5% by “Management and programme analysts” and 11.3% by “Administrative officers” (Table 13).
Staffing profile at the Pan American Sanitary Bureau: a brief overview
The Pan American Sanitary Bureau is the entity that issues contracts for staff working in 60.PAHO/AMRO. The proportion of staff holding fixed-term appointments is 89.9%, which is very similar to WHO at 87.4%. As at 31 July 2012, the Bureau had a total of 848 staff members on fixed-term or career service appointments.1 Of these, 448 (52.8%) were in the professional and higher categories, 76 (8.9%) were in the national professional officer category and 324 (38.2%) in the general service category. There were 109 staff on temporary appointments (11.1% of total staff), of whom 79 (72.5%) were in the professional and higher categories and 30 (27.5%) in the general service staff category.
1 The career service appointment was discontinued in 2002. However, staff members who held such an appointment
on 1 July 2002 and who remain below grade P.6/D.1 retain the appointment until they separate.
Western Pacific
15
Headquarters 13
Western Pacific
16
Headquarters 18
Eastern Mediterranean
9
Eastern Mediterranean
6
Europe 18
Europe 19
South-East Asia 10
South-East Asia
7
The Americas
7
The Americas
7
Africa 29
Africa 27
EB132/38
19
In PAHO/AMRO country offices and subregional centres the percentage of women in the 61.professional and higher categories continues to increase. As at 31 July 2012, women made up 44% of this group, compared with 42% during the 2011 reporting period. At the Bureau’s headquarters in Washington, DC, the percentage of women in professional and higher categories has remained unchanged at 56%. As at 31 July 2012, 53% of the 40 new staff members appointed to fixed-term positions in these categories were women.
Among fixed-term staff members, 55.0% are based in the Bureau’s headquarters in 62.Washington, DC. This involves 268 staff in the professional and higher categories and 196 in the general service category. The remaining 45.0% of fixed-term staff – 180 in the professional and higher categories, 76 in the national professional officer category and 128 in the general service category – were based in country offices. A total of 53 countries are represented among the internationally recruited staff of the Pan American Sanitary Bureau, including 21 from regions other than the Region of the Americas.
As at 31 July 2012, there have been 18 staff reassignments involving staff in the professional 63.and higher categories. Fourteen of these reassignments concerned the movement of staff between PAHO’s country offices and centres; one involved staff moving from the Bureau’s headquarters to the countries; and three involved staff moving from country offices to the headquarters in Washington, DC.
NON-STAFF PROFILE
When the Executive Board considered the annual report at its 130th session, members expressed 64.their desire to have data on individuals employed by WHO on contracts that do not carry the status of staff member.1 The present section provides data on contracts of that type, namely: the Agreement for Performance of Work, the Special Service Agreement and Consultant contracts. Agreements for Performance of Work, Consultant contracts and Special Service Agreements are used and administered through the procurement module in the Global Management System. In addition, the present report includes details of Junior Professional Officers, who do not appear elsewhere in the report because they hold contracts issued by UNDP, as that agency provides a central service to WHO. As at 31 July 2012, no data were available for the Region of the Americas.
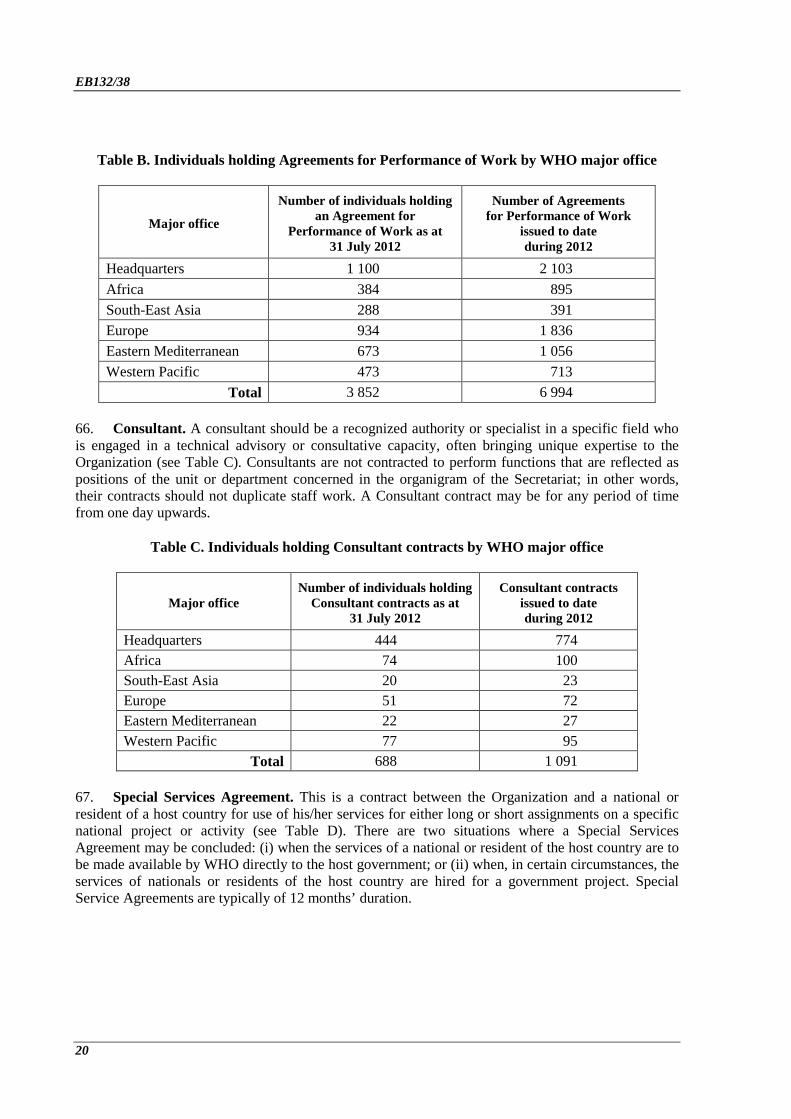
Agreement for Performance of Work. This type of agreement is used to contract individuals 65.or companies to provide services or prepare a specific product (see Table B). Examples of the type of activities for which an Agreement for Performance of Work should normally be used include the following: preparing a paper without the need for travel; translating a document; acting as a local conference organizer with responsibility for the logistics of a meeting or other event; and performing lay-out and design work. An individual engaged under an Agreement for Performance of Work is expected to deliver a results-oriented piece of work or services in a timely manner. In all cases, the individual concerned is paid a fixed-sum or maximum amount; does not normally work on WHO premises; does not perform work that requires close WHO technical guidance; and does not undertake travel for WHO (other than an occasional visit to WHO premises in order to present or discuss aspects of the work with WHO staff). An individual Agreement may be for any period of time from one day upwards.
1 See the summary records of the Executive Board at its 130th session, thirteenth meeting, section 3.
EB132/38
20
Table B. Individuals holding Agreements for Performance of Work by WHO major office
Major office
Number of individuals holding an Agreement for
Performance of Work as at 31 July 2012
Number of Agreements for Performance of Work
issued to date during 2012
Headquarters 1 100 2 103 Africa 384 895 South-East Asia 288 391 Europe 934 1 836 Eastern Mediterranean 673 1 056 Western Pacific 473 713
Total 3 852 6 994
Consultant. A consultant should be a recognized authority or specialist in a specific field who 66.is engaged in a technical advisory or consultative capacity, often bringing unique expertise to the Organization (see Table C). Consultants are not contracted to perform functions that are reflected as positions of the unit or department concerned in the organigram of the Secretariat; in other words, their contracts should not duplicate staff work. A Consultant contract may be for any period of time from one day upwards.
Table C. Individuals holding Consultant contracts by WHO major office
Major office Number of individuals holding
Consultant contracts as at 31 July 2012
Consultant contracts issued to date during 2012
Headquarters 444 774 Africa 74 100 South-East Asia 20 23 Europe 51 72 Eastern Mediterranean 22 27 Western Pacific 77 95
Total 688 1 091
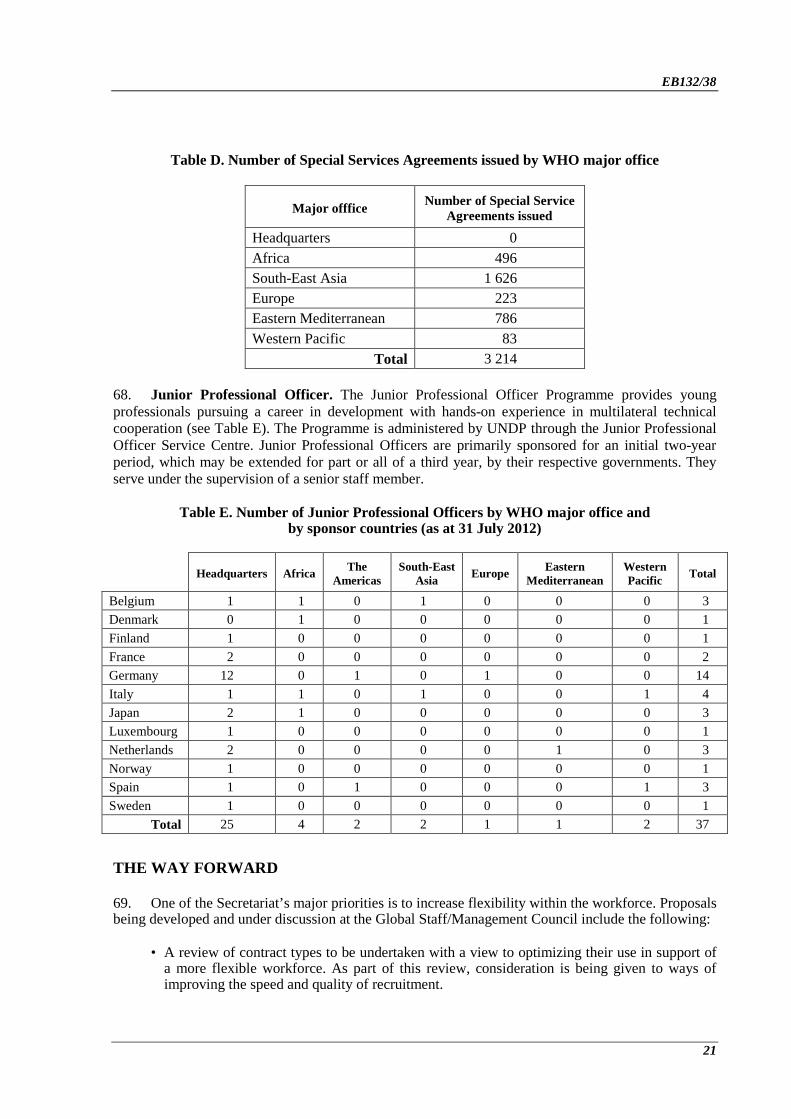
Special Services Agreement. This is a contract between the Organization and a national or 67.resident of a host country for use of his/her services for either long or short assignments on a specific national project or activity (see Table D). There are two situations where a Special Services Agreement may be concluded: (i) when the services of a national or resident of the host country are to be made available by WHO directly to the host government; or (ii) when, in certain circumstances, the services of nationals or residents of the host country are hired for a government project. Special Service Agreements are typically of 12 months’ duration.
EB132/38
21
Table D. Number of Special Services Agreements issued by WHO major office
Major offfice Number of Special Service Agreements issued
Headquarters 0 Africa 496 South-East Asia 1 626 Europe 223 Eastern Mediterranean 786 Western Pacific 83
Total 3 214
Junior Professional Officer. The Junior Professional Officer Programme provides young 68.professionals pursuing a career in development with hands-on experience in multilateral technical cooperation (see Table E). The Programme is administered by UNDP through the Junior Professional Officer Service Centre. Junior Professional Officers are primarily sponsored for an initial two-year period, which may be extended for part or all of a third year, by their respective governments. They serve under the supervision of a senior staff member.
Table E. Number of Junior Professional Officers by WHO major office and by sponsor countries (as at 31 July 2012)
Headquarters Africa The
Americas South-East
Asia Europe Eastern Mediterranean
Western Pacific Total
Belgium 1 1 0 1 0 0 0 3 Denmark 0 1 0 0 0 0 0 1 Finland 1 0 0 0 0 0 0 1 France 2 0 0 0 0 0 0 2 Germany 12 0 1 0 1 0 0 14 Italy 1 1 0 1 0 0 1 4 Japan 2 1 0 0 0 0 0 3 Luxembourg 1 0 0 0 0 0 0 1 Netherlands 2 0 0 0 0 1 0 3 Norway 1 0 0 0 0 0 0 1 Spain 1 0 1 0 0 0 1 3 Sweden 1 0 0 0 0 0 0 1
Total 25 4 2 2 1 1 2 37
THE WAY FORWARD
One of the Secretariat’s major priorities is to increase flexibility within the workforce. Proposals 69.being developed and under discussion at the Global Staff/Management Council include the following:
• A review of contract types to be undertaken with a view to optimizing their use in support of a more flexible workforce. As part of this review, consideration is being given to ways of improving the speed and quality of recruitment.
EB132/38
22
• A global, proactive placement mechanism is being developed in order to manage placement of all staff, through either mobility or reprofiling exercises, before consideration is given to external recruitment or promotions. The current reassignment process which is invoked for those eligible and triggered when a decision is taken to abolish an occupied position, will be managed under the aegis of this mechanism.
In support of increased staff mobility, it is planned to expand the schemes currently being 70.piloted within the regions and to reinforce them through global rosters and functional networks.
Work is also under way to set up a corporate fund to cover the cost of termination indemnities 71.due on termination of a contract. It is planned that, in a second phase of its activity, this fund will also support the significant future costs of mobility.
ACTION BY THE EXECUTIVE BOARD
The Board is invited to take note of this report. 72.
NUMBERED TABLES
The numbered tables referred to in the preceding paragraphs are listed below for ease of 73.reference (the information is as of 31 July 2012, unless otherwise stated):
Table 1 Number of staff holding long-term and temporary appointments
Table 2 Distribution of staff by major office, grade and sex
Table 3 Summary of countries not within range by region
Table 4a–f Distribution of staff in positions counted for geographical representation by country of origin
Table 5 Distribution of staff in positions not counted for geographical representation by country of origin
Table 6 Staff by age, sex and major office
Table 7 Staff by grade and age, all locations
Table 8 Staff by length of service
Table 9 Appointments processed from 1 January to 31 July 2012
Table 10 Staff retirement projections
Table 11 Total staff in the professional and higher categories by major office and region of nationality
Table 12 Staff mobility: change in duty station
Table 13 Distribution of occupied posts in the professional and higher categories across main occupational groups
EB
132/38
23
TABLE 1. NUMBER OF STAFF HOLDING LONG-TERM AND TEMPORARY APPOINTMENTS
Category Headquarters Special programmes
and collaborative arrangements
Africa The Americas South-East Asia Europe Eastern
Mediterranean Western Pacific Total
Long-term appointments Fixed-term appointments Professional staff 370 110 174 87 59 104 97 93 1 094 National professional staff 35 0 458 4 21 51 57 45 671 General service staff 293 22 836 46 101 108 202 147 1 755
Total 698 132 1 468 137 181 263 356 285 3 520 Continuing appointments Professional staff 489 62 186 12 76 91 77 69 1 062 National professional staff 1 0 117 1 20 32 22 15 208 General service staff 379 66 470 10 264 128 278 174 1 769
Total 869 128 773 23 360 251 377 258 3 039 Total number of long-term appointments 1 567 260 2 241 160 541 514 733 543 6 559
Temporary appointments Temporary appointments under Staff Rule 420.4 Professional staff 107 37 48 9 35 16 66 38 356 National professional staff 1 0 13 0 45 6 23 20 108 General service staff 67 13 26 2 108 14 33 37 300
Total 175 50 87 11 188 36 122 95 764 Temporary appointments of 60 days or less Professional staff 0 0 0 0 1 0 0 0 1 National professional staff 3 0 0 0 0 1 0 0 4 General service staff 3 0 1 0 0 2 0 2 8
Total 6 0 1 0 1 3 0 2 13 Total number of temporary appointments 181 50 88 11 189 39 122 97 777
Total number of staff 1 748 310 2 329 171 730 553 855 640 7 336
EB
132/38 24 TABLE 2. DISTRIBUTION OF STAFF BY MAJOR OFFICE, GRADE AND SEXa
Professional staff
Major office P1 P2 P3 P4 P5 P6/D1 D2 Ungraded Total Percentage
M F T M F T M F T M F T M F T M F T M F T M F T M F T M F Headquarters 0 0 0 7 25 32 62 95 157 134 152 286 177 99 276 53 17 70 21 4 25 8 5 13 462 397 859 53.8 46.2 Special programmes and collaborative arrangements 0 0 0 2 5 7 8 20 28 30 32 62 36 23 59 9 2 11 4 1 5 0 0 0 89 83 172 51.7 48.3 Africa 0 0 0 9 6 15 36 14 50 122 41 163 78 11 89 31 10 41 0 1 1 1 0 1 277 83 360 76.9 23.1 The Americas 0 1 1 2 5 7 5 6 11 38 24 62 11 5 16 1 0 1 0 0 0 0 1 1 57 42 99 57.6 42.4 South-East Asia 0 0 0 0 0 0 7 3 10 20 10 30 48 25 73 17 2 19 0 2 2 1 0 1 93 42 135 68.9 31.1 Europe 3 8 11 10 17 27 22 16 38 28 28 56 21 22 43 13 4 17 2 0 2 0 1 1 99 96 195 50.8 49.2 Eastern Mediterranean 2 1 3 3 7 10 15 10 25 42 13 55 36 17 53 19 4 23 3 1 4 1 0 1 121 53 174 69.5 30.5 Western Pacific 0 0 0 0 1 1 2 2 4 49 20 69 46 25 71 14 1 15 1 0 1 1 0 1 113 49 162 69.8 30.2 Total 5 10 15 33 66 99 157 166 323 463 320 783 453 227 680 157 40 197 31 9 40 12 7 19 1311 845 2156 60.8 39.2 Percentage by grade 33.3 66.7 100.0 33.3 66.7 100.0 48.6 51.4 100.0 59.1 40.9 100.0 66.6 33.4 100.0 79.7 20.3 100.0 77.5 22.5 100.0 63.2 36.8 100.0 60.8 39.2 100.0
Percentage of total
0.7
4.6
15.0
36.3
31.5
9.1
1.9
0.9
100.0 National professional officers
Major office A B C D Total Percentage
M F T M F T M F T M F T M F T M F Headquarters* 0 1 1 7 12 19 9 7 16 0 0 0 16 20 36 44.4 55.6 Special programmes and collaborative arrangements 0 0 0 0 0 0 0 0 0 0 0 0 0 0 0 0.0 0.0 Africa 11 2 13 143 36 179 256 121 377 5 1 6 415 160 575 72.2 27.8 The Americas 0 1 1 1 1 2 2 0 2 0 0 0 3 2 5 60.0 40.0 South-East Asia 4 2 6 5 6 11 15 8 23 1 0 1 25 16 41 61.0 39.0 Europe 6 6 12 21 33 54 8 9 17 0 0 0 35 48 83 42.2 57.8 Eastern Mediterranean 2 2 4 29 17 46 17 8 25 4 0 4 52 27 79 65.8 34.2 Western Pacific 0 8 8 12 16 28 7 16 23 0 1 1 19 41 60 31.7 68.3 Total 23 22 45 218 121 339 314 169 483 10 2 12 565 314 879 64.3 35.7 Percentage by grade 51.1 48.9 100.0 64.3 35.7 100.0 65.0 35.0 100.0 83.3 16.7 100.0 64.3 35.7 100.0
Percentage of total
5.1
38.6
54.9
1.4
100.0
General service staff
Major office G1 G2 G3 G4 G5 G6 G7 Total Percentage
M F T M F T M F T M F T M F T M F T M F T M F T M F Headquarters 0 0 0 1 0 1 16 7 23 26 98 124 60 247 307 56 150 206 3 8 11 162 510 672 24.1 75.9 Special programmes and collaborative arrangements 0 0 0 0 0 0 0 0 0 1 14 15 4 52 56 3 13 16 0 1 1 8 80 88 9.1 90.9 Africa 31 14 45 452 9 461 97 18 115 56 94 150 57 125 182 80 108 188 82 83 165 855 451 1306 65.5 34.5 The Americas 0 0 0 0 0 0 0 0 0 1 10 11 2 13 15 8 19 27 0 3 3 11 45 56 19.6 80.4 South-East Asia 7 1 8 62 0 62 34 7 41 27 40 67 44 53 97 33 15 48 28 14 42 235 130 365 64.4 35.6 Europe 0 0 0 14 0 14 15 9 24 7 25 32 25 113 138 9 17 26 1 1 2 71 165 236 30.1 69.9 Eastern Mediterranean 30 2 32 52 1 53 49 1 50 24 68 92 35 102 137 40 39 79 13 24 37 243 237 480 50.6 49.4 Western Pacific 3 4 7 20 0 20 23 9 32 6 51 57 8 89 97 23 53 76 8 24 32 91 230 321 28.3 71.7 Total 71 21 92 601 10 611 234 51 285 148 400 548 235 794 1029 252 414 666 135 158 293 1676 1848 3524 47.6 52.4 Percentage by grade 77.2 22.8 100.0 98.4 1.6 100.0 82.1 17.9 100.0 27.0 73.0 100.0 22.8 77.2 100.0 37.8 62.2 100.0 46.1 53.9 100.0 47.6 52.4 100.0 Percentage of total 2.6 17.3 8.1 15.6 29.2 18.9 8.3 100.0
a Includes all staff in all positions (including those not counted for geographical distribution purposes). * National professional officers appearing under Headquarters are located in offices outside Geneva (e.g. Addis Ababa, Kobe, Kuala Lumpur). M – male, F – female, T – total.
EB
132/38
25
TABLE 3. SUMMARY OF COUNTRIES NOT WITHIN RANGE BY REGION
Region Unrepresented countries Underrepresented countries Overrepresented countries Africa Lesotho Benin Swaziland Burkina Faso Burundi Cameroon Congo Côte d’Ivoire Democratic Republic of the Congo Ethiopia Ghana Guinea Kenya Malawi Mali Nigeria Rwanda Senegal Togo Uganda United Republic of Tanzania Zambia Zimbabwe The Americas Antigua and Barbuda Mexico Canada Bahamas Peru Barbados Belize Grenada Haiti Jamaica Paraguay Puerto Rico* Saint Kitts and Nevis Saint Lucia Saint Vincent and the Grenadines Suriname South-East Asia Indonesia Bangladesh India Nepal Sri Lanka
* Associate Member.
EB
132/38 26
Region Unrepresented countries Underrepresented countries Overrepresented countries Europe Andorra Austria Belgium Cyprus Israel Denmark Luxembourg France Monaco Ireland Montenegro Italy San Marino Netherlands The former Yugoslav Republic of Macedonia Serbia Spain Switzerland United Kingdom of Great Britain and Northern Ireland Eastern Mediterranean Kuwait Saudi Arabia Egypt Oman Iran (Islamic Republic of) Qatar Jordan South Sudan Lebanon United Arab Emirates Pakistan Sudan Tunisia Western Pacific Brunei Darussalam China Australia Cook Islands Japan Malaysia Kiribati Singapore New Zealand Lao People’s Democratic Republic Viet Nam Philippines Marshall Islands Micronesia (Federated States of) Nauru Niue Palau Papua New Guinea Samoa Singapore Tokelau* Tuvalu Vanuatu
*Associate Member.
EB
132/38
27
TABLE 4a. DISTRIBUTION OF STAFF IN POSITIONS COUNTED FOR GEOGRAPHICAL REPRESENTATIONa BY COUNTRY OF ORIGIN
Nationals of Member States in the African Region
Country Range
Staff by grade and sex
P1 P2 P3 P4 P5 P6/D1 D2 Ungraded All professional staff
M F M F M F M F M F M F M F M F M F Total Algeria 2-10 1 1 2 3 1 5 3 8 Angola 1-8 1 1 2 1 1 1 1 6 2 8 Benin 1-8 7 2 1 9 1 10 Botswana 1-8 1 0 1 1 Burkina Faso 1-8 1 2 4 2 4 1 11 3 14 Burundi 1-8 2 3 2 1 3 7 4 11 Cameroon 1-8 4 1 5 1 1 1 2 1 12 4 16 Cape Verde 1-7 1 0 1 1 Central African Republic 1-8 2 1 1 4 0 4 Chad 1-8 2 1 2 1 6 0 6 Comoros 1-7 1 1 0 1 Congo 1-8 3 4 3 1 1 12 0 12 Côte d’Ivoire 1-8 2 2 1 6 1 2 10 4 14 Democratic Republic of the Congo 2-12 2 12 1 3 1 1 19 1 20 Equatorial Guinea 1-7 1 1 0 1 Eritrea 1-8 1 3 4 0 4 Ethiopia 2-12 2 2 9 4 5 1 2 1 18 8 26 Gabon 1-8 2 1 1 2 2 4 Gambia 1-8 7 7 0 7 Ghana 1-8 1 1 1 3 4 4 1 1 1 10 7 17 Guinea 1-8 1 4 2 1 1 8 1 9 Guinea-Bissau 1-8 1 1 1 1 2 2 4
EB
132/38 28
Country Range
Staff by grade and sex
P1 P2 P3 P4 P5 P6/D1 D2 Ungraded All professional staff
M F M F M F M F M F M F M F M F M F Total Kenya 1-10 2 1 3 7 4 1 2 11 9 20 Lesotho 1-8 0 0 0 Liberia 1-8 1 1 0 1 Madagascar 1-8 1 1 1 2 3 2 5 Malawi 1-8 1 3 1 4 8 1 9 Mali 1-8 1 7 6 1 15 0 15 Mauritania 1-8 1 1 2 1 5 0 5 Mauritius 1-8 1 1 1 1 1 4 1 5 Mozambique 1-8 2 1 1 1 3 4 Namibia 1-8 1 2 2 1 3 Niger 1-8 2 1 3 1 5 2 7 Nigeria 4-14 1 3 8 5 1 2 19 1 20 Rwanda 1-8 1 2 3 10 1 16 1 17 Sao Tome and Principe 1-7 1 1 0 1 Senegal 1-8 5 3 4 2 1 1 1 10 7 17 Seychelles 1-7 1 0 1 1 Sierra Leone 1-8 1 1 2 1 3 4 South Africa 4-11 1 1 2 4 3 5 6 11 Swaziland 1-7 0 0 0 Togo 1-8 2 4 1 3 1 10 1 11 Uganda 1-8 7 4 6 1 1 14 5 19 United Republic of Tanzania 1-10 2 3 2 2 1 1 5 6 11 Zambia 1-8 3 3 2 2 2 7 5 12 Zimbabwe 1-8 1 2 4 2 1 4 1 1 12 4 16
Total 0 0 8 8 41 17 123 48 101 18 33 10 1 2 2 0 309 103 412 a Counted positions exclude: language positions, seconded staff and staff working in partnerships. M - male, F – female.
EB
132/38
29
TABLE 4b. DISTRIBUTION OF STAFF IN POSITIONS COUNTED FOR GEOGRAPHICAL REPRESENTATIONa BY COUNTRY OF ORIGIN
Nationals of Member States in the Region of the Americas
Country Range
Staff by grade and sex
P1 P2 P3 P4 P5 P6/D1 D2 Ungraded All professional staff
M F M F M F M F M F M F M F M F M F Total Antigua and Barbuda 1-7 0 0 0 Argentina 9-16 1 1 5 3 2 1 1 8 6 14 Bahamas 1-7 0 0 0 Barbados 1-7 0 0 0 Belize 1-7 0 0 0 Bolivia (Plurinational State of) 1-8 2 1 1 2 3 5 Brazil 21-29 1 3 4 7 5 4 4 14 14 28 Canada 19-26 1 2 5 11 8 9 2 2 2 1 1 24 20 44 Chile 2-9 1 2 1 1 2 3 4 7 Colombia 3-10 1 1 1 1 3 1 4 4 8 Costa Rica 1-8 1 2 2 1 3 Cuba 1-8 1 4 5 0 5 Dominica 1-7 1 0 1 1 Dominican Republic 1-8 2 2 0 2 Ecuador 1-8 1 1 2 2 3 3 6 El Salvador 1-8 1 2 1 2 3 Grenada 1-7 0 0 0 Guatemala 1-8 1 1 1 2 2 5 2 7 Guyana 1-7 1 1 0 2 2 Haiti 1-8 0 0 0 Honduras 1-8 1 1 2 0 2 Jamaica 1-8 0 0 0
30
EB
132/38
Country Range
Staff by grade and sex
P1 P2 P3 P4 P5 P6/D1 D2 Ungraded All professional staff
M F M F M F M F M F M F M F M F M F Total Mexico 11-17 1 4 2 1 1 1 4 6 10 Nicaragua 1-8 2 0 2 2 Panama 1-8 2 1 2 1 3 Paraguay 1-8 0 0 0 Peru 2-10 2 2 8 3 1 1 12 5 17 Puerto Rico* 1-8 0 0 0 Saint Kitts and Nevis 1-7 0 0 0 Saint Lucia 1-7 0 0 0 Saint Vincent and the Grenadines 1-7 0 0 0 Suriname 1-7 0 0 0 Trinidad and Tobago 1-8 1 2 1 2 2 4 United States of America 142-193 1 1 2 5 7 14 28 22 32 17 10 6 2 1 83 65 148 Uruguay 1-8 1 1 1 1 2 Venezuela (Bolivarian Republic of) 2-9 1 1 1 2 1 4 2 6
Total 1 2 4 10 14 33 76 61 60 28 21 10 4 0 2 2 182 146 328
a Counted positions exclude: language positions, seconded staff and staff working in partnerships. * Associate Member. M – male, F – female.
EB
132/38
31
TABLE 4c. DISTRIBUTION OF STAFF IN POSITIONS COUNTED FOR GEOGRAPHICAL REPRESENTATIONa BY COUNTRY OF ORIGIN
Nationals of Member States in the South-East Asia Region
Country Range
Staff by grade and sex
P1 P2 P3 P4 P5 P6/D1 D2 Ungraded All professional staff
M F M F M F M F M F M F M F M F M F Total Bangladesh 4-14 9 3 1 3 15 1 16 Bhutan 1-8 1 2 1 1 4 1 5 Democratic People’s Republic of
Korea 1-8 1 1 2 0 2
India 27-38 2 2 15 7 25 6 17 14 5 1 64 30 94 Indonesia 7-14 1 4 1 4 2 6 Maldives 1-7 1 1 1 1 2 Myanmar 2-10 1 2 2 3 2 5 Nepal 1-8 1 3 3 3 10 0 10 Sri Lanka 1-8 1 1 2 4 3 3 9 5 14 Thailand 4-12 1 1 4 2 1 4 5 9 Timor-Leste 1-7 1 1 0 1
Total 0 0 3 3 17 9 41 7 35 27 20 0 0 1 1 0 117 47 164
a Counted positions exclude: language positions, seconded staff and staff working in partnerships. M – male, F – female.
32
EB
132/38
TABLE 4d. DISTRIBUTION OF STAFF IN POSITIONS COUNTED FOR GEOGRAPHICAL REPRESENTATIONa BY COUNTRY OF ORIGIN
Nationals of Member States in the European Region
Country Range
Staff by grade and sex
P1 P2 P3 P4 P5 P6/D1 D2 Ungraded All professional staff
M F M F M F M F M F M F M F M F M F Total Albania 1-8 1 1 1 0 3 3 Andorra 1-7 0 0 0 Armenia 1-8 1 1 0 1 Austria 7-14 1 2 1 1 1 4 2 6 Azerbaijan 1-8 3 1 1 3 2 5 Belarus 1-8 2 1 1 2 3 Belgium 9-15 1 1 1 1 2 3 9 1 7 1 1 21 7 28 Bosnia and Herzegovina 1-8 1 1 0 1 Bulgaria 1-8 1 1 1 1 1 3 4 Croatia 1-8 1 1 2 1 1 2 4 6 Cyprus 1-7 0 0 0 Czech Republic 2-9 1 2 1 2 2 4 Denmark 6-12 1 3 2 2 4 2 5 1 1 12 9 21 Estonia 1-8 1 1 1 2 1 3 Finland 4-11 2 2 3 4 3 7 France 42-58 1 5 7 6 16 9 21 12 7 2 1 1 53 35 88 Georgia 1-8 1 1 1 1 2 3 Germany 63-86 1 2 5 8 16 13 20 10 3 2 1 45 36 81 Greece 4-11 1 1 1 1 2 2 4 Hungary 1-8 2 1 1 1 1 1 3 4 7 Iceland 1-7 1 0 1 1 Ireland 3-9 1 1 5 2 4 1 5 9 14 Israel 3-10 1 0 1 1 Italy 34-47 1 2 5 3 11 4 15 8 7 5 1 44 18 62 Kazakhstan 1-8 1 1 2 2 2 4 Kyrgyzstan 1-8 1 0 1 1
EB
132/38
33
Country Range
Staff by grade and sex
P1 P2 P3 P4 P5 P6/D1 D2 Ungraded All professional staff
M F M F M F M F M F M F M F M F M F Total Latvia 1-8 1 1 0 2 2 Lithuania 1-8 1 0 1 1 Luxembourg 1-8 0 0 0 Malta 1-7 2 1 1 3 1 4 Monaco 1-7 0 0 0 Montenegro 1-7 0 0 0 Netherlands 13-20 2 1 2 4 4 14 4 6 3 1 26 15 41 Norway 5-12 1 2 2 1 1 2 5 7 Poland 4-11 1 1 1 2 1 3 3 6 Portugal 4-10 3 1 1 1 4 5 Republic of Moldova 1-8 1 1 2 1 2 3 5 Romania 1-8 1 3 1 3 4 Russian Federation 12-19 2 4 1 2 1 3 3 1 10 7 17 San Marino 1-7 0 0 0 Serbia 1-8 1 1 2 2 3 3 6 9 Slovakia 1-8 1 1 0 1 Slovenia 1-8 1 0 1 1 Spain 18-26 1 1 1 3 1 5 4 4 3 2 1 1 16 11 27 Sweden 8-14 1 4 1 2 2 3 1 4 10 14 Switzerland 9-16 1 1 6 7 3 4 1 4 11 16 27 Tajikistan 1-8 1 2 0 3 3 The former Yugoslav Republic of
Macedonia 1-8 0 0 0
Turkey 5-12 3 1 3 1 1 5 4 9 Turkmenistan 1-8 1 1 1 1 2 3 Ukraine 2-10 2 1 1 2 2 4 United Kingdom of Great Britain
and Northern Ireland 37-51 1 2 4 4 3 9 16 14 17 15 6 1 3 1 50 46 96
Uzbekistan 1-10 1 1 0 1 Total 3 6 11 26 45 61 103 95 127 86 47 12 14 4 1 4 351 294 645
a Counted positions exclude: language positions, seconded staff and staff working in partnerships. M – male, F – female.
34
EB
132/38
TABLE 4e. DISTRIBUTION OF STAFF IN POSITIONS COUNTED FOR GEOGRAPHICAL REPRESENTATIONa BY COUNTRY OF ORIGIN
Nationals of Member States in the Eastern Mediterranean Region
Country Range
Staff by grade and sex
P1 P2 P3 P4 P5 P6/D1 D2 Ungraded All professional staff
M F M F M F M F M F M F M F M F M F Total Afghanistan 1-8 1 1 1 1 3 1 4 Bahrain 1-7 1 1 0 2 2 Djibouti 1-7 1 1 2 0 2 Egypt 3-12 1 2 3 3 2 7 3 2 4 14 13 27 Iran (Islamic Republic of) 4-12 1 5 2 4 1 1 10 4 14 Iraq 2-9 3 1 4 0 4 Jordan 1-8 1 3 1 2 2 1 1 1 8 4 12 Kuwait 1-8 0 0 0 Lebanon 1-8 2 2 2 2 1 2 6 5 11 Libya 1-8 1 1 0 1 Morocco 1-10 1 1 1 1 1 2 4 3 7 Oman 1-8 0 0 0 Pakistan 5-14 1 7 1 9 3 20 1 21 Qatar 1-7 0 0 0 Saudi Arabia 5-11 1 1 1 1 2 2 4 Somalia 1-8 2 1 1 1 3 2 5 South Sudan 1-7 0 0 0 Sudan 1-10 1 1 5 2 2 3 11 3 14 Syrian Arab Republic 1-8 1 1 2 1 4 1 5 Tunisia 1-8 2 2 1 1 2 1 6 3 9 United Arab Emirates 2-8 0 0 0 Yemen 1-8 2 1 1 4 0 4
Total 0 1 2 3 13 4 36 18 32 13 14 4 2 1 3 0 102 44 146
a Counted positions exclude: language positions, seconded staff and staff working in partnerships. M – male, F – female.
EB
132/38
35
TABLE 4f. DISTRIBUTION OF STAFF IN POSITIONS COUNTED FOR GEOGRAPHICAL REPRESENTATIONa BY COUNTRY OF ORIGIN
Nationals of Member States in the Western Pacific Region
Country Range
Staff by grade and sex
P1 P2 P3 P4 P5 P6/D1 D2 Ungraded All professional staff
M F M F M F M F M F M F M F M F M F Total Australia 12-19 1 3 1 2 8 6 6 4 4 1 2 21 17 38 Brunei Darussalam 1-7 0 0 0 Cambodia 1-8 1 1 2 0 2 China 40-55 1 3 5 8 9 3 4 1 1 20 15 35 Cook Islands 1-7 0 0 0 Fiji 1-7 2 1 2 1 3 Japan 121-166 1 2 2 1 5 8 12 6 1 1 1 23 17 40 Kiribati 1-7 0 0 0 Lao People’s Democratic Republic 1-8 0 0 0 Malaysia 3-9 3 2 2 3 1 6 5 11 Marshall Islands 1-7 0 0 0 Micronesia (Federated States of) 1-7 0 0 0 Mongolia 1-8 4 1 1 1 5 6 Nauru 1-7 0 0 0 New Zealand 2-9 2 2 2 4 1 7 4 11 Niue 1-7 0 0 0 Palau 1-7 0 0 0 Papua New Guinea 1-8 0 0 0 Philippines 3-12 1 1 6 7 5 9 4 1 1 1 18 18 36 Republic of Korea 15-21 1 5 3 3 4 1 1 10 8 18 Samoa 1-7 0 0 0 Singapore 3-10 1 1 0 1 Solomon Islands 1-7 1 1 0 1 Tokelau* 1-7 0 0 0 Tonga 1-7 1 0 1 1 Tuvalu 1-7 0 0 0 Vanuatu 1-7 0 0 0 Viet Nam 3-12 1 1 0 1
Total 0 1 2 6 13 14 34 41 44 26 11 2 6 0 3 1 113 91 204
a Counted positions exclude: language positions, seconded staff and staff working in partnerships. M – male, F – female.
36
EB
132/38
TABLE 5. DISTRIBUTION OF STAFF IN POSITIONS NOT COUNTED FOR GEOGRAPHICAL REPRESENTATIONa BY COUNTRY OF ORIGIN
Country Range
Staff by grade and sex
P1 P2 P3 P4 P5 P6/D1 D2 Ungraded All professional staff
M F M F M F M F M F M F M F M F M F Total Algeria 2-10 1 1 2 0 2 Argentina 9-16 1 1 0 1 Armenia 1-8 1 0 1 1 Australia 12-19 1 1 1 1 1 1 1 2 5 7 Belgium 9-15 1 1 3 1 2 4 4 8 Brazil 21-29 1 1 0 2 2 Bulgaria 1-8 1 1 1 1 2 Cameroon 1-8 2 0 2 2 Canada 19-26 1 1 1 2 3 4 4 8 China 40-55 1 1 1 2 1 3 Colombia 3-10 1 0 1 1 Cote d’Ivoire 1-8 1 1 0 1 Cuba 1-8 1 0 1 1 Czech Republic 2-9 1 0 1 1 Egypt 3-12 1 1 1 2 1 3 Ethiopia 2-12 1 0 1 1 Finland 4-11 1 1 0 1 France 42-58 1 3 2 6 5 3 2 13 9 22 Germany 63-86 2 5 1 2 3 7 10 Ghana 1-8 1 1 0 2 2 Greece 4-11 1 1 0 1 Guinea 1-8 1 0 1 1 Hungary 1-8 1 1 1 1 2 India 27-38 1 1 1 4 3 2 1 5 8 13 Iran 4-12 1 1 2 0 2 Ireland 3-9 2 2 0 2 Italy 34-47 1 1 1 1 2 2 3 5 8 Japan 121-166 1 0 1 1 Jordan 1-8 1 0 1 1 Kenya 1-8 1 1 1 1 2
EB
132/38
37
Country Range
Staff by grade and sex
P1 P2 P3 P4 P5 P6/D1 D2 Ungraded All professional staff
M F M F M F M F M F M F M F M F M F Total Republic of Korea 15-21 1 1 1 2 1 3 Lebanon 1-8 1 0 1 1 Mali 1-8 1 1 1 1 2 Mexico 11-17 1 1 1 1 2 Netherlands 13-20 2 0 2 2 New Zealand 1-7 1 1 2 0 2 Nigeria 4-14 2 0 2 2 Norway 5-12 1 1 0 1 Pakistan 5-14 1 2 1 1 0 5 5 Philippines 3-12 1 1 1 2 1 3 Portugal 4-11 1 1 0 2 2 Romania 1-8 1 1 0 1 Russian Federation 12-19 1 2 2 2 3 4 7 Senegal 1-8 1 1 1 1 2 Sierra Leone 1-8 1 1 0 1 South Africa 4-11 1 0 1 1 Spain 18-26 1 3 1 1 1 5 2 7 Sudan 1-10 1 0 1 1 Sweden 8-14 1 1 1 2 1 3 Switzerland 9-16 2 2 0 4 4 United Republic of Tanzania 1-10 1 1 1 1 2 Thailand 4-12 1 1 0 1 Tunisia 1-8 1 1 0 1 Turkey 5-12 1 1 1 1 2 Uganda 1-8 1 1 2 1 3 4 United Kingdom 37-51 1 3 1 4 2 5 4 1 2 14 9 23 United States of America 142-193 1 3 19 8 7 14 2 27 27 54 Viet Nam 3-12 1 1 0 1 Zambia 1-8 2 0 2 2 Zimbabwe 1-8 1 0 1 1 Others 1 1 0 2 2
Total 0 1 10 3 28 14 50 50 29 54 2 11 1 4 0 0 120 137 257
a Positions not counted for geographical distribution are: language positions, seconded staff and staff working in Special programmes and collaborative arrangements (partnerships). M – male, F – female.
38
EB
132/38
TABLE 6. STAFF BY AGE, SEX AND MAJOR OFFICE Professional and higher categories
Major office 20–29 years 30–39 years 40–49 years 50–59 years 60–62 years Over 62 years Total
M F T M F T M F T M F T M F T M F T M F T Headquarters 1 2 3 39 65 104 167 178 345 228 129 357 24 21 45 3 2 5 462 397 859 Special programmes and collaborative arrangements
0
0
0
8
17
25
37
43
80
37
20
57
7
3
10
0
0
0
89
83
172
Africa 0 0 0 7 5 12 85 30 115 150 40 190 35 8 43 0 0 0 277 83 360 The Americas 0 0 0 4 5 9 19 13 32 27 22 49 7 1 8 0 1 1 57 42 99 South-East Asia 0 0 0 3 5 8 20 17 37 56 15 71 13 4 17 1 1 2 93 42 135 Europe 2 0 2 15 25 40 44 47 91 33 22 55 4 2 6 1 0 1 99 96 195 Eastern Mediterranean 0 0 0 7 4 11 35 21 56 70 27 97 8 1 9 1 0 1 121 53 174 Western Pacific 0 2 2 10 2 12 48 22 70 44 20 64 10 3 13 1 0 1 113 49 162 Total 3 4 7 93 128 221 455 371 826 645 295 940 108 43 151 7 4 11 1 311 845 2 156 Percentage by bracket 42.9 57.1 100.0 42.1 57.9 100.0 55.1 44.9 100.0 68.6 31.4 100.0 71.5 28.5 100.0 63.6 36.4 100.0 60.8 39.2 100.0 Percentage of total 0.3 10.3 38.3 43.6 7.0 0.5 100.0
National professional
Major office 20–29 years 30–39 years 40–49 years 50–59 years 60–62 years Over 62 years Total
M F T M F T M F T M F T M F T M F T M F T Headquarters 1 2 3 13 10 23 2 7 9 0 1 1 0 0 0 0 0 0 16 20 36 Special programmes and collaborative arrangements
0
0
0
0
0
0
0
0
0
0
0
0
0
0
0
0
0
0
0
0
0
Africa 1 1 2 53 16 69 183 65 248 151 72 223 27 6 33 0 0 0 415 160 575 The Americas 0 0 0 0 0 0 1 0 1 1 2 3 1 0 1 0 0 0 3 2 5 South-EastAsia 0 0 0 2 5 7 5 4 9 17 5 22 1 2 3 0 0 0 25 16 41 Europe 0 0 0 6 15 21 17 21 38 9 12 21 3 0 3 0 0 0 35 48 83 Eastern Mediterranean 0 0 0 12 8 20 18 13 31 21 6 27 1 0 1 0 0 0 52 27 79 Western Pacific 0 1 1 5 10 15 9 19 28 4 11 15 1 0 1 0 0 0 19 41 60 Total 2 4 6 91 64 155 235 129 364 203 109 312 34 8 42 0 0 0 565 314 879 Percentage by bracket 33.3 66.7 100.0 58.7 41.3 100.0 64.6 35.4 100.0 65.1 34.9 100.0 81.0 19.0 100.0 0.0 0.0 0.0 64.3 35.7 100.0 Percentage of total 0.7 17.6 41.4 35.5 4.8 0.0 100.0
M – male, F – female, T – total.
EB
132/38
39
General service
Major office 20–29 years 30–39 years 40–49 years 50–59 years 60–62 years Over 62 years Total
M F T M F T M F T M F T M F T M F T M F T Headquarters 8 21 29 48 138 186 62 167 229 40 170 210 4 14 18 0 0 0 162 510 672 Special programmes and collaborative arrangements
0 0 0 2 16 18 5 20 25 1 42 43 0 2 2 0 0 0 8 80 88
Africa 9 11 20 146 124 270 392 183 575 283 127 410 25 6 31 0 0 0 855 451 1 306 The Americas 0 0 0 4 1 5 5 12 17 2 28 30 0 3 3 0 1 1 11 45 56 South-East Asia 4 6 10 54 46 100 85 43 128 85 32 117 7 3 10 0 0 0 235 130 365 Europe 1 7 8 20 53 73 35 59 94 13 41 54 2 5 7 0 0 0 71 165 236 Eastern Mediterranean 14 23 37 72 84 156 86 83 169 69 45 114 2 2 4 0 0 0 243 237 480 Western Pacific 4 18 22 26 76 102 27 71 98 33 61 94 1 4 5 0 0 0 91 230 321 Total 40 86 126 372 538 910 697 638 1 335 526 546 1.072 41 39 80 0 1 1 1 676 1 848 3 524
Percentage by bracket 31.7 68.3 100.0 40.9 59.1 100.0 52.2 47.8 100.0 49.1 50.9 100.0 51.3 48.8 100.0 0.0 100.0 100.0 47.6 52.4 100.0
Percentage of total 3.6 25.8 37.9 30.4 2.3 0.0 100.0
M – male, F – female, T – total.
40
EB
132/38
TABLE 7. STAFF BY GRADE AND AGE, ALL LOCATIONS Professional and higher categories
Grade 20–29 years 30–39 years 40–49 years 50–59 years 60–62 years Over 62 years Total
M F T M F T M F T M F T M F T M F T M F T Ungraded 0 0 0 0 0 0 1 0 1 5 3 8 2 2 4 4 2 6 12 7 19 D2 0 0 0 0 0 0 2 0 2 24 6 30 4 2 6 1 1 2 31 9 40 D1/P6 0 0 0 0 1 1 20 12 32 108 24 132 27 3 30 2 0 2 157 40 197 P5 0 0 0 4 2 6 135 91 226 268 117 385 46 16 62 0 1 1 453 227 680 P4 0 0 0 41 36 77 213 169 382 186 99 285 23 16 39 0 0 0 463 320 783 P3 2 2 4 33 56 89 69 70 139 48 34 82 5 4 9 0 0 0 157 166 323 P2 0 2 2 13 25 38 13 27 40 6 12 18 1 0 1 0 0 0 33 66 99 P1 1 0 1 2 8 10 2 2 4 0 0 0 0 0 0 0 0 0 5 10 15 Total 3 4 7 93 128 221 455 371 826 645 295 940 108 43 151 7 4 11 1 311 845 2 156 Percentage by bracket 42.9 57.1 100.0 42.1 57.9 100.0 55.1 44.9 100.0 68.6 31.4 100.0 71.5 28.5 100.0 63.6 36.4 100.0 60.8 39.2 100.0 Percentage of total 0.3 10.3 38.3 43.6 7.0 0.5 100.0
National professional
Grade 20–29 years 30–39 years 40–49 years 50–59 years 60–62 years Over 62 years Total
M F T M F T M F T M F T M F T M F T M F T D 0 1 1 5 9 14 13 6 19 5 6 11 0 0 0 0 0 0 23 22 45
C 2 2 4 51 38 89 97 44 141 54 34 88 14 3 17 0 0 0 218 121 339
B 0 1 1 35 17 52 122 77 199 137 69 206 20 5 25 0 0 0 314 169 483
A 0 0 0 0 0 0 3 2 5 7 0 7 0 0 0 0 0 0 10 2 12
Total 2 4 6 91 64 155 235 129 364 203 109 312 34 8 42 0 0 0 565 314 879 Percentage by bracket 33.3 66.7 100.0 58.7 41.3 100.0 64.6 35.4 100.0 65.1 34.9 100.0 81.0 19.0 100.0 0.0 0.0 0.0 64.3 35.7 100.0 Percentage of total 0.7 17.6 41.4 35.5 4.8 0.0 100.0
EB
132/38
41
General service
Grade 20–29 years 30–39 years 40–49 years 50–59 years 60–62 years Over 62 years Total
M F T M F T M F T M F T M F T M F T M F T G7 1 2 3 33 27 60 54 49 103 43 76 119 4 4 8 0 0 0 135 158 293
G6 13 5 18 82 86 168 109 162 271 43 152 195 5 9 14 0 0 0 252 414 666
G5 10 34 44 59 245 304 99 273 372 65 223 288 2 19 21 0 0 0 235 794 1029
G4 9 37 46 42 158 200 50 125 175 44 74 118 3 5 8 0 1 1 148 400 548
G3 3 6 9 46 13 59 95 19 114 82 12 94 8 1 9 0 0 0 234 51 285
G2 1 1 2 86 4 90 269 1 270 226 3 229 19 1 20 0 0 0 601 10 611
G1 3 1 4 24 5 29 21 9 30 23 6 29 0 0 0 71 21 92 Total 40 86 126 372 538 910 697 638 1335 526 546 1072 41 39 80 0 1 1 1676 1848 3524 Percentage by bracket 31.7 68.3 100.0 40.9 59.1 100.0 52.2 47.8 100.0 49.1 50.9 100.0 51.3 48.8 100.0 0.0 100.0 100.0 47.6 52.4 100 Percentage of total
3.6
25.8
37.9
30.4
2.3
0.0
100.0
M – male, F – female, T – total.
42
EB
132/38
TABLE 8. STAFF BY LENGTH OF SERVICE
Major office Under 5 years 5–9 years 10–14 years 15–19 years 20–24 years 25–29 years ≥30 years All
P NPO GS T P NPO GS T P NPO GS T P NPO GS T P NPO GS T P NPO GS T P NPO GS T P NPO GS T
Headquarters 228 35 199 462 389 1 268 658 132 0 82 214 53 0 16 69 36 0 66 102 18 0 30 48 3 0 11 14 859 36 672 1567
Special programmes and collaborative arrangements
78 0 17 95 64 0 34 98 16 0 17 33 9 0 2 11 4 0 13 17 0 0 3 3 1 0 2 3 172 0 88 260
Africa 77 359 314 750 169 136 795 1100 82 73 56 211 12 1 43 56 16 5 48 69 0 1 34 35 4 0 16 20 360 575 1306 2241
The Americas 26 2 13 41 23 1 5 29 28 0 11 39 10 0 7 17 6 0 7 13 5 1 5 11 1 1 8 10 99 5 56 160
South-East Asia 45 20 68 133 52 12 124 188 20 2 53 75 10 0 43 53 3 3 41 47 5 4 30 39 0 0 6 6 135 41 365 541
Europe 75 28 69 172 84 53 128 265 18 2 17 37 5 0 9 14 11 0 7 18 1 0 2 3 1 0 4 5 195 83 236 514
Eastern Mediterranean 62 51 129 242 66 15 243 324 32 8 31 71 8 1 27 36 2 1 29 32 4 2 13 19 0 1 8 9 174 79 480 733
Western Pacific 73 39 108 220 52 13 104 169 25 0 50 75 10 1 22 33 1 5 21 27 0 1 10 11 1 1 6 8 162 60 321 543
Total 664 534 917 2115 899 231 1701 2831 353 85 317 755 117 3 169 289 79 14 232 325 33 9 127 169 11 3 61 75 2156 879 3524 6559
Percentage by bracket 31.4 25.2 43.4 100.0 31.8 8.2 60.1 100.0 46.8 11.3 42.0 100.0 40.5 1.0 58.5 100.0 24.3 4.3 71.4 100.0 19.5 5.3 75.1 100.0 14.7 4.0 81.3 100.0 32.9 13.4 53.7 100.0
Percentage of total 32.2 43.2 11.5 4.4 5.0 2.6 1.1 100.0
P – professional and higher categories, NPO – national professional officer, GS – general service, T – total.
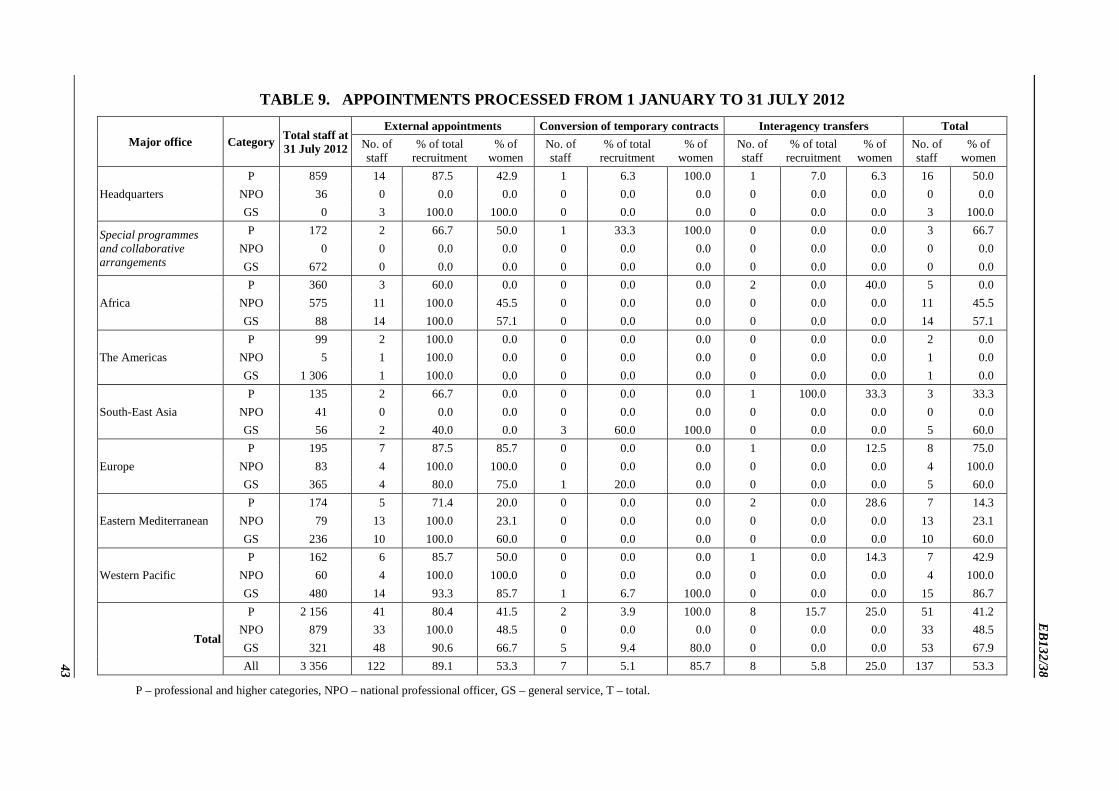
EB
132/38
43
TABLE 9. APPOINTMENTS PROCESSED FROM 1 JANUARY TO 31 JULY 2012
Major office Category Total staff at 31 July 2012
External appointments Conversion of temporary contracts Interagency transfers Total No. of staff
% of total recruitment
% of women
No. of staff
% of total recruitment
% of women
No. of staff
% of total recruitment
% of women
No. of staff
% of women
Headquarters P 859 14 87.5 42.9 1 6.3 100.0 1 7.0 6.3 16 50.0
NPO 36 0 0.0 0.0 0 0.0 0.0 0 0.0 0.0 0 0.0 GS 0 3 100.0 100.0 0 0.0 0.0 0 0.0 0.0 3 100.0
Special programmes and collaborative arrangements
P 172 2 66.7 50.0 1 33.3 100.0 0 0.0 0.0 3 66.7 NPO 0 0 0.0 0.0 0 0.0 0.0 0 0.0 0.0 0 0.0 GS 672 0 0.0 0.0 0 0.0 0.0 0 0.0 0.0 0 0.0
Africa P 360 3 60.0 0.0 0 0.0 0.0 2 0.0 40.0 5 0.0
NPO 575 11 100.0 45.5 0 0.0 0.0 0 0.0 0.0 11 45.5 GS 88 14 100.0 57.1 0 0.0 0.0 0 0.0 0.0 14 57.1
The Americas P 99 2 100.0 0.0 0 0.0 0.0 0 0.0 0.0 2 0.0
NPO 5 1 100.0 0.0 0 0.0 0.0 0 0.0 0.0 1 0.0 GS 1 306 1 100.0 0.0 0 0.0 0.0 0 0.0 0.0 1 0.0
South-East Asia P 135 2 66.7 0.0 0 0.0 0.0 1 100.0 33.3 3 33.3
NPO 41 0 0.0 0.0 0 0.0 0.0 0 0.0 0.0 0 0.0 GS 56 2 40.0 0.0 3 60.0 100.0 0 0.0 0.0 5 60.0
Europe P 195 7 87.5 85.7 0 0.0 0.0 1 0.0 12.5 8 75.0
NPO 83 4 100.0 100.0 0 0.0 0.0 0 0.0 0.0 4 100.0 GS 365 4 80.0 75.0 1 20.0 0.0 0 0.0 0.0 5 60.0
Eastern Mediterranean P 174 5 71.4 20.0 0 0.0 0.0 2 0.0 28.6 7 14.3
NPO 79 13 100.0 23.1 0 0.0 0.0 0 0.0 0.0 13 23.1 GS 236 10 100.0 60.0 0 0.0 0.0 0 0.0 0.0 10 60.0
Western Pacific P 162 6 85.7 50.0 0 0.0 0.0 1 0.0 14.3 7 42.9
NPO 60 4 100.0 100.0 0 0.0 0.0 0 0.0 0.0 4 100.0 GS 480 14 93.3 85.7 1 6.7 100.0 0 0.0 0.0 15 86.7
Total
P 2 156 41 80.4 41.5 2 3.9 100.0 8 15.7 25.0 51 41.2 NPO 879 33 100.0 48.5 0 0.0 0.0 0 0.0 0.0 33 48.5 GS 321 48 90.6 66.7 5 9.4 80.0 0 0.0 0.0 53 67.9 All 3 356 122 89.1 53.3 7 5.1 85.7 8 5.8 25.0 137 53.3
P – professional and higher categories, NPO – national professional officer, GS – general service, T – total.
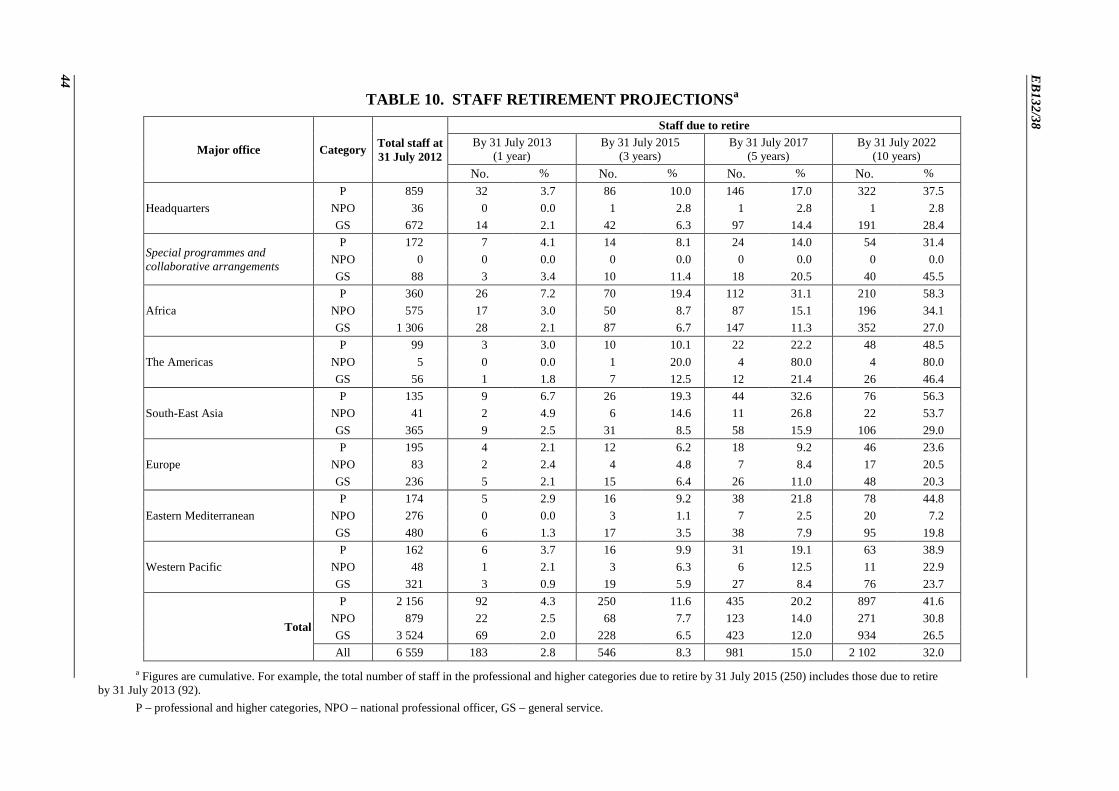
44
EB
132/38
TABLE 10. STAFF RETIREMENT PROJECTIONSa
Major office Category Total staff at 31 July 2012
Staff due to retire By 31 July 2013
(1 year) By 31 July 2015
(3 years) By 31 July 2017
(5 years) By 31 July 2022
(10 years) No. % No. % No. % No. %
Headquarters P 859 32 3.7 86 10.0 146 17.0 322 37.5
NPO 36 0 0.0 1 2.8 1 2.8 1 2.8 GS 672 14 2.1 42 6.3 97 14.4 191 28.4
Special programmes and collaborative arrangements
P 172 7 4.1 14 8.1 24 14.0 54 31.4 NPO 0 0 0.0 0 0.0 0 0.0 0 0.0 GS 88 3 3.4 10 11.4 18 20.5 40 45.5
Africa P 360 26 7.2 70 19.4 112 31.1 210 58.3
NPO 575 17 3.0 50 8.7 87 15.1 196 34.1 GS 1 306 28 2.1 87 6.7 147 11.3 352 27.0
The Americas P 99 3 3.0 10 10.1 22 22.2 48 48.5
NPO 5 0 0.0 1 20.0 4 80.0 4 80.0 GS 56 1 1.8 7 12.5 12 21.4 26 46.4
South-East Asia P 135 9 6.7 26 19.3 44 32.6 76 56.3
NPO 41 2 4.9 6 14.6 11 26.8 22 53.7 GS 365 9 2.5 31 8.5 58 15.9 106 29.0
Europe P 195 4 2.1 12 6.2 18 9.2 46 23.6
NPO 83 2 2.4 4 4.8 7 8.4 17 20.5 GS 236 5 2.1 15 6.4 26 11.0 48 20.3
Eastern Mediterranean P 174 5 2.9 16 9.2 38 21.8 78 44.8
NPO 276 0 0.0 3 1.1 7 2.5 20 7.2 GS 480 6 1.3 17 3.5 38 7.9 95 19.8
Western Pacific P 162 6 3.7 16 9.9 31 19.1 63 38.9
NPO 48 1 2.1 3 6.3 6 12.5 11 22.9 GS 321 3 0.9 19 5.9 27 8.4 76 23.7
Total
P 2 156 92 4.3 250 11.6 435 20.2 897 41.6 NPO 879 22 2.5 68 7.7 123 14.0 271 30.8 GS 3 524 69 2.0 228 6.5 423 12.0 934 26.5 All 6 559 183 2.8 546 8.3 981 15.0 2 102 32.0
a Figures are cumulative. For example, the total number of staff in the professional and higher categories due to retire by 31 July 2015 (250) includes those due to retire by 31 July 2013 (92).
P – professional and higher categories, NPO – national professional officer, GS – general service.
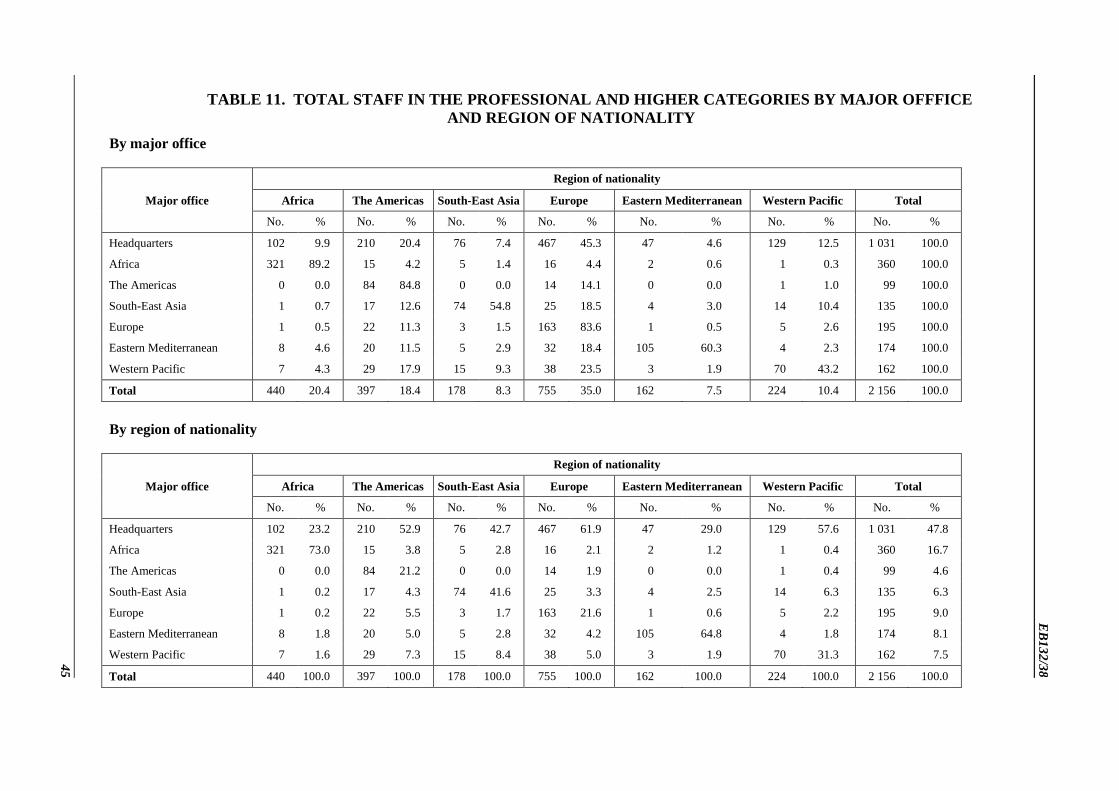
EB
132/38
45
TABLE 11. TOTAL STAFF IN THE PROFESSIONAL AND HIGHER CATEGORIES BY MAJOR OFFFICE AND REGION OF NATIONALITY
By major office
Major office
Region of nationality
Africa The Americas South-East Asia Europe Eastern Mediterranean Western Pacific Total
No. % No. % No. % No. % No. % No. % No. %
Headquarters 102 9.9 210 20.4 76 7.4 467 45.3 47 4.6 129 12.5 1 031 100.0
Africa 321 89.2 15 4.2 5 1.4 16 4.4 2 0.6 1 0.3 360 100.0
The Americas 0 0.0 84 84.8 0 0.0 14 14.1 0 0.0 1 1.0 99 100.0
South-East Asia 1 0.7 17 12.6 74 54.8 25 18.5 4 3.0 14 10.4 135 100.0
Europe 1 0.5 22 11.3 3 1.5 163 83.6 1 0.5 5 2.6 195 100.0
Eastern Mediterranean 8 4.6 20 11.5 5 2.9 32 18.4 105 60.3 4 2.3 174 100.0
Western Pacific 7 4.3 29 17.9 15 9.3 38 23.5 3 1.9 70 43.2 162 100.0
Total 440 20.4 397 18.4 178 8.3 755 35.0 162 7.5 224 10.4 2 156 100.0
By region of nationality
Major office
Region of nationality
Africa The Americas South-East Asia Europe Eastern Mediterranean Western Pacific Total
No. % No. % No. % No. % No. % No. % No. %
Headquarters 102 23.2 210 52.9 76 42.7 467 61.9 47 29.0 129 57.6 1 031 47.8
Africa 321 73.0 15 3.8 5 2.8 16 2.1 2 1.2 1 0.4 360 16.7
The Americas 0 0.0 84 21.2 0 0.0 14 1.9 0 0.0 1 0.4 99 4.6
South-East Asia 1 0.2 17 4.3 74 41.6 25 3.3 4 2.5 14 6.3 135 6.3
Europe 1 0.2 22 5.5 3 1.7 163 21.6 1 0.6 5 2.2 195 9.0
Eastern Mediterranean 8 1.8 20 5.0 5 2.8 32 4.2 105 64.8 4 1.8 174 8.1
Western Pacific 7 1.6 29 7.3 15 8.4 38 5.0 3 1.9 70 31.3 162 7.5
Total 440 100.0 397 100.0 178 100.0 755 100.0 162 100.0 224 100.0 2 156 100.0
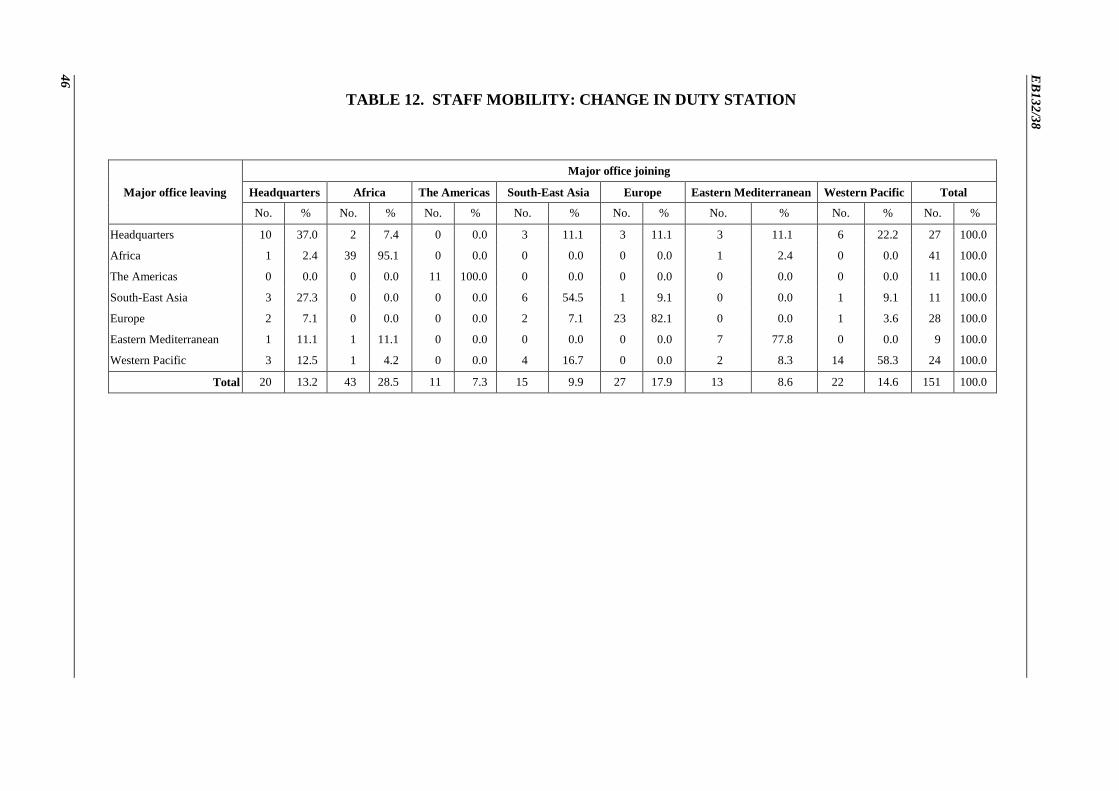
46
EB
132/38
TABLE 12. STAFF MOBILITY: CHANGE IN DUTY STATION
Major office leaving
Major office joining
Headquarters Africa The Americas South-East Asia Europe Eastern Mediterranean Western Pacific Total
No. % No. % No. % No. % No. % No. % No. % No. %
Headquarters 10 37.0 2 7.4 0 0.0 3 11.1 3 11.1 3 11.1 6 22.2 27 100.0
Africa 1 2.4 39 95.1 0 0.0 0 0.0 0 0.0 1 2.4 0 0.0 41 100.0
The Americas 0 0.0 0 0.0 11 100.0 0 0.0 0 0.0 0 0.0 0 0.0 11 100.0
South-East Asia 3 27.3 0 0.0 0 0.0 6 54.5 1 9.1 0 0.0 1 9.1 11 100.0
Europe 2 7.1 0 0.0 0 0.0 2 7.1 23 82.1 0 0.0 1 3.6 28 100.0
Eastern Mediterranean 1 11.1 1 11.1 0 0.0 0 0.0 0 0.0 7 77.8 0 0.0 9 100.0
Western Pacific 3 12.5 1 4.2 0 0.0 4 16.7 0 0.0 2 8.3 14 58.3 24 100.0
Total 20 13.2 43 28.5 11 7.3 15 9.9 27 17.9 13 8.6 22 14.6 151 100.0
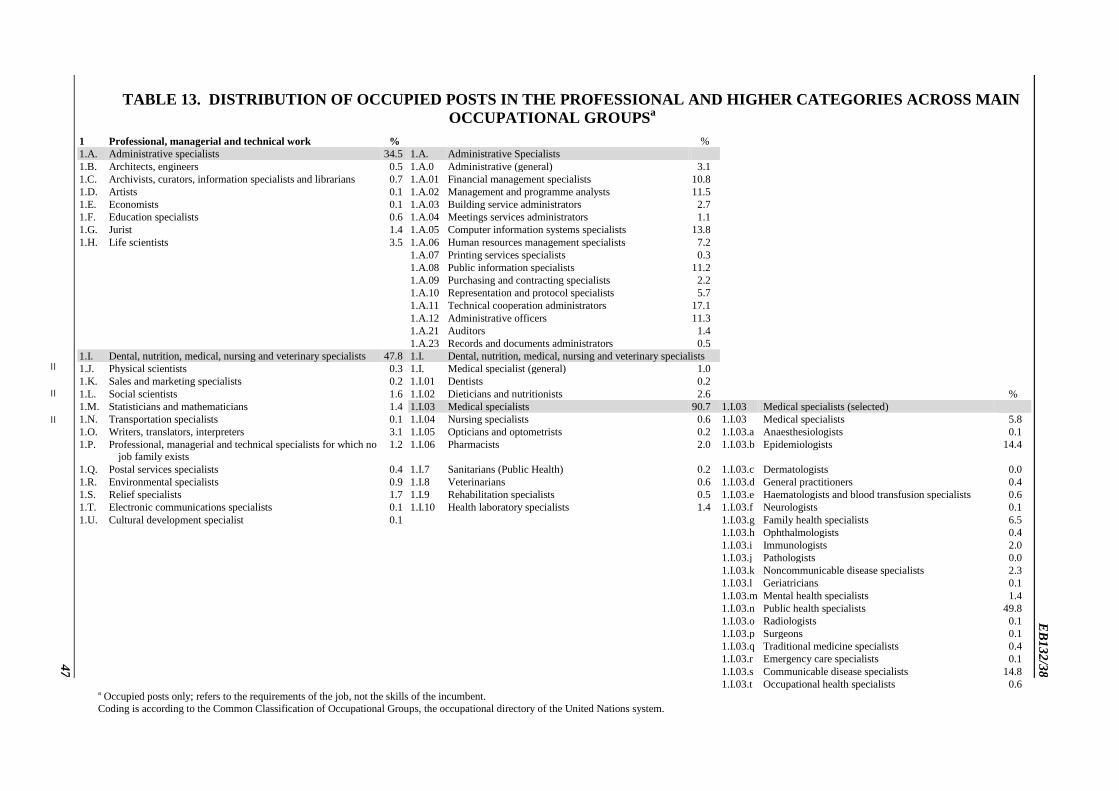
EB
132/38
47
TABLE 13. DISTRIBUTION OF OCCUPIED POSTS IN THE PROFESSIONAL AND HIGHER CATEGORIES ACROSS MAIN OCCUPATIONAL GROUPSa
1 Professional, managerial and technical work % % 1.A. Administrative specialists 34.5 1.A. Administrative Specialists 1.B. Architects, engineers 0.5 1.A.0 Administrative (general) 3.1 1.C. Archivists, curators, information specialists and librarians 0.7 1.A.01 Financial management specialists 10.8 1.D. Artists 0.1 1.A.02 Management and programme analysts 11.5 1.E. Economists 0.1 1.A.03 Building service administrators 2.7 1.F. Education specialists 0.6 1.A.04 Meetings services administrators 1.1 1.G. Jurist 1.4 1.A.05 Computer information systems specialists 13.8 1.H. Life scientists 3.5 1.A.06 Human resources management specialists 7.2 1.A.07 Printing services specialists 0.3 1.A.08 Public information specialists 11.2 1.A.09 Purchasing and contracting specialists 2.2 1.A.10 Representation and protocol specialists 5.7 1.A.11 Technical cooperation administrators 17.1
1.A.12 Administrative officers 11.3 1.A.21 Auditors 1.4 1.A.23 Records and documents administrators 0.5 1.I. Dental, nutrition, medical, nursing and veterinary specialists 47.8 1.I. Dental, nutrition, medical, nursing and veterinary specialists 1.J. Physical scientists 0.3 1.I. Medical specialist (general) 1.0 1.K. Sales and marketing specialists 0.2 1.I.01 Dentists 0.2 1.L. Social scientists 1.6 1.I.02 Dieticians and nutritionists 2.6 % 1.M. Statisticians and mathematicians 1.4 1.I.03 Medical specialists 90.7 1.I.03 Medical specialists (selected) 1.N. Transportation specialists 0.1 1.I.04 Nursing specialists 0.6 1.I.03 Medical specialists 5.8 1.O. Writers, translators, interpreters 3.1 1.I.05 Opticians and optometrists 0.2 1.I.03.a Anaesthesiologists 0.1 1.P. Professional, managerial and technical specialists for which no
job family exists 1.2 1.I.06 Pharmacists 2.0 1.I.03.b Epidemiologists 14.4
1.Q. Postal services specialists 0.4 1.I.7 Sanitarians (Public Health) 0.2 1.I.03.c Dermatologists 0.0 1.R. Environmental specialists 0.9 1.I.8 Veterinarians 0.6 1.I.03.d General practitioners 0.4 1.S. Relief specialists 1.7 1.I.9 Rehabilitation specialists 0.5 1.I.03.e Haematologists and blood transfusion specialists 0.6 1.T. Electronic communications specialists 0.1 1.I.10 Health laboratory specialists 1.4 1.I.03.f Neurologists 0.1 1.U. Cultural development specialist 0.1 1.I.03.g Family health specialists 6.5 1.I.03.h Ophthalmologists 0.4 1.I.03.i Immunologists 2.0 1.I.03.j Pathologists 0.0 1.I.03.k Noncommunicable disease specialists 2.3 1.I.03.l Geriatricians 0.1 1.I.03.m Mental health specialists 1.4 1.I.03.n Public health specialists 49.8 1.I.03.o Radiologists 0.1 1.I.03.p Surgeons 0.1 1.I.03.q Traditional medicine specialists 0.4 1.I.03.r Emergency care specialists 0.1 1.I.03.s Communicable disease specialists 14.8 1.I.03.t Occupational health specialists 0.6
a Occupied posts only; refers to the requirements of the job, not the skills of the incumbent. Coding is according to the Common Classification of Occupational Groups, the occupational directory of the United Nations system.
= = =