human resource management report - washington hr/hrm... · state of washington human resource...
TRANSCRIPT

State of Washington
Human Resource
Management ReportDevelop
Workforce
Reinforce
Performance
Deploy
Workforce
Plan & Align
Workforce
Hire
Workforce
Statewide Roll-up Report - October 2006
Eva Santos, Director
Department of Personnel
November, 2006

Plan & Align Workforce
HireWorkforce
Articulation of managers
HRM accountabilities. HR
policies. Workforce
planning. Job classes &
salaries assigned.
Qualified candidate pools,
interviews & reference
checks. Job offers. Appts
& per-
formance monitoring.
Work assignments&
Managers understand
HRM accountabilities.
Jobs, staffing levels, &
competencies aligned
with agency priorities.
Best candidate hired &
reviewed during
appointment period.
Successful performers
retained.
Workplace is safe, gives
Foundation is in place
to build and sustain a
productive, high
performing workforce.
The right people are in
the right job at the right
time.Employees are
committed to the work
they do & the goals of
the organization
Productive, successful
employees are retained
Outputs Initial Outcomes Intermediate Outcomes
Ultimate Outcomes
Managers’ Logic Model for Workforce Management
2
DeployWorkforce
Develop Workforce
Reinforce Performance
Work assignments& requirements defined. Positive workplace environment created. Coaching, feedback, corrections.
Individual development
plans. Time/ resources
for training. Continuous
learning environment
created.
Clear performance expectations linked to orgn’al goals & measures. Regular performance appraisals. Recognition. Discipline.
Workplace is safe, gives capacity to perform, & fosters productive relations. Staff know job rqmts, how they’re doing, & are supported.
Learning environment
created. Employees are
engaged in develop-
ment opportunities & seek
to learn.
Employees know how performance contributes to success of orgn. Strong performance rewarded; poor performance eliminated
Time & talent is used
effectively. Employees
are motivated &
productive.
Employees have
competencies for
present job & career
advancement
Successful perf is differentiated & strengthened. Employees are held accountable.
employees are retained
State has workforce
depth & breadth needed
for present and future
success
Agencies are better
enabled to successfully
carry out their mission.
The citizens receive
efficient government
services.

Standard Performance Measures
• Percent supervisors with current performance expectations for workforce management
• Management profile• Workforce planning measure (TBD)• Percent employees with current position/competencies descriptions
• Time-to-fill funded vacancies• Percent satisfaction with candidate quality• Percent hiring types (hiring balance)• Percent turnover during review period
• Percent employees with current performance expectations
Plan & Align Workforce
HireWorkforce
Ultimate Outcomes
� Employee survey ratings on
“commitment” questions
3
• Percent employees with current performance expectations• Employee survey ratings on “productive workplace” questions• Overtime usage • Sick leave usage• Number & type of non-disciplinary grievances and appeals, disposition• Workers compensation claims measure (TBD)
• Percent employees with current annual individual development plans • Employee survey ratings on “learning/development” questions• Competency gap measure (TBD)
• Percent current performance evaluations • Employee survey ratings on “performance accountability” questions • Number/type of disciplinary issues, actions, appeals disposition• Recognition/reward measure (TBD)
DeployWorkforce
Develop Workforce
Reinforce Performance
� Turnover rates and types
(e.g., retirement, resignation,
etc.)
� Turnover rate of key
occupational categories
� Workforce and diversity
profile
� Retention measure (TBD)

Analysis:
� This data is derived from the 35 agencies that submitted their HR Management Reports to DOP in October 2006
� 25 agencies reporting data for this measure have “workforce management” performance expectations in place for over 90% of their supervisors. These 25 agencies represent approximately 55% of the general government workforce.
� Managers must know what their workforce management responsibilities are and be held accountable for fulfilling those responsibilities. This is fundamental to strategic human resource management.
� The review of agencies’ HRM Reports indicates
Plan & Align
Workforce
Outcomes:
Managers understand
workforce management
accountabilities. Jobs and
competencies are defined
and aligned with business
priorities. Overall
foundation is in place to
build & sustain a high
performing workforce.
Percent Supervisors with Current
Performance Expectations for Workforce
Management
1 1 0 1 2 1 2 1 1 0
25
No data
0-10%
10-19%
20-29%
30-39%
40-49%
50-59%
60-69%
70-79%
80-89%
>=90%
Num
ber
of Agen
cies
1 reporting agency did not submit data for this measure
4
that some agencies may not understand the meaning of this measure and/or how the measure can be accomplished.
� Agencies that have achieved 100% on this measure did so by sending a firm communication from the director to all supervisors as to what their workforce management accountabilities are.
Action:
� DOP will consult with those agencies that have less than 90% workforce management expectations in place to help them progress with this measure
Performance
Measures:
Percent supervisors with
current performance
expectations for
workforce management
Management profile
Workforce Planning measure (TBD)
Percent current position/competency descriptions
Data as of July 2006Source: Agency HR Management Reports Oct 2006 (35 agencies reporting)
Per Agency Distribution
0%
20%
40%
60%
80%
100%
0 5 10 15 20 25 30 35
% Supervisors with Performance
Expectations for Workforce Managem
ent

Washington Management Service
4963
5142
5321 5312
5069
4869
3500
4000
4500
5000
5500
Jan 04 July 04 Jan 05 July 05 Jan 06 July 06
Plan & Align
Workforce
Outcomes:
Managers understand
workforce management
accountabilities. Jobs and
competencies are defined
and aligned with business
priorities. Overall
foundation is in place to
build & sustain a high
performing workforce. Number of WMS employees (headcount)
Analysis:
� The data shown in these charts is based on headcount, not FTEs or positions.
� The management profile data shown in this slide represents a new performance measure that is proposed for the Human Resource Management Report. It enables monitoring of the alignment of managers to staff at the agency and enterprise levels.
� In consultation with agencies, the Department of Personnel has prepared a briefing paper for the Governor regarding administrative controls on the
5
Performance
Measures:
Percent supervisors with current performance expectations for workforce management
Management profile
Workforce Planning measure (TBD)
Percent current position/competency descriptions
WMS Management Type
Policy
7%
Consultant
20%
Manager
73%
Manager 3,529
Consultant 955
Policy 363
Uncoded 22
4,869
51,457
All WMS General Service
Employees
use of the Washington Management Service.
Source: HR Data Warehouse and HRMSData as of October 2006.
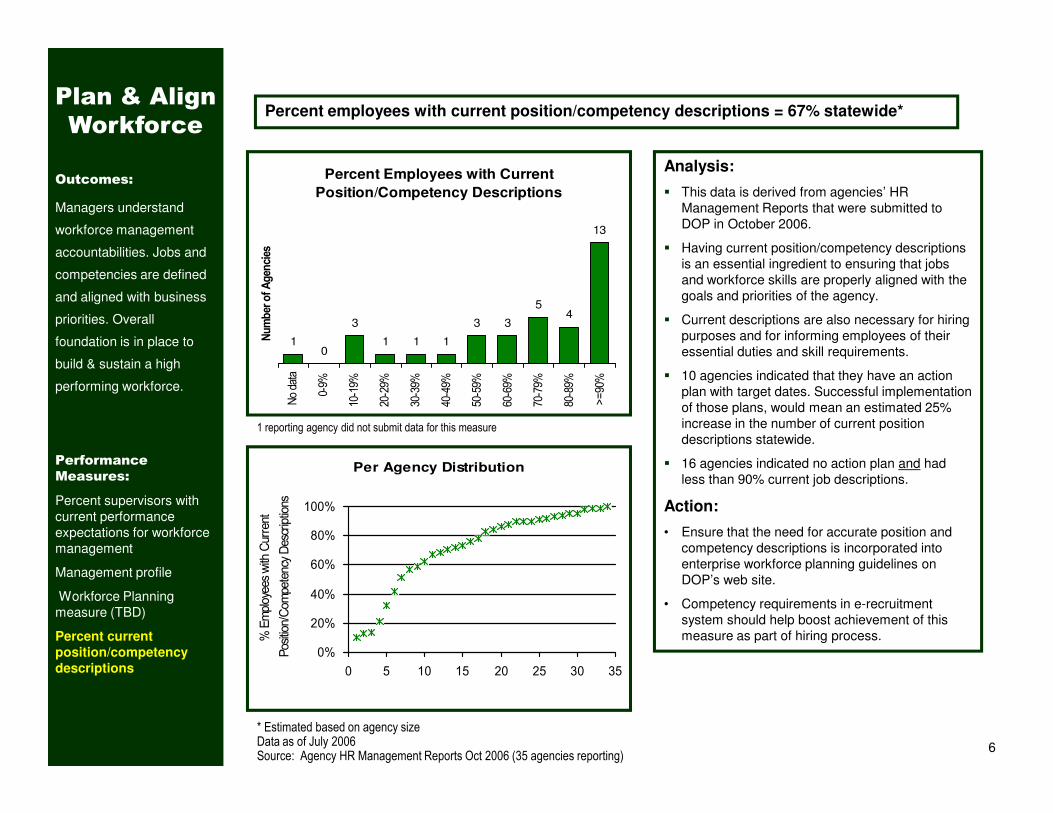
Percent employees with current position/competency descriptions = 67% statewide*
Analysis:
� This data is derived from agencies’ HR Management Reports that were submitted to DOP in October 2006.
� Having current position/competency descriptions is an essential ingredient to ensuring that jobs and workforce skills are properly aligned with the goals and priorities of the agency.
� Current descriptions are also necessary for hiring purposes and for informing employees of their essential duties and skill requirements.
� 10 agencies indicated that they have an action plan with target dates. Successful implementation of those plans, would mean an estimated 25%
Plan & Align
Workforce
Outcomes:
Managers understand
workforce management
accountabilities. Jobs and
competencies are defined
and aligned with business
priorities. Overall
foundation is in place to
build & sustain a high
performing workforce.
Percent Employees with Current
Position/Competency Descriptions
10
3
1 1 1
3 3
54
13
No data
0-9%
10-19%
20-29%
30-39%
40-49%
50-59%
60-69%
70-79%
80-89%
>=90%
Num
ber
of Agen
cies
6
of those plans, would mean an estimated 25% increase in the number of current position descriptions statewide.
� 16 agencies indicated no action plan and had less than 90% current job descriptions.
Action:
• Ensure that the need for accurate position and competency descriptions is incorporated into enterprise workforce planning guidelines on DOP’s web site.
• Competency requirements in e-recruitment system should help boost achievement of this measure as part of hiring process.
* Estimated based on agency sizeData as of July 2006Source: Agency HR Management Reports Oct 2006 (35 agencies reporting)
Performance
Measures:
Percent supervisors with current performance expectations for workforce management
Management profile
Workforce Planning measure (TBD)
Percent current
position/competency
descriptions
Per Agency Distribution
0%
20%
40%
60%
80%
100%
0 5 10 15 20 25 30 35
% Employees with Current
Position/Com
petency Descriptions
10-19%
20-29%
30-39%
40-49%
50-59%
60-69%
70-79%
80-89%
1 reporting agency did not submit data for this measure

Days to Fill Vacancies
Agency and statewide data will be available in April 2007
and will be generated from the HRMS E-recruitment
system. The measure is defined as the number of days
from date of hiring requisition to the date that the job offer
is accepted. We will attempt to chart data for all job
openings, as well as for selected categories of jobs.
Hire
Workforce
Outcomes:
Best candidates are hired
and reviewed during
appointment period. The
right people are in the right
job at the right time.
Performance
Measures
Days to fill vacancies
Candidate Quality
Agency and statewide data will be available in April 2007
7
Days to fill vacancies
% satisfaction with
candidate quality
% types of hires (hiring balance)
% separation during review period
*
***
Agency and statewide data will be available in April 2007
and will be generated from the HRMS E-recruitment
system. Data for this measure will be derived from a short
survey that the hiring manager completes upon appointing
the job candidate. The survey is generated by the E-
recruitment system and asks about the quality of
candidates interviewed and whether the manager was able
to appoint the best candidate. We will attempt to chart data
for all recruitments, as well as for selected categories of
jobs.

Analysis:
� Prior to July 1, 2005, the proportion of promotional appointments was typically higher than new hires. FY 2006 data shows a reversal of past trends. New hires now exceed promotional appointments by 6%.
� Possible causes for this new balance include:
� Less restrictive candidate referral requirements as a function of civil service reform changes that became effective on 7-1-05
� Agencies report that emphasis on competency-based, position-specific recruitment allows for more equal balance of new hires to promotionals
� Some agencies indicate that they are training supervisors on how to carefully
Types of Appointments - FY 2006
New Hires
32%
Transfer
26%Other
5%
Exempt
8%
Inter-agency
Promotions
3%
Intra-agency
Promotions
26%
Total number of appointments = 11,884*Includes appointments to permanent vacant positions only; excludes reassignments
“Other” = Demotions, re-employment, reversion & RIF appointments
Hire
Workforce
Outcomes:
Best candidates are hired
and reviewed during
appointment period. The
right people are in the right
job at the right time.
Performance
Measures
Days to fill vacancies
3,7373,081
365
1,000
3,113588
8
Reporting Period: July 1, 2005 – June 22, 2006
*Group 1 agencies are not included in the April, May and June 2006
data since they had converted to HRMS.
• Group 1 Employee Count = 5,709
• Group 2 Employee Count = 52,124
Source: HR Data Warehouse
select for those skills that are most critical to the organization, rather than broad brush credentials
� A few agencies use exit interviews to analyze why people leave during the review period
Action:
� Develop a standard set of exit interview questions that agencies can use to assess why newly appointed individuals leave before completing the review period
Separation During Review Period
7% (231)8% (295)
1% (20)
4% (154)
0%
2%
4%
6%
8%
10%
12%
14%
Probationary Separations Trial Service Separations
Involuntary
Voluntary
“Other” = Demotions, re-employment, reversion & RIF appointments
Total number of separations during review period = 700Includes separation from permanent position new hire appointments and classified
promotional appointments only
Days to fill vacancies
% satisfaction with candidate quality
% types of hires (hiring
balance)
% separation during
review period

Deploy
Workforce
Outcomes:
Staff know job
expectations, how they’re
doing, & are supported.
Workplace is safe, gives
capacity to perform, &
fosters productive
relations. Employee time
and talent is used
effectively. Employees are
motivated.
Employees who have current performance expectations = 64% statewide*
Analysis:
� This data is derived from agencies’ HR Management Reports that were submitted to DOP in October 2006.
� The percent of “Current Performance Expectations” is typically determined by whether Part 1 of the employee’s PDP is current.This means documented performance expectations that are measurable and clearly linked to the goals of the organization.
� Some agencies indicated in their HR Management Report that they have a clear mandate from the agency executive that supervisors are accountable for documenting current performance expectations. Some monitor this in internal GMAP sessions.
� 14 agencies indicated that they have an action plan to achieve current performance expectations for all
Percent Employees with Current
Performance Expectations
1 1 1 10
3
6
21
5
14
No data
0-9%
10-19%
20-29%
30-39%
40-49%
50-59%
60-69%
70-79%
80-89%
>90%
Num
ber
of A
gen
cie
s
9
motivated.
Performance
Measures
Percent employees with
current performance
expectations
Employee survey ratings on “productive workplace” questions
Overtime usage
Sick leave usage
Number & type of non-disciplinary grievance, appeals, and disposition
Worker Comp claims (TBD)
employees. Successful completion of these action plans would increase the statewide percentage by roughly 25%.
� 11 agencies indicated no action plan and had less than 90% current performance expectations.
� One agency pointed out that although only one-fourth of their employees have current performance expectations documented, nearly 90% of employees surveyed say they know what is expected of them on the job. Likewise, on a statewide basis, while only 64% have current performance expectations, 84% of those surveyed say they know what is expected of them at work.
� The question then becomes whether what an employee thinks they are supposed to be doing when they come into work is the same as management’s priorities. It would also be interesting to ask employees if they know how their performance is measured.
* Estimated based on agency sizeData as of July 2006Source: Agency HR Management Reports Oct 2006 (35 agencies reporting)
Per Agency Distribution
0%
20%
40%
60%
80%
100%
0 5 10 15 20 25 30 35
Employees with Current Performance Expectations
1 reporting agency did not submit data for this measure

Employee Survey “Productive Workplace” RatingsDeploy
Workforce
Outcomes:
Staff know job
expectations, how they’re
doing, & are supported.
Workplace is safe, gives
capacity to perform, &
fosters productive
relations. Employee time
and talent is used
effectively. Employees are
motivated.
Q4. I know what is expected of me at work.
Q1. I have opportunity to give input on decisions affecting my work.
Q2. I receive the information I need to do my job effectively.
Q6. I have the tools and resources I need to do my job effectively.
Q7. My supervisor treats me with dignity and respect.
Q8. My supervisor gives me ongoing feedback that helps me improve my performance.
Q9. I receive recognition for a job well done.
2%3%8% 37% 47% 3%
8% 12% 23% 32% 22% 2%
2%7% 19% 48% 21% 2%
3%8% 18% 45% 22% 3%
4%5% 8% 23% 3%57%
7% 10% 19% 29% 33% 3%
11% 14% 24% 26% 22% 3%
4.3
3.5
3.8
4.3
3.7
3.3
3.8
Ave Highlights:
� 80% indicate that their supervisor treats them with dignity and respect
� Approximately 2/3rd of respondents feel they have the information, tools, and resources to do their job
� While 84% indicate that they know what is expected of them at work, only 64% have current performance expectations documented. See analysis in slide 9.
� Only 62% receive regular feedback and nearly 50% of respondents indicate that they never-to-occasionally receive recognition for a job well done
� 71% of supervisors agree that they have the opportunity to give input on decisions affecting their work, as compared to 52% of non-
10Source: Statewide Employee Survey April 2006 N = 36,440 (58%)
motivated.
Performance
Measures
Percent employees with current performance expectations
Employee survey ratings
on “productive
workplace” questions
Overtime usage
Sick leave usage
Number & type of non-disciplinary grievance, appeals, and disposition
Worker Comp claims (TBD)
11% 14% 24% 26% 22% 3% 3.3
4.27
3.39
3.77 3.76
4.27
3.72
3.31
4.33
3.9 3.923.79
4.4
3.76
3.43
Q4 Q1 Q2 Q6 Q7 Q8 Q9
Employees
Supervisors
their work, as compared to 52% of non-supervisory employees
Action:
� At the request of the Governor, DOP has convened an interagency focus group to identify high scoring agencies’ best practices on survey questions 8 and 9. Findings will be presented at the Governor’s GMAP on January 17, 2007.
� Never � Seldom � Occasionally � Usually � Always
33.13.23.33.43.53.63.73.83.9
44.14.24.34.44.54.64.74.84.9
5
Overall average score = 3.8
Greater Olympia area = 3.94 Non-supv employees = 3.78
Western WA (without Oly) = 3.74 Supervisors = 3.93
Eastern Washington = 3.77
Distribution of agencies’ average score on “productive workplace” questions
Average

Analysis:
� DNR is excluded from the data and analysis shown as their values cause extreme skewing due to fire season.
� 3 agencies make up 81-83% of the overtime usage and costs:� Dept of Corrections� Dept of Social & Health Services� Dept of Transportation
� The total overtime cost increase shown in FY 2006 (up $2.8M from FY 2005) is likely due to the 3.2% across the board salary increases for that year.
� There has been speculation that overtime usage might decline in FY 2006 due to civil service reform modifications. Data indicates a slight drop from average usage of 26.7% in FY 05 to 25.9% in FY 06.
� Fiscal year second quarter peaks appear to be driven primarily from overtime usage in the DOC and DSHS
Average Overtime (quarterly, per capita)*
6
8
10
12
14
Ave
rag
e O
T H
ou
rs
Statewide Overtime Cost*
$46,878,632$48,910,137
$51,726,822
FY 2004 FY 2005 FY 2006
Deploy
Workforce
Outcomes:
Staff know job
expectations, how they’re
doing, & are supported.
Workplace is safe, gives
capacity to perform, &
fosters productive
relations. Employee time
and talent is used
effectively. Employees are
motivated.
11
institutions. This likely due to holiday coverage, but is also correlated to sick leave use.
� The need for overtime usage is also impacted by vacancy rates in the institutions, especially the correctional facilities
0
2
4
Q1
FY04
Q2
FY04
Q3
FY04
Q4
FY04
Q1
FY05
Q2
FY05
Q3
FY05
Q4
FY05
Q1
FY06
Q2
FY06
Q3
FY06
Q4
FY06
Ave
rag
e O
T H
ou
rs
Percent Employees Receiving Overtime*
0
5
10
15
20
25
30
35
Q1
FY04
Q2
FY04
Q3
FY04
Q4
FY04
Q1
FY05
Q2
FY05
Q3
FY05
Q4
FY05
Q1
FY06
Q2
FY06
Q3
FY06
Q4
FY06
Pe
rce
nt
Em
plo
ye
es
motivated.
Performance
Measures
Percent employees with current performance expectations
Employee survey ratings on “productive workplace” questions
Overtime usage
Sick leave usage
Number & type of non-disciplinary grievance, appeals, and disposition
Worker Comp claims (TBD)
Data as of June 22, 2006
*Group 1 Agencies are not included in the April, May and June 2006 data since
they had converted to HRMS.
• Group 1 Employee Count = 5,709
• Group 2 Employee Count = 52,124
Values for Q4 of FY06 are estimated from data from 5 of 6 pay periods.
*Statewide overtime values do not include DNR
Source: HR Data Warehouse

Deploy
Workforce
Outcomes:
Staff know job
expectations, how they’re
doing, & are supported.
Workplace is safe, gives
capacity to perform, &
fosters productive
relations. Employee time
and talent is used
effectively. Employees are
motivated.
Average Sick Leave Use (per capita)
17
18.8 18.317 16.5
17.4
20
17.316.7
18.319.1
17.4
0
5
10
15
20
25
30
Q1
FY04
Q2
FY04
Q3
FY04
Q4
FY04
Q1
FY05
Q2
FY05
Q3
FY05
Q4
FY05
Q1
FY06
Q2
FY06
Q3
FY06
Q4
FY06
Ho
urs
Analysis:
� Not surprisingly, sick leave use tends to peak during the winter months (during FY quarters 2 and 3).
� At present, there is no mechanism to track unplanned sick leave use at the enterprise level. It is hypothesized that a strong correlation exists between unplanned leave and overtime usage, especially in institutional settings.
� The table is intended to help respond to the question as to whether employees tend to use sick leave as soon as it is earned.
12
Average SickLeave useper quarter,per capita
Percentof SickLeaveearned
Average SickLeave per
quarter for justthose who took
sick leave
Percentof SickLeaveearned
Statewide 17.8 hours 74% 22.8 hours 95%
motivated.
Performance
Measures
Percent employees with current performance expectations
Employee survey ratings on “productive workplace” questions
Overtime usage
Sick leave usage
Number & type of non-disciplinary grievance, appeals, and disposition
Worker Comp claims (TBD)
Data as of June 22, 2006
Group 1 Agencies are not included in the April, May and June
2006 data since they had converted to HRMS.
• Group 1 Employee Count = 5,709
• Group 2 Employee Count = 52,124
Values for Q4 of FY06 are estimated from data from 5 of 6 pay
periods.
Source: HR Data Warehouse
Quarterly average FY04-FY06

Number of Non-Disciplinary Grievances Filed
88 86
5867
61
73
4045
51
68 7062
0
20
40
60
80
100
120
July
05
Aug
05
Sept
05
Oct
05
Nov
05
Dec
05
Jan
06
Feb
06
Mar
06
Apr
06
May
06
June
06
Compensation
17.4%
Work Hours
5.5%
Leav e
9.2%
Overtime
18.3%
Hiring
3.1%
Non-discrim
6.5%
Other
33.3%
Bid Sy stem
5.9%
Mgmt Rights
0.8%
Non-Disciplinary Grievances(represented employees)Deploy
Workforce
Outcomes:
Staff know job
expectations, how they’re
doing, & are supported.
Workplace is safe, gives
capacity to perform, &
fosters productive
relations. Employee time
and talent is used
effectively. Employees are
motivated.
13Data as of July 2006Source: Labor Relations Office
05 05 05 05 05 05 06 06 06 06 06 06motivated.
Performance
Measures
Percent employees with current performance expectations
Employee survey ratings on “productive workplace” questions
Overtime usage
Sick leave usage
Number & type of non-
disciplinary grievance,
appeals, and disposition
Worker Comp claims (TBD)
Top 10 Agencies# of Non-
Disciplinary Grievances
% of all non-disciplinaryGrievances
Dept of Soc. & Health Services 233 30.26%
Dept of Corrections 174 22.60%
Dept of Labor & Industries 62 8.05%
WA State Patrol 43 5.58%
Dept of Transportation 39 5.06%
Liquor Control Board 34 4.42%
Dept of Fish & Wildlife 28 3.64%
Dept of Natural Resources 21 2.73%
Dept of Ecology 19 2.47%
Dept of Licensing 17 2.21%
FY 06 Total Non-Disciplinary Grievances = 769
Analysis:
� Statewide data on the disposition of grievances during FY 2006 is not yet available from the state’s Labor Relations Office.
� The data shown is for non-disciplinary grievances only. Data for disciplinary grievances is shown in slide 19.

Non-Disciplinary Appeals(mostly non-represented employees)
Deploy
Workforce
Outcomes:
Staff know job
expectations, how they’re
doing, & are supported.
Workplace is safe, gives
capacity to perform, &
fosters productive
relations. Employee time
and talent is used
effectively. Employees are
motivated.
FY 06 Filings for Director's Review
4 5
11
37
14
20
2
14
46 7
0
5
10
15
20
July
05
Aug
05
Sept
05
Oct
05
Nov
05
Dec
05
Jan
06
Feb
06
Mar
06
Apr
06
May
06
June
06
Name Removal from Register
Job Classification
FY 06 Filings with PRB/PAB
4
9
14
0 5 10 15 20
Layoff
Disability Separation
Job Classification
Non-Disciplinary appeals only are shown above.
Disciplinary appeals are displayed in slide #20.
FY 06 Total filings = 104 FY 06 Total filings = 27*One may request a Director’s Review of decisions
pertaining to job class, removal of name from register,
rejection of job application, and job exam score.
14Data as of July 2006Source: DOP LAD
motivated.
Performance
Measures
Percent employees with current performance expectations
Employee survey ratings on “productive workplace” questions
Overtime usage
Sick leave usage
Number & type of non-
disciplinary grievance,
appeals, and disposition
Worker Comp claims (TBD)
FY 06 Director's Review Outcomes
Reversed
13%
Withdrawn
29%
Modified
3%
Affirmed
51%
No
Jurisdiction
4%
There is no one-to-one correlation between the filings in FY 2006 shown above and the outcomes displayed in the chart below. The time lag between filing date and when a decision is rendered can cross fiscal years.
FY 06 PRB/PAB Outcomes
Affirmed
42%
Modified
2%
Withdrawn
47%
Reversed
2%
Dismissed
7%
There is no one-to-one correlation between the filings in FY 2006 shown above and the outcomes displayed in the chart below. The time lag between filing date and when a decision is rendered can cross fiscal years.
Job Classification reviews onlyTotal outcomes = 68
Total outcomes = 60
rejection of job application, and job exam score.

Develop
Workforce
Outcomes:
A learning environment is
created. Employees are
engaged in professional
development and seek to
learn. Employees have
competencies needed for
present job and future
advancement.
Performance
Percent Employees with Current
Individual Development Plans
1 1 1 10
3
6
21
5
14
No data
0-9%
10-19%
20-29%
30-39%
40-49%
50-59%
60-69%
70-79%
80-89%
>90%
Num
ber
of A
gen
cie
s
Employees who have current Individual Development Plans (IDPs) = 64% statewide*
Analysis:
� Upon review of agencies HR Management Reports, 12 appear to have action plans to achieve current IDPs for all employees. Fully achieving these action plans would increase the statewide percentage by roughly 17%.
� 15 agencies indicated no action plan and had less than 90% current IDPs.
� With regard to employee survey results, only 55% of employees indicate that they have opportunities to learn and grow, as compared to 70% of supervisory employees.
� Approximately 36% of both supervisors and employees indicate that they never-to-occasionally receive ongoing feedback from their supervisor that helps them improve their performance.
1 reporting agency did not submit data for this measure
15
* Estimated based on agency size
Source: Agency HR Management Reports Oct 2006 (35 agencies reporting)
State Employee Survey April 2006 N = 36,440 (58%)
Performance
Measures
Percent employees with
current individual
development plans
Employee survey ratings
on “training &
development” questions
Q5. I have opportunities at work to learn and grow.
Q8. My supervisor gives me ongoing feedback that helps me improve my performance.
7% 12% 21% 30% 3%27%
7% 10% 19% 29% 33% 3%
3.6
3.7
Ave
Employee Survey “Training & Development” Ratings
Overall average score = 3.7 Non-
supv employees = 3.62
Supervisors = 3.83
Greater Olympia area = 3.77
Western WA (minus Oly) =3.60
Eastern Washington = 3.62
3.5
3.7
3.93.8
3
3.5
4
4.5
5
Q5 Q8
Employees
Supervisors
33.13.23.33.43.53.63.73.83.9
44.14.24.34.44.54.64.74.84.9
5 Distribution of agencies’ average score on “training & development” questions
Average

Reinforce
Performance
Outcomes:
Employees know how their
performance contributes to
the goals of the
organization. Strong
performance is rewarded;
poor performance is
eliminated. Successful
performance is differentiated
and strengthened.
Employees are held
Analysis:
� Annual performance evaluations are required by statute. In the past, most agencies conducted evaluations on the employee’s anniversary date. Today, many agencies are transitioning to all-agency, once-a-year timing. During this transition period, the reported completion percentage may be impacted.
� Upon review of agencies’ HR Management Reports, 12 appear to have action plans to achieve current performance evaluations for all employees. Fully achieving these action plans would increase the statewide percentage by roughly 19%.
� 14 agencies indicated no action plan and had less than 90% current performance evaluations.
Employees who have current performance evaluations = 63% statewide*
Percent Employees with Current
Performance Evaluations
20
10
1
5 5
12
3
15
No data
0-9%
10-19%
20-29%
30-39%
40-49%
50-59%
60-69%
70-79%
80-89%
>90%
Num
ber
of A
gen
cie
s
16
Per Agency Distribution
0%
20%
40%
60%
80%
100%
0 5 10 15 20 25 30 35
Employees with Current PDPs
Employees are held
accountable.
Performance Measures
Percent employees and
managers with current
annual performance
evaluations
Employee survey ratings on
“performance and
accountability” questions
Number/type of disciplinary
issues, actions, grievances,
appeals, and disposition
Recognition program
measure (TBD)
than 90% current performance evaluations.
� In the 15 agencies that have 90-100% of performance evaluations completed, 59% of employees say the evaluation provides meaningful information.
� On a statewide basis, although 63% of workforce has a current performance evaluation, only 51% of employees indicate that their performance evaluation provides them with meaningful information about their performance. Reference slide 17 for survey data.
* Estimated based on agency sizeData as of July 2006Source: Agency HR Management Reports Oct 2006 (35 agencies reporting)
2 reporting agencies did not provide specific data for this measure

Reinforce
Performance
Outcomes:
Employees know how their
performance contributes to
the goals of the
organization. Strong
performance is rewarded;
poor performance is
eliminated. Successful
performance is differentiated
and strengthened.
Employees are held
Analysis:
� Approximately 78% of employees say that they know how their work contributes to the goals of their agency, and that they are held accountable for performance.
� Although 63% of employees statewide have current performance evaluations, only 51% of employees indicate that their performance evaluation provides them with meaningful information.
� A number of agencies have indicated in their HR Management Reports and/or other venues that they are providing training and consultation to supervisors on how to do effective performance evaluations.
� See also data and analysis in slide 20.
Employee Survey “Performance & Accountability” Ratings
Q3. I know how my work contributes to the goals of my agency.
Q10. My performance evaluation provides me with meaningful information about my performance.
Q11. My supervisor holds me and my co-workers accountable for performance.
Q9. I receive recognition for a job well done.
3%5% 12% 36% 42% 2%
11% 13% 19% 30% 21% 6%
3%5% 11% 33% 44% 3%
11% 14% 24% 26% 22% 3%
4.1
3.4
4.1
3.3
Ave
5
� Never � Seldom � Occasionally � Usually � Always
17
Employees are held
accountable.
Performance Measures
Percent employees and
managers with current
annual performance
evaluations
Employee survey ratings
on “performance and
accountability” questions
Number/type of disciplinary
issues, actions, grievances,
appeals, and disposition
Recognition program
measure (TBD)
� See also data and analysis in slide 20.
Action:
� At the request of the Governor, DOP and the HR Management Advisory Group convened an interagency focus group to address the lowest scoring employee survey questions (including #9 and #10). The focus group represented agencies that scored highest on these questions. Findings are now being compiled, with the objective of identifying best practices that can be shared with other agencies. The findings will be presented at the Governor’s GMAP forum scheduled for January 17, 2007.
Data as of April 2006Source: Statewide Employee Survey N = 36,440 (58%)
Overall average score = 3.7
Non-supv employees = 3.73
Supervisors = 3.85
Greater Olympia area = 3.84
Western WA (without Oly) = 3.69
Eastern Washington = 3.72
4.1
3.4
4.1
3.3
4.3
3.4
4.3
3.4
3
3.5
4
4.5
5
Q3 Q10 Q11 Q9
Employees
Supervisors
3
3.13.2
3.3
3.43.5
3.6
3.73.8
3.9
44.1
4.24.3
4.4
4.54.6
4.7
4.84.9
5 Distribution of agencies’ average score on “performance & accountability” questions
Average
Reinforce
Performance
Outcomes:
Employees know how their
performance contributes to
the goals of the
organization. Strong
performance is rewarded;
poor performance is
eliminated. Successful
performance is differentiated
and strengthened.
Employees are held
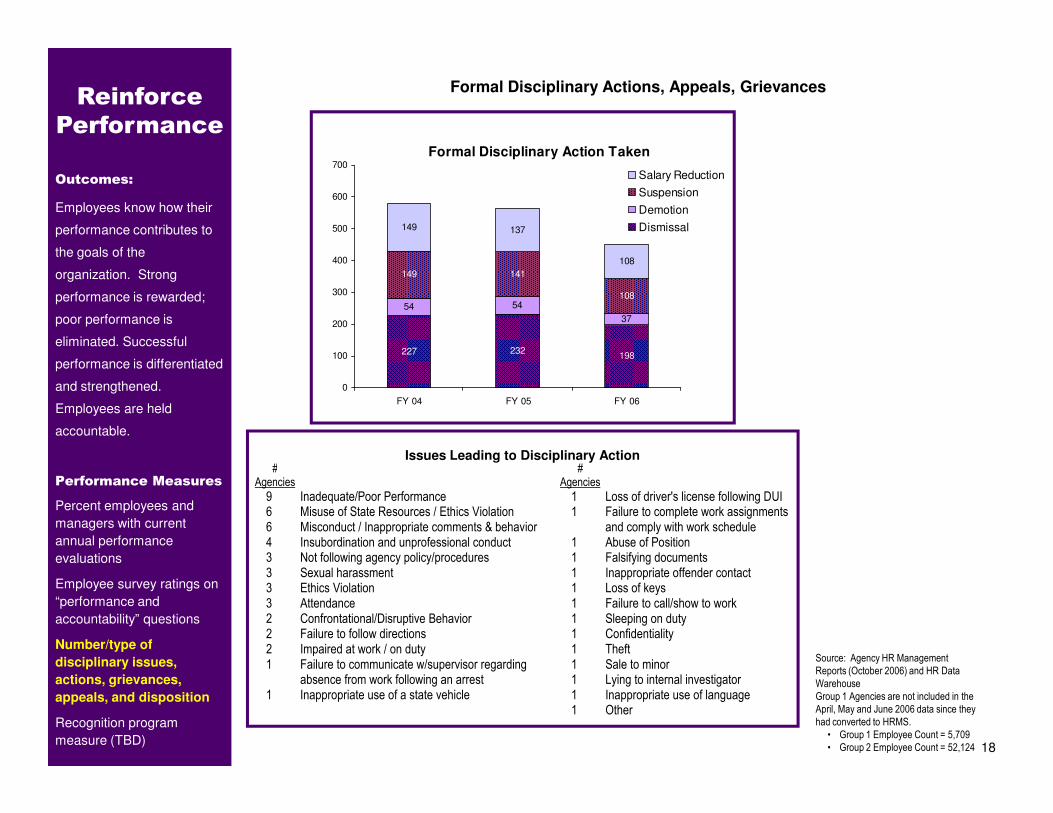
Formal Disciplinary Actions, Appeals, Grievances
Formal Disciplinary Action Taken
227 232198
54 54
37
149 141
108
149 137
108
0
100
200
300
400
500
600
700
FY 04 FY 05 FY 06
Salary Reduction
Suspension
Demotion
Dismissal
18
Employees are held
accountable.
Performance Measures
Percent employees and
managers with current
annual performance
evaluations
Employee survey ratings on
“performance and
accountability” questions
Number/type of
disciplinary issues,
actions, grievances,
appeals, and disposition
Recognition program
measure (TBD)
Source: Agency HR Management
Reports (October 2006) and HR Data
Warehouse
Group 1 Agencies are not included in the
April, May and June 2006 data since they
had converted to HRMS.
• Group 1 Employee Count = 5,709
• Group 2 Employee Count = 52,124
Issues Leading to Disciplinary Action#
Agencies#
Agencies
966433332221
1
Inadequate/Poor PerformanceMisuse of State Resources / Ethics ViolationMisconduct / Inappropriate comments & behaviorInsubordination and unprofessional conductNot following agency policy/proceduresSexual harassmentEthics ViolationAttendanceConfrontational/Disruptive BehaviorFailure to follow directionsImpaired at work / on dutyFailure to communicate w/supervisor regardingabsence from work following an arrestInappropriate use of a state vehicle
11
111111111111
Loss of driver's license following DUIFailure to complete work assignmentsand comply with work scheduleAbuse of PositionFalsifying documentsInappropriate offender contactLoss of keysFailure to call/show to workSleeping on dutyConfidentialityTheftSale to minorLying to internal investigatorInappropriate use of languageOther

Reinforce
Performance
Outcomes:
Employees know how their
performance contributes to
the goals of the
organization. Strong
performance is rewarded;
poor performance is
eliminated. Successful
performance is differentiated
and strengthened.
Employees are held
FY 2006 Disciplinary Appeals Total = 23
1
6
4
12
0 2 4 6 8 10 12 14
Other Salary Reduction Suspension Demotion Dismissal
Disciplinary Grievances(Represented Employees)
Disciplinary Appeals(Non-Represented Employees)
FY 06 PRB/PAB Outcomes
Statewide data on the disposition of disciplinary
grievances for FY 2006 was not available
Number of Disciplinary Grievances Filed Total = 277
7
30
2624 25 25
2124
29
22 22 22
0
5
10
15
20
25
30
35
40
July
05
Aug
05
Sept
05
Oct
05
Nov
05
Dec
05
Jan
06
Feb
06
Mar
06
Apr
06
May
06
June
06
19
Employees are held
accountable.
Performance Measures
Percent employees and
managers with current
annual performance
evaluations
Employee survey ratings on
“performance and
accountability” questions
Number/type of
disciplinary issues,
actions, grievances,
appeals, and disposition
Recognition program
measure (TBD)Sources: OFM Labor Relations Office and DOP LAD
FY 06 PRB/PAB Outcomes
Affirmed
23%
Modified
3%
Withdrawn
68%
Reversed
1%
Dismissed
5%
grievances for FY 2006 was not available
Top 10 Agencies # of Disciplinary Grievances
% of all DisciplinaryGrievances
Dept of Soc. & Health Services 96 34.66%
Dept of Corrections 82 29.60%
Liquor Control Board 19 6.86%
Dept of Transportation 12 4.33%
Employment Security Dept 11 3.97%
Dept of Labor & Industries 9 3.25%
WA State Patrol 7 2.53%
Dept of Health 6 2.17%
Dept of Natural Resources 5 1.81%
Dept of Revenue 5 1.81%

ULTIMATE
OUTCOMES
Employees are
committed to the work
they do and the goals
of the organization
Successful, productive
employees are
retained
The state has the
workforce breadth and
depth needed for
Analysis:
� Although 78% of employees indicate that they know how their work contributes to the goals of the agency, 45% do not have a good feel for how the agency measures success against those goals.
� In a performance-based culture, recognition should be tied to performance that is clearly linked to progress in successfully achieving the agency’s priorities. The low ratings on knowledge of agency success measures parallel the low survey ratings on recognition, although it is not known if there is a causal relationship.
� Informal discussions with agency HR
Q3. I know how my work contributes to the goals of my agency.
Q12. I know how my agency measures its success.
Q9. I receive recognition for a job well done.
3%5% 12% 36% 42% 2%
11% 13% 21% 32% 20% 3%
11% 14% 24% 26% 22% 3%
4.1
3.4
3.3
Ave
4.34.5
5Employees
SupervisorsOverall average score = 3.6
Non-supv employees = 3.57
� Never � Seldom � Occasionally � Usually � Always
Employee Survey “Employee Commitment” Ratings
20
depth needed for
present and future
success
Performance Measures
Employee survey ratings
on “commitment”
questions
Turnover rates and types
Turnover rate of key
occupational categories
(TBD)
Workforce and diversity
profile
Retention measure (TBD)
� Informal discussions with agency HR managers suggest that the low recognition ratings relate to day-to-day informal recognition, as opposed to more formal ceremonies.
Action:
� At the request of the Governor, DOP and the HR Management Advisory Group convened an interagency focus group to address the lowest scoring employee survey questions (including #9 and #12). The focus group represented agencies that scored highest on these questions. Findings are now being compiled, with the objective of identifying best practices that can be shared with other agencies. The findings will be presented at the Governor’s GMAP forum scheduled for January 17, 2007.
Data as of April 2006Source: Statewide Employee Survey N = 36,440 (58%)
4.1
3.3 3.3
4.3
3.6
3.4
3
3.5
4
4.5
Q3 Q12 Q9
Non-supv employees = 3.57
Supervisors = 3.77
Greater Olympia area = 3.76
Western WA (without Oly) = 3.53
Eastern Washington = 3.58
3
3.13.2
3.3
3.43.5
3.6
3.73.8
3.9
44.1
4.24.3
4.4
4.54.6
4.7
4.84.9
5 Distribution of agencies’ average score on “commitment” questions
Average

ULTIMATE
OUTCOMES
Employees are
committed to the work
they do and the goals
of the organization
Successful, productive
employees are
retained
The state has the
workforce breadth and
depth needed for
Analysis:
� On a statewide basis, employees leaving state service has maintained a steady rate of about 9.2% over the past five years. There has been a slight increase in the past two years.
� Despite the aging workforce data and concerns of baby boomer retirement projections, turnover due to retirement has not increased on a statewide level.
Retirement pockets: It is noted that some agencies and some occupational groups are more vulnerable to retirement turnover.
� The most significant increase in type of turnover is resignation. Since FY 04, resignations have increased by 1.1% (from 4.5% to 5.6%)
Resignation pockets: It is noted that some
Statewide Turnover
9.2% 9.1% 9.1% 9.4% 9.4%
2.1% 1.8% 1.9%2.2% 1.7%
0%
1%
2%
3%
4%
5%
6%
7%
8%
9%
10%
11%
12%
13%
14%
15%
FY 02 FY 03 FY 04 FY 05 FY 06
Leaving state service To another agency
21
depth needed for
present and future
success
Performance Measures
Employee survey ratings on
“commitment” questions
Turnover rates and types
Turnover rate of key
occupational categories
(TBD)
Workforce and diversity
profile
Retention measure (TBD)
Resignation pockets: It is noted that some agencies and some occupational groups are more vulnerable to resignation turnover.
� Agencies’ HRM Reports indicate the need to analyze exit interview data to determine why people resign and what the best strategies are to address this issue.
Action:
� Analyze pocket retirement and resignation data and challenges
� Assess/develop statewide workforce planning needs and approach
� Develop standard exit interview questions for agency use and statewide data
Data as of June 22, 2006
Group 1 agencies are not included in the April-June 2006 data
since they had converted to HRMS. Group 1 = 5,709. Group 2 =
52,124 Source: HR Data Warehouse
Type of Turnover
4.7% 4.5% 4.5% 4.9% 5.6%
1.8% 1.9% 1.9% 1.9%1.7%
2.2% 2.4% 2.3% 2.2% 1.8%
2.1% 1.8% 1.9%2.2% 1.7%
0.4%0.4%0.4%0.6% 0.4%
0%
1%2%
3%4%
5%6%
7%8%
9%10%
11%12%
13%14%
15%
FY 02 FY 03 FY 04 FY 05 FY06
Resignation Retirement Dismissal
RIF/Other To another agency

ULTIMATE
OUTCOMES
Employees are
committed to the work
they do and the goals
of the organization
Successful, productive
employees are
retained
The state has the
workforce breadth and
depth needed for
Caucasian
81%
Asian/Pacific
Islander
6%
African
American
5.%
Hispanic
4%
Native
American
2%
Diversity Profile
Women 52%
Persons with disabilities 5%
Vietnam Veterans 7%
Disabled Veterans 2%
People of color 17.5%
Persons over 40 76%
22
depth needed for
present and future
success
Performance Measures
Employee survey ratings on
“commitment” questions
Turnover rates and types
Turnover rate of key
occupational categories
(TBD)
Workforce and diversity
profile
Retention measure (TBD)
Data as of July 2006Source: HRMS Business Warehouse (BW)
Percent Age Distribution
0%1%
5%
8%
11%
13%
17%
19%
17%
8%
2%
0% 0%1%
4%
9%
19%
24%
21%
8%
2%
13%
15-19 20-24 25-29 30-34 35-39 40-44 45-49 50-54 55-59 60-64 >65
All Employees WMS Only
Approximately 86% of WMS is >40 years old.
Approximately 54% of WMS is >50 years old.