document
TRANSCRIPT


The failure of the policy implemented during 1920s which had given priority to the private sector has made it inevitable for the government to intervene in the economy.
Falls in the production and income levels in leading sectors of the economy.
“Shortage of foreign exchange” due to the decrease in exports to the countries facing depression.
Constraints on the imports of intermediate goods and fall in the national production due to the shortage of foreign exchange.
Increase in unemployment. A worldwide consensus about the necessity of
government intervention to cope with the depression.
Common for money, credit and public finance:
1.Stable development until 1938.
2. Monetary expansion during World War II.
Increase in money supply is less than the increase in national income between 1930 and 1939.
Since the upward move of the money supply is slower than that of the national income, a contractionary effect has taken place.
As a result , the wholesale price index (TEFE in Turkish) did not increased until the years of the war.
Increases in required reserves (“yasal karşılıklar” in Turkish) were used to control the money supply and inflation rates accordingly.
However, during the war, increase in the money supply has surpassed the increase in the national income (which is opposite to the prewar period).
Increases in inflation rate were observed as well. Excess supply of money was given as credits.
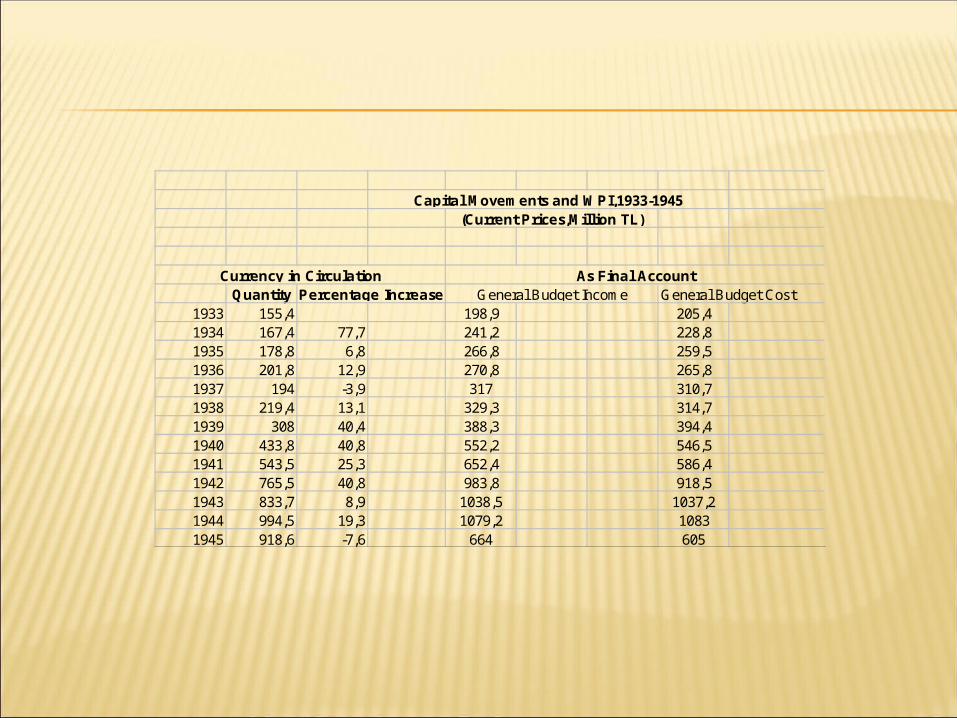
Quantity General Budget Cost 1933 155,4 198,9 205,41934 167,4 77,7 241,2 228,81935 178,8 6,8 266,8 259,51936 201,8 12,9 270,8 265,81937 194 -3,9 317 310,71938 219,4 13,1 329,3 314,71939 308 40,4 388,3 394,41940 433,8 40,8 552,2 546,51941 543,5 25,3 652,4 586,41942 765,5 40,8 983,8 918,51943 833,7 8,9 1038,5 1037,21944 994,5 19,3 1079,2 10831945 918,6 -7,6 664 605
(Current Prices,Million TL)Capital Movements and WPI,1933-1945
Currency in Circulation As Final AccountPercentage Increase General Budget Income
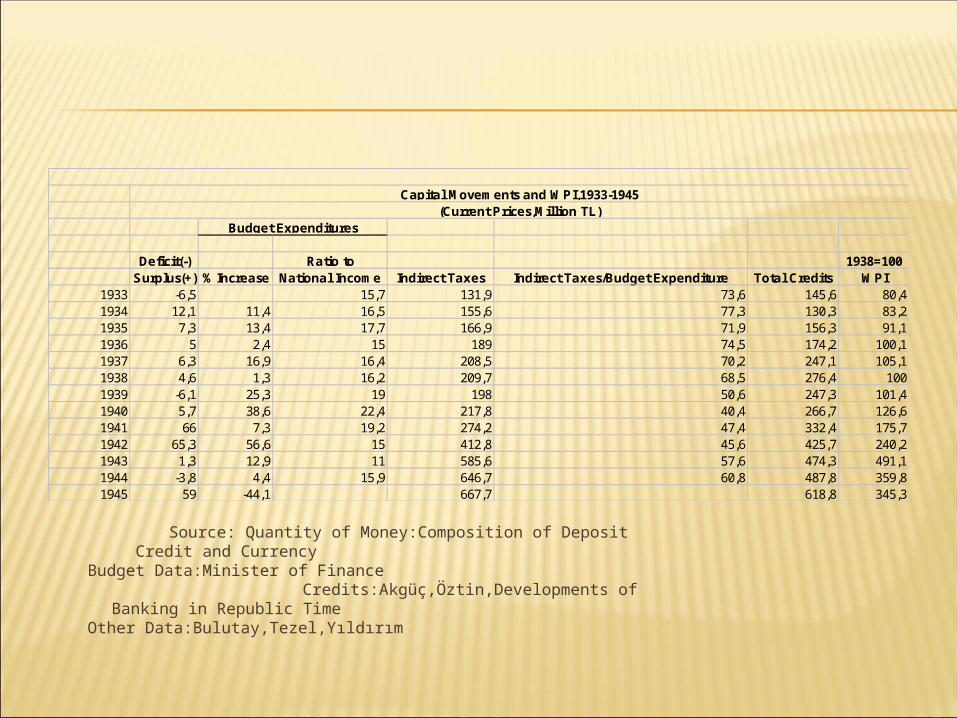
Deficit(-) Ratio to 1938=100Surplus(+) % Increase National Income Indirect Taxes Indirect Taxes/Budget Expenditure Total Credits WPI
1933 -6,5 15,7 131,9 73,6 145,6 80,41934 12,1 11,4 16,5 155,6 77,3 130,3 83,21935 7,3 13,4 17,7 166,9 71,9 156,3 91,11936 5 2,4 15 189 74,5 174,2 100,11937 6,3 16,9 16,4 208,5 70,2 247,1 105,11938 4,6 1,3 16,2 209,7 68,5 276,4 1001939 -6,1 25,3 19 198 50,6 247,3 101,41940 5,7 38,6 22,4 217,8 40,4 266,7 126,61941 66 7,3 19,2 274,2 47,4 332,4 175,71942 65,3 56,6 15 412,8 45,6 425,7 240,21943 1,3 12,9 11 585,6 57,6 474,3 491,11944 -3,8 4,4 15,9 646,7 60,8 487,8 359,81945 59 -44,1 667,7 618,8 345,3
Budget Expenditures
Capital Movements and WPI,1933-1945(Current Prices,Million TL)
Source: Quantity of Money:Composition of Deposit Credit and Currency Budget Data:Minister of Finance
Credits:Akgüç,Öztin,Developments of Banking in Republic Time Other Data:Bulutay,Tezel,Yıldırım
Etatism in industrialization. Between 1933 and 1938 greatest part of the revenues
was provided by indirect taxation and invested in industrial projects.
In this epoch, balanced budget has been adopted in principle which has led to a surplus in the budget.
The share of indirect taxation in budget expenditures has decreased.
The share of direct taxation increased by imposing taxes on wealth and land.
Government revenues are spent as transfer expenditures rather than industrial investments.
Private capitalist groups emerged.
Domestic borrowing strategy followed during the years of war.
1. Creating a balance between public expenditures and income.
2. Creating a foreign trade surplus by imposing restrictions on imports.
The commencement of the statist policy dates back to 1934.
The main purposes of the plan:
1. Construction of an industrial production system based on agricultural production and natural resources.
2. Domestic production of imported goods.
3. Diminishing the physical distance between the sources of factors of production and the place of incorporation for the firms in the economy.
The statist industrialization policy aimed to establish national industries for knitted clothes and textiles, mining products, paper products, and chemicals.
Statist industrialization program was conducted through relying mainly on indirect taxation which would not increase the domestic or foreign debt.
During the implementation of the statist policies the ratio of the farmed lands has increased.
Interest rates for the bank loans given by the Ziraat Bank has decreased and transactions has been eased.
“Toprak Mahsülleri Ofisi” was founded within this period.
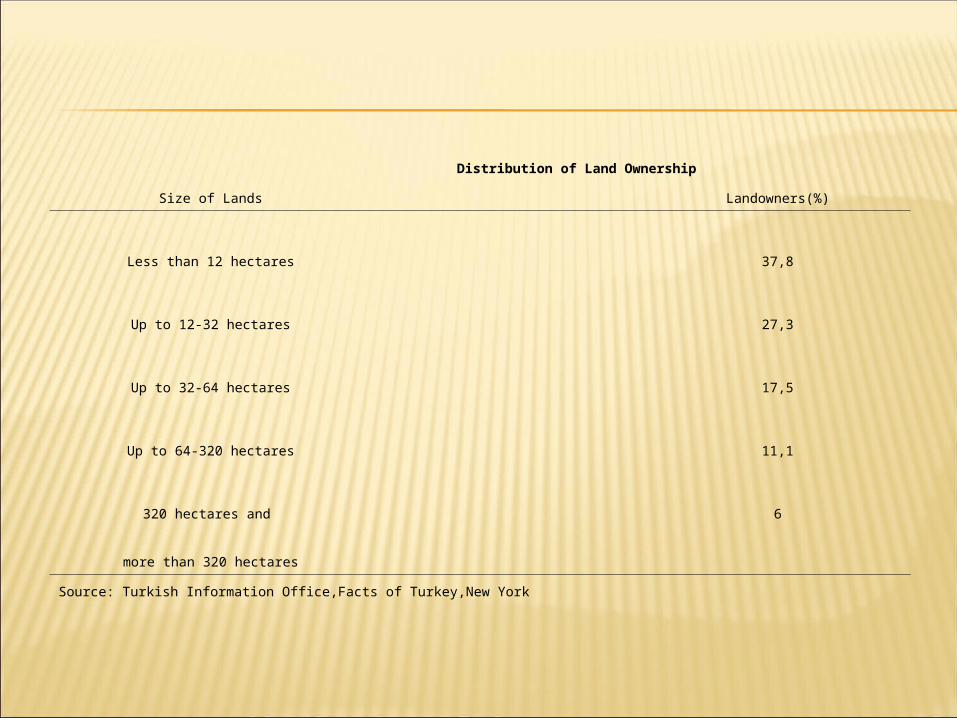
Distribution of Land Ownership
Size of Lands Landowners(%)
Less than 12 hectares 37,8
Up to 12-32 hectares 27,3
Up to 32-64 hectares 17,5
Up to 64-320 hectares 11,1
320 hectares and 6
more than 320 hectares
Source: Turkish Information Office,Facts of Turkey,New York
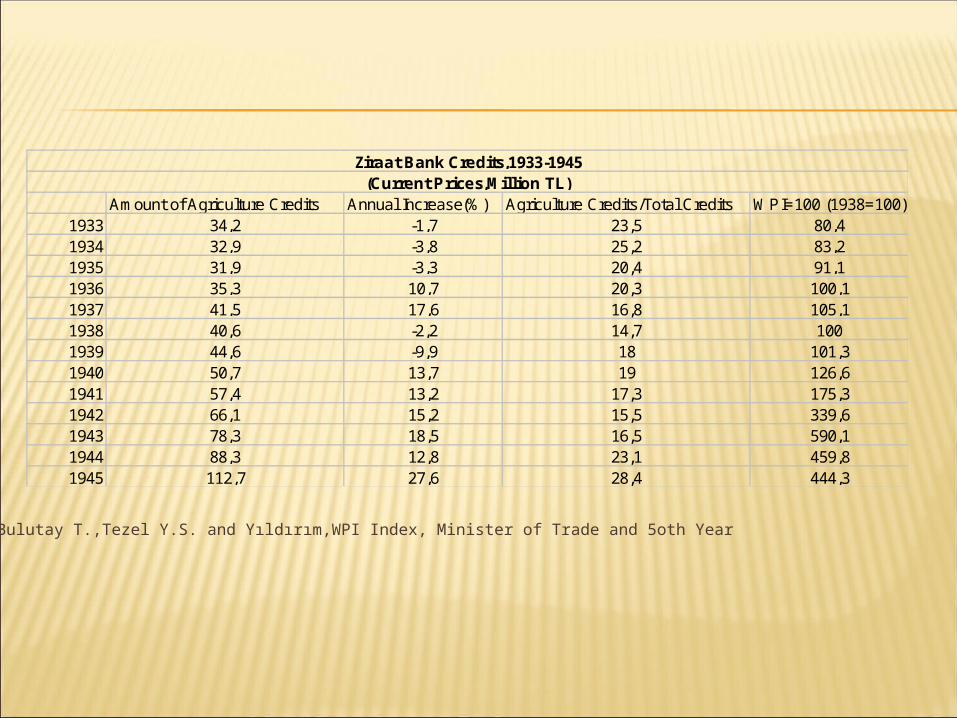
Amount of Agriculture Credits Annual Increase(%) Agriculture Credits/Total Credits WPI=100 (1938=100)1933 23,51934 25,21935 20,41936 20,31937 16,81938 14,71939 181940 191941 17,31942 15,51943 16,51944 23,11945 28,4
34,232,931,935,341,540,644,650,757,466,178,388,3112,7
-1,7-3,8-3,310,717,6-2,2-9,913,713,215,218,512,827,6
126,6
80,483,291,1100,1
Ziraat Bank Credits,1933-1945(Current Prices,Million TL)
444,3
175,3339,6590,1459,8
105,1100
101,3
Source:Bulutay T.,Tezel Y.S. and Yıldırım,WPI Index, Minister of Trade and 5oth Year
MTA and Etibank were established in 1935. MTA was responsible for mechanical issues such as searching, mining and
extracting the ores and/or training the miners or other personnel whereas Etibank was fulfilling certain financial tasks such as buying and selling of the mines.
Besides, Etibank was given other crucial duties such as producing and distributing electricity which was then an irreplaceable source of energy.
Though a considerable progress has been experienced in mining and energy sectors, some unfavorable factors such as low yield per worker due to lack of advanced technology and capital investments, deficiencies in processing the mines or raw materials, and high costs of producing electricity have deteriorated the positive picture.
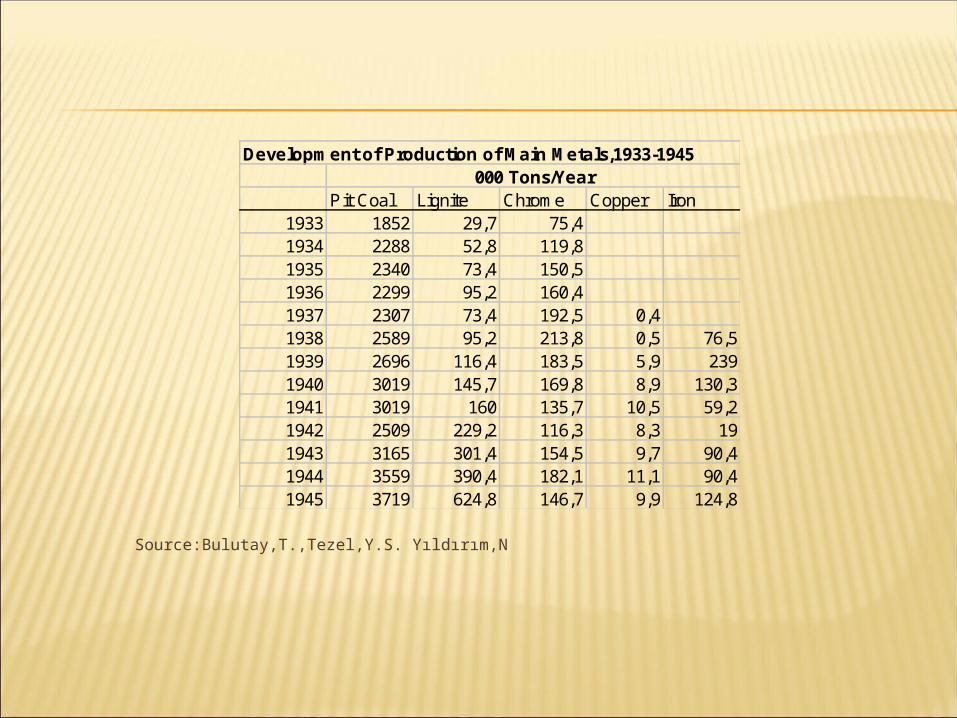
Development of Production of Main Metals,1933-1945
Pit Coal Lignite Chrome Copper Iron1933 1852 29,7 75,41934 2288 52,8 119,81935 2340 73,4 150,51936 2299 95,2 160,41937 2307 73,4 192,5 0,41938 2589 95,2 213,8 0,5 76,51939 2696 116,4 183,5 5,9 2391940 3019 145,7 169,8 8,9 130,31941 3019 160 135,7 10,5 59,21942 2509 229,2 116,3 8,3 191943 3165 301,4 154,5 9,7 90,41944 3559 390,4 182,1 11,1 90,41945 3719 624,8 146,7 9,9 124,8
000 Tons/Year
Source:Bulutay,T.,Tezel,Y.S. Yıldırım,N
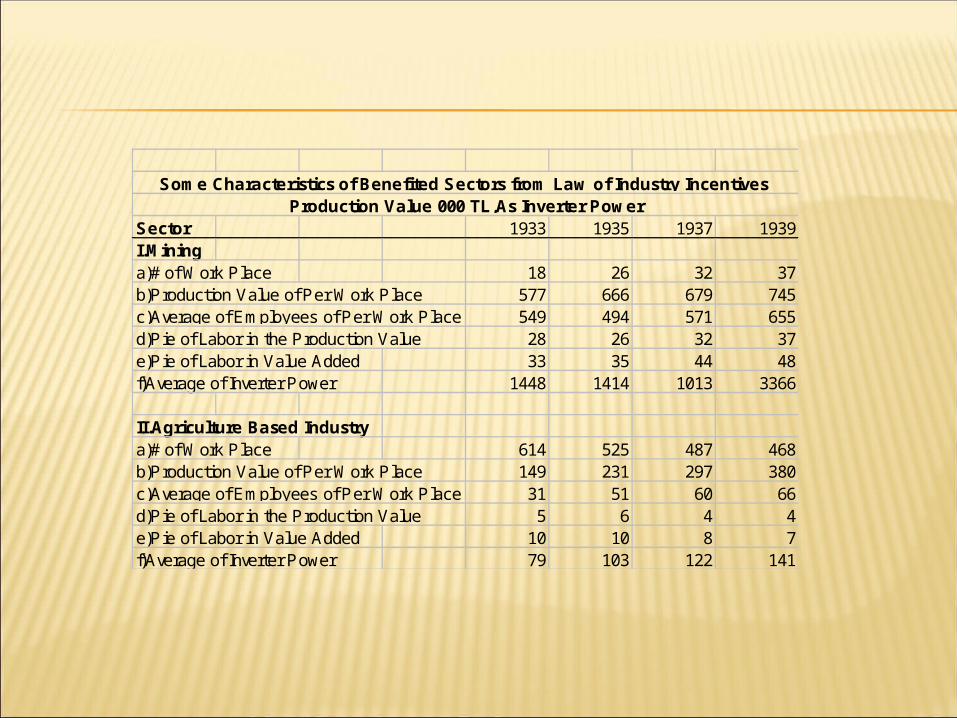
Sector 1933 1935 1937 1939I.Mininga)# of Work Place 18 26 32 37b)Production Value of Per Work Place 577 666 679 745c)Average of Employees of Per Work Place 549 494 571 655d)Pie of Labor in the Production Value 28 26 32 37e)Pie of Labor in Value Added 33 35 44 48f)Average of Inverter Power 1448 1414 1013 3366
II.Agriculture Based Industrya)# of Work Place 614 525 487 468b)Production Value of Per Work Place 149 231 297 380c)Average of Employees of Per Work Place 31 51 60 66d)Pie of Labor in the Production Value 5 6 4 4e)Pie of Labor in Value Added 10 10 8 7f)Average of Inverter Power 79 103 122 141
Some Characteristics of Benefited Sectors from Law of Industry Incentives Production Value 000 TL,As Inverter Power
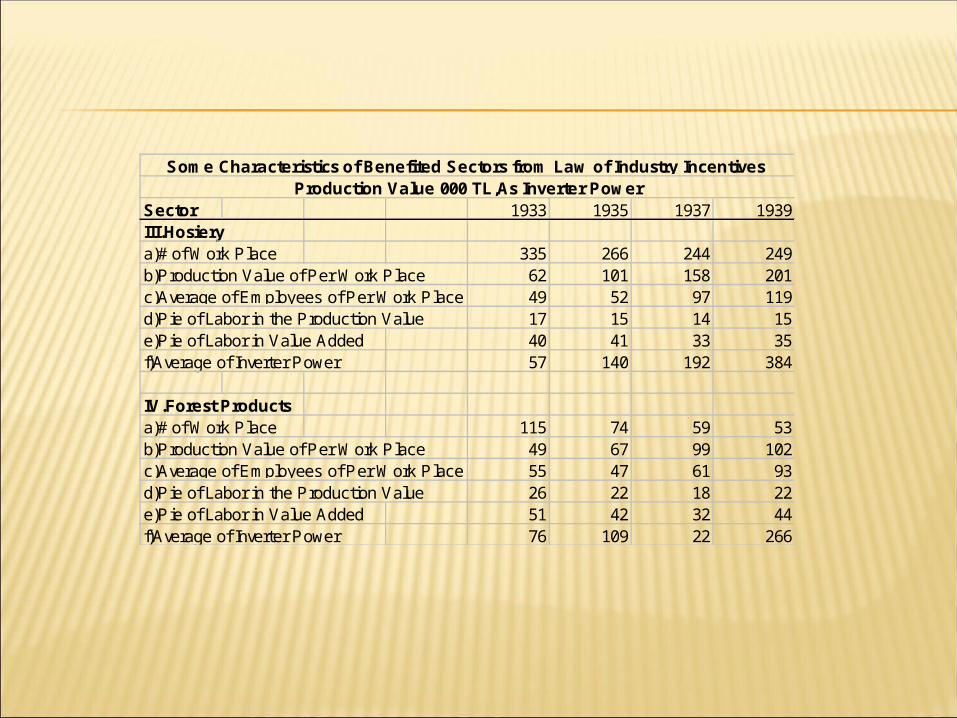
Sector 1933 1935 1937 1939III.Hosierya)# of Work Place 335 266 244 249b)Production Value of Per Work Place 62 101 158 201c)Average of Employees of Per Work Place 49 52 97 119d)Pie of Labor in the Production Value 17 15 14 15e)Pie of Labor in Value Added 40 41 33 35f)Average of Inverter Power 57 140 192 384
IV.Forest Productsa)# of Work Place 115 74 59 53b)Production Value of Per Work Place 49 67 99 102c)Average of Employees of Per Work Place 55 47 61 93d)Pie of Labor in the Production Value 26 22 18 22e)Pie of Labor in Value Added 51 42 32 44f)Average of Inverter Power 76 109 22 266
Some Characteristics of Benefited Sectors from Law of Industry Incentives Production Value 000 TL,As Inverter Power
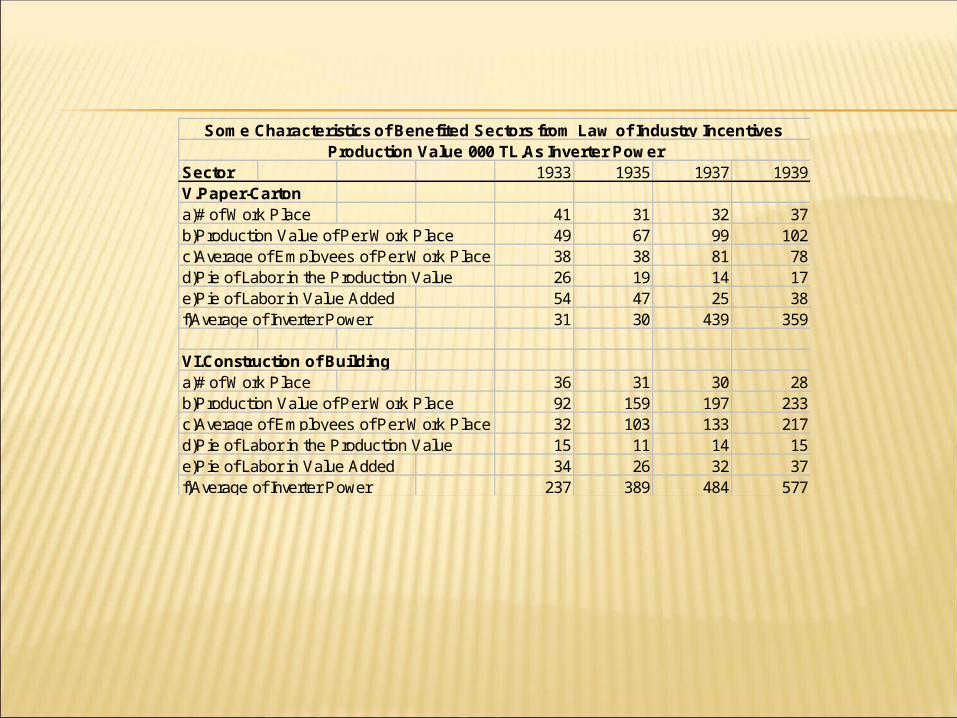
Sector 1933 1935 1937 1939V.Paper-Cartona)# of Work Place 41 31 32 37b)Production Value of Per Work Place 49 67 99 102c)Average of Employees of Per Work Place 38 38 81 78d)Pie of Labor in the Production Value 26 19 14 17e)Pie of Labor in Value Added 54 47 25 38f)Average of Inverter Power 31 30 439 359
VI.Construction of Buildinga)# of Work Place 36 31 30 28b)Production Value of Per Work Place 92 159 197 233c)Average of Employees of Per Work Place 32 103 133 217d)Pie of Labor in the Production Value 15 11 14 15e)Pie of Labor in Value Added 34 26 32 37f)Average of Inverter Power 237 389 484 577
Some Characteristics of Benefited Sectors from Law of Industry Incentives Production Value 000 TL,As Inverter Power
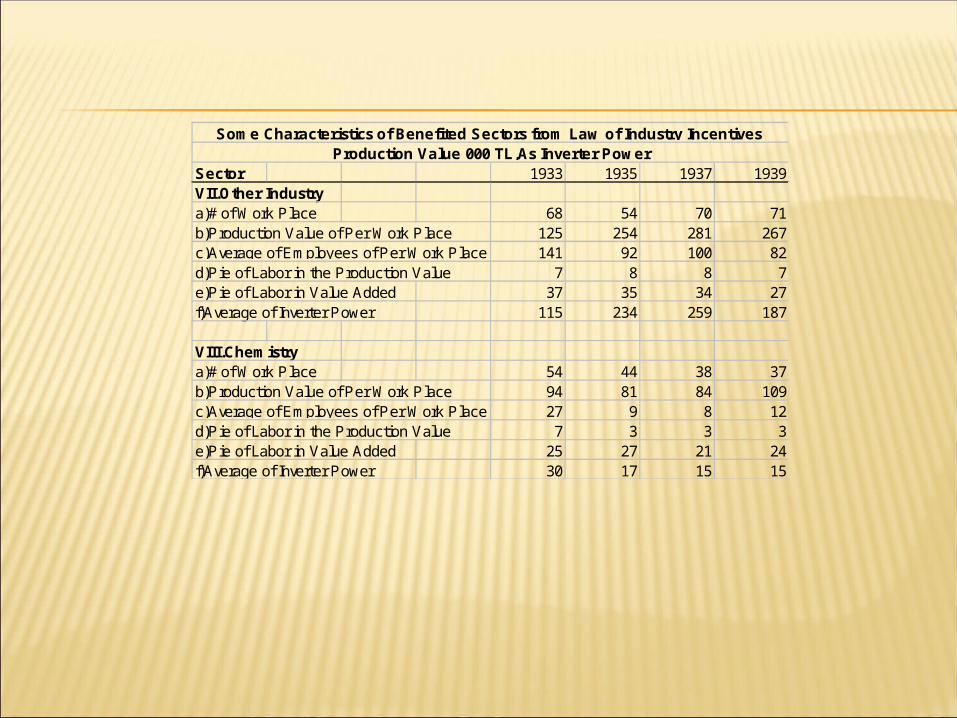
Sector 1933 1935 1937 1939VII.Other Industrya)# of Work Place 68 54 70 71b)Production Value of Per Work Place 125 254 281 267c)Average of Employees of Per Work Place 141 92 100 82d)Pie of Labor in the Production Value 7 8 8 7e)Pie of Labor in Value Added 37 35 34 27f)Average of Inverter Power 115 234 259 187
VIII.Chemistrya)# of Work Place 54 44 38 37b)Production Value of Per Work Place 94 81 84 109c)Average of Employees of Per Work Place 27 9 8 12d)Pie of Labor in the Production Value 7 3 3 3e)Pie of Labor in Value Added 25 27 21 24f)Average of Inverter Power 30 17 15 15
Some Characteristics of Benefited Sectors from Law of Industry Incentives Production Value 000 TL,As Inverter Power
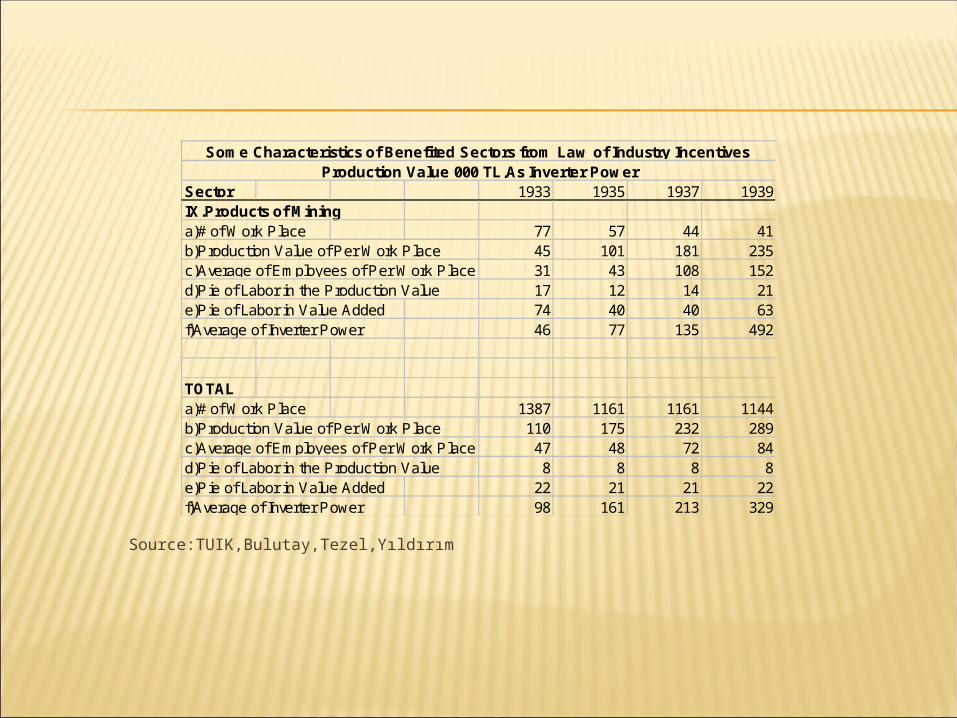
Sector 1933 1935 1937 1939IX.Products of Mininga)# of Work Place 77 57 44 41b)Production Value of Per Work Place 45 101 181 235c)Average of Employees of Per Work Place 31 43 108 152d)Pie of Labor in the Production Value 17 12 14 21e)Pie of Labor in Value Added 74 40 40 63f)Average of Inverter Power 46 77 135 492
TOTALa)# of Work Place 1387 1161 1161 1144b)Production Value of Per Work Place 110 175 232 289c)Average of Employees of Per Work Place 47 48 72 84d)Pie of Labor in the Production Value 8 8 8 8e)Pie of Labor in Value Added 22 21 21 22f)Average of Inverter Power 98 161 213 329
Some Characteristics of Benefited Sectors from Law of Industry Incentives Production Value 000 TL,As Inverter Power
Source:TUIK,Bulutay,Tezel,Yıldırım
The basic characteristic of the manufacturing industry during that epoch is that it has focused primarily on the production of consumer goods.
The most prominent progress was seen in the sector for knitted clothes and textiles.
Substantial part of the mining and manufacturing industries has taken advantage of the “incentive law”.
In this era, iron and steel production plants have been constructed in Karabük, and cement production has increased.
Considerable number of workplaces were centralized on the agricultural industries and textiles.
Indicators like production per workplace or number of workers per workplace were in favor of the mining industry.
However, forestry products, textiles and construction sectors have recorded the highest values when it comes to the share of labor.
Similarly, mining products, paper products, chemicals, and constructing industry have given the highest share to the wages from the value added in comparison with the other industries.
Mining, construction and other manufacturing industries have had the highest average values for “çevirici güç” per sector.
The main purpose was to prevent trade deficits. While doing so,
1. Imports of the goods produced domestically have been restricted.
2. “Imports in return for exports policy” was adopted. Restrictions on imports have been relaxed this way.
3. Turkey’s sole trade deficit within the 1933-1945 period was seen in 1938.
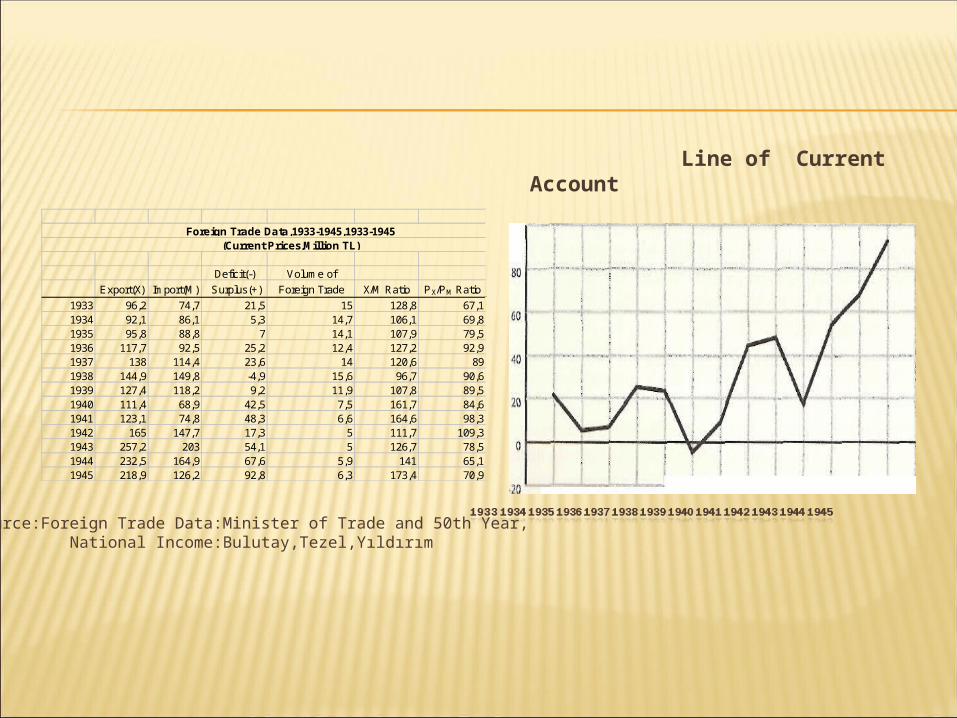
Deficit(-) Volume of
Export(X) Import(M) Surplus(+) Foreign Trade X/M Ratio PX/PM Ratio
1933 96,2 74,7 21,5 15 128,8 67,11934 92,1 86,1 5,3 14,7 106,1 69,81935 95,8 88,8 7 14,1 107,9 79,51936 117,7 92,5 25,2 12,4 127,2 92,91937 138 114,4 23,6 14 120,6 891938 144,9 149,8 -4,9 15,6 96,7 90,61939 127,4 118,2 9,2 11,9 107,8 89,51940 111,4 68,9 42,5 7,5 161,7 84,61941 123,1 74,8 48,3 6,6 164,6 98,31942 165 147,7 17,3 5 111,7 109,31943 257,2 203 54,1 5 126,7 78,51944 232,5 164,9 67,6 5,9 141 65,11945 218,9 126,2 92,8 6,3 173,4 70,9
Foreign Trade Data,1933-1945,1933-1945(Current Prices,Million TL)
Line of Current Account
Source:Foreign Trade Data:Minister of Trade and 50th Year,National Income:Bulutay,Tezel,Yıldırım
Rapid growth in national production has stemmed from the developments in the industrial structure.
National income has continued ceaselessly to grow during the years of war, except for 1945.
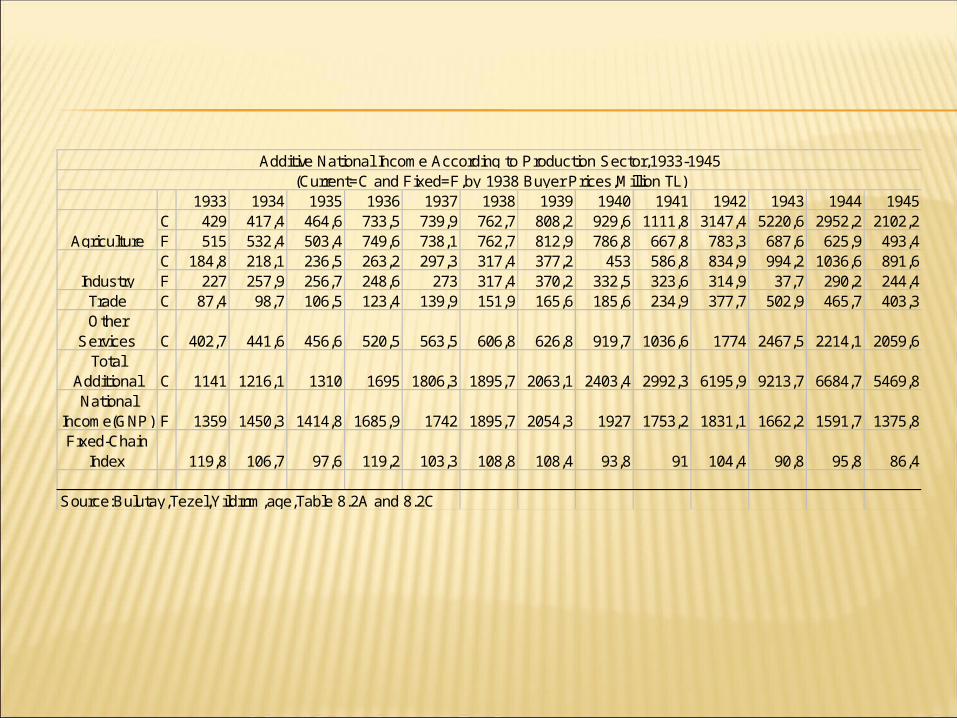
1933 1934 1935 1936 1937 1938 1939 1940 1941 1942 1943 1944 1945C 429 417,4 464,6 733,5 739,9 762,7 808,2 929,6 1111,8 3147,4 5220,6 2952,2 2102,2F 515 532,4 503,4 749,6 738,1 762,7 812,9 786,8 667,8 783,3 687,6 625,9 493,4C 184,8 218,1 236,5 263,2 297,3 317,4 377,2 453 586,8 834,9 994,2 1036,6 891,6F 227 257,9 256,7 248,6 273 317,4 370,2 332,5 323,6 314,9 37,7 290,2 244,4
Trade C 87,4 98,7 106,5 123,4 139,9 151,9 165,6 185,6 234,9 377,7 502,9 465,7 403,3Other
Services C 402,7 441,6 456,6 520,5 563,5 606,8 626,8 919,7 1036,6 1774 2467,5 2214,1 2059,6Total
Additional C 1141 1216,1 1310 1695 1806,3 1895,7 2063,1 2403,4 2992,3 6195,9 9213,7 6684,7 5469,8National
Income(GNP) F 1359 1450,3 1414,8 1685,9 1742 1895,7 2054,3 1927 1753,2 1831,1 1662,2 1591,7 1375,8Fıxed-Chain
Index 119,8 106,7 97,6 119,2 103,3 108,8 108,4 93,8 91 104,4 90,8 95,8 86,4
Source:Bulutay,Tezel,Yıldırım,age,Table 8.2A and 8.2C
Additive National Income According to Production Sector,1933-1945(Current=C and Fixed=F,by 1938 Buyer Prices,Million TL)
Agriculture
Industry

A great deal of progress has been shown in literacy rate.
Villiage Institutes have been developed to improve the literacy rate and educate qualified labor.
A “labor law” has been enacted to regulate the labor hours in a week, thus women and small children 16 or under have been protected.
.
Source: Kepenek, Y. And N Yentürk. “Türkiye Ekonomisi”. Remzi Kitabevi. 21. Basım, 2008. (Chapter 4).