hsl/2002/06 - review of railway safety s safety risk model · srm project database..... 17 2.2.8....
TRANSCRIPT

Broad Lane, Sheffield, S3 7HQTelephone:+44 (0)114 289 2000Facsimile: +44 (0)114 289 2500
© Crown copyright 2002
HEALTH AND SAFETY LABORATORYAn agency of the Health and Safety Executive
Review of Railway Safety’s Safety Risk Model
HSL/2002/06
Human Factors Group
Shane Turner BSc MSc PhDDeborah Keeley BA DPhilMichael Glossop MEng PhDGeorge Brownless BSc PhD
Shane TurnerProject Leader:
Summary
Her Majesty’s Railway Inspectorate (HMRI) commissioned the Risk Assessment Section ofthe Health & Safety Laboratory to examine Railway Safety’s Safety Risk Model (SRM) toinform the Inspectorate of its scope, limitations, strengths and weaknesses. This model,developed by Railway Safety (RS) (prior to 1 January 2001 the Safety and StandardsDirectorate of Railtrack), aims to provide a structured representation of the cause andconsequences of potential adverse events arising from the Railtrack PLC-controlledinfrastructure (RCI). The SRM consists of a series of fault tree and event tree modelsrepresenting 110 hazardous events split into three divisions: train accidents, movement andnon-movement accidents.
The intended objectives of the SRM are potentially far-reaching, from providing inputs intorisk assessments (which form part of Railtrack’s Railway Safety Case, and indeed the safetycases of others in the Railway Group), to assisting in the making of safety decisions aboutchanges or modifications and new infrastructure investment. It is likely that over theforthcoming months and years the Railway Group will make increasing use of the SRM whenattempting to justify that the risks from current and future operation on the railway are AsLow As Reasonably Practicable (ALARP). Therefore, it is imperative that an examination ofthe SRM is made, prior to it being extensively used, to inform HMRI of its strengths andweaknesses. This will enable HMRI to make balanced decisions about whether cases, todemonstrate that risk is tolerable, are acceptable when arguments are presented partly basedon the output from the SRM.
Objectives
1. Carry out a detailed review of the SRM
� Determine the strengths and weaknesses of the model;
� examine the limitations of the model;
� investigate the scope of the model; and
� examine the human factors aspects of the model.
2. Benchmark the SRM
� Develop criteria for benchmarking QRA models;
� benchmark the SRM against the criteria; and
� compare the SRM with London Underground Ltd’s (LUL’s) QRA.
3. Investigate roll-out of the SRM
� Examine who will use the model and how it is intended to be used; and
HEALTH AND SAFETY LABORATORYAn agency of the Health and Safety Executive
� examine the mechanism for roll-out to members of the Railway Group.
4. Examine the use of the SRM by the Railway Group
� Examine use by Railtrack; and
� examine use by an example Train Operating Company.
The scope of the review is to form a balanced view of the SRM from a consideration of theabove objectives. The review involved examining the fault tree and event tree models, whichmake up the SRM, examining the supporting documentation and holding discussions withvarious members of the Railway Group, primarily RS and Railtrack. It was not intended thatthe issue of implementation would be covered by this review.
Main Findings
The SRM has generally been found to be a good quality system-wide QRA that models to alevel of detail commensurate with the input data available. It is a ‘high level’ QRA, in so faras it does not address the details of each line of route and does not model in detail systems,such as train braking systems. However, there is a significant amount of detail included inparts of the SRM, particularly the train accident models. Some shortcomings have been foundwith the SRM, these being of a relatively minor nature, which are discussed in detail in thisreport. The main issues are not connected to the SRM itself, but more to do with how it is tobe used.
Although the benchmarking exercise highlighted a number of detailed issues for both theSRM and LUL QRA, in general both were found to be high quality and well developed. TheSRM has undergone a very structured, well-documented, development. We can therefore beconfident that it does not contain significant gaps. The output from the model benefits fromthe fact that it is flexible, in that the risk can be quantified in terms of different levels of harmand for different groups of people at risk. However, at this stage in its development (that issince 1999, compared to the LUL QRA which has been under development since the early90s), it is not clear how the SRM will meet all of its stated objectives. In addition, the genericnature of the model makes no allowance for regional differences on the infrastructure.However, this is not a weakness in the production of the SRM, rather a weakness in the scope(which was restricted to system-wide considerations).
The LUL QRA, in contrast, has different models for each LUL line, enabling them to takeaccount of line specific features. The model contains more detail on accident precursors andthe likelihood of detecting failed controls than the SRM, thus enabling risk reducing measuresto be evaluated more readily. In addition, the model only considers fatalities and not differentlevels of harm, although these are taken into account in LUL’s customer risk assessments, asthey are outside the scope of the LUL QRA. Historically, the development and maintenance ofthe LUL QRA was not particularly well managed and the process was not coherentlydocumented. However, the management of the LUL QRA has improved in recent years and isno longer perceived deficient.
HEALTH AND SAFETY LABORATORYAn agency of the Health and Safety Executive
The overall approach taken by RS, to widely distribute the outputs from the SRM, but not theactual fault and event trees and to provide guidance on its use within safety cases, wouldappear to be acceptable. The main points are summarised below.
� RS are, quite rightly, currently being very cautious in how they pass the SRM to theRailway Group, mainly because they are aware of its limitations and share many of theconcerns about the results being used inappropriately.
� The TOCs appear to have been well-informed about the SRM, primarily through the ‘RiskProfile Bulletin’. This would appear to be an acceptable way of sharing the findings fromthe SRM with the Railway Group.
� The guidance drafted by RS on the preparation of risk assessments within railway safetycases will help to reduce concern about the SRM being used inappropriately. It shouldprove invaluable if supported by suitable training for ensuring adequate competence levelswhen using the SRM.
� Disappointingly, some TOCs have not attended any of the briefing sessions held by RS.
The Railway Group have only recently begun using the SRM and therefore there are currentlyno clear processes in place. However, where it has been used, no evidence has been found thatthe SRM was used inappropriately. Currently, the SRM is mainly used as a checklist ofhazardous events and precursors for operators’ own risk assessments. Although this is anacceptable use of the SRM, more benefit could be obtained, especially if operators used theSRM to inform them of how they contribute risk to the network and how their risk compareswith system-wide average risk. RS have drafted guidance (October 2001) on use of the SRMwithin railway safety cases, which when formally issued should help immensely in ensuringthat the SRM is used to its full potential and, more importantly, used appropriately.
Reassuringly, most of the Railway Group appear to share the same view; that the SRM willfeed into their risk assessment rather than be a replacement for it. However, the developmentof any processes and increased use of the SRM will need to be carefully scrutinised.
HEALTH AND SAFETY LABORATORYAn agency of the Health and Safety Executive
Contents
404.3.3. Familiarisation training . . . . . . . . . . . . . . . . . . . . . . . . . . . . . . .404.3.2. Guidance on use of the SRM . . . . . . . . . . . . . . . . . . . . . . . . . .384.3.1. Risk Profile Bulletin . . . . . . . . . . . . . . . . . . . . . . . . . . . . . . . . . .38
4.3. Dissemination of knowledge of the SRM to theRailway Group . . . . . . . . . . . . . . . . . . . . . . . . . . . . . . . . . . . . . . .
364.2.2. Summary of TOC’s response to questionnaire . . . . . . . . .354.2.1. Background to the questionnaire . . . . . . . . . . . . . . . . . . . . .354.2. TOC’s perception of the roll-out strategy . . . . . . . . . . . . . .344.1. Railway Safety’s roll-out strategy . . . . . . . . . . . . . . . . . . . . .344. ROLL-OUT OF THE SRM TO THE RAILWAY GROUP . . . . . . . . . . .333.3.1. Further work . . . . . . . . . . . . . . . . . . . . . . . . . . . . . . . . . . . . . . . . .313.3. Summary of benchmarking exercise . . . . . . . . . . . . . . . . . .303.2.8. Criterion 8 - Results . . . . . . . . . . . . . . . . . . . . . . . . . . . . . . . . . .303.2.7. Criterion 7 - Analysis . . . . . . . . . . . . . . . . . . . . . . . . . . . . . . . . .293.2.6. Criterion 6 - Quantification of the model . . . . . . . . . . . . . . .283.2.5. Criterion 5 - Structure of the model . . . . . . . . . . . . . . . . . . .273.2.4. Criterion 4 - Hazard Identification . . . . . . . . . . . . . . . . . . . . .263.2.3. Criterion 3 - Quality Assurance . . . . . . . . . . . . . . . . . . . . . . .253.2.2. Criterion 2 - Ownership / Resource . . . . . . . . . . . . . . . . . . . .243.2.1. Criterion 1 - Concept / Scope . . . . . . . . . . . . . . . . . . . . . . . . .233.2. Benchmarking the SRM with LUL’s QRA . . . . . . . . . . . . . .223.1. Approach to benchmarking . . . . . . . . . . . . . . . . . . . . . . . . . .223. BENCHMARKING . . . . . . . . . . . . . . . . . . . . . . . . . . . . . . . . . . . . . . . . . . . .222.6. Summary of review . . . . . . . . . . . . . . . . . . . . . . . . . . . . . . . . . . .212.5. Sensitivity . . . . . . . . . . . . . . . . . . . . . . . . . . . . . . . . . . . . . . . . . . .212.4. Review of low consequence events . . . . . . . . . . . . . . . . . . .202.3. Review of high consequence events . . . . . . . . . . . . . . . . . .202.2.12. Auditable trail and quality assurance . . . . . . . . . . . . . . . . . .192.2.11. Review of major assumptions . . . . . . . . . . . . . . . . . . . . . . . . .182.2.10. Risk measures . . . . . . . . . . . . . . . . . . . . . . . . . . . . . . . . . . . . . . .172.2.9. SRM project database . . . . . . . . . . . . . . . . . . . . . . . . . . . . . . . .152.2.8. Human factors aspects . . . . . . . . . . . . . . . . . . . . . . . . . . . . . . .
72.2.7. Quantification of the FaultTree+ models . . . . . . . . . . . . . . . .72.2.6. Structure of the FaultTree+ models . . . . . . . . . . . . . . . . . . . .62.2.5. Development of the FaultTree+ models . . . . . . . . . . . . . . . . .62.2.4. Hazard identification . . . . . . . . . . . . . . . . . . . . . . . . . . . . . . . . . .52.2.3. Review of the fault and event tree related software . . . . .42.2.2. Scope of the SRM . . . . . . . . . . . . . . . . . . . . . . . . . . . . . . . . . . . . .42.2.1. Initiation of the SRM . . . . . . . . . . . . . . . . . . . . . . . . . . . . . . . . . .42.2. High level review of the SRM . . . . . . . . . . . . . . . . . . . . . . . . . .32.1. Scope of the review . . . . . . . . . . . . . . . . . . . . . . . . . . . . . . . . . . .22. REVIEW OF THE SRM . . . . . . . . . . . . . . . . . . . . . . . . . . . . . . . . . . . . . . . .21.2. Scope of the report . . . . . . . . . . . . . . . . . . . . . . . . . . . . . . . . . . .11.1. Objectives . . . . . . . . . . . . . . . . . . . . . . . . . . . . . . . . . . . . . . . . . . . .11. INTRODUCTION . . . . . . . . . . . . . . . . . . . . . . . . . . . . . . . . . . . . . . . . . . . . . .
HEALTH AND SAFETY LABORATORYAn agency of the Health and Safety Executive

507. REFERENCES . . . . . . . . . . . . . . . . . . . . . . . . . . . . . . . . . . . . . . . . . . . . .496.4. Use of the SRM . . . . . . . . . . . . . . . . . . . . . . . . . . . . . . . . . . . . .496.3. Roll-out of the SRM . . . . . . . . . . . . . . . . . . . . . . . . . . . . . . . . .486.2. Benchmarking of the SRM . . . . . . . . . . . . . . . . . . . . . . . . . . .476.1. Review of the SRM . . . . . . . . . . . . . . . . . . . . . . . . . . . . . . . . .476. MAIN FINDINGS . . . . . . . . . . . . . . . . . . . . . . . . . . . . . . . . . . . . . . . . . . .465.3. Summary . . . . . . . . . . . . . . . . . . . . . . . . . . . . . . . . . . . . . . . . . .465.2.2. Specific use in a TOC railway safety case . . . . . . . . . . . .455.2.1. General use . . . . . . . . . . . . . . . . . . . . . . . . . . . . . . . . . . . . . . . .455.2. Utilisation within the Train Operating Companies . . . . .445.1.2. Specific use in Railtrack’s Railway Safety Case . . . . . . .425.1.1. General use . . . . . . . . . . . . . . . . . . . . . . . . . . . . . . . . . . . . . . . .425.1. Utilisation within Railtrack . . . . . . . . . . . . . . . . . . . . . . . . . .415. RAILWAY GROUP’S USE OF THE SRM . . . . . . . . . . . . . . . . . . . . . .414.4. Summary . . . . . . . . . . . . . . . . . . . . . . . . . . . . . . . . . . . . . . . . . .
APPENDIX A BREAKDOWN OF EXAMPLE HAZARDOUS EVENTS . . 53
APPENDIX B BENCHMARKING CRITERIA . . . . . . . . . . . . . . . . . . . . . 60
APPENDIX C SUMMARY OF BENCHMARKING OF SRM AND LUL QRA. . . . . . . . . . . . . . . . . . . . . . . . . . . . . . . . . . . . . . . . . . . . . 69
APPENDIX D LETTER TO RAILWAY GROUP . . . . . . . . . . . . . . . . . . . 78
APPENDIX E QUESTIONNAIRE SENT TO RAILWAY GROUP . . . . . . 79
HEALTH AND SAFETY LABORATORYAn agency of the Health and Safety Executive

1. INTRODUCTION
Her Majesty’s Railway Inspectorate (HMRI) commissioned the Risk Assessment Section ofthe Health & Safety Laboratory (HSL) to examine Railway Safety’s Safety Risk Model (SRM)to inform the Inspectorate of its scope, limitations, strengths and weaknesses. This model,developed by Railway Safety (RS) (prior to 1 January 2001 the Safety and StandardsDirectorate of Railtrack), aims to provide a structured representation of the cause andconsequences of potential adverse events arising from the Railtrack PLC-controlledinfrastructure (RCI). The SRM consists of a series of fault tree and event tree modelsrepresenting 110 hazardous events split into three divisions: train accidents, movement andnon-movement accidents.
The intended objectives of the SRM are potentially far-reaching, from providing inputs intorisk assessments (which form part of Railtrack’s Railway Safety Case, and indeed the safetycases of others in the Railway Group1), to assisting in the making of safety decisions aboutchanges or modifications and new infrastructure investment. It is likely that over theforthcoming months and years the Railway Group will make increasing use of the SRM whenattempting to justify that the risks from current and future operation on the railway are AsLow As Reasonably Practicable (ALARP). Therefore, it is imperative that an examination ofthe SRM is made, prior to it being extensively used, to inform HMRI of its strengths andweaknesses. This will enable HMRI to make balanced decisions about whether cases, todemonstrate that risk is tolerable, are acceptable when arguments are presented partly basedon the output from the SRM.
1.1. Objectives
The overall objectives of the review of the SRM are summarised below:
Carry out a detailed review of the SRM
� Determine the strengths and weaknesses of the model;
� examine the limitations of the model;
� investigate the scope of the model; and
� examine the human factors aspects of the model.
Benchmark the SRM
� Develop criteria for benchmarking quantified risk assessments;
� benchmark the SRM against the criteria; and
� compare the SRM with London Underground Ltd’s (LUL’s) QRA.
HEALTH AND SAFETY LABORATORYAn agency of the Health and Safety Executive
1
1 The Railway Group comprises Railtrack PLC, Railway Safety and the train and station operators whohold railway safety cases for operation on or related to infrastructure controlled by Railtrack PLC.

Investigate roll-out of the SRM
� Examine who will use the model and how it is intended to be used; and
� examine the mechanism for roll-out to members of the Railway Group.
Examine use of the SRM by the Railway Group
� Examine use by Railtrack; and
� examine use by an example Train Operating Company.
The scope of the review is to form a balanced view of the SRM from a consideration of theabove objectives. The review involved examining the fault tree and event tree models, whichmake up the SRM, examining the supporting documentation and holding discussions withvarious members of the Railway Group, primarily RS and Railtrack. It was not intended thatthe issue of implementation would be covered in detail by this review.
1.2. Scope of the report
This report presents the findings to the above four objectives. The first objective, to carry outa detailed review of the SRM, was reported in detail in an interim report (Turner and Keeley,2001) and is therefore not discussed in detail here.
The report is structured as follows:
� Section 2 summarises the review of the SRM;
� Section 3 describes the benchmarking of the SRM;
� Section 4 discusses the strategy taken on roll-out;
� Section 5 discusses how the SRM is being used by the Railway Group; and
� Section 6 draws together the main findings.
2. REVIEW OF THE SRM
The results of a detailed review of the SRM were contained in an interim report (Turner andKeeley, 2001). However, two areas were not discussed in detail in the interim report: thequality of the data and an examination of the human factors element. These are discussed ingreater detail below.
The review undertaken was of Version 1 of the SRM, as supplied by RS on 5 April 2001. Inparticular, the following were supplied:
� fault tree and event tree models (FaultTree+ files); and
HEALTH AND SAFETY LABORATORYAn agency of the Health and Safety Executive
2

� a Microsoft Access project database containing details of the derivation of the basic eventsand the fault sequence consequences.
As the SRM is being continuously developed, the comments in the following sections may notapply to later versions of the SRM FaultTree+ files. Therefore, where relevant, the specificversion of the files examined is clearly stated.
In addition to examining the fault tree and event tree models, relevant documentation has beenexamined and communication made with personnel from both RS and Railtrack.
2.1. Scope of the review
In order to determine the strengths and weaknesses of the SRM a sample of the fault and eventtree models have been reviewed. It would have been an extremely resource intensive task toconsider each of the 110 hazardous events within the SRM to any level of detail. Thereforethe review has been broken down into:
� a high level review of the overall model (Section 2.2);
� a detailed review of the fault and event trees for two high consequence / low frequencyhazardous events (Section 2.3):
� HET-1: ‘Collision between two passenger trains (other than at a platform)’ - version 1,subversion (a), FaultTree+ files were examined.
� HET-12: ‘Derailment of a passenger train’ - version 1, subversion (b), FaultTree+ fileswere examined.
� and a detailed review of the fault and event trees of two low consequence / high frequencyevents (Section 2.4):
� HEM-9: ‘Passenger falls or is injured whilst boarding or alighting the train’ - version1, subversion (b), FaultTree+ files were examined.
� HEN-24: ‘Worker slips, trips and falls (less than 2 metres)’ - version 1, subversion (b),FaultTree+ files were examined.
The reviews of specific hazardous events have looked in detail at:
� the completeness of the hazardous event, that is whether all major precursors, andmitigation and escalation factors are considered;
� the assumptions made;
� the structure of the event trees and fault trees, that is an examination of the logic; and
� the base event data, including derivation, traceability and sensitivity.
HEALTH AND SAFETY LABORATORYAn agency of the Health and Safety Executive
3

2.2. High level review of the SRM
The review of the overall model has generally not dealt with the detail of specific hazardousevents, but has considered more high level issues, such as those that impact the SRM as awhole. This section describes the findings from this review and considers global assumptions,quality assurance, possibilities for misuse and misinterpretation, and any other pitfalls, as wellas any issues with the chosen software.
2.2.1. Initiation of the SRM
The project initiation document (RS, 1999a) described the factors considered by RS at theoutset of the development of the SRM. These were considered appropriate and thereforehelped provide initial confidence in the SRM.
2.2.2. Scope of the SRM
The scope of the SRM was found to be clearly stated (RS, 2001a), with the primary objectivesbeing:
� to provide an understanding of the nature of the current risks on the RCI; and
� to provide risk information relating to the RCI to the Railway Group.
It is clear that the SRM is able to meet these high level objectives, although it is not clear howsome of the more detailed objectives would be fulfilled, particularly in relation to supportingprocesses that would need to be involved. For example, the following are stated objectives(RS, 1999a; RS, 2001a):
� assist in the development of railway safety cases within the Railway Group;
� provide risk information for use in risk assessments throughout the Railway Group;
� identify and prioritise the revision of Railway Group Standards; and
� assist in identifying additional control measures.
The mechanisms and processes that would enable the SRM to fulfil all these objectives werenot explicit as was discussed, in detail, in the interim report (Turner and Keeley, 2001).However, RS in response stated (RS, 2001c):
� “it is the responsibility of the Senior Risk Analyst within Railway Safety to ensure thatprogress is made towards achieving as many of the objectives of the SRM as soon aspossible; and
� the design and implementation of specific tasks and projects to achieve this are anessential part of the ongoing SRM development programme.”
HEALTH AND SAFETY LABORATORYAn agency of the Health and Safety Executive
4

This response appears reasonable, since the SRM has only been developed since 1999. Thedraft Guidance Note ‘Guidance on the preparation of risk assessments within railway safetycases’ (see Section 4.3.2) prepared by RS in 2001, after the interim report (Turner and Keeley,2001), is indicative of a continuing commitment to meet the stated objectives.
The scope of the SRM,
� in terms of its boundaries, that is the parts of the RCI modelled; and
� in terms of the groups of people whose risk is quantified
was found to be clearly stated. Indeed, areas of the RCI not covered by the SRM were alsoclearly stated.
2.2.3. Review of the fault and event tree related software
The applicability of the software packages used, Isograph’s FaultTree+ and RiskVu, appear tohave been carefully considered at the outset. These packages are also used by LondonUnderground Ltd (LUL), and FaultTree+ is used throughout the aviation industry. Therefore,it is considered that overall the choice of software is appropriate. However, a number of issueswere identified and discussed in detail in the interim report (Turner and Keeley, 2001). Thestrengths and weaknesses are summarised below.
FaultTree+
� FaultTree+ is relatively simple to use with little training;
� it interfaces well with other packages allowing all data and assumptions to be recordedelsewhere and imported electronically;
� large event trees cannot be scrolled around and are, therefore, difficult to read, which givesa potential for introducing errors into the models; and
� FaultTree+ allows the use of partial event failure nodes in the event trees. This is astrength in that it gives analysts flexibility. However, there is a potential pitfall in thatFaultTree+ does not check that the sum of the partial event probabilities for a specificsequence is one.
RiskVu
� RiskVu is simple to use without needing access to the fault and event trees. However, it isdifficult to use the results appropriately without understanding the underlying fault andevent tree models. It is a concern that with RiskVu, the SRM could be treated like a ‘blackbox’ and the results used inappropriately. However, from discussions with RS, they areaware of this limitation and only allow trained analysts to use it;
� it is straightforward to use RiskVu to ask ‘what-if’ type questions and to perform simplesensitivity studies; and
HEALTH AND SAFETY LABORATORYAn agency of the Health and Safety Executive
5

� it presents results in a clear and easily digestible form. However, care must be taken toensure that the results are used appropriately. For example, it would be a concern if theRiskVu outputs were used as the main argument in supporting a decision not to acceptsafety improvements.
2.2.4. Hazard identification
The approach used to identify the hazardous events generally appeared to be very good, that islogical and well scoped. The only small concern related to the fact that the range of peopleused in the brainstorming sessions had not been described. However, RS’s response was thatthe following were involved (RS, 2001c): risk analyst specialists from within Railway Safety;technical specialists from Railway Safety, who reviewed the hazardous event identificationdocument (RS, 1999c); and a diverse range of expertise by making use of the original EastCoast Main Line, Channel Tunnel Rail Link and Yellow Book hazard identification processes.Assuming that these previous studies involved personnel from all parts of the rail industry andat all levels and that these studies are still valid, then the hazardous event identificationprocess would be acceptable.
The approach adopted to identify the hazardous event precursors involved reliance onprevious hazard identification studies, and “the experience and knowledge of the Risk Modelanalysts”. One possible shortcoming involved the lack of any new hazard identification studyfor the purpose of identifying precursors. However, RS stated that: “the comprehensive natureof the previous analyses combined with the knowledge of the individuals within RS and theirreview of historic data, provides considerable confidence that a minimum number of gapsexist” (RS, 2001c). The identification of precursors would therefore appear to be acceptable.
There remained a small concern about the apparent lack of a process for ensuring that thereare no gaps in the future, for example a formal system for regular review. However, RS statedthat they have a commitment to update the model to account for new data and systemtechnology changes at least once per year (RS, 2001c). Indeed, RS have a procedure for theupdate of the SRM (TP 624/01), which appears adequate.
2.2.5. Development of the FaultTree+ models
The link between the FaultTree+ models and the hazardous event identification (RS, 1999c) isexcellent. However, the link between the identified precursors (RS, 1999d) and the FaultTree+models is not clear, as some of the precursors do not appear in the fault trees. It has not beenpossible to determine the mechanism employed for deciding whether particular identifiedprecursors should be incorporated into the fault tree models or not. This is therefore a causefor concern, as there is the potential for the SRM to miss some ways in which a particularhazardous event may occur. RS have not included all the identified precursors in the fault treemodels in order to limit the level of detail. Only the high level precursors have been includedin the fault tree models because of limited data available on the root causes of some failures.
RS stated to have originally intended to provide a table, cross-referencing each precursor inthe precursor identification report (RS, 1999d) to the SRM precursors; this was not done dueto insufficient time and resources to complete the process (RS, 2001c). However, RS statedthat part of the quality assurance process required the reviewers to satisfy themselves that the
HEALTH AND SAFETY LABORATORYAn agency of the Health and Safety Executive
6

identified precursors had been adequately represented in the SRM (RS, 2001c). Although theprocess appears adequate, the lack of traceability for the decision making process makes itdifficult to be confident that there are no gaps.
2.2.6. Structure of the FaultTree+ models
Generally the fault tree and event tree models appear to have been well-constructed. Eventhough some of the models are extremely large, for example the collision models, they arerelatively easy to navigate, although for someone with little knowledge of quantified riskassessment (QRA) they would be difficult to use. There was some initial concern that, giventhe size and complexity of the SRM and in particular some event trees, there is a realpossibility for mistakes in the model itself, and also possibilities for mistakes to be madewhen using the model. Given a model of this size and complexity it would be impossible for itto be totally error free; however, because of the way that it has been constructed this anxietyhas been minimised.
In general the fault trees within the SRM are expressed at a relatively high level and do not,generally, model the root causes of failures. However, RS indicated (RS, 2001g) that: “manyperson months of effort were expended in resolving the fault trees as far as possible, but wereultimately limited by the availability of suitable data. And indeed, the collision models doinclude some 500 individual cause precursors”. Therefore, where data was available, detailedmodelling has been incorporated in the SRM. Those acknowledged modelling limitationsmean that there is potential for the SRM to aid safety decisions at a fairly high level but not atthe practical or sharp end. There also appears to be no attempt to model any controls; thismakes the link between the precursors modelled in the SRM and the controls and safetymanagement system difficult to envisage. However, RS have developed a Controls Databaseand are working on a Risk Control Matrix project (RS, 2001g; RS, 2002). The ControlsDatabase contains all the controls in all the Railway Group Standards, and the Risk ControlMatrix is being designed to link explicitly the precursors in the SRM to the controls andmeasures listed in the Controls Database.
The SRM is very much a system-wide model that generally does not take account ofdifferences across the RCI. Thus, the risk calculated is an average system-wide value.
Escalation and mitigation factors have, with necessity, been modelled in detail because of thelarge effect they can have on the consequences of certain events. These factors increase thecomplexity and size of the event trees but are necessary to get a reasonable estimate of therisk. There is obviously a balance to be struck between a refined, extremely complex modelwith an accurate estimate of risk and a coarse, simple model but a very approximate estimateof risk. The SRM appears to strike an appropriate balance.
2.2.7. Quantification of the FaultTree+ models
Quantification of the SRM is discussed in detail in this section, because the quality of theinput data dictates the quality of the outputs from the SRM. The section is split into threesubsections:
� fault tree event and event tree node quantification;
HEALTH AND SAFETY LABORATORYAn agency of the Health and Safety Executive
7
� consequences; and
� quality of the input data.
Issues relating to the human factors aspects of the SRM are discussed in Section 2.2.8.
Fault tree event and event tree node quantification
As discussed in Section 2.1.3 of the interim report (Turner and Keeley, 2001), because of aspecific FaultTree+ modelling issue, the fault tree basic events have been quantified in termsof number of events per train mile or per passenger journey. RS indicated (RS, 2001g) thatthis has had to be done so that the risk contribution from each cause precursor is quantifiedand displayed within the RiskVu program. The traditional use of frequencies at the first nodeof the event tree will result in no precursor risk contribution estimates being generated withinRiskVu. RS have stated (RS, 2001g) that this matter has been taken up with Isograph, thesoftware author, who are considering whether modifications can be made to RiskVu to correctthe anomaly. With the LUL QRA, which has event frequencies attached to the first node ofthe event trees, RiskVu does not produce any precursor risk contributions.
This linking of the event frequency to the second node in the event tree is unusual in thatnormally the fault tree would be quantified in terms of events per year and this would belinked to the event tree as the initiating event. This has led to the following issues:
• the basic events in the fault trees are populated with extremely small numbers which aredifficult to visualise;
• the unusual codification may cause confusion to others; and
• even though the basic events are quantified as frequencies (events per mile) they havebeen modelled throughout the fault trees as probabilities. Mathematically this is incorrect,because when a fault tree is quantified these frequencies are multiplied together (crossproduct terms). This potentially results in an inaccurate calculation of the event tree topevent ‘frequency’. However, as the values are small the error should be negligible. Thishas had to be done because these fault trees feed into the second node of the event tree andnot the first as is normally the case.
However, this does not create a numerical problem, because where the second node of theevent tree is specified as the ‘number of events per train mile’, the initiating event isquantified as the ‘number of train miles per year’. Therefore, combined they represent thenumber of events per year as is usually the case.
Additionally, quantification in this way could give the SRM inherent flexibility, since riskcould be calculated for any number of assumed passenger journeys or train miles. There aretherefore potential benefits to TOCs who could, in principle, determine their overall level ofrisk and compare with national averages (by inputting the specific number of train milesundertaken).
HEALTH AND SAFETY LABORATORYAn agency of the Health and Safety Executive
8
The following are inconsistent within the SRM.
• The units of the basic events are not consistent throughout the different hazardous eventmodels. Events have been derived as either ‘events per number of train miles’, ‘events pernumber of passenger journeys’ or ‘events per track miles’. Numerically, as long as thesame units are used consistently throughout the fault tree models for a specific hazardousevent, this approach should create no problems. However, there exists a potential pitfallfor the unaware, as it increases the chance of errors being made in the quantification of thefault trees. It nevertheless appears that within the SRM the most appropriate units havebeen intentionally used for each specific hazardous event, presumably to make thefrequencies more meaningful in terms of the normalising parameter used. For example,the number of boarding and alighting incidents relate more to the number of passengerjourneys than the number of train miles travelled and the number of worker slips, trips andfalls relate more to the number of track miles than the number of train miles.
• Another small inconsistency, which again numerically is not problematic, but to theunaware is a potential pitfall, is that frequencies calculated for the hazardous events areeither the frequency of all incidents, whether or not they lead to injury occurring (mainlythe case for the train accident hazardous events), or the frequency of incidents which leaddirectly to injury (mainly non-movement or movement hazardous events). As the SRMhas mainly been quantified in terms of accident data, limitations in the data prevent allincidents being calculated in terms of the frequency leading to any level of consequence,including no harm.
These points are adequately described within the Risk Profile Bulletin (RS, 2001a). Therefore,the potential for error should be small, but cannot be ruled out.
Many of the events in the high consequence / low frequency classification, such as trainaccidents, have been quantified on the basis of very few past incidents, for examplesometimes only one or two incidents. There is therefore a concern that these may be underrepresented in the SRM. An analysis of data over a 10 year period may not identify the risk ofan event that only occurs every 50 years, for example; but, if the consequences of that eventare severe then the risk may by significant.
Some cause precursors in the fault trees of the SRM have a failure frequency of zero assigned.Approximately thirty percent of the events stored in the project database have a failureprobability or frequency of zero. However, the vast majority of these appear in the ‘collisionbetween trains’ top events and therefore only affect a small part of the SRM. It appears thatwith the current version of the SRM, particularly in the collision models, where a particularfailure has not been observed then it is assumed never to occur. For these cases there is littlerecognition (except for events where there is no precursor data to quantify the hazardousevents and estimated precursor frequencies have had to be used) that just because historicallyan event has not been seen, there is still a chance, although small, that it may occur in thefuture. The overall system-wide risk could be assumed to be insensitive to a few of these suchevents. However, as there are a large number, some 500, then this assumption cannot be madestraightforwardly and is a cause for concern. RS, in response (RS, 2001c), stated they havethought hard about this and indicated that they believe that it is not a cause for concern,because in these cases there is a high degree of confidence in the overall hazardous event
HEALTH AND SAFETY LABORATORYAn agency of the Health and Safety Executive
9

frequency and assigning a non-zero frequency to these precursors would significantlyoverestimate the hazardous event frequency and therefore the risk. Whilst this is true for thehistoric risk, it may not be the case for the future risk. RS stated that (RS, 2001g): “thepurpose of the SRM is to attempt to establish what we believe is the current level of risk onthe railway by predicting the risk contribution from each cause precursor and all the possibleoutcomes associated with each hazardous event. Then, using knowledge of what mighthappen on the railway in the future e.g. fitment of TPWS (Train Protection Warning System)or changes in SPAD management, we can make estimates of what the future risk might be”.The SRM is suitable for this and provides a reasonable estimate of the current level of risk. Itis also representative of the future risk assuming there to be no significant change to thesystem hardware or operating procedures, and can be used to estimate the change in risk frommaking changes on the railway, for example fitment of TPWS.
Issue 1 of the Risk Profile Bulletin acknowledges “that for Version 1 of the SRM, no attemptwould be made to quantify the frequencies and probabilities for these precursors”, (that is the‘cause precursors’) where no data is available for some but not all the identified causeprecursors. This only applies to the collision between trains hazardous events, and as suchonly affects a small part of the SRM. It also goes on to say that “the actual data gives areasonable estimate of the hazardous event frequency, such that this assumption is unlikely toproduce significant errors”. RS have indicated (RS, 2001g) that Lancaster University MScstudents have confirmed that this is a reasonable assumption. The approach taken alsoemphasises that the output from the SRM is not a measure of the current or even future risk onthe RCI but more a measure of the past or historic average risk; however, this can beindicative of the current and future risk as discussed above. It is emphasised in the RiskProfile Bulletin that a study will be initiated in 2001 with the aim of developing amethodology to assign data where little or no records of failure exist for such causeprecursors; RS stated that this project is now underway (RS, 2001c).
Consequences
Similar to the derivation of fault tree basic event failure probabilities or frequencies and eventtree node probabilities, the derivation of consequences is based wherever possible onhistorical data and then on expert judgement. However, there is very little data available,particularly for high consequence / low frequency type train accidents and where this dataexists, it can vary considerably in quality. Consequence data can therefore be subject to greatuncertainty. To account for the uncertainty, a range of casualties have been estimated for eachaccident type over an order of magnitude. It appears reasonable to be able to make thisestimation. Generally within the SRM the midpoints of the range in consequences have beenassigned to each accident scenario. Thus, as with the failure data, the consequences are verymuch best estimate.
It is good to see that the SRM Overview Report (RS, 2000) refers to the use of the upper andlower bound estimates of the consequences as the basis of sensitivity analyses. However, thisissue appears to be glossed over within other documentation supporting the SRM. RS inresponse (RS, 2001g) have indicated that “significant effort was put into ensuring that theSRM is a best estimate model including a considerable amount of effort assessing the validityof the results against historical data. Therefore, uncertainty in the data has been considered”.
HEALTH AND SAFETY LABORATORYAn agency of the Health and Safety Executive
10
For specific fault sequences where there is no accident data, expert judgement has beenapplied. This can be very subjective, and is often a concern in QRAs. However, for the SRM anumber of factors were used: historical data, the characteristics of the rolling stock, trainspeed, the location of the incident, the conditions for evacuation, differences between twosimilar fault sequences and other relevant conditions. These help reduce the concern, as thisstructured approach helps derive consistent and repeatable consequence estimates.
SRM data quality
The fault trees and event trees within the SRM have been predominantly populated with datafrom various accident, incident or failure databases. Therefore, in order to determine thequantitative aspect of quality of the SRM, it is necessary to determine the quality of the data inthe incident databases. RS carried out a review of available data sources (RS, 1999f) with theaim of determining: what is in them; the number of years worth of data; how accessible thedata is; and how relevant the data is. Although this provided an excellent summary of thecontents of these databases, it did not address the important issue of data quality.
In order to determine the quality of the data input to the SRM, RS were asked to provideinformation on the following databases (Turner, 2001a):
� Safety Management Information System (SMIS);
� AEA derailment database;
� Fatalities database;
� Major Injuries database; and
� SPADMIS database (a predecessor of the SPADs database).
These databases were used to quantify the vast majority of the events within the SRM.Information was requested for each of the above databases on:
� the level of detail stored in each;
� the process for data entry;
� quality assurance aspects; and
� how the data from these databases was used to support the SRM.
A review of the information provided by RS (RS, 2001e) is discussed below.
Level of detail: The amount of information stored in each of these databases variesconsiderably, as it also can from record to record within a given database.
SMIS is an extensive database that is used by all the Railway Group to recordinformation on safety related events. The level of detail is very dependent on the type
HEALTH AND SAFETY LABORATORYAn agency of the Health and Safety Executive
11

of incident. Greater detail is required if an incident involved a train or has been classedas ‘serious’, that is if it could lead to a fatality. However, from the one exampleprovided, where a train collided with an animal but did not derail, there is no detailgiven either on the speed of the train or on the number of people on the train. Both ofthese are required to be able to get a reasonable estimate of the consequences for agiven event.
The Fatalities and Major Injuries databases provide simple information on injuries topassengers, members of the public and workers. This includes all mandatory SMISfields as well as some additional information such as the type and degree of the injury.Links are present in these databases to the relevant SMIS records.
SPADMIS contains vast amounts of information on all category ‘A’ SPADs that haveoccurred on the RCI. This is contained in over 300 fields. The data was found tosupport the SRM well in the level of detail contained within the fault trees whereSPADs were an identified precursor.
The AEA derailment database was found to contain high level details aboutderailments such as: location, the train involved, details of the design of the vehiclederailed, a brief description of the cause and details of the injuries. However, noinformation was given on the number of people at risk, nor was sufficient informationgiven about the cause to enable the root cause to be determined. For the SRM, as ahigh level tool, use of this database is probably adequate.
Process for data entry: Each database uses different data sources and has a different processfor data entry. These aspects are therefore discussed for each of the databases.
Data is entered into SMIS by approximately 40 organisations throughout the UnitedKingdom. There is therefore a potential problem in ensuring consistency and quality.However, Railtrack stated that they have strict key performance indicators regardinginput of data and finalising of safety related events. The adequacy of these indicatorshas not been assessed. Data is input by data clerks and therefore sanity checking of thedata at the input stage is likely to be limited. However, as the clerks are required to goon a two day training course as part of the process to ensure competency, the concernis small. The large range of data sources used for populating SMIS, for example dailyincident logs, Railtrack Zone reports, freight and passenger train operating companies(FOCs/TOCs) and the Fault Reporting and Monitoring of Equipment (FRAME)system, mean that quality and consistency of the data input into SMIS may vary due tovariations in the quality of these reports; this is a concern.
Entry into the Fatalities and Major Injuries databases is carried out centrally at RS bySafety Intelligence Advisors (SIAs). The primary source of data is SMIS and each SIAis required to undergo both SMIS browser and maintenance training as well as have asatisfactory level of understanding of safety on the railways. The fact that thesedatabases are maintained and updated centrally and that the personnel involved in thisappear to be suitably qualified and experienced gives confidence in the consistency ofthe data with that in SMIS. However, one potential area of weakness, and therefore a
HEALTH AND SAFETY LABORATORYAn agency of the Health and Safety Executive
12

concern, is that the data is derived predominantly from SMIS. The quality of the datain this database is therefore driven by the quality of the data within SMIS.
A national SPADMIS database is held centrally by RS. This is updated by RS by thedownloading of local databases held by the Railtrack Zones. Data is entered into theselocal databases by clerks within each of the zones. Therefore, as data entry is notcentralised there is potential for problems with consistency and data quality. However,the concern is likely to be minimal, as the same format of SPAD reports are usedthroughout Railtrack and this is especially the case if the information contained withinthe reports aligns well with the fields in the SPADMIS database.
The AEA derailment database was maintained by British Rail Research (BRR), nowAEA, and information was fed into it by use of D1 and D2 forms. These werecompleted by the Railtrack zones (or equivalent pre 1994) and sent to BRR. As astandard form has been used throughout the zones, this should have helped ensureconsistency in populating the database. It would appear reasonable to be able to rely onthis for estimating the frequency of high level precursors that lead to a derailment forquantification of the SRM.
Quality assurance: The overall quality of the database is very dependent on the qualityassurance procedures applied to inputting data, verifying the data and maintaining thedatabases. This is therefore discussed at length for each of the databases makingparticular reference to: verification, consistency and accuracy of the data.
Within SMIS the safety manager of the organisation, that is the ‘event owner’, isresponsible for the verification of any inputted safety related events and auditing thequality of the data input. RS stated that this is usually carried out by checking thedetails of the inputted safety event against paper records. The process would appear tobe acceptable, although it has not been possible to determine whether this is the case inreality. RS audit compliance against the Railway Group Standard which mandates therequirements for reporting of safety related information by means of SMIS(GE/RT8047). In addition, RS also verify the quality of data in SMIS by verifying thedata in databases it has derived from SMIS, against other data sources. RS generallydo not compare the data within SMIS against hard copies of the data as used by theinput clerks. However, for serious incidents the data is compared with informationprovided in the incident logs, from HMRI and any other data provided by the zones.
Consistency of data for similar events in SMIS is ensured by the use of mandatoryfields. However, this does not help ensure consistency within non-mandatory fields,where RS agree that data is input to varying levels of consistency and is dependent onthe data available to the data input clerk. It is these non-mandatory fields that mayprovide most information on the root causes of an event.
RS indicated that under-reporting in SMIS is not seen to be a significant issue,although they do recognise that there is less confidence in the accuracy of the detailcontained in the less serious events and that under-reporting is likely in the followingareas: trespass, near miss events (particularly non-movement incidents) and vandalism.
HEALTH AND SAFETY LABORATORYAn agency of the Health and Safety Executive
13

With the Fatalities database, SIAs are responsible for verification of the data. Theycross check data in this database with: daily incident logs, British Transport Policereports, coroner’s reports and HMRI data. Additionally, RS stated that they wouldmeet every 6 months with HMRI and Railtrack to discuss issues related to data qualitysuch as inconsistencies and means of improving data quality. Consistency is ensuredby centralised data entry. It therefore appears that control of data in this database isacceptable.
Quality assurance of the data in the Major Injuries database is similar to that with theFatalities database. However, there is no cross checking of data against any hardcopies of the data, as the data has been derived solely from SMIS. The SIAs monitorthe data downloaded from SMIS for any anomalies. The quality of the data wouldtherefore appear to be adequate.
Data in the SPADMIS database is verified by RS. By verifying the data centrally thisalso helps ensure that there is consistency between records. Checks are made betweenthat contained in the central database and those held by the zones to identify anypossible inconsistencies. Detailed checks are also made with data on SPADs containedwithin the Daily Incident Logs. There would therefore appear to be no major cause forconcern as regards the quality of data in this database.
Derailment investigation officers within BRR were responsible for the verification ofdata contained in the AEA derailment database. They used their skill and judgementwhen entering the data. However, there is a considerable amount of variation betweenthe data stored in the various records. In addition, there has apparently been asignificant under-reporting of incidents during the transitional periods of the railindustry, which has inevitably affected the quality of the data. This was due to thezones, or their equivalent, not sending the required information. The derailmentinvestigation officers did however reconcile data contained within the Daily IncidentReports; this should have minimised the degree of under-reporting to some extent, butprobably had more of an impact of ensuring accuracy of the events reported. It wouldappear that this potential issue has not had a detrimental affect on the SRM, as RSstated that they have made specific checks against the number of derailments recordedwithin HMRI annual reports and the HMRI reportable accidents database.
Use within SRM: Interrogation of the databases for use within the SRM was done by RSstaff. For the SMIS database, the Risk and Safety Intelligence Team who have hadspecific training and have a high level understanding of the system and the datarecorded in it, were used. For the other databases risk analysts from RS, closelyinvolved with the development of the SRM, were used; particular analysts familiarwith a given database were used. Advice was taken as necessary from the SIAs,especially for the SPADMIS database. RS believed that specific training wasunnecessary to use the Fatalities, Major Injuries and AEA derailment databasesbecause of the analyst’s familiarity with these databases. The latter database was alsosupplied with a detailed document describing each field in the database. Therefore, assuitable competent personnel appear to have been used to interrogate the databases fordata to populate the SRM, this is not an area of concern.
HEALTH AND SAFETY LABORATORYAn agency of the Health and Safety Executive
14

RS stated that: “whenever data is used within the SRM careful thought is given to theapplicability of the data to the cases being considered” and go on to say that “therelevance of the sources of information was an input into the quality assurance checksfor each model included within the SRM”. In addition, further checks were madeagainst the number of SPADs recorded in SPADMIS, SPAD reports and the SPADfrequencies generated by the SRM models to ensure the accuracy of the results.Although implementation of this process has not been examined the approach wouldappear to be reasonable.
In summary, the main issues found with the data sources used to populate the SRM are:
� there is insufficient breakdown of the causes of an incident, therefore why an incidentoccurred cannot be fully determined;
� RS have made good use of the data available, therefore retrieval of information and use inthe SRM are not perceived to be major problems. However, if the TOCs were to requireinformation, this would be a concern, due to their probable lack of suitably qualified andexperienced personnel; and
� best use of available data has been made, although there does appear to be somelimitations in this data, especially that derived from SMIS, and this is a minor cause forconcern.
Summary
A number of issues have been identified relating to the quantification of the SRM, asdiscussed in detail above. The vast majority of these are relatively minor and thequantification was generally found to be fit-for-purpose. However, one small area of concernis that some of the data in the SRM is up to 3 years old and in need of reviewing. RS haveacknowledged this and have provided verbal assurances that the necessary work would bedone; and have indicated that an update is currently in progress.
2.2.8. Human factors aspects
Many causes leading to the realisation of a hazardous event are human error related, eitherdirectly, for example a signal passed at danger due to a driver disregarding a signal because oftheir ignorance of the rules and instructions, or indirectly, for example a broken rail due to thefailure of maintenance. Human error can appear both as a cause precursor, as in the aboveexamples, and also as a consequence precursor. It was, therefore, imperative to review howhuman error aspects were incorporated into the SRM.
Throughout the documentation supporting the SRM (RS, 1999a) it is stated that where data isnot available, use has been made of human error probability assessments using the HumanError Assessment and Reduction Technique (HEART) or expert judgement from in-houseexpertise. However, use of techniques such as HEART to produce estimates of human errorprobabilities should be used with caution because they were not developed specifically for therailway industry. HEART analysis (Williams, 1986) is based on a review of human factorsliterature and of experimental evidence (nuclear power control room simulation studies)
HEALTH AND SAFETY LABORATORYAn agency of the Health and Safety Executive
15

showing the effects of various parameters on human performance. One of the problemsassociated with this technique is that both human performance literature and simulatorexercises tend to be highly controlled, use reasonably motivated subjects for short periods oftime and often look at no more than two independent variables. Contrast this to the RCI,where many performance shaping factors vary and interact; for example: time pressures,adequacy of training, inadequate maintenance scheduling and driver fatigue. In addition,Kirwan (1994) points out that the HEART technique fails to model dependence, and itsfurther weaknesses include a lack of justification for such a simple multiplicative modelwhich sees human error as a function of Error Producing Conditions, and its varied use bydifferent assessors. In summary, the generality of data obtained from human reliabilitytechniques such as HEART, remains questionable. However, Version 1 of the SRM has triedto steer away from these techniques wherever possible and use actual data. RS have alsoindicated that they are commissioning a Research and Development project to investigate thepossibility of developing a Human Error Probability assessment methodology specific to therailway industry.
The adequacy of the human factors aspects depends on the data used to populate the SRM; forexample: on the reliability and validity of the data sets used, whether the historical accidentand incident databases record information in terms of the root cause of the human error, andwhether the databases are sensitive enough to consider the underlying psychologicalmechanisms, that is the reasons why the human error occurred in the first place. Experiencefrom other high hazard industries, for example mining (Weyman and Anderson, 1997),suggests that such classifications are frequently found wanting in this respect. A summary ofthe sources of data used to populate the SRM, and associated issues, was discussed inSection 2.2.7, where in general it was found that there is insufficient detail to give an insightinto the root cause of the human error.
At a high level, assuming the data used to be adequate, the SRM does take account of humanfactors. The level of detail varies depending on the particular hazardous event. For example,the collision between trains hazardous event contains many human factors related precursors,particularly in connection with signals passed at danger. This is clearly seen by referring toTable A1 in Appendix A, where the highlighted events are basic events in the fault treemodels that are quantified. Whereas, as seen in Table A2 in Appendix A, the derailment of apassenger train hazardous event contains relatively few direct human error precursors. Theproportion of human factor related precursors can be seen for other example hazardous eventsby referring to Tables A3 to A5 in Appendix A.
A small concern in the SRM is that various events, whilst modelled to the same level of detail,appear not to be equivalent. For example, consider the collision between trains hazardousevent and the following precursors:
� ‘driver error due to disregarding signals because of their ignorance of the rules andinstructions’; and
� ‘driver error due to disregarding signals because they fail to react to a caution signal’.
These are modelled to the same level in the fault tree, but it is not clear that they areequivalent levels of cause. The important aspect about failing to react to a caution signal is not
HEALTH AND SAFETY LABORATORYAn agency of the Health and Safety Executive
16

the description, but why the driver failed to react. Because of the possible mix in the level ofdetail, any prioritisation of precursors in terms of their risk contributions may not reflect theactual relative risks in terms of the root causes.
Events which are indirectly human factor related are not obviously taken into account withinthe SRM. For example, the risk of broken rails may be partly due to maintenance errors, butthe fault trees are not developed sufficiently to show this, mainly due to a lack of suitabledata. However, the frequency of a broken rail should include contributions from all causes;therefore, the calculated risk should be accurate even if the root causes are not clear. Indeed,up to 99 percent of the precursor events within the SRM are ultimately human factor related ifthe fault trees were developed down far enough. If the SRM is used as a tool for calculatinghigh level risk profiles rather than detailed assessment of the root causes of hazardous events,the limited development2 of the fault trees is not a cause for concern because the hazardousevents with the highest risk contributions can be targeted and then detailed analysis carried outoutside the SRM. From discussion with RS and Railtrack this appears to be the way that theSRM is to be used. Even though root causes may not be fully modelled, there is still asignificant amount of detail in the SRM to enable users of the SRM to carry out a detailedanalysis of the causes of a hazardous event.
2.2.9. SRM project database
The project database forms an integral part of the SRM. This stores all data, assumptions,justifications, references and calculations used to derive the data. This database is an excellentpart of the SRM and is the single most important aspect that makes the SRM stand out abovemany other QRAs across many industries. Currently, the derivations and assumptions are notgiven for all the data in the database; the incomplete records relate to three hazardous events(HET-1, 2 and 3), the data associated with the other 107 hazardous events being fullycomplete. In addition, RS have stated (RS, 2001g) that: “information relevant to HET-1, 2 and3 is contained within separate spreadsheets and is currently being updated”. Therefore, this isnot perceived as a major issue.
The importance of this database cannot be overstated. It is a vital element of the SRM inensuring traceability of the data populating the fault tree and event tree models. It also helpsimmensely in understanding the SRM models and will be vital if the model is used outside RSby the Railway Group. The lack of such a database is a common flaw in QRAs. It is good tosee that RS thought of this at the outset and have also produced a report describing itscontents and its use (RS, 1999e). However, this report is out of date as regards to linking withFaultTree+ because of changes to the functionality of FaultTree+. Because of the importanceof the database, RS should consider revising this report as soon as possible.
A summary of the other points discussed in the interim report (Turner and Keeley, 2001) aregiven below:
� Because the database is used to calculate the consequence of each fault sequence withinthe event trees, they can be quantified in terms of a range of consequence outputs.
HEALTH AND SAFETY LABORATORYAn agency of the Health and Safety Executive
17
2 The SRM does model the system-wide aspects of the railway in detail, and in considerably moredetail than has been attempted before. However, it does not generally model the precursors down toroot causes.
� Using the database to calculate consequences could also be a weakness, as the codingrequired to do this appears to be rather cumbersome for simple multiplication and additionof data.
� The field that identifies in which particular hazardous event a particular failure probabilityor frequency is modelled does not appear to have been filled in consistently.
2.2.10. Risk measures
The SRM has been quantified in terms of equivalent fatalities, which is excellent in that itrecognises the importance of considering not only fatalities but also major and minor injuries.However, there is a small concern that there is no clear rationale for the ratios used to converta major and a minor injury into an equivalent fatality. The output from the SRM will bedependent on these ratios, and a sensitivity study should be carried out. RS have stated (RS,2001g) that: “these ratios are the currently accepted values used throughout the railwayindustry and were in use before the SRM project was initiated”. RS have also indicated (RS,2001g) that they are commissioning research into this area as a part of the Research andDevelopment programme.
The SRM is very flexible in terms of the risk measure used. Instead of equivalent fatalities,the SRM can output in terms of absolute fatalities, major injuries and minor injuries topassengers, workers or members of the public.
The normal risk measure, expected equivalent fatalities per year, gives the total expectedequivalent fatalities from the RCI - the collective risk. This is useful to determine relativerisks but does not give any indication of individual risk. In the Risk Profile Bulletin (RS,2001a) the collective risk is converted to an average individual passenger risk for a commuter.This is reasonable as far as it goes, but it does not help identify what the risks are to particulargroups of passengers. Indeed, this would not be possible because this information cannot beresolved from the SRM. This therefore appears to be a limitation in the scope of the SRM, asit was not a part of the original scope.
It is anticipated by RS, although not part of the original scope, that the SRM will also be usedto derive individual risk to workers and members of the public. However, currently it isrecognised that difficulties exist in doing this because of problems in identifying theproportions of the various hazardous events that would apply to specific groups of staff ormembers of the public. It would be a concern if the SRM were used to derive individual riskin this way. There is no distinction possible between the different groups of workers and toomany assumptions would have to be made, resulting in extreme subjectivity.
The SRM is essentially based on historical accident data; it presents the average collective riskover the last 10 years for example. Therefore, the output from the SRM appears more ameasure of risk outcome rather than risk potential. This is particularly true for the derivationof hazardous event frequencies. However, the derivation of consequences has had to bepredictive because of the limited numbers of specific historical incidents. It could be aconcern if the SRM is put to more uses than can really be justified, such as being the maininput into the decision as to whether a new safety feature should be implemented. However,the SRM can be constructively used as an input to the decision making process as long as it isnot the sole input.
HEALTH AND SAFETY LABORATORYAn agency of the Health and Safety Executive
18

2.2.11. Review of major assumptions
The SRM has been developed to represent the average risk on the system-wide RCI. Thistherefore leads to a number of potential problems, especially if it is used to assist in makingsafety decisions on a local basis. For example, certain assumptions would be extremelyinaccurate for particular regions of the country. The SRM contains a number of assumptions,for example ‘the average length of a tunnel is half a mile’ and ‘a fixed proportion of the trackhas a third live rail’. This potentially makes the SRM very difficult to use by many membersof the Railway Group, for example small TOCs, without many changes to the fault tree andevent tree data.
Most key assumptions are identified and discussed by RS in the Risk Profile Bulletin (RS,2001a; 2000d). These were found to be adequate except for the following issues:
Consequences: Where possible consequences have been derived from the average of pastexperience. However, the project database does not appear to give details of thenumber of people present on the trains for these real events, as accurate estimates ofthis have not been recorded historically, and a value of 700 over 10 carriages has beenassumed (fully loaded train). Where fewer passengers were present in reality this doesnot appear to have been taken into account. RS indicated that they have taken this intoaccount, although this is not clear in the documentation or project database, and agreethat this should be made clearer in the project database (RS, 2001c).
Passenger loading: Although it appears that the consequences in the SRM are based on a 10car train (the average train being smaller), scaled to account for the time of day (night,off-peak and peak) and as such may overestimate the consequences for a smaller train,this is not the case in practice. For most scenarios, it is not the total number of peopleon the train that is the important variable, but the number of people in a carriage.Therefore, the density of passengers is the important variable. The way that theconsequences have been derived therefore apply equally well to any length of train fora given number of passengers per carriage. The main exception is with fires on a trainin a tunnel, where the total number of passengers would be the important variable. Inthis case the consequences could be overestimated approximately by a factor of two tothree for smaller trains.
The issue of how consequences apply to different length trains has caused someconfusion within the Railway Group and as a result RS have attempted to clarify theissue. The current position, however, still requires resolution, both from a projectdatabase and supporting documentation perspective.
Speed of trains: The SRM is rather coarse in how speed of trains are dealt with. Trains areassumed to be either slow, which is defined as either less than 15 mph or 25 mph, orfast, greater than 15 mph or 25 mph respectively. This does not appear sufficient tocover the range of train speeds and therefore consequences on the RCI.
HEALTH AND SAFETY LABORATORYAn agency of the Health and Safety Executive
19

2.2.12. Auditable trail and quality assurance
Generally, the way in which the SRM has been developed is excellent in terms of auditability.
• The model has been developed in-house and is therefore owned and understood in-house.
• The project database helps trace the derivation of all the data that populates the fault treesand events trees of the SRM.
• The project quality plan (RS, 1999b) clearly describes the way in which records ofmeeting notes, telephone conversations, hand calculations and computer calculationswhich support the development of the SRM should be stored. This, if carried out assuggested, ensures that the assumptions made are traceable.
• The event tree models for each hazardous event have generally been developed in aconsistent way, which also helps the audit process.
• During the development of particular hazardous event models, unique filenames havebeen used to identify the FaultTree+ files for these events. This has given good traceabilityto the initial development of the SRM.
The quality plan also details the organisation of staff involved in the project and theirresponsibilities and briefly the level of checking required for the SRM. Although the staffresponsibilities are clear, the degree of verification and peer review for the model is not. RSstated that each fault and event tree model within the SRM was checked either by anothermember of the RS risk team who was not directly involved in the development of the specificmodel or by external consultants (RS, 2001c). Two of the fault and event tree models,derailment and fire models, have been checked in detail by external consultants. However,RS’s response (RS, 2001g) was that “the SRM concept was reviewed independently by theHead of Standards Justification within RS”. Railtrack have also independently reviewed theSRM (Railtrack, 2001d) prior to incorporating the results in their draft railway safety case(Railtrack, 2001a). However, prior to this review there does not appear to have been anyoverall independent review (independent of Railtrack and Railway Safety).
The overall control exercised during the development of the SRM appears good. Thedocumentation supporting the SRM is excellent, in stating where the requirements of theSRM came from, what the initial boundaries of the SRM were, how the identification of thehazardous events was made and how the model was developed. These matters are clearly andcompetently presented.
2.3. Review of high consequence events
In general, no major issues were found with either of the high consequence hazardous eventmodels examined in detail - ‘collision between passenger trains’ and ‘derailment of apassenger train’. Despite their size, the models were surprisingly easy to navigate and reviewbecause they have been excellently structured. However, many detailed, but relatively minor,issues were raised following this review. These are discussed at length in the interim report(Turner and Keeley, 2001).
HEALTH AND SAFETY LABORATORYAn agency of the Health and Safety Executive
20

2.4. Review of low consequence events
No major issues were found with either of the low consequence hazardous event modelsexamined in detail - ‘passenger falls or is injured whilst boarding or alighting the train’; and‘worker slips, trips and falls’. The minor issues uncovered are discussed below.
� The majority of the non-movement and movement accident events are modelled in thesame way. They are extremely simple fault tree and event tree models which effectivelypresent average historical accident data in a way that can be compared with the risksgenerated from the train accident models. The fault trees are simple OR combinations ofdifferent ways in which the hazardous event can be caused; for example, a passengerslipping or falling while boarding either a moving or stationary train are two such eventsin the fault tree for the ‘passenger falls or is injured whilst boarding or alighting the train’hazardous event - HEM-9. The event trees are even simpler in that there are no mitigationor escalation factors considered. They merely present the frequency of the hazardous eventleading to injury, and a consequence. This is a complicated way of using the data but isdone to give consistency and compatibility with the rest of the SRM.
� The basic events in the fault trees are generally based on a significant amount of data,being frequent events; in fact for the two events considered 5 years of incident data havebeen used. This appears to be an acceptable period of time to consider, and therefore getreasonable estimates of the occurrence frequency. However, the problem with this sort ofevent is that there is likely to be huge under-reporting, especially in incidents leading tominor injury. It is of concern that this eventuality does not appear to have been consideredby RS. It is acknowledged, however, that the significance of this is probably small. RShave indicated (RS, 2001g) that they are currently undertaking a detailed analysis of the16000 minor injury related events that occurred over the period April 2000 to March 2001.RS anticipate that the risk profile for the movement and non-movement hazardous eventswill change significantly as a result of this analysis.
� Averages are taken over the whole of the RCI and over all groups of people at risk,therefore any local differences or differences between individual groups, for exampleelderly passengers, cannot be resolved from the SRM. This is a limitation of the SRM andis acknowledged by RS.
Overall the quality of the low consequence event models is entirely dictated by the quality ofincident recording systems. Despite this, the way in which the risk from all hazardous eventswithin the SRM can be compared is extremely useful.
2.5. Sensitivity
The role of uncertainty in the documentation seems to have been glossed over and end resultsjust stated. Sensitivity analyses are referred to, but there is little evidence that they have beencarried out. RS stated that they have made some consideration of uncertainty during thedevelopment of the SRM (RS, 2001c). They consider that judgements were made that erred onthe pessimistic side. In addition, RS are currently working on projects relating to defining theuncertainty within the SRM. Once completed this may reduce the concern in this area.
HEALTH AND SAFETY LABORATORYAn agency of the Health and Safety Executive
21

2.6. Summary of review
The SRM has generally been found to be a good quality system-wide QRA that includesmodels to a level of detail commensurate with the level of input data available. It is a ‘highlevel’ QRA in so far as it does not address the details of each line of route and does not modelin detail systems, such as train braking systems. However, there is a significant amount ofdetail included in parts of the SRM, particularly the train accident models. Some shortcomingshave been found with the SRM, the majority being of a relatively minor nature, and arediscussed in detail above. It is unrealistic to expect the first attempt at such a model to beperfect or complete. The important point is that once one exists, it can be refined and addedto. We have been given verbal assurances, through discussion with RS, that the SRM will berefined and extended. However, there is still a concern that it may be treated as perfect andcomplete by others and that the calculated risks are presented in such a way as to give theimpression that there is no uncertainty in the final result.
Most areas of concern relate to use of the SRM by Freight or Passenger Train OperatingCompanies. This is discussed in detail in Sections 4 and 5.
3. BENCHMARKING
3.1. Approach to benchmarking
One of the objectives of this piece of work was to benchmark the SRM with similar modelsdeveloped by other rail industries, for example London Underground Ltd. (LUL). This sectiondescribes the process by which criteria were developed and the SRM and LUL’s QRAbenchmarked.
Initially, a literature review was carried out to identify potential techniques for benchmarkingQRAs. A number of publications on benchmarking in the field of safety were identified butalmost exclusively these dealt with levels of safety rather than risk assessment. During the1980s, a series of inter-comparison exercises on QRA were carried out between riskassessment teams across Europe. However, whilst this is a good method of studyinguncertainty and lack of consensus in QRA, it does not examine the qualities of a given QRA.It is also very resource intensive and is not applicable to new risk assessments. Therefore itwas decided to draw up a scheme, from first principles, against which the qualities of anyQRA could be assessed.
Such an evaluation scheme should be relatively straightforward to apply and, because of thebreadth of potential application, generally applicable. Therefore, a list of criteria felt to berelevant to all QRAs was drawn up in a brainstorming session (at HSL), with each criterioneffectively subdivided into ‘characteristics’, in order to define the criterion and thus improvethe reproducibility of assessment. The characteristics were divided into ‘good’, ‘average’ and‘poor’; hence a QRA exhibiting all ‘good’ characteristics would be considered good withrespect to this criterion. An effort was made to keep both the list of criteria and theirassociated characteristics limited in number, to prevent the evaluation scheme from becomingunworkable, whilst covering all the characteristics of QRA felt to be important. After theinitial brainstorming session, the criteria and characteristics were compared against therelevant areas of guidance for use in assessing safety cases submitted under the COMAH
HEALTH AND SAFETY LABORATORYAn agency of the Health and Safety Executive
22
regulations and then further reviewed internally within HSL and externally by HMRI to ensurethe relevance and comprehensiveness of the scheme. The list of criteria and their respectivecharacteristics are given in Appendix B.
The benchmarking involved assessing a QRA against eight criteria:
1. concept/scope;
2. ownership/resourcing;
3. quality assurance;
4. hazard identification;
5. structure of the model;
6. quantification of the model;
7. analysis; and
8. results.
For each of these criterion a score between 0-10 was assigned; a score between 0 and 3implying a poor rating against the particular criterion; a score between 4 and 7, an averagerating; and a score between 8 and 10, a good rating.
Each criterion has listed sets of characteristics that represent what is expected for good,average and poor ratings. These characteristics are used to help determine the score against theparticular criterion. The QRA is assessed against each individual characteristic for a givencriterion to determine where, qualitatively, it lies, for example a low good or a high average.
Once all the characteristics for a particular criterion have been rated, an overall score for thatcriterion is assigned, based on the spread of ratings of the individual characteristics.
It is not intended that the scores for each criterion should be combined in any way as theirimportance will vary and therefore the use of subjective weightings is avoided. It is alsostressed that the use of the score is just a means of comparing two different QRAs. It is thequalitative aspects of the benchmarking which are most important.
3.2. Benchmarking the SRM with LUL’s QRA
The SRM and LUL’s QRA were benchmarked against each characteristic (given in the tablescontained within Appendix B) according to the system outlined in the previous section. TheSRM benchmarking was carried out as a group task and was based on the findings of HSL’searlier review of the SRM (Turner and Keeley, 2001) and any new documentation orinformation received from Railway Safety and Railtrack. It should be noted that the LULQRA had to be benchmarked following only one days discussion with LUL; a brief review ofsome of the LUL QRA supporting documentation; and knowledge gained from a previous
HEALTH AND SAFETY LABORATORYAn agency of the Health and Safety Executive
23

review of LUL’s risk assessment systems (Turner and Gadd, 2001). Ideally a detailed reviewof LUL’s QRA should have been carried out, as was the case with the SRM and discussed inSection 2. Therefore, although the benchmarking of LUL’s QRA was not ideal, it is certainlyindicative.
It should also be noted that the two models are not identical in scope and depth. The SRM hasa wider coverage than the LUL QRA in terms of high level hazardous events, whereas theLUL QRA models high consequence events in much more detail with different models foreach line. The LUL QRA also has more detail on accident precursors and the likelihood ofdetection than the SRM, thus enabling the assessment of risk reducing measures to beevaluated more readily. Throughout the benchmarking it has been attempted to assess themodels with respect to their given scope, such that the differences in scope should not affectthe scoring assigned.
The results of the benchmarking exercises are summarised in Appendix C. The followingsections discuss both model’s strengths and weaknesses with respect to each criterion. Thecharacteristic numbers in the following tables refer to those given in the tables in Appendix Band the qualities ‘A’, ‘B’ and ‘C’ correspond to ‘good’, ‘average’ and ‘poor’ respectively. Forexample, in Table 1 both the SRM and the LUL QRA have a quality of ‘A’ assigned tocharacteristic 1.1. This, therefore, reflects that both QRAs were best described bycharacteristic 1A.1 in Appendix B and not characteristics 1B.1 or 1C.1.
3.2.1. Criterion 1 - Concept / Scope
TABLE 1: Summary of benchmarking for criterion 1
67Overall ScoreAA1.7BB1.6BB1.5CB1.4BB1.3BA1.2AA1.1
QualityQualityCharacteristic
LUL QRASRMCriterion 1:Concept/Scope
SRM: The supporting documentation for the SRM clearly states the scope of the assessmentand what it aims to achieve. In addition, the physical boundaries of the SRM aredefined and justified. Supporting documentation for the model contains a thoroughdescription of all of the techniques used. The model uses a fault tree/ event treeapproach which is an appropriate technique to use given the complexity of highconsequence / low frequency type events. Although the approach may beovercomplicated for low consequence / high frequency type events it is acceptable forintegration with high consequence / low frequency events. The significant limitationsof the SRM are identified, that is it is a global average model. It is not entirely clear
HEALTH AND SAFETY LABORATORYAn agency of the Health and Safety Executive
24
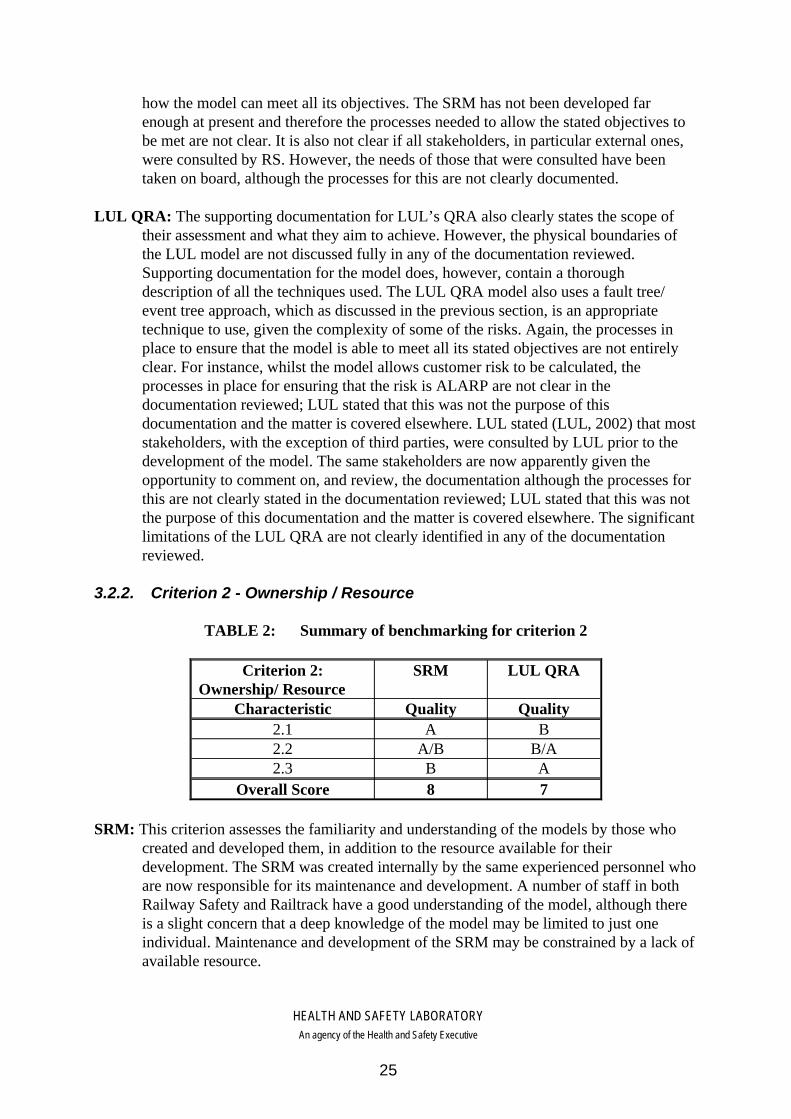
how the model can meet all its objectives. The SRM has not been developed farenough at present and therefore the processes needed to allow the stated objectives tobe met are not clear. It is also not clear if all stakeholders, in particular external ones,were consulted by RS. However, the needs of those that were consulted have beentaken on board, although the processes for this are not clearly documented.
LUL QRA: The supporting documentation for LUL’s QRA also clearly states the scope oftheir assessment and what they aim to achieve. However, the physical boundaries ofthe LUL model are not discussed fully in any of the documentation reviewed.Supporting documentation for the model does, however, contain a thoroughdescription of all the techniques used. The LUL QRA model also uses a fault tree/event tree approach, which as discussed in the previous section, is an appropriatetechnique to use, given the complexity of some of the risks. Again, the processes inplace to ensure that the model is able to meet all its stated objectives are not entirelyclear. For instance, whilst the model allows customer risk to be calculated, theprocesses in place for ensuring that the risk is ALARP are not clear in thedocumentation reviewed; LUL stated that this was not the purpose of thisdocumentation and the matter is covered elsewhere. LUL stated (LUL, 2002) that moststakeholders, with the exception of third parties, were consulted by LUL prior to thedevelopment of the model. The same stakeholders are now apparently given theopportunity to comment on, and review, the documentation although the processes forthis are not clearly stated in the documentation reviewed; LUL stated that this was notthe purpose of this documentation and the matter is covered elsewhere. The significantlimitations of the LUL QRA are not clearly identified in any of the documentationreviewed.
3.2.2. Criterion 2 - Ownership / Resource
TABLE 2: Summary of benchmarking for criterion 2
78Overall ScoreAB2.3
B/AA/B2.2BA2.1
QualityQualityCharacteristic
LUL QRASRMCriterion 2:Ownership/ Resource
SRM: This criterion assesses the familiarity and understanding of the models by those whocreated and developed them, in addition to the resource available for theirdevelopment. The SRM was created internally by the same experienced personnel whoare now responsible for its maintenance and development. A number of staff in bothRailway Safety and Railtrack have a good understanding of the model, although thereis a slight concern that a deep knowledge of the model may be limited to just oneindividual. Maintenance and development of the SRM may be constrained by a lack ofavailable resource.
HEALTH AND SAFETY LABORATORYAn agency of the Health and Safety Executive
25

LUL QRA: The LUL QRA was created by consultants and we were informed that initiallyLUL failed to buy into the model. This is no longer the case and it is now mostlydeveloped internally by LUL (with consultant support as deemed necessary). Anumber of staff in LUL have a good understanding of the model although, again, thereis a slight concern that there is only one expert with a deep understanding of it. LULhave an assigned budget to buy in any necessary consultancy resource for thedevelopment of their model.
3.2.3. Criterion 3 - Quality Assurance
TABLE 3: Summary of benchmarking for criterion 3
6.58Overall ScoreBA3.8BA3.7BB3.6BA3.5BA3.4BB3.3BA3.2BB3.1
QualityQualityCharacteristic
LUL QRASRMCriterion 3:Quality assurance
SRM: The supporting documentation for the SRM is very good with regular updates,although the database documenting values and assumptions used is in need of review.The model has been reviewed, at least to some degree, externally although this was nottruly independent, and has also been through some independent internal reviewprocess. However, neither review process is particularly clear. In addition, the modelhas been checked for errors, although again the process for this does not appear to bedocumented. Railway Safety have a good QA plan. Some of the data used in the SRMis up to 3 years old; Railway Safety are currently in the process of reviewing it. Indeed,RS have a procedure for the update of the SRM (TP 624/01). The SRM is supportedby an excellent Access database, which ensures that the data and assumptions used aretraceable. However, this database is not fully complete (at 10/01). All file names forthe SRM reflect the version number, thus helping to ensure that the latest versions areused at all times.
LUL QRA: The QA supporting the LUL QRA is not particularly detailed or comprehensive.Although their summary document, LUL QRA 2001 (LUL, 2001a), is updated at leastyearly, the rest of the supporting documentation, although available, is notcomprehensively assembled. The model has been reviewed externally and has alsobeen through an independent internal review. However, the review processes are notparticularly clear in the documentation reviewed. LUL stated (LUL, 2002) that “thereis supporting documentation for the review of the LUL QRA as documented in theLUL Safety Case”, and went on to say that “the progress of this update is also
HEALTH AND SAFETY LABORATORYAn agency of the Health and Safety Executive
26

monitored via the London Underground Safety Action Tracking Database”. The modelwas checked for errors during the internal review, although again the process does notappear to be clearly documented. LUL have no QA plan as such, although a high leveldescription of their procedures is given in Safety Control Standard 8 (SCS8) (LUL,1999). A review process for the LUL QRA is documented in Section 7 of the LULRailway Safety Case (LUL, 2001b), in which a safety improvement plan is mentioned.LUL have a paper system in place for documenting their data and assumptions,although they are in the process of creating an electronic Access database. LUL’s filesare distributed by a controlled source, although there have been incidents ofconsultants using the wrong version of FaultTree+ files while developing the model.However, LUL, in response, have stated (LUL, 2002) that “this was due to theconsultants assuming they had the correct version from previous work undertaken onbehalf of LUL without checking with LUL before commencing this particular piece ofwork”.
3.2.4. Criterion 4 - Hazard Identification
TABLE 4: Summary of benchmarking for criterion 4
67Overall ScoreBB4.6BA4.5AA4.4BB4.3BB4.2BB4.1
QualityQualityCharacteristic
LUL QRASRMCriterion 4:Hazard Identification
SRM: This criterion considers the process for the identification of the hazardous events, theprecursors, and the mitigation and escalation factors used in the QRA models. Thehazard identification process used in the creation of the SRM employed abrainstorming approach, although it is not clear who was involved in the process.Railway Safety consulted some of those affected by the hazards, for example workers,but some other relevant groups, such as vulnerable people, were not approached. It isconsidered that there are no significant gaps in the SRM within its stated scope.Railway Safety’s approach to hazard identification when creating the SRM is welldocumented. The model considers human factors and abnormal operations, but doesnot cover abnormal and degraded operations comprehensively and both need furtherdevelopment.
LUL QRA: LUL describe the hazard identification techniques in detail, in their standardSCS8. It appears that they used a HAZOP approach but no documentation of theprocess or the personnel involved could be found in the documentation reviewed;however, LUL have stated in response (LUL, 2002) that “these are contained in anumber of separate files to the summary document”. LUL also consulted some of
HEALTH AND SAFETY LABORATORYAn agency of the Health and Safety Executive
27

those affected by the hazards, for example workers, but some of the other groups, suchas vulnerable people, were not approached. It appears that there are no significant gapsin the LUL QRA. The LUL Railway Safety Case describes how their QRA hasdeveloped over the last 10 years, but the initial process for hazard identification wasnot described in the documentation reviewed. LUL have stated in response (LUL,2002) that this “is documented in a report entitled J2419 - Fault Tree development andconsequence analysis for London Underground”. The model considers human factorsand abnormal operations, but does not cover abnormal and degraded operationscomprehensively and both need further development.
3.2.5. Criterion 5 - Structure of the model
TABLE 5: Summary of benchmarking for criterion 5
67.5Overall ScoreBB5.7BA5.6AA5.5BB5.4BB5.3BB5.2BA5.1
QualityQualityCharacteristic
LUL QRASRMCriterion 5:Model Structure
SRM: The models contained within the SRM are well structured and, for the most part,logically correct. However, the SRM is not detailed enough to allow all of its statedobjectives to be met. The labelling of the logic gates is clear, although not all the eventtree sequences are uniquely labelled. The modelling assumptions for the SRM arestated although not fully justified. The model is designed to a level commensurate withthe available data. A good process, which is well documented, ensures that thereshould be no significant gaps in the scenarios considered in the SRM. The model isflexible; however, substantial effort would be needed to include local differences.
LUL QRA: The models used in the LUL QRA are generally acceptable, although they havebeen found to contain a number of minor mistakes in the labelling and logic. The LULQRA has been developed to a level to identify main areas of customer risk. There aresome problems with inconsistent labelling and duplicate names. The modellingassumptions are not explicitly stated in SCS8, although this document states that theyare recorded elsewhere; indeed, it does not appear to be the purpose of SCS8 todescribe all modelling assumptions. The model has been designed to a levelcommensurate with its objectives and also taking account of the available data. LULdo a fault schedule stage after their hazard identification, which is then mapped ontothe fault and event trees. This should help ensure that no gaps exist, but the process isnot documented in the literature reviewed. The model is reasonably flexible and,
HEALTH AND SAFETY LABORATORYAn agency of the Health and Safety Executive
28
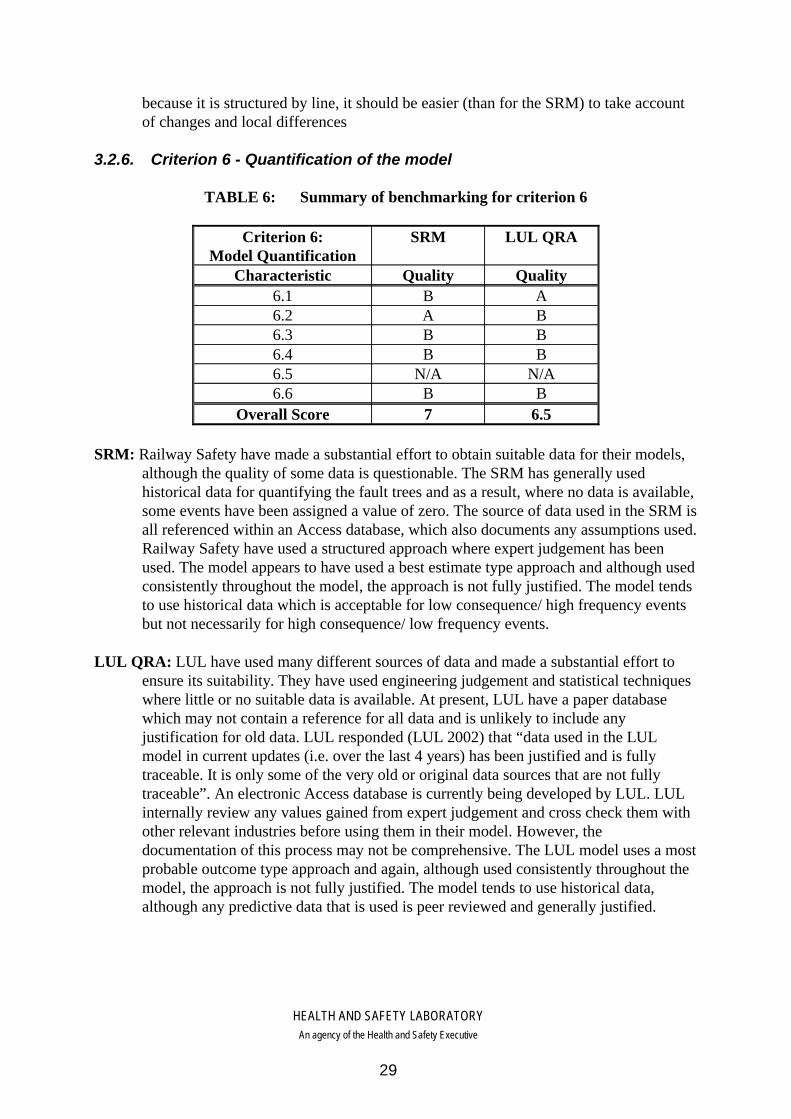
because it is structured by line, it should be easier (than for the SRM) to take accountof changes and local differences
3.2.6. Criterion 6 - Quantification of the model
TABLE 6: Summary of benchmarking for criterion 6
6.57Overall ScoreBB6.6
N/AN/A6.5BB6.4BB6.3BA6.2AB6.1
QualityQualityCharacteristic
LUL QRASRMCriterion 6:Model Quantification
SRM: Railway Safety have made a substantial effort to obtain suitable data for their models,although the quality of some data is questionable. The SRM has generally usedhistorical data for quantifying the fault trees and as a result, where no data is available,some events have been assigned a value of zero. The source of data used in the SRM isall referenced within an Access database, which also documents any assumptions used.Railway Safety have used a structured approach where expert judgement has beenused. The model appears to have used a best estimate type approach and although usedconsistently throughout the model, the approach is not fully justified. The model tendsto use historical data which is acceptable for low consequence/ high frequency eventsbut not necessarily for high consequence/ low frequency events.
LUL QRA: LUL have used many different sources of data and made a substantial effort toensure its suitability. They have used engineering judgement and statistical techniqueswhere little or no suitable data is available. At present, LUL have a paper databasewhich may not contain a reference for all data and is unlikely to include anyjustification for old data. LUL responded (LUL 2002) that “data used in the LULmodel in current updates (i.e. over the last 4 years) has been justified and is fullytraceable. It is only some of the very old or original data sources that are not fullytraceable”. An electronic Access database is currently being developed by LUL. LULinternally review any values gained from expert judgement and cross check them withother relevant industries before using them in their model. However, thedocumentation of this process may not be comprehensive. The LUL model uses a mostprobable outcome type approach and again, although used consistently throughout themodel, the approach is not fully justified. The model tends to use historical data,although any predictive data that is used is peer reviewed and generally justified.
HEALTH AND SAFETY LABORATORYAn agency of the Health and Safety Executive
29
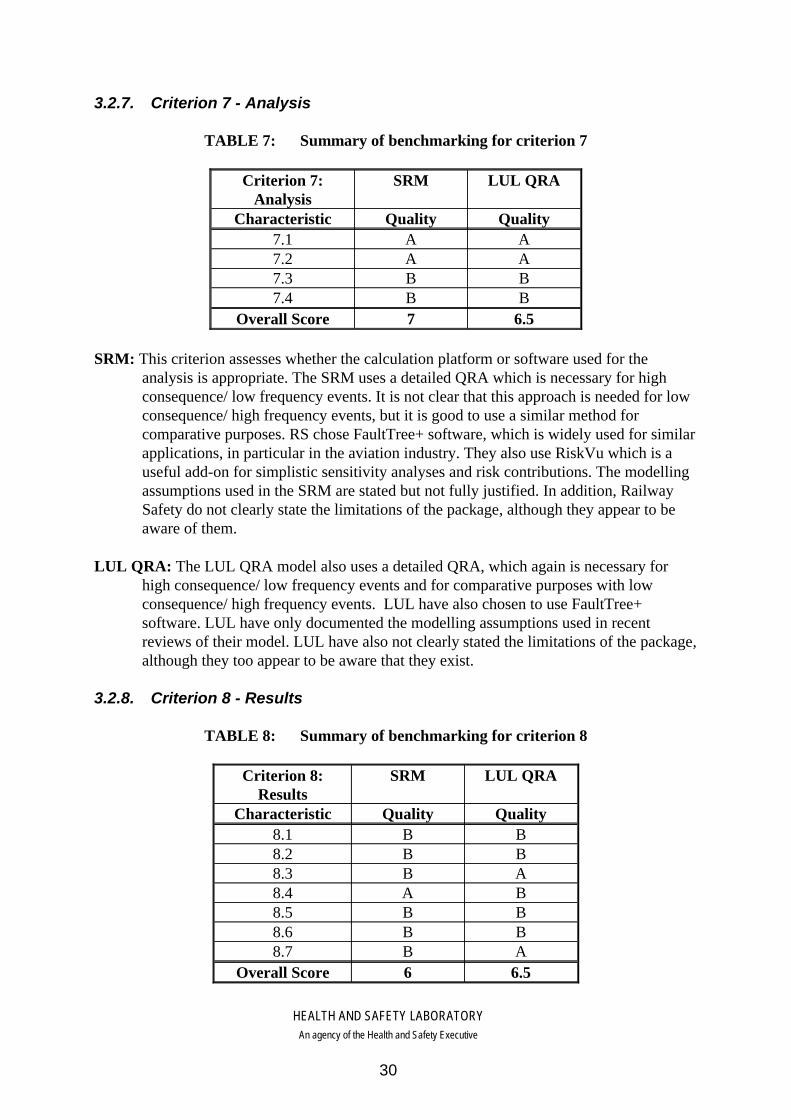
3.2.7. Criterion 7 - Analysis
TABLE 7: Summary of benchmarking for criterion 7
6.57Overall ScoreBB7.4BB7.3AA7.2AA7.1
QualityQualityCharacteristic
LUL QRASRMCriterion 7:Analysis
SRM: This criterion assesses whether the calculation platform or software used for theanalysis is appropriate. The SRM uses a detailed QRA which is necessary for highconsequence/ low frequency events. It is not clear that this approach is needed for lowconsequence/ high frequency events, but it is good to use a similar method forcomparative purposes. RS chose FaultTree+ software, which is widely used for similarapplications, in particular in the aviation industry. They also use RiskVu which is auseful add-on for simplistic sensitivity analyses and risk contributions. The modellingassumptions used in the SRM are stated but not fully justified. In addition, RailwaySafety do not clearly state the limitations of the package, although they appear to beaware of them.
LUL QRA: The LUL QRA model also uses a detailed QRA, which again is necessary forhigh consequence/ low frequency events and for comparative purposes with lowconsequence/ high frequency events. LUL have also chosen to use FaultTree+software. LUL have only documented the modelling assumptions used in recentreviews of their model. LUL have also not clearly stated the limitations of the package,although they too appear to be aware that they exist.
3.2.8. Criterion 8 - Results
TABLE 8: Summary of benchmarking for criterion 8
6.56Overall ScoreAB8.7BB8.6BB8.5BA8.4AB8.3BB8.2BB8.1
QualityQualityCharacteristic
LUL QRASRMCriterion 8:Results
HEALTH AND SAFETY LABORATORYAn agency of the Health and Safety Executive
30
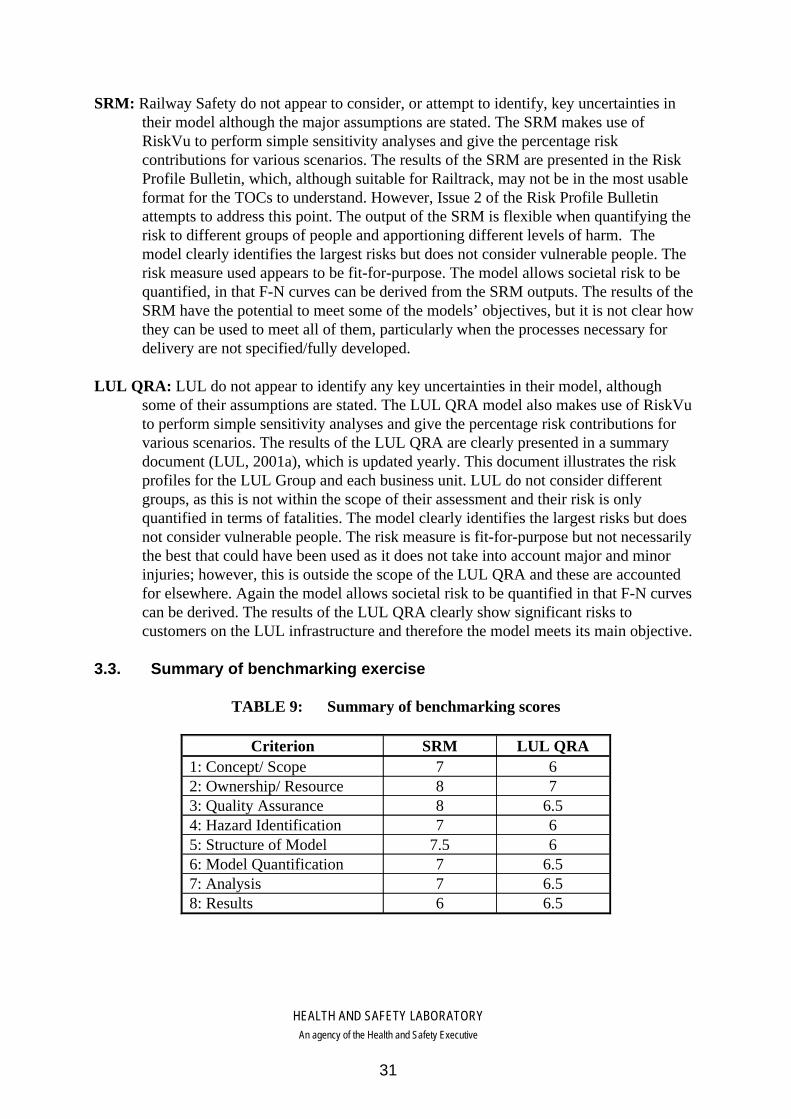
SRM: Railway Safety do not appear to consider, or attempt to identify, key uncertainties intheir model although the major assumptions are stated. The SRM makes use ofRiskVu to perform simple sensitivity analyses and give the percentage riskcontributions for various scenarios. The results of the SRM are presented in the RiskProfile Bulletin, which, although suitable for Railtrack, may not be in the most usableformat for the TOCs to understand. However, Issue 2 of the Risk Profile Bulletinattempts to address this point. The output of the SRM is flexible when quantifying therisk to different groups of people and apportioning different levels of harm. Themodel clearly identifies the largest risks but does not consider vulnerable people. Therisk measure used appears to be fit-for-purpose. The model allows societal risk to bequantified, in that F-N curves can be derived from the SRM outputs. The results of theSRM have the potential to meet some of the models’ objectives, but it is not clear howthey can be used to meet all of them, particularly when the processes necessary fordelivery are not specified/fully developed.
LUL QRA: LUL do not appear to identify any key uncertainties in their model, althoughsome of their assumptions are stated. The LUL QRA model also makes use of RiskVuto perform simple sensitivity analyses and give the percentage risk contributions forvarious scenarios. The results of the LUL QRA are clearly presented in a summarydocument (LUL, 2001a), which is updated yearly. This document illustrates the riskprofiles for the LUL Group and each business unit. LUL do not consider differentgroups, as this is not within the scope of their assessment and their risk is onlyquantified in terms of fatalities. The model clearly identifies the largest risks but doesnot consider vulnerable people. The risk measure is fit-for-purpose but not necessarilythe best that could have been used as it does not take into account major and minorinjuries; however, this is outside the scope of the LUL QRA and these are accountedfor elsewhere. Again the model allows societal risk to be quantified in that F-N curvescan be derived. The results of the LUL QRA clearly show significant risks tocustomers on the LUL infrastructure and therefore the model meets its main objective.
3.3. Summary of benchmarking exercise
TABLE 9: Summary of benchmarking scores
6.568: Results6.577: Analysis6.576: Model Quantification67.55: Structure of Model674: Hazard Identification
6.583: Quality Assurance782: Ownership/ Resource671: Concept/ Scope
LUL QRASRMCriterion
HEALTH AND SAFETY LABORATORYAn agency of the Health and Safety Executive
31

This section highlights the key strengths and weaknesses of the two QRAs benchmarked.Although there are a number of deficiencies of each QRA, generally both were found to be ofhigh quality and well-developed. A summary table showing the benchmarked scores for eachQRA is shown in Table 9. Some of the weaknesses associated with the SRM are due to itbeing relatively new and still developing, as opposed to the LUL QRA, which is over 10 yearsold and therefore a relatively mature QRA. Some of the weaknesses of the LUL QRA arebecause it is older, when control and development standards were not so stringent. However,there are areas where both QRAs could be improved, learning from each other’s areas of bestpractice.
The strengths of the SRM are:
� the model was created internally by suitably qualified and experienced personnel, and anumber of other staff have a good understanding of the model;
� the supporting documentation is very comprehensive and details the entire creationprocess;
� the model is supported by a very good database, which tabulates the values used, theirsources and any assumptions made;
� can be confident that there are no significant gaps in the hazardous events considered andthe modelled precursors within the SRM’s scope;
� the model is well-structured, clearly labelled and generally logically correct;
� a good choice of calculation method was made and appropriate software for theapplication was used; and
� the output from the model is flexible, in that the risk can be quantified in terms ofdifferent levels of harm and for different groups of people at risk.
The strengths of the LUL QRA are:
� LUL have created different models for each of their lines, thereby incorporating any linespecific features;
� can be reasonably confident that no major gaps exist in the coverage of the model withinits scope - the level of modelling is suitable given the supporting data;
� the model has more detail on accident cause precursors and the likelihood of detectionthan the SRM, thus enabling the assessment of risk reducing measures to be evaluatedmore readily;
� a good choice of calculation method was made and appropriate software for theapplication was used;
HEALTH AND SAFETY LABORATORYAn agency of the Health and Safety Executive
32
� the results are clearly presented in a usable format and are appropriate for the statedobjectives and scope of the QRA; and
� resources are made available for the development of the model in the yearly businessplanning rounds.
The weaknesses of the SRM are:
� it is not clear how the model will meet all its stated objectives, although it is realised thatthis may be because the model is relatively new and still developing;
� the data used is at least three years old and needs reviewing. In addition a significantnumber of events have not been assigned values;
� the model is very generic and makes no allowance for regional differences on theinfrastructure; and
� uncertainty seems to have been glossed over and no rigorous sensitivity analyses havebeen carried out.
The weaknesses of the LUL QRA are:
� the supporting documentation is not coherently managed;
� the model was initially developed by consultants and therefore some detailedunderstanding of the model has been lost due to the lack of supporting documentation;
� there is no detailed QA plan;
� the model only considers fatalities and not different levels of harm. However, these aretaken account of in LUL’s customer risk assessments; and
� uncertainty seems to have been glossed over and no rigorous sensitivity analyses havebeen carried out.
3.3.1. Further work
The benchmarking exercise has concentrated on treating the QRAs in isolation withoutconsidering their interaction with other risk assessment systems. There is therefore potential toexpand the benchmarking to consider:
� the links between the risk controls and the QRA;
� interfaces between the QRA and the risk management system; and
� how the QRA is used.
HEALTH AND SAFETY LABORATORYAn agency of the Health and Safety Executive
33

4. ROLL-OUT OF THE SRM TO THE RAILWAY GROUP
The SRM considers the railway system as a whole, rather than the details of a particular routeor operator. There is therefore concern that it could be used inappropriately by the trainoperating companies (TOCs), given their perceived limited level of competence and a modelas large and complex as the SRM.
This section discusses Railway Safety’s strategy for SRM roll-out, including that for theactual fault and event trees and, as importantly, the outputs.
Investigation of roll-out has been approached from two sides:
� communication with Railway Safety to determine their strategy for the process (Section4.1); and
� production of a questionnaire, which was forwarded to the TOCs, to determine theirperception of the roll-out process (Section 4.2).
4.1. Railway Safety’s roll-out strategy
The Risk Profile Bulletin (RS, 2001a; 2001d) states that “the means by which the model willbe made available outside Railway Safety and the levels of competency required to run themodel are being considered currently”. RS were asked to provide information on their currentstrategy (Turner, 2001b). In response (RS, 2001f), they stated:
“Our approach has been:
� to inform industry of the SRM through briefings, workshops anddemonstrations;
� to make available the key risk information outputs from the SRM throughpublication of the Risk Profile Bulletin;
� to make the data in the Risk Profile Bulletin available in Excelspreadsheet format on request;
� to provide support and advice on risk questions arising;
� to provide advice on how the system-wide risk information from the SRMcan be used effectively to support a risk assessment which underpins aduty-holder’s railway safety case; and
� to provide the SRM’s fault-event tree models and databases where theseadd value and are formally requested.”
At first sight this statement appears acceptable. There is a need, however, to examine thevarious processes for undertaking each step. These are discussed later in this report. Aparticular concern involves the possible wide distribution of fault and event trees, which thefinal bullet point suggests. This is because the SRM consists of over 100 complex fault and
HEALTH AND SAFETY LABORATORYAn agency of the Health and Safety Executive
34
event trees requiring specialist software and expert analysis; many TOCs do not possess therequisite resources or competence.
Discussions with RS made it clear that currently, it was not their intention to issue theFaultTree+ files to the Railway Group, with the exception of Railtrack. RS believed thatRailtrack had sufficient staff at their headquarters who were suitably qualified andexperienced. Also the SRM applied directly to them, as it stands, without requiringmodification. Railtrack gave us assurances that they had staff with the necessary competence.As regards the remainder of the Railway Group, it is the opinion of RS that they could providepaper copies if specifically requested, but only when they added value. In addition, RS statedthat it was not the intention to supply the SRM in the RiskVu format either. RS appear tounderstand the general limitations in the resource and competency standards throughout theRailway Group; that is, being able to use the SRM appropriately. RS also understand theinherent dangers in distributing the SRM files throughout the Railway Group. The mainvehicles for roll-out are the Risk Profile Bulletin and a RS guidance note; these are bothdiscussed in Section 4.3.
In summary, the overall approach taken by RS, to widely distribute the outputs from the SRMbut not the actual fault and event trees, would appear to be acceptable.
4.2. TOC’s perception of the roll-out strategy
This section discusses how the TOCs perceive the roll-out process and how they are organisedand prepared, particularly as regards competency, to use the SRM. A questionnaire was usedto gather a snapshot of the Railway Group position. This section is split as:
� Section 4.2.1, which describes the questionnaire; and
� Section 4.2.2, which summarises the findings from the questionnaire.
4.2.1. Background to the questionnaire
To determine how RS’s roll-out strategy was viewed by TOCs, a questionnaire wasdeveloped. The questionnaire was designed to garner answers to the following:
� understanding of the SRM;
� anticipated use of the SRM;
� competence standards perceived necessary to use the SRM
� information received;
� access to the SRM; and
� support on the SRM.
The questionnaire (see Appendix E) and accompanying letter (see Appendix D) wasforwarded to 29 TOCs. Of these, 12 replies were received. Summaries of the comments
HEALTH AND SAFETY LABORATORYAn agency of the Health and Safety Executive
35
received are given below, with the results being anonymised. It should be noted that thecompanies who replied represented a range of operational experience and size.
4.2.2. Summary of TOC’s response to questionnaire
The responses to all questions are summarised below.
Purpose of the SRM - question 1
Eleven of the companies appeared to have a clear understanding of the model’s purpose. Theone company that did not answer this section stated that they would not be using the SRM.The consensus response was that the purpose of the model was to evaluate the risk to theoverall railway infrastructure and also link control measures to risks. This corresponds to whatis stated in the Risk Profile Bulletin.
Expected use of the SRM by the TOCs - question 2
Two of the companies did not anticipate using the SRM. From the other ten replies, it appearsthat the SRM is being used in a similar way. The TOCs have stated that the output from theSRM is only being used as support to their own risk assessment, and not as a replacement.Comments included:
“Relate control measures to the risk, and to provide assurance that they are adequate.”
“Review significant risks in the safety case to ensure they are being controlled.”
Due to the system-wide nature of the SRM, it would be inappropriate for the TOCs to beusing the SRM as their own risk assessment, as it would not reflect the location specific risksfor their company. However, it would be appropriate to use the SRM as an aid to the riskassessment process as a whole. This appears to be the approach being adopted.
The Risk Profile Bulletin - question 3
All of the companies who replied indicated that they had received a copy of the Risk ProfileBulletin. Five mentioned that the information is in a format that can be easily used, althoughone of these went on to state that they would prefer the risks to be broken down into those forTOCs, Railtrack and the zones.
Of the remaining seven companies: one did not indicate any improvements they would like tosee; three would prefer if the risks could be made more location specific instead of being forthe whole railway infrastructure; two indicated that they would prefer the outputs to besimplified and summarised and the remaining TOC thought that further health warningsshould be present with the information, and was unsure whether the information was new.
It is noted that since this questionnaire was circulated, a second issue of the Risk ProfileBulletin has been published by RS and circulated to the Railway Group. Therefore, some ofthe comments may now be inappropriate. The Risk Profile Bulletin is discussed in greaterdetail in Section 4.3.1 of this report.
HEALTH AND SAFETY LABORATORYAn agency of the Health and Safety Executive
36
Any further information received about the SRM - question 4
Nine of the companies indicated that they have not received any formal information on theSRM except via the Risk Profile Bulletin. Of the remaining three, one had received additionalinformation about a year ago, although they did not specify what it was; another said they hadreceived briefing notes; and the last stated to have received letters and a one-to-one briefing.Therefore, the Risk Profile Bulletin would appear to be the main way information about theSRM is received.
Formal familiarisation in the use of the SRM - questions 5 and 6
Eight of the companies that replied indicated that they had not attended any formalfamiliarisation sessions, although one of these had indicated that they have had informalmeetings about the SRM with RS. Five of these companies indicated that the reason that theydid not go to any of the formal familiarisation sessions, such as briefings, was because theyeither did not know they existed, or the dates were inconvenient.
Of the four that indicated they had received familiarisation training, one had attended theworkshops, another had attended workshops and seminars, another had attended seminars andhad self teach notes/reports, and the last had attended seminars, received letters, hadone-to-one meetings and presentations.
Use of the SRM - questions 7 and 8
These answers relate closely to those given for Question 2. As with Question 2, two of theTOCs indicated that they would be unlikely to use the information from the SRM. Two of theremaining companies have currently not used the information from the model but indicatedthat they would in future.
It appears those companies who have used, or will be using, the SRM output, check it againsttheir own risk assessments, or will be taking small amounts of non-site specific data from it.The main reason for the use of the SRM as a ‘check tool’, is due to it considering system-wideconditions, and not local conditions such as long tunnels or a large number of level crossings.Where indicated, only the senior safety person is expected to use the information from theSRM. How the SRM is being used is discussed in greater detail in Section 5.
Access to the SRM - question 9
One of the TOCs had requested access to the SRM fault and event trees and access was turneddown due to specific software requirements. Another company had been granted access,although have currently not been able to further develop it; however, this company hadindicated that they have knowledge of fault tree and event tree analysis. A further TOC hadexplored requesting access, but decided against it on the grounds that the customisationrequired for their operations would be large and this would not have been cost effective. Theremaining eight TOCs have not requested access to the SRM fault and event trees.
HEALTH AND SAFETY LABORATORYAn agency of the Health and Safety Executive
37
Expertise in Fault Tree and Event Tree analysis - question 10
Only two companies indicated that they had specific knowledge in fault tree and event treeanalysis. One of these was a company that was not expecting to be using the output from theSRM. Four of the other companies mentioned other, general risk assessment expertise, thoughnot specifically fault tree and event tree analysis.
It should be noted that the question specifically asked about fault tree and event treeexpertise/training in the TOCs. Those companies that indicated ‘no’ to this question, andincluded no other comment, would still be assumed to have a degree of expertise in general,more qualitative, risk assessments.
Support by Railway Safety - question 11
Apart from three companies, no further support (except that previously mentioned forQuestion 5) on the SRM was mentioned. Of these three, one indicated that they had beenoffered support but had not required it, another TOC had informal meetings with RS, and thelast indicated that they had all their questions answered.
From discussions with RS it is clear that they would provide support and advice to companiesas required, on how to use results from the SRM, particularly as regards risk assessments inrailway safety cases. However, the onus is on the TOCs to request this support.
4.3. Dissemination of knowledge of the SRM to the Railway Group
The method of informing the Railway Group of the SRM, including its limitations and itsresults, such as risk profiles for the RCI, is by the Risk Profile Bulletin publication. Thispublication is discussed at length in Section 4.3.1. It is recognised by RS that the railwayindustry requires assistance to apply the results from the SRM, as presented in the Risk ProfileBulletin. This is to avoid many of the potential pitfalls of applying a system-widerepresentation of the risk to a particular route or for a particular operator. RS have recentlyproduced guidance for this, which is discussed in Section 4.3.2.
4.3.1. Risk Profile Bulletin
The Risk Profile Bulletin has been produced to inform the Railway Group and wider railwayindustry of current views of the risk profile and the dominant contributors to risk on the RCI.The Bulletin’s purpose is to provide information for use in risk assessments and forsupporting judgements about the risk relating to a company’s operations and how thiscompares with and contributes to the system-wide risk. There are a number of concerns assummarised below.
• The data in Issue 1 (RS, 2001a) was not presented in a way that most of the RailwayGroup would find useful. The presentation of data in the Risk Profile Bulletin has beenimproved in Issue 2 (RS, 2001d). However, it is still likely to be difficult for a TOC touse.
• The total risk is presented in relation to train accidents, movement accidents,non-movement accidents and trespass. However, these are not broken down further into
HEALTH AND SAFETY LABORATORYAn agency of the Health and Safety Executive
38

the risk to the different exposed groups, that is passengers, workers and members of thepublic. The data is available to make the necessary calculations.
• Although the main assumptions are presented, it would be difficult for a TOC, forexample, to make the SRM output more applicable to them.
• Local factors are not incorporated. It is therefore difficult to see how local decisions canbe made based on such global average representations of risk.
• The breakdown of precursors in terms of risk contribution is good as far as it goes, but theprocess only considers hazardous events in isolation. There is no attempt to take accountof where particular precursors can lead to more than one hazardous event. Therefore, howthe risk contributions are presented is potentially misleading.
The Risk Profile Bulletin does have many strengths as summarised below:
� SRM intended objectives, scope and boundaries are clearly presented;
� it clearly states that specific details relevant to a particular operator are not modelled in theSRM and also acknowledges that the results should only be used as an input into, and notas a substitute to, decision making - a good health warning;
� the system-wide risk profiles are clearly presented;
� consequences and frequency are clearly presented for each hazardous event. These includethe frequency, the risk in terms of equivalent fatalities per year, and the predicted averagefatalities, major injuries and minor injuries per event for passengers, workers andmembers of the public; and
� the background to the SRM, the modelling approach and key assumptions aresummarised. Although these do not go into detail, what is presented should be sufficient towarn the Railway Group that the SRM needs to be used with extreme care. However, thereis no clear guidance on how to use the results from the SRM.
Issue 2 of the Risk Profile Bulletin has improved the presentation of the data, particularly asregards the risk contribution from the many precursors. In issue 1, the risk contribution fromevery precursor was simply listed under each hazardous event. This constituted a massiveamount of confusing detail. It also did not reflect the fact that some precursors may lead todifferent hazardous events. Precursors are now categorised into eight common groupings:vandalism, track faults affecting different categories of trains, rolling stock faults affectingdifferent categories of trains, structural failures, train SPADs, driver error, crossings andstations. For each of these groups the risk contribution has been calculated. In addition, theseare broken into a number of sub-groups whose risk contributions have also been calculated.This is a major improvement.
In addition, more detail on the key assumptions for each hazardous event fault and event treemodel has been provided.
HEALTH AND SAFETY LABORATORYAn agency of the Health and Safety Executive
39

The Risk Profile Bulletin is generally found to be a useful way of informing the RailwayGroup of the SRM and more importantly the risks from the RCI. However, even with thewarnings presented, there is concern that the results could be used inappropriately.
4.3.2. Guidance on use of the SRM
A guidance note (RS, 2001b) has recently been prepared by RS on the preparation of riskassessments within railway safety cases. Appendix A of this document describes a ‘safety caserisk assessment method based on the use of the outputs from the SRM’. This has been writtenwith the aim of aiding TOCs to use the SRM appropriately, in an attempt to mitigate potential problems. A review of these aspects of the guidance has therefore been carried out and thefindings are summarised below.
� The introduction to the process clearly stresses where and how use of the results of theSRM is appropriate, and where it is not. For example, it clearly stresses that the results ofthe SRM should form the initial basis for risk assessment, if the operation is similar tothose considered in the Risk Profile Bulletin and the SRM. It stresses that it is notappropriate to reproduce information from the SRM without taking into account thespecific factors applicable to the operation being considered. Finally, it also states areasnot considered by the SRM. This gives sufficient warning that careful considerationshould be made of how the SRM should be applied.
� The guidance presents a clear and structured approach in using the results of the SRMappropriately for TOCs.
� A workshop approach is suggested, with examples of the range of experience in themembers that should attend. This is good practical advice that should facilitate appropriateoutcomes.
� The approach using spreadsheet templates is good in that it should be relatively simple forthe methodology to be used. However, it is a concern that the risk assessment process maybe treated like a ‘black box’.
� Guidance is given on how a TOC can adjust the system-wide SRM assumptions into thoserelating to their operations. This is in terms of both the precursor frequency and theconsequences. This gives a TOC clear guidance on how to make the SRM apply to them;however, the basis on which this guidance has been made is not made clear.
Overall, this guidance is very much needed. In its absence, the SRM may well have been usedinappropriately. However, to ensure that the Railway Group have sufficient understanding anddevelop required competence levels, specific formal training will be necessary. The trainingproposed by RS should be examined to ensure that it is at a suitable level and that all withinthe Railway Group are trained before they use the SRM in detail to support their safety cases.
4.3.3. Familiarisation training
RS have introduced the Railway Group to the SRM, predominantly through briefings andseminars. This has enabled Railway Group to be informed, at a high level, about the SRM and
HEALTH AND SAFETY LABORATORYAn agency of the Health and Safety Executive
40
its objectives. However, such processes have not been detailed enough to enable the RailwayGroup to utilise the SRM themselves. This was never the expectation of the familiarisationsessions.
It is a concern that not all parts of the Railway Group have received familiarisation training.From the questionnaire responses, 7 of 12 TOCs indicated that they had received no formalfamiliarisation on the SRM. It would appear that only those particularly interested in the SRMhave attended the seminars and briefings. It would be of particular concern if the TOCs whohave not attended any familiarisation session given by RS used the SRM in any way.
RS appear to have put significant effort into informing the Railway Group about the SRM.They have held various briefing sessions at various times and in numerous locations. Theyhave also been in direct discussions with various TOCs, at the TOC’s request. It wouldtherefore appear that RS are supporting the Railway Group in the use of the SRM in anappropriate way. More important, however, will be the training necessary to support theguidance produced as discussed in Section 4.3.2.
4.4. Summary
Overall, the SRM roll-out process appears to be acceptable thus far. The main points to noteare summarised below.
� RS are, quite rightly, currently being very cautious about how they pass the SRM to theRailway Group. This is mainly because they are aware of its limitations and have concernsabout the results being used inappropriately.
� The TOCs appear to have been well informed about the SRM, primarily through the RiskProfile Bulletin. This would appear to be an acceptable way of sharing the findings of theSRM with the Railway Group.
� The guidance drafted by RS on the preparation of risk assessments within railway safetycases will help to reduce concern about the SRM being used inappropriately. It shouldprove invaluable, if supported by suitable training, for ensuring adequate competencelevels in using the SRM.
� Disappointingly, some TOCs have not attended any of the briefing sessions held by RS.
5. RAILWAY GROUP’S USE OF THE SRM
To date (September 2001) the SRM has mainly been utilised in supporting the riskassessments in railway safety cases. Detailed descriptions of processes to use the SRM ormethodologies to adjust the data to reflect the local conditions are still developing. Therefore,there is only a limited amount of information available to be able to reflect on the RailwayGroup’s use of the SRM. Railtrack stated (Railtrack, 2001f) “the SRM is excellent inpresenting the overall landscape of risk, but does not have sufficient information about localissues or analytical detail in the precursors to be able to support ALARP arguments.Consequently, the SRM can only realistically be applied as a start point for assessment”. Asstressed in the interim report (Turner and Keeley, 2001), one of the greatest concerns about
HEALTH AND SAFETY LABORATORYAn agency of the Health and Safety Executive
41

the SRM is whether it is going to be utilised appropriately by the Railway Group. Current useand intended future use of the SRM, by both Railtrack and the TOCs, are discussedrespectively in Sections 5.1 and 5.2.
5.1. Utilisation within Railtrack
The SRM most accurately relates to the operations of Railtrack, as opposed to that of theTOCs, as it was primarily developed to represent the risks on its infrastructure. There istherefore only minimal concern in the SRM’s use within Railtrack, particularly as a tool forassessing system-wide risk. There is still concern as to how the SRM will be used to take localdifferences into consideration, however. Railtrack have stated that (Railtrack, 2001f) the SRMcannot be used to address local issues, as such analyses would require much more detailed andspecific assessment. This currently would be done outside the SRM, but making use of it todefine the average system-wide risk landscape. In the future, an evolution of the SRM may beused, which would consist of a number of models relevant to particular regions of thenetwork, such that particular types of signalling, rolling stock and types of electrification canbe specifically addressed (Railtrack, 2001f).
Railtrack’s overall strategy for the use of the SRM is discussed in Section 5.1.1, followed inSection 5.1.2 by a discussion of how it has been utilised in Railtrack’s safety case, recentlysubmitted to HMRI for assessment.
5.1.1. General use
Railtrack stated that they saw two main uses of the SRM:
� to provide information on the system-wide risk profile and use this to support the safetycase; and
� within the Safety Risk Framework (Railtrack, 2001b; 2001c), to aid safety related decisionmaking.
Railtrack saw the SRM as a representation of the historical risk and in indicating, at a highlevel, where the high risk areas are. They recognised that the SRM does not provide detailedroot cause analysis, nor reflect local differences in the infrastructure. Indeed, Railtrack appearto recognise the major limitations of the SRM. Railtrack thought a number of problems to benational rather than just local and, therefore, believed the SRM to be an invaluable tool. Theintent, as stated by Railtrack, in the use of the SRM, is to prioritise coarsely the areas ofsignificant risk and then do more detailed assessment outside of the SRM. Railtrack’sapproach to the use of the SRM, although still developing, appears acceptable.
Railtrack are the one member of the Railway Group who have access to the SRM fault andevent tree files. They recognise the potential problems in distributing the SRM widelythroughout their company, particularly to line management in the zones who would not havesuitable competencies. Railtrack gave verbal assurances that the SRM would only be used bya small team of staff (approximately four) in their headquarters who are competent in its use.In fact, one of these was originally involved in its development. This team would use themodel and advise others throughout Railtrack as necessary.
HEALTH AND SAFETY LABORATORYAn agency of the Health and Safety Executive
42

A small concern in Railtrack’s access to the SRM is in connection with version control andownership of the SRM. It is not clear how RS will manage access and ensure that paralleldevelopments of the SRM do not occur. Railtrack gave verbal assurances that as RS havecustody of the SRM, Railtrack will formally only use the official version, as supplied by RS.However, they indicated that they may also make experimental changes to the SRM; thiswould not then be used as a formal version and would not be recognised by RS. Nethertheless,Railtrack felt that they could use a modified version of the SRM to support a safetyjustification, if all changes made relative to the official version could be justified and suitablequality assurance procedures adhered to. In addition, Railtrack stated (Railtrack, 2001f) that“in the future, the needs of risk assessments by RS and Railtrack are likely to diverge, mainlybecause under the Railway Safety Case Regulations there is a requirement to reduce riskcompliant with the principle of ALARP”. This they felt “will necessitate the development oflocal or regional risk assessments that are in much more detail than the SRM, and RS in theiroverseeing role may have less interest in the more parochial issues”. However, Railtrackindicated that “there is no reason why any future updates required by Railtrack and RS shouldnot be coordinated such that there is a single model that can be used by both parties andcontrolled by RS”.
Railtrack stated that there were not any formal links between the SRM and other riskassessments, particularly local or task based risk assessments. The SRM, they believe, is usedto define the risk landscape and to give a baseline from which to start other assessments. Theapparent informal nature of the interfaces with other risk assessments and the safetymanagement system is a concern, but it is appreciated that the SRM’s use is very much in itsinfancy and still developing.
Railtrack’s major use of the SRM will be within the Safety Risk Framework (SRF), which isan element of an overarching strategy being developed to deliver an approach to managingsafety risks - the Safety Risk Strategy (Railtrack, 2001b; 2001c). This is currently beingdeveloped and the outline of the strategy is summarised in the development plan ofRailtrack’s Railway Safety Case (Railtrack, 2001a) and in their Safety and EnvironmentalPlan 2001/02 (Railtrack, 2001c). However, even though the detail is still being developed, theimportance of this makes it worthy of brief discussion, particularly in how the SRM isintended to be utilised.
The main elements of the framework are:
� to identify all of Railtrack’s safety risks associated with their assets and activities; and
� to provide key information about the risks, and action plans to eliminate or mitigate them.
It is intended to be a mechanism for ensuring that all safety risks are identified, assessed, andreduced so far as is reasonably practicable; and for ensuring that safety objectives are alsomet.
HEALTH AND SAFETY LABORATORYAn agency of the Health and Safety Executive
43
The SRM will be used to identify the hazards and provide the top level assessment of the levelof risk associated with each. For each of these risks, the framework will be a log ofinformation based on a number of key questions, for each of which the SRM will provide ahigh-level insight:
� What is the character and magnitude of the risk?
� Who has responsibility for managing this risk?
� Have we assessed this risk?
� Is our management of this risk in line with objectives?
� How good are the controls on this risk?
� How will this risk change over time?
� Do we have plans to reduce this risk?
� What more should we do to reduce this risk?
� How high a priority is the reduction of this risk?
� How will work be funded?
� What are we going to do, and when?
The use of the SRM in this way would appear to be acceptable. However, how it will be usedin detail is currently unknown, and should be examined at a later stage.
Overall, Railtrack’s current use and future use of the SRM would appear acceptable. Theyhave also reviewed the SRM in detail for completeness and applicability (Railtrack, 2001d).In addition, a thorough comparison has been made by Railtrack between the SRM and LondonUnderground’s QRA (Railtrack, 2001e).
5.1.2. Specific use in Railtrack’s Railway Safety Case
Railtrack’s latest safety case (Railtrack, 2001a), as submitted to HMRI for assessment,presents an assessment of the risks on the RCI derived from the SRM. The SRM has beenused to calculate the risk profile in terms of equivalent fatalities in several ways:
� profile for broad categories of risk - accidents to trespassers, train accidents, accidents topassengers at stations, other accidents to passengers, accidents to workforce, pedestriansstruck by trains at level crossings, and other accidents to members of the public;
� detailed risk profile in terms of each hazardous event;
HEALTH AND SAFETY LABORATORYAn agency of the Health and Safety Executive
44
� detailed risk profile in terms of each hazardous event, but separated into train accidents,movement accidents and non-movement accidents;
� the contribution of risk to different railway assets and activities; and
� the risk contribution of the precursors to their respective hazardous event, as presented inIssue 1 of the Risk Profile Bulletin.
In producing these profiles, the SRM appears to have been used appropriately, although thecontribution of risk to different assets may be a little simplistic in its approach. As such, thereis a concern that dependencies between the different sub-asset/activity groups are notreflected. However, Railtrack indicated (Railtrack, 2001f) that the vast majority of the riskfrom the SRM is from independent precursors, and therefore this approach is commensuratewith the SRM. Railtrack also indicated (Railtrack, 2001f) that one of the main uses of thissection is to inform people as to where significant risks are present on the railway and not topresent the results of detailed analysis. Thus the presentation of information in this form is auseful start point for more detailed analysis outside the SRM. Therefore, overall, the minorinaccuracies from not truly reflecting the dependencies is not thought to be a significantproblem.
No further use appears to have been made in the Railway Safety Case, other than presentationof the risk profiles. For example, this has not been taken further to link with the controls,including the standards, nor used to determine whether current controls are effective and ifnot, what additional controls could be used. However, Railtrack indicated that they arecurrently working on this in a revision of their draft safety case.
In summary, use of the SRM to produce the risk profiles is acceptable, but it is not clear howthis information is, or is intended to be, used.
5.2. Utilisation within the Train Operating Companies
Use of the SRM within the TOCs has up to now been very limited. However, from thequestionnaire discussed in Section 4.2.2, it is clear that it is likely to be used increasingly overthe next few months, particularly to support TOC’s railway safety cases. Section 5.2.1therefore discusses the overall use of the SRM as indicated in the responses to thequestionnaire and Section 5.2.2 looks briefly at one TOC’s use of the SRM, as described intheir draft railway safety case submitted to HMRI for assessment.
5.2.1. General use
From the TOCs responses to the questionnaire, as summarised in Section 4.2.2, the main useor intended use of the SRM is:
� to support risk assessments in railway safety cases;
� to check that risk assessments have no obvious omissions; and
� to compare company risks with system-wide risks.
HEALTH AND SAFETY LABORATORYAn agency of the Health and Safety Executive
45
These applications all appear to be acceptable, although particular attention should be paid tothe processes by which these objectives have been realised. It appears that most TOCsunderstand that the SRM is not a replacement for their risk assessments, but merely an inputinto them. This therefore gives confidence that the majority of the industry are going in theright direction. The guidance, currently in draft form, on how to use the SRM to supportrailway safety cases is welcomed. Once the guidance is formally issued and more detailed useof the SRM is made, a thorough review of how the TOCs are organised to use the SRMshould be made.
5.2.2. Specific use in a TOC railway safety case
In one draft safety case submitted to HMRI for assessment, the SRM was used as an input tothe risk assessment. Its use was essentially as a checklist for hazardous events and precursors.From the list of hazardous events in the SRM, if any were thought to be within the scope ofthe TOC’s operations, they were chosen for further assessment. These were reviewed andcompared with previous risk assessments to ensure there were no significant gaps. Forrelevant hazardous events, the precursors were also listed, using the SRM as a source ofinformation. No further use of the SRM was made.
No use of the SRM data appears to have been made and heavy reliance is made on limitedincident data (3 years) and judgement. This may therefore underestimate the risk from highconsequence / low frequency events, although it is appreciated that most of such events wouldbe under the control of others, for example Railtrack.
A comparison of the risks from the SRM and the TOC’s risk assessment does not appear tohave been undertaken both for the hazardous events and the precursor risk contributions.Therefore, there is no feel for how the TOC compares with the national average.
In summary, the use of the SRM to help generate a list of hazardous events and precursors isacceptable; however, much more use could have been made of the SRM. However, it isappreciated that use of the SRM is still developing.
5.3. Summary
No evidence of the SRM being used inappropriately has been discovered, although there isscope for much increased use. However, because of the developmental nature of how theSRM is being used by the rail industry, it is recommended that particular attention be paid tothis, especially in the current round of railway safety case submissions.
The Railway Group, generally, have no clear process for linking the SRM into their overallrisk management system. Currently, the SRM is mainly used as a checklist for hazardousevents and the precursors for operators’ own risk assessments. Although this is an acceptableuse of the SRM, more benefit could be obtained, especially if operators used the SRM toinform them of how they contribute risk to the network and how their risk compares with thesystem-wide average risk and to other similar operators.
HEALTH AND SAFETY LABORATORYAn agency of the Health and Safety Executive
46

6. MAIN FINDINGS
The SRM has generally been found to be a good quality, system-wide QRA that models to alevel of detail commensurate with the input data available. It is a ‘high level’ QRA, in so faras it does not address the details of each line of route and does not model in detail systems,such as train braking systems. However, there is a significant amount of detail included inparts of the SRM, particularly the train accident models. Some shortcomings have been foundwith the SRM, these being of a relatively minor nature, which are discussed in detail in thisreport. The main issues are not connected to the SRM itself, but more to do with how it is tobe used. The main points to note are summarised below.
6.1. Review of the SRM
� The design and planning of the SRM, in the particular aspects considered before it wasdeveloped, were considered comprehensive.
� The scope of the SRM was found to be clearly stated, including the physical boundaries ofthe model. The high level objectives of the SRM were also found to be clearly stated,although the processes of how the SRM is going to be used to fulfil most of these was notclear. This requires further consideration and development by RS.
� The software chosen for the development of the SRM was carefully chosen by RS andappears fit-for-purpose.
� The hazard identification processes were found to be adequate. Therefore, confidence isgained that within the stated scope and boundaries of the SRM there should be nosignificant gaps.
� Overall, the fault and event tree models were found to be well-constructed.
� The SRM provides a first high level look at system-wide risk on the RCI. It does notprovide the necessary detail to allow risk to be assessed on a particular line or for aparticular train operating company, nor does it aid safety decisions at the practical or sharpend.
� The fault tree models are not developed further than available incident data. This reducesthe uncertainty in the basic event data, but does not assist in determining whether controlsare all embracing, which is an important element of risk management. Controls areimplicitly modelled and assumed to be working.
� A number of issues were identified as regards the quantification of the SRM. The vastmajority of these are relatively minor and the quantification was generally found to befit-for-purpose. However, one small area of concern is that some of the data in the SRM isalready 3 years old and in need of reviewing.
� The sources of data used to quantify the SRM were generally found to be adequate. Themain area of concern was due to the databases containing insufficient information to allowthe root causes of incidents to be derived.
HEALTH AND SAFETY LABORATORYAn agency of the Health and Safety Executive
47

� Consideration of human factors in the SRM was found to be acceptable. Human factorshave been taken into account at a high level and the quantification of such events is datadriven and has avoided the use of techniques such as HEART. However, the SRM wasfound not to resolve incidents into their root causes and was also found not to explicitlymodel indirect human failings. These are not major causes for concern if the SRM is usedonly as a first-pass assessment tool.
� The project database forms an integral part of the SRM. It stores all data, assumptions,justifications, references, and calculations used to derive the data. This database isinvaluable.
� The risk measure used, equivalent fatalities, is suitable for the SRM.
� There may be questions asked about specific assumptions underlying the SRM, but RShave been very open about these in an attempt to get the Railway Group to use the SRMappropriately. There are a number of concerns over the effectiveness of this, however, asthe Railway Group may not appreciate the inherent limitations.
� The general quality assurance procedures associated with the development of the SRM aregood and the documentation supporting the SRM is excellent.
� There is a formal process for update of the SRM, both in terms of the structure and interms of the data.
� The fact that the model has been developed in-house and is owned and understood indetail by those maintaining and supporting its use is very important to its usefulness.
� The SRM models a vast range of hazardous events which affect all exposed groups ofpeople on the RCI; high consequence / low frequency train accidents to low consequence /high frequency slips trips and falls are considered. This helps present a full picture of theaverage system-wide risk.
� The SRM effectively presents historical incident data in a different way. It could be arguedwhether more is being made of the SRM than is justifiable. In practical terms, it is difficultto visualise how the SRM will help make detailed safety decisions especially on aday-to-day basis.
� The role of uncertainty in the documentation seems to have been ‘glossed over’ and endresults simply stated. Sensitivity analyses are referred to, but there is no evidence that theyhave been carried out.
6.2. Benchmarking of the SRM
Although the benchmarking exercise highlighted a number of detailed issues for both theSRM and LUL QRA, in general both were found to be high quality and well developed. TheSRM has undergone a very structured, well-documented, development. We can therefore beconfident that it does not contain significant gaps. The output from the model benefits fromthe fact that it is flexible, in that the risk can be quantified in terms of different levels of harm
HEALTH AND SAFETY LABORATORYAn agency of the Health and Safety Executive
48
and for different groups of people at risk. However, at this stage in its development (that issince 1999, compared to the LUL QRA which has been under development since the early90s), it is not clear how the SRM will meet all of its stated objectives. In addition, the genericnature of the model makes no allowance for regional differences on the infrastructure.However, this is not a weakness in the production of the SRM, rather a weakness in the scope(which was restricted to system-wide considerations).
The LUL QRA, in contrast, has different models for each LUL line, enabling them to takeaccount of line specific features. The model contains more detail on accident precursors andthe likelihood of detecting failed controls than the SRM, thus enabling risk reducing measuresto be evaluated more readily. In addition, the model only considers fatalities and not differentlevels of harm, although these are taken into account in LUL’s customer risk assessments.Historically, the development and maintenance of the LUL QRA was not particularly wellmanaged and the process was not coherently documented. However, the management of theLUL QRA has improved in recent years and is no longer perceived deficient.
6.3. Roll-out of the SRM
The overall approach taken by RS, to widely distribute the outputs from the SRM, but not theactual fault and event trees and to provide guidance on its use within safety cases, wouldappear to be acceptable. The main points are summarised below.
� RS are, quite rightly, currently being very cautious in how they pass the SRM to theRailway Group, mainly because they are aware of its limitations and share many of theconcerns about the results being used inappropriately.
� The TOCs appear to have been well-informed about the SRM, primarily through the ‘RiskProfile Bulletin’. This would appear to be an acceptable way of sharing the findings fromthe SRM with the Railway Group.
� The guidance drafted by RS on the preparation of risk assessments within railway safetycases will help to reduce concern about the SRM being used inappropriately. It shouldprove invaluable if supported by suitable training for ensuring adequate competence levelswhen using the SRM.
� Disappointingly, some TOCs have not attended any of the briefing sessions held by RS.
6.4. Use of the SRM
The Railway Group have only recently begun using the SRM and therefore there are currentlyno clear processes in place. However, where it has been used, no evidence has been found thatthe SRM was used inappropriately. Currently, the SRM is mainly used as a checklist ofhazardous events and precursors for operators’ own risk assessments. Although this is anacceptable use of the SRM, more benefit could be obtained, especially if operators used theSRM to inform them of how they contribute risk to the network and how their risk compareswith system-wide average risk and other similar operators. RS have drafted guidance (October2001) on use of the SRM within railway safety cases, which when formally issued should help
HEALTH AND SAFETY LABORATORYAn agency of the Health and Safety Executive
49
immensely in ensuring that the SRM is used to its full potential and, more importantly, usedappropriately.
Reassuringly, most of the Railway Group appear to share the same view; that the SRM willfeed into their risk assessment rather than be a replacement for it. However, the developmentof any processes and increased use of the SRM will need to be carefully scrutinised.
7. REFERENCES
Kirwan B (1994). A guide to practical human reliability assessment, Taylor and Francis,London.
LUL (1996). Safety Control Standard No. 6: Safety Justification and ALARP, Issue 1, August1996.
LUL (1999). Safety Control Standard No. 8: Appropriate Risk Assessment, Issue 2, June1999.
LUL (2001a). London Underground Limited Railway Safety Case, Version 3, HMRI Draft 2,May 2001.
LUL (2001b). London Underground Limited Quantified Risk Assessment Update 2001, Issue1, June 2001.
LUL (2002). SRM and LUL QRA benchmarking, E-mail from J. Collis (LUL) to S. Turner(HSL), HSL ref.: RA/RE/77/2001 E109, 4 January 2002.
Railtrack (2001a). Railtrack’s Railway Safety Case XXXX 2001, Version 4, June 2001.
Railtrack (2001b). Safety Risk Strategy, Issue 1 draft, August 2001.
Railtrack (2001c). Safety and Environmental Plan 2001/2002, 2001.
Railtrack (2001d). Review of SRM report, Issue 1 draft, 2001.
Railtrack (2001e). Comparison of the Railway Safety SRM and the LUL QRA, Issue 1 draft,August 2001.
Railtrack (2001f). Safety Risk Model (SRM) Final Report, Letter from P. Dray (Railtrack) toS. Turner (HSL), HSL ref.: RA/RE/77/2001 E102, 1 November 2001.
RS (1999a). The Safety & Standards Directorate Safety Risk Model: Project initiationdocument, SP-RSK-3.1.3.1, Issue 2, March 1999.
RS (1999b). The Safety & Standards Directorate Safety Risk Model: Project quality plan,SP-RSK-3.1.3.2, Issue 1, February 1999.
RS (1999c). The Safety & Standards Directorate Safety Risk Model: Identification ofhazardous events, SP-RSK-3.1.3.4, Issue 2, April 1999.
HEALTH AND SAFETY LABORATORYAn agency of the Health and Safety Executive
50

RS (1999d). The Safety & Standards Directorate Safety Risk Model: Identification ofhazardous event precursors, SP-RSK-3.1.3.5, Issue 2, March 1999.
RS (1999e). The Safety & Standards Directorate Safety Risk Model: User manual for theproject database, SP-RSK-3.1.3.7, Issue 1, May 1999.
RS (1999f). The Safety & Standards Directorate Safety Risk Model: Review of data sources,SP-RSK-3.1.3.3, Issue 3, February 1999.
RS (2000). The Safety & Standards Directorate Safety Risk Model: Safety risk modeloverview report, SP-RSK-3.1.3.10, Draft, May 2000.
RS (2001a). Profile of safety risk on Railtrack PLC-controlled infrastructure,SP-RSK-3.1.3.11, Issue 1, January 2001.
RS (2001b). Guidance on the preparation of risk assessments within Railway Safety Cases,draft 2, September 2001.
RS (2001c). Responses to HSL Comments on the Safety Risk Model, SP-RSK-3.1.4/60/crd,Letter from C. Dennis (RS) to S. Turner (HSL), HSL ref.: RA/RE/77/2001 E54, 3 August2001.
RS (2001d). Profile of safety risk on Railtrack PLC-controlled infrastructure,SP-RSK-3.1.3.11, Issue 2, July 2001.
RS (2001e). Quality of data used in the Safety Risk Model, Letter from K. Somaiya (RS) to S.Turner (HSL), HSL ref.: RA/RE/77/2001 E84, 31 August 2001.
RS (2001f). Review of Safety Risk Model, Letter from S. Brearley (RS) to S. Turner (HSL),HSL ref.: RA/RE/77/2001 E44, 18 July 2001.
RS (2001g). Comments on the Safety Risk Model (SRM) Final Report (Draft 1), Letter fromC. Dennis (RS) to S. Turner (HSL), HSL ref.: RA/RE/77/2001 E103, 13 November 2001.
RS (2002). Comments on the Safety Risk Model (SRM) Final Report (Draft 2), Letter from K.Somaiya (RS) to S. Turner (HSL), HSL ref.: RA/RE/77/2001 E115, 18 January 2002.
Turner S (2001a). Quality of data within the SRM, E-mail from S. Turner (HSL) to K.Somaiya (RS), HSL ref.: RA/RE/77/2001 E58, 7 August 2001.
Turner S (2001b). Letter from S. Turner (HSL) to S. Brearley (RS), HSL ref.: RA/RE/77/2001E42, 11 July 2001.
Turner S and Gadd S (2001). Review of London Underground Ltd risk assessment system,HSL report: RAS/01/03, May 2001.
Turner S and Keeley D (2001). A Preliminary Review of Railway Safety’s Safety Risk Model,HSL report: RAS/01/07, September 2001.
HEALTH AND SAFETY LABORATORYAn agency of the Health and Safety Executive
51

Weyman A K and Anderson M (1997). Assessment of the application of risk assessment inthe UK mining industry (main report), HSL report: RAS/98/5, 1998.
Williams J C (1986). HEART - a proposed method for assessing and reducing human error, Inproceedings of the 9th Advances in Reliability Technology Symposium, University ofBradford.
HEALTH AND SAFETY LABORATORYAn agency of the Health and Safety Executive
52

APPENDIX A: BREAKDOWN OF EXAMPLE HAZARDOUS EVENTS
This appendix shows the level of modelling in the fault trees of five hazardous events fromthe SRM. For each of these the fault tree logic is summarised in a table, showing the hierarchyof precursors leading to the hazardous event. The most resolved precursors, the basic events,are at the right hand side and the least resolved at the left hand side. The basic events havebeen highlighted in the tables. Any one of the precursors will lead to the top event occurring.
APPENDIX A
HEALTH AND SAFETY LABORATORYAn agency of the Health and Safety Executive
53

TABLE A1: Summary of hierarchy of precursors for collision between trainshazardous event - HET 1
Uncategorised SPADs which aredrivers responsibility
Misreads signal by viewing wrongsignal
Misreads signal as a result ofmisreading previous signal
Misreads correct signal bymisreading signal aspect
Driver misreads signalMisjudges trains behaviour
Misjudges environmentalconditions
Driver misjudges signalWrong informationInformation not given
Correct information given butmisunderstood
Ambiguous or incompleteinformation
Driver miscommunicationViolation of rules and instructionsIgnorance of rules and instructionsFails to react to caution signalFails to locate signals aspectFails to check signals aspectAnticipation of signals clearanceDriver disregards signalTrain driver human error
Other environmental conditionsVegetation on track Environmental conditions
Other staff hand signalmancommunication error
Other staff communication humanerror
Other staff human error
Signalman communication humanerror
Signalman human error inoperating signalling equipment
Signalman human errorOther railway staff human error(not drivers)
Traction control failureBrake failureT&RS failure
Wrongside signalling failureLowest level precursorHighest level precursor
APPENDIX A
HEALTH AND SAFETY LABORATORYAn agency of the Health and Safety Executive
54
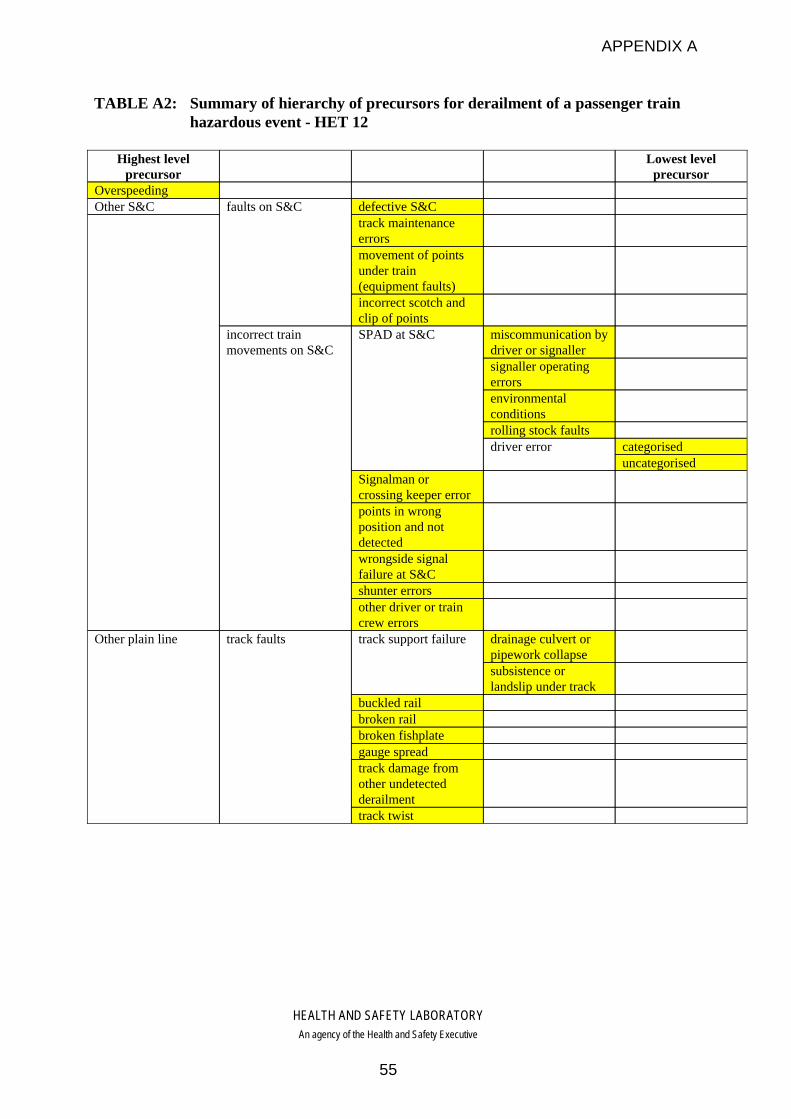
TABLE A2: Summary of hierarchy of precursors for derailment of a passenger trainhazardous event - HET 12
track twist
track damage fromother undetectedderailment
gauge spreadbroken fishplatebroken railbuckled rail
subsistence orlandslip under track
drainage culvert orpipework collapse
track support failuretrack faultsOther plain line
other driver or traincrew errors
shunter errors
wrongside signalfailure at S&C
points in wrongposition and notdetected
Signalman orcrossing keeper error
uncategorisedcategoriseddriver error
rolling stock faults
environmentalconditions
signaller operatingerrors
miscommunication bydriver or signaller
SPAD at S&Cincorrect trainmovements on S&C
incorrect scotch andclip of points
movement of pointsunder train(equipment faults)
track maintenanceerrors
defective S&Cfaults on S&COther S&COverspeeding
Lowest levelprecursor
Highest levelprecursor
APPENDIX A
HEALTH AND SAFETY LABORATORYAn agency of the Health and Safety Executive
55

TABLE A2 (cont): Summary of hierarchy of precursors for derailment of passengertrain hazardous event - HET 12
severe braking orsnatching
coupling failurebuffer lockingwheel failure
wheel flats orwheel/tyre wearbeyond limits
suspension system orbogie failures
seized axle boxbearing
axle failurerolling stock faultssnow or iceflooding
retaining wallssignalling gantriesOHLE structureslandslip
lineside structures orbuildings
overbridgesdebris from structuralfailures
train derailed while indepot or sidings
derailed OTM orengineers trains
running into railvehicles
large animals
objects from buildingsites
items blown onto linetrees
objects placed ontrack by vandals
engineers materialleft fouling line
objects fallen fromtrees
maintenance vehiclesobjects on the line
through boundaryfence
fallen fromoverbridge
vehiclesrunning intoobstructions
Other plain linecontinued
Lowest levelprecursor
Highest levelprecursor
APPENDIX A
HEALTH AND SAFETY LABORATORYAn agency of the Health and Safety Executive
56
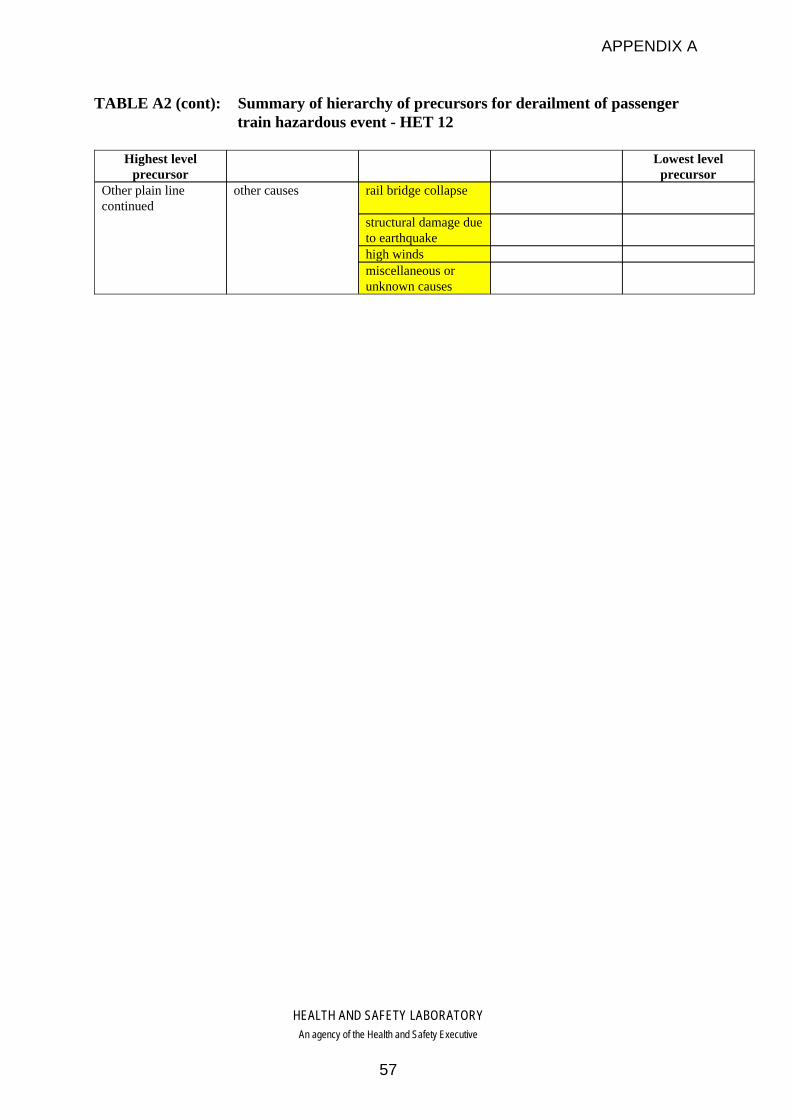
TABLE A2 (cont): Summary of hierarchy of precursors for derailment of passengertrain hazardous event - HET 12
miscellaneous orunknown causes
high winds
structural damage dueto earthquake
rail bridge collapseother causesOther plain linecontinued
Lowest levelprecursor
Highest levelprecursor
APPENDIX A
HEALTH AND SAFETY LABORATORYAn agency of the Health and Safety Executive
57
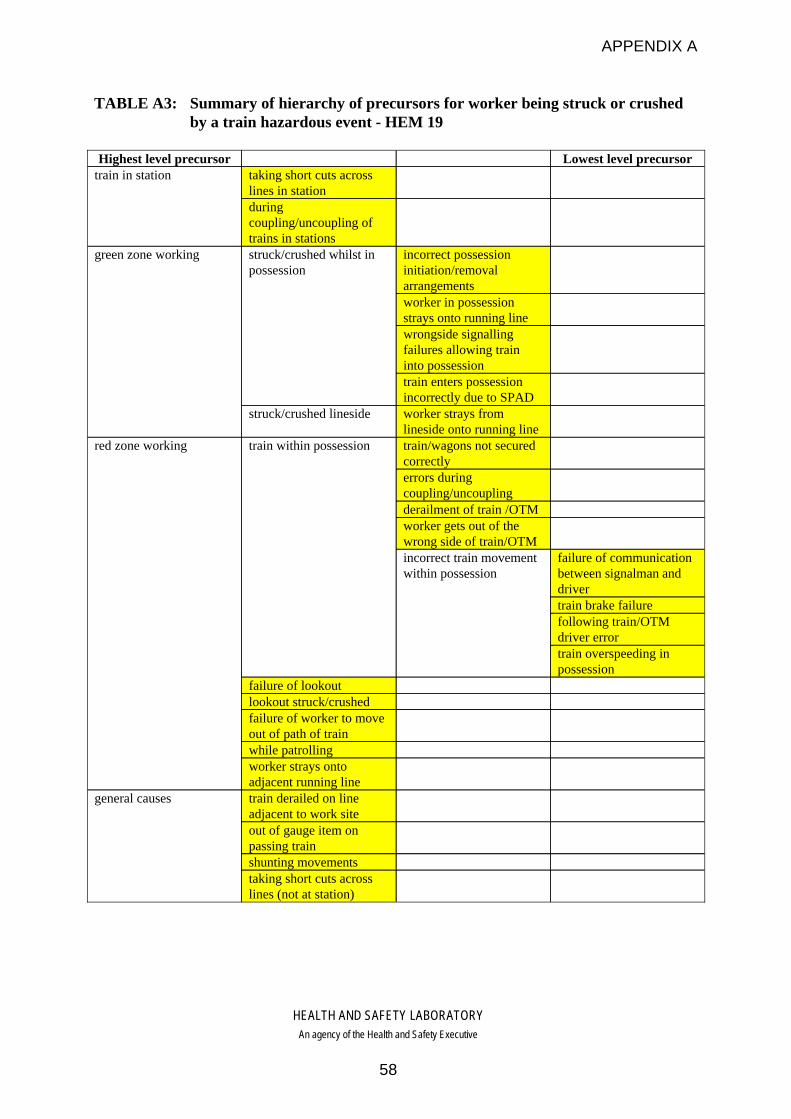
TABLE A3: Summary of hierarchy of precursors for worker being struck or crushedby a train hazardous event - HEM 19
taking short cuts acrosslines (not at station)
shunting movements
out of gauge item onpassing train
train derailed on lineadjacent to work site
general causes
worker strays ontoadjacent running line
while patrolling
failure of worker to moveout of path of train
lookout struck/crushedfailure of lookout
train overspeeding inpossession
following train/OTMdriver error
train brake failure
failure of communicationbetween signalman anddriver
incorrect train movementwithin possession
worker gets out of thewrong side of train/OTM
derailment of train /OTM
errors duringcoupling/uncoupling
train/wagons not securedcorrectly
train within possessionred zone working
worker strays fromlineside onto running line
struck/crushed lineside
train enters possessionincorrectly due to SPAD
wrongside signallingfailures allowing traininto possession
worker in possessionstrays onto running line
incorrect possessioninitiation/removalarrangements
struck/crushed whilst inpossession
green zone working
duringcoupling/uncoupling oftrains in stations
taking short cuts acrosslines in station
train in stationLowest level precursorHighest level precursor
APPENDIX A
HEALTH AND SAFETY LABORATORYAn agency of the Health and Safety Executive
58
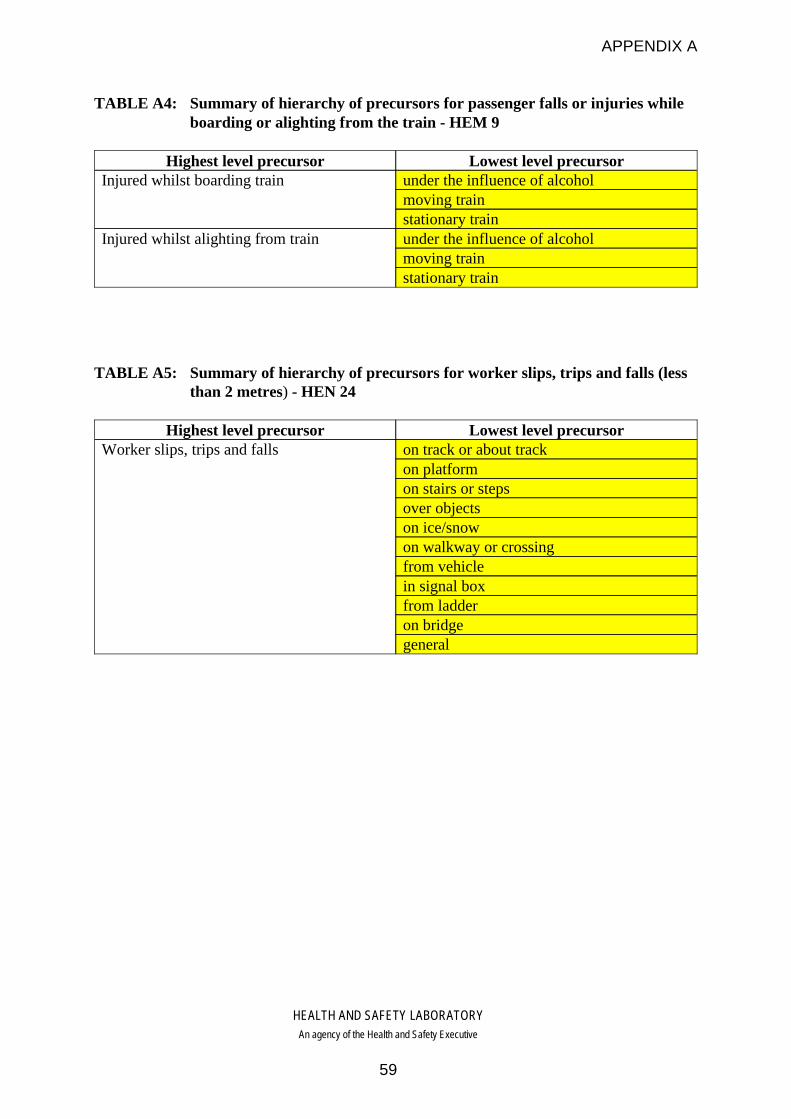
TABLE A4: Summary of hierarchy of precursors for passenger falls or injuries whileboarding or alighting from the train - HEM 9
stationary trainmoving trainunder the influence of alcoholInjured whilst alighting from trainstationary trainmoving trainunder the influence of alcoholInjured whilst boarding train
Lowest level precursorHighest level precursor
TABLE A5: Summary of hierarchy of precursors for worker slips, trips and falls (lessthan 2 metres) - HEN 24
generalon bridgefrom ladderin signal boxfrom vehicleon walkway or crossingon ice/snowover objectson stairs or stepson platformon track or about trackWorker slips, trips and falls
Lowest level precursorHighest level precursor
APPENDIX A
HEALTH AND SAFETY LABORATORYAn agency of the Health and Safety Executive
59
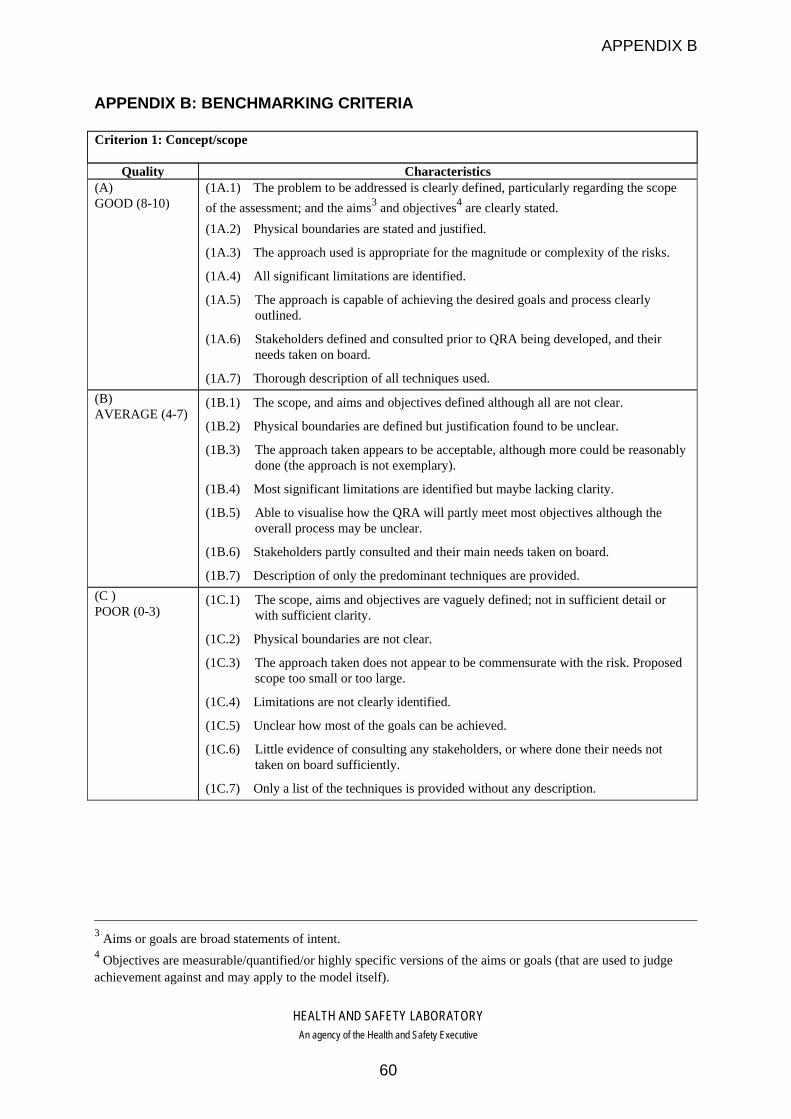
APPENDIX B: BENCHMARKING CRITERIA
(1C.1) The scope, aims and objectives are vaguely defined; not in sufficient detail orwith sufficient clarity.
(1C.2) Physical boundaries are not clear.
(1C.3) The approach taken does not appear to be commensurate with the risk. Proposedscope too small or too large.
(1C.4) Limitations are not clearly identified.
(1C.5) Unclear how most of the goals can be achieved.
(1C.6) Little evidence of consulting any stakeholders, or where done their needs nottaken on board sufficiently.
(1C.7) Only a list of the techniques is provided without any description.
(C )POOR (0-3)
(1B.1) The scope, and aims and objectives defined although all are not clear.
(1B.2) Physical boundaries are defined but justification found to be unclear.
(1B.3) The approach taken appears to be acceptable, although more could be reasonablydone (the approach is not exemplary).
(1B.4) Most significant limitations are identified but maybe lacking clarity.
(1B.5) Able to visualise how the QRA will partly meet most objectives although theoverall process may be unclear.
(1B.6) Stakeholders partly consulted and their main needs taken on board.
(1B.7) Description of only the predominant techniques are provided.
(B)AVERAGE (4-7)
(1A.1) The problem to be addressed is clearly defined, particularly regarding the scope
of the assessment; and the aims3 and objectives4 are clearly stated.
(1A.2) Physical boundaries are stated and justified.
(1A.3) The approach used is appropriate for the magnitude or complexity of the risks.
(1A.4) All significant limitations are identified.
(1A.5) The approach is capable of achieving the desired goals and process clearlyoutlined.
(1A.6) Stakeholders defined and consulted prior to QRA being developed, and theirneeds taken on board.
(1A.7) Thorough description of all techniques used.
(A)GOOD (8-10)
CharacteristicsQuality
Criterion 1: Concept/scope
APPENDIX B
HEALTH AND SAFETY LABORATORYAn agency of the Health and Safety Executive
60
4 Objectives are measurable/quantified/or highly specific versions of the aims or goals (that are used to judgeachievement against and may apply to the model itself).
3 Aims or goals are broad statements of intent.
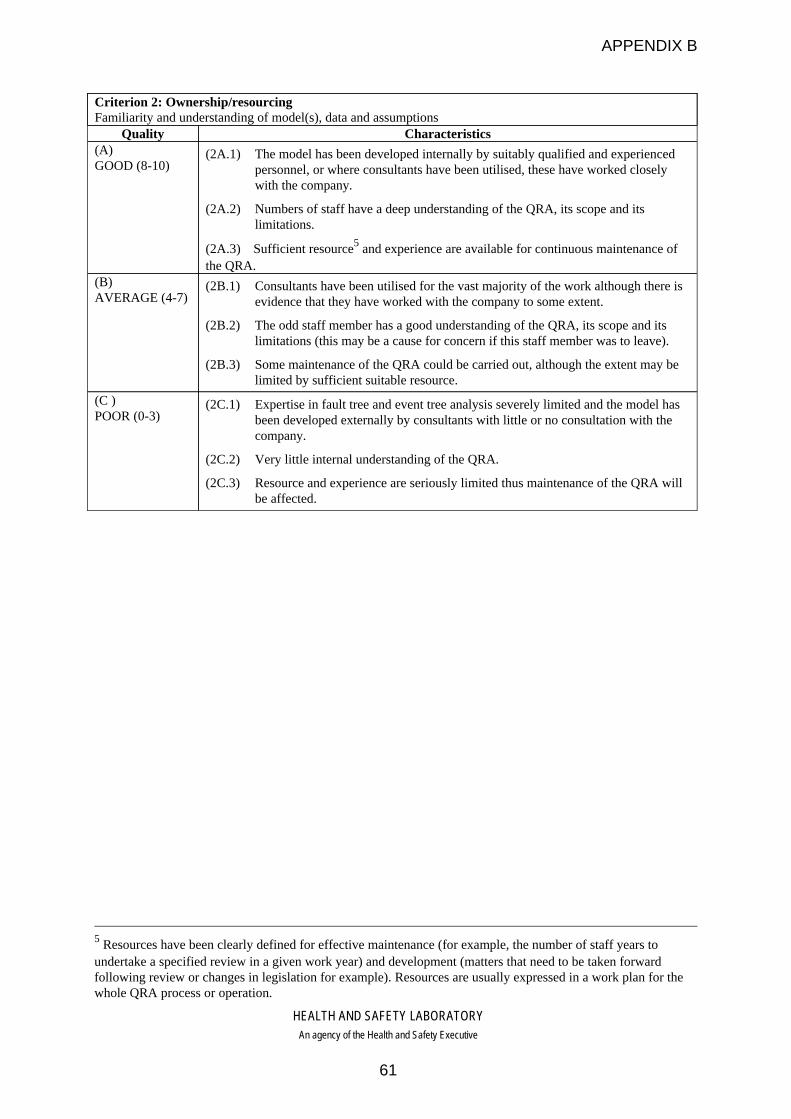
(2C.1) Expertise in fault tree and event tree analysis severely limited and the model hasbeen developed externally by consultants with little or no consultation with thecompany.
(2C.2) Very little internal understanding of the QRA.
(2C.3) Resource and experience are seriously limited thus maintenance of the QRA willbe affected.
(C )POOR (0-3)
(2B.1) Consultants have been utilised for the vast majority of the work although there isevidence that they have worked with the company to some extent.
(2B.2) The odd staff member has a good understanding of the QRA, its scope and itslimitations (this may be a cause for concern if this staff member was to leave).
(2B.3) Some maintenance of the QRA could be carried out, although the extent may belimited by sufficient suitable resource.
(B)AVERAGE (4-7)
(2A.1) The model has been developed internally by suitably qualified and experiencedpersonnel, or where consultants have been utilised, these have worked closelywith the company.
(2A.2) Numbers of staff have a deep understanding of the QRA, its scope and itslimitations.
(2A.3) Sufficient resource5 and experience are available for continuous maintenance ofthe QRA.
(A)GOOD (8-10)
CharacteristicsQuality
Criterion 2: Ownership/resourcingFamiliarity and understanding of model(s), data and assumptions
APPENDIX B
HEALTH AND SAFETY LABORATORYAn agency of the Health and Safety Executive
61
5 Resources have been clearly defined for effective maintenance (for example, the number of staff years toundertake a specified review in a given work year) and development (matters that need to be taken forwardfollowing review or changes in legislation for example). Resources are usually expressed in a work plan for thewhole QRA process or operation.

(3B.1) Roles and responsibilities of personnel documented and an indication of theirexperience stated. However, questions exist about the suitability of all personnelor insufficient detail given.
(3B.2) Supporting documentation relatively comprehensive, although may not all beup-to-date.
(3B.3) Some limited independent review has been carried out although possibly notexternally. Most actions have been acted upon and the process has beendocumented although it could be improved.
(3B.4) Most of the QRA has been checked for accuracy, although the records of this maybe poor. Therefore, only have limited confidence in the quality.
(3B.5) QA procedures documented and generally fit-for-purpose although may be weakin places.
(3B.6) Processes appear to be in place for the review and update of the QRA althoughthese may appear to be rather informal and infrequent.
(3B.7) Evidence of a process to make the data and modelling assumptions traceable.However, the effectiveness may be questionable.
(3B.8) Version control is operated centrally, but not implemented in other units.
(B)AVERAGE (4-7)
(3A.1) The roles and responsibilities of all those involved in the QRA are clearlydocumented and match their experience.
(3A.2) Supporting documentation is readily available, up-to-date, easy to use andcomprehensive.
(3A.3) The model has been independently peer reviewed both internally and externally.All comments have been noted or acted upon and the review process is clearlydocumented.
(3A.4) All aspects of the QRA (data, structure, assumptions) have been thoroughlychecked thus confident that there are no significant errors in data or structure.
(3A.5) QA procedures6 are clearly documented and are adequate.
(3A.6) Well defined formal processes are in place for the regular review and update ofthe QRA.
(3A.7) Clear effective processes are in place to ensure the data used and all assumptions(modelling and data) are traceable.
(3A.8) Measures in place to prevent use of old versions of the QRA (excellent versioncontrol).
(A)GOOD (8-10)
CharacteristicsQuality
Criterion 3: Quality assurance
APPENDIX B
HEALTH AND SAFETY LABORATORYAn agency of the Health and Safety Executive
62
6 QA procedures for both the development and use of the QRA. For example, was there a suitable quality plan atthe outset?

(3C.1) Roles and responsibilities of personnel not clearly documented. Where they aredocumented, the experience may not be adequate.
(3C.2) Very little supporting documentation. What there is may be out-of-date.
(3C.3) Very little review (internally or externally) has been carried out.
(3C.4) Checking of the QRA for accuracy extremely limited, therefore not confident ofthe quality.
(3C.5) QA procedures not documented or where documented are clearly inadequate.
(3C.6) Very little evidence of any process for the review and update of the QRA.
(3C.7) A poor process is in place to make the data and modelling assumptions traceable.
(3C.8) Poor measures in place for version control.
(C)POOR (0-3)
CharacteristicsQuality
Criterion 3: Quality assurance
APPENDIX B
HEALTH AND SAFETY LABORATORYAn agency of the Health and Safety Executive
63

(4C.1) Very insular in the approach taken to identifying the hazards.
(4C.2) Inappropriate hazard identification techniques used or appropriate techniquesused by unqualified assessors.
(4C.3) Those affected by the hazard not approached.
(4C.4) Gaps in the analysis are clearly present.
(4C.5) Little or no documentation of the process.
(4C.6) Only normal operation considered with little consideration of human factors.
(C)POOR (0-3)
(4B.1) Some form of brainstorming used to identify the hazards and the mechanismsleading to these. However, the brainstorming team did not have a suitable balanceof experience and expertise.
(4B.2) Some recognised hazard identification techniques have been used by reasonablyqualified and experienced assessors.
(4B.3) Some of those affected by the hazard have been approached although not asufficient number.
(4B.4) Cannot be totally confident that no significant gaps exist although it appears to befairly comprehensive.
(4B.5) Some documentation of the process taken exists.
(4B.6) Human factors and abnormal operations are considered to some extent althoughnot comprehensively.
(B)AVERAGE (4-7)
(4A.1) Hazard identification is considered systematically and comprehensively drawingon historical data, personnel with extensive knowledge of the system, experiencedrisk assessors and any other available resource.
(4A.2) Recognised hazard identification techniques have been used by suitably qualifiedand experienced assessors.
(4A.3) A wide range of people exposed to the hazard have been approached.
(4A.4) Confident that there are no significant gaps in the QRA within the stated scope.
(4A.5) The approach taken is clearly documented.
(4A.6) Human factors and abnormal operations are considered in detail.
(A)GOOD (8-10)
CharacteristicsQuality
Criterion 4: Hazard identificationIdentification of the hazardous events, the precursors, and the mitigation and escalation factors
APPENDIX B
HEALTH AND SAFETY LABORATORYAn agency of the Health and Safety Executive
64
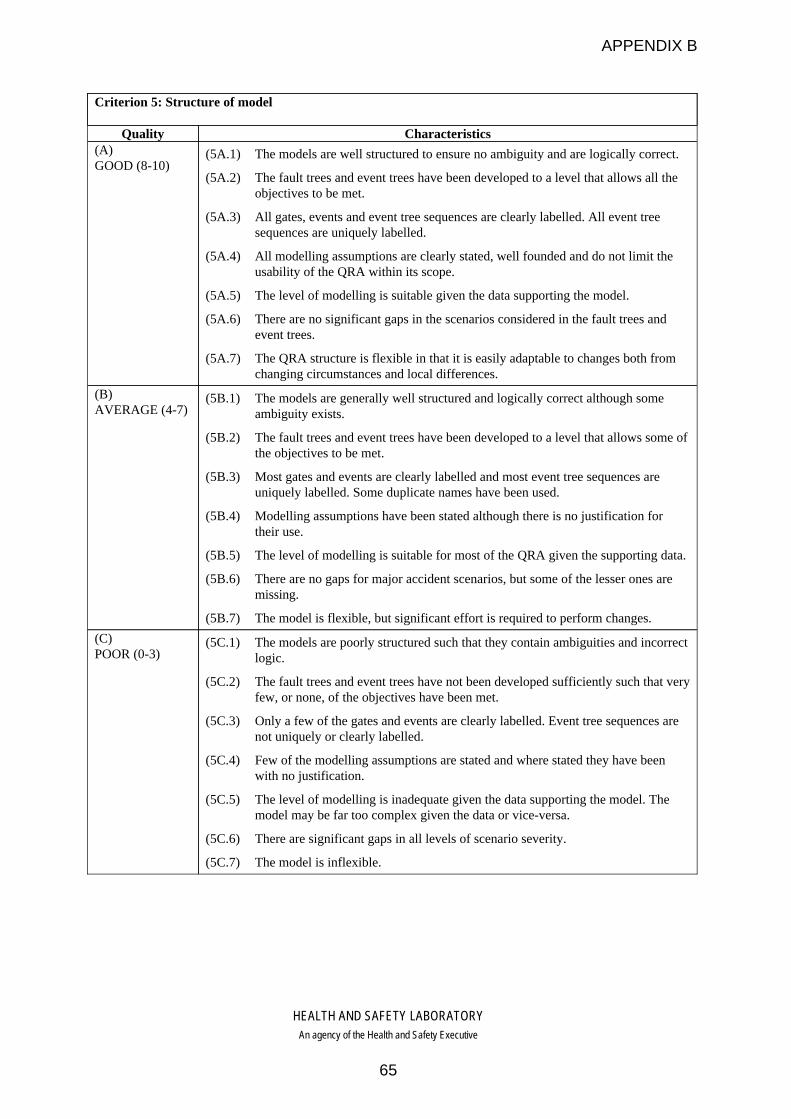
(5C.1) The models are poorly structured such that they contain ambiguities and incorrectlogic.
(5C.2) The fault trees and event trees have not been developed sufficiently such that veryfew, or none, of the objectives have been met.
(5C.3) Only a few of the gates and events are clearly labelled. Event tree sequences arenot uniquely or clearly labelled.
(5C.4) Few of the modelling assumptions are stated and where stated they have beenwith no justification.
(5C.5) The level of modelling is inadequate given the data supporting the model. Themodel may be far too complex given the data or vice-versa.
(5C.6) There are significant gaps in all levels of scenario severity.
(5C.7) The model is inflexible.
(C)POOR (0-3)
(5B.1) The models are generally well structured and logically correct although someambiguity exists.
(5B.2) The fault trees and event trees have been developed to a level that allows some ofthe objectives to be met.
(5B.3) Most gates and events are clearly labelled and most event tree sequences areuniquely labelled. Some duplicate names have been used.
(5B.4) Modelling assumptions have been stated although there is no justification fortheir use.
(5B.5) The level of modelling is suitable for most of the QRA given the supporting data.
(5B.6) There are no gaps for major accident scenarios, but some of the lesser ones aremissing.
(5B.7) The model is flexible, but significant effort is required to perform changes.
(B)AVERAGE (4-7)
(5A.1) The models are well structured to ensure no ambiguity and are logically correct.
(5A.2) The fault trees and event trees have been developed to a level that allows all theobjectives to be met.
(5A.3) All gates, events and event tree sequences are clearly labelled. All event treesequences are uniquely labelled.
(5A.4) All modelling assumptions are clearly stated, well founded and do not limit theusability of the QRA within its scope.
(5A.5) The level of modelling is suitable given the data supporting the model.
(5A.6) There are no significant gaps in the scenarios considered in the fault trees andevent trees.
(5A.7) The QRA structure is flexible in that it is easily adaptable to changes both fromchanging circumstances and local differences.
(A)GOOD (8-10)
CharacteristicsQuality
Criterion 5: Structure of model
APPENDIX B
HEALTH AND SAFETY LABORATORYAn agency of the Health and Safety Executive
65
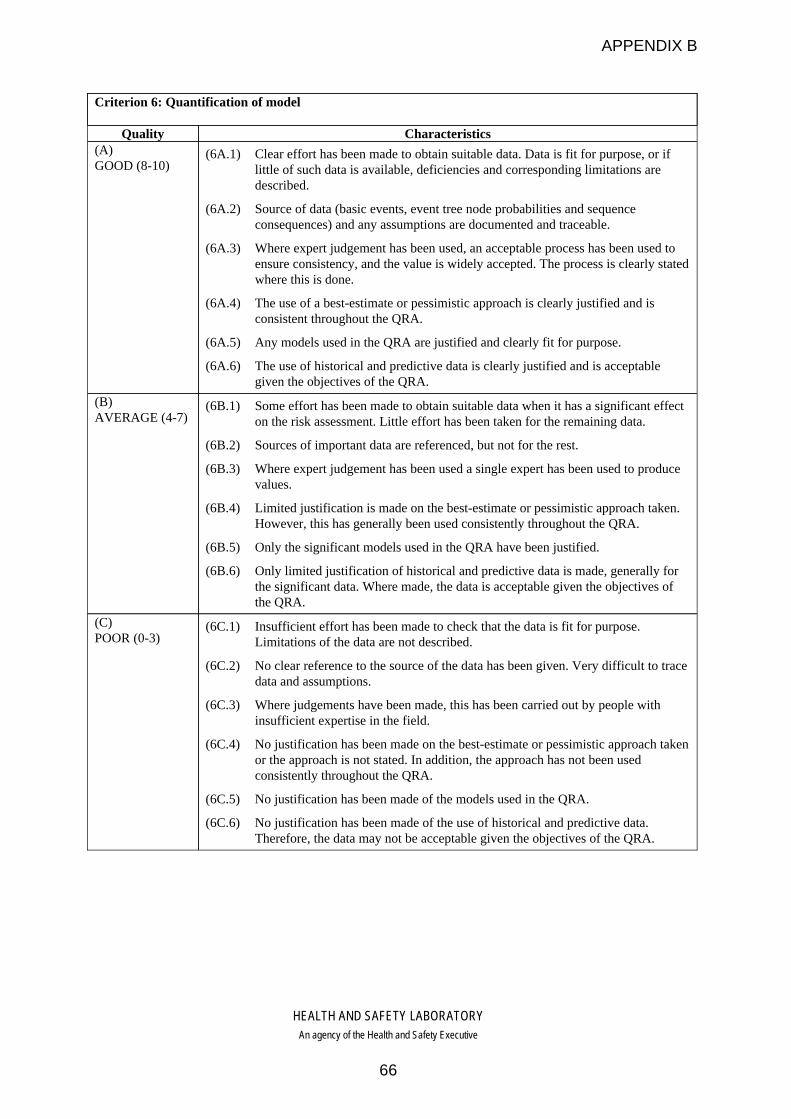
(6C.1) Insufficient effort has been made to check that the data is fit for purpose.Limitations of the data are not described.
(6C.2) No clear reference to the source of the data has been given. Very difficult to tracedata and assumptions.
(6C.3) Where judgements have been made, this has been carried out by people withinsufficient expertise in the field.
(6C.4) No justification has been made on the best-estimate or pessimistic approach takenor the approach is not stated. In addition, the approach has not been usedconsistently throughout the QRA.
(6C.5) No justification has been made of the models used in the QRA.
(6C.6) No justification has been made of the use of historical and predictive data.Therefore, the data may not be acceptable given the objectives of the QRA.
(C)POOR (0-3)
(6B.1) Some effort has been made to obtain suitable data when it has a significant effecton the risk assessment. Little effort has been taken for the remaining data.
(6B.2) Sources of important data are referenced, but not for the rest.
(6B.3) Where expert judgement has been used a single expert has been used to producevalues.
(6B.4) Limited justification is made on the best-estimate or pessimistic approach taken.However, this has generally been used consistently throughout the QRA.
(6B.5) Only the significant models used in the QRA have been justified.
(6B.6) Only limited justification of historical and predictive data is made, generally forthe significant data. Where made, the data is acceptable given the objectives ofthe QRA.
(B)AVERAGE (4-7)
(6A.1) Clear effort has been made to obtain suitable data. Data is fit for purpose, or iflittle of such data is available, deficiencies and corresponding limitations aredescribed.
(6A.2) Source of data (basic events, event tree node probabilities and sequenceconsequences) and any assumptions are documented and traceable.
(6A.3) Where expert judgement has been used, an acceptable process has been used toensure consistency, and the value is widely accepted. The process is clearly statedwhere this is done.
(6A.4) The use of a best-estimate or pessimistic approach is clearly justified and isconsistent throughout the QRA.
(6A.5) Any models used in the QRA are justified and clearly fit for purpose.
(6A.6) The use of historical and predictive data is clearly justified and is acceptablegiven the objectives of the QRA.
(A)GOOD (8-10)
CharacteristicsQuality
Criterion 6: Quantification of model
APPENDIX B
HEALTH AND SAFETY LABORATORYAn agency of the Health and Safety Executive
66

(7C.1) No justification of the calculation method used.
(7C.2) The software is not fit for purpose.
(7C.3) The modelling assumptions are not stated.
(7C.4) No limitations or pitfalls stated.
(C)POOR (0-3)
(7B.1) Limited justification on the choice of calculation method.
(7B.2) The software is fit for purpose but there are other packages that are more widelyused.
(7B.3) Modelling assumptions are stated, but there is no justification.
(7B.4) Only major limitations and pitfalls have been stated.
(B)AVERAGE (4-7)
(7A.1) The choice of calculation method is clearly justified and is suitable for theapplication.
(7A.2) The software is widely used for similar applications and its choice has beenclearly justified.
(7A.3) The modelling assumptions are clearly stated, justified and are fit for purpose.
(7A.4) Any limitations or potential pitfalls are clearly stated in order to greatly reducethe potential for misuse.
(A)GOOD (8-10)
CharacteristicsQuality
Criterion 7: AnalysisThe calculation platform or software if relevant
APPENDIX B
HEALTH AND SAFETY LABORATORYAn agency of the Health and Safety Executive
67
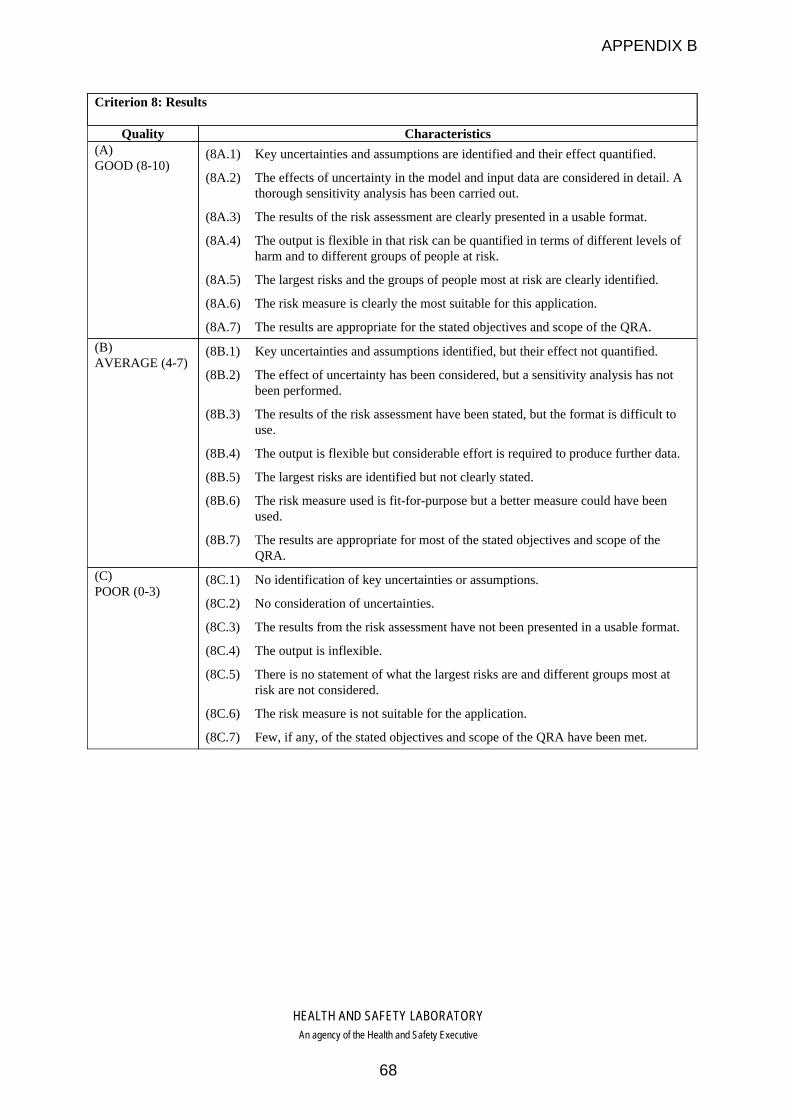
(8C.1) No identification of key uncertainties or assumptions.
(8C.2) No consideration of uncertainties.
(8C.3) The results from the risk assessment have not been presented in a usable format.
(8C.4) The output is inflexible.
(8C.5) There is no statement of what the largest risks are and different groups most atrisk are not considered.
(8C.6) The risk measure is not suitable for the application.
(8C.7) Few, if any, of the stated objectives and scope of the QRA have been met.
(C)POOR (0-3)
(8B.1) Key uncertainties and assumptions identified, but their effect not quantified.
(8B.2) The effect of uncertainty has been considered, but a sensitivity analysis has notbeen performed.
(8B.3) The results of the risk assessment have been stated, but the format is difficult touse.
(8B.4) The output is flexible but considerable effort is required to produce further data.
(8B.5) The largest risks are identified but not clearly stated.
(8B.6) The risk measure used is fit-for-purpose but a better measure could have beenused.
(8B.7) The results are appropriate for most of the stated objectives and scope of theQRA.
(B)AVERAGE (4-7)
(8A.1) Key uncertainties and assumptions are identified and their effect quantified.
(8A.2) The effects of uncertainty in the model and input data are considered in detail. Athorough sensitivity analysis has been carried out.
(8A.3) The results of the risk assessment are clearly presented in a usable format.
(8A.4) The output is flexible in that risk can be quantified in terms of different levels ofharm and to different groups of people at risk.
(8A.5) The largest risks and the groups of people most at risk are clearly identified.
(8A.6) The risk measure is clearly the most suitable for this application.
(8A.7) The results are appropriate for the stated objectives and scope of the QRA.
(A)GOOD (8-10)
CharacteristicsQuality
Criterion 8: Results
APPENDIX B
HEALTH AND SAFETY LABORATORYAn agency of the Health and Safety Executive
68

APPENDIX C: SUMMARY OF BENCHMARKING OF SRM AND LUL QRA
Tables C1 to C8 in this Appendix summarise the results of the benchmarking exercise.
APPENDIX C
HEALTH AND SAFETY LABORATORYAn agency of the Health and Safety Executive
69
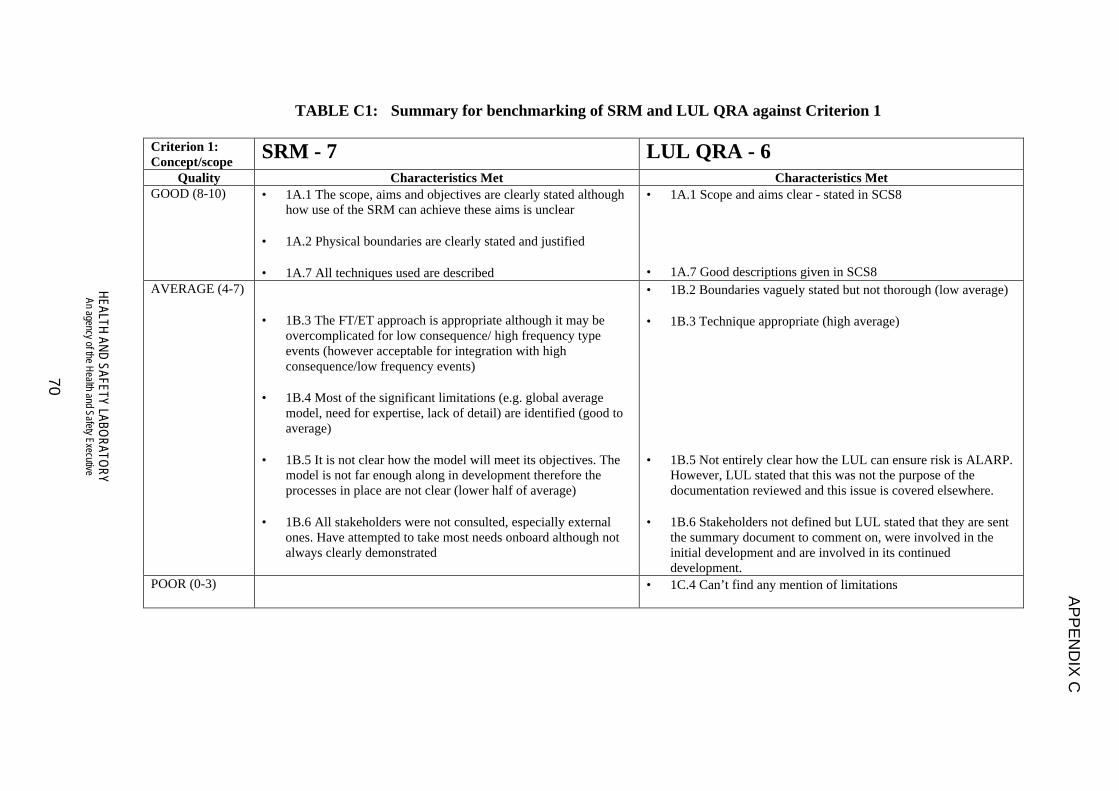
TABLE C1: Summary for benchmarking of SRM and LUL QRA against Criterion 1
Criterion 1:Concept/scope SRM - 7 LUL QRA - 6
Quality Characteristics Met Characteristics MetGOOD (8-10) • 1A.1 The scope, aims and objectives are clearly stated although
how use of the SRM can achieve these aims is unclear
• 1A.2 Physical boundaries are clearly stated and justified
• 1A.7 All techniques used are described
• 1A.1 Scope and aims clear - stated in SCS8
• 1A.7 Good descriptions given in SCS8AVERAGE (4-7)
• 1B.3 The FT/ET approach is appropriate although it may beovercomplicated for low consequence/ high frequency typeevents (however acceptable for integration with highconsequence/low frequency events)
• 1B.4 Most of the significant limitations (e.g. global averagemodel, need for expertise, lack of detail) are identified (good toaverage)
• 1B.5 It is not clear how the model will meet its objectives. Themodel is not far enough along in development therefore theprocesses in place are not clear (lower half of average)
• 1B.6 All stakeholders were not consulted, especially externalones. Have attempted to take most needs onboard although notalways clearly demonstrated
• 1B.2 Boundaries vaguely stated but not thorough (low average)
• 1B.3 Technique appropriate (high average)
• 1B.5 Not entirely clear how the LUL can ensure risk is ALARP.However, LUL stated that this was not the purpose of thedocumentation reviewed and this issue is covered elsewhere.
• 1B.6 Stakeholders not defined but LUL stated that they are sentthe summary document to comment on, were involved in theinitial development and are involved in its continueddevelopment.
POOR (0-3) • 1C.4 Can’t find any mention of limitations AP
PE
ND
IX C
HEALTH AND SAFETY LABORATO
RYAn agency of the Health and Safety Executive
70

TABLE C2: Summary for benchmarking of SRM and LUL QRA against Criterion 2
Criterion 2:Ownership SRM - 8 LUL QRA - 7
Quality Characteristics Met Characteristics MetGOOD (8-10) • 2A.1 Model developed internally
• 2A.2 Numbers of staff adequate at RSL and possibly Railtrack.CRD the expert though (low good to average)
• 2A.3 Budget to buy in consultancy resource if needed, alwaystime and money available for development (low good)
AVERAGE (4-7)
• 2B.3 Maintenance of the QRA may be limited by lack ofavailable resource
• 2B.1 Consultants initially used – LUL didn’t buy into it. Nowfound that model OK, LUL develop it in the main
• 2B.2 Numbers of staff adequate. Team of 3 with a deepunderstanding and many more with a general understanding(high average)
POOR (0-3)
AP
PE
ND
IX C
HEALTH AND SAFETY LABORATO
RYAn agency of the Health and Safety Executive
71

TABLE C3: Summary for benchmarking of SRM and LUL QRA against Criterion 3
Criterion 3:Quality assurance SRM - 8 LUL QRA – 6.5
Quality Characteristics Met Characteristics MetGOOD (8-10)
• 3A.2 Supporting documentation very good, some is beingupdated (e.g. RPB) although not all (e.g. database report) (lowgood)
• 3A.4 Confident that the checking is OK (low good)
• 3A.5 QA plan is good
• 3A.7 Use of database is excellent ensuring good traceabilityalthough not totally filled in
• 3A.8 All file names reflect the version number
• 3A.1 Roles and responsibilities are clearly defined and requiredlevels of experience are discussed
AVERAGE (4-7) • 3B.1 Roles and responsibilities are documented although not insufficient detail
• 3B.3 Models reviewed independently internally. Two modelshave been reviewed by external consultancies although not trulyindependent. Process of review unclear (high average to lowgood)
• 3B.6 Data 3 years old and no evidence of a review processhowever feel that they do intend doing it
• 3B.2 Summary document (LUL QRA 2001) updated at leastyearly – easy to read. General background documentationsupposedly available but not pulled together.
• 3B.3 Reviewed externally in 1995. All updates reviewed byLUL and infraco’s. Also some cross reviewing with Railtrack.Processes involved not clearly documented.
• 3B.4 Done with internal review. Not documented well.• 3B.5 No QA plan as such. Very high level description given in
SCS8 (low average/poor)• 3B.6 Process documented in Sec. 7.9 of safety case. A safety
improvement plan has been mentioned but not clearlydocumented.
• 3B.7 Paper system, not very formal. In the process of creating adatabase.
• 3B.8 Versions of summary document numbered. FT+ files givenout by controlled source but consultants can use wrong versions.
POOR (0-3)
AP
PE
ND
IX C
HEALTH AND SAFETY LABORATO
RYAn agency of the Health and Safety Executive
72

TABLE C4: Summary for benchmarking of SRM and LUL QRA against Criterion 4
Criterion 4:Hazard ID SRM - 7 LUL QRA - 6
Quality Characteristics Met Characteristics MetGOOD (8-10) • 4A.4 Yes
• 4A.5 Approach well documented
• 4A.4 Doing a 4 year review. Check incidents as they occur.Look at other independent RA. Have WRA and CRA to checkagainst. (low good)
AVERAGE (4-7) • 4B.1 Brainstorming done but do not know who was involved inthe process (high average)
• 4B.2 Again, do not know who was involved in using the HazardID techniques (high average)
• 4B.3 Some affected were consulted
• 4B.6 Abnormal operations and degraded operation consideredbut not comprehensive and need developing further.
• 4B.1 Hazard ID technique described in detail in SCS8.Reviewed historical data and brought in external experts.
• 4B.2 Used HAZOP but not clear who was involved (highaverage)
• 4B.3 Included workers and thought about people withdisabilities. Passenger groups and vulnerable people notinvolved.
• 4B.5 Part of the RSC explains how the QRA has developed overthe last 10 years. Initial process not clearly documented.
• 4B.6 Human factors inbuilt into HazID – not initially included,added on. Abnormal operations and degraded operationconsidered but not comprehensive and need developing further.
POOR (0-3)
AP
PE
ND
IX C
HEALTH AND SAFETY LABORATO
RYAn agency of the Health and Safety Executive
73

TABLE C5: Summary for benchmarking of SRM and LUL QRA against Criterion 5
Criterion 5:Model Structure SRM – 7.5 LUL QRA - 6
Quality Characteristics Met Characteristics MetGOOD (8-10) • 5A.1 Models well structured and logically correct (mostly) (low
good)
• 5A.5 Model designed to meet the data available, therefore good
• 5A.6 Good process and documentation therefore confident thereare no significant gaps
• 5A.5 Gone to a level that’s sensible to reach objectives andtaking account of available data and confidence in it. Useengineering judgement as well (high average)
AVERAGE (4-7)
• 5B.2 Model not detailed enough to allow all objectives to be met(average)
• 5B.3 Gates clearly labelled although not all event tree sequencesclearly labelled (high average)
• 5B.4 Modelling assumptions (e.g. speed of trains, time of day)stated although not clearly justified (high average)
• 5B.7 Model flexible but local differences would requiresubstantial effort to include
• 5B.1 Various mistakes in labelling and logic found but generallyOK
• 5B.2 Developed to a level to identify main areas of customerfatality
• 5B.3 Some problems with inconsistent labelling and duplicatenames (low average)
• 5B.4 Assumptions not explicitly stated in SCS8 although it saysthat they should be recorded elsewhere – not purpose of SCS8.
• 5B.6 Do fault schedule stage after HazID which is then mappedonto FT/ET’s – LUL stated that this is documented.
• 5B.7 Data changes easy. Structured by line which helps makeother changes easier. Defined in terms of assets therefore onlypart of the FT/ET is likely to change (high average)
POOR (0-3)
HEALTH AND SAFETY LABORATO
RYAn agency of the Health and Safety Executive
74
AP
PE
ND
IX C
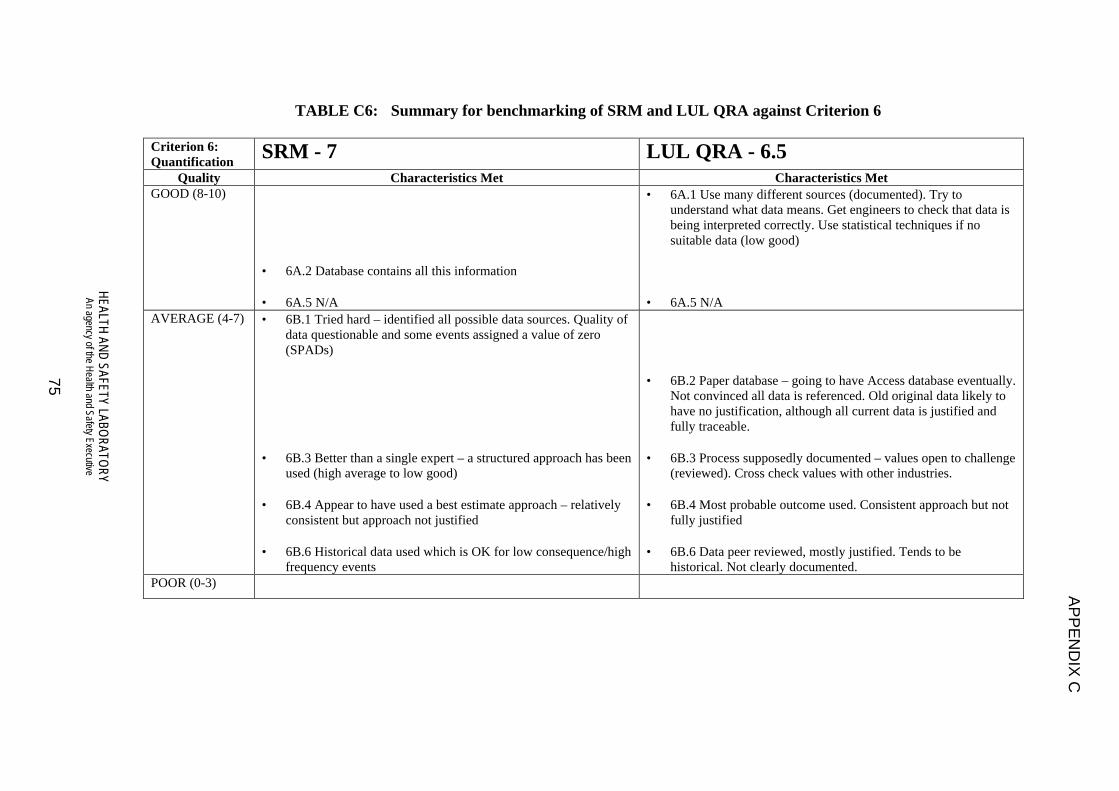
TABLE C6: Summary for benchmarking of SRM and LUL QRA against Criterion 6
Criterion 6:Quantification SRM - 7 LUL QRA - 6.5
Quality Characteristics Met Characteristics MetGOOD (8-10)
• 6A.2 Database contains all this information
• 6A.5 N/A
• 6A.1 Use many different sources (documented). Try tounderstand what data means. Get engineers to check that data isbeing interpreted correctly. Use statistical techniques if nosuitable data (low good)
• 6A.5 N/AAVERAGE (4-7) • 6B.1 Tried hard – identified all possible data sources. Quality of
data questionable and some events assigned a value of zero(SPADs)
• 6B.3 Better than a single expert – a structured approach has beenused (high average to low good)
• 6B.4 Appear to have used a best estimate approach – relativelyconsistent but approach not justified
• 6B.6 Historical data used which is OK for low consequence/highfrequency events
• 6B.2 Paper database – going to have Access database eventually.Not convinced all data is referenced. Old original data likely tohave no justification, although all current data is justified andfully traceable.
• 6B.3 Process supposedly documented – values open to challenge(reviewed). Cross check values with other industries.
• 6B.4 Most probable outcome used. Consistent approach but notfully justified
• 6B.6 Data peer reviewed, mostly justified. Tends to behistorical. Not clearly documented.
POOR (0-3)
HEALTH AND SAFETY LABORATO
RYAn agency of the Health and Safety Executive
75
AP
PE
ND
IX C

TABLE C7: Summary for benchmarking of SRM and LUL QRA against Criterion 7
Criterion 7:Analysis SRM – 7 LUL QRA – 6.5
Quality Characteristics Met Characteristics MetGOOD (8-10) • 7A.1 Fairly obvious that a detailed QRA was needed for the
high consequence/low frequency events, not clear for the highfrequency /low consequence events but good to use similarmethod for comparison purposes
• 7A.2 Appear to have chosen a decent package in FaultTree+ - itsuse is justified. RiskVu is a useful add-on for simplisticsensitivity analyses and risk contribution
• 7A.1 Fairly obvious that a detailed QRA was needed for thehigh consequence/low frequency events, not clear for the highfrequency /low consequence events but good to use similarmethod for comparison purposes
• 7A.2 Appear to have chosen a decent package in FaultTree+ - itsuse is justified. RiskVu is a useful add-on for simplisticsensitivity analyses and risk contribution
AVERAGE (4-7) • 7B.3 Modelling assumptions appear to be stated but definitelynot justified (low average)
• 7B.4 Pitfalls not stated (e.g. partial failures) – may need AEATreport
• 7B.3 Modelling assumptions may be noted now – not done inthe past and likely to be no justification (low average)
• 7B.4 Not documented – communicated verbally (lowaverage/poor)
POOR (0-3)
HEALTH AND SAFETY LABORATO
RYAn agency of the Health and Safety Executive
76
AP
PE
ND
IX C
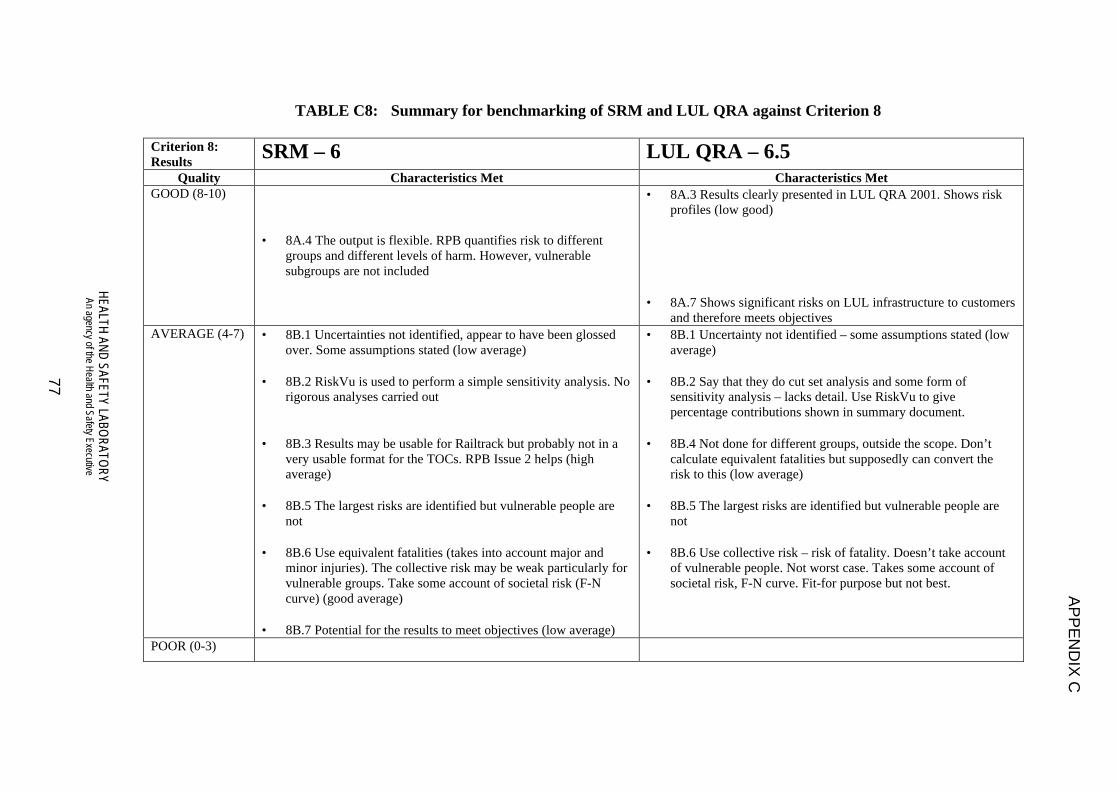
TABLE C8: Summary for benchmarking of SRM and LUL QRA against Criterion 8
Criterion 8:Results SRM – 6 LUL QRA – 6.5
Quality Characteristics Met Characteristics MetGOOD (8-10)
• 8A.4 The output is flexible. RPB quantifies risk to differentgroups and different levels of harm. However, vulnerablesubgroups are not included
• 8A.3 Results clearly presented in LUL QRA 2001. Shows riskprofiles (low good)
• 8A.7 Shows significant risks on LUL infrastructure to customersand therefore meets objectives
AVERAGE (4-7) • 8B.1 Uncertainties not identified, appear to have been glossedover. Some assumptions stated (low average)
• 8B.2 RiskVu is used to perform a simple sensitivity analysis. Norigorous analyses carried out
• 8B.3 Results may be usable for Railtrack but probably not in avery usable format for the TOCs. RPB Issue 2 helps (highaverage)
• 8B.5 The largest risks are identified but vulnerable people arenot
• 8B.6 Use equivalent fatalities (takes into account major andminor injuries). The collective risk may be weak particularly forvulnerable groups. Take some account of societal risk (F-Ncurve) (good average)
• 8B.7 Potential for the results to meet objectives (low average)
• 8B.1 Uncertainty not identified – some assumptions stated (lowaverage)
• 8B.2 Say that they do cut set analysis and some form ofsensitivity analysis – lacks detail. Use RiskVu to givepercentage contributions shown in summary document.
• 8B.4 Not done for different groups, outside the scope. Don’tcalculate equivalent fatalities but supposedly can convert therisk to this (low average)
• 8B.5 The largest risks are identified but vulnerable people arenot
• 8B.6 Use collective risk – risk of fatality. Doesn’t take accountof vulnerable people. Not worst case. Takes some account ofsocietal risk, F-N curve. Fit-for purpose but not best.
POOR (0-3)
HEALTH AND SAFETY LABORATO
RYAn agency of the Health and Safety Executive
77
AP
PE
ND
IX C
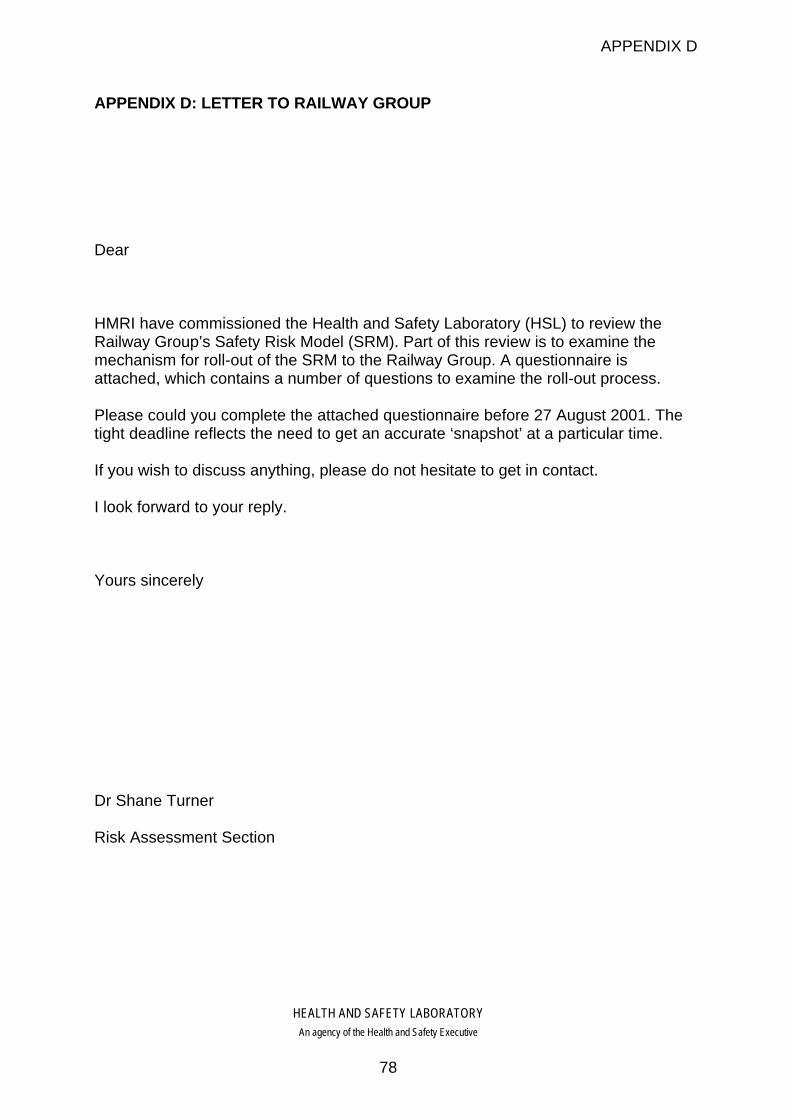
APPENDIX D: LETTER TO RAILWAY GROUP
Dear
HMRI have commissioned the Health and Safety Laboratory (HSL) to review theRailway Group’s Safety Risk Model (SRM). Part of this review is to examine themechanism for roll-out of the SRM to the Railway Group. A questionnaire isattached, which contains a number of questions to examine the roll-out process.
Please could you complete the attached questionnaire before 27 August 2001. Thetight deadline reflects the need to get an accurate ‘snapshot’ at a particular time.
If you wish to discuss anything, please do not hesitate to get in contact.
I look forward to your reply.
Yours sincerely
Dr Shane Turner
Risk Assessment Section
APPENDIX D
HEALTH AND SAFETY LABORATORYAn agency of the Health and Safety Executive
78

APPENDIX E: QUESTIONNAIRE SENT TO RAILWAY GROUP
Questionnaire of the Railways Group’s Safety Risk Model (SRM)
HMRI have commissioned this review of the Railway Group’s Safety Risk Model (SRM).This questionnaire contains a number of questions concerning your views of the roll-outprocess.
Name of organisation:
Contact person (name and title) and contact details (address and phone number):
Details on person completing form (if different from above):
…………………………………………………………………………………………………
…………………………………………………………………………………………………
…………………………………………………………………………………………………
………………
Please answer the following questions and tick the appropriate box if required. If there is insufficient space for your answer, please continue on separate sheet(s) of paper asnecessary.
Q1. What is your understanding concerning the purpose of the SRM?
Q2. How do you imagine the SRM should be used by your organisation in practice?
Q3. Have you received a copy of the Risk Profile Bulletin? YES oNO o(go to Q4)
If YES:
(i) Do you think the information (for example the risk profiles and riskcontributions) is presented in a format that allows it to be used easily?
YES oNO o
APPENDIX E
HEALTH AND SAFETY LABORATORYAn agency of the Health and Safety Executive
79
(ii) How do you think the information could be better presented in the Risk ProfileBulletin to allow the output from the SRM to be more applicable to you?
Q4. Have you received any other formal information on the SRM? YES oNO o(go to Q5)
If YES, please can you provide details.
Q5. Have you or your staff attended formal training on the SRM? YES oNO o
(go to Q6)
If YES:
(i) What did the training involve? (Please tick the appropriate box/boxes)
Workshops oSeminars oBriefings oSelf teach notes/reports oOther (please describe) _____________________________________________
(ii) What information was presented?
(iii) When was it held?
APPENDIX E
HEALTH AND SAFETY LABORATORYAn agency of the Health and Safety Executive
80

(iv) How many of your staff attended, and what were their roles/responsibilities?
(v) How relevant do you think the training was?
Q6. If neither you nor your staff have attended formal training on the SRM, please explainwhy.
Q7. Have you used the SRM or outputs from the SRM? YES oNO o(go to Q8)
If YES:
(i) At what level and in what detail did you use it?
(ii) What have you used it for (e.g. supporting Railway Safety Case; providing riskassessments; prioritising safety related work; aiding the decision makingprocess in safety related areas)?
APPENDIX E
HEALTH AND SAFETY LABORATORYAn agency of the Health and Safety Executive
81

(iii) How did you use the model to take account of local conditions and how do youlink it with the controls?
(iv) How does the SRM or output from the SRM interface with your riskassessment system?
(v) What is the position/experience of staff within your organisation who use themodel?
(vi) What is the specified competence requirement for SRM users?
(vii) If any contractors or non-employees have been (or are about to be)commissioned to use the SRM on your behalf, how do you (or how will you)ensure they use the SRM appropriately?
Q8. If the SRM has not been used, are you intending to use it in the future? YES oNO o
(go to Q9)
APPENDIX E
HEALTH AND SAFETY LABORATORYAn agency of the Health and Safety Executive
82
If YES:
(i) Exactly how do you intend to use the SRM?
(ii) Which of your staff will use the model (role/responsibilities)?
Q9. Have you requested access to the actual fault tree / event tree models?YES oNO o
(go to Q10)
If YES:
(i) Were you granted access? YES oNO o(go to Q10)
(ii) How was access managed by Railway Safety?
(iii) How did you use the models (provide details of any changes made to the dataand/or structure)?
Q10. Do any employees have specific training or expertise in fault tree and event treeanalysis? YES oNO o
(go to Q11)
APPENDIX E
HEALTH AND SAFETY LABORATORYAn agency of the Health and Safety Executive
83

If YES, could you please provide specific details of the numbers, experience andtraining of each.
FINALLY:
Q11. What support for your organisation in the use and understanding of the SRM is beingprovided by Railway Safety?
Thank you for taking the time to fill in this questionnaire
Please return the questionnaire to:-Shane Turner, Health and Safety Laboratory, Broad Lane, Sheffield. S3 7HQ
APPENDIX E
HEALTH AND SAFETY LABORATORYAn agency of the Health and Safety Executive
84