hsbc numerical reasoning test
DESCRIPTION
Practice questions for SHL numerical reasoning test for standard employer testingTRANSCRIPT
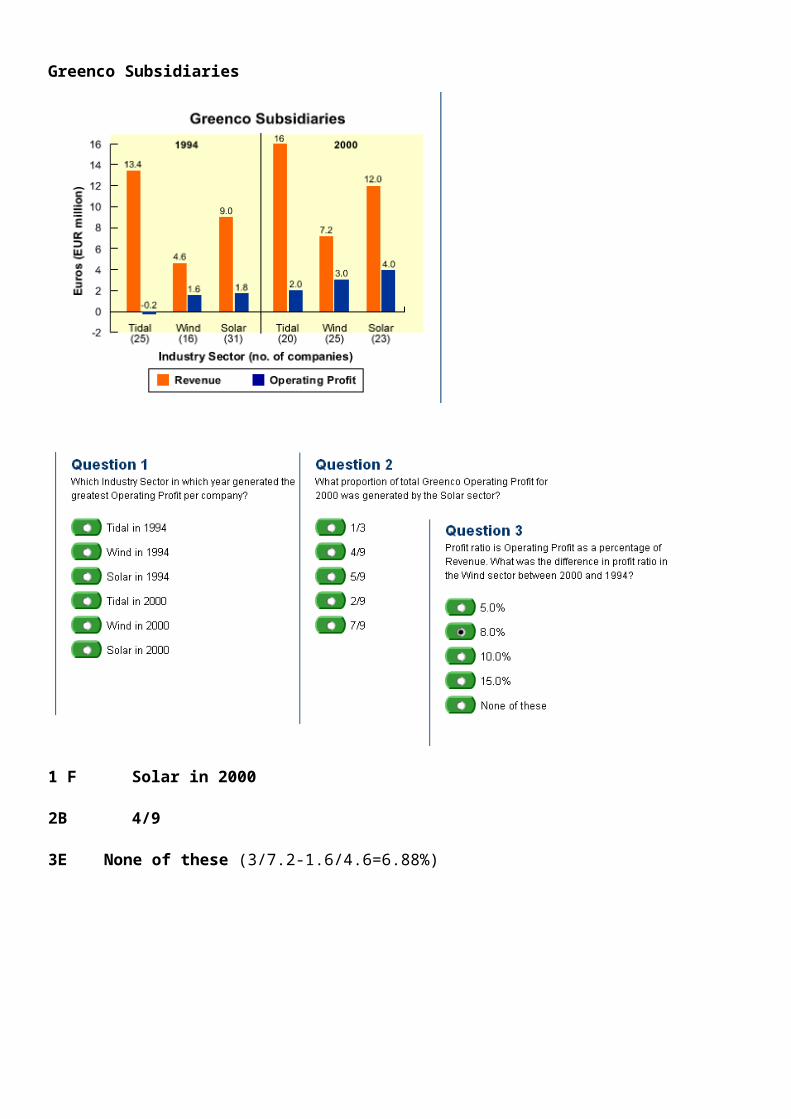
Greenco Subsidiaries
1 F Solar in 20002B 4/93E None of these (3/7.2-1.6/4.6=6.88%)
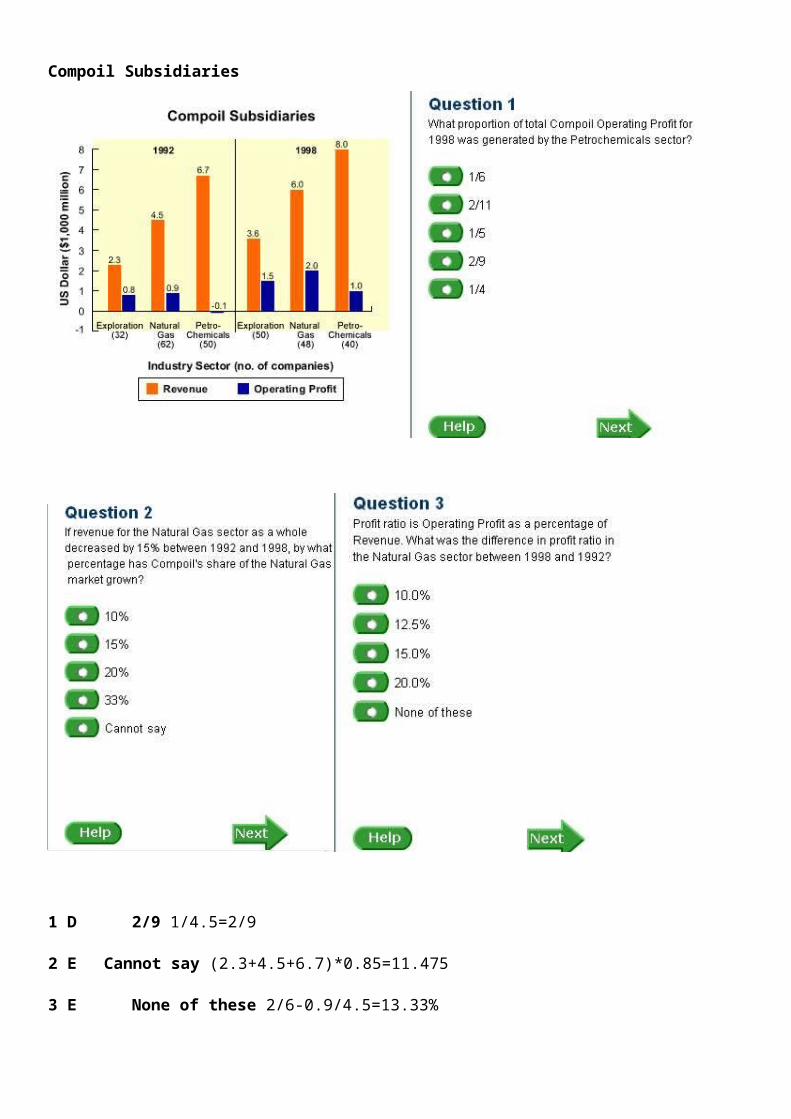
Compoil Subsidiaries
1 D 2/9 1/4.5=2/92 E Cannot say (2.3+4.5+6.7)*0.85=11.4753 E None of these 2/6-0.9/4.5=13.33%
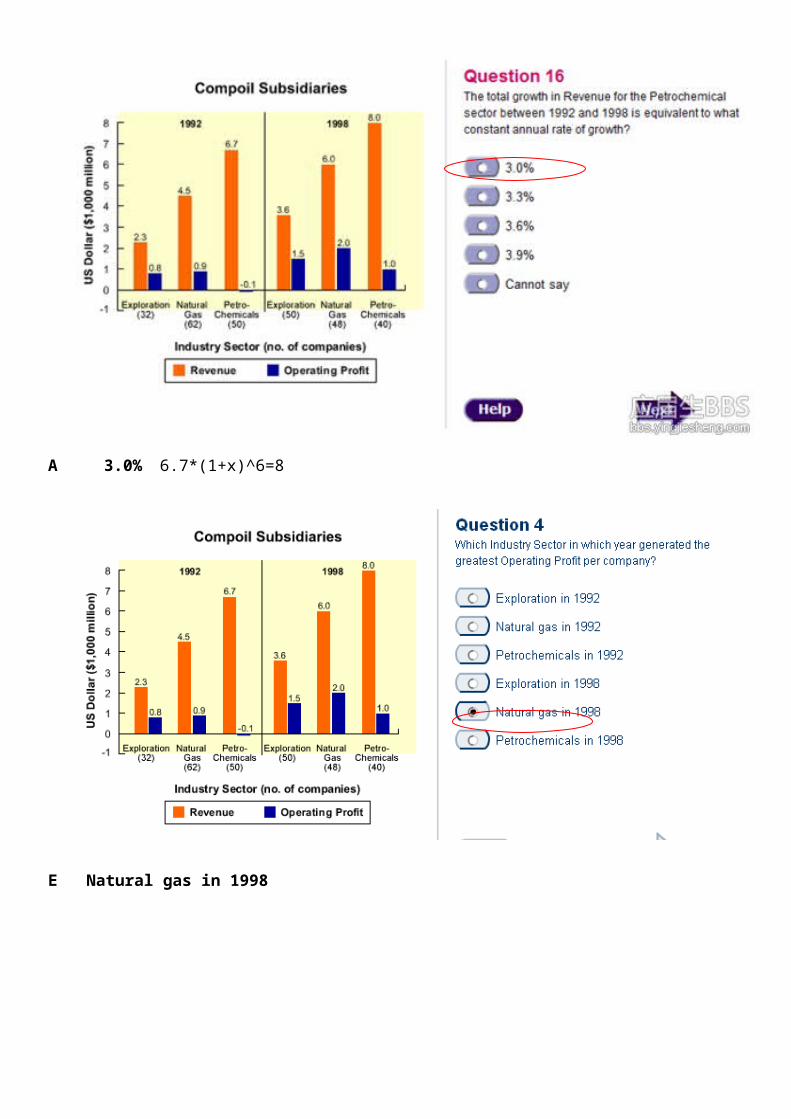
A 3.0% 6.7*(1+x)^6=8
E Natural gas in 1998
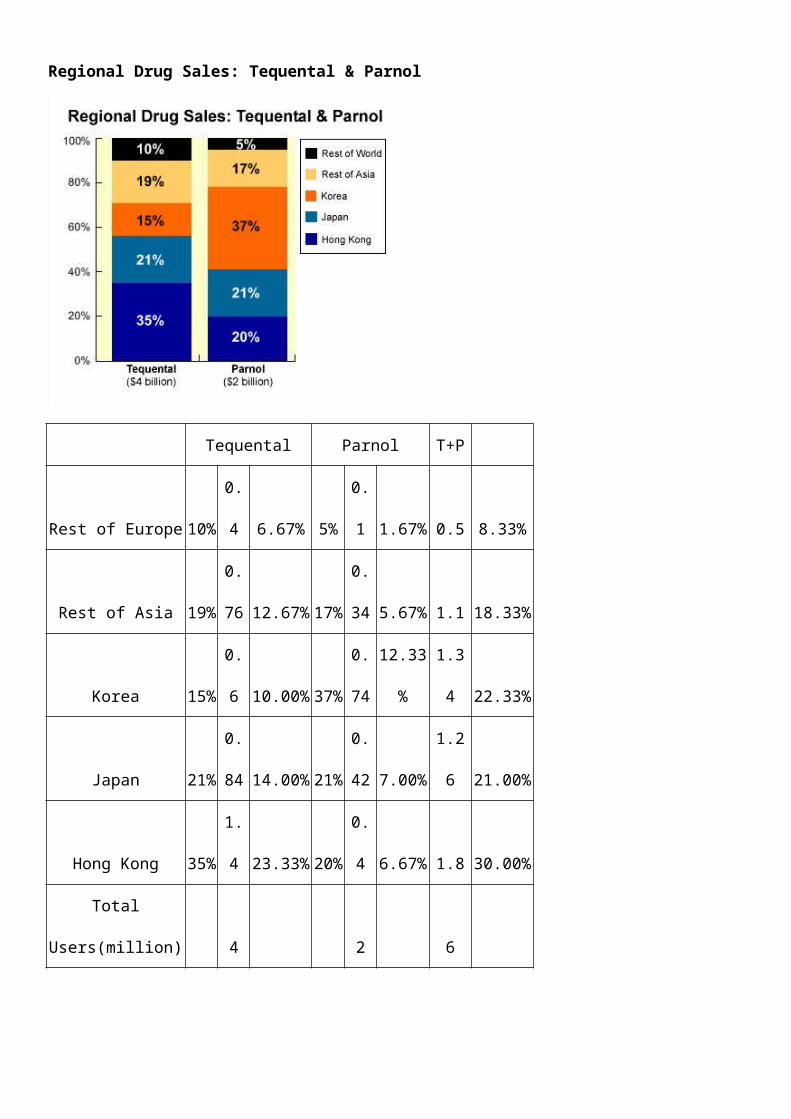
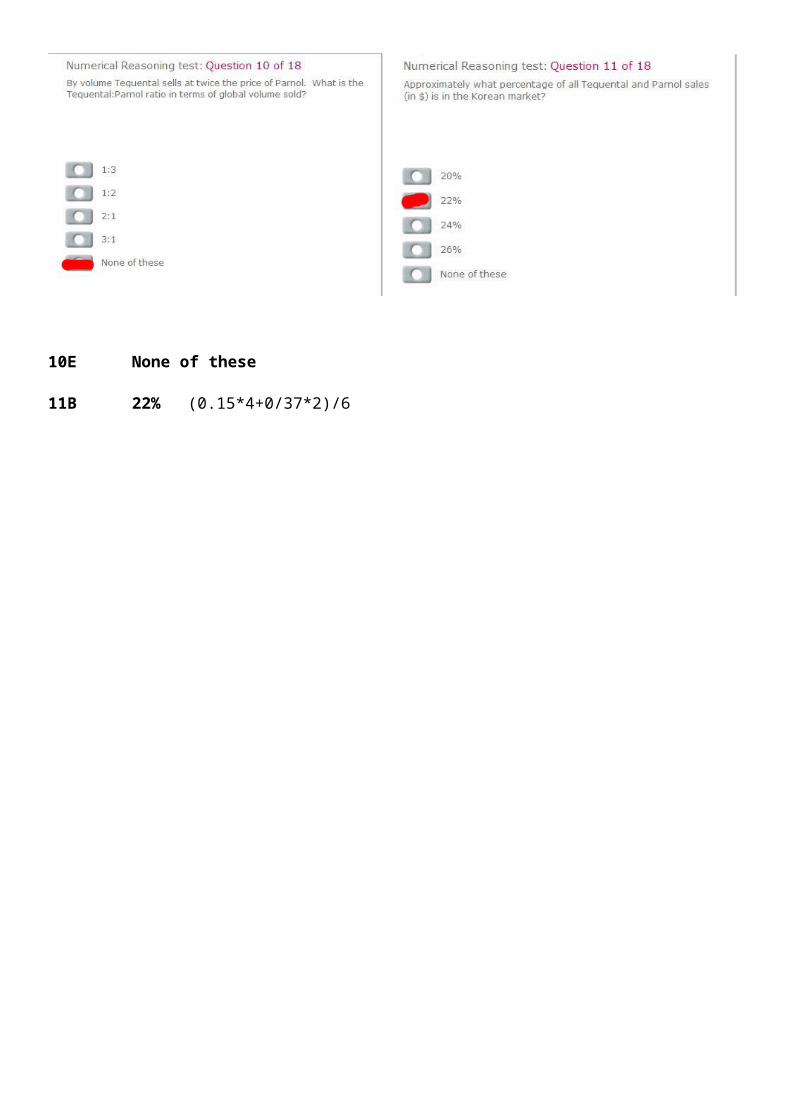
Regional Drug Sales: Tequental & Parnol
Tequental Parnol T+P Rest of Europe 10% 0.4 6.67% 5% 0.1 1.67% 0.5 8.33%
Rest of Asia 19% 0.76 12.67% 17% 0.34 5.67% 1.1 18.33%Korea 15% 0.6 10.00% 37% 0.74 12.33% 1.34 22.33%Japan 21% 0.84 14.00% 21% 0.42 7.00% 1.26 21.00%
Hong Kong 35% 1.4 23.33% 20% 0.4 6.67% 1.8 30.00%Total Users(million) 4 2 6
10E None of these11B 22% (0.15*4+0/37*2)/6
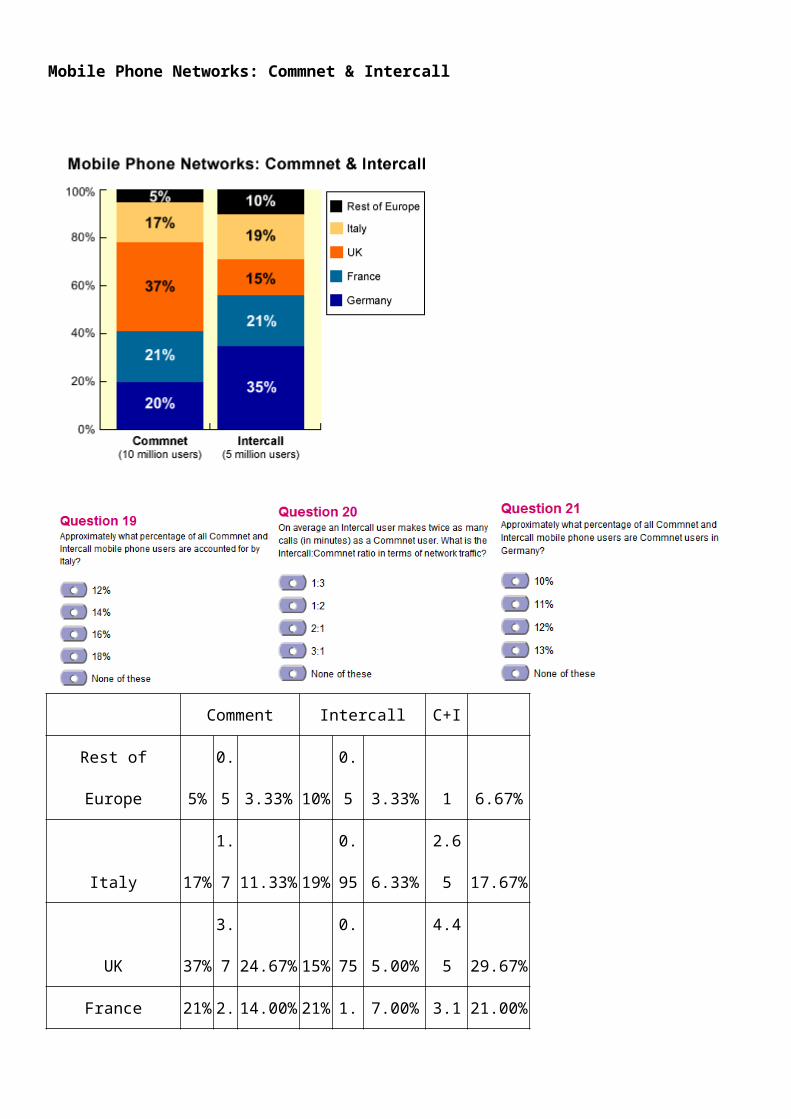
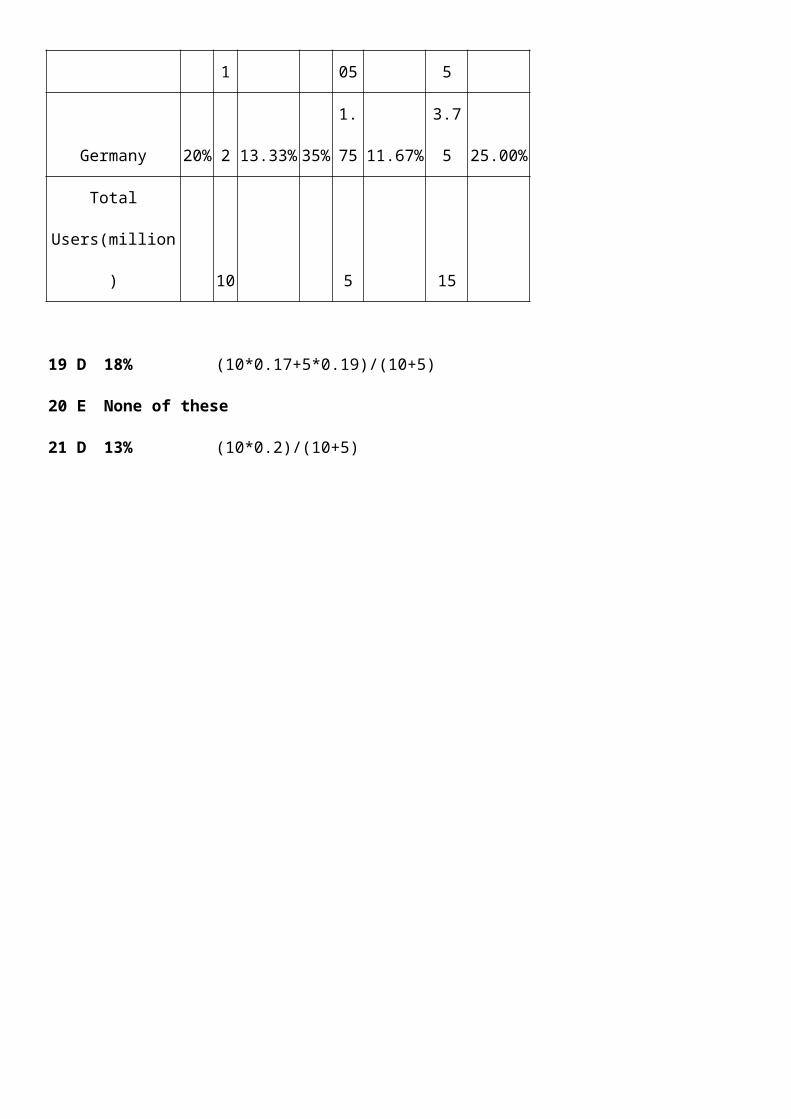
Mobile Phone Networks: Commnet & Intercall
Comment Intercall C+I Rest of Europe 5% 0.5 3.33% 10% 0.5 3.33% 1 6.67%
Italy 17% 1.7 11.33% 19% 0.95 6.33% 2.65 17.67%UK 37% 3.7 24.67% 15% 0.75 5.00% 4.45 29.67%
France 21% 2.1 14.00% 21% 1.05 7.00% 3.15 21.00%Germany 20% 2 13.33% 35% 1.75 11.67% 3.75 25.00%
Total Users(million) 10 5 15
19 D 18% (10*0.17+5*0.19)/(10+5)20 E None of these21 D 13% (10*0.2)/(10+5)
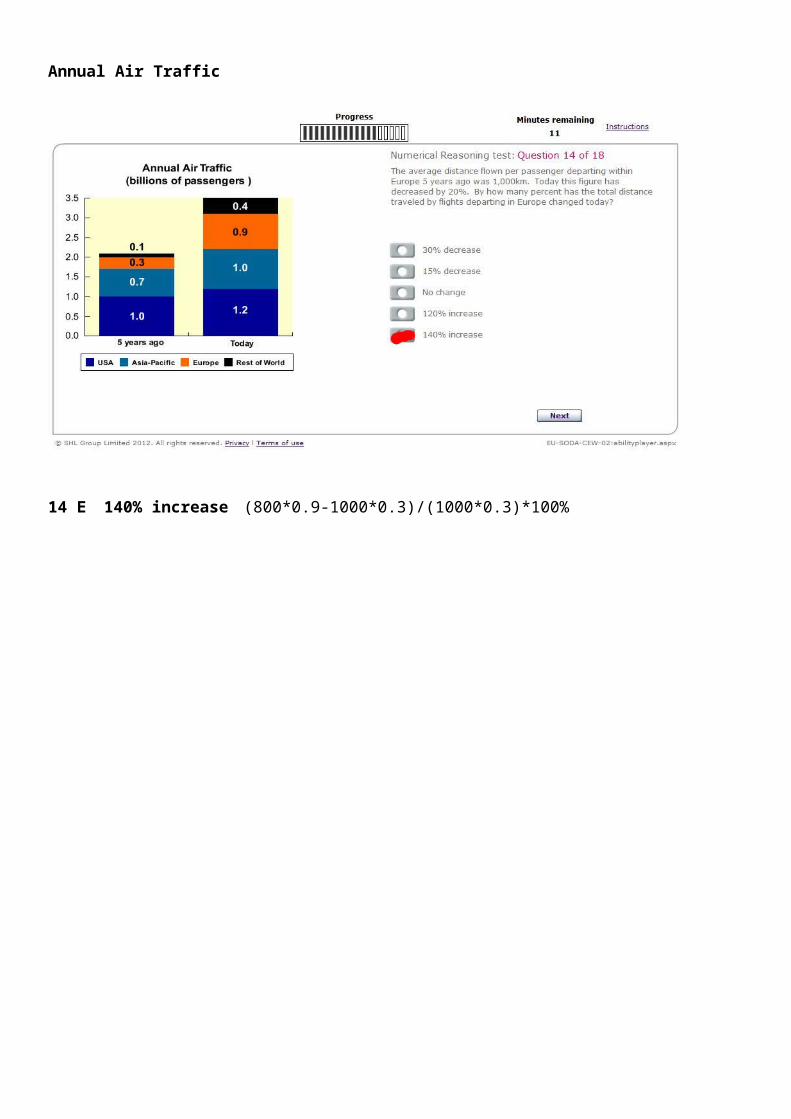
Annual Air Traffic
14 E 140% increase (800*0.9-1000*0.3)/(1000*0.3)*100%
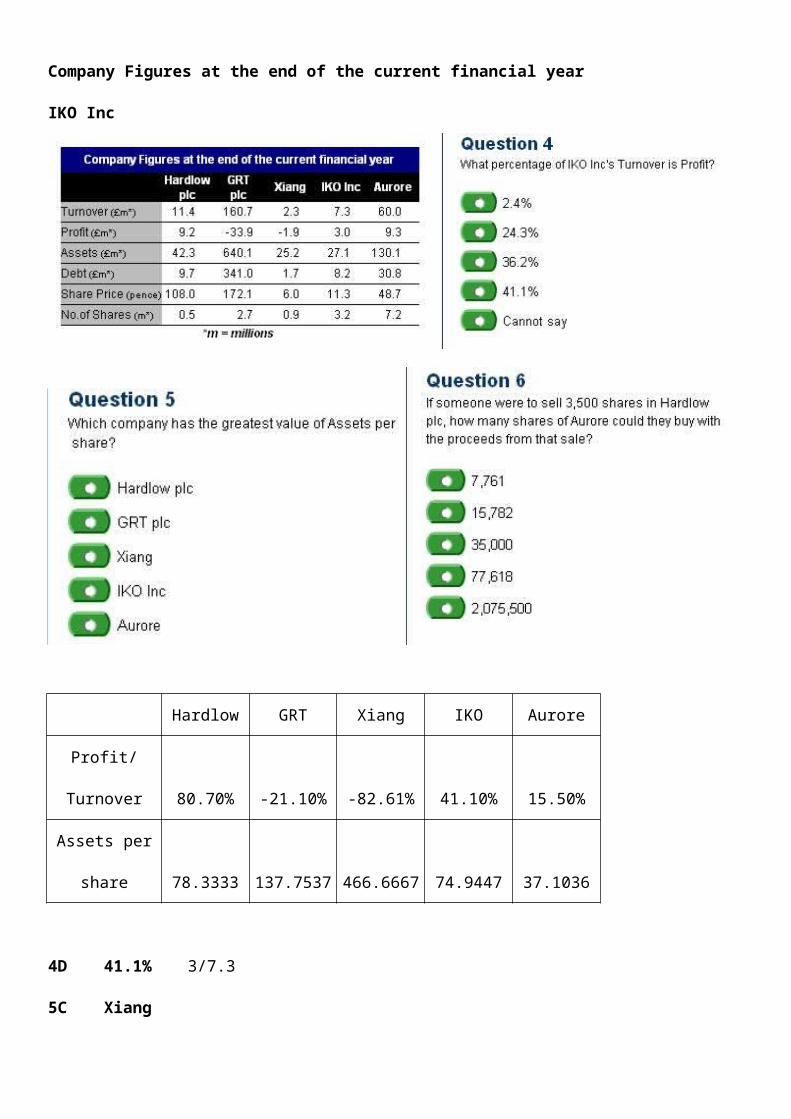
Company Figures at the end of the current financial yearIKO Inc
Hardlow GRT Xiang IKO AuroreProfit/Turnover 80.70% -21.10% -82.61% 41.10% 15.50%Assets per share 78.3333 137.7537 466.6667 74.9447 37.1036
4D 41.1% 3/7.35C Xiang6A 7,761 3500*108/48.7
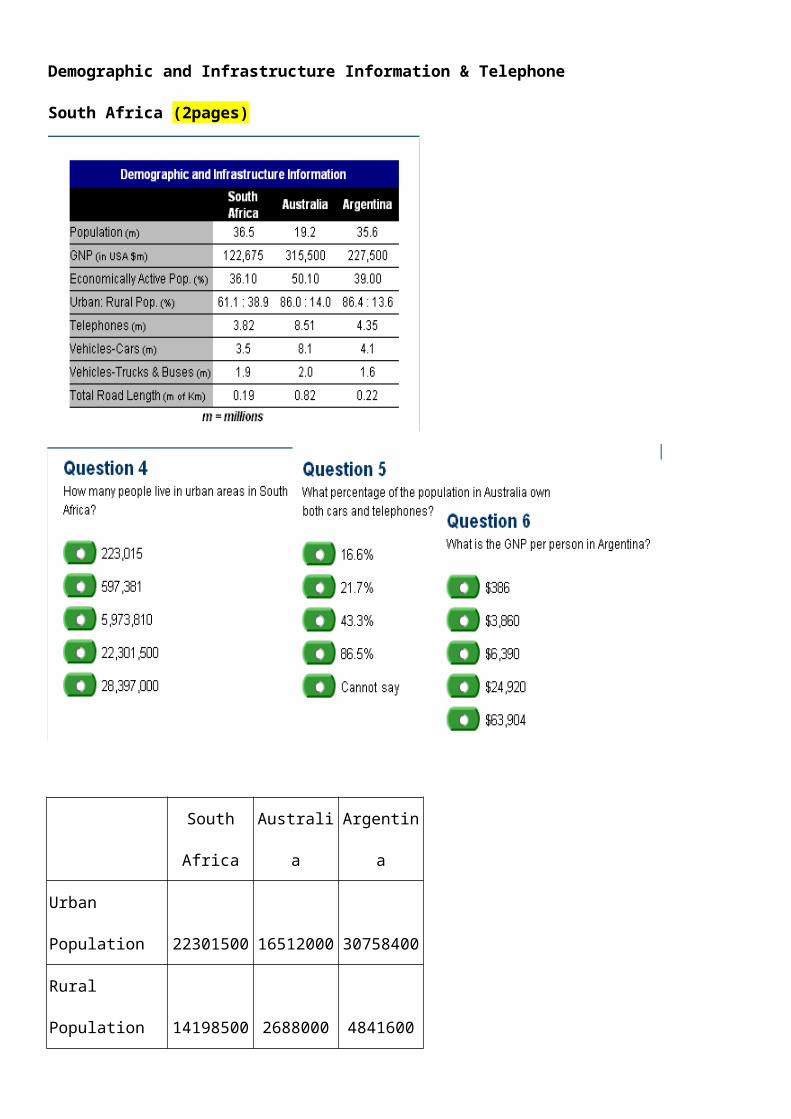
Demographic and Infrastructure Information & TelephoneSouth Africa (2pages)
South Africa Australia Argentina
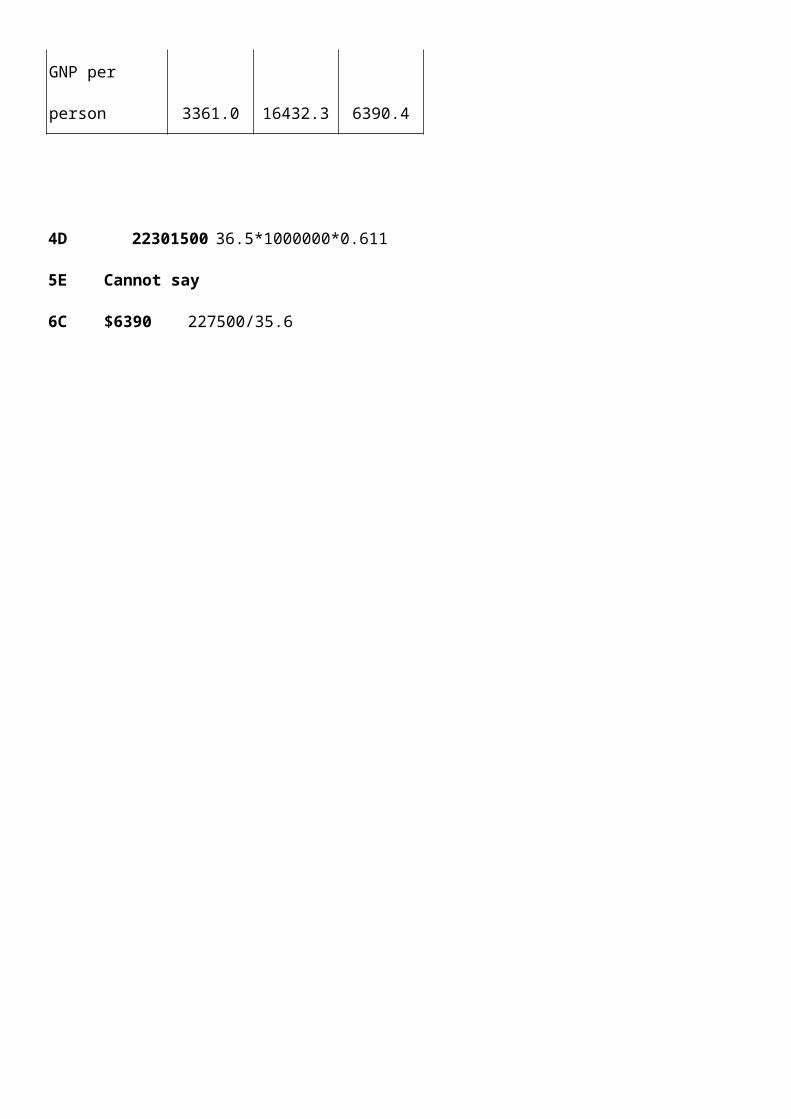
Urban Population 22301500 16512000 30758400Rural Population 14198500 2688000 4841600GNP per person 3361.0 16432.3 6390.4
4D 22301500 36.5*1000000*0.6115E Cannot say6C $6390 227500/35.6
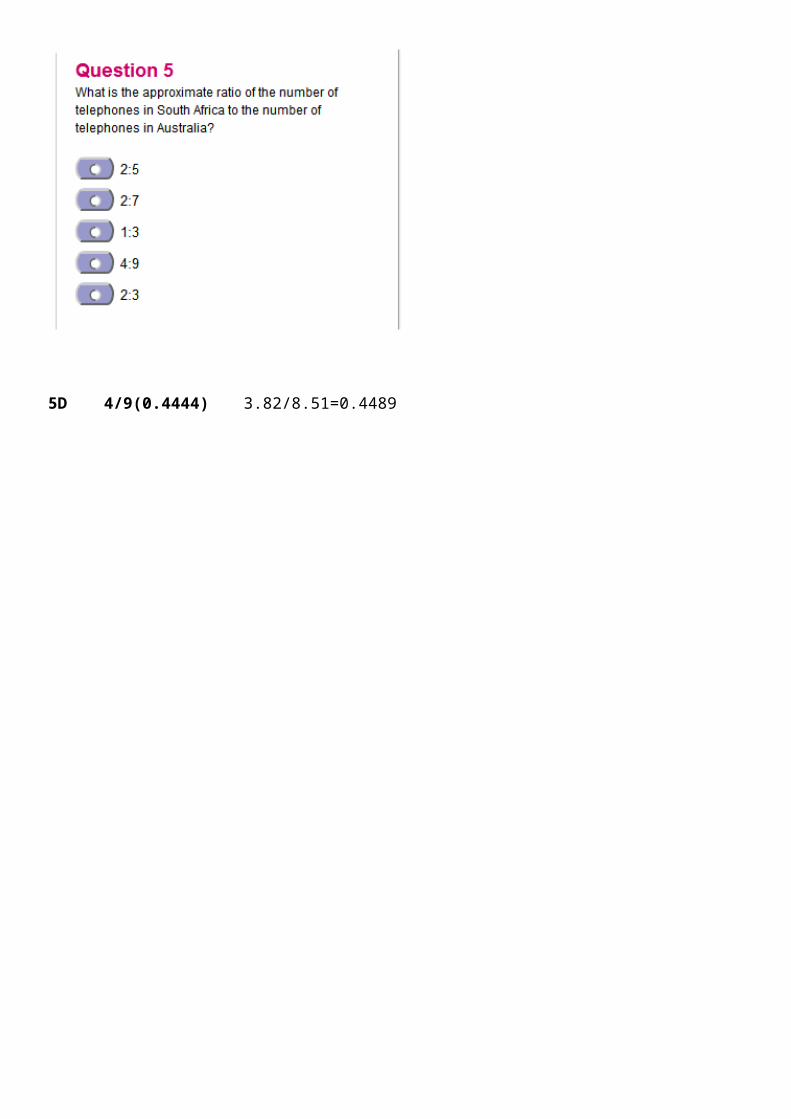
5D 4/9(0.4444) 3.82/8.51=0.4489

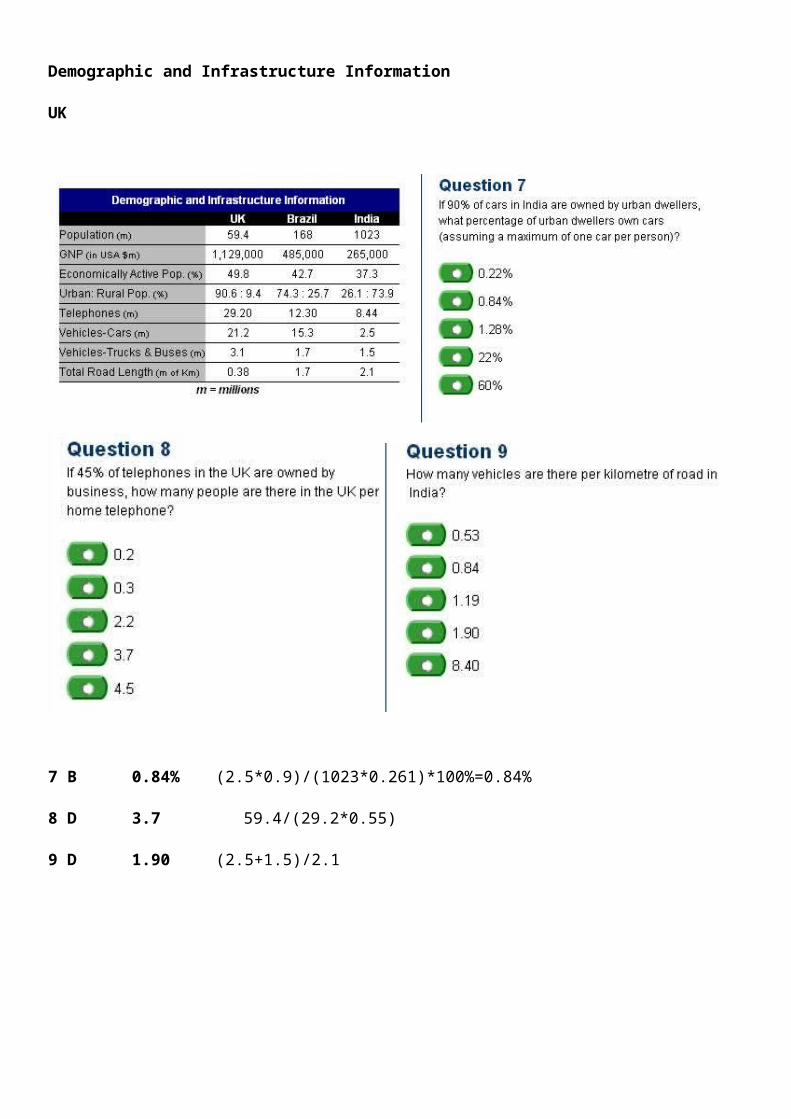
Demographic and Infrastructure InformationUK
7 B 0.84% (2.5*0.9)/(1023*0.261)*100%=0.84%8 D 3.7 59.4/(29.2*0.55)9 D 1.90 (2.5+1.5)/2.1
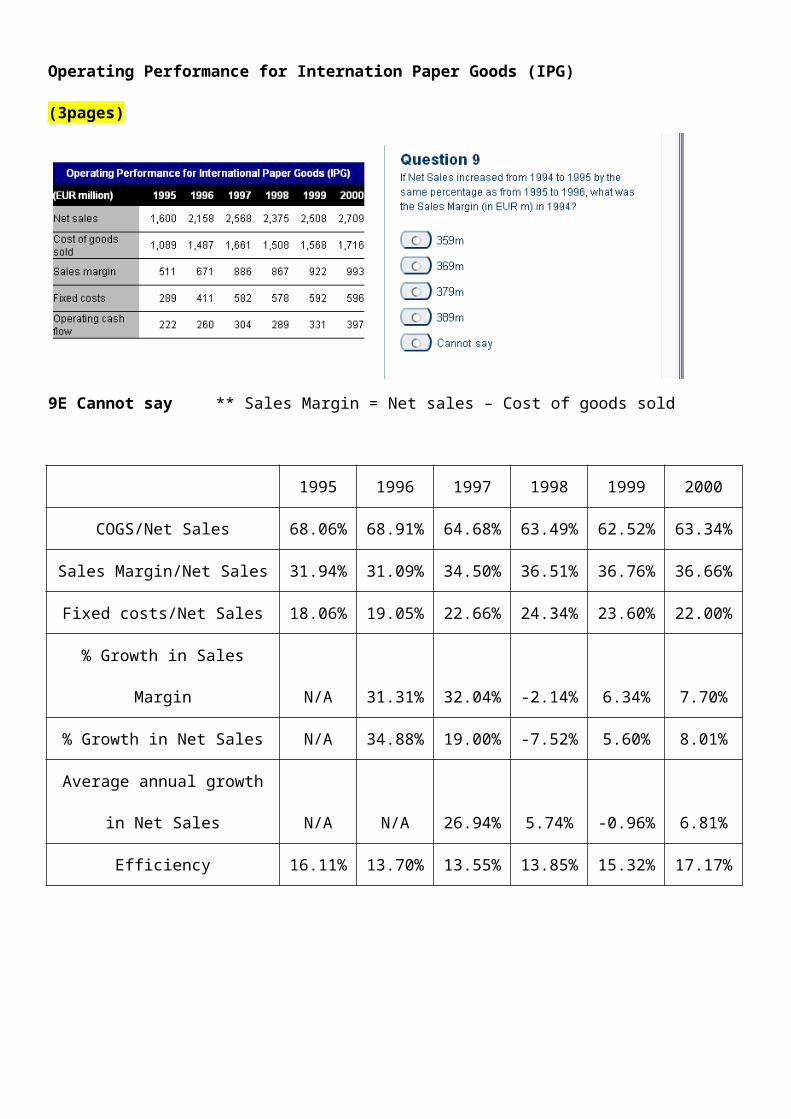
Operating Performance for Internation Paper Goods (IPG)(3pages)
9E Cannot say ** Sales Margin = Net sales – Cost of goods sold
1995 1996 1997 1998 1999 2000
COGS/Net Sales 68.06% 68.91% 64.68% 63.49% 62.52% 63.34%Sales Margin/Net Sales 31.94% 31.09% 34.50% 36.51% 36.76% 36.66%
Fixed costs/Net Sales 18.06% 19.05% 22.66% 24.34% 23.60% 22.00%% Growth in Sales Margin N/A 31.31% 32.04% -2.14% 6.34% 7.70%
% Growth in Net Sales N/A 34.88% 19.00% -7.52% 5.60% 8.01%Average annual growth in Net
Sales N/A N/A 26.94% 5.74% -0.96% 6.81%Efficiency 16.11% 13.70% 13.55% 13.85% 15.32% 17.17%
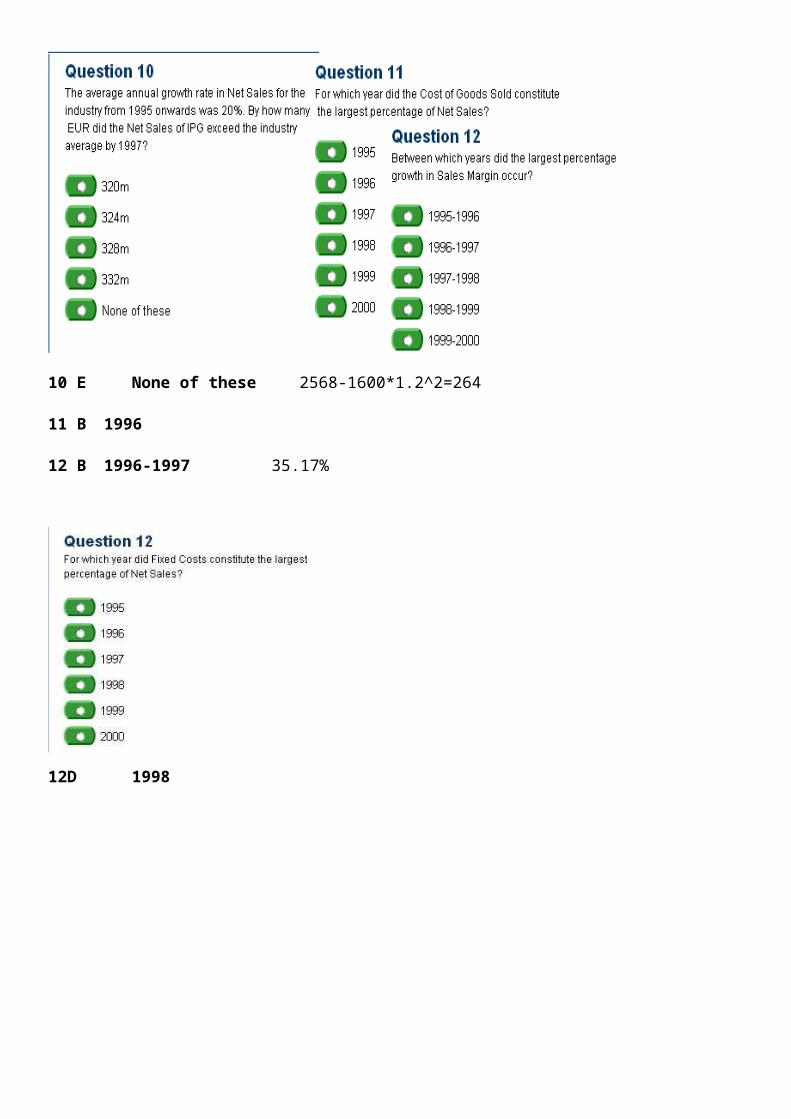
10 E None of these 2568-1600*1.2^2=26411 B 199612 B 1996-1997 35.17%
12D 1998
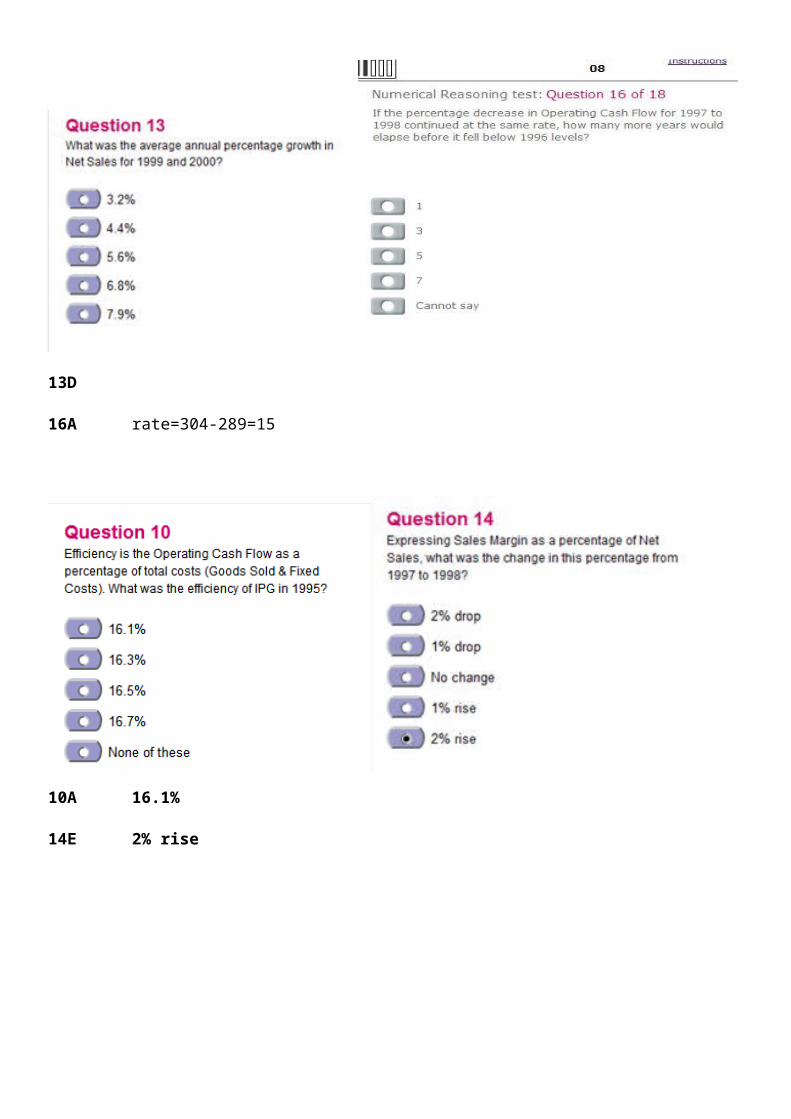
13D16A rate=304-289=15
10A 16.1%14E 2% rise
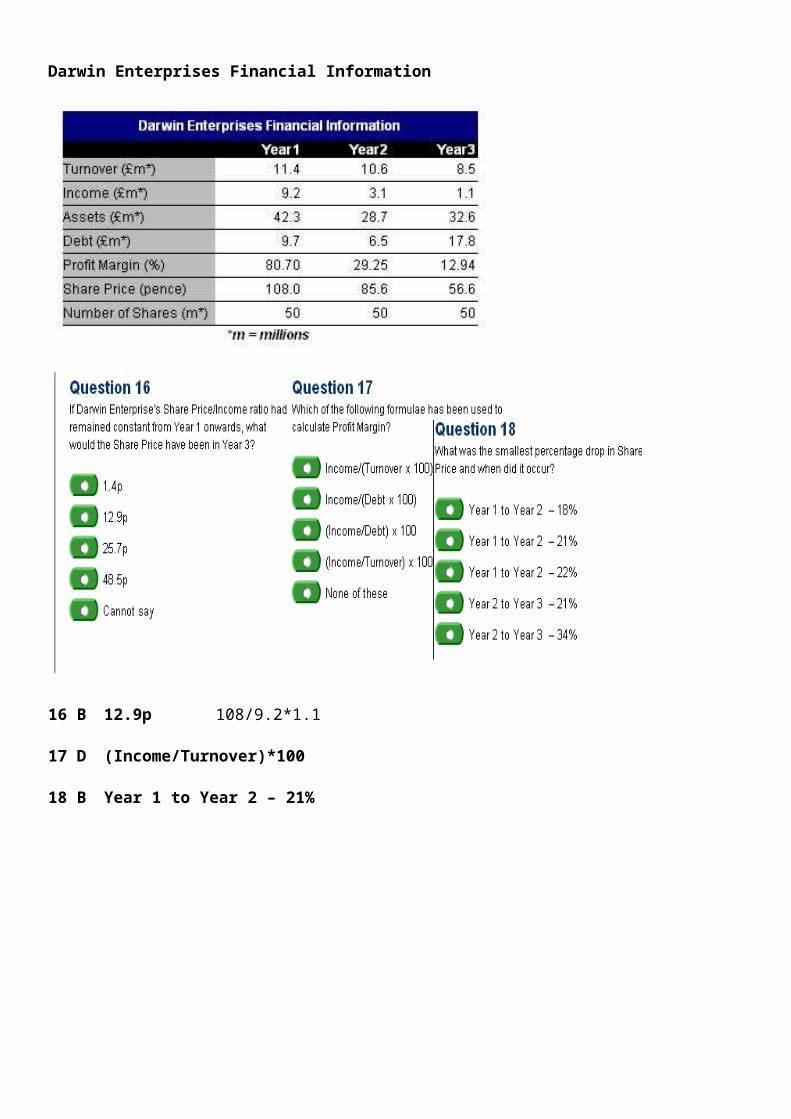
Darwin Enterprises Financial Information
16 B 12.9p 108/9.2*1.117 D (Income/Turnover)*10018 B Year 1 to Year 2 – 21%
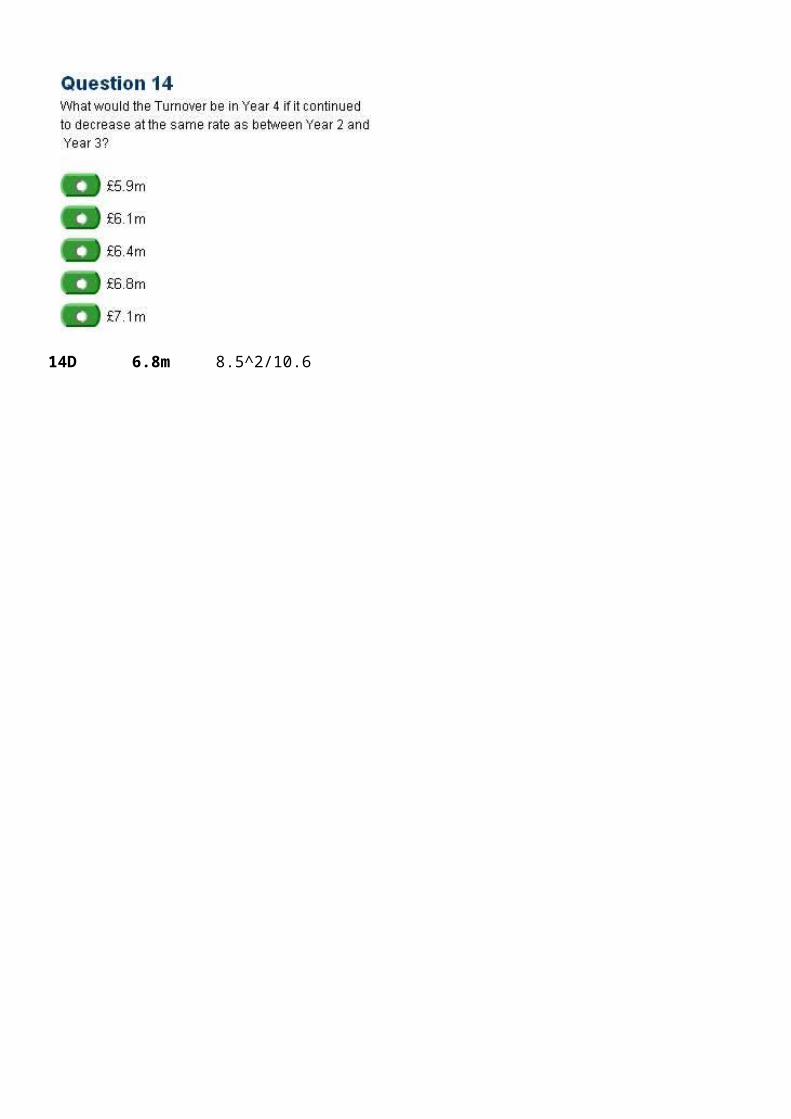
14D 6.8m 8.5^2/10.6
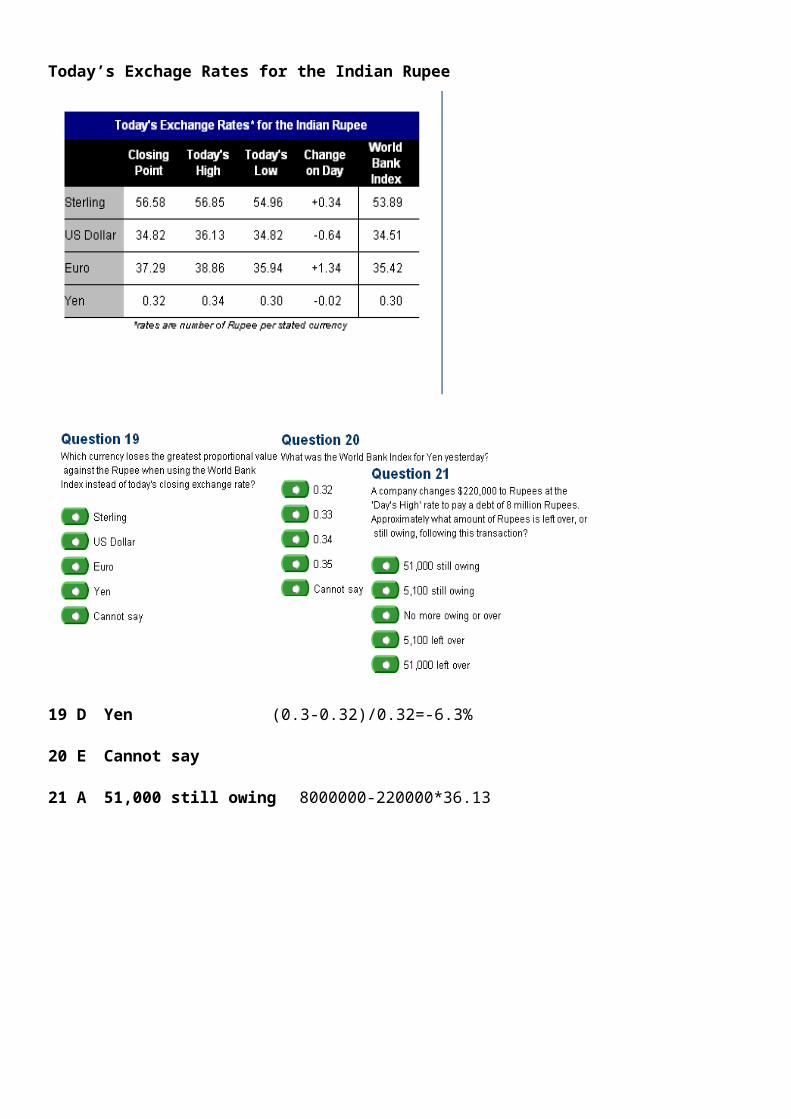
Today’s Exchage Rates for the Indian Rupee
19 D Yen (0.3-0.32)/0.32=-6.3%20 E Cannot say21 A 51,000 still owing 8000000-220000*36.13
20D 0.32 0.32/0.3=0.34/x
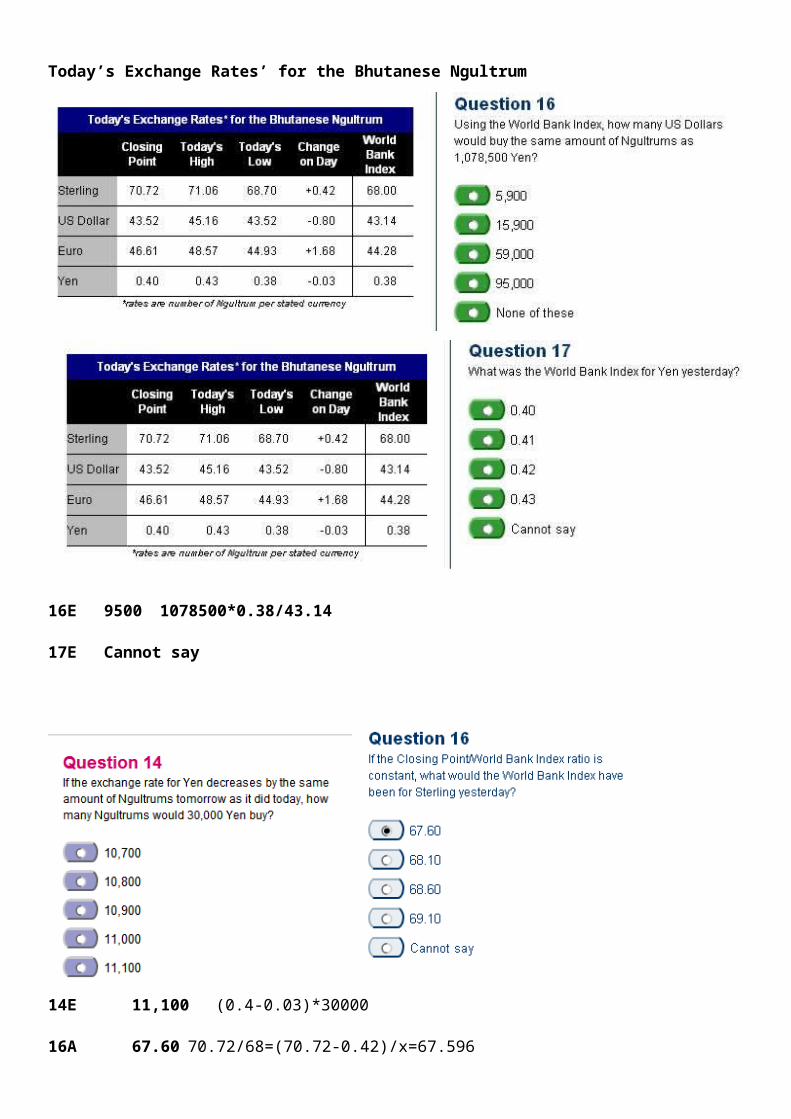
Today’s Exchange Rates’ for the Bhutanese Ngultrum
16E9500 1078500*0.38/43.1417ECannot say
14E 11,100 (0.4-0.03)*3000016A 67.60 70.72/68=(70.72-0.42)/x=67.596
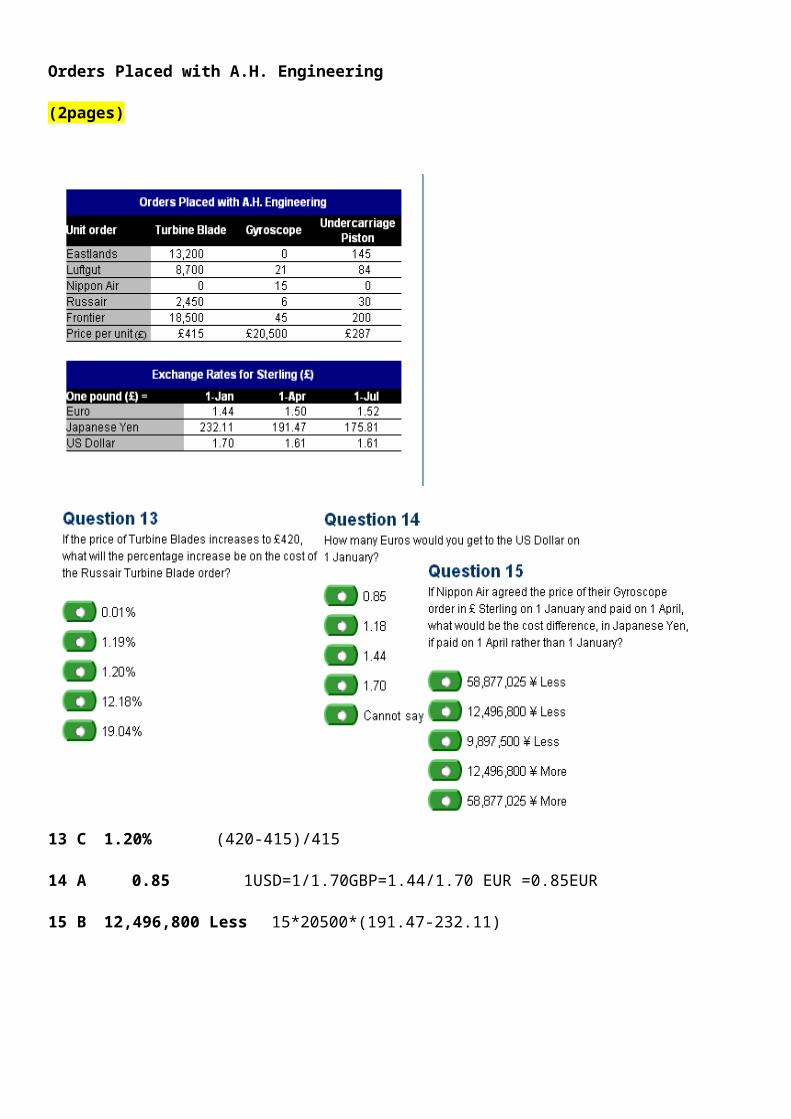
Orders Placed with A.H. Engineering(2pages)
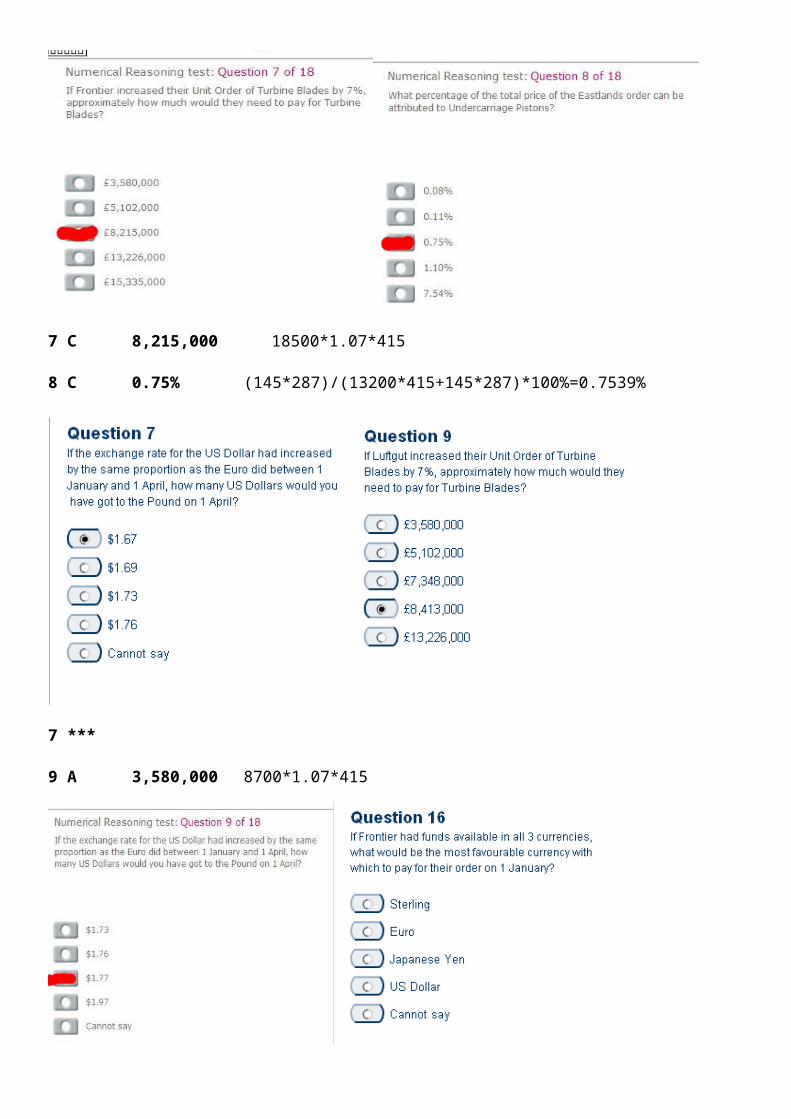
13 C 1.20% (420-415)/41514 A 0.85 1USD=1/1.70GBP=1.44/1.70 EUR =0.85EUR15 B 12,496,800 Less 15*20500*(191.47-232.11)
7 C 8,215,000 18500*1.07*4158 C 0.75% (145*287)/(13200*415+145*287)*100%=0.7539%
7 ***9 A 3,580,000 8700*1.07*415
9 C $1.7716 E Cannot say
因为不知道它 3种货币的持有量,即 funds的数额,所以用什么货币支付都一样,我选的 E cannot
say
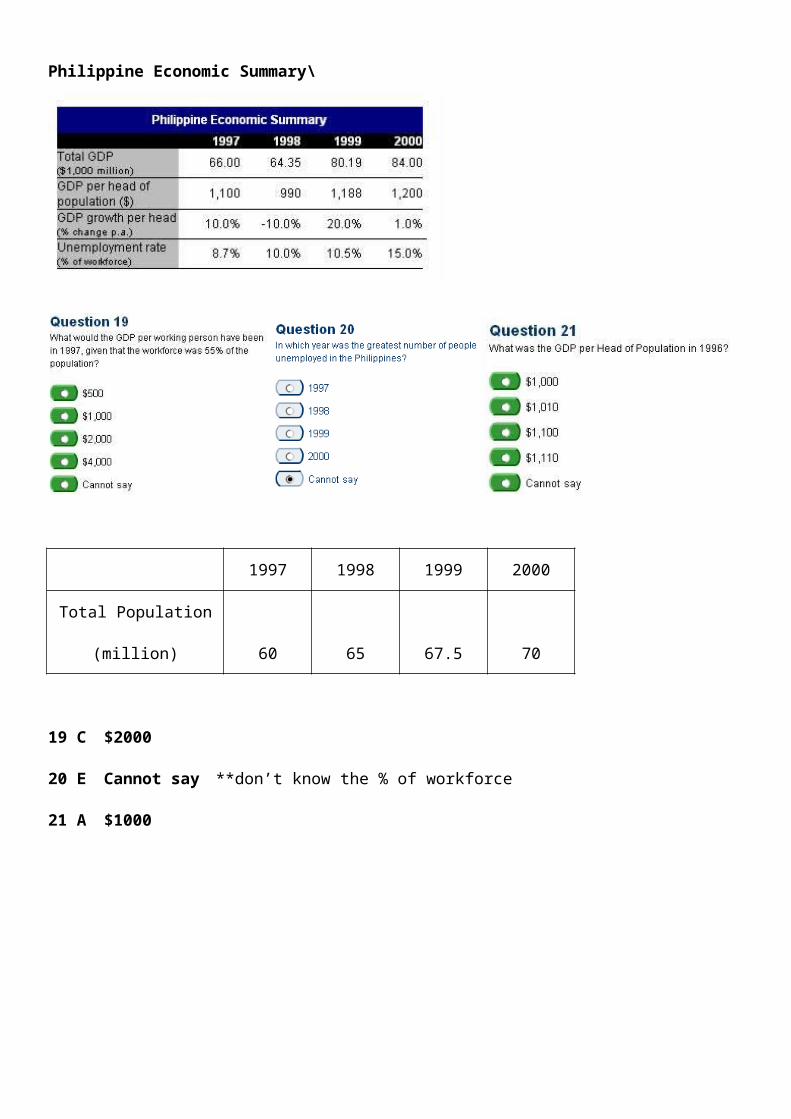
Philippine Economic Summary\
1997 1998 1999 2000Total Population (million) 60 65 67.5 70
19 C $200020 E Cannot say **don’t know the % of workforce21 A $1000

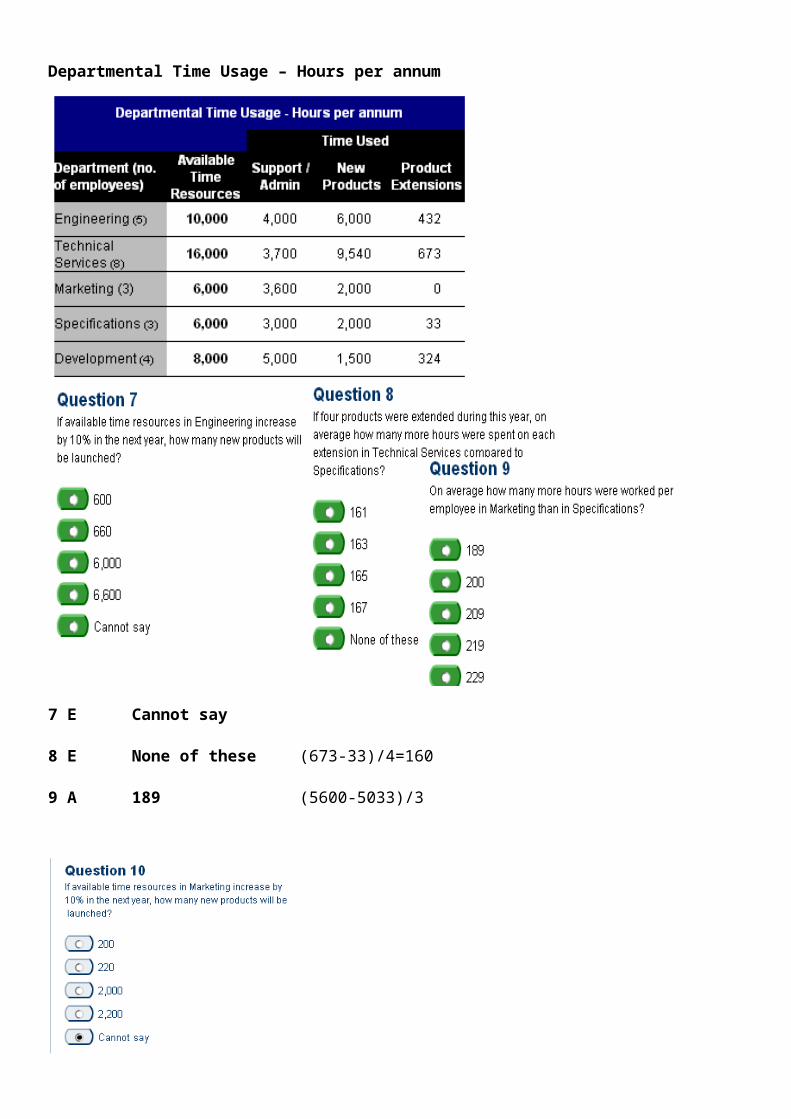
Departmental Time Usage – Hours per annum
7 E Cannot say8 E None of these (673-33)/4=1609 A 189 (5600-5033)/3
10 E Cannot say
因为 available time resources与 new products的数量没有告诉关系,我选的 E cannot say
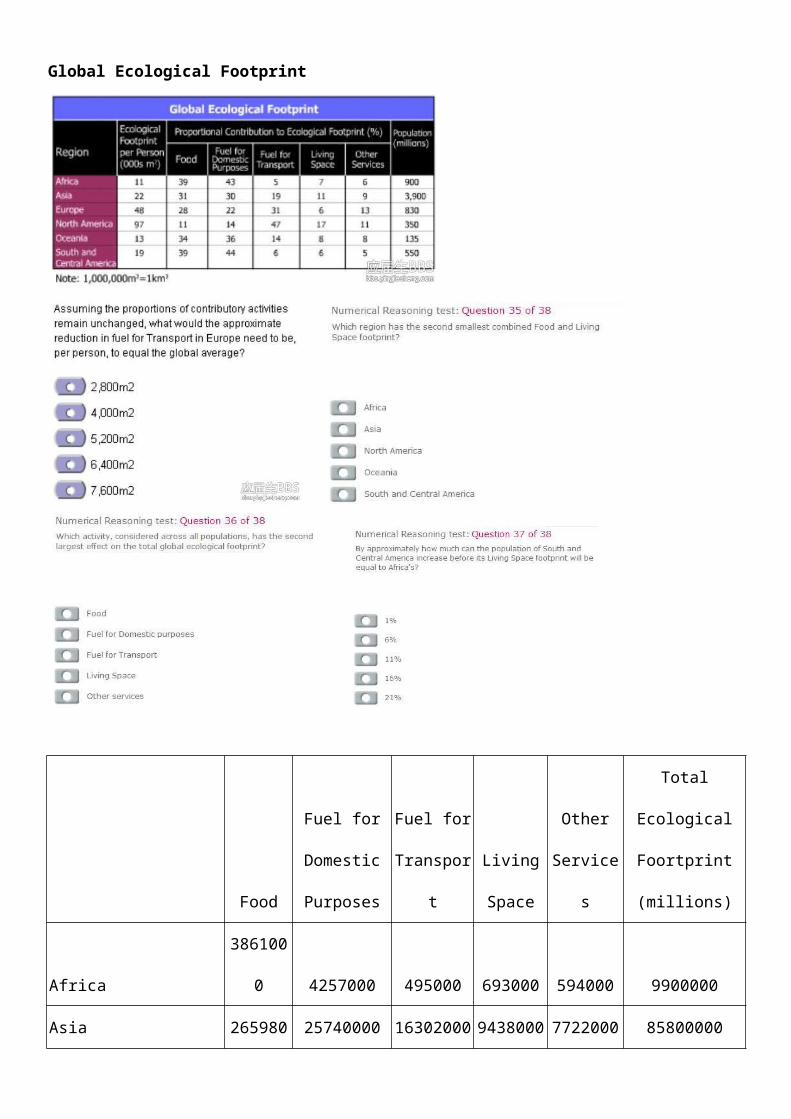
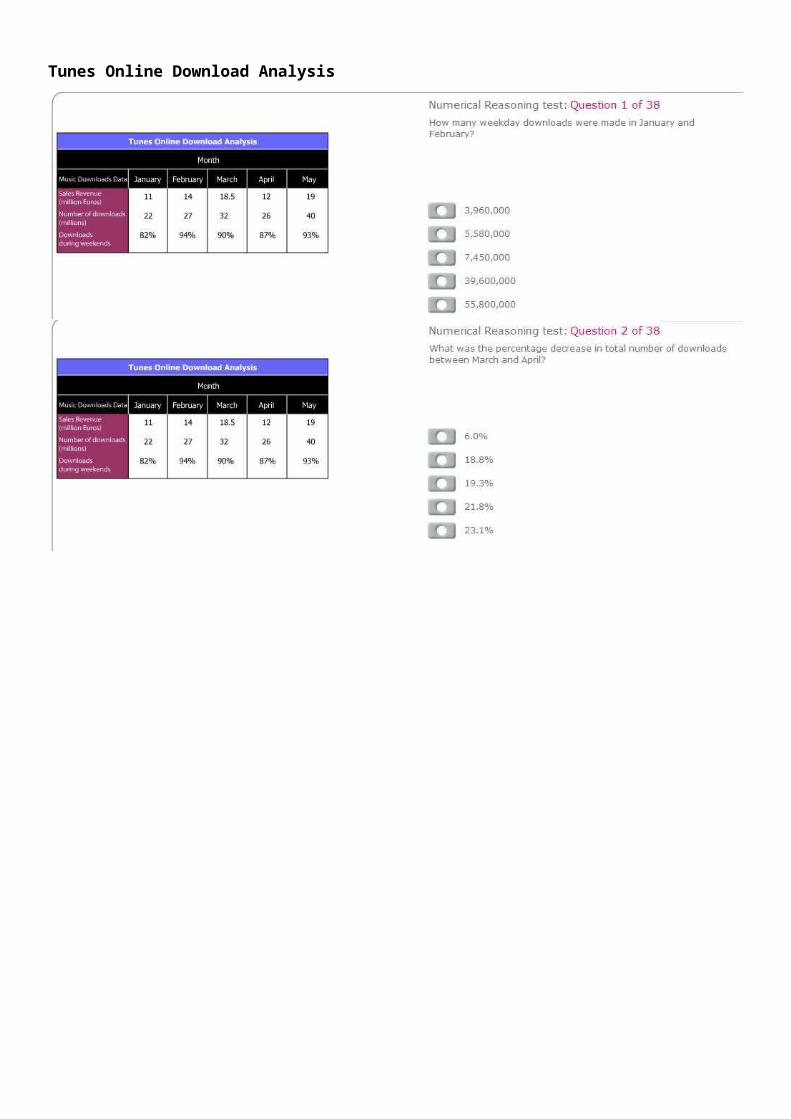
Global Ecological Footprint
Food
Fuel for Domestic Purposes
Fuel for Transport
Living Space
Other Services
Total Ecological Foortprint (millions)
Africa 3861000 4257000 495000 693000 594000 9900000Asia 26598000 25740000 16302000 9438000 7722000 85800000Europe 11155200 8764800 12350400 2390400 5179200 39840000North America 3734500 4753000 15956500 5771500 3734500 33950000Oceania 596700 631800 245700 140400 140400 1755000South and Central America 4075500 4598000 627000 627000 522500 10450000 50020900 48744600 45976600 19060300 17892600 181695000 27.53% 26.83% 25.30% 10.49% 9.85% 34 A 2800 48000*(0.31-0.253)35 A Africa36 B Fuel for Domestic purposes37 C 11% 693000/627000-1

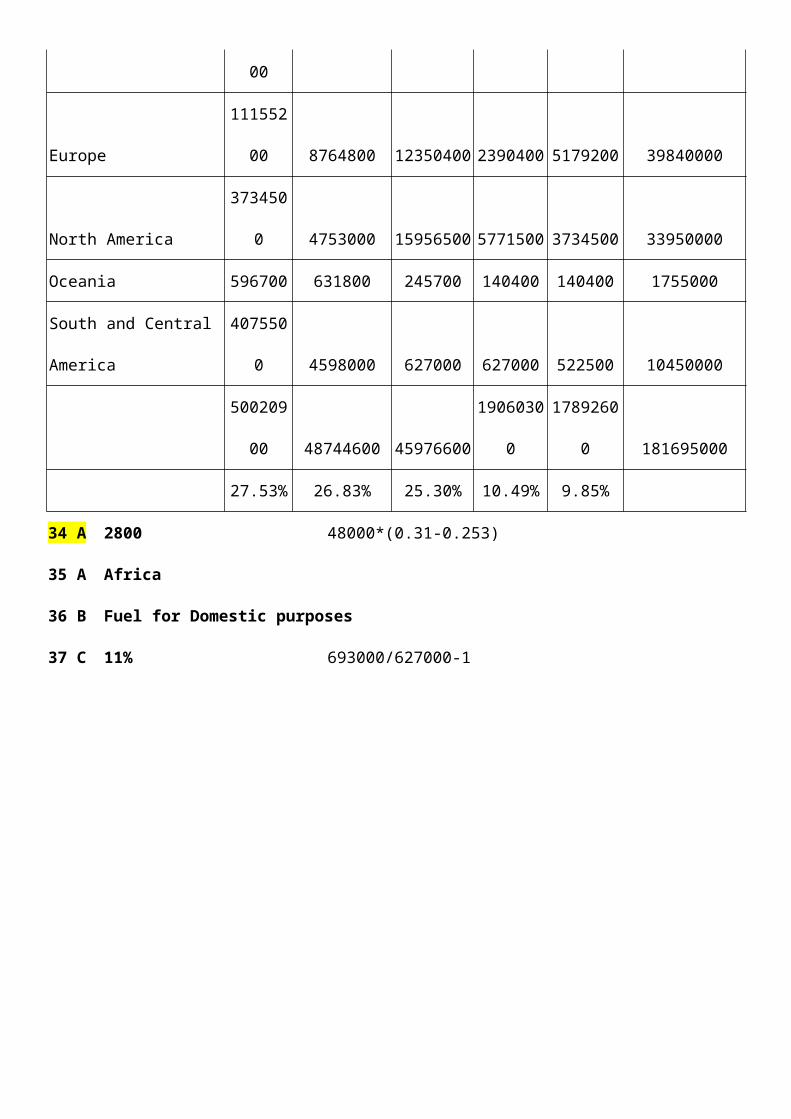
Amount Spent on Computer Imports
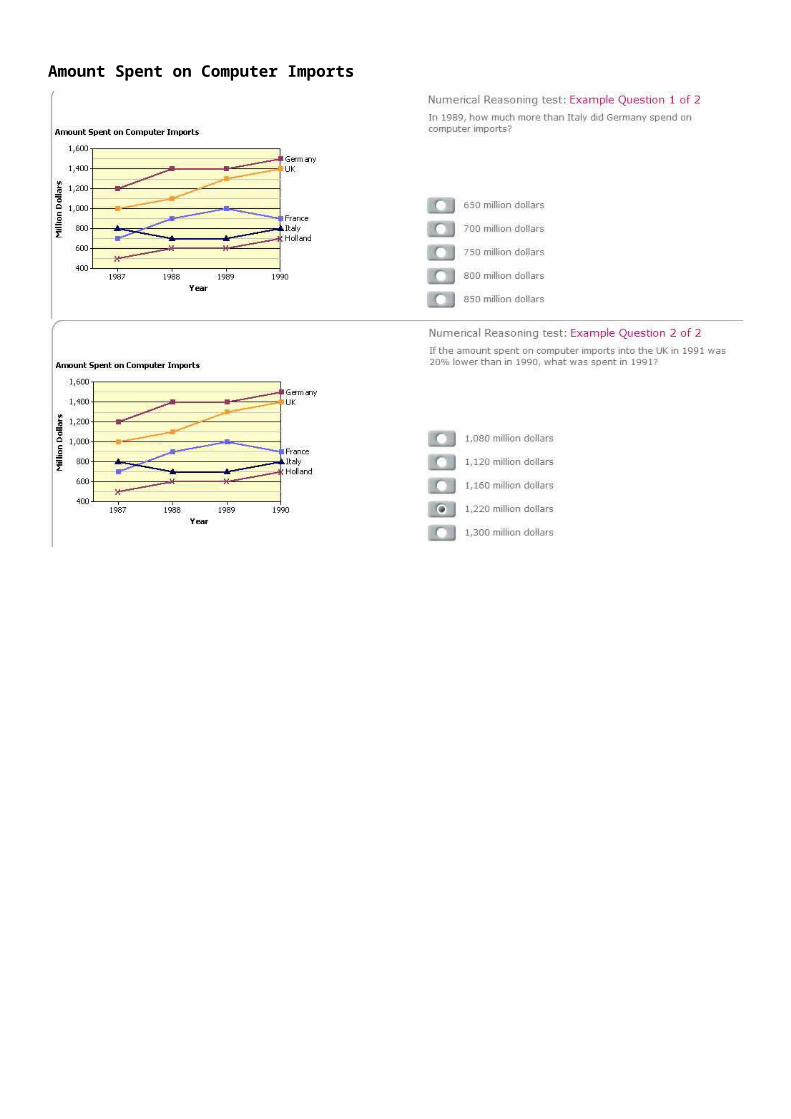
Tunes Online Download Analysis
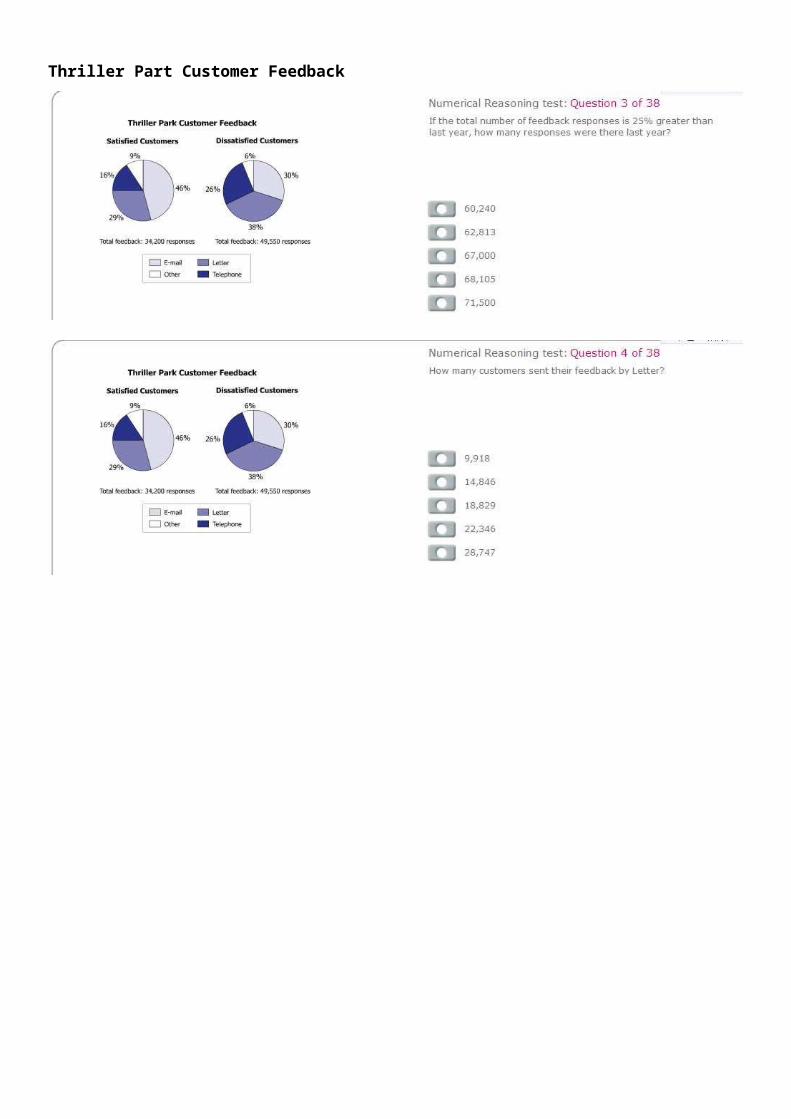
Thriller Part Customer Feedback

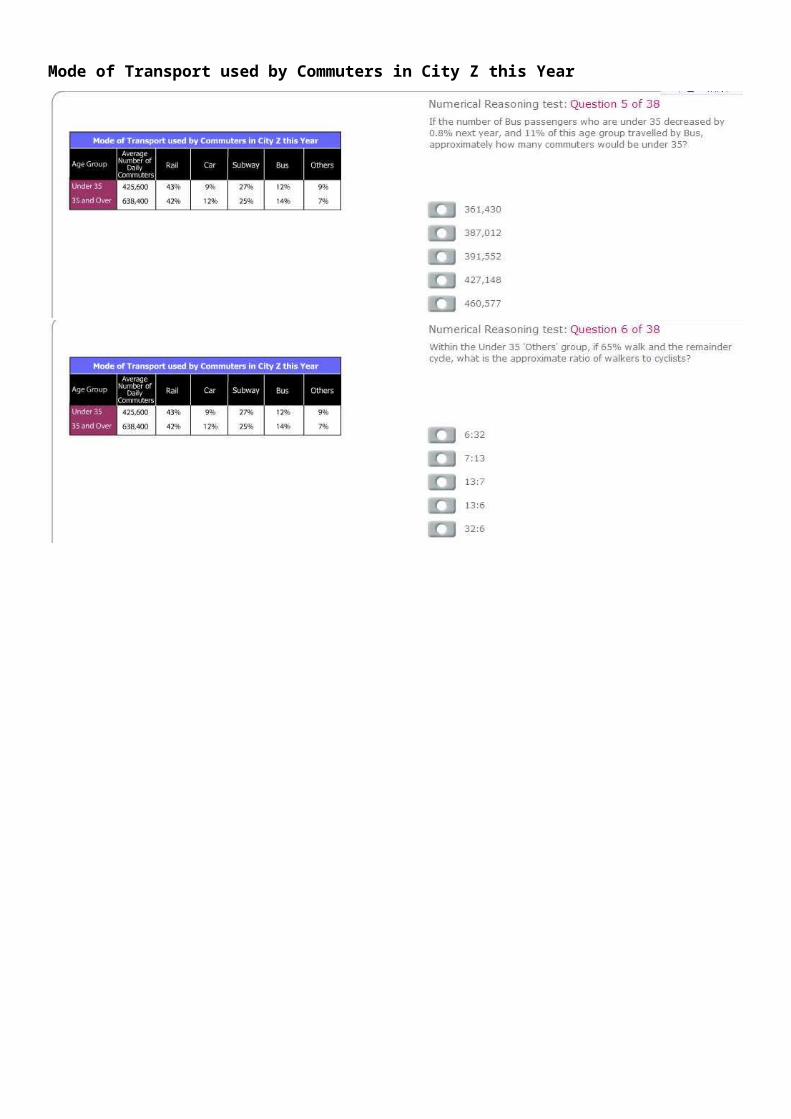
Mode of Transport used by Commuters in City Z this Year
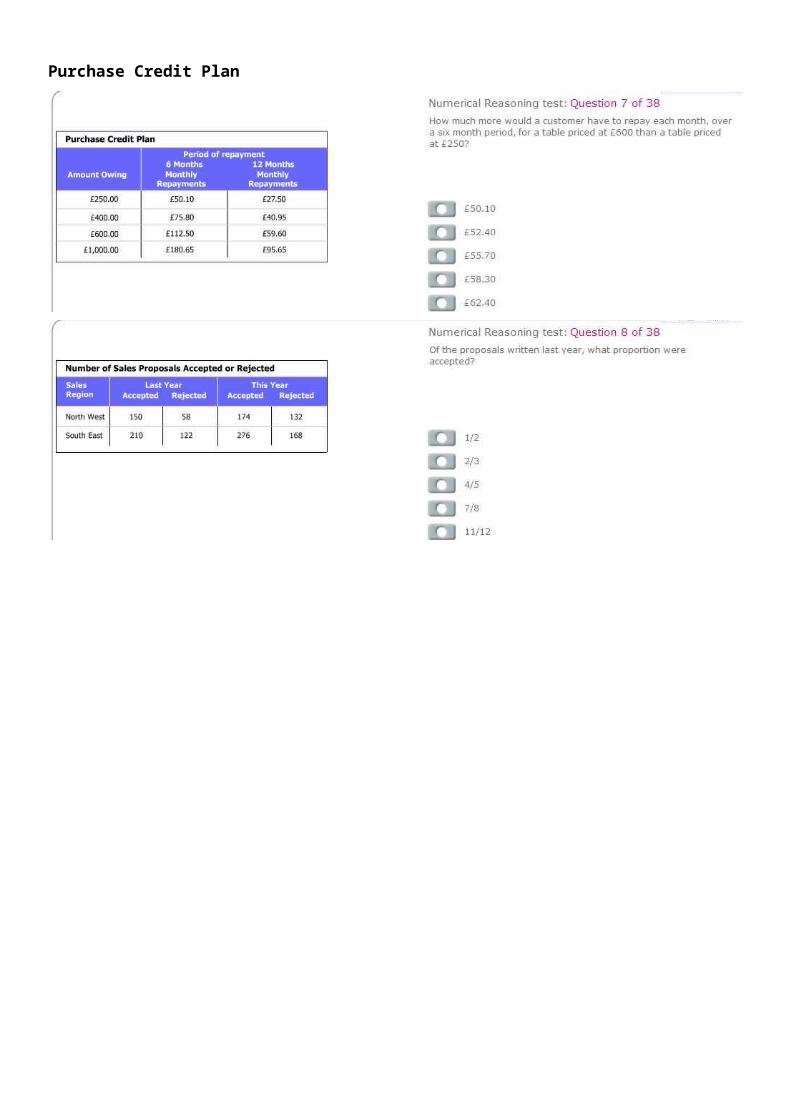
Purchase Credit Plan
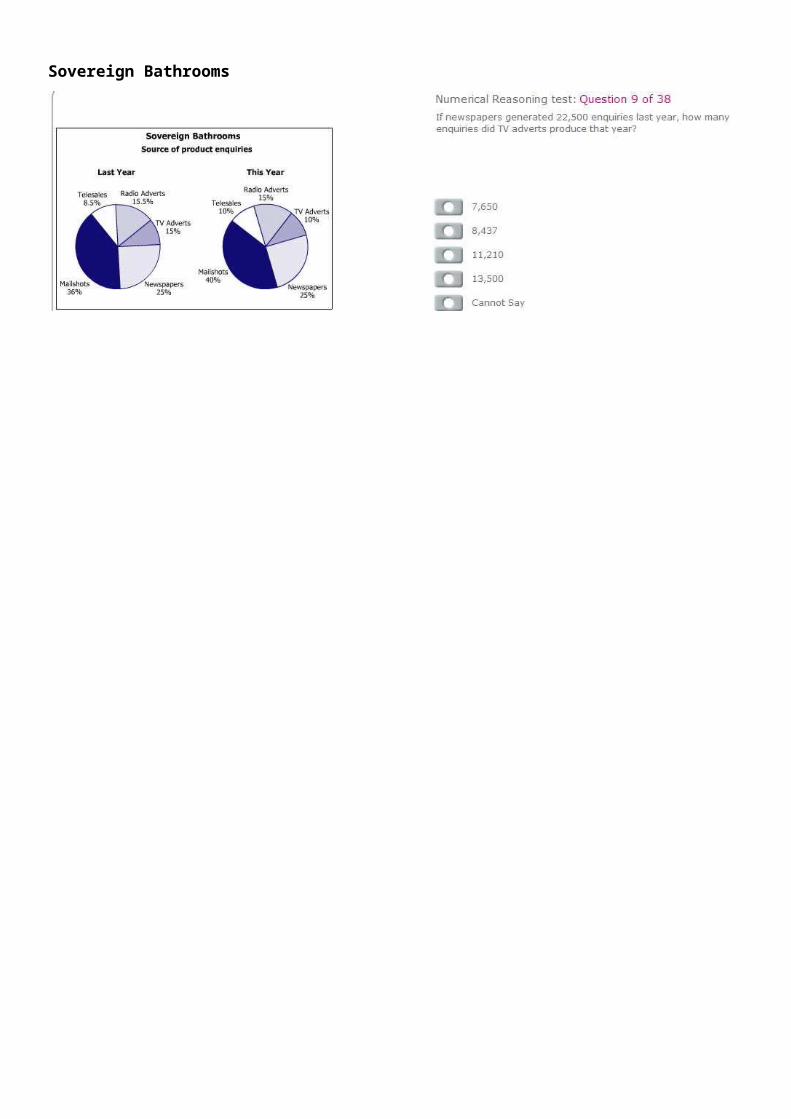
Sovereign Bathrooms

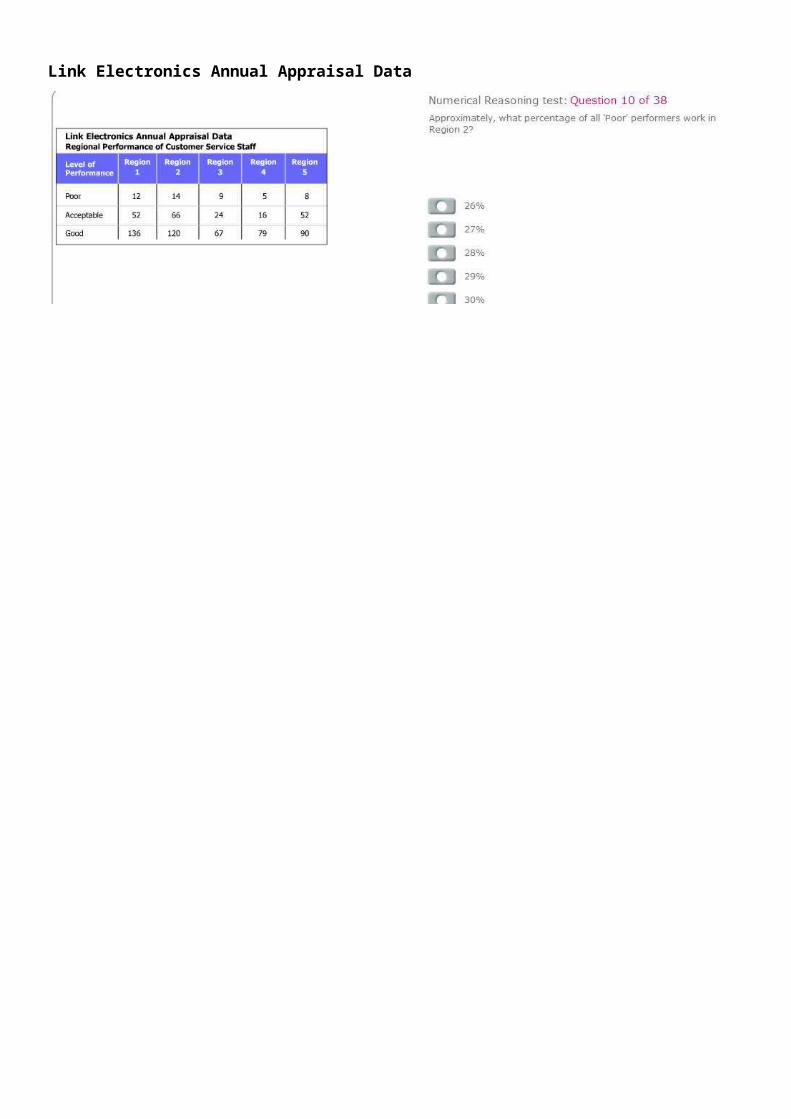
Link Electronics Annual Appraisal Data
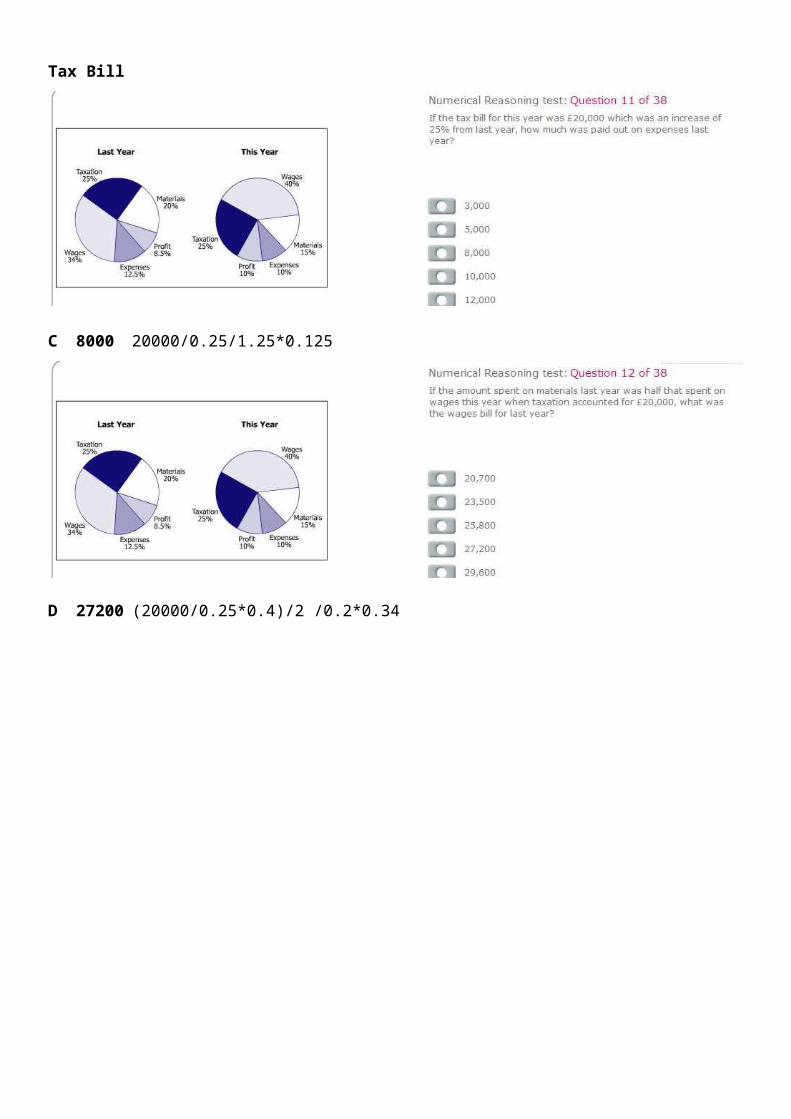
Tax Bill
C 8000 20000/0.25/1.25*0.125
D 27200 (20000/0.25*0.4)/2 /0.2*0.34
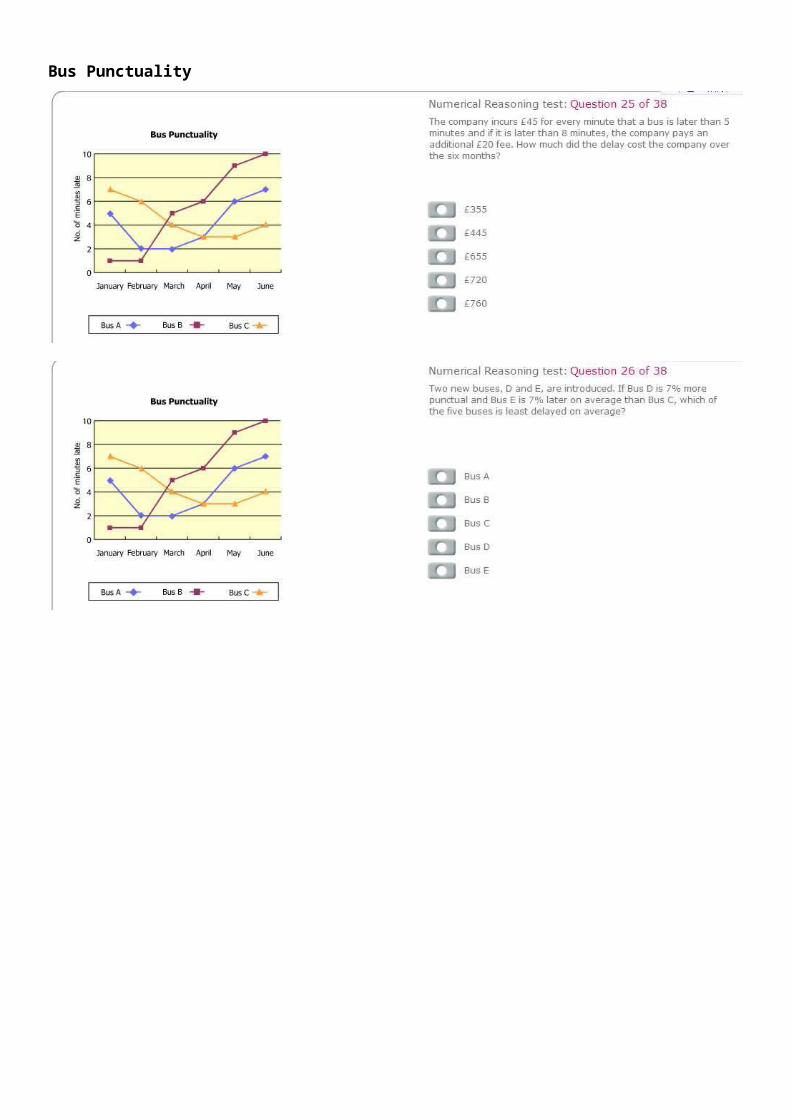
Bus Punctuality
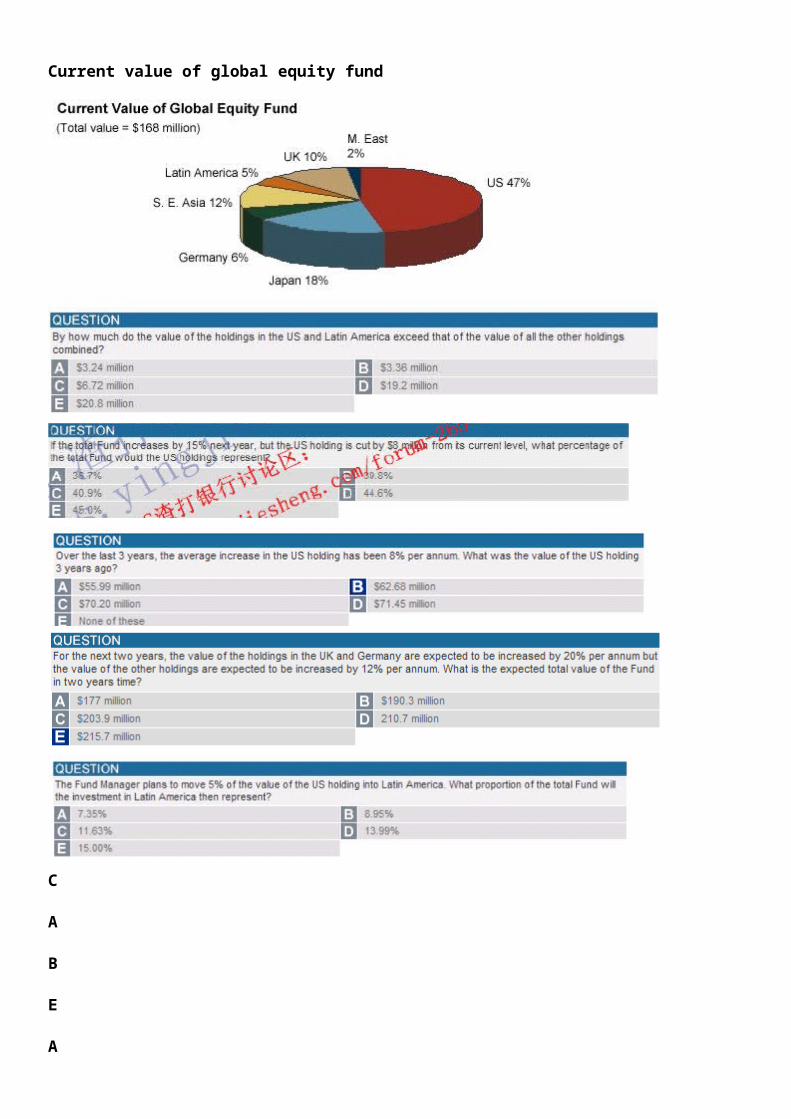
Current value of global equity fund
CABEA1. Which of the following combinations of holdings has a value of $36.96?
UK and SE.ASIA (D)2. Last year UK holdings was 10% less than now, what about UK last year?
15.12 million
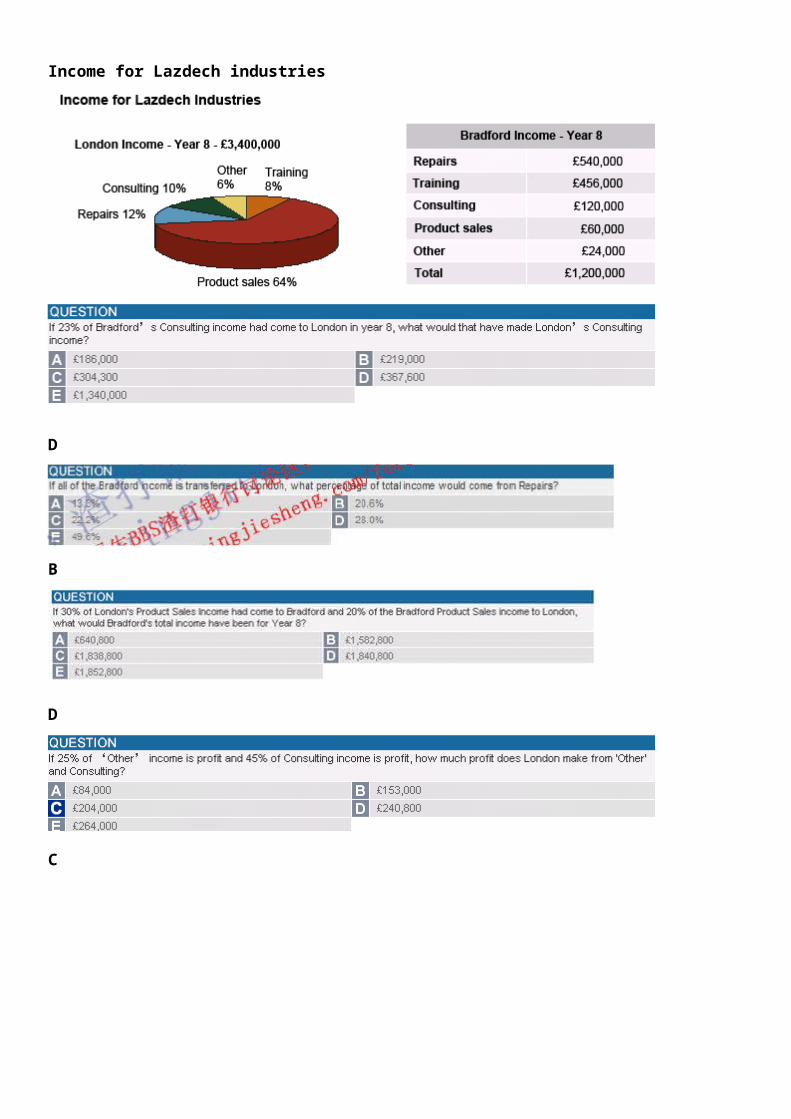
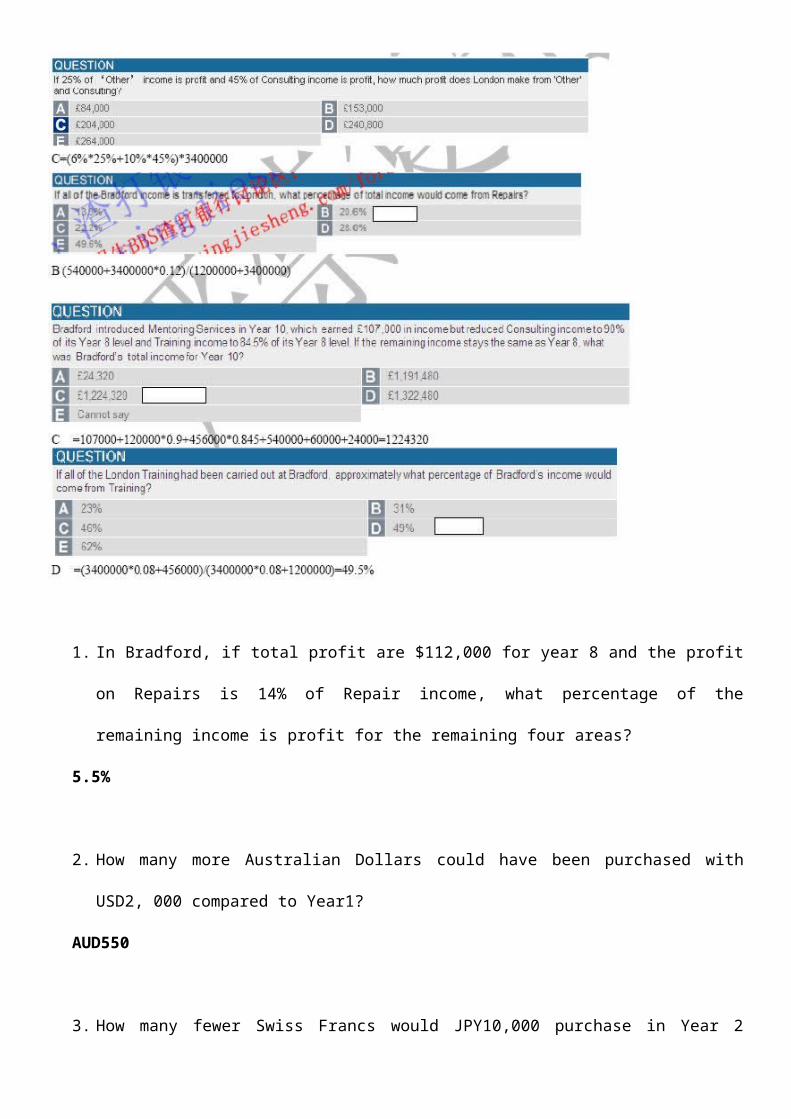
Income for Lazdech industries
D
B
D
C
1. In Bradford, if total profit are $112,000 for year 8 and the profit on Repairs is 14% of Repair income, what percentage of the remaining income is profit for the remaining four areas?
5.5%
2. How many more Australian Dollars could have been purchased with USD2, 000 compared to Year1?AUD550
3. How many fewer Swiss Francs would JPY10,000 purchase in Year 2 compared to Year 1?CHF 38.24
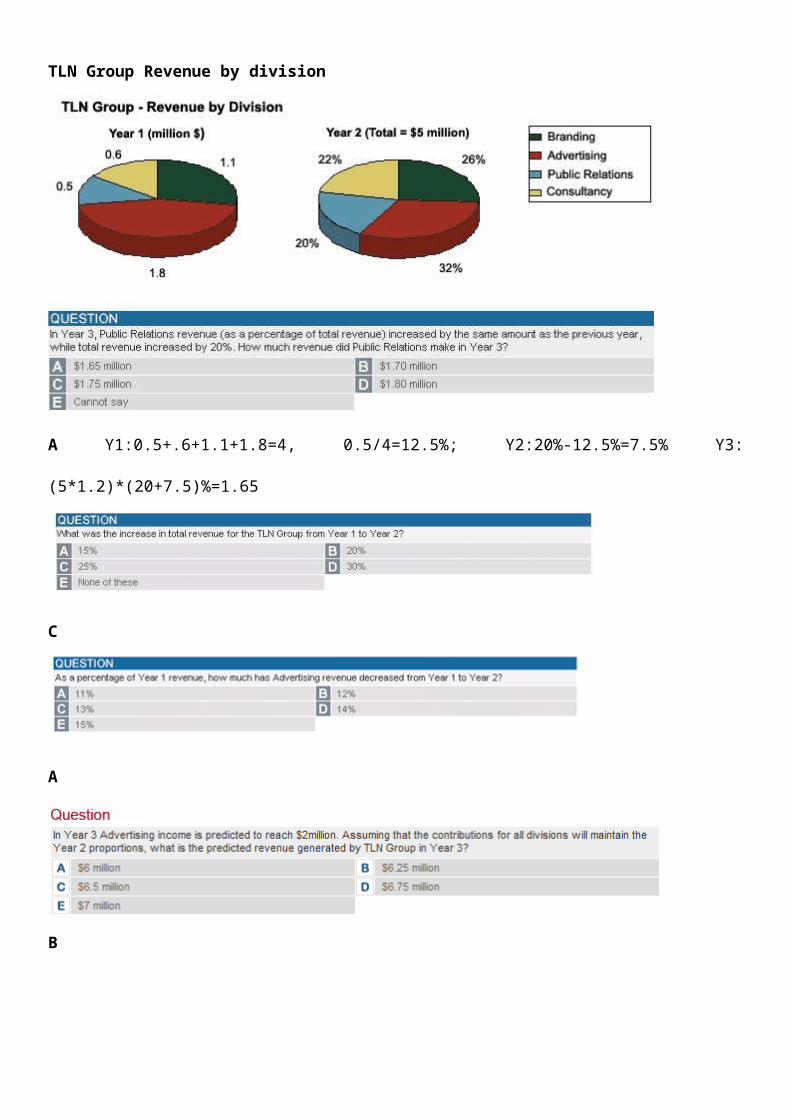
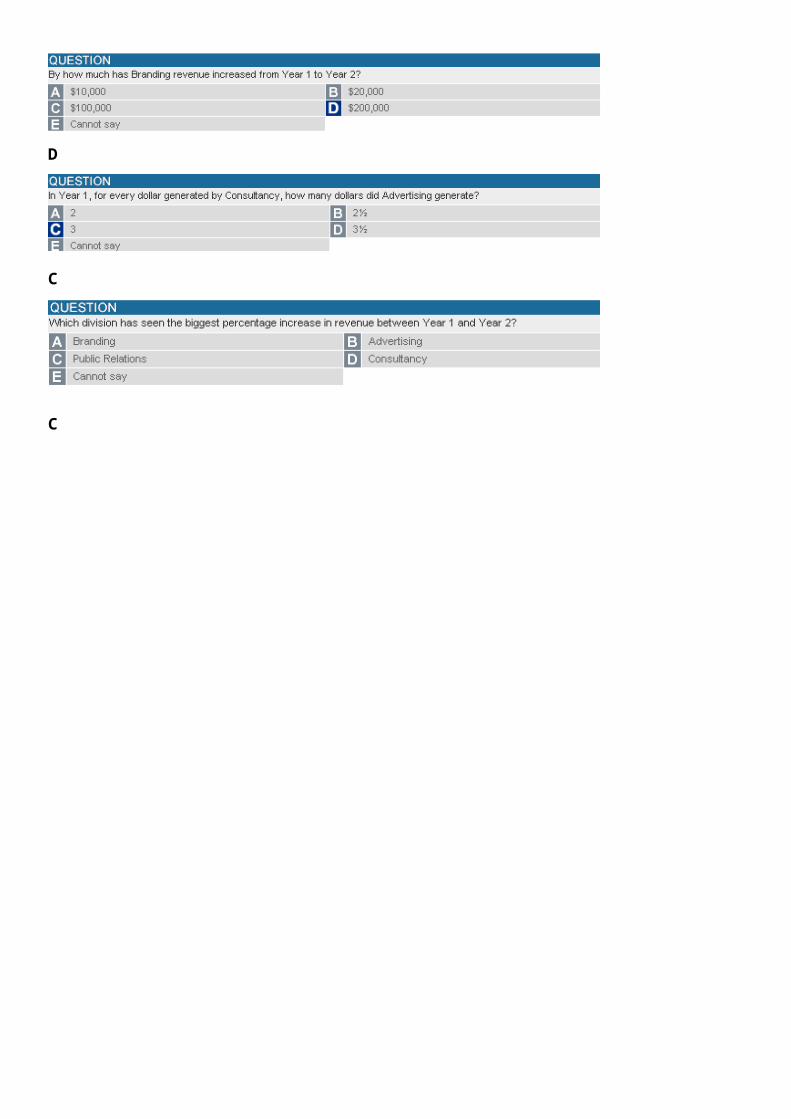
TLN Group Revenue by division
A Y1:0.5+.6+1.1+1.8=4, 0.5/4=12.5%; Y2:20%-12.5%=7.5% Y3:(5*1.2)*(20+7.5)%=1.65
C
A
B
D
C
C
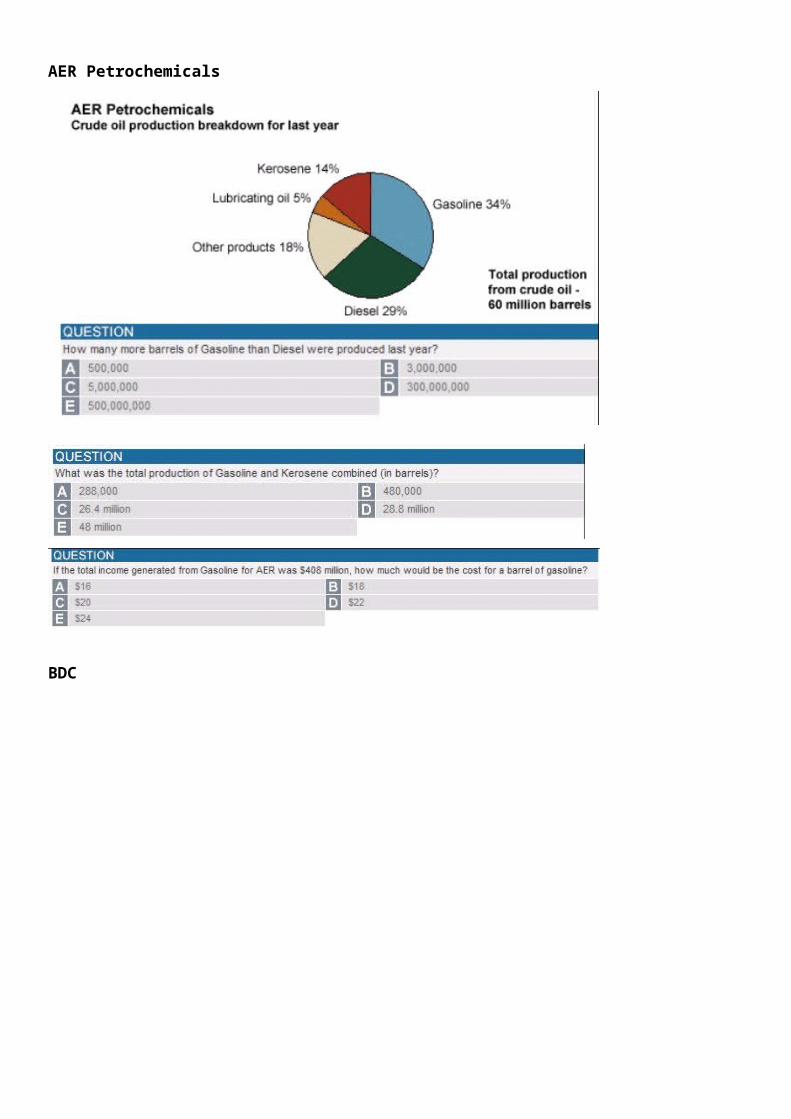
AER Petrochemicals
BDC
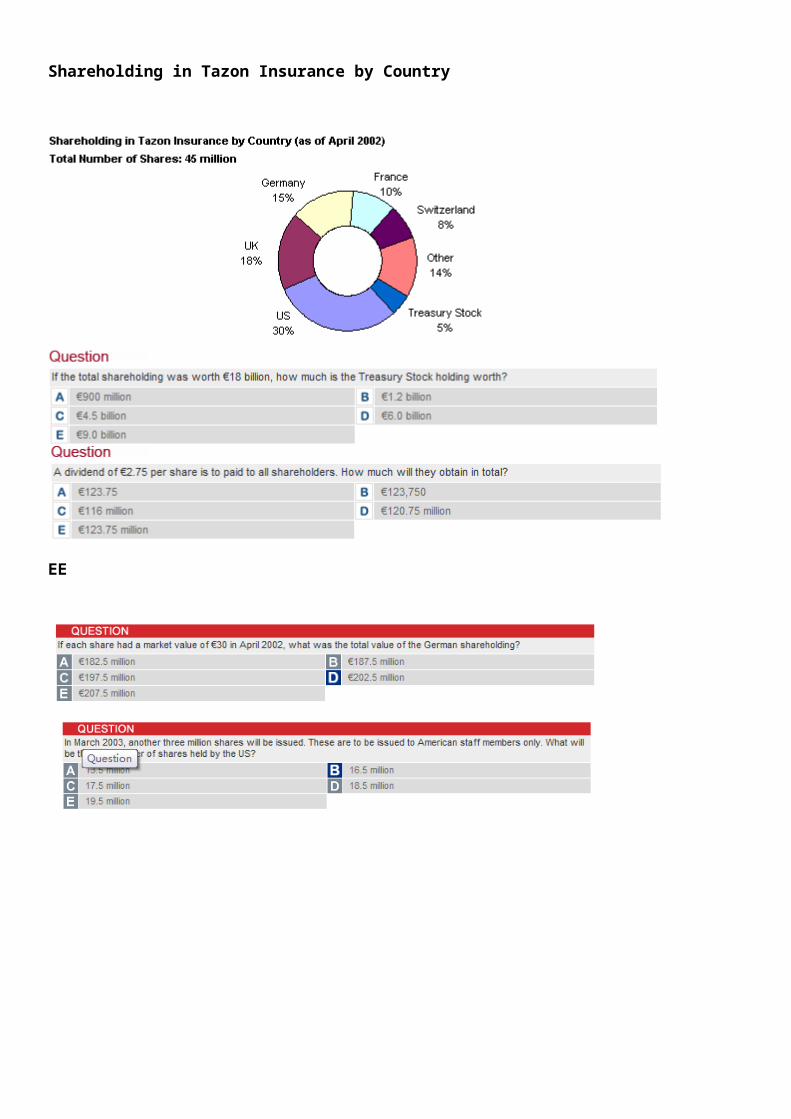
Shareholding in Tazon Insurance by Country
EE
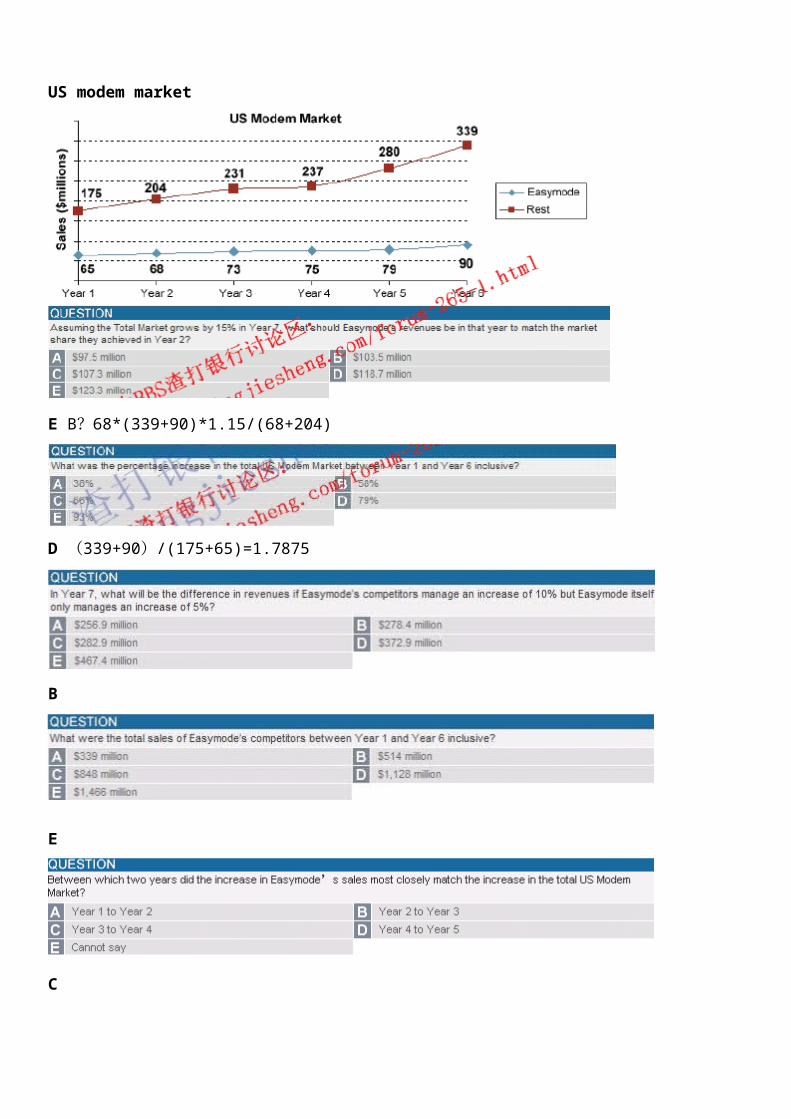
US modem market
E B?68*(339+90)*1.15/(68+204)
D (339+90)/(175+65)=1.7875
B
E
C
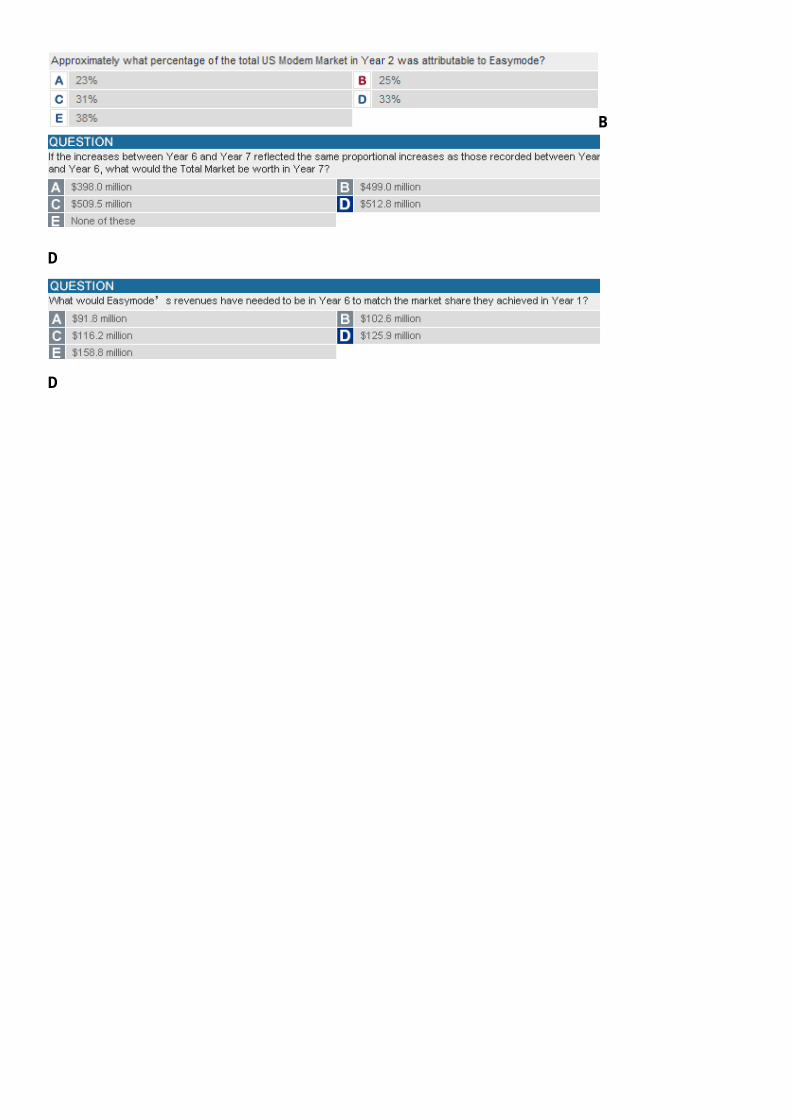
B
D
D
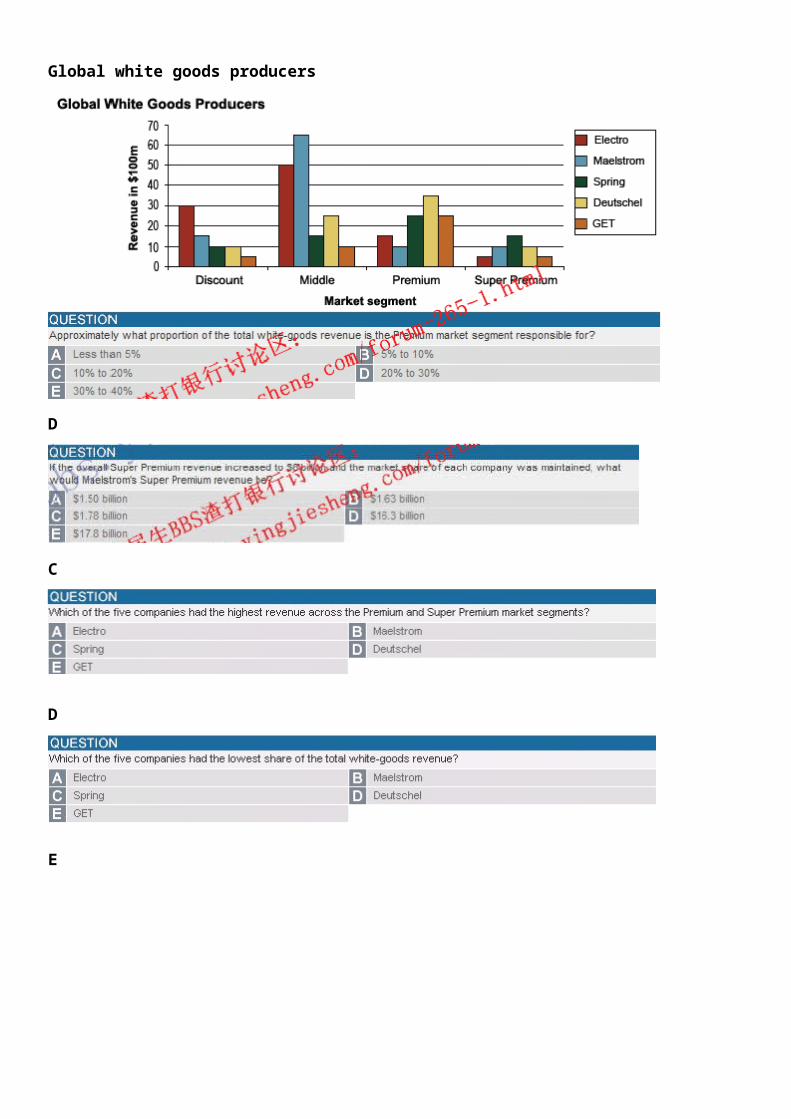
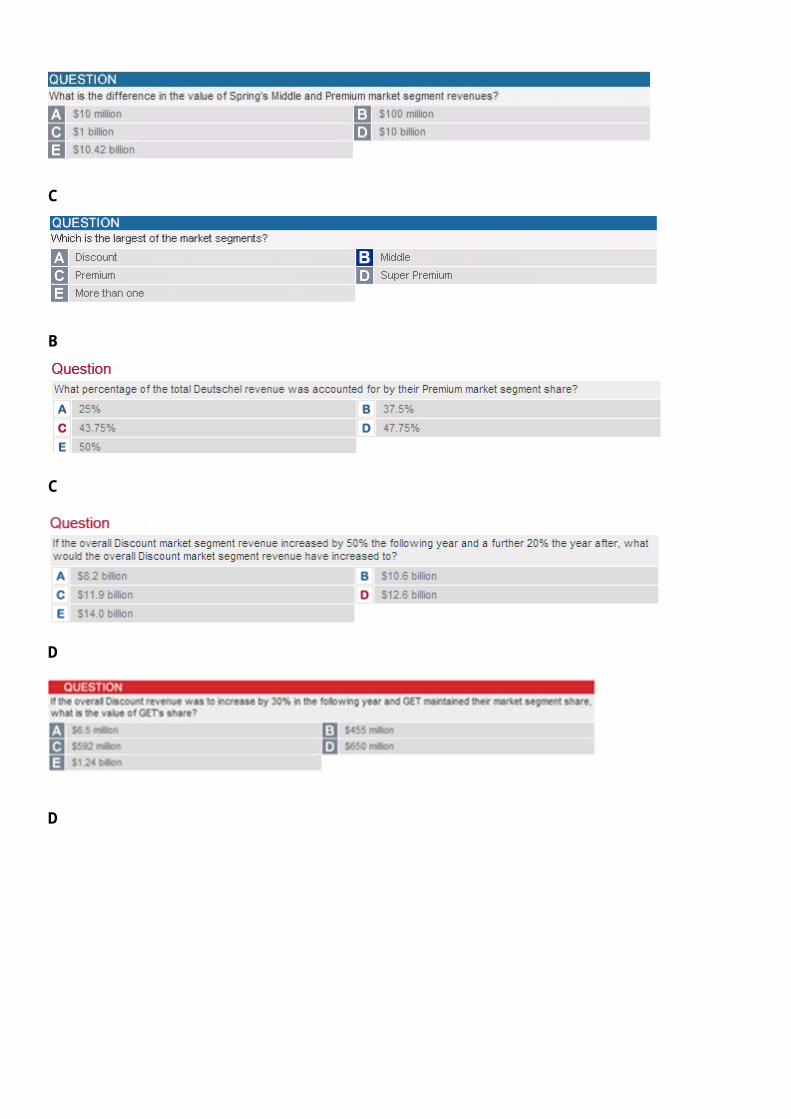
Global white goods producers
D
C
D
E

C
B
C
D
D
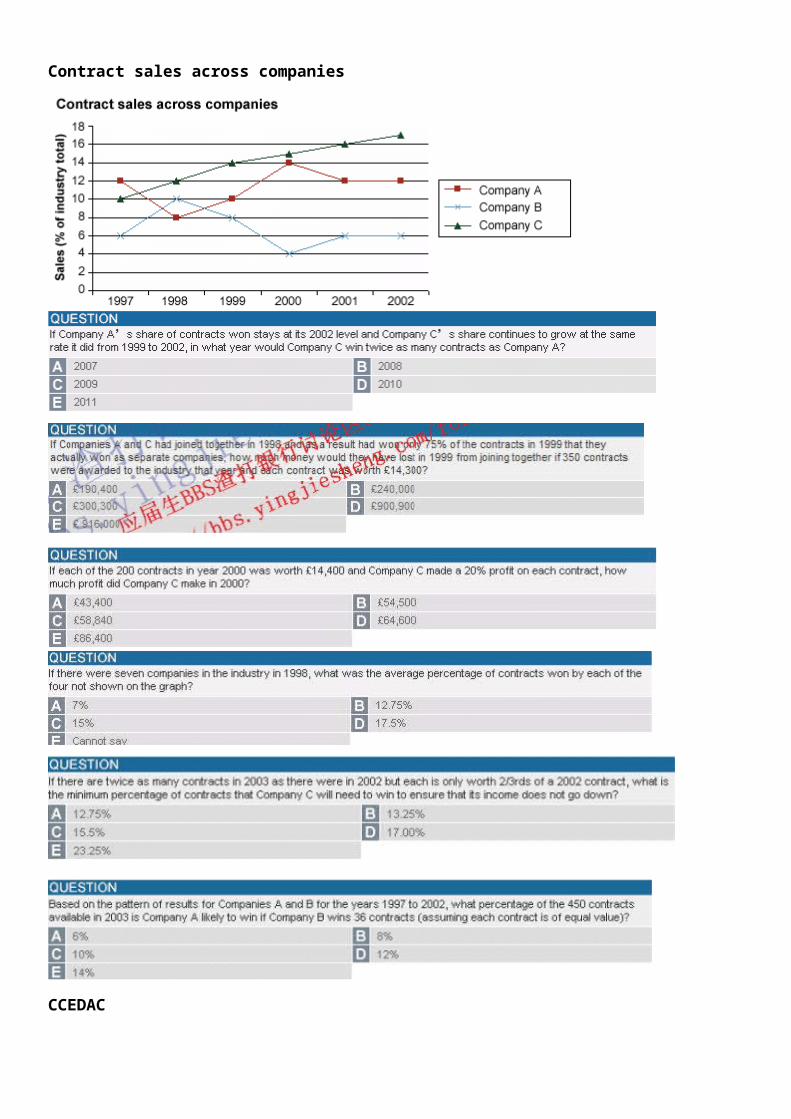
Contract sales across companies
CCEDAC
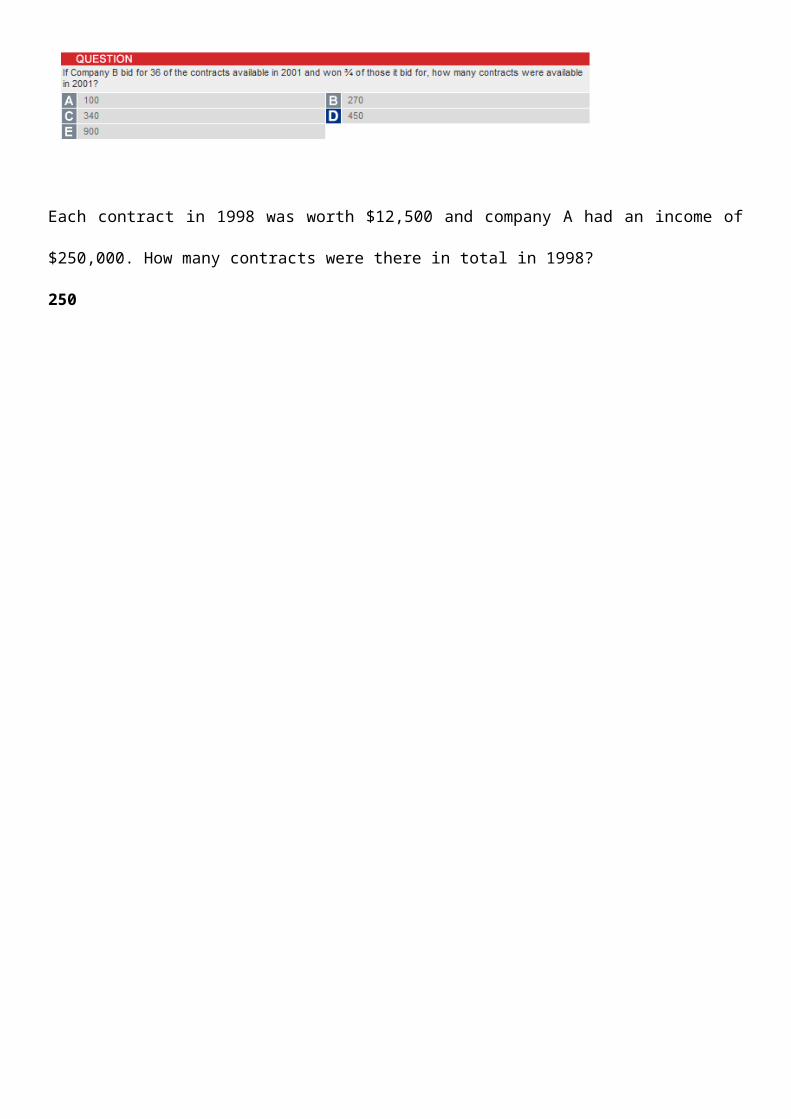
Each contract in 1998 was worth $12,500 and company A had an income of $250,000. How many contracts were there in total in 1998?250

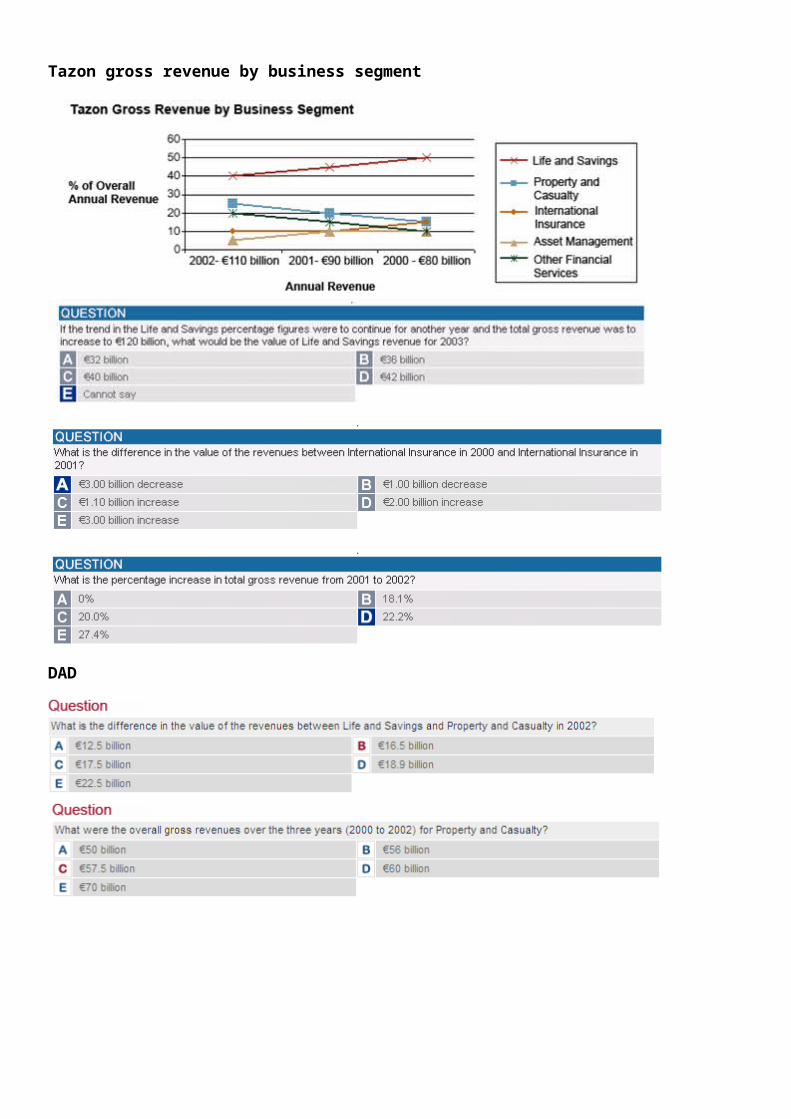
Tazon gross revenue by business segment
DAD
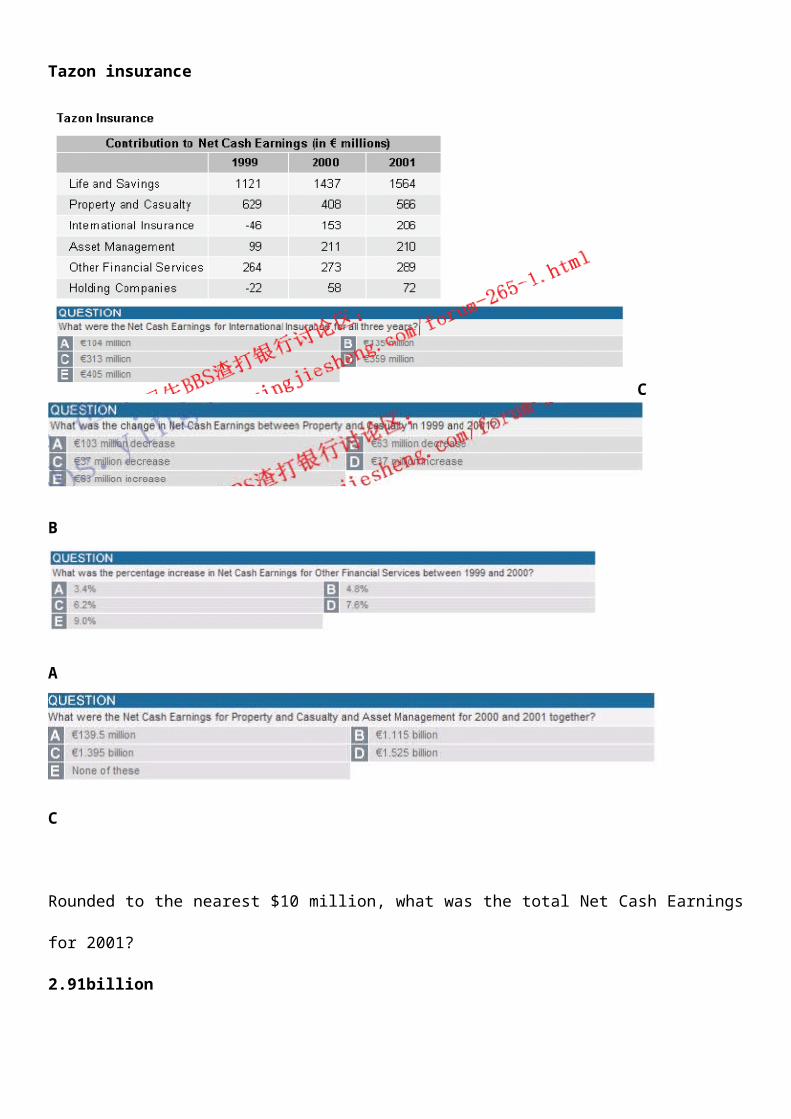
Tazon insurance
C
B
A
C
Rounded to the nearest $10 million, what was the total Net Cash Earnings for 2001?2.91billion
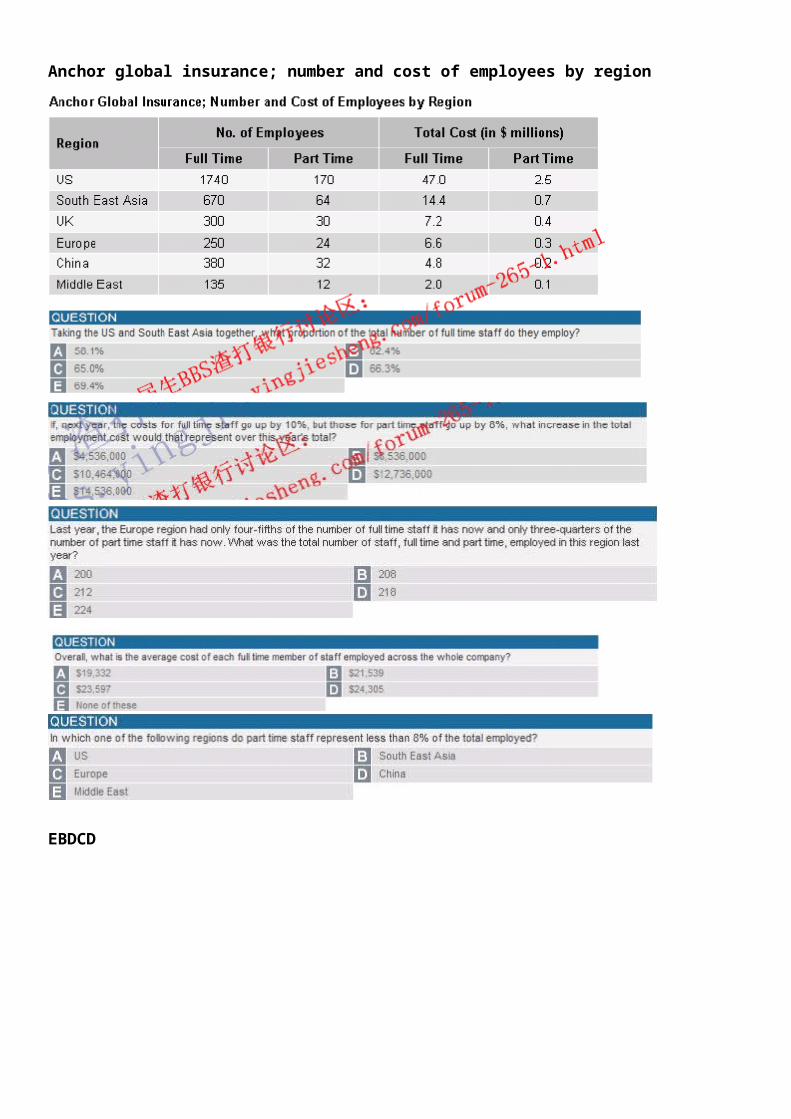
Anchor global insurance; number and cost of employees by region
EBDCD
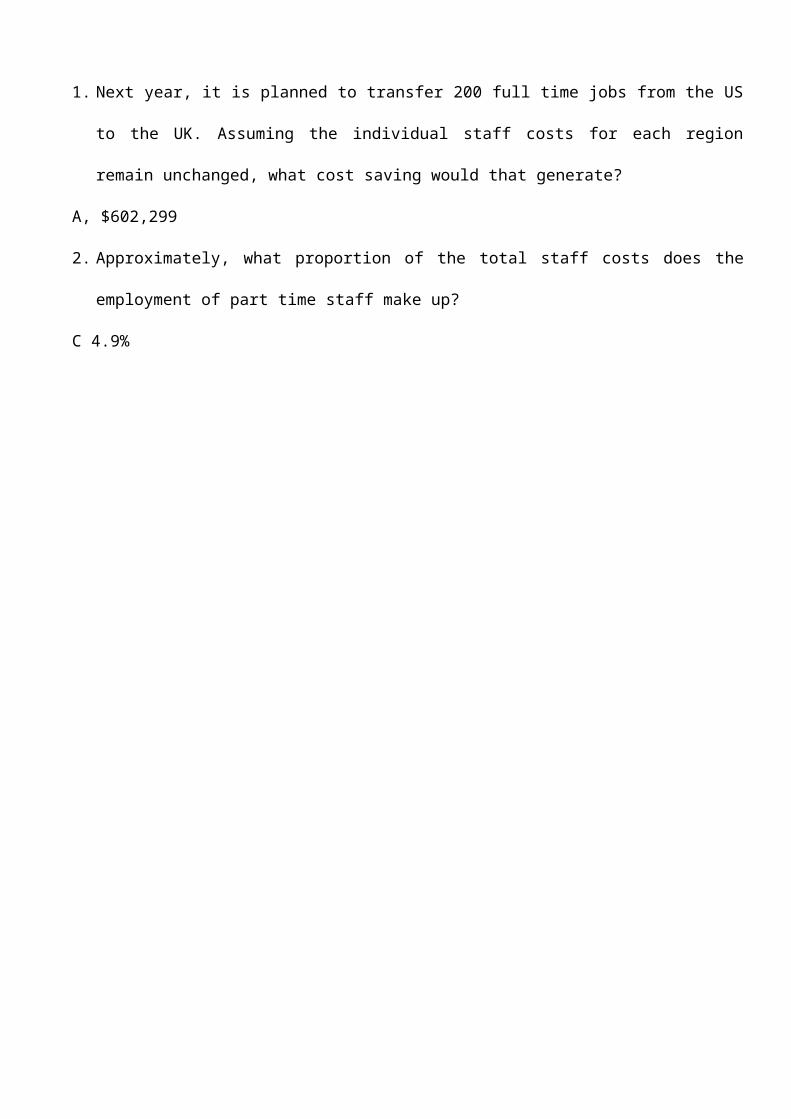
1. Next year, it is planned to transfer 200 full time jobs from the US to the UK. Assuming the individual staff costs for each region remain unchanged, what cost saving would that generate?
A, $602,2992. Approximately, what proportion of the total staff costs does the employment of part time staff make
up?C 4.9%
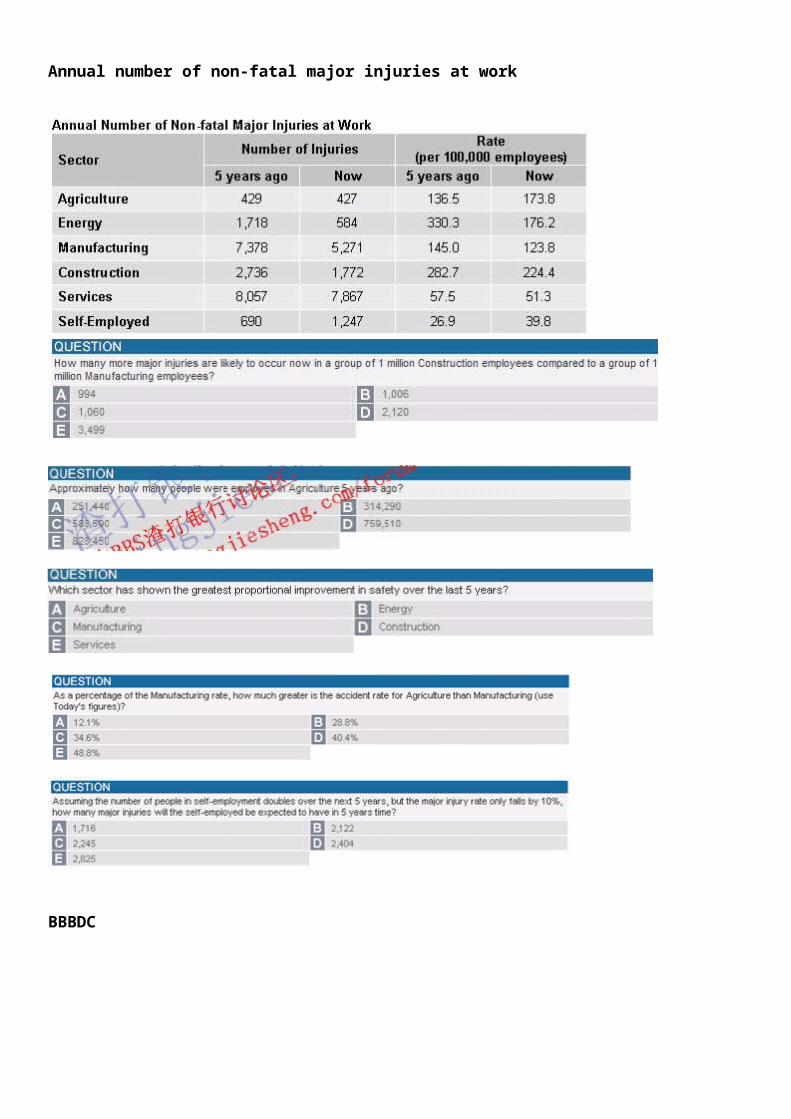
Annual number of non-fatal major injuries at work
BBBDC
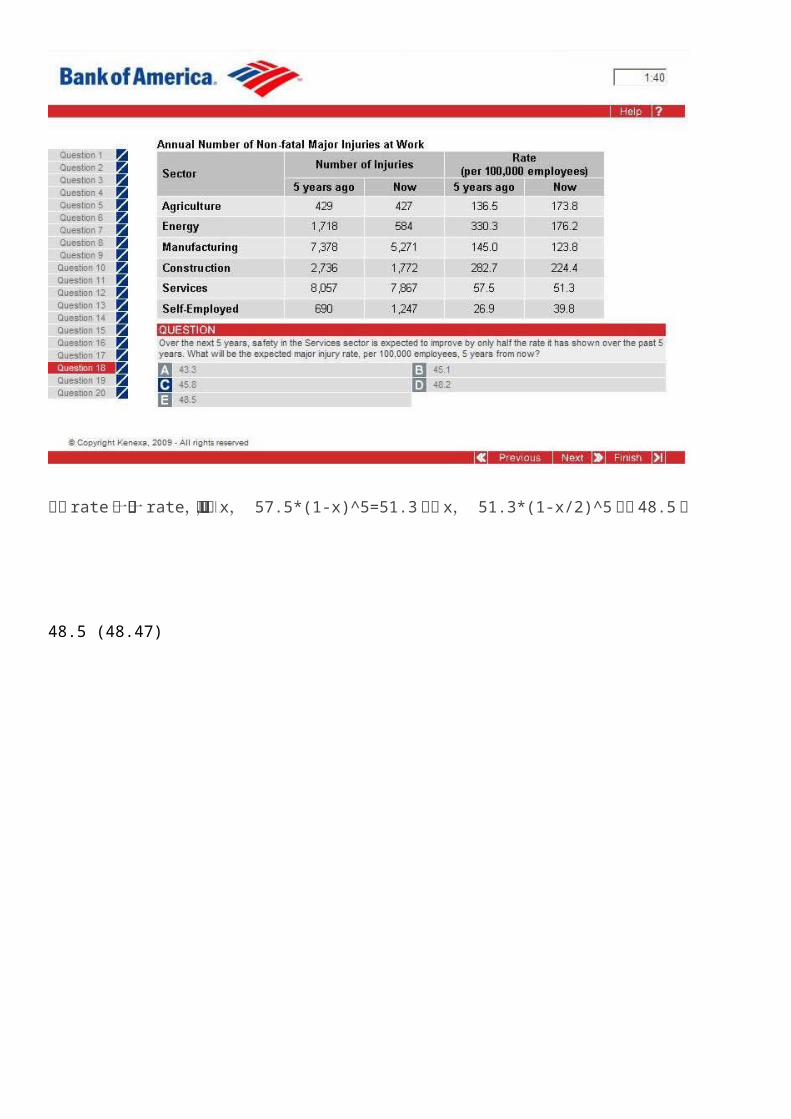
这个 rate 是一个基于一年的 rate,所以不能直接像我上面那样做,而是要设 x,然后 57.5*(1-
x)^5=51.3算出 x,再用 51.3*(1-x/2)^5算出 48.5的
48.5 (48.47)
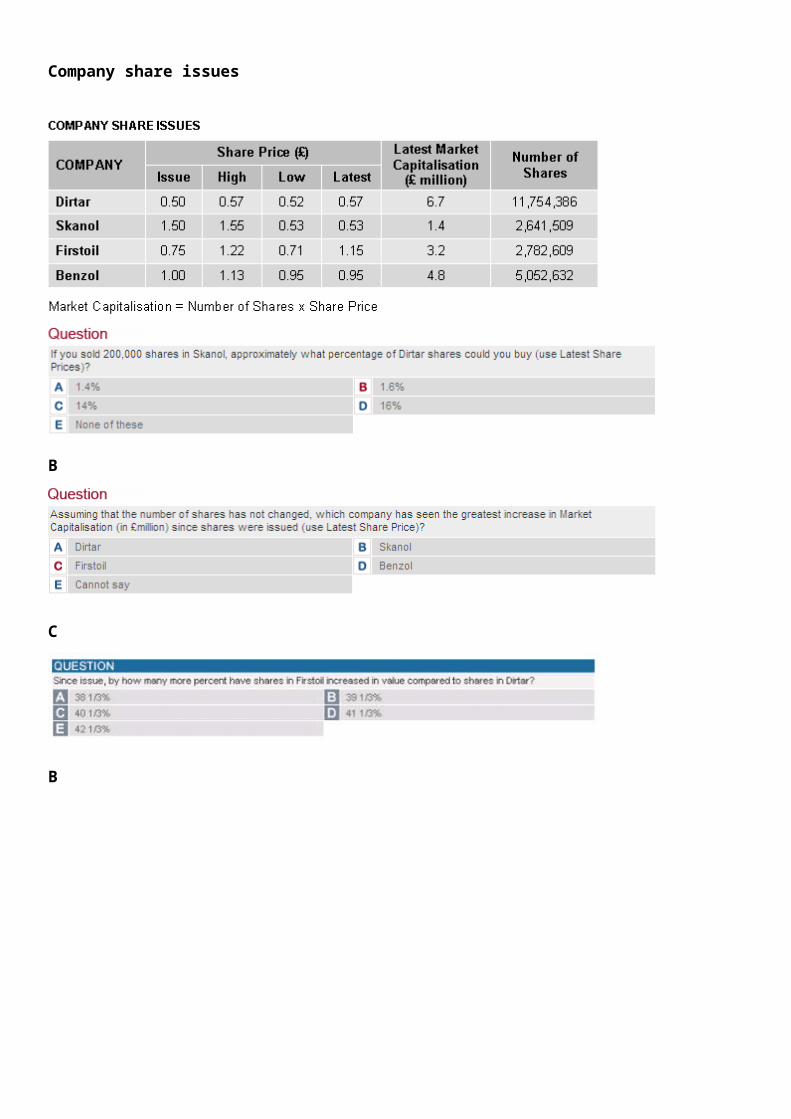
Company share issues
B
C
B
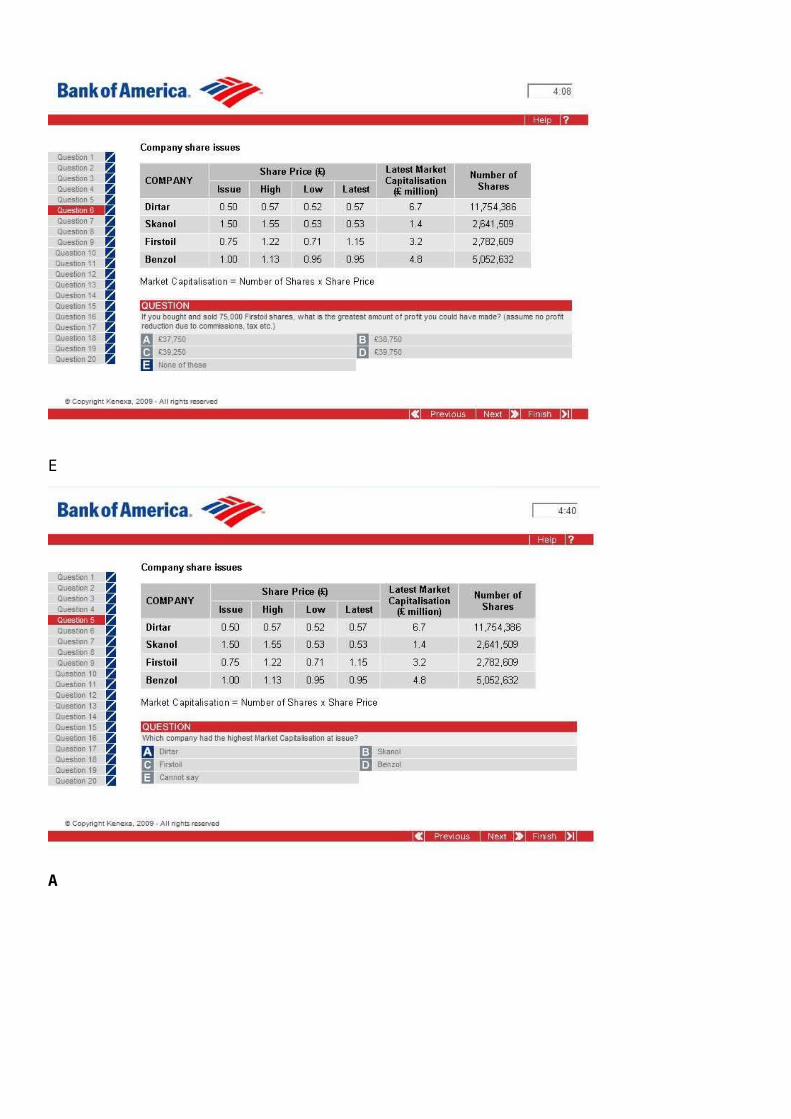
E
A
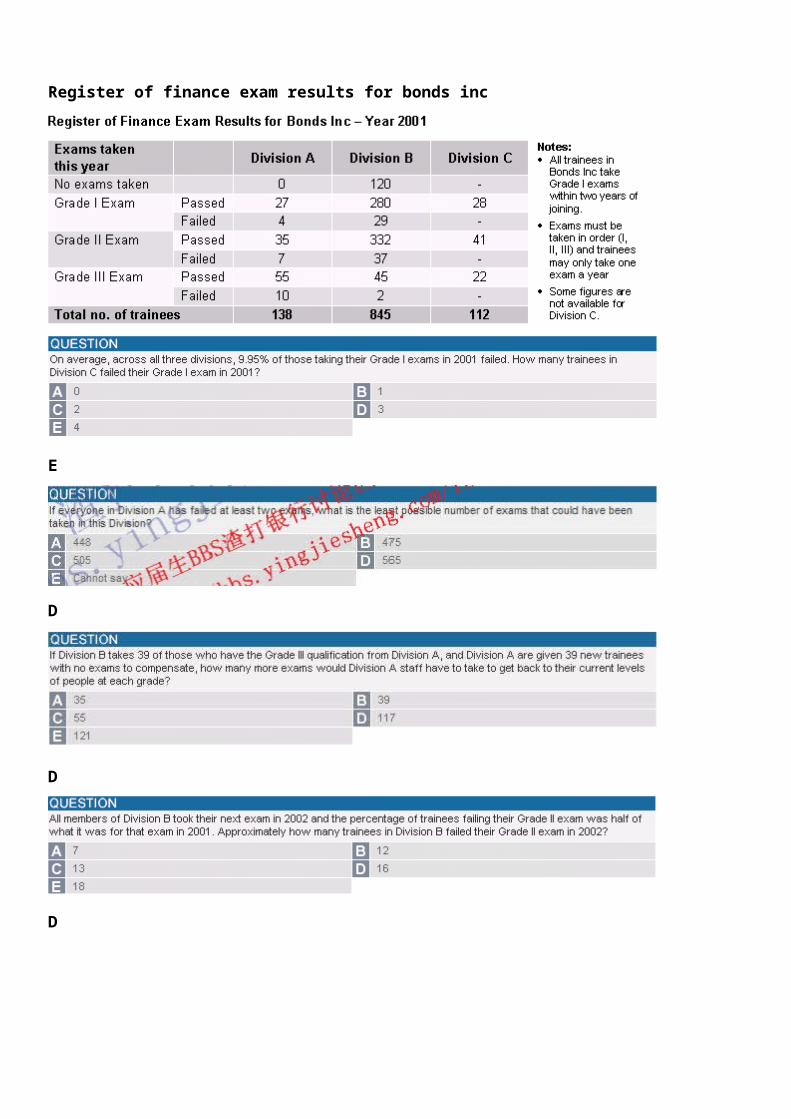
Register of finance exam results for bonds inc
E
D
D
D
C
C
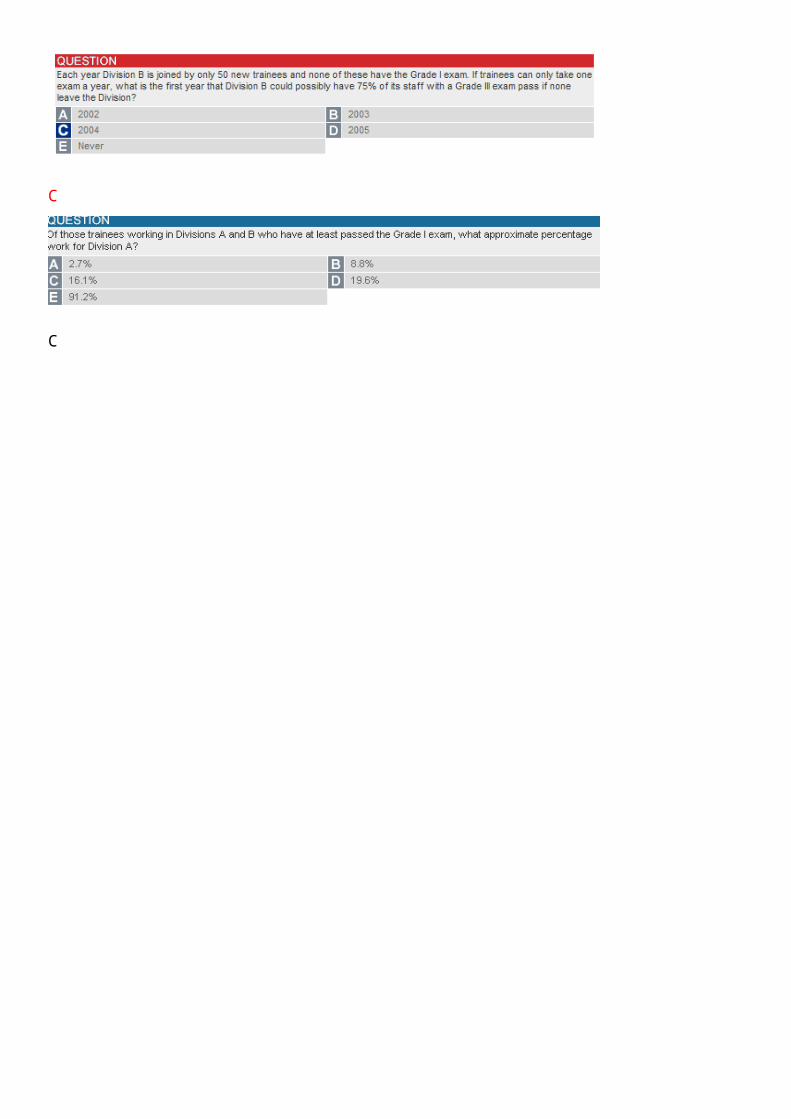
Frequency of driver accidents
AEDBD
Approximately how many miles per year does the average 50-59 women driver drive?3,958
Granta industries ltd product range
BEBBB
Population statistics
B
D
B

D
C
Stationery costs from five providers
A
D25*7=175 175*0.9=157.5 30*7=210 210-157.5=52.5 52.5*12=63
C
D
E
Value of 1 sterling
D
A
D
C
B
E
A
D
Price of soya beans
A:375-359*1.021=8.461 注意是年头还是年尾
C
A
E
D
Average speeds of 4 wheeled vehicles in the city
BEB
D =40/26.8+40/26.4=3 hours 3/24=12.5%
Staff distribution at ABC engineering
E 1800
B
E因为上面是变化率,没有说总人数。
Price indices
E
C
BAt the start of which year did the House Price Index Outside the capital show the greatest percentage increase relative to the previous year?1999 but the answer gives us 1998
Two houses were purchased at the beginning of 1999 for $100,000 each, one in the Capital and one Outside. Assuming the value of both houses rose in line with the House Price Index, what would be the difference in their prices by the beginning of 2000?$1, 182
Retail sales by Product Category
E
B
C
CWhat were the total sales figures for Menswear over the four-year period?$126million

Opinion Poll Result