how should i evaluate rv size and...
TRANSCRIPT

Roberto M. Lang, MD
How Should I Evaluate RV Size and Function?

RV Anatomy• Complex crescent shape• Thin-walled, compliant
chamber• Low pulmonary
resistance / afterload• Sensitive to changes in
afterload- RV dilatation- RV hypertrophy

RV Contraction• Complex contraction
pattern• Inward movement of
the free wall (bellows effect)
• Minor axis shortening• Long-axis shortening
draws the TV towards the apex
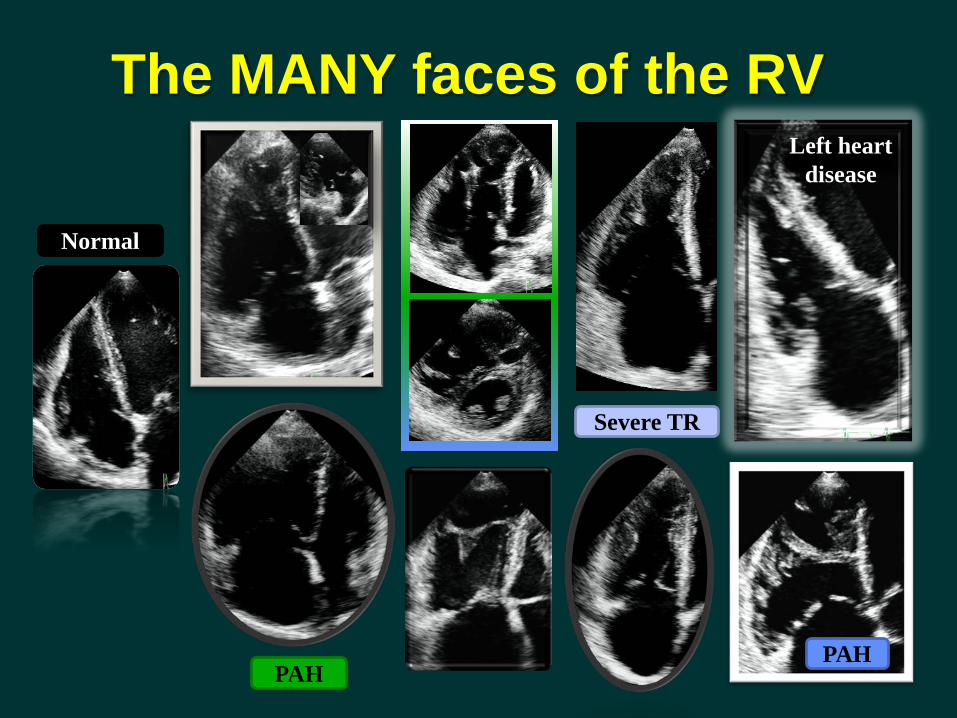
Normal
PAH
Severe TR
Left heart disease
PAH
The MANY faces of the RV
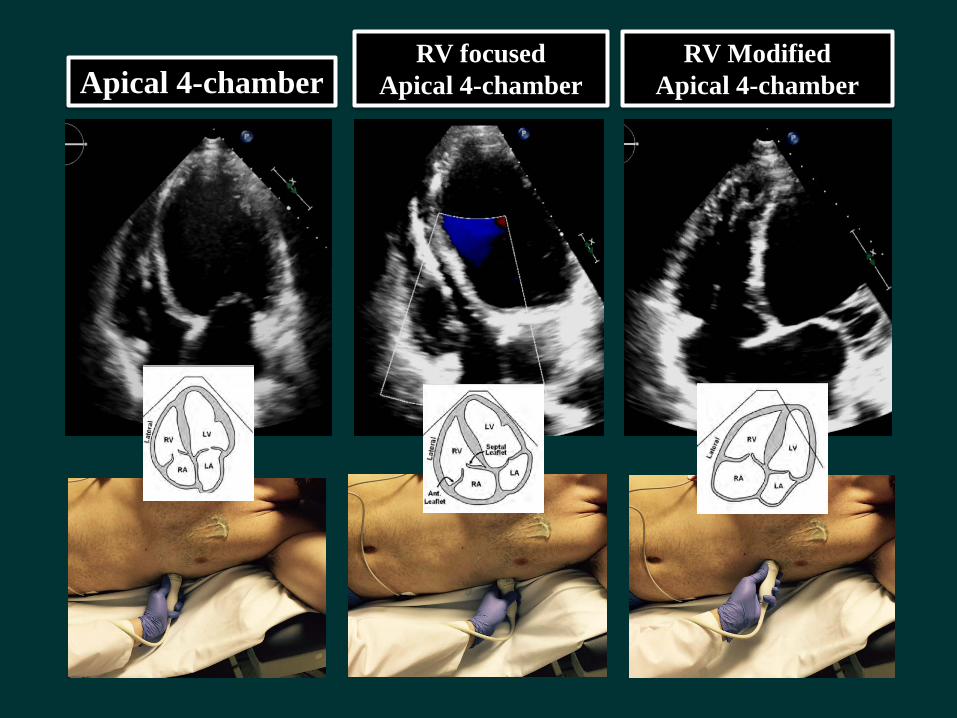
Apical 4-chamberRV focused
Apical 4-chamberRV Modified
Apical 4-chamber
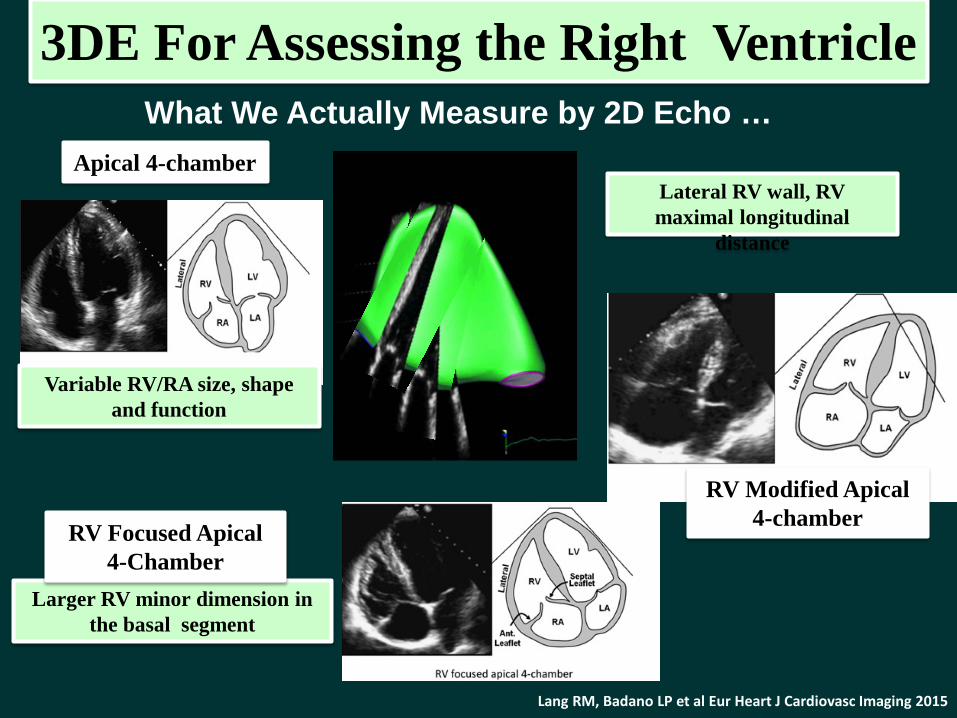
Lang RM, Badano LP et al Eur Heart J Cardiovasc Imaging 2015
What We Actually Measure by 2D Echo …
3DE For Assessing the Right Ventricle
Variable RV/RA size, shape and function
Apical 4-chamber
Larger RV minor dimension in the basal segment
RV Focused Apical 4-Chamber
Lateral RV wall, RV maximal longitudinal
distance
RV Modified Apical 4-chamber

• Qualitative RV Size
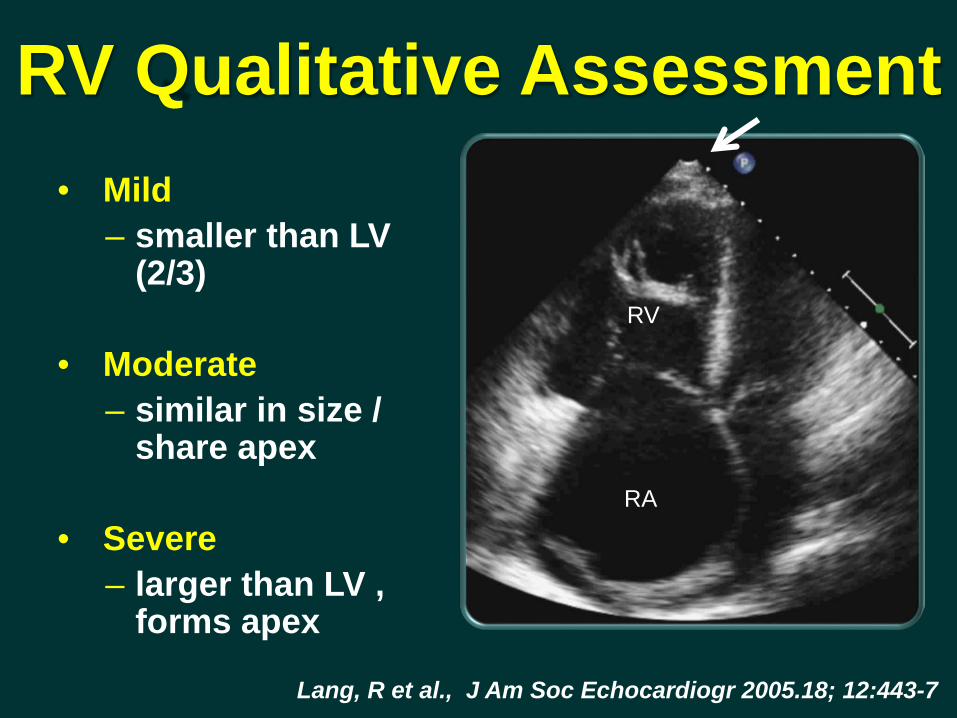
RV Qualitative Assessment

RV Qualitative Assessment• Mild
– smaller than LV (2/3)
Lang, R et al., J Am Soc Echocardiogr 2005.18; 12:443-7
RA
RV

RV Qualitative Assessment• Mild
– smaller than LV (2/3)
• Moderate– similar in size /
share apexRA
RV
Lang, R et al., J Am Soc Echocardiogr 2005.18; 12:443-7
RV Qualitative Assessment• Mild
– smaller than LV (2/3)
• Moderate– similar in size /
share apex
• Severe– larger than LV ,
forms apex
Lang, R et al., J Am Soc Echocardiogr 2005.18; 12:443-7
RA
RV

Contrast echo- Improve RV visualization
Right Ventricle

• Qualitative• Quantitative
RV SizeRV Function
RV Wall Thickness
RV Dimensions & Area
RV Quantitative Assessment

RV Wall Thickness
• M-mode or 2D• Subcostal view (thicker)• End-diastole• Avoid epicardial fat and coarse
trabeculations
Lang, R et al. J Am Soc Echocardiogr 2015
• More sensitive than EKG• Sensitivity 93%, specificity 95%•Thickness correlates with RV pressure
>3 mm indicates RVH

33±4mm
27±4mm
25±2mm
28±3.5mm
22±2.5mm
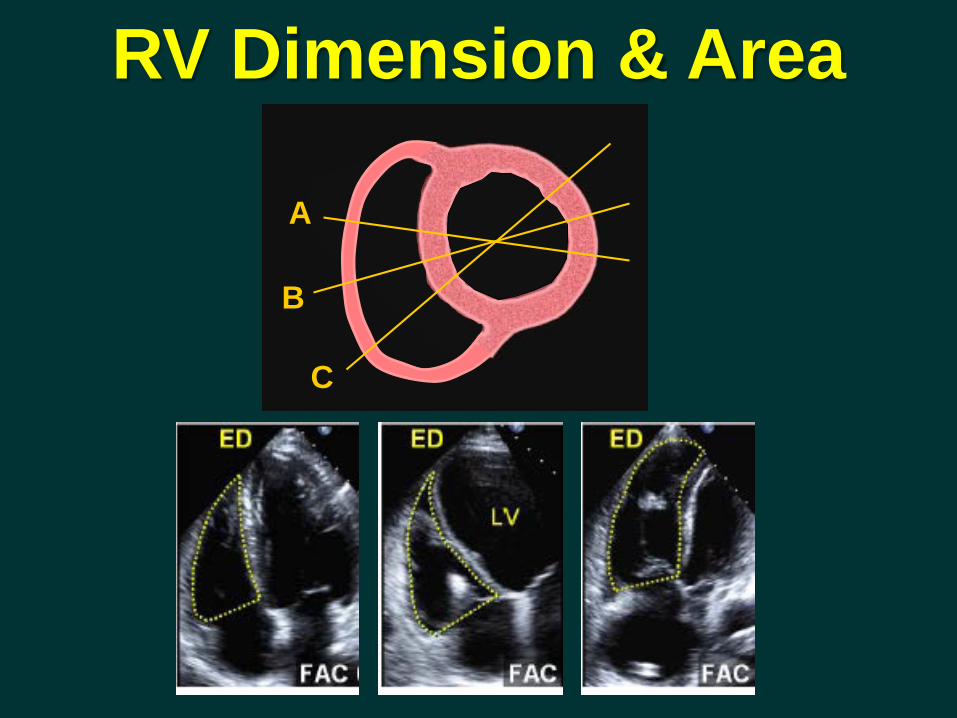
A
B
C
RV Dimension & Area

RV Dimension & Area
NL Mild Mod SevereRV EDA (cm2) 11-28 29-32 33-37 ≥ 38
RV ESA (cm2) 7.5-16 17-19 20-22 ≥ 23

Normal RV Abnormal RV
Diastole Systole
Fractional Area Change
(end-diastolic – end-systolic area)end-diastolic area
Diastole Systole
FAC =

Segmental Nomenclature of RV Walls and Coronary Supply
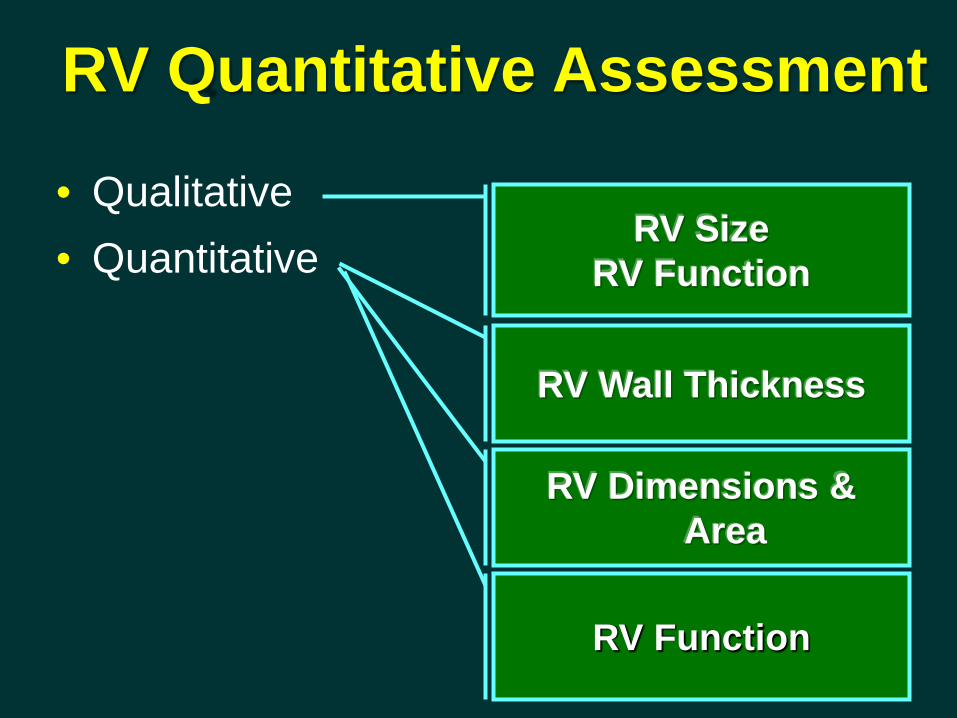
• Qualitative• Quantitative
RV SizeRV Function
RV Wall Thickness
RV Dimensions & Area
RV Quantitative Assessment
RV Function

• Eye-balling• RIMP (RV Index of Myocardial Performance)• TAPSE (Annular Plane Systolic Excursion)• 2D FAC (Fractional Area Change)• 2D RV EF (2D RV Ejection Fraction)• 3D RV EF (3D RV Ejection fraction)• Tissue Doppler Derived Tricuspid Lateral
Annular Systolic Velocity (S’)• Longitudinal Strain and Strain Rate
RV Function

RV Function
• Qualitative– “Eye-Balling” – Correlation 0.85 with
quantitative RVEF (Simpson’s)
– High InterobserverVariability (14.8% ±13%)
Miller, D. J Am Soc Echocardiogr 2004; 17:443-7
RA
RV

RV TAPSEApical 4-chamber RV-focused view
Basal segment & annulus parallel to M-mode cursor
24±3.5, mm
<17, mm
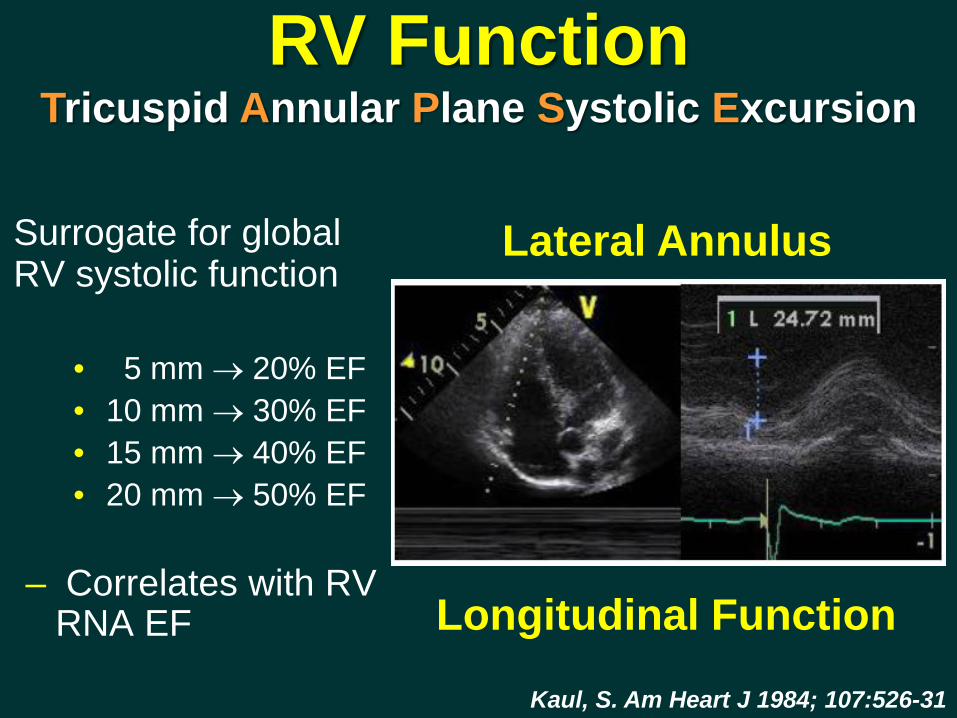
RV FunctionTricuspid Annular Plane Systolic Excursion
Surrogate for global RV systolic function
• 5 mm → 20% EF• 10 mm → 30% EF• 15 mm → 40% EF• 20 mm → 50% EF
– Correlates with RV RNA EF
Kaul, S. Am Heart J 1984; 107:526-31
Lateral Annulus
Longitudinal Function

RV Tissue Doppler S’
S’
Apical 4-chamber RV-focused view
Basal segment & annulus parallel to M-mode cursor
14.1±2.3, cm/s<9.5, cm/s
RV Function

RV FunctionTissue Doppler of Tricuspid Annulus
• Correlates with other measures of global RV systolic function
• Basal segment and annulus must be kept well alignedMeluzin, J. et al. Eur Heart J 2001; 22:340-8.
S’ Velocity: < 9.5 cm/s indicated RV systolic dysfunction
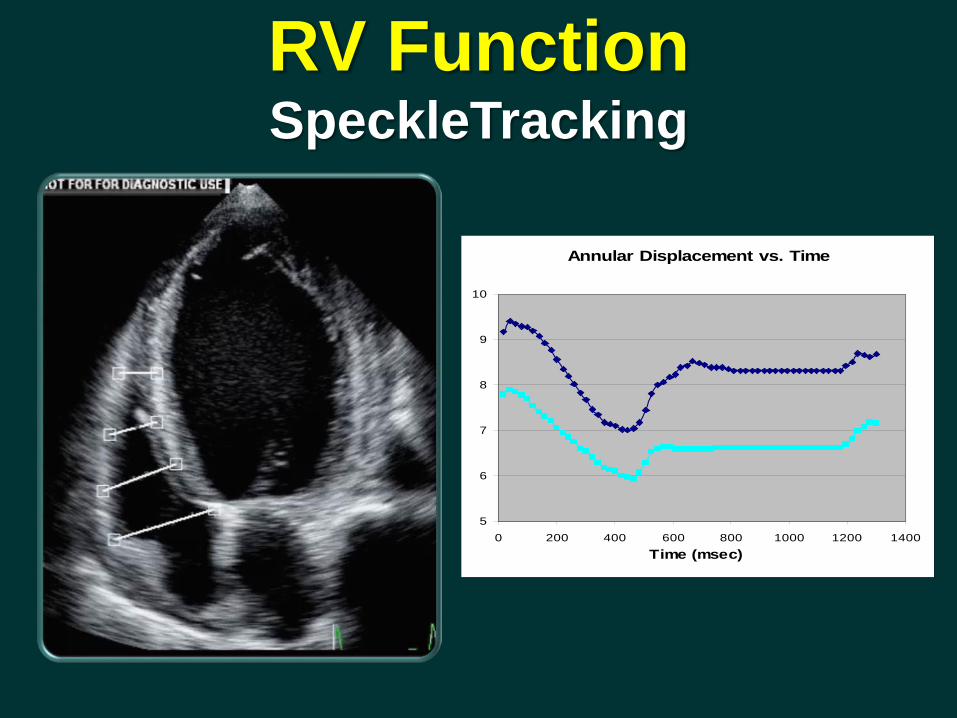
Annular Displacement vs. Time
5
6
7
8
9
10
0 200 400 600 800 1000 1200 1400Time (msec)
RV FunctionSpeckleTracking

RV Free Wall longitudinal Strain
Apical 4-chamber RV-focussed view
Free wall longitudinal strain
-29±4.5, % >-20, %

RV FunctionStrain Imaging
80 patients with PAH (Class III/IV) RV free wall strain >-12.5%
associated with greater disease severity, higher BNP, higher RAP, larger RV volumes
Strain >-12.5% had 61% 1 yr and 57% 2 yr mortality
For every 5% decrease in strain, risk of death increased by 3.3 fold
Sachdev A et al. Chest 2011, 139:1299-1309
Normal Subject PAH Subject
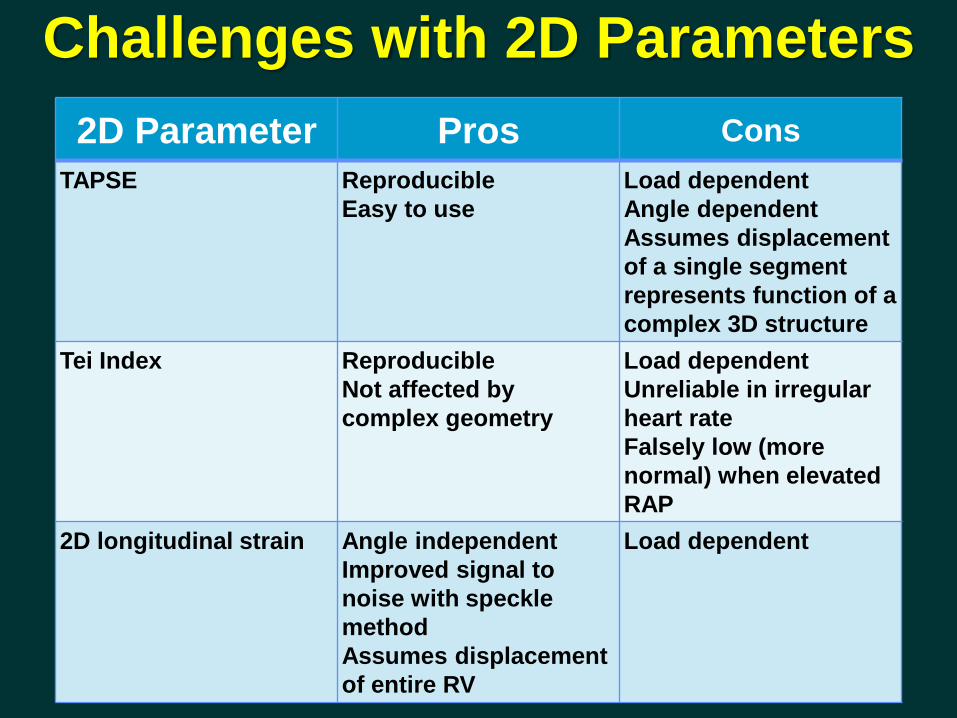
Challenges with 2D Parameters2D Parameter Pros Cons
TAPSE ReproducibleEasy to use
Load dependentAngle dependentAssumes displacement of a single segment represents function of a complex 3D structure
Tei Index ReproducibleNot affected by complex geometry
Load dependentUnreliable in irregular heart rate Falsely low (more normal) when elevated RAP
2D longitudinal strain Angle independentImproved signal to noise with speckle methodAssumes displacement of entire RV
Load dependent

RIMP Index = IVCT + IVRT
Tei, C. et al. J Am Soc Echocardiogr 1996; 9:838-47Roberson, DA and Cui, W. J Am Soc Echocardiogr 2007; 20:764-70
ET
Pulsed Doppler Method Pulsed Tissue Doppler Method
Index of Global RV Function
>0.4 >0.55RV Dysfunction
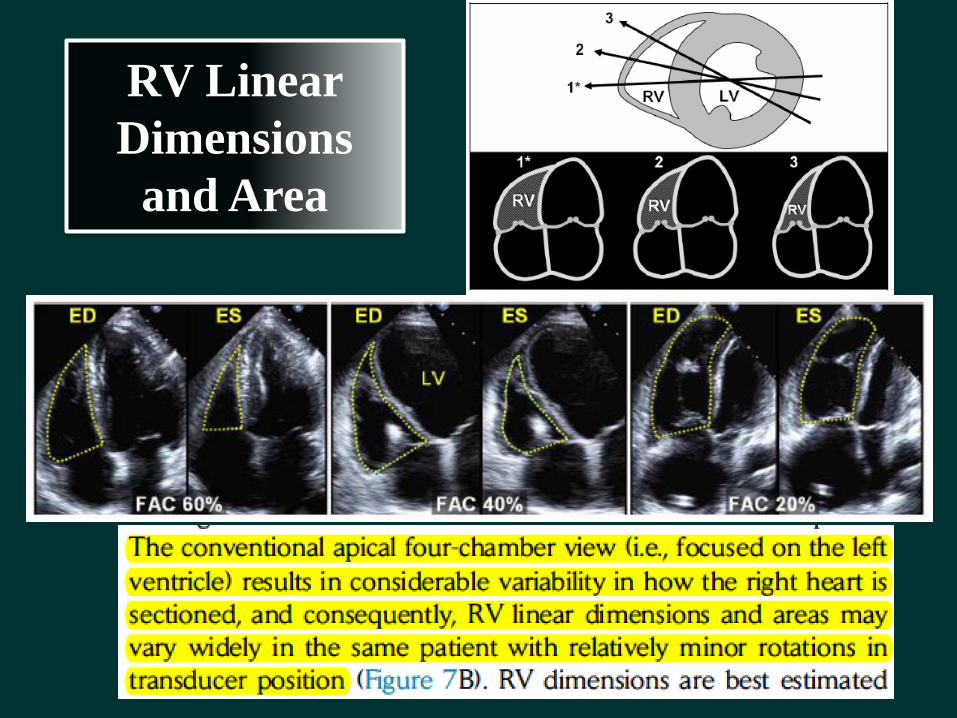
RV Linear Dimensions
and Area

RV FunctionFractional Area Change
Lang, R et al. J Am Soc Echocardiogr 2005.18; 12:443-7
2D FAC <35% indicates RV systolic dysfunction
• Correlates with MRI RV EF (r = 0.69 - 0.88)• Related to outcome in a number of conditions

Eyeball confirmation is important!
TAPSE = 1.6 cm
RV S’ = 14 cm/s
Moderate-severe TR

RVEF 27%
CMR
RA
RV
LV
LA
PV
RA RV
RV
PV

• Complex geometry• Limited definition of RV
endocardium due to heavy trabeculation
• Retrosternal position of RV can limit windows
• Operator-dependent• Must include infundibulum
(contains up to 25-30% of RV volume)
• Lack of standardization of normal values
Challenges with 2D Echocardiography

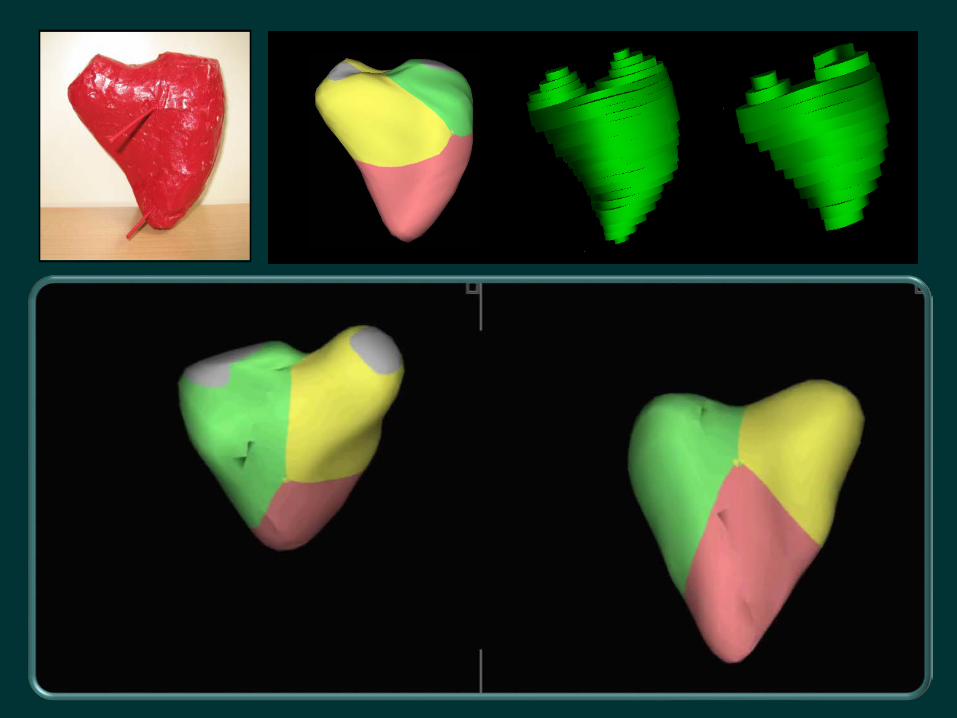
3D Echocardiography
Freehand Acquisition
Real-time Acquisition

RT3DE Imaging
S
AP

RV Anatomy
• Inlet
• Apical
• Outlet
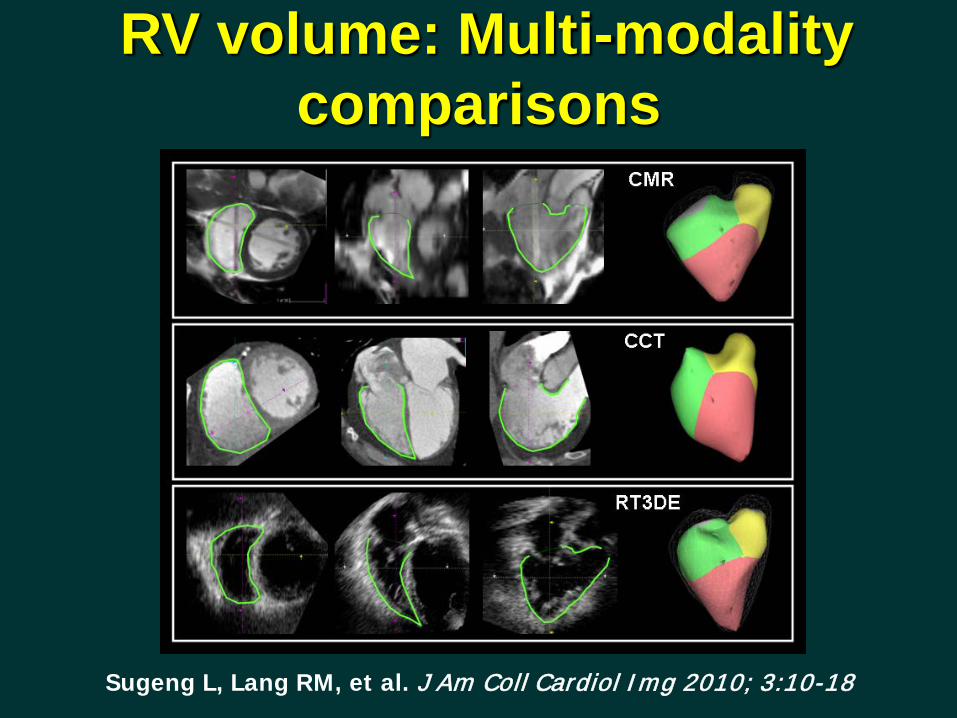
RV volume: Multi-modality comparisons
Sugeng L, Lang RM, et al. J Am Coll Cardiol Img 2010; 3:10-18

CCT overestimated and RT3DE underestimated RV volumes compared to CMR
reference.
y = 0.7x
r = 0.81
y = 0.7x
r = 0.81
-150
-100
-50
0
50
100
150
0 100 200 300CMR : ESV (ml)
CC
T - C
MR
: ES
V (m
l)
y = 0.7x
r = 0.81
y = 0.7x +
r = 0.81
-150
-100
-50
0
50
100
150
0 100 200 300 400CMR : EDV (ml)
CC
T - C
MR
: ED
V (m
l)y = 0.7x +
r = 0.81
y = 0.7x
r = 0.81
-40
-20
0
20
40
10 20 30 40 50 60 70CMR : EF (%)
CC
T - C
MR
: EF
(%)
ESV EDV EF
y = 0.7x +
r = 0.81
y = 0.7x
r = 0.81
-150
-100
-50
0
50
100
150
0 100 200 300CMR : ESV (ml)
RT3
DE
- CM
R :
ESV
(ml) y = 0.7x
r = 0.81
y = 0.7x
r = 0.81
-150
-100
-50
0
50
100
150
0 100 200 300 400CMR : EDV (ml)
RT3
DE
- CM
R :
EDV
(ml)
y = 0.7x
r = 0.81
y = 0.7x
r = 0.81
-40
-20
0
20
40
10 20 30 40 50 60 70CMR : EF (%)
RT3
DE
- CM
R :
EF (%
)
Bias: 17 mlLOA: ±63 ml
Bias: 23 mlLOA: ±76 ml
Bias: -9 mlLOA: ±53 ml
Bias: -14 mlLOA: ±73 ml
Bias: -2%LOA: ±15%
Bias: -2%LOA: ±12%
Sugeng L, Lang RM, et al. J Am Coll Cardiol Img 2010; 3:10-18
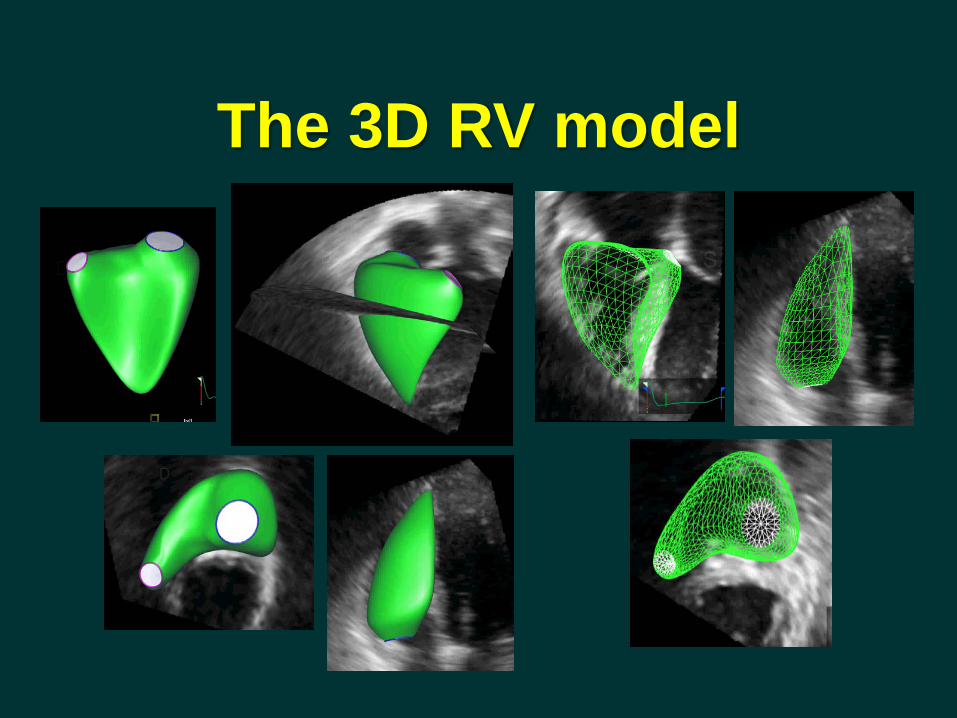
The 3D RV model
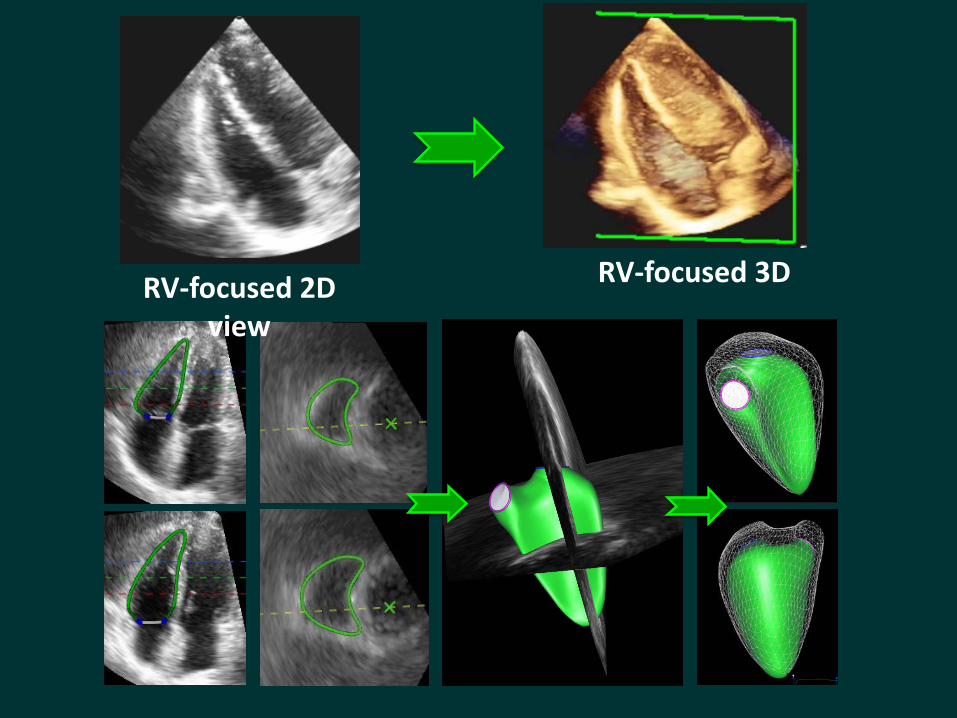
RV-focused 3DRV-focused 2D view
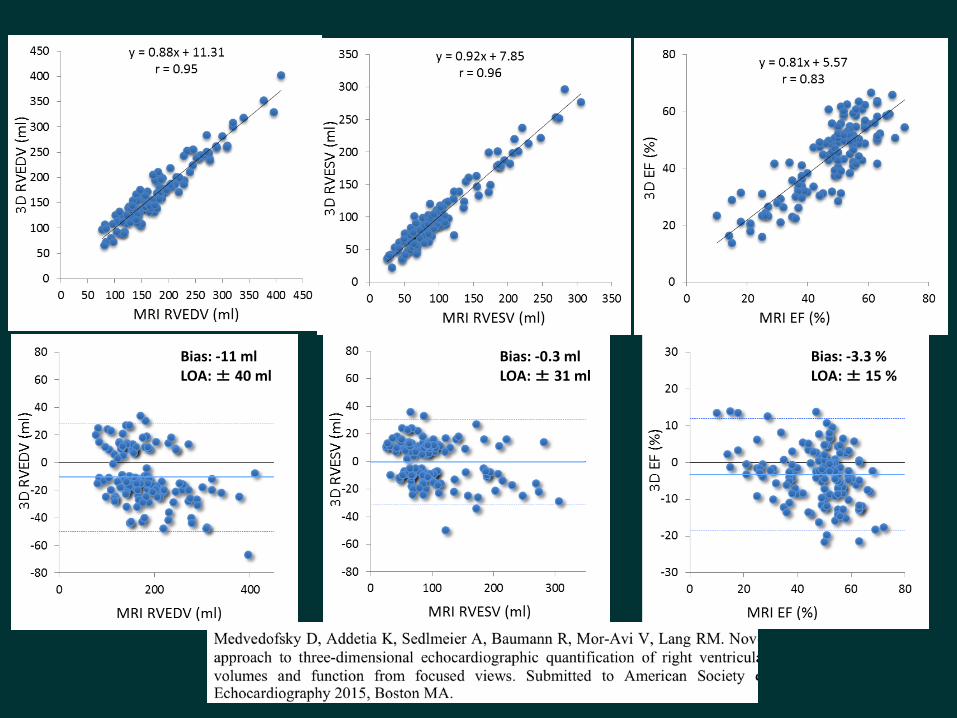
Bias: -11 mlLOA: ± 40 ml
Bias: -0.3 mlLOA: ± 31 ml
Bias: -3.3 %LOA: ± 15 %

RV Volumes and EF
RV EF % 58±6.5
<45
RV EDV/BSA, Men 61.3±13 35-87RV EDV/BSA, Women 53±10.5 32-74
RV ESV/BSA, Men 27±8.5 10-44RV ESV/BSA, Women 22±7 8-36

RV Function Parameter
CC with MRIRVEF (r)
3D RVEF2D RVstrain2D FACS’2D TAPSE2D RV TEI
0.850.670.630.520.470.37
Freed B, Lang RM et al., J Am Soc Echocardiogr 2012: 25 (6), B116
RV Function in PAH


• Easy and quick acquisition
• Independent of geometric assumptions
• Semi-automated border detection
• Dynamic RV cast• 3DE volume, function,
compare well with CMR and are reproducible
• Limited by quality of 3D RV data
• RV mass less reproducible
• Not available on-line
Current RT3DE MethodologyAdvantages Disadvantages