how much do taxes discourage incorporation?
TRANSCRIPT
THE JOURNAL OF FINANCE • VOL. LII, NO.2. JUNE 1997
How Much Do Taxes Discourage Incorporation?
JEFFREY K. MACKIE-MASON and ROGER H. GORDON*
ABSTRACT
The double taxation of corporate income should discourage firms from incorporating.We investigate the extent to which the aggregate allocation of assets and taxableincome in the United States between corporate and noncorporate firms responds tothe size of this tax distortion during the period 1959-1986. In theory, profitable firmsshould shift out of the corporate sector when the tax distortion is large, and conversely for firms with tax losses. Our empirical results provide strong support forthese forecasts, and imply that the resulting excess burden equals 16 percent ofbusiness tax revenue.
ONE OF THE MOST BASIC distortions created by the double taxation of corporateincome in the United States is the disincentive to incorporate. Even in mostcountries with integrated or partially integrated tax systems, there are differential taxes across organizational forms. However obvious this distortion maybe, most articles investigating the distortions created by the corporate tax havetaken as exogenous a firm's choice whether or not to incorporate, assuming forexample that some industries are inherently corporate, while others are inherently noncorporate. A variety of nontax factors, described below, can certainly influence a firm's choice of organizational form, causing some to favorincorporating and others not. But are these nontax factors so dominant thattaxes do not in practice influence a firm's choice of organizational form? AsGravelle and Kotlikoff (1989, 1993) emphasize, tax-induced changes in firms'choices of organizational form in principle can create large excess burdens. Thesize of these excess burdens in practice depends on the extent to which firmsrespond to these tax incentives.
In this article, we calculate how the tax distortion discouraging firms fromincorporating has varied over time, then estimate the extent to which theallocation of assets and taxable income between corporate and noncorporate
* Both authors are from the University of Michigan and NBER. We thank Laura Kalambokidis,Linda Burilovich, Sharon Parrott, David Eaton, Tracy Hudson, Steve Pincus, Bill Boyle from theIRS, and especially Jane MacKie-Mason for assistance in creating the data set for this article.Yong Yang provided superb econometric support. We received helpful comments from a referee aswell as from Jane Gravelle, Joel Slemrod, and Mark Wolfson and seminar participants at NBER,Stanford Business School, Hoover Institution, UC Berkeley, UCLA, Rochester Business School,Toronto, and Michigan. Financial support for the data collection was provided by the Office of TaxPolicy Research and the Rackham Graduate School at the University of Michigan. The first draftof the article was written while MacKie-Mason was a National Fellow at the Hoover Institution.Previous versions of this article were circulated with the title "Taxes and the Choice of Organizational Form." We gratefully acknowledge financial support from National Science Foundationgrant SES-9122240.
477
478 The Journal of Finance
forms of organization has shifted in response to this time-varying tax distortion. We do this using aggregate data, by industry, in the United States duringthe period 1959-1986, then use our estimates to project the effects of the 1986tax reform on the size of the corporate sector.
In theory, taxes should induce profitable firms to shift out of the corporatesector when the tax distortion to inco:rporating increases, and conversely forfirms with tax losses. Our empirical results provide strong support for thesetheoretical forecasts, and hold consistently across a wide variety of specifications and measures of the tax variables. We also find that some nontax-ratepolicy changes caused shifts in the predicted directions between various forms.
The measured effects are relatively small, however. For instance, cutting thetax rate on noncorporate income by 0.10 is forecasted to cause 0.2 percent oftotal assets to shift out of corporate form. The effect is larger for the locationof taxable gains and losses, with the same tax change leading to a shift ofapproximately 3 percent of gains and 4 percent of losses toward the morefavored forms of organization, and in the process generating an excess burdenthat we estimate to be 16 percent of the tax revenue raised from businessincome. Overall, nontax factors appear to be dominant in the choice of organizational form, although further research will be needed to determine whichfactors are most important.!
In Section I of this article we present a theoretical characterization of theincentives to choose one organizational form over another. We specify therelationship between specific tax rate parameters and any nontax benefits (orcosts) of using the corporate form. We also discuss the effects of variousnonrate tax system effects. In Section II we present our empirical analysis. Wedescribe the data, our empirical specification, and our estimation results, thendiscuss in some detail the interpretation of the results. We consider a varietyof alternative explanations. We then estimate the social welfare cost of thedifferential tax treatment across organizational forms that is implied by oureconometric analysis, and summarize the findings in Section III.
I. Theoretical Framework
A. Model ofa Firm's Choice of Organizational Form
We begin with a simple model that determines the equilibrium allocation ofresources across different organizational forms as a function of tax rates andnontax factors. For now we leave "nontax factors" largely unspecified; wereturn to them in Section I.e. For simplicity, we allow for only two classes ofownership: one that is taxed at both the corporate and personal level (corporate) and another that is taxed only at the personal level (noncorporate). Thedouble-taxation of corporate income has been the focus of studies of corporate
1 See Fama and Jensen (1983a,b) for a discussion of the role of various nontax factors in thechoice of organizational form. In a companion article, Gordon and MacKie-Mason (1994), we testsome of these hypotheses empirically and fmd,consistent with Fama and Jensen, that industrieswhere the average firm size is large and where' firms face more risk are more heavily corporate.
How Much Do Taxes Discourage Incorporation? 479
debt/equity decisions; we examine its role in the determination of ownershipstructure.
If there were no taxes, when should a firm choose to incorporate? Assumethat a firm, if it is noncorporate, would earn economic income of I. If instead itincorporates, its economic income would change to I + g due to a variety ofnontax differences between the corporate and noncorporate forms of organization that affect the profitability of the firm. (g can be negative and will vary byfirm). Without tax distortions, firms would incorporate ifg > 0, and conversely.
But the tax law treats income of corporate and noncorporate firms differently. In particular, a noncorporate firm would have taxable income of someamount Ix which would be subject to tax as ordinary personal income of thepartners/proprietors. Denote the personal tax rate on this income by 'TN. 2 Anoncorporate firm's net-of-tax income is therefore I - 'TNIx•
If the firm incorporates, its income is subject not only to corporate taxes butalso to personal taxes on any resulting payouts to shareholders or any realizedcapital gains. In addition.fhe definition of taxable income under the corporatetax differs in a variety of detailed ways from that faced by noncorporate firms.For example, the tax treatment of such items as capital gains, fringe benefits,tax losses, and tax preferences, differs between corporate and noncorporatefirms. Corporate and noncorporate taxable income may also differ becausecorporations intentionally shift income between the corporate and noncorporate tax bases, e.g., through debt finance. We postpone discussion of the effectsof income shifting until Section II.G.
We capture the effects of any differences in the definition of taxable incomeby adjusting the tax rate appropriately. In particular, assume that if a firmincorporates, it generates taxable income of Ix + g which is taxed at aneffective corporate tax rate of "c- Shareholders in the corporation then facepersonal income taxes on the income left after corporate taxes- dividendincome is taxed at ordinary rates, while capital gains are taxed at lower rates.The specific tax rates, of course, vary by investor. However, as shown, forexample, in Gordon and Bradford (1980), when a firm's equity is traded freelyin the financial markets, without constraints, then the implicit personal taxrates affecting firm behavior can be expressed as a weighted average of the taxrates faced by each individual investor in the firm. Let 'TE represent the implicitpersonal tax rate per dollar of equity income, taking as given the division ofthis income between dividends and capital gains.s Also, let 'T denote the overall
2 For a sole proprietorship, this tax rate simply equals the marginal tax rate of the soleproprietor. For firms with several owners, TN will equal a Weighted average of the tax rates of eachof the owners. See below for a discussion of the effects of variation in TN across investors.
3 Of course, firms can choose their dividend payout rate taking into account differences betweenthe tax treatment of dividends and (realized and unrealized) capital gains. By using observeddividend payout rates in calculating TE, we take into account any realized tax savings that resultfrom the choice of payout rate, although we ignore any nontax implications of this choice. Thenature of these nontax factors is too poorly understood to justify adding further complications toour measure of tax distortions.
480 The Journal of Finance
effective tax rate on corporate income, so that 'T == "c + (1 - 'TC)'TE' A corporation's net-of-tax profits equals I + g - 'T(Ix + g).
The net cost from incorporating therefore equals
(1)
In general, this expression (and each term) can be of either sign.s Each of theparameters in this expression can differ by firm, leading some firms to prefercorporate form and others to remain noncorporate.
In general, those firms will incorporate for which
(2)
The expression in parentheses on the right-hand side measures the size of thetax distortion affecting the choice of organizational form, which we denote byT. As a result of this distortion, at least some firms will choose a less efficientorganizational form in order to reduce tax liabilities. In particular, if the ratiog/lx is distributed across firms with Ix > 0 according to the cumulative distribution function ep+(gIIx) and among firms with Ix < 0 according to the distribution function ep-(gIIx)' then this equation implies that the fraction of theprofitable firms that choose to be noncorporate will equal ep+(T) and thenoncorporate fraction among firms with losses will equal 1 - ep-(T).
Note that the relation between T and incorporation is not monotonic. Increasing T lowers the fraction of firms that incorporate among firms withtaxable profits (Ix > 0), and raises it for firms with Ix <0. Firms with tax losses(Ix < 0) gain more from deducting losses when the tax rate they face is higher.Until the Tax Reform Act of 1986, owners of noncorporate firms could deducttax losses from their taxable income from other sources; corporations with taxlosses could use these losses to save on taxes through merger with a profitableentity, or by tax loss carrybacks or carry forwards.
If g were zero, then expression (2) also implies that if firms have lossesduring some periods and profits during other periods, then they should changeorganizational form at the transition point. When g is nonzero, the value of Ixat which the firm changes organizational form becomes -gIT. Similarly, ifpartof a firm generates negative taxable income while the rest of the firm earnsprofits, then the firm should try to sell off whichever part is not being taxed atthe appropriate tax rate, so that each part can choose the more advantageousorganizational form. Tax shelters often seem designed to take advantage ofthese incentives. A common life history for a firm is to start noncorporate,
4 Ix can be negative for a variety of reasons. First, even if its ex ante value were positive, its expost value could be negative. Second, for multi-period investments, expected taxable income couldbe negative in some years and positive in others. Third, even if the real income to equity werepositive, this expression equals the real income to the firm minus the nominal income to debt.Finally, even if I were positive, L; could be negative due to the effects of accelerated depreciation,etc.
How Much Do Taxes Discourage Incorporation? 481
when high start-up costs cause it to run tax losses, and then to incorporateonce the firm becomes profitable.
The key objective of this article is to measure empirically the impact ofchanges in the tax distortion T on the aggregate division of business activitybetween corporate and noncorporate forms, using data from the United Statesduring the period 1959-1986. Since variation in tax rates has been ratherlimited, in effect we will be estimating acp+(T)laT for firms with tax profits and1 - acp-(T)laT for firms with tax losses.
In the derivation justifying such an estimation strategy we have made anumber of simplifying assumptions, however, which merit further discussion.One implicit assumption, for example, is that firms can change their organizational form instantaneously and without cost. Yet there are a variety of taxand other transaction costs of changing organizational form, and limits on thefrequency of such changes, that in principle would introduce an intertemporalaspect into the analysis." In principle, therefore, firms should base organizational form decisions on future as well as current incentives, and may notrespond to potential tax gains that are too small or too temporary to justify thetransactions costs of a change in form.
Not all means of shifting the composition of activity between corporate andnoncorporate forms of ownership generate such transactions and tax costs,however. Investment rates can differ, for example, between existing corporateand noncorporate firms without generating transactions costs, and in theprocess change the relative sizes of the two sectors. In addition, new firms canchoose between organizational forms without incurring extra transactionscosts at that date. Exit rates could also differ between corporate and noncorporate firms. Transactions costs and limitations are important primarily forcertain changes of organizational form by existing firms, and these changesexplain only part of the aggregate shifts between corporate and noncorporatestatus. To test for evidence of transactions costs, however, we try includingfuture as well as current tax rates in the analysis, and test for a gradualresponse to past tax changes.
Another simplifying assumption is that TN is the same for all taxpayers in agiven year. Yet, the personal income tax generates important differences ineffective personal tax rates across investors. Behavior should differ across taxbrackets-a firm whose owners face very high personal tax rates would chooseto be noncorporate only if it generates sufficient tax losses so tax considerations outweigh any nontax factors, whereas a firm whose owners are in lowtax brackets would choose the noncorporate form only if its taxable income ishigh enough. As a result, firms with extreme levels of taxable income, bothpositive and negative, should be more likely to become noncorporate. Consistent with this, noncorporate rates ofretum reported in the Statistics ofIncome
5 For example, when a C corporation converts to a partnership or sole proprietorship, it facesrecapture of certain tax benefits, the cost of which has varied substantially over time. Furthermore, corporations cannot shift between C status and subchapter S status more than once everyfive years.
482 The Journal ofFinance
differ much more between firms with gains and losses than they do forcorporations. In some specifications reported here, we test for variation in theeffective personal tax rates faced by firms earning positive and negativeincome."
The above derivation also assumed that the cumulative distribution functions, <1>+ and <1>-, remain stable over time." Intertemporal variation in thesedistribution functions creates bias to the extent to which these variations arecorrelated with changes in the size of the tax distortion. We take severalapproaches to try to control for possible changes over time in these distributionfunctions. First, we add a quadratic function of time to the specification. Inaddition, we will include cyclical indicators to capture changes over time in thedistribution of the Ix. Finally, we will control for key changes in the regulationsthat differently affect corporate and noncorporate organizational forms, tocapture important changes in the distribution of g. Omitted sources of variation can still potentially affect our estimates, however.
B. Tax Effects Other Than Tax Rates
The above discussion focuses primarily on differences in tax rates affectingdifferent organizational forms. However, there are a multitude of other taxprovisions that differ by organizational form, as described in detail in Scholesand Wolfson (1987,1990,1991). We summarize some of these provisions, eventhough we are in a position to estimate the effects of only a few of them in theempirical work.
Rules Governing Election. A business must satisfy some restrictions in orderto avoid corporate taxes. Often, for example, firms that are legally organized aspartnerships are required by the IRS to pay corporate taxes. In general, a firmwill be taxed as a corporation unless it fails two of the following criteria: (1)continuity of life; (2) centralized management; (3) easy transferability of ownership shares; and (4) limited liability."
A firm that is deemed to be a corporation under the criteria above can stillavoid the corporate-level tax if it qualifies for S corporation status. The maincriteria for S corporation eligibility as of the end of our sample period (1986)were (1) no more than 35 shareholders; (2) no corporate shareholders; (3) notpart of an affiliated group; (4) only one class of stock; and, (5) not a domestic
6 In a companion article (Gordon and MacKie-Mason (1994», we analyze in detail the effects onequilibrium allocations of differences in personal tax rates across investors and differences intaxable income across industries. Given data limitations faced when dealing with such a complexsetting, however, this companion article is limited to simulating the model using plausible values.In contrast, in this article our objective is to test the model's ability to forecast empirically.
7 The fraction of firms with profits or losses can change without generating problems, though.8 For much of the 1980s it was possible to form a master limited partnership (MLP) that had
most of the characteristics of a corporation, including limited liability for the partners andpublicly-traded ownership shares, yet was taxed as a partnership. However the U.S. 1987 tax lawinstituted rules that require nearly all master limited partnerships to be taxed as corporations,except for oil, gas, and real estate firms. See Gentry (1994) for tests of tax effects using MLP data.
How Much Do Taxes Discourage Incorporation? 483
international sales corporation (DISC). The rules governing eligibility for Scorporation status have changed frequently since S corporations were createdin 1957. Table V summarizes some of the key changes during our sampleperiod. We examine the effects of a number of these rule changes in Section II.
Pensions and Fringe Benefits. Opportunities for tax-deferred savings andfringe benefit deductibility have varied across organizational forms and overtime. For example, partners and sole proprietors (unincorporated firms withone owner and unlimited liability) can use individual-oriented qualified savings plans such as Keogh accounts. Corporate pension funds have differentrules on deduction limits and other characteristics. In addition, more fringebenefits provided to employees are deductible for corporations than for partnerships and sole proprietorships (including, until 1986, health insurancepremiums). S corporations have faced corporate tax treatment of fringes during some years, and personal tax treatment during others.
Loss Offsets and At-Risk Rules. One significant advantage for partnershipsand sole proprietorships is the ability to offset business losses against othersources of personal income when figuring tax liability. A C corporation canoffset losses only against its own income during the past three years or in somenumber of future years. Before 1983, S corporation losses faced a third set ofrules; since 1983 they are treated the same as C corporations. Some of our testsbelow allow the effective corporate tax rate to differ between firms with taxprofits and tax losses.
In 1976 "at-risk" rules were applied to partnerships, restricting loss deductions to the amount for which an investor is personally at risk. These ruleswere a response to the growing use of schemes that leveraged investments bylimited partners in order to sell large tax losses to high tax rate investors whocould immediately deduct them during the early years of a partnership whiledeferring taxes on gains until years later (when they were taxed at the usuallylower tax rate of the at-risk investor). These schemes were particularly prevalent for real estate and leasing deals that took advantage of depreciation andinterest deduction rules (but there were also some rule exceptions for realestate investment). At-risk rules were applied to S corporation shareholdersbeginning in 1978. We test below for the effects of these "at-risk" rules.
Passive and Foreign Income. Before 1982, firms earning foreign-source orpassive (e.g., portfolio or limited partner) income were not allowed to registeras S corporations. With the U.S. 1986 Tax Reform Act, passive losses accruingto partners and S corporation shareholders could be offset only against othersources of passive income and not against ordinary income. Beginning in 1972,a C corporation could receive favored tax treatment on export business if itqualified as a Domestic International Sales Corporation (DISC). S corporationshave never been allowed to obtain DISC treatment.
Capital Gains Provisions. In general, capital gains are taxed more favorablyat the personal than at the corporate level, creating an incentive not toincorporate for firms earning substantial income in the form of capital gains.
484 The Journal ofFinance
However, under the General Utilities Doctrine, C corporations could separately incorporate an asset before it was sold and then distribute the liquidation proceeds directly to shareholders without incurring capital gains tax atthe corporate level. As a result, the tax rate on realized capital gains shouldhave been roughly equivalent for corporate and noncorporate firms. The General Utilities Doctrine was repealed in 1986, although it took three more yearsto close several important loopholes. To prevent firms from shifting to Scorporate status just before liquidation in order to avoid corporate-level capitalgains taxation, a related provision (Section 1374) was also enacted in 1986 thatrequires firms that convert to S status to pay tax at the top corporate rate onany "built-in gains" realized during the 10 years following a conversion.
Alternative Minimum Tax. C corporations face an alternative minimum tax(AMT) when taxable income is low due to substantial tax preference items, butfor many years this AMT was not binding on more than a few firms. Noncorporate firms were not subject to the corporate AMT. In 1986 a much strongerAMT was legislated, which included 50 percent of the difference between bookand taxable income in the alternative tax base. (This provision was modified in1990 and repealed as of 1994.) S corporations were not subject to this tax,which was important for firms with substantial book relative to taxable income. However, a new personal-level alternative minimum tax was also instituted in 1986 that is of importance for investors with substantial passivelosses.
Summary. It should be clear from this review that there are numerous taxrule differences that are not easily captured in the formulation of expression(2) but that should affect the allocation of economic resources across organizational forms. In our empirical analysis we exploit the fact that a number ofthese provisions have changed during our sample period, providing us alimited opportunity to test for their effects.
C. Non-Tax Factors
The two main explanations commonly given for a nontax advantage, g, to thecorporate form of organization are first that corporations face limited liabilityand second that they can trade their shares publicly. How important andconvincing are these explanations?
Limited Liability. In principle, corporate shareholders have limited liability, whereas partners and unincorporated sole proprietors have unlimitedliability. However, these are only the "default" rules, defining the allocation ofliabilities that are not otherwise allocated by explicit contracts-through recontracting, these rules can be, and often are, undone. For example, it is verycommon that the shareholders of small corporations must pledge personalassets if they wish to obtain external bank financing. Partnerships, on theother hand, can write liability limits into contracts with lenders, suppliers,customers, and so forth.
How Much Do Taxes Discourage Incorporation? 485
The legal difference in the default provisions concerning liability for corporate versus noncorporate firms is therefore important only to the degree thatexplicit recontracting imposes transactions costs-in some cases, these costswill be large enough that the less favorable rule is left in place. Differences inthese provisions are therefore more important when contracting costs arelarger.
Even when contracting costs prevent differences in default liability provisions from being undone by explicit contract provisions, it is still not clearwhether making limited liability the default provision for corporations favorsthe corporate form of organization. To the extent that equity holders are betterinformed than debt holders concerning the future prospects for the firm,limited liability exacerbates problems created by asymmetric informationwhen firms try to borrow. Conversely, if existing shareholders have privateinformation about the firm's potential liabilities (or future prospects) notavailable to new shareholders, then the lemons problem when shares are soldto new shareholders may be lessened because liability is limited for the newshareholders.9
Another complication is that some firms are taxed only at the personal level,yet still have limited liability. One clear example would be subchapter Scorporations. Another is limited partnerships. In a limited partnership onlythe general partner-who may own no more than 1 percent of the equitycapital-need bear unlimited liability. The limited partners, similar to corporate shareholders, are liable only to the extent of their investment. In fact, thegeneral partner can even be a corporation, which bears general liability butonly to the limit of the corporation's wealth, with no further recourse to thecorporation's shareholders.l?
Public Trading of Shares. Corporations are also said to have an advantagedue to their ability to trade their shares publicly. It is widely agreed thatpublicly-traded firms have access to lower-cost equity capital. In addition,publicly-traded shares may provide an important instrument for the amelioration of principal-agent problems between managers and owners. In principle, a manager's compensation should be tied to his contribution to the valueof the firm. If shares are publicly traded, then the value ofthe firm (though notnecessarily the manager's contribution to it) would be observable continuously,allowing compensation and retention decisions for managers to be tied toperformance period by period. In particular, firms commonly tie a manager's
9 Existing shareholders also have private information about their personal assets. With unlimited liability, the potential losses to any new shareholder depend in part on the personal assets ofexisting shareholders, since shareholders have joint and several liability. This creates yet adifferent type of lemons problem, one that is again avoided with limited liability. For furtherdiscussion, see Winton (1993).
10 This approach appears to provide partnerships the same limited liability protection ascorporations. However, limited partners cannot directly participate in management without losingtheir partnership tax treatment, creating hidden information and moral hazard costs. Some moralhazard costs of limited partnerships are considered in Wolfson (1985a, 1985b); MacKie-Mason(1987) examines some hidden information costs. See also Fellingham and Wolfson (1985).
486 The Journal ofFinance
compensation to the firm's share value, via share-purchase pension plans,stock options, etc., as documented for example in Murphy (1986). Withoutpublic trading of shares, compensation and retention decisions must be basedon cruder measures of performance, e.g., accounting information from thefirm's income statement and balance sheet. In principle, however, any resulting measurement errors in compensation decisions period by period can eventually be corrected as long as there is an accurate assessment of the value ofthe firm at the date the manager resigns/retires, as occurs for a sole proprietorwhen he sells his business. In the meantime, business decisions may sufferfrom the fact that they must be based on cruder information about the firm'sperformance, putting noncorporate firms at a disadvantage.
For the most part, regulations that affect public trading of shares andlimited liability differently for corporate and noncorporate firms have notchanged over time, nor is there any obvious reason why the economic importance of these differing regulations have changed over time. If so, then whatever their importance we can estimate the effects of tax changes appropriately,using time series data. To protect against gradual changes in regulations (ortheir economic importance) that may have occurred, we add time trends to allspecifications. In addition, we describe below several detailed regulatorychanges that did occur during the sample period, and test for their importancein the empirical work.
If, Empirical Analysis
We now estimate the degree to which various measures of the allocation ofresources and economic activity across organizational forms has responded tochanges in tax incentives. We rely on aggregate U.S. tax return data madepublic by the IRS; individual business tax returns are not publicly available.
A. Overview and Data
We use data covering the period 1959-1986. The data are collected fromnumerous IRS publications and data tapes, and are carefully checked foraccuracy. We have measures for about a dozen income statement and balancesheet items as reported to the IRS for C corporations, S corporations, partnerships, and sole proprietorships. We have data for 7 industry aggregates thatcorrespond to the SIC I-digit aggregates.P For net income, losses, and someother variables we have separate data for firms that reported positive netincome and firms with losses. Unfortunately, the IRS does not report assetdata separately for profit and loss firms for all organizational forms.
11 Because some necessary farm information was not reported by the IRS during the 1980s, wehad to remove Industry 1-Agriculture, Forestry, and Fishing-from all of our data, leaving usonly 7 of the 8 standard industry aggregates.
How Much Do Taxes Discourage Incorporation? 487
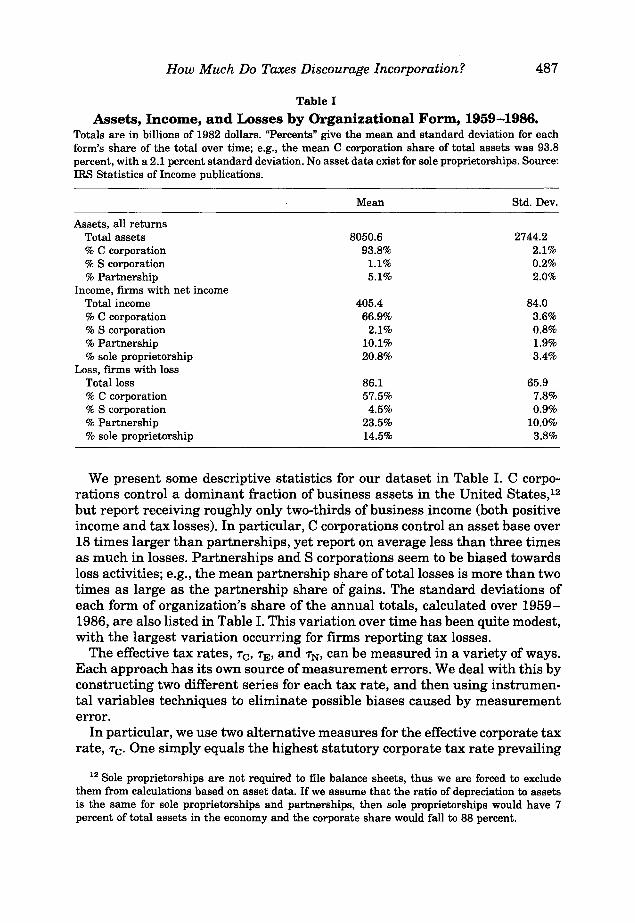
Table I
Assets, Income, and Losses by Organizational Form, 1959-1986.Totals are in billions of 1982 dollars. "Percents" give the mean and standard deviation for eachform's share of the total over time; e.g., the mean C corporation share of total assets was 93.8percent, with a 2.1 percent standard deviation. No asset data exist for sole proprietorships. Source:IRS Statistics of Income publications.
Mean Std. Dev.
Assets, all returnsTotal assets 8050.6 2744.2% C corporation 93.8% 2.1%% S corporation 1.1% 0.2%% Partnership 5.1% 2.0%
Income, firms with net incomeTotal income 405.4 84.0% C corporation 66.9% 3.6%% S corporation 2.1% 0.8%% Partnership 10.1% 1.9%% sole proprietorship 20.8% 3.4%
Loss, firms with lossTotal loss 86.1 65.9% C corporation 57.5% 7.8%% S corporation 4.5% 0.9%% Partnership 23.5% 10.0%% sole proprietorship 14.5% 3.8%
We present some descriptive statistics for our dataset in Table I. C corporations control a dominant fraction of business assets in the United States.Pbut report receiving roughly only two-thirds of business income (both positiveincome and tax losses). In particular, C corporations control an asset base over18 times larger than partnerships, yet report on average less than three timesas much in losses. Partnerships and S corporations seem to be biased towardsloss activities; e.g., the mean partnership share of total losses is more than twotimes as large as the partnership share of gains. The standard deviations ofeach form of organization's share of the annual totals, calculated over 19591986, are also listed in Table I. This variation over time has been quite modest,with the largest variation occurring for firms reporting tax losses.
The effective tax rates, Te, TE, and TN' can be measured in a variety of ways.Each approach has its own source of measurement errors. We deal with this byconstructing two different series for each tax rate, and then using instrumental variables techniques to eliminate possible biases caused by measurementerror.
In particular, we use two alternative measures for the effective corporate taxrate, "c- One simply equals the highest statutory corporate tax rate prevailing
12 Sole proprietorships are not required to file balance sheets, thus we are forced to excludethem from calculations based on asset data. If we assume that the ratio of depreciation to assetsis the same for sole proprietorships and partnerships, then sole proprietorships would have 7percent of total assets in the economy and the corporate share would fall to 88 percent.
488 The Journal of Finance
in each year. While the true rate may differ from this due, for example, to thelower rates faced on the first $100,000 of income for each firm and due toloss-offset provisions, the variation in the effective tax rate over time should bedominated by movements in the statutory rate. Our second measure of "cequals observed aggregate corporate income tax liabilities (before variouscredits) divided by aggregate corporate taxable income.
For the personal tax rate on ordinary income ('TN), we also use two alternative approaches to measure this representative tax rate for those potentiallyinvesting in noncorporate businesses. One approach is simply to set 'TN equalto the highest statutory marginal personal tax rate in each year. While not allnoncorporate owners are in the top tax bracket, this rate should still be highlycorrelated over time with the effective value of 'TN' An alternative approach weuse for measuring 'TN is to infer the tax rate of the marginal owner of municipalbonds by comparing the yields on otherwise comparable Treasury and municipal bonds. We use an estimate ofthis implicit tax rate carefully calculated byKochin and Parks (1988) and Poterba (1989).
To estimate the personal tax rate on equity income ('TE) we assume that thefraction d of nominal income accruing to equity holders takes the form ofdividends, and that capital gains are always realized long-term. Then 'TE = d'TN
+ (l - d)Kex'TN where K measures the fraction of long-term gains that aretaxable, and ex is an adjustment to make the capital gains tax rate "accrualequivalent." This captures the benefits from deferring accruing tax liabilitiesuntil the asset is sold plus the benefits from the capital gains tax exemption onassets still held at death. Following Feldstein, Dicks-Mireaux, and Poterba(1983), we assume that ex = 0.25. 13 We estimate d by taking the ratio ofcorporate dividend payments to after-tax corporate profits as reported in theNational Income and Product Accounts. 14 We use the statutory time-series forthe capital gains exclusion, K.
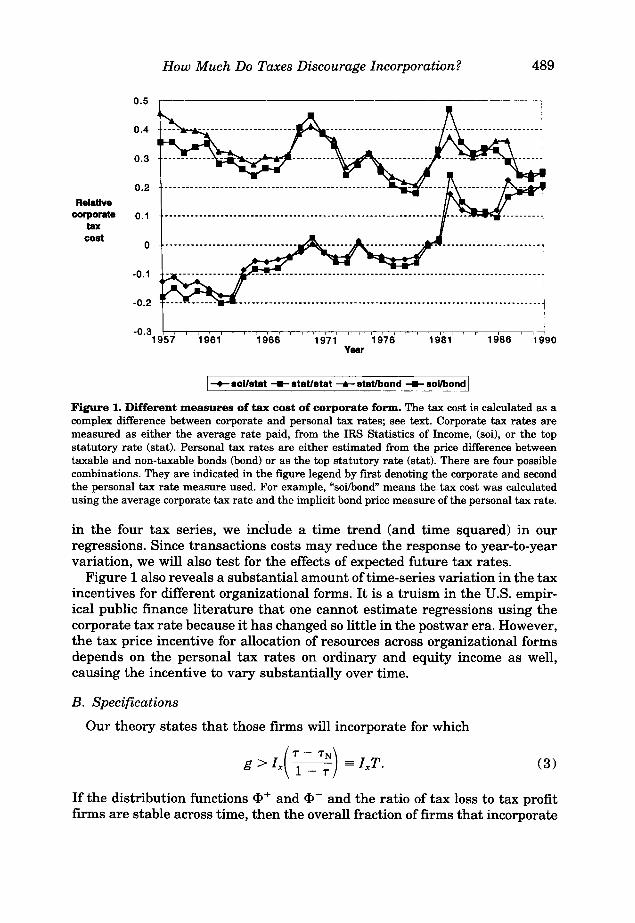
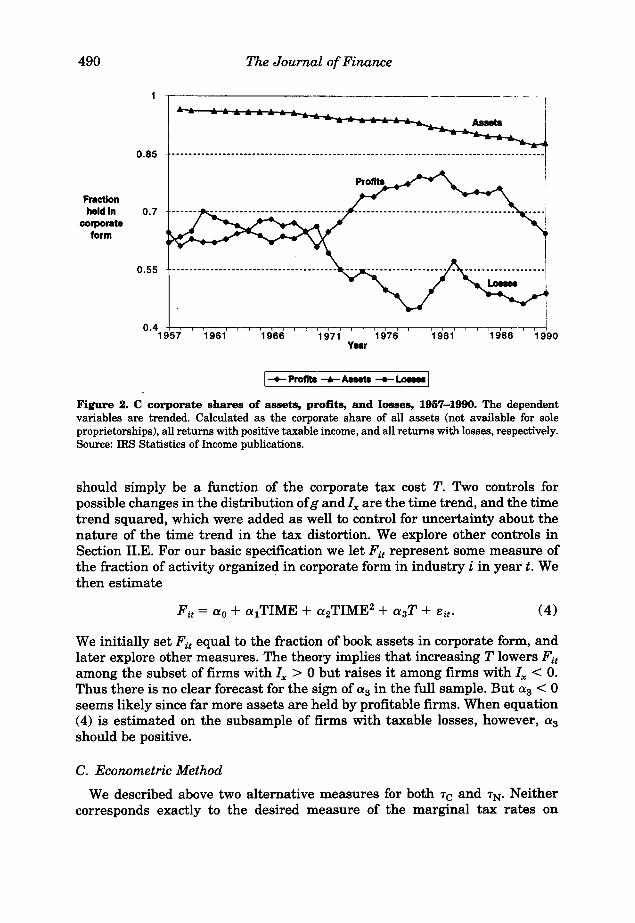
Since we have two different measures of both 'Tc and 'TN, we have in principlefour different time-series measures of the difference between the total taxburden on corporate income and the tax burden on noncorporate income('T - 'TN)' All four series are plotted in Figure 1. For comparison, in Figure 2 weplot the time series for the fractions of book assets, profits, and losses reportedin corporate form. The main difference between the four tax rate series is in thelevel and time trend. In particular, the two tax-cost series with 'TN set to thehighest statutory personal tax rate trend upwards, while the two series with 'TN
set to the implicit tax rate estimated from bond interest rates trend downwards. Year to year variation in each of the four series, in contrast, is highlycorrelated. To focus on this year to year variation rather than the time trends
13 Recent research on optimal trading strategies suggests that the effects of the tax treatmentof capital gains may be far more complicated than can be captured with an estimated O! that isconstant over time. See Gordon and MacKie-Mason (1990) for further discussion. In addition, O!
should be a function of interest rates, which vary over time.14 We did not attempt to make use of industry variation in d in the analysis, fearing that such
variation could serve as a proxy for other omitted factors affecting the choice of organizationalform, e.g., variation in Ix by industry.
How Much Do Taxes Discourage Incorporation? 489
--- -- ---- ---- --- --- ---- --- ----- ---- -- --- --- --- -- ----_....-----_. ---jI
----- ------- -------- ------------------------------------- ----_.. --_. ---j
0.5
0.4
0.3
0.2
Relativecorporate 0.1
taxcost
0
-0.1
-0.2
-0.31957 1961
Vesr
1__ sollstat ....... statlstat ....... stat/bond ....... solfbond I
Figure 1. Different measures of tax cost of corporate form. The tax cost is calculated as acomplex difference between corporate and personal tax rates; see text. Corporate tax rates aremeasured as either the average rate paid, from the IRS Statistics of Income, (soi), or the topstatutory rate (stat). Personal tax rates are either estimated from the price difference betweentaxable and non-taxable bonds (bond) or as the top statutory rate (stat). There are four possiblecombinations. They are indicated in the figure legend by first denoting the corporate and secondthe personal tax rate measure used. For example, "sci/bond" means the tax cost was calculatedusing the average corporate tax rate and the implicit bond price measure of the personal tax rate.
in the four tax series, we inciude a time trend (and time squared) in ourregressions. Since transactions costs may reduce the response to year-to-yearvariation, we will also test for the effects of expected future tax rates.
Figure 1 also reveals a substantial amount of time-series variation in the taxincentives for different organizational forms. It is a truism in the U.S. empirical public finance literature that one cannot estimate regressions using thecorporate tax rate because it has changed so little in the postwar era. However,the tax price incentive for allocation of resources across organizational formsdepends on the personal tax rates on ordinary and equity income as well,causing the incentive to vary substantially over time.
B. Specifications
Our theory states that those firms will incorporate for which
(3)
If the distribution functions <1>+ and <1>- and the ratio of tax loss to tax profitfirms are stable across time, then the overall fraction of firms that incorporate
490 The Journal ofFinance
,------------------------ ---_.
0.85 -------------_.--••_•• --_.----- ----------------- --------- -----------------. - --. ---------
Fractionheld In 0.7
corporateform
0.55
0.41957 1961 1966 '1971' , , '1976
Yeer
I I1990
1__ profits ........A8Ht8 --a.-IFigure 2. C corporate shares of assets, profits, and losses, 1957-1990. The dependentvariables are trended. Calculated as the corporate share of all assets (not available for soleproprietorships), all returns with positive taxable income, and all returns with losses, respectively.Source: IRS Statistics of Income publications.
should simply be a function of the corporate tax cost T. Two controls forpossible changes in the distribution ofg and Ix are the time trend, and the timetrend squared, which were added as well to control for uncertainty about thenature of the time trend in the tax distortion. We explore other controls inSection II.E. For our basic specification we let Fit represent some measure ofthe fraction of activity organized in corporate form in industry i in year t. Wethen estimate
(4)
We initially set Fit equal to the fraction of book assets in corporate form, andlater explore other measures. The theory implies that increasing T lowers Fitamong the subset of firms with Ix > 0 but raises it among firms with Ix < O.Thus there is no clear forecast for the sign of a3 in the full sample. But a3 < 0seems likely since far more assets are held by profitable firms. When equation(4) is estimated on the subsample of firms with taxable losses, however, a3
should be positive.
C. Econometric Method
We described above two alternative measures for both 'Tc and 'TN' Neithercorresponds exactly to the desired measure of the marginal tax rates on
How Much Do Taxes Discourage Incorporation? 491
corporate and personal income. To deal with these measurement problems, wemake use of an instrumental variables (N) method.
Consider first the two corporate tax rate series: one constructed using thehighest statutory marginal rate which we denote by C I , and the other usingthe realized average tax rate which we denote by Cz. Cz has the advantage thatit captures the effects of progressivity in the tax law and no-loss-offset provisions. It will have measurement error for several reasons, however. First, itmeasures the ex post tax rate, yet organizational form decisions are plausiblybased on the expected value of this rate judged some period ahead of time. Inaddition, accounting measures of taxable income and tax payments differ in avariety of ways from the desired figure.V Third, Cz is constructed using thesame measure of corporate taxable income that is used in the construction ofthe dependent variable, introducing a potential endogeneity bias. (This biaswill be smaller in the regressions using industry data, since the tax measureuses aggregate data while the dependent variable uses industry data.)
Due to these various sources of measurement error,
C z = TC + e.
We assume that e and TC are orthogonal-this would certainly be the caseunder the first source of measurement error, and seems plausible for the othertwo sources as well. The statutory tax rate, CI , is certainly correlated with thetrue "c» but its correlation with s should be minimal-the statutory tax rate isknown ex ante so it is uncorrelated with new ex post information, and it doesnot depend on taxable income or on any idiosyncrasies in accounting dataabout taxable income or tax payments. Therefore, it makes a suitable instrumental variable.
Similarly, we have two separate measures of the personal tax rate, TN: thehighest statutory personal tax rate, which we denote by PI' and the implicittax rate embodied in the tax-exempt interest rate, denoted by Pz. The lattermeasure should provide a better approximation to the true tax rate, TN' butwill still suffer from several sources of measurement error. First, while municipal bonds are tax exempt, noncorporate firms that earn tax losses shouldattract investors in yet higher tax brackets, while noncorporate firms (e.g., soleproprietorships) that generate positive taxable income would attract investorsin lower tax brackets. The relative values of the effective tax rates on municipal bonds and on noncorporate income would then change over time, due, forexample, to changing wealth distributions. In addition, the relative interestrates on taxable and tax-exempt bonds reflect expected future tax policies,whereas TN is a measure of the current effective tax rate. While PI willcertainly be highly correlated with TN' it should not be correlated with these
15 For example, the carryforwards and carrybacks that show up in any given year's returns arethose arising from losses in other tax years, not from losses occurring that year. Corporate taxsavings from more generous fringe benefit provisions do not show up in these figures. Also, foreignsource income contaminates the measured tax rate.
492 The Journal ofFinance
Table II
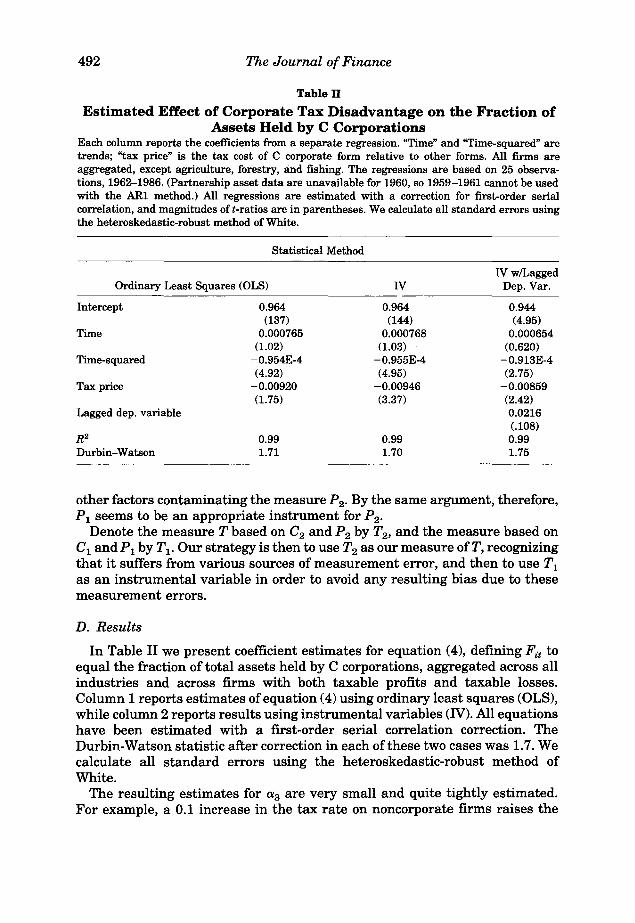
Estimated Effect of Corporate Tax Disadvantage on the Fraction ofAssets Held by C Corporations
Each column reports the coefficients from a separate regression. "Time" and "Time-squared" aretrends; "tax price" is the tax cost of C corporate form relative to other forms. All firms areaggregated, except agriculture, forestry, and fishing. The regressions are based on 25 observations, 1962-1986. (Partnership asset data are unavailable for 1960, so 1959-1961 cannot be usedwith the AR1 method.) All regressions are estimated with a correction for first-order serialcorrelation, and magnitudes oft-ratios are in parentheses. We calculate all standard errors usingthe heteroskedastic-robust method of White.
Statistical Method
NwlLaggedOrdinary Least Squares (OLS) N Dep. Var.
Intercept 0.964 0.964 0.944(137) (144) (4.95)
Time 0.000765 0.000768 0.000654(1.02) (1.03) (0.620)
Time-squared -0.954E-4 -0.955E-4 -0.913E-4(4.92) (4.95) (2.75)
Tax price -0.00920 -0.00946 -0.00859(1.75) (3.37) (2.42)
Lagged dep. variable 0.0216(.108)
R2 0.99 0.99 0.99Durbin-Watson 1.71 1.70 1.75
other factors contaminating the measure P2' By the same argument, therefore,P1 seems to be an appropriate instrument for P2'
Denote the measure T based on C2 and P2 by T2 , and the measure based onC1 and P1 by T l' Our strategy is then to use T2 as our measure of T, recognizingthat it suffers from various sources of measurement error, and then to use T1
as an instrumental variable in order to avoid any resulting bias due to thesemeasurement errors.
D. Results
In Table II we present coefficient estimates for equation (4), defining Fit toequal the fraction of total assets held by C corporations, aggregated across allindustries and across firms with both taxable profits and taxable losses.Column 1 reports estimates of equation (4) using ordinary least squares (OLS),while column 2 reports results using instrumental variables (N). All equationshave been estimated with a first-order serial correlation correction. TheDurbin-Watson statistic after correction in each of these two cases was 1.7. Wecalculate all standard errors using the heteroskedastic-robust method ofWhite.
The resulting estimates for a3 are very small and quite tightly estimated.For example, a 0.1 increase in the tax rate on noncorporate firms raises the
How Much Do Taxes Discourage Incorporation? 493
Table III
Estimated Effect of Corporate Tax Disadvantage on the Fraction ofGains and Losses Reported by C Corporations
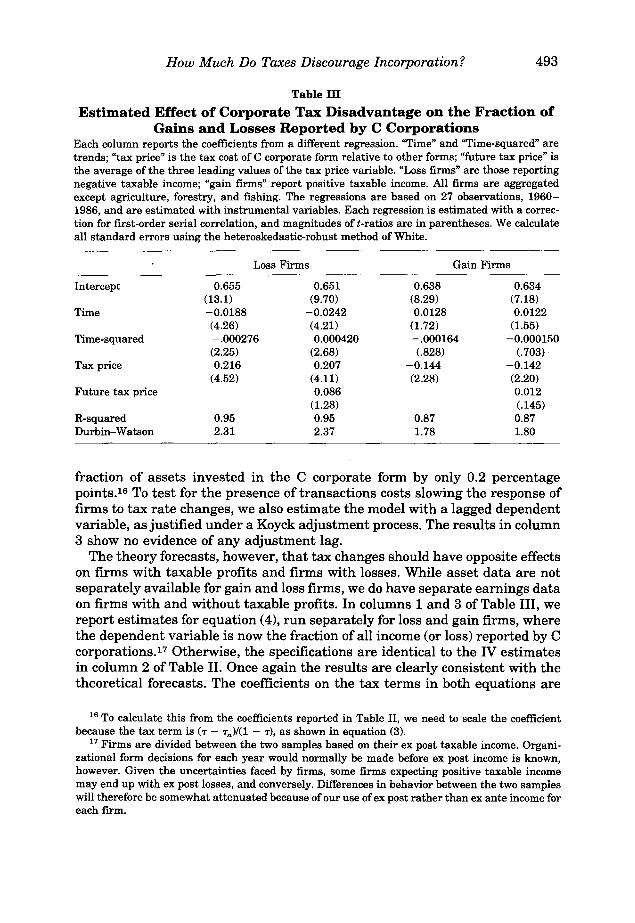
Each column reports the coefficients from a different regression. "Time" and "Time-squared" aretrends; "tax price" is the tax cost of C corporate form relative to other forms; "future tax price" isthe average of the three leading values of the tax price variable. "Loss firms" are those reportingnegative taxable income; "gain firms" report positive taxable income. All firms are aggregatedexcept agriculture, forestry, and fishing. The regressions are based on 27 observations, 19601986, and are estimated with instrumental variables. Each regression is estimated with a correction for first-order serial correlation, and magnitudes of t-ratios are in parentheses. We calculateall standard errors using the heteroskedastic-robust method of White.
Loss Firms Gain Firms
Intercept 0.655 0.651 0.638 0.634(13.1) (9.70) (8.29) (7.18)
Time -0.0188 -0.0242 0.0128 0.0122(4.26) (4.21) (1.72) (1.55)
Time-squared -.000276 0.000420 -.000164 -0.000150(2.25) (2.68) (.828) (.703)
Tax price 0.216 0.207 -0.144 -0.142(4.52) (4.11) (2.28) (2.20)
Future tax price 0.086 0.012(1.28) (.145)
R-squared 0.95 0.95 0.87 0.87Durbin-Watson 2.31 2.37 1.78 1.80
fraction of assets invested in the C corporate form by only 0.2 percentagepoints.w To test for the presence of transactions costs slowing the response offirms to tax rate changes, we also estimate the model with a lagged dependentvariable, as justified under a Koyck adjustment process. The results in column3 show no evidence of any adjustment lag.
The theory forecasts, however, that tax changes should have opposite effectson firms with taxable profits and firms with losses. While asset data are notseparately available for gain and loss firms, we do have separate earnings dataon firms with and without taxable profits. In columns 1 and 3 of Table III, wereport estimates for equation (4), run separately for loss and gain firms, wherethe dependent variable is now the fraction of all income (or loss) reported by Ccorporations.!" Otherwise, the specifications are identical to the IV estimatesin column 2 of Table II. Once again the results are clearly consistent with thetheoretical forecasts. The coefficients on the tax terms in both equations are
16 To calculate this from the coefficients reported in Table II, we need to scale the coefficientbecause the tax term is ('T - 'Tn )/(1 - 'T), as shown in equation (3).
17 Firms are divided between the two samples based on their ex post taxable income. Organizational form decisions for each year would normally be made before ex post income is known,however. Given the uncertainties faced by firms, some firms expecting positive taxable incomemay end up with ex post losses, and conversely. Differences in behavior between the two sampleswill therefore be somewhat attenuated because of our use of ex post rather than ex ante income foreach firm.
494 The Journal ofFinance
now much larger. The t-ratio for deficit firms is very high; the precision of theestimate for gain firms is lower, but still significant. Thus, we conclude thatthe very small response of the aggregate size of the corporate sector to taxchanges masks moderate but largely offsetting differences between the behavior of profitable firms and loss firms. For example, at the mean for deficit firms,raising 'TN by 0.10 would result in 4.2 percent of aggregate losses shifting outof the corporate sector. For gain firms the same tax change would cause a shiftof 2.8 percent of aggregate profits into the corporate sector.
As a further test for the presence of transactions costs, we added to these twospecifications the average value ofT during the subsequent three years-whentax changes last longer, firms would be more likely to respond to them, giventransactions costs of changing form. The resulting coefficients are reported incolumns 2 and 4 of Table III. Here, we find weak support for the importance oftransactions costs. Among loss firms the response to a tax change is about 40percent larger if it lasts for at least four years rather than ending after oneyear. For gain firms, there is no apparent change in the effect. Of course, ourshort annual time series limits our ability to estimate long-run effects.
One way to check the robustness of these results is to estimate the model onjust the allocation of income and losses between C and S corporations. Asdescribed earlier, some of the nontax differences between C corporations andpartnerships do not exist between C and S corporations. Both have limitedliability, suggesting more sensitivity to tax effects in this restricted sample. Onthe other hand, the S corporate form has strong restrictions on the number andtype of owners. When we estimate the model on the fraction of corporateincome or loss reported in C corporate form, we continue to find a negativeeffect of taxes for gain firms (the t-ratio is -1.83) and a positive effect for lossfirms (the t-ratio is 4.84). The magnitudes of the coefficients are only about 25
.percent-30 percent as large as the corresponding coefficients in Table III,however, suggesting that restrictions on the number and type of shareholdersare very costly for most firms.
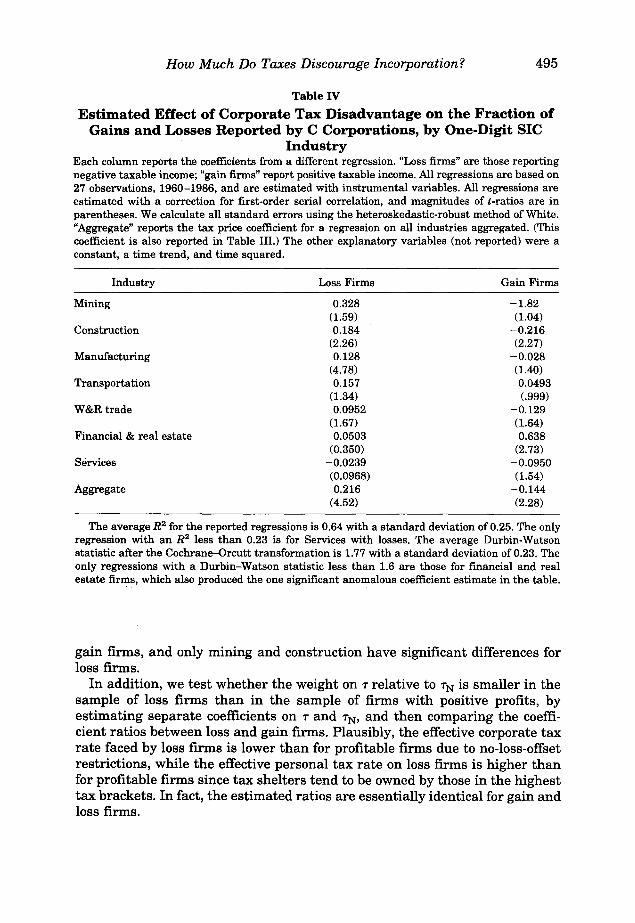
Similar results are found when the sample is disaggregated by one-digitindustry. These results are reported separately in Table IV for firms withprofits and firms with losses. (To save on space, we report just the estimates ofaa.) The pattern of shifting is consistent with the aggregate results. In onlythree cases out of fourteen are the signs of the coefficients contrary to thetheoretical forecasts and only one of these three is statistically significant:Finance and Real Estate. Many, perhaps most of the firms with positive ex postprofits in this group may have expected ex ante to have taxable losses, andacted accordingly.
We also test our restrictions that the coefficients on the corporate andpersonal tax costs are the same (except for sign). When we reestimate theregressions by industry in Table IV with the two tax variable componentsentered separately, the coefficients on both 'T and 'TN continue to have theexpected signs, and about the same size as in Table IV. Only manufacturingand trade have statistically different (at the 5 percent level) coefficients for
How Much Do Taxes Discourage Incorporation? 495
Table IV
Estimated Effect of Corporate Tax Disadvantage on the Fraction ofGains and Losses Reported by C Corporations, by One-Digit SIC
IndustryEach column reports the coefficients from a different regression. "Loss firms" are those reportingnegative taxable income; "gain firms" report positive taxable income. All regressions are based on27 observations, 1960-1986, and are estimated with instrumental variables. All regressions areestimated With a correction for first-order serial correlation, and magnitudes of t-ratios are inparentheses. We calculate all standard errors using the heteroskedastic-robust method of White."Aggregate" reports the tax price coefficient for a regression on all industries aggregated. (Thiscoefficient is also reported in Table III.) The other explanatory variables (not reported) were aconstant, a time trend, and time squared.
Industry Loss Firms Gain Firms
Mining 0.328 -1.82(1.59) (1.04)
Construction 0.184 -0.216(2.26) (2.27)
Manufacturing 0.128 -0.028(4.78) (1.40)
Transportation 0.157 0.0493(1.34) (.999)
W&Rtrade 0.0952 -0.129(1.67) (1.64)
Financial & real estate 0.0503 0.638(0.350) (2.73)
Services -0.0239 -0.0950(0.0968) (1.54)
Aggregate 0.216 -0.144(4.52) (2.28)
The average R2 for the reported regressions is 0.64 with a standard deviation of 0.25. The onlyregression with an R 2 less than 0.23 is for Services with losses. The average Durbin-Watsonstatistic after the Cochrane-Orcutt transformation is 1.77 with a standard deviation of 0.23. Theonly regressions with a Durbin-Watson statistic less than 1.6 are those for financial and realestate firms, which also produced the one significant anomalous coefficient estimate in the table.
gain firms, and only mining and construction have significant differences forloss firms.
In addition, we test whether the weight on T relative to TN is smaller in thesample of loss firms than in the sample of firms with positive profits, byestimating separate coefficients on T and TN' and then comparing the coefficient ratios between loss and gain firms. Plausibly, the effective corporate taxrate faced by loss firms is lower than for profitable firms due to no-loss-offsetrestrictions, while the effective personal tax rate on loss firms is higher thanfor profitable firms since tax shelters tend to be owned by those in the highesttax brackets. In fact, the estimated ratios are essentially identical for gain andloss firms.
496 The Journal ofFinance
We are also concerned that our dependent variable is a fraction constrainedto lie between zero and one. To check th.e sensitivity of our linear specificationto this restriction on the error distribution we reestimate the aggregate andindustry equations with the dependent variable in log-odds form, In(F/(1 - F»,under the assumption that Bit follows a Weibull distribution. This has noappreciable effect on the magnitude or significance of our results. We reportthe linear specification because it is much easier to interpret, and the linearspecification provides a close approximation to the effect from a nonlinearfunction given the limited variation in the dependent variable.
As a robustness check, we also estimate our regressions, separately for profitand loss firms, using as the dependent variable the fraction of returns filed bycorporations, both aggregated and disaggregated by industry. The signs on thetax price effects follow the pattern of signs reported above in Tables III and IV,but the coefficient estimates are nearly always statistically insignificant.
Altogether we find very strong evidence that, as the theory forecasts, bothassets and annual gains and losses are shifted across organizational forms inresponse to changes in the relative tax costs imposed on those forms. Thedirection and magnitudes of the effects are measured quite consistently acrossa wide variety of models.
E. Role of the Time Trends
The time trend variables in the above regressions have nontrivial coefficients, and their inclusion does affect the estimated value and statisticalsignificance of a3' If, for example, we reestimate all of the regressions withoutthe time trend variables, the estimates of a3 become statistically insignificant,and the sign changes for loss firms. Much of the explanatory power in theinitial regression comes from the time trends-the (AR1-transformed) R2 was0.55 with all of the variables and 0.30 with only the time trends. We thereforetry to explore further for which factors the time trends may be proxying.t"
One possible role for the time trends is to pick up the effects of changes in Ixover time-when Ix is larger in absolute value relative to g, tax considerationsare more important. Since a major factor changing Ix is movements in theaggregate economy, we use an estimate of the deviation between gross nationalproduct (GNP) and its long-run trend as a control for business cycle factors.Due to problems in inflation accounting, Ix will also depend on the inflationrate, so the rate of change in the producer price index is also added as a controlvariable.w
Another possible role of the time trend is to capture factors causing g tochange over time. We develop a chronology of some of the more significantpolicy changes between 1959 and 1986 that we believe may affect the choice of
18 They apparently are not proxying for mismeasurement in the time trend in T-the time trendcoefficients in the OLS regression are essentially unchanged when we measure Tusing CI and PIrather than C2 and P2.
19 Inflation also increases the effective capital gains tax rate, an effect not captured in ourmeasure of T.
How Much Do Taxes Discourage Incorporation? 497
Table V
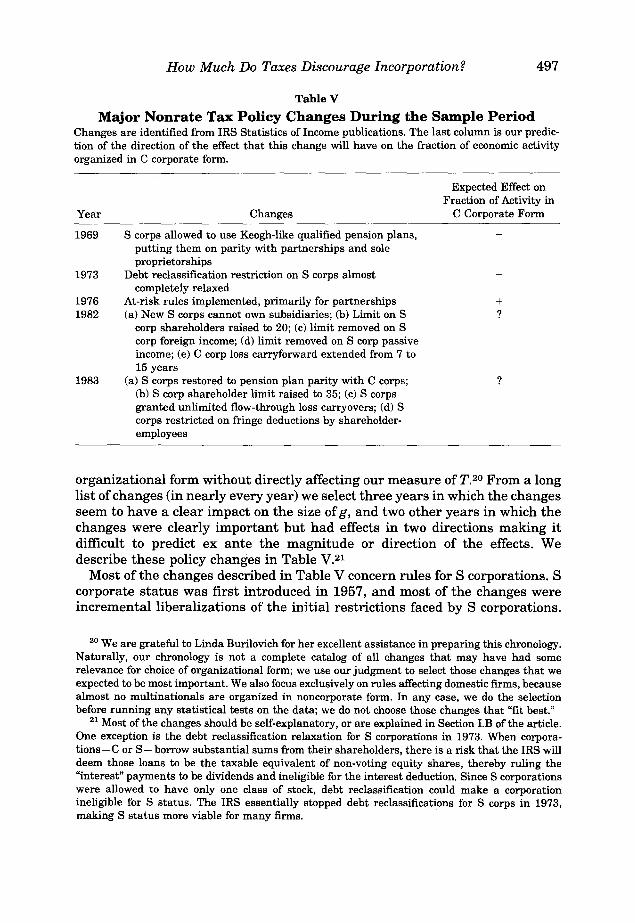
Major Nonrate Tax Policy Changes During the Sample PeriodChanges are identified from IRS Statistics of Income publications. The last column is our prediction of the direction of the effect that this change will have on the fraction of economic activityorganized in C corporate form.
Year
1969
1973
19761982
1983
Changes
S corps allowed to use Keogh-like qualified pension plans,putting them on parity with partnerships and soleproprietorships
Debt reclassification restriction on S corps almostcompletely relaxed
At-risk rules implemented, primarily for partnerships(a) New S corps cannot own subsidiaries; (b) Limit on S
corp shareholders raised to 20; (c) limit removed on Scorp foreign income; (d) limit removed on S corp passiveincome; (e) C corp loss carryforward extended from 7 to15 years
(a) S corps restored to pension plan parity with C corps;(b) S corp shareholder limit raised to 35; (c) S corpsgranted unlimited flow-through loss carryovers; (d) Scorps restricted on fringe deductions by shareholderemployees
Expected Effect onFraction of Activity in
C Corporate Form
+?
?
organizational form without directly affecting our measure of T.20 From a longlist of changes (in nearly every year) we select three years in which the changesseem to have a clear impact on the size of g, and two other years in which thechanges were clearly important but had effects in two directions making itdifficult to predict ex ante the magnitude or direction of the effects. Wedescribe these policy changes in Table V.21
Most of the changes described in Table V concern rules for S corporations. Scorporate status was first introduced in 1957, and most of the changes wereincremental liberalizations of the initial restrictions faced by S corporations.
20 We are grateful to Linda Burilovich for her excellent assistance in preparing this chronology.Naturally, our chronology is not a complete catalog of all changes that may have had somerelevance for choice of organizational form; we use our judgment to select those changes that weexpected to be most important. We also focus exclusively on rules affecting domestic firms, becausealmost no multinationals are organized in noncorporate form. In any case, we do the selectionbefore running any statistical tests on the data; we do not choose those changes that "fit best."
21 Most of the changes should be self-explanatory, or are explained in Section I.B of the article.One exception is the debt reclassification relaxation for S corporations in 1973. When corporations-C or S- borrow substantial sums from their shareholders, there is a risk that the IRS willdeem those loans to be the taxable equivalent of non-voting equity shares, thereby ruling the"interest" payments to be dividends and ineligible for the interest deduction. Since S corporationswere allowed to have only one class of stock, debt reclassification could make a corporationineligible for S status. The IRS essentially stopped debt reclassifications for S corps in 1973,making S status more viable for many firms.
498 The Journal ofFinance
Table VI
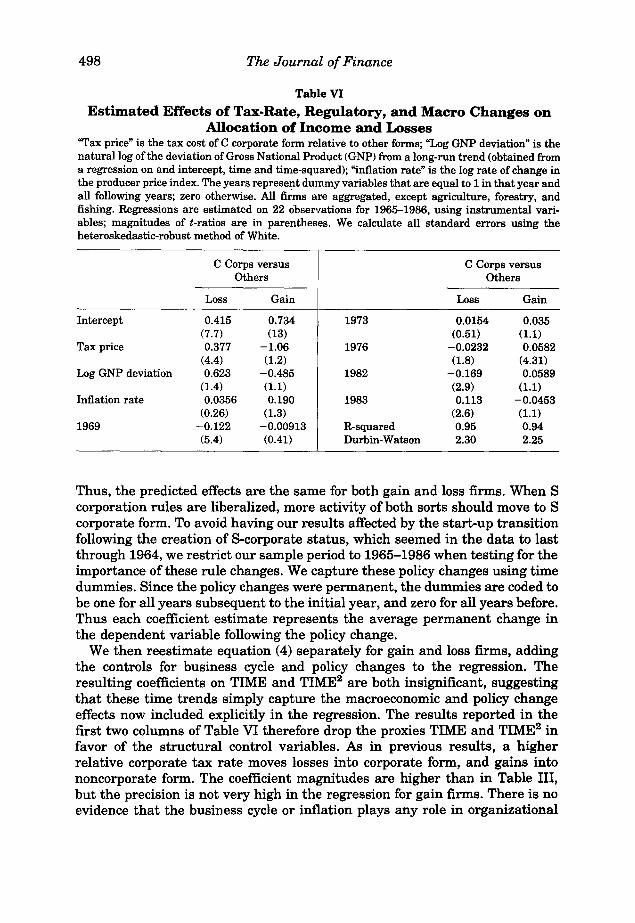
Estimated Effects of Tax-Rate, Regulatory, and Macro Changes onAllocation of Income and Losses
"Tax price" is the tax cost of C corporate form relative to other forms; "Log GNP deviation" is thenatural log of the deviation of Gross National Product (GNP) from a long-run trend (obtained froma regression on and intercept, time and time-squared); "inflation rate" is the log rate of change inthe producer price index. The years represent dummy variables that are equal to 1 in that year andall following years; zero otherwise. All fi~s are aggregated, except agriculture, forestry, andfishing. Regressions are estimated on 22 observations for 1965-1986, using instrumental variables; magnitudes of t-ratios are in parentheses. We calculate all standard errors using theheteroskedastic-robust method of White.
C Corps versus C Corps versusOthers Others
Loss Gain Loss Gain
Intercept 0.415 0.734 1973 0.0154 0.035(7.7) (13) (0.51) (1.1)
Tax price 0.377 -1.06 1976 -0.0232 0.0582(4.4) (1.2) (1.8) (4.31)
Log GNP deviation 0.623 -0.485 1982 -0.169 0.0589(1.4) (1.1) (2.9) (1.1)
Inflation rate 0.0356 0.190 1983 0.113 -0.0453(0.26) (1.3) (2.6) (1.1)
1969 -0.122 -0.00913 R-squared 0.95 0.94(5.4) (0.41) Durbin-Watson 2.30 2.25
Thus, the predicted effects are the same for both gain and loss firms. When Scorporation rules are liberalized, more activity of both sorts should move to Scorporate form. To avoid having our results affected by the start-up transitionfollowing the creation of S-corporate status, which seemed in the data to lastthrough 1964, we restrict our sample period to 1965-1986 when testing for theimportance of these rule changes. We capture these policy changes using timedummies. Since the policy changes were permanent, the dummies are coded tobe one for all years subsequent to the initial year, and zero for all years before.Thus each coefficient estimate represents the average permanent change inthe dependent variable following the policy change.
We then reestimate equation (4) separately for gain and loss firms, addingthe controls for business cycle and policy changes to the regression. Theresulting coefficients on TIME and TIME2 are both insignificant, suggestingthat these time trends simply capture the macroeconomic and policy changeeffects now included explicitly in the regression. The results reported in thefirst two columns of Table VI therefore drop the proxies TIME and TIME2 infavor of the structural control variables. As in previous results, a higherrelative corporate tax rate moves losses into corporate form, and gains intononcorporate form. The coefficient magnitudes are higher than in Table III,but the precision is not very high in the regression for gain firms. There is noevidence that the business cycle or inflation plays any role in organizational
How Much Do Taxes Discourage Incorporation? 499
form decisions. Several of the coefficients on the policy change variables arelarge and statistically significant, and have the expected (or a plausible) sign,while none of the significant coefficients has an unexpected sign. While thenumber of coefficients being estimated is high enough relative to the numberof observations that we do not want to put undue weight on these results, thecoefficient estimates remain very much consistent with the theoretical forecasts.
F. Efficiency Implications
Efficiency losses from these tax distortions arise because some firms withg > 0 choose not to incorporate (while other firms with g < 0 do choose toincorporate) due to tax factors, thereby incurring real costs in order to avoidtransferring money to the government. To use our empirical results to estimatethe size of the efficiency losses arising from tax distortions to organizationalform, we proceed as follows. When T changes by dT, some firms change theirform of organization. By equation (2), we know that for these firms g/Ix = T.Then, the efficiency loss generated by profitable firms shifting to noncorporateform and loss-making firms shifting to corporate form as T increases by dTequals
(st: aI-)
-T aT + aT dT,
where T: (1;) measures aggregate taxable profits (losses) in the corporatesector and where ale/aT measures the change in either taxable income figurethat results when T increases. Let at (ai) denote our estimate for the changein the fraction of taxable income (losses) that arise in the corporate sector whenT changes. Then, aI:/aT = atr, and aI;/aT = air, where I" (r) measuresaggregate profits (losses) for all businesses, corporate and noncorporate.Therefore, the aggregate efficiency losses, L, generated by the tax distortion tothe choice of organizational form equals
L ~ - f:s(a~[+ + a,r) ds ~ -O.5T'(a,l- + a~[+). (5)
Given the estimates for at and ai that appear in Table III, and using theobserved values ofrand r for 1986, we find that the aggregate efficiency lossequals 2.06 billion dollars, or 22 percent of the tax revenue actually collectedfrom corporate and noncorporate firms that year. Over the full sample period,on average, the efficiency loss was 16 percent of tax revenue raised. Thisestimate of the efficiency loss is slightly larger than the figures reported inGordon and MacKie-Mason (1994), where the loss is estimated as 17 percent oftax revenue in 1986 and 9 percent, on average, during the period 1970 to 1986.
Our results differ dramatically from those in Gravelle and Kotlikoff (1989,1993) (hereafter GK). In their 1989 article they calculate in their base case that
500 The Journal ofFinance
the excess burden generated by the tax distortion to the choice of organizational form equals 109 percent of the revenue raised.22 Their estimates arebased, however, on implausible forecasts of the fraction of firms that areinitially corporate and the sensitivity of the composition of firms across organizational forms to tax factors. Based on our replication of the model simulations from GK (1989), they assume in their base case that the corporate shareof total assets starts at the implausibly low figure of 36 percent, suggesting aserious benchmarking problem. The corporate asset share then jumps to 99percent if the tax distortion is removed. The Statistics of Income data show, incontrast, that on average 93.8 percent of assets had been corporate during theperiod 1959-1986,23 and our empirical estimates in Table II forecast that thecorporate share would increase by only 0.6 percent if the tax distortion wereeliminated. In any case, the size of the tax distortion varies substantiallyduring the sample period, as seen in Figure 1. However, the maximum andminimum corporate shares of total assets differ by less than 7 percentagepoints during this period, compared to the massive shifts the GK model wouldpredict with that much tax price variation.
G. Possible Effects of Income Shifting
One complication not addressed so far is the possibility of income shiftingbetween the corporate and the personal tax base. Given the differences between the corporate and the personal tax rates, firms would gain by shiftingtaxable income toward the tax base facing the lower tax rate, even. holdingfixed the ownership of capital. When the corporate rate is higher, this can bedone, for example, through use of debt finance. The resulting tax savingslessen the tax disadvantage faced by corporations. However, the process ofincome shifting generates nontax costs, e.g., bankruptcy costs, that partly (andat the margin fully) offset the tax savings.
The extent of this income shifting should be a function of the size of T,implying that the small observed responsiveness to T found so far may in partreflect the fact that our measure of T overstates the tax disadvantage faced bycorporations because it ignores the possibility of income shifting. In particular,if a corporation shifts a fraction 0 of its income from the corporate to thepersonal tax base, then its tax liabilities are reduced by OIx(T- TN)' The extentof income shifting is limited by some offsetting nontax costs. Assume inparticular that the firm incurs real costs of IIxIC(O), which for simplicity weapproximate by 0.5IIxl~/'Y. By making the costs proportional to the absolutevalue of Ix, we implicitly assume that 0 does not vary systematically with firmsize. The value of 0 that maximizes the firm's after-tax profits then equals
0= 'Y(T - TN)sign(Ix)'
22 The GK estimate is obtained from a simulation model, and thus is subject to a different sortof measurement error problem than is ours.
23 As we note earlier, this is an overestimate because it excludes sole proprietorship assets. Weroughly estimate the true corporate asset share at 88 percent.
How Much Do Taxes Discourage Incorporation? 501
Given this choice for e, a corporation's profits net of taxes and net of any nontaxcosts of income shifting would equal
1- IxT + 0.5'Y11xl(T - TN)2.
As expected, the possibility of income shifting raises net-of-tax corporateincome. Given the possibility of income shifting, a firm chooses to incorporateonly if
(6)
When we reestimate equation (3) using T* instead of T, we need to usenonlinear methods in order to estimate 'Y. In addition, since income shiftingreduces measured income in the corporate sector without changing the capitalstock there, we redefine our dependent variable to correct for the effects ofincome shifting.w This reestimation is done separately for firms with profitsand firms with losses. The resulting estimates for 'Yare far too large to beplausible, but are insignificant statistically. There is not sufficient variation inthe data to allow us to estimate 'Y directly.
In order to judge the possible importance of income shifting for our results,we set 'Y equal to what we view to be a plausible (though arbitrary) value to seehow far our previous results might be in error through the omission of incomeshifting considerations. In particular, we set 'Y = 0.7, which implies that adifference between the corporate and the personal tax rate of 20 percent leadscorporations to shift 14 percent of their income out of the corporate tax base.2 5
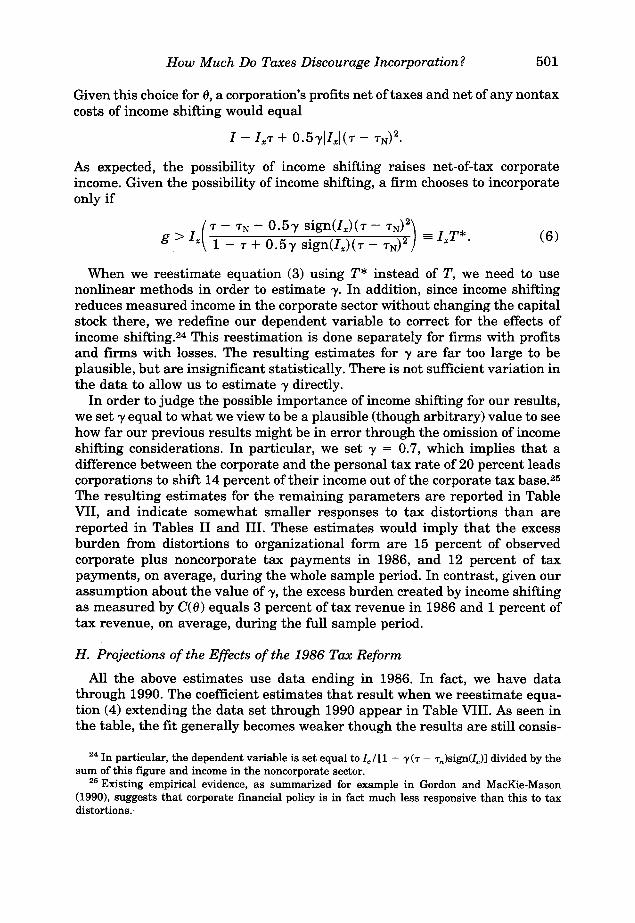
The resulting estimates for the remaining parameters are reported in TableVII, and indicate somewhat smaller responses to tax distortions than arereported in Tables II and III. These estimates would imply that the excessburden from distortions to organizational form are 15 percent of observedcorporate plus noncorporate tax payments in 1986, and 12 percent of taxpayments, on average, during the whole sample period. In contrast, given ourassumption about the value of 'Y, the excess burden created by income shiftingas measured by C(e) equals 3 percent of tax revenue in 1986 and 1 percent oftax revenue, on average, during the full sample period.
H. Projections of the Effects of the 1986 Tax Reform
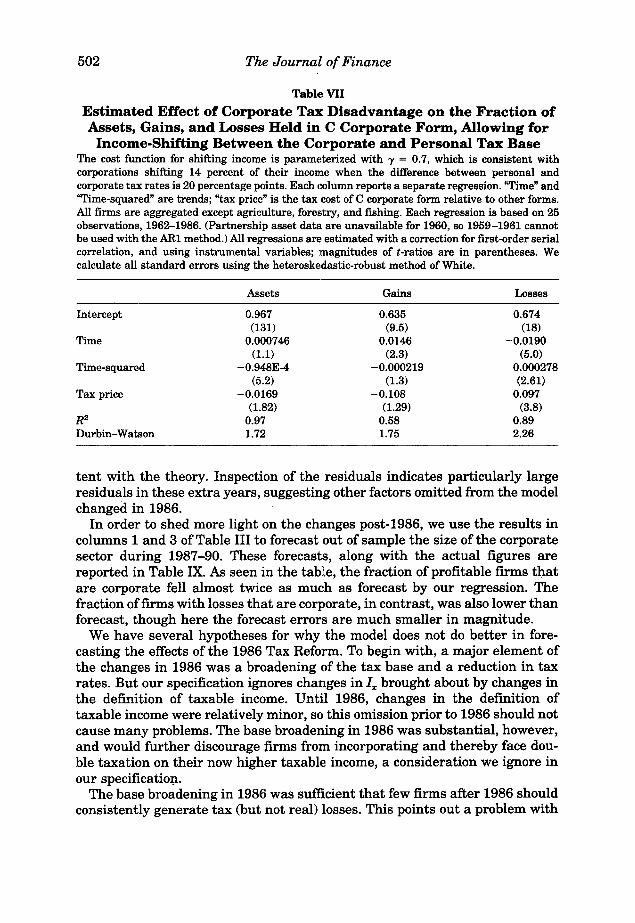
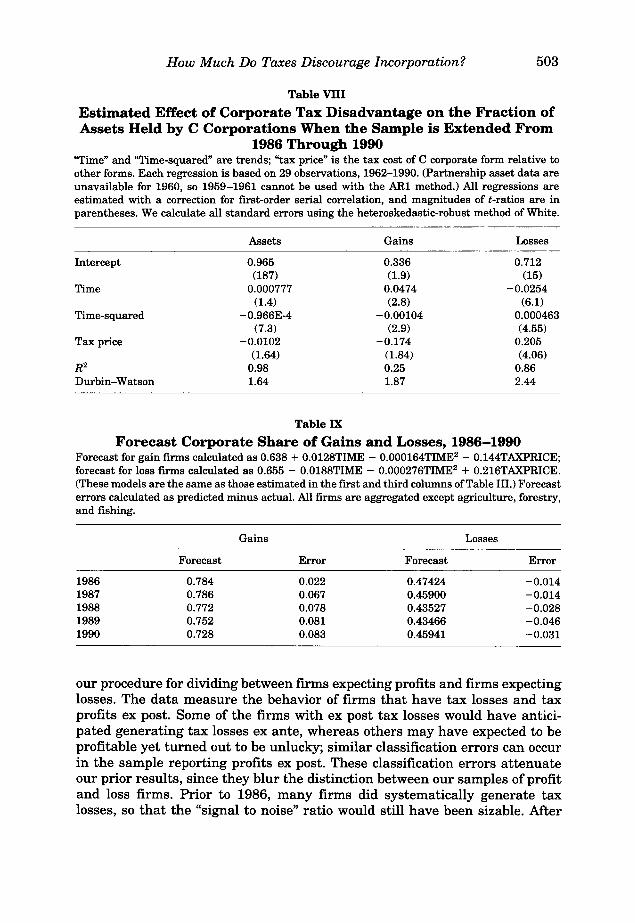
All the above estimates use data ending in 1986. In fact, we have datathrough 1990. The coefficient estimates that result when we reestimate equation (4) extending the data set through 1990 appear in Table VIII. As seen inthe table, the fit generally becomes weaker though the results are still consis-
24 In particular, the dependent variable is set equal to 1c/[1 - 'Y(T - Tn)sign(lc)]divided by thesum of this figure and income in the noncorporate sector.
25 Existing empirical evidence, as summarized for example in Gordon and MacKie-Mason(1990), suggests that corporate financial policy is in fact much less responsive than this to taxdistortions.:
502 The Journal ofFinance
Table VII
Estimated Effect of Corporate Tax Disadvantage on the Fraction ofAssets, Gains, and Losses Held in C Corporate Form, Allowing for
Income-Shifting Between the Corporate and Personal Tax BaseThe cost function for shifting income is parameterized with 'Y = 0.7, which is consistent withcorporations shifting 14 percent of their income when the difference between personal andcorporate tax rates is 20 percentage points. Each column reports a separate regression. "Time" and"Time-squared" are trends; "tax price" is the tax cost of C corporate form relative to other forms.All firms are aggregated except agriculture, forestry, and fishing. Each regression is based on 25observations, 1962-1986. (Partnership asset data are unavailable for 1960, so 1959-1961 cannotbe used with the AR1 method.) All regressions are estimated with a correction for first-order serialcorrelation, and using instrumental variables; magnitudes of t-ratios are in parentheses. Wecalculate all standard errors using the heteroskedastic-robust method of White.
Assets Gains Losses
Intercept 0.967 0.635 0.674(131) (9.5) (18)
Time 0.000746 0.0146 -0.0190(1.1) (2.3) (5.0)
Time-squared -0.948E-4 -0.000219 0.000278(5.2) (1.3) (2.61)
Tax price -0.0169 -0.108 0.097(1.82) (1.29) (3.8)
R2 0.97 0.58 0.89Durbin-Watson 1.72 1.75 2.26
tent with the theory. Inspection of the residuals indicates particularly largeresiduals in these extra years, suggesting other factors omitted from the modelchanged in 1986.
In order to shed more light on the changes post-1986, we use the results incolumns 1 and 3 of Table III to forecast out of sample the size of the corporatesector during 1987-90. These forecasts, along with the actual figures arereported in Table IX. As seen in the table, the fraction of profitable firms thatare corporate fell almost twice as much as forecast by our regression. Thefraction of firms with losses that are corporate, in contrast, was also lower thanforecast, though here the forecast errors are much smaller in magnitude.
We have several hypotheses for why the model does not do better in forecasting the effects of the 1986 Tax Reform. To begin with, a major element ofthe changes in 1986 was a broadening of the tax base and a reduction in taxrates. But our specification ignores changes in Ix brought about by changes inthe definition of taxable income. Until 1986, changes in the definition oftaxable income were relatively minor, so this omission prior to 1986 should notcause many problems. The base broadening in 1986 was substantial, however,and would further discourage firms from incorporating and thereby face double taxation on their now higher taxable income, a consideration we ignore inour specification.
The base broadening in 1986 was sufficient that few firms after 1986 shouldconsistently generate tax (but not real) losses. This points out a problem with
How Much Do Taxes Discourage Incorporation? 503
Table VIII
Estimated Effect of Corporate Tax Disadvantage on the Fraction ofAssets Held by C Corporations When the Sample is Extended From
1986 Through 1990"Time" and "Time-squared" are trends; "tax price" is the tax cost of C corporate form relative toother forms. Each regression is based on 29 observations, 1962-1990. (Partnership asset data areunavailable for 1960, so 1959-1961 cannot be used with the AR1 method.) All regressions areestimated with a correction for first-order serial correlation, and magnitudes of t-ratios are inparentheses. We calculate all standard errors using the heteroskedastic-robust method of White.
Assets Gains Losses
Intercept 0.965 0.336 0.712(87) (1.9) (15)
Time 0.000777 0.0474 -0.02540.4) (2.8) (6.1)
Time-squared -0.966E-4 -0.00104 0.000463(7.3) (2.9) (4.55)
Tax price -0.0102 -0.174 0.205(1.64) (1.84) (4.06)
R2 0.98 0.25 0.86Durbin-Watson 1.64 1.87 2.44
Table IX
Forecast Corporate Share of Gains and Losses, 1986-1990Forecast for gain firms calculated as 0.638 + 0.0128TIME - 0.000164TIME2
- 0.144TAXPRICE;forecast for loss firms calculated as 0.655 - 0.0188TIME - 0.000276TIME2 + 0.216TAXPRICE.(These models are the same as those estimated in the first and third columns of Table III.) Forecasterrors calculated as predicted minus actual. All firms are aggregated except agriculture, forestry,and fishing.
Gains Losses
Forecast Error Forecast Error
1986 0.784 0.022 0.47424 -0.0141987 0.786 0.067 0.45900 -0.0141988 0.772 0.078 0.43527 -0.0281989 0.752 0.081 0.43466 -0.0461990 0.728 0.083 0.45941 -0.031
our procedure for dividing between firms expecting profits and firms expectinglosses. The data measure the behavior of firms that have tax losses and taxprofits ex post. Some of the firms with ex post tax losses would have anticipated generating tax losses ex ante, whereas others may have expected to beprofitable yet turned out to be unlucky; similar classification errors can occurin the sample reporting profits ex post. These classification errors attenuateour prior results, since they blur the distinction between our samples of profitand loss firms. Prior to 1986, many firms did systematically generate taxlosses, so that the "signal to noise" ratio would still have been sizable. After
504 The Journal ofFinance
1986, however, few firms would anticipate generating tax losses systematically. Yet many firms would still end up having bad years on occasion. As aresult, the sample offirms with tax losses after 1986 is dominated plausibly byfirms that anticipated generating tax profits. These firms would tend to shiftout of the corporate sector after 1986, consistent with the results in Table III.Similarly, there would be less attenuation in the behavioral response amongfirms with positive ex post profits, consistent with the evidence.
Other important changes in 1986 were a strengthening of the corporatealternative minimum tax and the repeal of the General Utilities Doctrine.While the resulting extra tax payments do show up in the average tax ratefigure, they are not picked up by the instrument (which simply equals thestatutory tax rate). Our procedure again understates the increase in therelative tax burden faced by corporate firms.
A further complication introduced by the 1986 tax reform was the introduction of binding restrictions on the deductibility of passive losses for noncorporate firms and rule changes effectively ending master limited partnerships.These restrictions clearly lower the attractiveness of the noncorporate form.Yet we underestimate the size of the noncorporate sector after 1986, suggesting that these complications are of second order importance.
On net, we observe substantial changes in organizational form choices after1986. Our forecasts suggest that the changes in tax rates alone may explainroughly half of the observed changes. Many other changes occurred as part ofthe Tax Reform Act of 1986, whose effects we do not attempt to capture in ourempirical specification, that plausibly explain much of the remaining changesin organizational form choices that occurred after 1986~
III. Conclusion
Our basic hypothesis is simple: profitable firms will shift out of the corporatesector when the tax distortion to incorporating is larger, and conversely forfirms with tax losses-, Our empirical evidence provides strong and consistentsupport for this hypothesis: assets, taxable gains, and taxable losses all shiftacross organizational forms in the direction expected in response to changes intax rates. We test a wide variety of specifications using different measures ofthe tax variables, different forms of the dependent variable, different econometric methods, and different control variables. Throughout we obtain estimates that support the basic hypothesis; our main results are statisticallyprecise. The implied efficiency losses from the tax distortions during thesample period to the choice of organizational form equals only about a sixth ofthe tax revenue collected from business income. It appears that nontax factorsdominate the choice of organizational form.
REFERENCES
Fama, Eugene F., and Michael C. Jensen, 1983a, Separation of ownership and control, Journal ofLaw and Economics 26, 301-326.
How Much Do Taxes Discourage Incorporation? 505
Fama, Eugene F., and Michael C. Jensen, 1983b, Agency problems and residual claims, JournalofLaw and Economics 26, 327-349.
Feldstein, Martin S., Louis Dicks-Mireaux, and James Poterba, 1983, The effective tax rate andthe pretax rate of return, Journal ofPublic Economics 21, 129-158.
Fellingham, James, and Mark A. Wolfson, 1985, Taxes and risk sharing, Accounting Review 60,10-17.
Gentry, William, 1994, Taxes, financial decisions, and organizational form: Evidence from publiclytraded partnerships, Journal ofPublic Economics 53, 223-244.
Gordon, Roger H., and David F. Bradford, 1980, Taxation and the stock market valuation of capitalgains and dividends: Theory and empirical results, Journal ofPublic Economics 14, 109-136.
Gordon, Roger H., and Jeffrey K MacKie-Mason, 1990, Effects of the tax reform act of 1986 oncorporate financial policy and organizational form, in J. Slemrod, Ed.: Do Taxes Matter?: TheImpact of the Tax Reform Act of 1986 (MIT Press, Cambridge, Mass.).
Gordon, Roger H., and Jeffrey K MacKie-Mason, 1994, Tax distortions to the choice of organizational form, Journal ofPublic Economics 55, 279-306.
Gravelle, Jane G., and Lawrence J. Kotlikoff, 1989, The incidence and efficiency costs of corporatetaxation when corporate and non-corporate firms produce the same good, Journal ofPoliticalEconomy 97, 749-781.
Gravelle, Jane G., and Lawrence J. Kotlikoff, 1993, Corporate tax incidence and inefficiency whencorporate and non-corporate goods are close substitutes, Economic Inquiry 31, 501-516.
Kochin, Levis A, and Richard W. Parks, 1988, Was the tax-exempt bond market inefficient or werefuture expected tax rates negative?, Journal ofFinance 43, 913-932.
MacKie-Mason, Jeffrey, 1987, Long-term contracts and sequential economic decisions, Workingpaper, University of Michigan.
Murphy, Kevin J., 1986, Incentives, learning, and compensation: A theoretical and empiricalinvestigation of managerial labor contracts, Rand Journal ofEconomics 17, 59-76.
Poterba, James M., 1989, Tax reform and the market for tax-exempt debt, Regional Science andUrban Economics 19, 537-562.
Scholes, Myron. S., and Mark. A Wolfson, 1987, Taxes and organization theory, Working paper,Stanford Graduate School of Business.
Scholes, Myron S., and Mark A Wolfson, 1990, The effects of changes in tax laws on corporatereorganization activity, Journal of Business 63, SI41-S164.
Scholes, Myron S., and Mark A Wolfson, 1991, Taxes and Business Strategy: A Global PlanningApproach. (Prentice-Hall, Englewood Cliffs, N.J.)
Winton, Andrew, 1993, Limitation ofliability and the ownership structure ofthe firm, Journal ofFinance 48, 487-512.
Wolfson, Mark A, 1985a, Empirical evidence of incentive problems and their mitigation in oil andgas tax shelter programs, in J. Pratt and R. Zeckhauser, Ed.: Principals and Agents: TheStructure of Business (Harvard Business School, Cambridge, Mass.).
Wolfson, Mark A, 1985b, Tax, incentive, and risk-sharing issues in the allocation of propertyrights: The general lease-or-buy problem, Journal ofBusiness 58, 159-172.