how many people can the earth feed? - vaclav smilvaclavsmil.com/wp-content/uploads/pdr1994.pdf ·...
TRANSCRIPT
How Many People Can the Earth Feed?
VACLAV SMIL
THE VERY SIMPLICITY and directness of the question posed in the title guaran- tee that it will be asked again and again. But taking up the challenge is a futile effort if the answer sought is a single specific value. The underlying complexity of food-population-environment relationships makes it impos- sible to come up with such an answer even if all the links and feedbacks were known with a high degree of certainty and even if the forecasts were for a limited period of time. Trying to hit the ultimate total would be much like aiming at an unseen and moving target.
Forecasts of ranges circumscribed by carefully defined sets of assump- tions can be offered with confidence only for periods of less than two de- cades; some revealing calculations and meaningful comments can be made about the outlook for the next one to two generations, but no 50-60-year forecast can get most of its ingredients right; and even if it did so, the whole setting would still be largely unpredictable: looking back to the early 1930s makes the point convincingly.' Forecasts on a civilizational time scale may be, at best, interesting bits of conjecture, yet there has been no shortage of such estimates during the twentieth century.
How realistic are past estimates?
The history of global carrying capacity estimates goes back about 100 years. Nobody could make any sensible global appraisals until there was at least basic information regarding the extent of cultivated and potentially culti- vable area, typical yields of dominant cereal crops, and their likely future increase. As with so many other developments, the time for projecting the population total that the planet could support came during the last decades of the nineteenth century.
Ravenstein (1891), perhaps the first researcher to investigate the limit, came up with a maximum total of just under 6 billion people. Shortly af- terwards, Pfaundler (1902)-assuming no extension of the existing 2,174 million hectares (Mha) of cropland and good grazing land, average density
POPULATION AND DEVELOPMENT REVIEW 20, NO. 2 (JUNE 1994) 2 5 5
This content downloaded on Thu, 7 Mar 2013 19:26:32 PMAll use subject to JSTOR Terms and Conditions
256 How MANY PEOPLE CAN THE EARTH FEED?
of 5 people per hectare supported by traditional farming methods, and re- cycling of organic matter-ended up with a minimum of 11 billion people. Numerous other estimates followed, and fit mostly between 10 and 40 bil- lion people. I will mention a few of the post-World War II values in order to illustrate different approaches to the challenge.
Brown (1954) concluded that increased yields from existing cultivated land supplemented by output from about 500 Mha of new fields and 80 Mha of newly irrigated arid lands would raise the 1950 food supply sixfold, enough to support about 1 5 billion people. Baade (1962), assuming that up to three times as much cropland as in 1950 could be available, and that average cereal yields would be 5 t/ha, put the total at 30 billion. Zierhoffer (1966) arrived at a total of 41 billion people by simply assuming that even- tually every one of 3,350 Mha of the world's potentially arable land would support as many people as Japan's farmland did during the early 1960s.
Meadows et al. (1972) did not present a maximum value, but their assumption of doubled 1970 average yields and declining availability of ar- able land implied support for a total of 11.5 billion people. Revelle (1976) calculated that with average global yields equal to half of those in the US Midwest in the mid- 1970s, with about 10 percent of land in nonfood crops, and with postharvest losses and nonfood uses at no more than 10 percent of the yield, the potentially cultivable area outside the humid tropics could provide a vegetarian diet of 2,500 kilocalories (kcal) per day for nearly 40 billion people.
Extreme carrying capacity estimates go far outside the broad, fourfold range bracketed by the estimates just cited. They have been defined by true believers in the antipodal camps of catastrophist and cornucopian futures. A generation ago Ehrlich (1968) wrote that "the battle to feed all humanity is over" and that "hundreds of millions of people are going to starve to death" during the 1970s.2 Ehrlich's global population maximum would have to be well below the 1970 total of about 3.7 billion people.
In contrast, Simon (1981) maintained that food has no long-run, physi- cal limit. These extremes leave us either with the prospect of eliminating about half of humanity in order to return the worldwide count to a sup- portable level or with visions of crop harvests surpassing the mass of the planet itself.3 As Sauvy (1990[1949]: 774) noted crisply, "Lack of precision in data and in method of analysis allows shortcuts toward reaching an ob- jective predetermined by prejudice, shaped largely either by faith in progress or by conservative skepticism." Unfortunately, less extreme estimates have been hardly more impressive.
Because the question of the ultimate support capacity cannot have a single correct answer, assessing the value of past estimates must be done by looking at their assumptions. Too many of them are overly simplistic, and even the more elaborate ones are usually difficult to defend. In gen-
This content downloaded on Thu, 7 Mar 2013 19:26:32 PMAll use subject to JSTOR Terms and Conditions
VACLAV SMIL 257
eral, the capacity predictions assume too much-as well as too little. Most notably, they almost completely ignore the demand side of the question.
How useful can another attempt be?
Does it make sense to try again? There can be no correct single total: every calculation must be based on a large number of assumptions, and every one of these numbers can be disputed and substituted for by slightly or substantially different values. The cumulative effects of even slight initial disparities can result in massive differences over long periods of time. De- tailing even a limited number of basic assumptions can turn the exercise into a tedious account. Proffering a large number of alternatives can result in a broad fan of values spanning the already published estimates.4
Trying again makes sense only if the exercise does not concentrate on the ultimate, and realistically unanswerable, question and remains focused on a limited, although still extended, time span. Global population is ex- pected to reach 10 billion people by the middle of the next century: can it be supplied with adequate nutrition in an increasingly sustainable man- ner? If so, then the outlook would be hopeful also to the century's end. Both the UN (1992) and the World Bank (1992) medium variants foresee just over 11 billion people by the year 2100.
Can human ingenuity extract from the biosphere enough food to sup- port healthy and vigorous life for twice as many people as today, and if so, can this achievement be anything but an ephemeral spike? A systematic attempt to answer these questions can be valuable in several important ways. To begin with, it can remind us of the complexity of realities the adequate understanding of which is essential to tackle the question. Genuine aware- ness of this complexity is the best antidote against succumbing either to Ehrlichian doom or to Simonian giddiness.
Although I will demonstrate that systematic appraisals of global food availability and of dietary requirements assuring a healthy and active life are beset by uncertainties, two important conclusions arise from a cautious quantification of these sets. The first one is that even the poor countries are not greatly short of food for providing an adequate (although obviously not very diversified) diet for all of their people, and that relatively modest (and mostly intranational) redistributions could take care of the existing deficiencies. The second one is the existence of a significant potential for reducing food waste at every level, from the immediate postharvest storage to household use.
Perhaps the most important outcome of appraising the existing pro- ductive levels and their plausible improvements and adjustments is the iden- tification of an enormous slack in global food production capacity. Care- fully and conservatively defined assumptions can narrow the values of such
This content downloaded on Thu, 7 Mar 2013 19:26:32 PMAll use subject to JSTOR Terms and Conditions
258 How MANY PEOPLE CAN THE EARTH FEED?
efficiency gains to reasonable approximations, offering a realistic under- standing of possible achievements during the coming 50-60 years.
I hasten to stress that my primary concern in this essay is to make sure that these assumptions conform to biophysical realities. I shall never underestimate the roles played by diverse consumer, economic, and politi- cal factors in food production: after all, these influences-from government subsidies to the effects of rising incomes on food preferences-have often had more profound impact on agricultural output than the biophysical con- stants and variables. But unlike the latter class of production determinants, socioeconomic arrangements can be profoundly modified, or altogether dis- carded and reinvented.
In contrast, all societies and all economies are ultimately just elabo- rate subsystems of the global ecosystem. As long as we operate within the realm of what is biospherically possible, we can have realistic expectations that human ingenuity and adaptability will find effective solutions. This reality offers no guarantees of success, but it delimits the boundaries of hope.
How much food do we have?
Given the current degree of agricultural commercialization and the profu- sion of statistical inquiries, knowledge of food supply should be highly ac- curate throughout the rich world, and at least fairly reliable in most poor countries. Readily available summaries of food availability reinforce this impression. The single most important worldwide source of such data is the food balance sheets prepared by the Food and Agriculture Organization (FAO).5 Procedures for their preparation are straightforward. Domestic pro- duction is adjusted for changes in stocks and net trade, for seed and indus- trial conversions, and for amounts fed to livestock or wasted during stor- age, processing, and transportation.
This tracing of food flows requires numerous approximations. Direct measurements of productivity for crops planted on large areas, fluctuating in size, are costly; even affluent countries prefer to collect their crop statis- tics by the least expensive means, relying on interviews, mail surveys, and secondary sources.6 Naturally, in poor countries the indirect assessments are dominant. At least two-thirds of all countries base their crop produc- tion totals on such estimates.
Uncertainties concerning the reported cropland totals are common sources of errors. Official land-use statistics almost universally underesti- mate the actually cultivated area. Two prominent examples will suffice. Ongoing cadastral surveys of Nepali hills reveal that the cultivated area of the region is almost four times as large as shown by the official decennial National Agricultural Census figures, with subregional multiples ranging
This content downloaded on Thu, 7 Mar 2013 19:26:32 PMAll use subject to JSTOR Terms and Conditions
VACLAV SMIL 259
from more than two to more than eight (Gill 1993). China's official statis- tics showed 95 Mha of cultivated land in 1990 (State Statistical Bureau 1992), but the actual countrywide total may be up to 40 percent higher (Smil 1993).
Problems in reporting the output of continuous crops (many vegetables and fruits) and incomplete harvests (cassava, the leading tuber of the trop- ics, is often not harvested beyond the immediate need) are perhaps the most common sources of additional errors. Standing crop estimates may easily differ by 5-10 percent from actual totals, and in many poorer coun- tries these errors may be as much as 20-25 percent.
Most countrywide rates of harvesting and postharvesting losses are hardly better than informed guesses. Losses at every stage-harvesting, han- dling, threshing, drying, storage, and milling-may be as low as a fraction of one percent and as high as 10 percent. The resulting cumulative totals range from well below 10 percent to as much as half of the standing crop, and although year-to-year fluctuations may be considerable, constant waste rates are routinely used in compilations of food balance sheets. Choice of typical food-processing multipliers introduces further notable errors, above all where rice is the dominant staple.7 Seeding rates are highly variable throughout most of the poor world, especially when expressed, as is com- mon in constructing food balance sheets, as a fraction of the total crop har- vest.8
Cumulative opportunities for significant errors are obvious even if most of the input values were based on good first-hand estimates. Yet a detailed study of food balance sheets shows that nearly 70 percent of all figures used in constructing national balance sheets are estim'ated in FAO's Rome headquarters, while only about 30 percent are supplied directly by the mem- ber states. Uncertainties do not end with calculating the food availability totals. The final step is the conversion of mass food values into energy equiva- lents and the calculation of nutritional contents. Data on some nutrients in many foods are still simply unavailable or highly inadequate, but the main problem is selection of representative averages from often wide ranges of well-established values.9
Food balance sheets for rich countries at least do not omit any major inputs, but in many poor countries they either leave out or greatly under- estimate some qualitatively essential food supplies. The most notably ne- glected input is wild meat, an important source of high-quality protein.'0 Edible wild plants may also be sources of high-quality nutrients. In West Africa parts of 24 out of 165 studied plant species are regularly eaten, and in the whole continent more than 500 wild plants are consumed as food."
Average food supplies in rich countries are so high that inaccuracies embedded in availability estimates can in no way question nutritional ad- equacy. But in some of the poorest countries, supplies just 5-10 percent higher than indicated by FAO's food balances could make the difference
This content downloaded on Thu, 7 Mar 2013 19:26:32 PMAll use subject to JSTOR Terms and Conditions
260 How MANY PEOPLE CAN THE EARTH FEED?
between malnutrition and acceptable minima. The real mark of our igno- rance is that in many cases we cannot even be sure in which direction to correct a particular value. In aggregate, there is little doubt that global food supplies, as well as average availabilities in most poor countries, are higher than indicated by food balance sheets.
FAO's global mean of per capita food supply was almost exactly 2,700 kcal/day in 1990; if the real value were just around 3 percent higher, the mean would rise to 2,800 kcal/capita. FAO's average for the poor world was about 2,500 kcal/capita; a 5 percent increase would bring it to just over 2,600 kcal. In order to judge the adequacy of this supply we must know what share of it is actually consumed, what its nutritional quality is, and how much food is really needed.
How much food do we eat?
Whatever their accuracy, food balance sheets do not inform us about ac- tual average per capita food consumption.'2 This knowledge, ideally en- compassing data on about a dozen principal nutrients, can come only from detailed food intake surveys. Consumption averages should be lower than the food balance sheet means owing to losses during processing, wholesale and retail storage and transfers, and kitchen waste. Disparities between the two rates can be large. Daily per capita availabilities are well over 3,000 kcal in all rich countries, implying means of over 4,000 kcal/day for every adult, far beyond any realistic needs. Actually eating so much food would imply a stunning extent of gross obesity.
Unfortunately, it is impossible to derive consumption means from sup- ply figures by scaling down the latter by a fixed fraction accounting for the distribution and kitchen losses. Supply figures are too uncertain bases for such adjustments, and differences in eating habits and food distribution re- sult in highly idiosyncratic patterns of use. Because of the expense, most countries simply do not conduct representative recurrent food intake sur- veys, and many of them have never had even a single limited assessment. Consequently, we do not know with satisfactory accuracy the actual food intakes of most of the world population.
This information is questionable even for the countries with published nutritional surveys. A closer look at scores of recent and hundreds of post- World War II studies (reviewed in detail in FAO 1983, 1986, and 1988) reveals that more than 90 percent of them are not even true food con- sumption assessments, but rather income and expenditure surveys con- cerned with food consumption only as a part of total household budgets. True food consumption surveys measuring household or individual food intake either record actual food intake or rely on recalls of past food con-
This content downloaded on Thu, 7 Mar 2013 19:26:32 PMAll use subject to JSTOR Terms and Conditions
VACLAV SMIL 261
sumption. Food records are the most accurate but also the most expensive, and hence least practical for countrywide assessment involving large sample sizes. But even food records may considerably underestimate individual con- sumption.'3
Dietary recalls, most often for the 24 hours preceding an interview, are favored in extensive surveys but their accuracy is clearly questionable: many items will be forgotten and quantities will be either underestimated or exaggerated.'4 Recall studies covering a few days may give fairly repre- sentative means in affluent societies with little seasonal variation of food intake, but similar results may be quite misleading in impoverished coun- tries where both the supply and needs range widely, reaching highs during periods of heavy field labor. We really have no practical and reliable way to determine the true usual food consumption, that is, intake representative over a long time. At best, we can obtain approximations of current intakes limited to specific time periods.
Comparisons of food consumption averages with daily supply means derived from food balance sheets show that in rich countries the former values are commonly 20-40 percent lower than the latter rates, and in poor countries the difference can be negative as well as positive (or accidentally coincidental). Generally, these are not unexpected differences, but many reputed intakes are puzzling. That Austria and Germany have nearly iden- tical supply means is not surprising, but do Germans really eat so much less (about 20 percent) than Austrians? Did an average Japanese in 1990 actu- ally eat less than an average Indian in 1971?'5 And how can the huge Ameri- can gap between supply and consumption be explained when US food in- take data are based on 24-hour recall that includes all food eaten anywhere? Do Americans have very poor memories or are they just exceedingly waste- ful? The latter possibility has been convincingly excluded by the Garbage Project, which examined more than one million items from household refuse samples (Rathje and Murphy 1992).16
Moreover, comparisons of supply and consumption data over time only increase the disparities. For example, household intake studies in Bangladesh, conducted by a combination of 24-hour food weighing and interviews, show a steady decline of daily per capita averages from nearly 2,300 kcal in 1962-64 to 2,070 kcal in 1975-76 and to just 1,950 kcal in 1981-82, a drop of over 7 percent in six years (Hassan and Ahmad 1984). In contrast, FAO's balance sheet for the same period credited Bangladesh with about 5 percent higher per capita food supply in 1981 than in 1975. Which trend is correct?
The only easily defensible generalization is that few, if any, national per capita food energy consumption means surpass 2,600 kcal/day, and that most values fit between 2,000 and 2,500 kcal/day. Are these rates within the range of desirable intakes or do they indicate serious food shortages?
This content downloaded on Thu, 7 Mar 2013 19:26:32 PMAll use subject to JSTOR Terms and Conditions
262 How MANY PEOPLE CAN THE EARTH FEED?
How much food do we need?
Determination of food energy needs at the population level is an extraordi- narily complex challenge, both because of enormous variation in require- ments and because of effective human adaptations to lower food availabil- ity. Human food needs are made up of the basal metabolic rate (BMR) and energy for growth and replacement of body tissues and for activities (FAO/ WHO/UNU Expert Consultation 1985; James and Schofield 1990). BMR, the minimum amount of energy needed to maintain critical body functions, varies with sex, body size, and age. BMR measurements show wide depar- tures from statistically expected means.'7 Minimum survival requirements call for additional energy for metabolizing food and for personal hygiene, adding at least 25 percent to the BMR even for housebound people.
Growth demands claim as much as one-third of the total food intake during the first few months of life, by age ten they are down to just 2 per- cent, and after an early-teenage rise to 3-4 percent they become insignifi- cant. Energy costs of activities can be expressed conveniently as multiples of BMR. They range from 1.3-1.5 BMR for standing to 1.8-4.0 BMR for light work and to 6-8 BMR for heavy exertion. A large share of fieldwork in traditional farming societies still falls into the last category, while an over- whelming majority of tasks in industrialized societies call merely for light exertion. Mental work needs only a very modest energy investment, in- creasing the BMR by less than 10 percent.
Calculations at the national level start with the population's age and sex structure (usually from the latest available census), assume average BMRs of individuals in specified groups (accurate only where mean heights and weights are known from anthropometric surveys), assign prevailing activity levels, and make allowances for pregnancy and diseases. Inevita- bly, these calculations cannot be estimated without a number of simplify- ing assumptions. I have done them for six of the world's most populous countries in 1990 and came up with the weighted per capita mean of about 2,100 kcal/day.
The World Hunger Program prepared such estimates for more than 130 countries (containing 92 percent of global population), with daily per capita averages ranging from just short of 1,800 kcal in Afghanistan or Bangladesh to about 2,300 kcal in a number of rich countries, with the global mean at about 2,000 kcal (Bender 1993).18 This study also concluded that current global consumption would have to increase by less than 2 per- cent if all people were to get enough food energy intake for their height.
Naturally, more food would be needed to eliminate stunting, which has reduced national food energy requirements by more than 15 percent in some countries. But even this change would call for a relatively small intake adjustment: if everybody's height and weight were increased to de- sirable levels, global food energy consumption would rise by less than 8
This content downloaded on Thu, 7 Mar 2013 19:26:32 PMAll use subject to JSTOR Terms and Conditions
VACLAV SMIL 263
percent. In aggregate, adjustments for desired-weight-for-actual-height (an increase that could be put into effect immediately) and the worldwide elimi- nation of stunting (necessarily a generational change) would require less than a 10 percent increase of global food energy consumption.
Consequently, it would be prudent to use the per capita value of 2,200 kcal/day as an adequate average of global food energy needs. The global food supply available in 1990 could make this diet adequate not only in terms of total energy intake, but also in terms of its quality.'9 But food con- sumption surveys have repeatedly shown actual intakes below 2,200 kcal/ day. The two most representative US investigations resulted in means of less than 2,400 kcal for males, and less than 1,600 kcal for females.20 These rates are confirmed by the latest North American food survey: the actual food energy intake of Nova Scotia women is only 1,720 kcal/day for those between 18 and 34 years of age, and it averages below 1,500 kcal/day for those older than 35 years (Nova Scotia Heart Health Program 1993).
Prevalence of such low intakes in many affluent societies-between 10 and 25 percent below standard recommendations-clearly indicates that there is no single minimum of food energy supply applicable to all popula- tions (Borrini and Margen 1985). Further, energy balance studies of tradi- tional societies confirm that not only particular groups, but whole popula- tions can live with food energy intakes well below the standard, Western-set, metabolic expectations (Pollitt and Amante 1984; de Garine and Harrison 1988; Garby 1990).
Among Kenya's Turkana, adult males consume only about 1,900 kcal, and females only about 1,400 kcal/day during the late dry season. Among the Senegalese Ferlo a large seasonal food deficit (nearly 300 kcal/day com- pared to standard recommendations) is not accompanied by any significant increase in malnutrition or by any clinical signs of food deficiency (Ben- efice et al. 1984). Remarkable adaptations to lower food supply are illus- trated most strikingly by differences in the energy cost of pregnancy and lactation. In the West pregnancy raises BMR by 15-20 percent, lactation raises BMR by 30-50 percent. But in poor countries women give birth to healthy babies while consuming much less food energy, maintaining a genu- ine energy balance on what seem to be incredibly low levels of food in- take-not merely 5-10, but easily 20-40, even close to 50 percent lower than the expected requirement.2'
Nor do lower food intakes necessarily weaken the affected economies. As Poleman (1993) concluded (in a letter to The Economist), "poor people long ago discovered how to allocate their resources so as to get by on what by the standards of the industrialized world is very little. It serves no pur- pose to deny this ingenuity." Numerous observations confirm that workers with low-energy intakes are often as productive as those with high food consumption, that a long-term adaptation to lower food availability (com- monly achieved by slower growth and by reduction in adult body mass)
This content downloaded on Thu, 7 Mar 2013 19:26:32 PMAll use subject to JSTOR Terms and Conditions
264 How MANY PEOPLE CAN THE EARTH FEED?
can maintain good health (albeit in smaller bodies-but they will be more efficient), and that there is scant correlation between food energy intake and time spent actually working (Edmundson and Sukhatme 1989).22
Recommendations of energy intakes are thus a pursuit of a moving target whose position changes not only owing to differences in individual or population-wide energy conversion efficiencies but also because of cul- turally conditioned work habits and attitudes, seasonal fluctuations in staple diets, and a host of genetic and environmental factors controlling the adap- tive process. These uncertainties make it questionable to offer estimates of global prevalence of malnutrition based on contrasting the known means of food energy supplies with standard expected requirements. Even in pro- tein-energy malnutrition, the most acute form of nutritional deficiency af- flicting many children in poor countries, energy intakes in some areas may be adequate, or even excessive, in relation to body weight or to age (Bhattacharya 1986).
Humans are flexible convertors of food energy, responding with al- tered metabolic efficiencies to different diets, environmental conditions, spe- cific tasks, and health states. The question about food requirements is not simply "how much?" but rather "for what?" and "in what context?" These questions move the search for food requirements to the much larger and largely unquantifiable setting of cultural preferences and social expecta- tions. Human energetics is so contextual and so value-laden precisely be- cause it concerns humans (Borrini and Margen 1985).
Two practical consequences for capacity calculations are clear. First, no large-scale averages of recommended or desirable food energy needs can be highly reliable; because their use in global calculations is unavoid- able, conservative rates must be favored. Second, only relatively small av- erage adjustments are needed in order to improve nutritional status and activity levels of less fortunate populations.
Taking FAO's food availability figures (daily global mean of 2,700 kcal/ capita), adjusting them very slightly (up to 2,800 kcal/capita) to correct for the supply of unaccounted foods, and comparing them to actual average intakes and needs (2,200 kcal/capita) leaves only one possible conclusion: current global food production is sufficient to provide adequate food for the world's population. Even if all of the poor world's populations would raise their health status and activity level to those prevailing in rich coun- tries, the average 1990 global food energy consumption would have to in- crease by only 10 percent, and it would still remain well below the avail- able mean supply.
This conclusion "starkly confirms that the current pattern of malnu- trition and hunger is unrelated to food availability, but is instead a function of global entitlements to food" (Bender 1993: 10). Local or national food deficits, ranging from marginal to crippling, are not caused by physical short- ages. Their principal reasons are either breakdown of normal production,
This content downloaded on Thu, 7 Mar 2013 19:26:32 PMAll use subject to JSTOR Terms and Conditions
VACLAV SMIL 265
transportation, and distribution or insufficient access by individuals or groups. The first phenomenon arises most often amidst wars (Afghanistan, Angola, Ethiopia, Mozambique, Somalia, and Sudan have been the worst recent entries) or in the aftermath of major natural catastrophes (repeated washing away of Bangladeshi harvests); the second is present in the richest as well as in the poorest countries.23
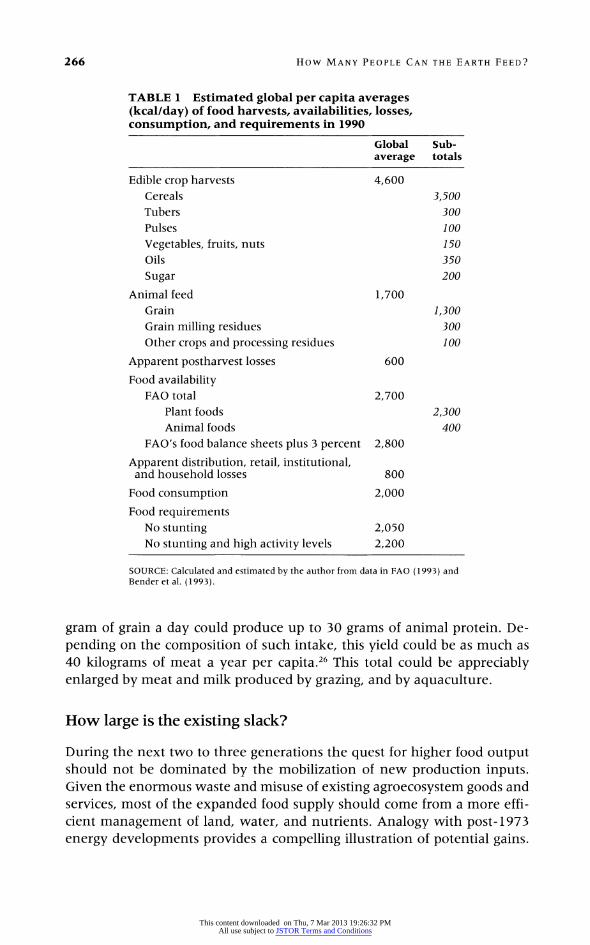
A tabular restatement of global averages concerning food production, supply, consumption, and requirements may be useful at this point. Most of the difference between harvest and availability rates is, of course, due to the feeding of some 700 Mt of grain to domestic animals, an input that reappears further down in the table as most of the 400 kcal/day available in animal products. Postharvest wastes are equivalent to about 600 kcal/ day, and losses during distribution and retail and at the institutional and household level add up to an even larger amount of about 800 kcal/day (Table 1).
Before appraising the available slack in the global food system, as well as the options to tap new production inputs, I must still address the desir- able composition of average diets, above all, the share of animal foods. Ex- treme attitudes in this matter are represented by uncompromising vegetar- ians, and by those who assume that only the Western meaty diets provide the most desirable nutrition.
Of course, vegetarians can cite impeccable biochemical evidence for their choice. We are descendants of omnivorous, but overwhelmingly veg- etarian hominids, and there is no existential need to consume animal foods because all essential amino acids can be ingested in appropriate mixtures of plant foods. Vegetarianism is surely no obstacle to maximizing an individual's life span. On a collective level, demographic evidence shows that life ex- pectancies in a number of countries with very low intakes of animal pro- tein are as high as, or even higher than in nations eating much more meat.24 In contrast, the promoters of animal husbandry can point to a widespread human preference for animal foods, and to a virtually worldwide trend to- ward meatier diets with rising incomes.
Two facts matter: (1) diets very high in meat are a very recent aberra- tion unsustainable on a global scale, but (2) consumption of some animal foods is nutritionally desirable. Analogy with mass car ownership is useful: it, too, is a recent aberration that cannot be sustainably extended from rich to poor countries, and that, for environmental reasons, must be profoundly transformed even in the rich ones.25
While meaty Western diets cannot be a model for the industrializing countries of the next century, substantial production of animal foodstuffs can be achieved by a combination of efficient dairy, chicken, and pork pro- duction. Today's good practices could produce mixtures of such animal foods by feeding between 3 and 4 kg of grain for every kg of edible product. Con- sequently, the current global per capita mean of feeding about half a kilo-
This content downloaded on Thu, 7 Mar 2013 19:26:32 PMAll use subject to JSTOR Terms and Conditions
266 How MANY PEOPLE CAN THE EARTH FEED?
TABLE 1 Estimated global per capita averages (kcal/day) of food harvests, availabilities, losses, consumption, and requirements in 1990
Global Sub- average totals
Edible crop harvests 4,600 Cereals 3,500 Tubers 300 Pulses 100 Vegetables, fruits, nuts 150 Oils 350 Sugar 200
Animal feed 1,700 Grain 1,300 Grain milling residues 300 Other crops and processing residues 100
Apparent postharvest losses 600
Food availability FAO total 2,700
Plant foods 2,300 Animal foods 400
FAO's food balance sheets plus 3 percent 2,800
Apparent distribution, retail, institutional, and household losses 800
Food consumption 2,000
Food requirements No stunting 2,050 No stunting and high activity levels 2,200
SOURCE: Calculated and estimated by the author from data in FAO (1993) and Bender et al. (1993).
gram of grain a day could produce up to 30 grams of animal protein. De- pending on the composition of such intake, this yield could be as much as 40 kilograms of meat a year per capita.26 This total could be appreciably enlarged by meat and milk produced by grazing, and by aquaculture.
How large is the existing slack?
During the next two to three generations the quest for higher food output should not be dominated by the mobilization of new production inputs. Given the enormous waste and misuse of existing agroecosystem goods and services, most of the expanded food supply should come from a more effi- cient management of land, water, and nutrients. Analogy with post-1973 energy developments provides a compelling illustration of potential gains.
This content downloaded on Thu, 7 Mar 2013 19:26:32 PMAll use subject to JSTOR Terms and Conditions
VACLAV SMIL 267
Preoccupation with supply increases survived the first round of OPEC's sharp crude oil price rises in 1973-74, but gradually it became clear that the slack in the system is an energy source preferable to discovery of new deposits of traditional fuels or to development of novel conversions.
This largely price-driven realization has allowed the world to do more with less: between 1970 and 1990 the energy intensity of the global economy fell by about 15 percent, with declines of 30 percent in North America and 20 percent in Europe and in East Asia.27 And these improvements will con- tinue: the World Energy Council (1993) projects that, in comparison with the 1990 rate, the overall energy intensity of the global economy will de- cline by more than 40 percent by the year 2020.28 Of course, the world- wide production of energy will continue to increase during the next one or two generations, but higher efficiencies of fuel and electricity use will greatly reduce the rate of this expansion.
Similar opportunities lie ahead in producing more food. During the next one to three generations the rich countries with relatively stable popu- lations could produce more food with barely changed, or even decreased inputs, while the poor countries could tap the existing slack to lower the relative use of productive resources. As with rational energy management (a broader term I prefer to conservation), there are no stunning shortcuts: any single action or technique can save usually only a few percent of the total existing use, but a combination of these approaches results in major and long-lasting gains.
Many no-cost or low-cost decisions are only a matter of applying ap- propriate know-how or available techniques, and their adoption has im- pressive rewards (Munson and Runge 1990). Merely knowing when to plant can be very valuable. Earlier or more timely plantings of soybeans can raise yields by up to 50 percent, while seeding beyond a narrow optimum period may cut American corn yields by 125 kg/ha per day, and in Kenya's East- ern and Central Provinces the difference may be as much as 170 kg/ha per day (Haugerud and Collinson 1991).
Knowing how to plant also matters: optimum density of corn seeding raises yields by as much as 2.5 t/ha, denser seeding improves wheat yields, and narrower rows can bring another ton of soybeans per hectare. Return- ing to crop rotations is another well-proven, low-cost strategy in some re- gions. Rotations were the mainstay of all highly productive traditional agroecosystems. Their rapid decline, and even outright abandonment, dur- ing the past two generations should be seen as an aberration. Their envi- ronmental advantages have been well documented by long-term field ex- periments (Higgs et al. 1990). They include, above all, reduced soil erosion and runoff, benefits of symbiotic nitrogen production by legumes, better soil tilth, and interruption of weed, insect, and crop disease cycles.
Successful rotations must include leguminous plants, and so much more attention should be given to the productivity of edible cultivars, which also
This content downloaded on Thu, 7 Mar 2013 19:26:32 PMAll use subject to JSTOR Terms and Conditions
268 How MANY PEOPLE CAN THE EARTH FEED?
make substantial contributions to local protein supply (Matthews 1989). An outstanding recent example of this approach is the release of an im- proved strain of mung beans by the Asian Vegetable Research and Devel- opment Center. Between 1985 and 1990 this cultivar was planted on over 360,000 ha in China, outyielding local varieties by about 50 percent (Harris 1991). Optimum selection of high-yielding varieties resistant to disease or insects can make similar differences, with identical rates of nutrient and pesticide inputs, for all major grain crops. Yield gains in the United States can be around 3 t/ha (25-40 percent higher) for corn and about 1.3 t/ha (almost 50 percent higher) for soybeans.
In view of these proven advantages, it is surely conservative to be- lieve that the combination of widespread adoption of proper planting (ear- lier, denser), better crop rotations, and careful choice of cultivars would increase average crop yields by 20 percent during the next 50-60 years. Obviously, these increases will need more nutrients and water, but both of these inputs offer their own considerable conservation opportunities.
Timing is also critical for fertilizer applications. They should coincide with periods of the highest nutrient need, and they have to be done in ways that minimize field losses. One of the best examples of this concern is the widespread use of urea broadcast onto flooded rice fields.29 In dryland row crops, major efficiency gains come from side-dressing (sometimes only every second row) rather than from broadcasting the fertilizer. Other re- warding agronomic measures reducing nutrient losses and improving av- erage fertilizer uptakes include proper N:P:K ratios (nitrogen losses can be particularly high when phosphorus is deficient, while adequate nitrogen greatly increases potassium uptake), various ways of minimizing soil ero- sion (contour cultivation, reduced tillage), and effective weed and pest con- trol. In drier environments notable gains can come from such a simple ad- justment as leaving higher stubble to catch more snow.
Costlier but highly effective ways to improve fertilizer uptake must start with accurate and relatively detailed soil testing. Comprehensive tests can provide reliable recommendations for optimal application of nutrients. Basic testing has been widespread in rich countries, but recent automated testing procedures linked to microcomputers and satellite-based global po- sitioning have brought the technique to an extremely accurate field level. Unfortunately, even occasional tests are still rare or absent in large parts of the poor world, a shortcoming representing a huge opportunity for higher fertilizing efficiencies.
Ammonia injection into soils, as opposed to surface broadcasting of solid fertilizers, requires specialized storage, distribution, and application techniques. The higher costs are repaid by much better crop uptakes and utilizations. Naturally, such novel applicators as spoked-wheel injection also require higher capital investment and will be limited for decades to rich agricultures. Emerging options include applicators with on-board comput-
This content downloaded on Thu, 7 Mar 2013 19:26:32 PMAll use subject to JSTOR Terms and Conditions
VACLAV SMIL 269
ers that change rates and combinations of nutrients as the machine travels across the field.
Another costly, but ultimately highly rewarding investment would be the modernization of China's nitrogen fertilizer industry, now the world's largest. About half of the nutrient in China is produced in small, coal-based plants as ammonium carbonate. This is an unstable, highly volatile com- pound that should be vacuum-packed for distribution and incorporated deep into soil to eliminate large losses, recently estimated to be as high as 20 percent even before application (Smil 1993).
The combined effect of these improvements, first in rich countries, later throughout the poor world, should be impressive. Improvements in fertilizer efficiency were already seen in the US corn production of the 1 980s. While nitrogen and potassium applied per harvested hectare of America's largest crop had reached an obvious plateau, and phosphorus application actually declined, average yields kept increasing (Runge et al. 1990). This has been true even in the most intensively cultivated parts of the country: most notably, the best yields in Iowa during the 1970s.
A recent European survey found nitrogen uptake efficiencies in wheat farming ranging from lows of 18-37 percent in Greece to highs of 52-65 percent in England (Jenkinson and Smith 1989). Other studies indicate somewhat higher (Frissel 1978) but also much lower average uptakes (Ross 1989). While it is impossible to offer an accurate global mean, the best in- dications are that as little as 35-40 percent and certainly no more than 45-50 percent of all applied nitrogen is actually taken up by crops.
Naturally, the gains will be uneven, but careful agronomic practices should raise the average nitrogen use efficiency by at least 30 percent dur- ing the next two to three generations, bringing average uptakes to at least 50, or perhaps around 60 percent of applied nitrogen. Even if the utiliza- tion of nitrogen from other sources remained constant, higher fertilizer ef- ficiencies would raise the effective supply of the nutrient by 10-12 Mt.30 In reality, effective supply of nitrogen from other sources should also increase because of reduced nutrient losses in soil erosion, and because of more fre- quent rotations and more vigorous recycling.
Again, relatively modest improvements would translate into impres- sive total gains: reducing erosional losses by just 20 percent would save roughly 5 Mt of nitrogen from non-fertilizer sources, and expanding biofixation (largely through proper rotations with legumes) and waste re- cycling by just 10 percent would add another 5 Mt of nitrogen.3' The cu- mulative effect of adopting well-proven, mostly low-cost measures aimed at increasing efficiency of nutrient uptake would be equal to expanding nitrogen supply by 20-22 Mt a year.
Given that nitrogen is almost always the nutrient with highest field losses, similar relative efficiency improvements should be possible for the other two macronutrients, P and K. This nutrient gain would be sufficient,
This content downloaded on Thu, 7 Mar 2013 19:26:32 PMAll use subject to JSTOR Terms and Conditions
270 How MANY PEOPLE CAN THE EARTH FEED?
even with a much lower crop response, to produce additional harvests equivalent to about 500 Mt of grain. But the increased productivity due to advances in planting, rotations, and cultivar selection, and nutrient needs of crops grown with water saved by more efficient irrigation, would reduce this total to a net gain equivalent to about 150 Mt of grain.32
No less important efficiency gains are achievable by a combination of technical improvements and higher prices in crop irrigation (Stanhill 1986). Currently prices of water in intensively farmed, arid regions do not even cover the costs of delivery. California farmers repay their share of aqueduct costs over a period of 50 years with interest-free loans, and most of them are paying about 10 percent of the actual supply cost (Gottlieb 1991). Dur- ing the late 1980s, a decade of extensive drought and chronic urban water shortages, the typical price of China's irrigation water was mostly between 5 and 20 percent of the actual cost (Smil 1993). Higher prices should im- prove the existing methods, bring better matching of crops with available moisture, and introduce more efficient watering techniques. But higher prices alone may not be sufficient: some regions will also need changes in basic water-allocation arrangements.
Total distribution, seepage, and evaporation losses in traditional ridge- and-furrow irrigation amount commonly to 50-60 percent of carried wa- ter. Typical water use efficiency-the share of water released for irrigation that is finally evapotranspired by crops-is no more than one-third even in surface irrigation in the United States (Stanhill 1985). Gains can be made even without any investment: irrigating every other furrow saves about one-third of water with only a modest decline of crop yields. Careful sched- uling of irrigation is the simplest low-cost measure, and microcomputers have turned it into an instant-response field tool. Optimal irrigation sche- dules can result in large water savings (Frederick 1988). A simple Ameri- can innovation makes almost perfect scheduling available to any farmer buying an auger, a score of gypsum blocks, and an AC resistance meter.33
Better matching of crops with natural moisture supply is another highly effective alternative. For example, replacing corn with sorghum can lower water needs by 10-15 percent, and planting sunflowers instead of soybeans as an oil crop can save easily 20-25 percent of water. If the current water use efficiency in field cropping averages 30-40 percent for the poor world, and 40-50 percent in rich countries, there is no reason why these rates could not be increased by at least half during the next two to three generations.
Erring again on the conservative side, even if the average water use efficiency were to go up by no more than 30 percent, and if no less than 1,200 kg of water were needed to produce a kg of crops, the global annual gain would be equivalent to about 250 Mt of additional grain. This amount must be reduced by water needed for increased productivity owing to ag- ronomic advances: assuming that at least one-fourth of expanded harvests will come from irrigated land, the net gain would be 100-150 Mt of grain.34
This content downloaded on Thu, 7 Mar 2013 19:26:32 PMAll use subject to JSTOR Terms and Conditions
VACLAV SMIL 271
Better seeding, crop rotations, careful cultivar choice, and improved use of nutrients and water do not exhaust the opportunities for rational management. Perhaps the most widely recognized possibility is in reducing often large postharvest losses. Again, no single measure will bring a drastic change: gains will result mainly from a combination of better crop storage, less wasteful and more versatile ways of processing, and greater availability of commercial and domestic refrigeration. Cutting the current postharvest losses by 20 percent would be equivalent to about 6 percent of global 1990 food energy consumption.
Bender (1993) estimated that eliminating all end-use food waste (in- cluding indirect waste during animal feeding) in excess of the best prac- tices prevailing in rich countries would yield an equivalent of 12.5 percent of 1990 global food energy consumption. Even if only half of that potential were practically achievable during the next 40-60 years, the gain would be equivalent to more than 60 Mt of processed grain.
These gains in input efficiency can be augmented by widespread adop- tion of less fatty and less meaty diets. Economic and social realities would seem to make such a transformation highly unlikely: since the beginning of the twentieth century the trend in virtually all industrializing countries has been in exactly the opposite direction, toward diets progressively higher in animal foodstuffs and hence in total and saturated fats (Popkin 1993). The same trend is clear among the most affluent urban consumers in many poor countries. But neither of these realities precludes substantial shifts: after all, the current Western dietary pattern is of very recent origin even in countries with traditionally important animal husbandry,35 and the com- bination of public education with appropriate economic incentives can make a notable difference over two or three generations.
Health concerns have already brought some shifts from high-fat to low-fat foods, and they will continue to dominate such a transition in the richest countries.36 The well-documented correlation between obesity and morbidity is related above all to cardiovascular diseases and diabetes. Vari- ous studies of body mass index and mortality suggest a U-shaped, J-shaped, or uniformly direct association-but no matter which relationship applies, there is no survival advantage in being overweight (Kushner 1993). The benefits of sparse diets were most dramatically documented by the greatly improved health and rapid increases of life expectancy of the British popu- lation during the two wartime rationing spells (Sen 1993).
The relationship between cardiovascular mortality and intakes of satu- rated fat is far from simple (Smil 1990; Stehbens 1990), but there is little doubt about the broader benefits of lowered fat intake (Public Health Ser- vice 1988). Limiting fat intake to a maximum of 30 percent of total food energy (compared to just over 40 percent in the United States or France) would follow a longstanding recommendation of the American Heart As- sociation (1982). Bender (1993) calculated that such a worldwide reduc-
This content downloaded on Thu, 7 Mar 2013 19:26:32 PMAll use subject to JSTOR Terms and Conditions
272 How MANY PEOPLE CAN THE EARTH FEED?
tion of lipid intakes would be equivalent to just over 10 percent of 1990 world food consumption assuming that the whole cut were achieved by lower intakes of animal products. This reduction would leave the lipid share still above the level for the world's longest-living population: Japanese con- sume only one-fourth of their calories as fat. Yet even this conservative step would be the equivalent of feeding annually at least another 500 mil- lion people.
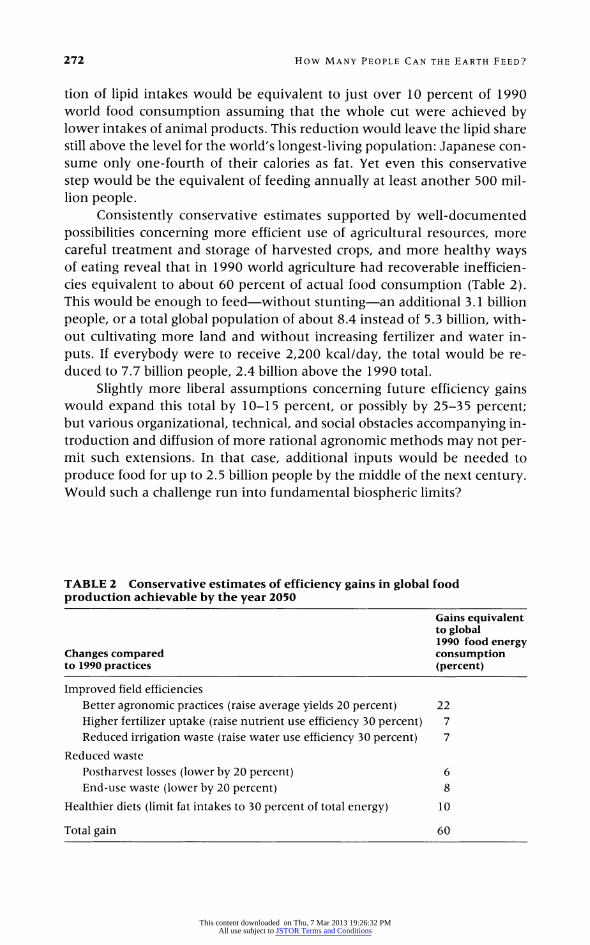
Consistently conservative estimates supported by well-documented possibilities concerning more efficient use of agricultural resources, more careful treatment and storage of harvested crops, and more healthy ways of eating reveal that in 1990 world agriculture had recoverable inefficien- cies equivalent to about 60 percent of actual food consumption (Table 2). This would be enough to feed-without stunting-an additional 3.1 billion people, or a total global population of about 8.4 instead of 5.3 billion, with- out cultivating more land and without increasing fertilizer and water in- puts. If everybody were to receive 2,200 kcal/day, the total would be re- duced to 7.7 billion people, 2.4 billion above the 1990 total.
Slightly more liberal assumptions concerning future efficiency gains would expand this total by 10-15 percent, or possibly by 25-35 percent; but various organizational, technical, and social obstacles accompanying in- troduction and diffusion of more rational agronomic methods may not per- mit such extensions. In that case, additional inputs would be needed to produce food for up to 2.5 billion people by the middle of the next century. Would such a challenge run into fundamental biospheric limits?
TABLE 2 Conservative estimates of efficiency gains in global food production achievable by the year 2050
Gains equivalent to global 1990 food energy
Changes compared consumption to 1990 practices (percent)
Improved field efficiencies Better agronomic practices (raise average yields 20 percent) 22
Higher fertilizer uptake (raise nutrient use efficiency 30 percent) 7 Reduced irrigation waste (raise water use efficiency 30 percent) 7
Reduced waste Postharvest losses (lower by 20 percent) 6 End-use waste (lower by 20 percent) 8
Healthier diets (limit fat intakes to 30 percent of total energy) 10
Total gain 60
This content downloaded on Thu, 7 Mar 2013 19:26:32 PMAll use subject to JSTOR Terms and Conditions
VACLAV SMIL 273
How restrictive are natural factors?
Photosynthetic productivity depends on the availability of solar radiation, atmospheric carbon dioxide, plant nutrients, land, water, and sufficient biodiversity. Crop yields are almost never limited by the incoming solar radiation. Similarly, the current atmospheric concentration of CO2 (about 350 parts per million) is adequate for sustained high biomass yields, and increasing concentrations of the gas will tend to enhance the photosyn- thetic efficiency of nearly all well-watered and well-fertilized crops.37 Thus the four critical natural determinants of future crop productivity are the availability of land, nutrients, and water, and the protection of adequate biodiversity.
Local and regional conditions result in a wide variety of limiting pat- terns, but on the global level two generalizations are justified. First, poten- tial supplies of cropland and water are still relatively large, but their practi- cal availability is limited by distributional and qualitative considerations. In contrast, natural availability of the three macronutrients-nitrogen, phos- phorus, and potassium-has been below the level needed to produce the global crop harvest for the past two decades. While it may be costly, more land can be brought into production and more water diverted for irriga- tion, but no new natural sources of macronutrients are waiting to be tapped: in order to increase their supply we have to synthesize more ammonia and mine more phosphates and potash.
The relative scarcity of nitrogen in the biosphere has made it the most common limiting nutrient in plant growth. Mineralization, microbial re- lease of nitrogen from soil organic matter, bacterial fixation of atmospheric N2, and the deposition of N compounds in precipitation have been for long augmented by recycling of organic wastes. However, the limited availabil- ity, low nitrogen concentration, and high application losses of recycled ma- terials restrict the maximum crop productivity of organic agriculture.38 This barrier was removed effectively only with mass production of nitrogen fer- tilizers after 1950. These compounds now contribute more than two-fifths of all nitrogen inputs to the world's farmland. Because about three-fourths of the nitrogen in proteins consumed by humans comes from crops, at least every third person worldwide gets the protein thanks to Haber-Bosch syn- thesis of ammonia using nitrogen from the air (Smil 1991 a).
Phosphorus is even rarer in the biosphere than nitrogen, but neither complex sugars nor proteins can be made without it. The total P content of global crop production in the early 1990s (including harvested residues but excluding forages) was about 12 Mt. No combination of natural inputs could supply this amount of the nutrient: phosphorus fertilization is now an es- sential agricultural practice causing inevitable intensification and accelera- tion of phosphorus cycling between farm soils and plants and higher flux of the nutrient from soils to waters (Smil 1990).
This content downloaded on Thu, 7 Mar 2013 19:26:32 PMAll use subject to JSTOR Terms and Conditions
274 How MANY PEOPLE CAN THE EARTH FEED?
The fate of fertilizer phosphorus has been a key preoccupation of soil scientists for more than a century (Khasawneh et al. 1980). The traditional view was that most of the applied nutrient was quickly tied up by the soil, piling up in unavailable forms. In reality, the best available soil nutrient budgets (Frissel 1978; Karlovsky 1981) show that phosphorus use efficien- cies in highly productive agroecosystems are at least as high as the uptakes of nitrogen, and in some soils they are even higher.
There are no insurmountable resource, technical, energetic, agronomic, or environmental reasons preventing increased production and use of fer- tilizers even if agronomic improvements would not save more than the con- servatively estimated 30 percent of the current nutrient use, and if all re- quirements to produce additional harvests would have to come from new supplies. Assuming average nutrient uptake efficiencies around 60 percent, N, P, and K production would have to increase by about 25, 6, and 7 Mt respectively. This would call for expanding the global fertilizer output by about one-third by 2050, a growth rate well below the post-1950 perfor- mance.
Even higher increases, resulting from lower uptake efficiencies, would not run into any near-term resource limits. The Haber-Bosch process takes its nitrogen from the practically unlimited atmospheric pool, and there is no shortage of hydrogen sources (methane is now dominant, but hydroge- nation of coal could draw on a much larger resource). Reserve totals for phosphate rock range from about 20 to 70 billion tons, resource estimates from about 110 to 300 billion tons (Sheldon 1982). Even the lowest re- serve number is good for more than a century of extraction at the 1990 level. There is a close relationship between increasing nitrogen fertilization and potassium requirements-most intensively cultivated croplands must receive potassium to prevent rapid yield drops-but potassium compounds, although unequally distributed, are abundant in the Earth's crust (Munson 1985).
Fertilizer production is a mature industry steadily improving its tech- niques and lowering its energy costs. Fuels and electricity needed to ex- tract the minerals and to produce various fertilizing compounds are now equal to less than 3 percent of global primary energy consumption (Smil 1991a). This is a marginal burden in a world where more than one-tenth of the final energy demand is for gasoline fueling private cars whose aver- age efficiency is still too low: there could be no rational argument positing fertilizer shortages caused by inadequate energy supplies during the next three generations.39
Declining response to higher fertilizer applications is inevitable in the most intensively farmed regions, but a large majority of the world's farm- land is still short of the needed macronutrients. In turn, increased efficiency of crop uptake should lower undesirable nutrient losses, mainly into wa-
This content downloaded on Thu, 7 Mar 2013 19:26:32 PMAll use subject to JSTOR Terms and Conditions
VACLAV SMIL 275
ters. Leaching, or denitrification and volatilization rates do not have to rise with more intensive fertilization: they will go up only with excessive use and with improper applications.
Losses and degradation of arable land are worldwide phenomena, caused by growing populations, industrialization, and environmental deg- radation. Their effects are already acutely felt in many poor populous coun- tries (Blaikie and Brookfield 1987; Dudal 1987). Perhaps the most stun- ning fact is that China, whose potential expansion of arable land is limited to about one-tenth of the currently cultivated area, has had a net loss of almost one-fifth of its arable land since the mid-1950s (Smil 1993). FAO's (1981) detailed appraisal of long-term agricultural prospects in 90 poor coun- tries (excluding China) found that 51 of them had abundant or moderately abundant reserves of arable land-but the population of these countries was just one-third of the studied total. In contrast, 18 countries with ex- treme land scarcity, already cultivating more than nine-tenths of the po- tentially arable land, supported one-half of all the population in the stud- ied set.
Conversions of natural ecosystems to farmland will continue in many poor countries. The theoretical potential for further extensions is clearly large-several detailed assessments based on evaluation of soil and climatic maps have come up with ultimate totals of close to 2 billion ha, larger than the 1990 farmland (Buringh 1977)-but the total global addition to new farmland during the next three generations may be much smaller than dur- ing the past 60 years when the cultivated area was enlarged by about 50 percent (Richards 1990). Expanding the 1990 cultivated area by no more than 20 percent by the year 2050 (the slowest growth rate since 1800) would add about 300 Mha of crop fields, enough to produce an equivalent of at least 400 Mt of grain even with average global yields locked at the 1990 level.
Obviously, expanding the cultivated area will not suffice to feed an additional 2-2.5 billion people. Intensification of farming rather than ex- tension of cultivated land will have to provide the bulk of new harvests. This reality is in accord with the long-term evolutionary trend: agriculture is basically a set of techniques aimed at producing higher harvests from an ever smaller amount of land with higher inputs of energies (Smil 1994). In this context it is the care the land receives, rather than its absolute area, that determines long-term agricultural prospects.
Higher demands put on land by larger populations have repeatedly led to better and more efficient use. Paradoxically, as Sauvy (1990 [1949]) noted, "it should be possible and even legitimate to take into account land abuse caused by insufficient population size." After scores of generations of supporting some of the world's highest population densities, Dutch or Sichuanese fields are undoubtedly in better shape than are the extensively farmed Kazakh or Saskatchewan lands.40
This content downloaded on Thu, 7 Mar 2013 19:26:32 PMAll use subject to JSTOR Terms and Conditions
276 How MANY PEOPLE CAN THE EARTH FEED?
Modern societies have recognized the very large cost benefits obtain- able from investment in preventive population-wide health and safety mea- sures, and they will have to extend this approach also to the care of land. Fortunately, we already have most of the necessary know-how and can point to some impressive recent advances. In North America conservation tillage practices have moved from being isolated curiosities during the early 1970s to mainstream practices during the 1980s. There has also been a re- surgence of interest in organic recycling. Agronomists have been active in designing and testing new, as well as some old, approaches to more sus- tainable cropping (National Research Council 1989; Edwards et al. 1990; Soule and Piper 1992).
Although most of this work is done in the rich countries, some of the poor world's traditional soil and water conservation practices have consid- erable promise for more sustainable farming (Reij 1991; Van Dijk and Ahmed 1993). Continuing reliance on improved local staples is an important part of this approach, especially in the tropics where traditionally grown roots and tubers have numerous advantages over cereals (FAO 1989; Pearce 1990). They better fit the high-humidity climates, integrate very well with intercropping arrangements, can have very high yields, provide a higher yield stability, and some of them allow for flexible planting and harvesting. A 50 percent increase in the poor world's average root crop yields over the next 60 years would produce the food energy equivalent of 50 Mt of grain even if the planted area were to remain at the 1990 level.
Growing crops and trees together is another effective way to increase productivity. These practices lessen land competition, create desirable mi- croclimates, and provide additional nutrients to plants (above all when plant- ing leguminous tree species shedding nitrogen-rich leaves and enriching soil with rhizobia-fixed N); and, of course, trees and shrubs yield continu- ous or cyclical harvests of food (fruit, nuts), fodder (leaves), fuel, or timber (Nair and Fernandes 1984; Winterbottom and Hazlewood 1987; Arnold 1990). Aquacultural potential has been far from fully exploited (Landau 1992). The possibility of impressive gains has been demonstrated by the recent Chinese advances. In 1979 the country's freshwater fish harvest amounted to about 800,000 tons, or less than one kilogram per capita; by 1990 it was 4.5 million tons, or about 4 kilograms per capita (State Statisti- cal Bureau 1992).
An unexpected source of possible gains is the cultivation of abandoned fertile land. Such abandonment appears to be a worldwide phenomenon: recent village studies have shown numerous instances of low-intensity use of farmland and a surprisingly common existence of idle fertile land through- out China (estimated to be as high as 5 percent of all cultivated area) and in such densely settled regions as parts of West Africa, the Caribbean is- lands, and Southeast Asia. Preston (1989) found this phenomenon even in
This content downloaded on Thu, 7 Mar 2013 19:26:32 PMAll use subject to JSTOR Terms and Conditions
VACLAV SMIL 277
central Java, the world's most densely inhabited rural region. If these oddlands were to add just 3 percent to the 1990 total of arable land, and if the productivity of those lands were no higher than the average 1990 yield, additional harvests from that area would be equivalent to 50-100 Mt of unmilled grain.
Extension of good agronomic practices and the most suitable cultivars to many poor countries offers a far from exhausted opportunity for higher yields. There is no need to postulate any closing of gaps between the poor world's, or the world's mean, and the best national averages of rich coun- tries, or, ultimately, the best recorded yields. Huge differences are revealed by such comparisons at every step,4' but environmental limitations (above all, soil quality and moisture availability) guarantee that most of those gaps cannot be closed. Sizable aggregate gains would come from raising the productivities of many laggard countries to the standard of their region, or bringing Africa's means, the world's lowest, closer to the poor world's av- erages.
For example, Nigeria's corn yield is only two-thirds of the Mexican mean, which, in turn, is only three-quarters of the poor world's average. Similar disparities exist in animal husbandry. Africa's annual milk yield is less than 500 kg/cow, compared to the poor world's mean of over 800 kg, the Latin American average of about 1,600 kg, the global yield of 2100 kg, and the US mean of about 7,000 kg/cow. Indeed, many African countries would be much better off if they could merely match their performance of a generation ago.42 Even relatively slow worldwide advances would have the desired effect. Average cereal yields increased about 2.5 times between 1950 and 1990 (from 1.1 to 2.8 t/ha), and by 55 percent in the 20 years between 1970 and 1990. If global intensification (new cultivars, multicropping, and higher fertilizing) were to raise the mean yield just by one-third by the year 2050, the global harvest would increase by an equiva- lent of at least 600 Mt of unmilled grain.
Agriculture's water needs will pose a greater supply challenge than land availability. Evapotranspiration is an inherently water-intensive pro- cess, and water withdrawals for irrigation average almost 90 percent of to- tal water use in Asia and Africa, 60 percent in South America, and 50 per- cent in North and Central America (World Resources Institute 1992). We have no practical means of augmenting the natural cycle (desalination is too expensive), and will have to rely on tapping new supplies and on going beyond the relatively easy efficiency gains in managing the existing flows.
The first option is either limited or precluded in a growing number of arid countries, except for using saline waters. This option will not be a ma- jor source of new water supplies, but three leading grain crops-barley, sorghum, and wheat-are relatively salt-tolerant, and properly managed use of saline waters in growing them is a practical proposition (Rhoades et
This content downloaded on Thu, 7 Mar 2013 19:26:32 PMAll use subject to JSTOR Terms and Conditions
278 How MANY PEOPLE CAN THE EARTH FEED?
al. 1992). Fortunately, the second option can go much beyond the average 30 percent gain assumed in a conservative calculation of the existing slack.
More radical improvements of traditional irrigation efficiencies will be more capital intensive: they will need gradual introduction of pressur- ized systems, including a variety of portable sprinklers, center pivots, mov- ing lines, and drip systems. Delivery by center pivot irrigation and lateral move systems can be programmed for optimum amounts of water and sched- uled during night hours. All agricultural chemicals can be accurately dis- tributed in the spray, and water use efficiencies average about 80 percent. Further, laser-guided leveling of fields and runoff recovery systems may raise the efficiencies of gravity irrigation systems close to those of pressur- ized techniques with a fraction of initial capital cost. As a result, irrigation efficiencies in the world's most arid regions where water is currently underpriced and wasted through improper application could be doubled in comparison with traditional practices.
Notable contributions could come from the closest possible matching of crops with precipitation: inappropriate cultivation is now widespread, ranging from California corn and Florida sugarcane (draining the Everglades) to steady extension of Chinese rice cultivation into the arid North and to the Saudi extravagance of wheat self-sufficiency. Considerable water could also be saved by restricting beef production to natural grasslands: feedlot beef is by far the most water-intensive foodstuff.43 If capital-intensive tech- niques were to raise irrigation efficiency in the world's poor arid countries another 30 percent above the level achieved by less expensive measures (that is from 45-50 to 60-65 percent), the total gain by the year 2050 would be equivalent to about 150 km3 of water, enough to grow 50-100 Mt of grain.
New food crops cannot make a notable global difference in less than one generation, but they can make a substantial local contribution in areas of pioneering introduction and improvement. The commercial potential of new tropical crops appears especially promising (Plotkin 1986). The most likely candidates for diffusion and breeding include amaranths (grain of Andean origin with high protein content), fruit of pupunha and buriti palms for eating, and those of pataua and babassu palms for edible oils. Naturally, such introductions, as well as the continuing improvement of leading crops and maintenance of viable agroecosystems, will require the maintenance of sufficient biodiversity-but this need is by far the most difficult produc- tion factor to evaluate.
We do not have satisfactory answers to any of the four key questions: how diverse were individual crops originally? how much of this diversity has been irretrievably lost? what is the minimum diversity necessary to sustain effective breeding programs? and how much ecosystem diversity can we lose without undermining the biophysical foundations of our soci-
This content downloaded on Thu, 7 Mar 2013 19:26:32 PMAll use subject to JSTOR Terms and Conditions
VACLAV SMIL 279
eties and economies? Recent opinions have ranged from predictions of un- precedented spells of megaextinction (with millions of species destroyed in less than a single generation) imperiling human survival (Ehrlich and Wil- son 1991) to less acute concerns (Mann 1991).
Three important considerations must be kept in mind before succumb- ing to extinction panic. First, extensive collection efforts begun during the 1960s have amassed an impressive wealth of germ plasm for both wild pre- decessors and cultivars of all major crops (Plucknett et al. 1987).44 Second, there appears to be a generally negative relation between plant diversity and potential agricultural productivity (Huston 1993). This link, valid on both local and global levels, means that much of the remaining plant biodiversity can be protected with a relatively small impact on food pro- duction. Third, advances in genetic engineering can be expected to have a major impact during the next three generations.
The practical gains from genetic engineering may not have kept pace with some exaggerated expectations, but the realistically assessed progress has been quite impressive: inserting genes into plants is already almost rou- tine. Efforts to identify, isolate, and clone desirable genes will intensify. This long-term quest is exemplified by China's commitment to map the rice genome over the 15-year period starting in 1993. Consequently, it would be very surprising if the cumulative impact of bioengineering were not at least as important by the year 2050 as traditional crop breeding has been during the past 60 years, when it has been credited with at least one-third and as much as four-fifths of average productivity increases for major grain crops (Russell 1991).
Notable long-range possibilities that would have a far greater produc- tive impact include enhancing and extending microbial nitrogen fixation and mycorrhizal-root interactions, moderating the rates of nitrification and denitrification (nitrification inhibitors have been available since the 1960s, but their field use is still limited), increasing plant resistance to environ- mental stresses, and using plant growth regulators.
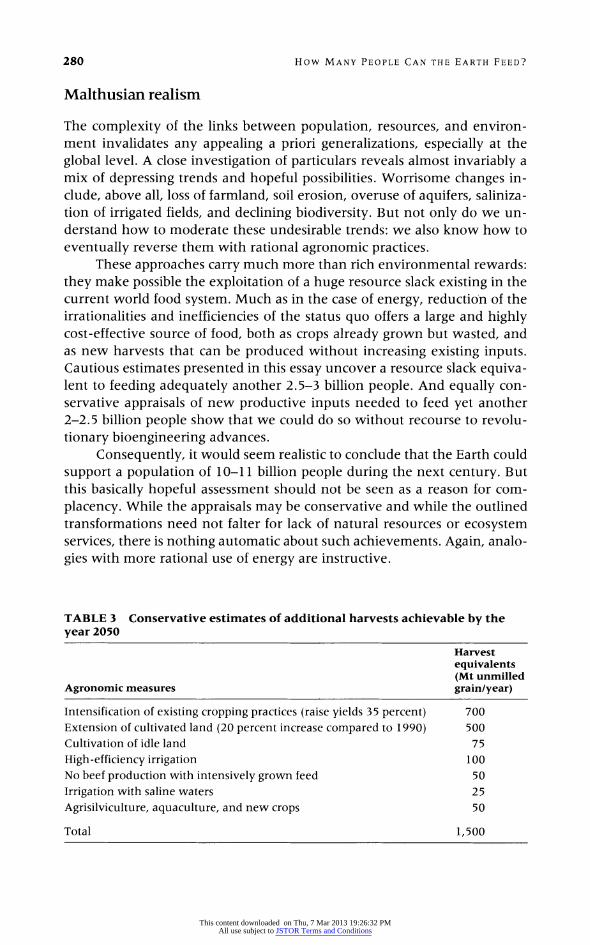
But there is no need to call for such bioengineering breakthroughs in order to demonstrate that enough additional food could be produced on top of increased harvests derived from more rational use of existing agri- cultural inputs. A relatively small extension of cultivated land, gradual (and very slow in a long-term perspective) intensification of cropping, cultiva- tion of idle lands, high-efficiency irrigation in the driest regions, and some smaller, but locally critical contributions (reduced beef production, agrisilviculture, aquaculture, new crops, saline irrigation) could combine to produce an additional food equivalent of about 1,500 (1,400-1,600) Mt of unmilled grain (Table 3). This would be more than enough to feed an additional 2-2.5 billion people even with rather high postharvest losses and with fairly inefficient animal feeding.
This content downloaded on Thu, 7 Mar 2013 19:26:32 PMAll use subject to JSTOR Terms and Conditions
280 How MANY PEOPLE CAN THE EARTH FEED?
Maithusian realism
The complexity of the links between population, resources, and environ- ment invalidates any appealing a priori generalizations, especially at the global level. A close investigation of particulars reveals almost invariably a mix of depressing trends and hopeful possibilities. Worrisome changes in- clude, above all, loss of farmland, soil erosion, overuse of aquifers, saliniza- tion of irrigated fields, and declining biodiversity. But not only do we un- derstand how to moderate these undesirable trends: we also know how to eventually reverse them with rational agronomic practices.
These approaches carry much more than rich environmental rewards: they make possible the exploitation of a huge resource slack existing in the current world food system. Much as in the case of energy, reduction of the irrationalities and inefficiencies of the status quo offers a large and highly cost-effective source of food, both as crops already grown but wasted, and as new harvests that can be produced without increasing existing inputs. Cautious estimates presented in this essay uncover a resource slack equiva- lent to feeding adequately another 2.5-3 billion people. And equally con- servative appraisals of new productive inputs needed to feed yet another 2-2.5 billion people show that we could do so without recourse to revolu- tionary bioengineering advances.
Consequently, it would seem realistic to conclude that the Earth could support a population of 10-11 billion people during the next century. But this basically hopeful assessment should not be seen as a reason for com- placency. While the appraisals may be conservative and while the outlined transformations need not falter for lack of natural resources or ecosystem services, there is nothing automatic about such achievements. Again, analo- gies with more rational use of energy are instructive.
TABLE 3 Conservative estimates of additional harvests achievable by the year 2050
Harvest equivalents (Mt unmilled
Agronomic measures grain/year)
Intensification of existing cropping practices (raise yields 35 percent) 700 Extension of cultivated land (20 percent increase compared to 1990) 500 Cultivation of idle land 75 High-efficiency irrigation 100 No beef production with intensively grown feed 50 Irrigation with saline waters 25 Agrisilviculture, aquaculture, and new crops 50
Total 1,500
This content downloaded on Thu, 7 Mar 2013 19:26:32 PMAll use subject to JSTOR Terms and Conditions
VACLAV SMIL 281
In both cases there is clearly enough know-how and capital to create the necessary change, but the scope and the pace of these transformations are obviously critical. In energy's case a broad consensus holds that the rich countries, containing one-fifth of the world's population but consum- ing about two-thirds of all fossil fuels, must stabilize their energy use dur- ing the coming generation (mainly through further substantial efficiency gains) in order to enable relatively rapid and affordable consumption gains in poor countries (World Energy Council 1993). Failure to do so would greatly increase the existing economic gap between the two worlds-with all attendant political, social, and military implications-and, even more fundamentally, it could lead to unmanageable environmental consequences.
Assurance of a globally adequate food supply will obviously call for different modes of action, but it, too, will have to contain a strong compo- nent of what I would label the rich world's self-serving altruism. Except in direst emergencies this should not include any massive food aid, but it will require greatly expanded transfers of efficient farming techniques abroad, as well as the modification of unsustainable diets at home. Together with a changed energy equation, these steps should go far toward narrowing the "affluence gap," and hence also the fertility divide, between the two worlds.
Inevitably, such changes would involve major social and economic dislocations and adaptations, and the most important future concerns may not be those that come immediately to mind. The effects of higher food prices (conducive to higher food-chain efficiencies) or the challenges of un- precedented international cooperation may become secondary to worries about rural labor shortages resulting from seemingly unstoppable global urbanization. As the post-1979 Chinese example shows, some sensible de- velopmental policies can rapidly generate the purchasing power to buy more food and to increase agricultural production even in a demographically and environmentally disadvantaged society. At the same time, such a process may be accompanied by deepening regional disparities, which even richer countries have found difficult to eliminate.
Admittedly, both the pace and the extent of particular changes will vary widely, but there is little doubt about the need for a fundamental, long-term transformation of prevailing ways. In that sense the stabilized, and eventually reduced, rates of energy use and modified food consump- tion are only two, albeit critical, ingredients of a long-overdue Western tran- sition from mindless consumerism and a borrowing economy toward a more sustainable pattern of living. Most of the poor world's countries will have to contribute to this global transformation by profoundly reforming their developmental policies.
That such changes are, and will be, opposed as intrusions upon sover- eign policymaking is no compelling reason for not pushing ahead. Effective globalism will face enormous economic, cultural, and political resistance, but it is hard to imagine viable planetary futures without moving in that
This content downloaded on Thu, 7 Mar 2013 19:26:32 PMAll use subject to JSTOR Terms and Conditions
282 How MANY PEOPLE CAN THE EARTH FEED?
direction. Even satisfactory global advances will hide serious regional and national failures whose frequency may not be less common and whose im- pacts may not be less devastating than in the recent past.
Naturally, this global appraisal cannot reveal anything about such par- ticulars. Nor does it imply any judgment about the desirability of a global population twice the current size and its broader social and environmental impacts. And, perhaps most fundamentally, it is only of limited help in de- termining whether such a level of production would be supportable for cen- turies, and even less so in judging whether it would be sustainable on a civilizational time scale. This we simply do not know: attempts akin to Han scholars' forecasts of the late twentieth-century civilization are clearly futile.
The appraisal presented here is merely a reflection of realistic possi- bilities consistent with both the biospheric realities and with the human capabilities required to produce food for some 10 billion people, not a de- scription of general and inexorable advances. The quest for higher efficiency has become an essential ingredient of virtually all long-term national en- ergy strategies, but an analogous transformation in farming has barely be- gun. Successful diffusion of these efficiency gains will require strong and sustained national and international commitment, and its progress will un- doubtedly be weakened by continuation of many agronomic and environ- mental malpractices that have reduced global feeding capacity during this century.
I would hope that once the benefits of this approach-economic, en- vironmental, and nutritional-become widely appreciated, the quest for ef- ficiency will achieve results much better than the conservative expecta- tions offered in this essay. Again, analogy with the experience of two decades of rational use of energy is encouraging, not only because of the magni- tude of past gains but mainly because of the remaining huge potential.45
This analogy should hold even if the potentially most sweeping envi- ronmental change-relatively rapid global warming bringing substantial (1-30C per century) tropospheric temperature increases-were to compli- cate the process. Such temperature increases are rapid in evolutionary terms but small in relation to the duration of even conventional breeding pro- grams, and hence there should be no insuperable problems adjusting pro- ductivity to such a change (Ellis et al. 1990).
As Bennett (1949: 26) noted, "Pessimism about maintenance or im- provement of per capita food supply . .. is not intellectually necessary, not compelled on the basis of historical fact or logic." Catastrophists might be surprised to learn that this was also the parting credo of the man who is still generally seen as the great patron of their cause.
Thomas Robert Malthus-so well known for his observations that "the power of population is indefinitely greater than the power in the earth to produce subsistence for man" and that "this natural inequality . .. appears
This content downloaded on Thu, 7 Mar 2013 19:26:32 PMAll use subject to JSTOR Terms and Conditions
VACLAV SMIL 283
insurmountable in the way to the perfectability of society" -closed the sec- ond, and so curiously rarely read, 1803 edition of his great essay with an appraisal whose eminent sensibility makes it truly timeless:
On the whole, therefore, though our future prospects respecting the mitiga- tion of the evils arising from the principle of population may not be so bright as we could wish, yet they are far from being entirely disheartening, and by no means preclude that gradual and progressive improvement in human so- ciety.... And although we cannot expect that the virtue and happiness of mankind will keep pace with the brilliant career of physical discovery; yet, if we are not wanting to ourselves, we may confidently indulge the hope that, to no unimportant extent, they will be influenced by its progress and will partake in its success.
Notes
1 There is no compelling reason to be- lieve that the three generations between 1990 and 2050 will see fewer practical advances in food production than were experienced in the 60 years before 1990. In 1930 synthetic am- monia was still a rare and expensive com- modity, tractors did not even have low-pres- sure rubber tires, there was neither hybrid corn nor short-stalked, high-yielding wheat and rice varieties, soybeans were an insignifi- cant crop outside China, and there were no synthetic herbicides or effective insecticides and fungicides.
Even if a brilliant forecaster had identi- fied both the existence and the extent of these inputs and commodities by 1990, would he have situated these advances amid 5.3 billion people, GATT negotiations, collapsing Com- munism, and microcomputers? And yet in combination these realities shape the current performance of global farming no less deci- sively than new agronomic techniques.
2 Not content with a prediction of hun- dreds of millions of famine deaths, Ehrlich (1969) also forecast the end of all important animal life in the oceans by the summer of 1979, an event bringing "almost instanta- neous starvation in Japan and China" and causing Chinese armies to attack Russia "on a broad front on 13 October," and concluded that "most of the people who are going to die
in the greatest cataclysm in the history of man have already been born."
3 Global grain output was nearly 2 bil- lion tons in 1990. If this total were to grow annually by almost 2 percent (the mean rate during the past decade) the yearly harvest of cereals would surpass the Earth's mass in less than 1,500 years, roughly an equivalent of the time elapsed since the dissolution of the Western Roman Empire.
4 M. K. Bennett (1992 [1949]: 356) summed up this dilemma succinctly two gen- erations ago: "Certainly it seems futile to en- gage in unqualified prediction in so inexact a field of inquiry, and it would be tiresome to state all the qualifications necessary in pre- diction."
5 Results of annual food balances, sum- marized in FAO's Production Yearbook by coun- try, as well as by continents and economic categories, are expressed as average daily per capita supplies of food energy, carbohydrates, proteins, fats, and principal vitamins and min- erals, with all nutrients also classed accord- ing to plant or animal origins.
6 Each June the US Department of Agri- culture surveys areas planted to crops by us- ing more than 1,000 enumerators to gather direct data from nearly 17,000 sampling units encompassing about 0.6 percent of the total
This content downloaded on Thu, 7 Mar 2013 19:26:32 PMAll use subject to JSTOR Terms and Conditions
284 How MANY PEOPLE CAN THE EARTH FEED?
US land area. In France crop yields since 1956 have been determined by using aerial photo- graphs to select an equal-probability sample of 7,200 points per departement for direct field survey. Out of some 300 sets of agricultural data gathered in European countries, less than 10 percent are based on direct physical mea- surements, 20 percent rely on interviews and mail surveys, and 50 percent are derived in the statistical offices from secondary sources. See also FAO (1982).
7 For example, Piazza (1986) constructed all of his food balance sheets for China with a rice extraction coefficient of 0.67, while FAO has been using a more common assump- tion of 72 percent. But during the late 1980s I found that typical milling rates in some of the most populous provinces were not lower than 75 percent. The difference between us- ing a nationwide average milling rate of 75 and one of 67 percent translates into over 15 million tons of additional food for China's 1990 rice harvest, more than Japan's annual rice production.
No less important are the qualitative dif- ferences: the brown and the highly milled, polished rice do not differ much in their total energy content, but the latter foodstuff may have only one-third of the former's niacin content. Similarly, energy equivalents of vari- ous wheat flours differ from one another by less than 10 percent but their thiamine con- tents may differ more than 15-fold.
8 Depending on the cultivars and agro- nomic practices, seed requirements may range from 2 to 7 percent of total output for rice, 6 to 12 percent for wheat, and 8 to 20 percent for peanuts.
9 Wheat's protein content may be any- where between 9 and 15 percent, and apples may have as little as 3 and as much as 10 mg of ascorbic acid per 100 g. I have already men- tioned the more than one-order-of-magni- tude differences in thiamine content of vari- ous flours.
10 These lists can start with ants, mag- gots, and snails and proceed with lizards, small birds, and different species of rats to hedgehogs, pythons, and fruit bats. The larg- est part of these wild animal foods is secured by opportunistic collecting and hunting (with even small children as frequent participants) and so it remains beyond any possibility of
reliable quantification on a regional or na- tional scale. In parts of Africa and Latin America wild meat can provide at least 20 percent of all animal protein (de Vos 1977). Studies of wild meat offered for sale in town and city markets have been too site-specific and incomplete to be used as bases for gen- eralizations (Assibey 1974; Martin 1983).
11 A high-protein concentrate from the beans of Parkia biglobosa, a leguminous tree common in Western Africa, has a content of about 20-50 percent protein, 30-40 percent lipids (three-fifths as unsaturated fatty acids), and plenty of iron and calcium (Campbell- Platt 1980). Unripe pods of jant (Prosopis cin- eraria) are used in a similar way in semi-desert areas of western India (Gupta, Gandhi, and Tan 1974).
Various African populations also use pow- dered leaves of baobab (Adansonia digitata) and Vigna unguiculata in their stews, extract 'butter" from shea nuts (Butyrospermum parkii), and ferment Sclerocarya birrea fruits to prepare a beer. In Tanzania four-fifths of all leafy green vegetables (excellent sources of vitamins and minerals) eaten in rural areas are collected wild plants, which accompany almost half of all meals.
12 Yet too often this obvious distinction is unappreciated or ignored, and food supply means from FAO's printouts or from national accounts are routinely presented as actual consumption figures. Be it the French Annuaire Statistique, which carries a food sup- ply table under the title "Principales con- sommations des manges," or China's Statisti- cal Yearbook, which lists average food supply under "Per capita consumption of major con- sumer goods," statistical sources mislead the uninitiated user who takes their categories at face value.
FAO does not call the figures in its Pro- duction Yearbook "consumption" but, appro- priately,. "supply"-yet the wrong impression is left anyway. The Economist (13 July 1991, p. 107), citing those figures, stated that "the Irish munched the most ... with 3,700 calo- ries a day, just ahead of America's 3,670." Of course, both values are food balance sheet- derived supplies (and the units should be kcal, not cal).
13 Problems may arise due to normal daily variations of intakes, disruption of usual
This content downloaded on Thu, 7 Mar 2013 19:26:32 PMAll use subject to JSTOR Terms and Conditions
VACLAV SMIL 285
eating habits, difficulties in measuring por- tions taken directly from a single pot, omis- sions of seasonal variations, food eaten away from home (now a major share of total con- sumption in all affluent countries), and sub- stantial intrafamily differences. For example, van Steenbergen et al. (1984) found that in Kenyan households relying on ugali (corn paste), children had great difficulty eating large volumes of the staple; toddlers often missed the evening meal completely because it was served when they were already asleep. In most poor countries children, and often also women, subsist mainly on staples; meat, fish, vegetables, and fruit go preferentially to men.
14 Shortcomings of dietary recall studies are well illustrated by comparing two surveys that provided the best information about the average food consumption in the United States: the Department of Agriculture's Na- tionwide Food Consumption Survey (NFCS) and the Second National Health and Nutri- tion Examination Survey (NHANES II). For example, for males between 25 and 34 years of age, NFCS showed total energy intake of 2,449 kcal, NHANES II 2,734 kcal, a gap of 285 kcal or nearly 12 percent. For compari- son of the two studies see Swan (1983).
15 Japan's National Nutrition Survey is perhaps the best exercise of its kind, sampling about 15,000 households nationwide every year since 1969. All food consumed by all household members is weighed and recorded by a member of each household during a five- day period and the records are checked ev- ery day by a dietician (Statistics Bureau 1992). In contrast, Indian data come from a general income and expenditure survey, which al- most certainly undersampled the poorest part of the population (National Sample Survey Organization 1978).
16 Current American household waste is only 10-15 percent of all purchased solid food. However, there is little doubt that the standard values of energy and fat content of red meat used in food balance sheets overes- timate actual consumption of animal fats: gar- bage studies document extensive trimming of fatty cuts. Similarly, French studies show that about 10 percent of all fat actually served on the plate is discarded (Dupin, Hercberg, and Lagrange 1984).
17 Daily basal metabolic rates of two out- wardly identical individuals commonly differ by 15-25 percent, and gaps of 40 percent are not uncommon.
18 The study covered about 92 percent of the global population, with basic popula- tion data for 1985; it used single-year age groups from birth to 17 years of age, and then aggregates of ages 18-29, 30-59, and 60 and over. As neither age-sex structures nor body weights and activity levels can change nota- bly in a few years, the study's national means and global average are readily applicable to the 1990 benchmark used in this essay.
19 Total per capita protein supply would be about 70 g/day (25 g/day from animal foods), a more than adequate rate compared to the desirable age- and sex-weighted glo- bal mean intake of 50 g/day.
20 Standard recommendations for 25- year-old adults would be about 2,000 kcal for housewives and 2,500 kcal for male office workers.
21 Prentice (1984) found that, compared to standard metabolic expectations, pregnant rural Gambian women appeared to have en- ergy shortfalls of as much as 500 kcal/day even if they were to just sleep and rest, and up to 1,000 kcal considering their heavy work duties. Adair and Pollitt (1982) found a simi- lar situation among Taiwanese mothers bear- ing healthy children.
22 "The statement that many people in the Third World are underfed and therefore physically underactive has no more signifi- cance than its illogical corollary that many Westerners are overfed and therefore hyper- active" (Edmundson and Sukhatme 1989: 276).
23 Hunger-defined as a chronic short- age of nutrients needed for growth and good health-affected about 12 million children and 8 million adults in the United States in the late 1980s (Brown 1987).
24 The Chinese are the extreme example: they consumed daily less than 15 grams of animal protein per capita during the early 1990s, but the average life expectancy was just above 70 years. Comparable US figures were 70 grams and 76 years. The remaining difference in life expectancy is definitely not due to China's low animal protein intake.
This content downloaded on Thu, 7 Mar 2013 19:26:32 PMAll use subject to JSTOR Terms and Conditions
286 How MANY PEOPLE CAN THE EARTH FEED?
Other countries with low meat intakes (less than 30 grams of animal protein/day) and life expectancies over 70 years include Chile, Jamaica, South Korea, and Venezuela (FAO 1993; UNDP 1993). The poor world's mean in 1990 was about 15 grams, the rich world's average was about 60.
25 An average person on this planet weighs about 50 kg. A person who eats ev- ery year twice her or his body weight in meat (still below the US retail average of 120 kg in 1990) would have required the feeding of all of the world's 1990 grain harvest to domes- tic animals, obviously an impossible option.
In 1990 the United States had about 190 million motor vehicles, which consumed an equivalent of some 420 million tons of crude oil (Motor Vehicle Manufacturers Association 1992). If this rate of ownership (1.3 people/ vehicle) and fuel consumption were a global norm, the world in 1990 would have had more vehicles (about 4.1 billion) than adults and they would have consumed about 15 bil- lion tons of crude oil, or almost exactly twice the world's total use of all fossil fuels and pri- mary electricity. Clearly, a worldwide exten- sion of Western indulgence in general, and American overconsumption in particular, is as impractical for car ownership as for meat eating.
26 Feeding requirements (kg of concen- trate feed/kg of liveweight) range from 2.5-3 for chicken and fish polycultures, and are around 5 for pigs; the ratios are just 1 for milk and 2.5 for eggs (Smil 199 lb). In order to ob- tain dressed weights the rate for pigs should be increased by about 30 percent, for chicken by at least 15 percent. Clearly, there is no need to produce at least 9,000 kcal of plant energy per day per capita-the average as- sumed by Gilland (1983) in his evaluation of global food supply-in order to provide enough feed for a sensibly meaty diet.
27 This decline, documented by the World Energy Council (1993), is impressive not only in aggregate terms (where it could be explained by higher shares of services op- erating with relatively low energy intensities), but also in the case of manufacturing. For ex- ample, between 1973 and 1988 eight lead- ing OECD countries lowered the sector's en- ergy intensity by 40 percent, and only
one-quarter of this drop can be explained by structural shifts; the rest came from doing more with less (Schipper and Meyers 1992).
28 Indeed, a further increase in the effi- ciency of energy use was perhaps the most widely supported goal among the critical long-term measures recommended by the World Energy Council's Commission in 1993, which forecast lower energy intensities for every economic region. The potential for ma- jor efficiency gains in poor countries is best illustrated by the Chinese example. By 1990 the energy intensity of China's economy was less than 60 percent of the value at the be- ginning of Deng's reforms (Smil 1993), and WEC anticipates that the 1990 rate will be about halved by the year 2020.
Of course, most industrializing countries will see absolute increases in their energy use-but they will produce larger amounts of goods and services with every unit of energy than today's rich countries did at a compa- rable stage of development. Technical leap- frogging, illustrated by a relevant food-related example, is perhaps the single most important explanation of this fact. When the Western European countries started to commercialize the Haber-Bosch synthesis during the 1 920s, they needed more than four tons of coal to produce a ton of ammonia; today's Egyptian or South Korean plants imported from the United States or the Netherlands need less than a ton of oil for a ton of ammonia.
29 Hydrolysis of urea produces ammo- nium carbonate, which raises alkalinity and promotes volatilization losses; but this process is vastly enhanced between 10 AM and 2 PM
when the peak photosynthesis in the water column depletes CO2. raising water's pH to over 9 and resulting in very high volatiliza- tion losses (Ross 1989). Obviously, urea broadcast during that time, and especially on hot and windy days, may be largely lost; but preplanting or pretransplanting applications or spreading of smaller amounts during early morning hours can reduce such losses.
30 In 1990 the world's arable land re- ceived about 175 Mt N, about 80 Mt as syn- thetic fertilizer, the rest from natural sources and organic recycling. With fertilizer nitrogen uptake between 38 and 48 percent, 30-38 Mt N were transferred into crops. Increasing the
This content downloaded on Thu, 7 Mar 2013 19:26:32 PMAll use subject to JSTOR Terms and Conditions
VACLAV SMIL 287
uptake efficiency by 30 percent (to 50-62 per- cent) would raise the transferred total to 40-50 Mt N, a gain of 10-12 Mt N.
31 Erosion removes 40-50 Mt N a year from farmland; reducing this loss by just 10 percent with better agronomic practices would add 5 Mt N/year. Biofixation and or- ganic recycling contribute annually at least 50 Mt N; a mere 10 percent expansion of this total would add another 5 Mt N/year.
32 Harvests of 500 Mt of crops would claim about 13 Mt of additional nitrogen, while crops grown with about 150 km3 of saved irrigation water would need about 3 Mt N, leaving a net gain of 4-6 Mt N, enough to produce, even with lowered yield response, harvests equivalent to about. 1 50 Mt of grain.
33 Gypsum blocks containing two elec- trodes are buried at a few places in the root zone. As the blocks absorb and lose moisture at a rate very similar to that of the surround- ing soil, regular measurements of changing current flow give reliable indications of the soil's moisture. Benefits include not only con- siderable water savings but also higher crop yields as plants avoid being stressed by either too much or too little moisture (Richardson et al. 1989).
34 A 30 percent gain in irrigation effi- ciency would provide 260-330 km3 of addi- tional water, but about 150 km3 would be taken up by higher crop harvests achieved by better agronomic practices on irrigated land. Consequently, the net gain would be 110-180 km3; this water could be used to irrigate new land and produce additional harvests equiva- lent to 100-150 Mt of grain.
35 For example, even in the Netherlands total annual per capita cheese, meat, and egg consumption was only about 100 kg in the mid-1930s, but by the mid-1970s it had nearly tripled (den Hartog 1992).
36 Recent shifts from high-fat to low-fat diets have been most notable in Norway, Fin- land, and the Netherlands (Popkin 1993), while the consumption of red meat has shown significant declines in both the United States and Canada.
37 There is no doubt that crops would benefit from higher CO2 levels, especially as this rise would also improve typical water use
efficiencies (Kimball 1983). However, these benefits might be reduced for some species by higher temperatures during the growing season (Ellis et al. 1990).
38 Limits of organic agriculture relying for nitrogen solely on planting leguminous species and recycling crop residues and hu- man and animal wastes are, depending on the climate and degree of multicropping, between 7 and 13 people/ha (Smil 1994).
39 In rich countries energy in food pro- cessing, distribution, and cooking commonly adds up to four or five times as much as all energies used in field farming; in poor coun- tries this difference is at least twofold.
40 Many Dutch farms had yields of over 2 t/ha of wheat and 2.5 t/ha of barley as early as 1850, rates higher than the means for the poor world in 1990. Traditional complex ro- tations and intensive organic recycling in Sichuanese fields produced enough food to support more than 10 people/ha of cultivated land.
41 In 1990 the poor world's corn yield averaged 2.4 t/ha, the rich world's mean was 6 t/ha, the best US farmers harvested about 14 t/ha, and the world record stood at over 22 t/ha. Analogous sequences are (all in t/ ha) 2.3, 2.8, 6.7, and 14.5 for wheat; 3.4, 3.9, 8. 0, and 14.4 for rice; and 1.5, 2.2, 3.4, and 5.6 for soybeans (FAO 1993; Fageria 1992). I am citing the highest yields merely to show huge gaps between typical harvests and pho- tosynthetic potential. The only realistic chal- lenge during the coming generations is to nar- row the gap between the rich and poor world's yields.
42 A detailed, properly conceived (using purchasing power parities) international com- parison of agricultural outputs shows that in all but a few African countries every indica- tor for 1990 was considerably lower than in 1970 (Rao 1993). For example, indexes of fi- nal per capita output in 1970 were 95 per- cent of the global mean in Angola, 90 in Sudan, 75 in Nigeria, and 74 in Zimbabwe; 1990 values were, respectively, 31, 55, 49, and 62. Between 1970 and 1990 Nigeria's in- dex of arable land productivity fell from 50 to 44, while China's index rose from 156 to 229.
43 When beef is produced by feeding grain harvested from irrigated cropland, ev-
This content downloaded on Thu, 7 Mar 2013 19:26:32 PMAll use subject to JSTOR Terms and Conditions
288 How MANY PEOPLE CAN THE EARTH FEED?
ery kg of meat may require well over 10,000 kg (10 tons) of water (Lockeretz 1975), a truly astonishing waste of a limited resource. In contrast, even such water-intensive industrial processes as wood pulping or chemical syn- theses require just 50-2 50 kg of water per kg of finished product, and daily residential needs are mostly between 150 and 400 kg per capita (Kammerer 1982).
Raising beef cattle also causes massive long-term water losses because of widespread replacement of Central and South American tropical forests by pastures (Parsons 1988). The potential for water pollution and disposal problems with huge volumes of manure pro- duced in big feedlots poses yet another set of beef-generated environmental problems.
44 More than 2.5 million crop samples (nearly half of them cereals) are stored in various forms around the world, and it is es- timated that for some principal crops (wheat, corn, potatoes) more than 90 percent of the existing germ plasm is already represented in these collections (Plucknett et al. 1987).
45 Perhaps the most impressive example of this potential comes from a National Acad- emy of Sciences study of US responses to pos- sible global warming: it found that it should be possible to cut the emissions of greenhouse gases by up to 40 percent with little or no long-term economic cost-and without any destabilizing drop in the average quality of life (Committee on Science, Engineering, and Public Policy 1991).
References
Adair, L. S. and E. Pollitt. 1982. 'Energy balance during pregnancy and lactation," The Lancet 2: 219.
American Heart Association. 1982. "Rationale of the diet-heart statement of the AHA," Circu- lation 65: 839A-854A.
Arnold, J. E. M. 1990. "Tree components in farming systems," Unasylva 41, no. 106: 35-42. Assibey, E. 0. A. 1974. "Wildlife as a source of protein in Africa south of the Sahara," Biologi-
cal Conservation 6: 32-39. Baade, V. 1962. The Race to the Year 2000. Garden City: Doubleday. Beecher, G. R. and J. T. Vanderslice. 1984. "Determination of nutrients in foods: Factors that
must be considered," in Modern Methods of Food Analysis, ed. K. K. Stewart and J. R. Whitaker. Westport: Avi Publishing, pp. 29-55.
Bender, W. et al. 1993. Project 2050 Food and Agriculture Sector Summary. Providence: World Hunger Program, Brown University.
Benefice, E. et al. 1984. "Nutritional status and seasonal variations for pastoralist populations of the Sahel (Senegalese Ferlo)," Ecology of Food and Nutrition 14: 229-247.
Bennett, M. K. 1992 [1949]. "Population and food supply: The current scare," ScientificMonthly 68, no. 1: 17-26. [Reprinted in Population and Development Review 18: 341-358.]
Bhattacharya, A. K. 1986. "Protein-energy malnutrition (kwashiorkor-marasmus syndrome): Terminology, classification, and evolution," World Review of Nutrition and Dietetics 47: 80-133.
Blaikie, P. and H. Brookfield (eds.). 1987. Land Degradation and Society. London: Methuen. Borrini, G. and S. Margen. 1985. Human Energetics. Ottawa: International Development Re-
search Centre. Brown, H. 1954. The Challenge of Man 's Future. New York: Viking Press. Brown, J. L. 1987. 'Hunger in the U. S.," ScientificAmerican 256, no. 2: 37-41. Buringh, P. 1977. "Food production potential of the world," World Development 5: 477-485. Campbell-Platt, G. 1980. "African locust bean (Parkia species) and its West African fermented
product, dawadawa, " Ecology of Food and Nutrition 9: 123-132. Committee on Science, Engineering, and Public Policy. 1991. Policy Implications of Greenhouse
Warming. Washington, DC: National Academy Press. de Garine, I. and G. A. Harrison (eds.). 1988. Coping with Uncertainty in Food Supply. Oxford:
Clarendon Press.
This content downloaded on Thu, 7 Mar 2013 19:26:32 PMAll use subject to JSTOR Terms and Conditions
VACLAV SMIL 289
de Vos, A. 1977. "Game as food," Unasylva 29, no. 111: 2-12. den Hartog, A. P. 1992. "Dietary change and industrialization: The making of the modern
Dutch diet (1850-1985)," Ecology of Food and Nutrition 27: 307-318. Dudal, R. 1987. "Land resources for plant production," in D. J. McLaren and B. K. Skinner
(eds.), Resources and World Development. Chichester: John Wiley. Dupin, H., S. Hercberg, and V. Lagrange. 1984. "Evolution of the French diet: Nutritional
aspects," World Review of Nutrition and Diet 44: 57-84. Durnin, J. V. G. A. and R. Passmore. 1967. Energy, Work and Leisure. London: Heinemann
Educational Books. Edmundson, W. C. and P. V. Sukhatme. 1989. "Food and work: Poverty and hunger?" Eco-
nomic Development and Cultural Change 38: 263-280. Edwards, C. A. et al. (eds.). 1990. Sustainable Agriculture. Ankeny, Iowa: Soil and Water Con-
servation Society. Ehrlich, P. 1968. The Population Bomb. New York: Ballantine.
1969. "Eco-Catastrophe!" Ramparts 8, no. 3: 24-28. and E. 0. Wilson. 1991. "Biodiversity studies: Science and policy," Science 253: 758-762.
Ellis, R. H. et al. 1990. "Quantitative relations between temperature and crop development and growth," in Climatic Change and Plant Genetic Resources, ed. M. Jackson et al. London: Belhaven Press, pp. 85-115.
Food and Agriculture Organization. 1981. Agriculture: Toward 2000. Rome: FAO. 1982. Estimation of Crop Areas and Yields in Agricultural Statistics. Rome: FAO. 1983. A Comparative Study of Food Consumption Data from Food Balance Sheets and House-
hold Surveys. Rome: FAO. 1986. Review of Food Consumption Surveys- 1985. Rome: FAO. 1988. Review of Food Consumption Surveys- 1988. Rome: FAO. 1989. Roots, Tubers and Plantains in Food Security. Rome: FAO. 1993. Production Yearbook. Rome: FAO.
FAO/WHO/UNU Expert Consultation. 1985. Energy and Protein Requirements. Geneva: World Health Organization.
Fageria, N. K. 1992. Maximizing Crop Productivity. New York: Marcel Dekker. Frederick, K. D. 1988. "Irrigation under stress," Resources (Spring): 1-4. Frissel, M. J. (ed.). 1978. Cycling of Mineral Nutrients in Agricultural Ecosystems. Amsterdam:
Elsevier Scientific Publishing. Garby, L. 1990. "Metabolic adaptation to decrease energy intake due to changes in energy
cost of low energy expenditure regimen," World Review of Nutrition and Dietetics 61: 173-208.
Gill, G. J. 1993. O.K., The Data's Lousy, But It's All We've Got (Being a Critique of Conventional Methods). London: International Institute for Environment and Development.
Gilland, B. 1983. "Considerations on world population and food supply," Population and De- velopment Review 9: 203-211.
Gottlieb, R. 1991. Thirst for Growth. Tucson: University of Arizona Press. Gupta, M. C., B. M. Gandhi, and B. N. Tan. 1974. "An unconventional legume-Prosopis
cineraria," American Journal of Clinical Nutrition 27: 1035-1036. Harris, C. 1991. "Frontrunners of China's agriculture," IDRC Reports (July): 16-17. Hassan, N. and K. Ahmad. 1984. "Studies on food and nutrient intake by rural population of
Bangladesh: Comparison between intakes of 1962-64, 1975-76 and 1981-82," Ecology of Food and Nutrition 15: 143-1 58.
Haugerud, A. and M. P. Collinson. 1991. Plants, Genes and People: Improving the Relevance of Plant Breeding. London: International Institute for Environment and Development.
Higgs, R. L. et al. 1990. "Crop rotations: Sustainable and profitable," Journal of Soil and Water Conservation 45: 68-70.
Huston, M. 1993. "Biological diversity, soils, and economics," Science 262: 1676-1680. James, W. P. T. and E. C. Schofield 1990. Human Energy Requirements. Oxford: Oxford Uni-
versity Press.
This content downloaded on Thu, 7 Mar 2013 19:26:32 PMAll use subject to JSTOR Terms and Conditions
290 How MANY PEOPLE CAN THE EARTH FEED?
Jenkinson, D. S.:and K. A. Smith (eds.). 1989. Nitrogen Efficiency in Agricultural Soils. London: Elsevier Applied Science.
Kammerer, J. C. 1982. "Estimated demand of water for different purposes," in Water for Hu- man Consumption, International Water Resources Association. Dublin: Tycooly Publish- ing, pp. 141-172.
Karlovsky, J. 1981. "Cycling of nutrients and their utilization by plants in agricultural ecosys- tems," Agro-Ecosystems 2: 127-144.
Khasawneh, F. E. et al. (eds.). 1980. The Role of Phosphorus in Agriculture. Madison: American Society of Agronomy.
Kimball, B. A. 1983. "Carbon dioxide and agricultural yield: An assemblage and analysis of 430 prior observations," Agronomy Journal 75: 779-788.
Kushner, R. F. 1993. "Body weight and mortality," Nutrition Reviews 51, no. 5: 127-136. Landau, M. 1992. Introduction to Aquaculture. New York: John Wiley. Lockeretz, W. 1975. "Consumption of agricultural resources in the production of fat cattle
and food grains," Journal of Soil and Water Conservation 30: 268-271. Mann, C. C. 1991. "Extinction: Are ecologists crying wolf?" Science 253: 726-728. Martin, G. H. G. 1983. "Bushmeat in Nigeria as a natural resource with environmental impli-
cations," Environmental Conservation 10: 125-132. Matthews, R. M. 1989. Legumes. New York: Marcel Dekker. Meadows, D. H. et al. 1972. The Limits to Growth. New York: Universe Books. Motor Vehicle Manufacturers Association. 1992. Facts & Figures '92. Detroit: MVMA. Munson, R. D. (ed.). 1985. Potassium in Agriculture. Madison: American Society of Agronomy.
and C. F. Runge. 1990. Improving Fertilizer and Chemical Efficiency Through "High Preci- sion Farming." St. Paul: Center for International Food and Agricultural Policy, Univer- sity of Minnesota.
Nair, P. K. R. and E. Fernandes. 1984. Agroforestry as an Alternative to Shifting Cultivation. Rome: FAO.
National Research Council. 1989. Alternative Agriculture. Washington, DC: National Academy of Sciences Press.
National Sample Survey Organization. 1978. Caloric and Protein Values of Food Items Consumed Per Diem Per Consumer Unit in Urban and Rural Areas. New Delhi: Government of India.
Nova Scotia Heart Health Program. 1993. Report of the Nova Scotia Nutrition Survey. Halifax: Nova Scotia Department of Health.
Parsons, J. J. 1988. "The scourge of cows," Whole Earth Review (Spring): 40-47. Pearce, R. 1990. "Traditional food crops in sub-Saharan Africa," Food Policy 15: 374-382. Pfaundler, L. 1902. "Die Weltwirtschaft im Lichte der Physik," Deutsche Revue 22, no. 2: 29-38,
171-182. Piazza, A. 1986. Food Consumption and Nutritional Status in the PRC. Boulder: Westview Press. Plotkin, M. J. 1986. "The outlook for new agricultural and industrial products from the trop-
ics," in E. 0. Wilson (ed.), Biodiversity. Washington, D.C.: National Academy Press, pp. 106-115.
Plucknett, D. L. et al. 1987. Gene Banks and the World's Food. Princeton: Princeton University Press.
Poleman, T. 1993. "Food values," letter to The Economist, 23 January, p. 8. Pollitt, E. and P. Amante (eds.). 1984. Energy Intake and Activity. New York: Alan R. Liss. Popkin, B. M. 1993. "Nutritional patterns and transitions," Population and Development Review
19: 138-157. Prentice, A. M. 1984. "Adaptations to long-term low energy intake," in Pollitt and Amante,
1984, pp. 3-31. Preston, D. A. 1989. "Too busy to farm: Under-utilisation of farmland in Central Java," The
Journal of Development Studies 26: 43-57. Public Health Service. 1988. The Surgeon General's Report on Nutrition and Health. Washington,
DC: US Government Printing Office.
This content downloaded on Thu, 7 Mar 2013 19:26:32 PMAll use subject to JSTOR Terms and Conditions
VACLAV SMIL 291
Rao, D. S. P. 1993. Intercountry Comparisons of Agricultural Output and Productivity. Rome: FAO. Rathje, W. and C. Murphy. 1992. Rubbish! The Archaeology of Garbage. New York: Harper. Ravenstein, E. G. 1891. "Lands of the globe still available for European settlement," Proceed-
ings of the Royal Geographic Society 13: 27-3 5, 64. Reij, C. 1991. Indigenous Soil and Water Conservation In Africa. London: International Institute
for Environment and Development. Revelle, R. 1976. "The resources available for agriculture," ScientificAmerican 235, no. 3: 164-178. Rhoades, J. D. et al. 1992. The Use of Saline Waters for Crop Production. Rome: FAO. Richards, J. F. 1990. "Land transformation," in B. L. Turner et al. (eds.), The Earth as Trans-
formed by Human Action. New York: Cambridge University Press, pp. 163-178. Richardson, G. et al. 1989. "Gypsum blocks 'tell a water tale,"' Journal of Soil and Water Con-
servation 44: 192-195. Ross, S. 1989. Soil Processes: A Systematic Approach. London: Routledge. Runge, C. F. et al. 1990. Agricultural Competitiveness, Farm Fertilizer and Chemical Use, and Envi-
ronmental Quality: A Descriptive Analysis. St. Paul: Center for International Food and Agri- cultural Policy, University of Minnesota.
Russell, W. A. 1991. "Genetic improvement of maize yields," Advances in Agronomy 46: 245-298. Sauvy, A. 1990 [1949]. "Le 'faux probleme' de la population mondiale," Population 4, no. 3.
[For the English translation see Population and Development Review 16: 7 59-774.] Schipper, L. and S. Meyers. 1992. Energy Efficiency and Human Activity. Cambridge: Cambridge
University Press. Sen, A. 1993. "The economics of life and death," ScientificAmerican 268, no. 5: 40-47. Sheldon, R. P. 1987. "Industrial materials-with emphasis on phosphate rock," in D. J. McLaren
and B. K. Skinner (eds.), Resources and World Development. Chichester: John Wiley. Simon, J. L. 1981. The Ultimate Resource. Princeton: Princeton University Press. Smil, V. 1989. "Coronary heart disease, diet, and Western mortality," Population and Develop-
ment Review 15: 399-424. . 1990. "Nitrogen and phosphorus," in B. L. Turner et al. (eds.), The Earth as Trans-
formed by Human Action. New York: Cambridge University Press, pp. 423-436. . 1991 a. "Population growth and nitrogen: An exploration of a critical existential link,"
Population and Development Review 17: 569-601. 199 lb. General Energetics. New York: John Wiley. 1993. China's Environmental Crisis. Armonk: M. E Sharpe. 1994. Energy in World History. Boulder: Westview Press.
Soule, J. D. and J. K. Piper. 1992. Farming in Nature's Image. Washington, DC: Island Press. Stanhill, G. 1985. "The water resource for agriculture," Philosophical Transactions of the Royal
Society B 310: 161-173. . 1986. "Water use efficiency," Advances in Agronomy 39: 53-85.
State Statistical Bureau. 1992. China Statistical Yearbook 1992. Beijing: State Statistical Bureau. Statistics Bureau. 1992. Japan Statistical Yearbook 1992. Tokyo: Statistics Bureau. Stehbens, W. E. 1990. "The controversial role of dietary cholesterol and hypercholesterolemia
in coronary heart disease and atherogenesis," Pathology 21: 213-221. Swan, P. B. 1983. "Food consumption by individuals in the United States: Two major sur-
veys," Annual Review of Nutrition 3: 413-432. United Nations. 1992. Long-Range World Population Projections: Two Centuries of Population Growth
1950-2150. New York: United Nations. United Nations Development Programme. 1993. Human Development Report 1993. New York:
UNDP. Van Dijk, J. A. and M. H. Ahmed. 1993. Opportunities for Expanding Water Harvesting in Sub-
Saharan Africa: The Case of the Teras of Kassala. London: International Institute for Envi- ronment and Development.
van Steenbergen, W. et al. 1984. "Food consumption of different household members in Machakou, Kenya," Ecology of Food and Nutrition 14: 1-19.
This content downloaded on Thu, 7 Mar 2013 19:26:32 PMAll use subject to JSTOR Terms and Conditions
292 How MANY PEOPLE CAN THE EARTH FEED?
Winterbottom, R. and P. T. Hazlewood. 1987. "Agroforestry and sustainable development: Making the connection," Ambio 16: 100-1 10.
World Bank. 1992. World Development Report 1992. New York: Oxford University Press. World Energy Council. 1993. Energy for Tomorrow's World. New York: St. Martin's Press. World Resources Institute. 1992. World Resources 1992-93. New York: Oxford University Press. Zierhoffer, A. 1966. "Luzne uwagi na temat pojemnosci ludnosciowej kuli ziemskiej na
przykladzie Japonii" [Unrestricted thoughts about the global carrying capacity using the example of Japan]," Czasopismo Geograficzne 37: 119-128.
This content downloaded on Thu, 7 Mar 2013 19:26:32 PMAll use subject to JSTOR Terms and Conditions