how employee engagement matters for hospital...
TRANSCRIPT

Healthcare Quarterly Vol.15 No.2 2012 29
AbstractManagers increasingly understand that employee engage-ment is a prerequisite for high performance. This article examines how job, work environment, management and organizational factors influence levels of engagement among healthcare employees. Original data come from the Ontario Hospital Association–NRC Picker Employee Experience Survey, involving over 10,000 employees in 16 Ontario hospi-tals. The article provides a clear definition and measure of engagement relevant to healthcare. In addition to identifying the main drivers of engagement, findings shows that a high level of employee engagement is related to retention, patient-centred care, patient safety culture and employees’ positive assessments of the quality of care or services provided by their team. Implications of these findings for healthcare leaders are briefly considered.
Engaged employees are essential to the success of any organization. Increasingly, healthcare employers are taking steps to strengthen this people-performance link. While many studies have looked at the job satis-
faction of healthcare employees, we know far less about how the broader concept of engagement applies to healthcare settings. Furthermore, a lack of good data on employee engagement in Canadian healthcare organizations has made it difficult to use the concept as a workplace improvement tool, which has been the case in other industries.
This article fills these gaps. Using results from the first wave of the Ontario Hospital Association (OHA)–NRC Picker Employee Experience Survey (EES), involving over 10,000 employees in 16 Ontario hospitals, this article does three things: (1) provides a clear definition and measure of engagement; (2) examines the main work environment drivers of engage-ment; and (3) documents the relationship between levels of employee engagement and critical organizational outcomes.
The Quality Healthcare WorkplaceHigh-performing organizations have healthy and engaged employees. Their work environments are designed to enable the development and utilization of the “people capacity” required for success. Critically important in this regard is a culture that values employees, leadership commitment to the organization’s people-development goals and support systems that enable people to excel in their jobs (Lowe 2010).
These ideas have taken root in healthcare and are evolving. A decade ago, the focus was on creating healthier workplaces. For example, the US Joint Commission on the Accreditation of Healthcare Organizations linked high-quality care and healthy workplaces in this way: “A healthy workplace is one where workers will be able to deliver higher-quality care and one in which worker health and patients’ care quality are mutually supportive. That is, the physical and emotional health of workers fosters quality care, and vice versa, being able to deliver high-quality care fosters worker health” (Eisenberg et
How Employee Engagement Matters for Hospital PerformanceGraham Lowe
HealtH Human ResouRces

30 Healthcare Quarterly Vol.15 No.2 2012
al. 2001: 447). Now, experts and practitioners are calling for a comprehensive, strategically focused approach to measuring and reporting the quality of healthcare work environments. (See Healthcare Papers 10[3], published in 2010; the issue focuses on using common work environment metrics to improve perfor-mance in healthcare organizations.) This is a big step beyond workplace health promotion programs, integrating employee well-being within a comprehensive framework for improving the quality of healthcare.
We also are learning more about the positive relationship between staff satisfaction and patient satisfaction, echoing private sector research showing strong correlations between employee engagement scores and customer experiences (Harmon and Behson 2007; Heskett et al. 2008). Recent studies in health-care indicate that managers can improve patient care experiences by improving employee satisfaction and retention (Collins et al. 2008; Michie and West 2004; Rondeau and Wagar 2006; Sikorska-Simmons 2006). Research conducted in England’s National Health Service documents how hospitals with higher levels of staff engagement provide higher-quality services and
have better financial performance (West et al. 2011). To support this new direction in evidence-based human
resource practices, OHA recently created the Quality Healthcare Workplace Model (Figure 1). The model outlines how health system performance depends on a capable workforce in healthy and productive workplaces. The OHA’s model suggests that the quality of the work environment for staff and physicians is a key determinant of a high-performing healthcare organization. By integrating healthy workplace, human resources, quality and patient safety goals within a performance-focused framework, the model offers a useful guide to research and practice. At the centre of the model is employee engagement.
Study BackgroundThe development of the EES was guided by the model in Figure 1. The 95-item questionnaire assesses the drivers, individual outcomes and organizational outcomes specified in the model. (For further information, see OHA’s OHA-NRC Picker Employee and Physician Experience Surveys Backgrounder.) A companion survey for physicians was also developed but is not our focus
in this article. NRC Picker Canada was a partner in the development of both surveys. Some of the work environment, patient safety and patient care items were adapted from earlier NRC Picker surveys. I acted as the project consultant.
The first wave of OHA members to use the EES did so in late 2010 and early 2011. The total sample analyzed here consists of 10,702 employees from 16 facilities. Table 1 shows that response rates vary across peer groups, ranging between 45 and 60%. The overall sample response rate is 46%, which is acceptable for an employee survey (Baruch and Holtom 2008). (In studies published in peer-reviewed academic journals, the average response rate for employee surveys within organizations is 53%.) The sample composition reflects a concentration of employees in community hospitals (43% of the total sample) and teaching hospi-tals (30% of total). The nine facilities in the two other peer groups account for 27% of all respondents.
Looking briefly at respondents’ charac-teristics, most have been in their current job and with their employer for six years or longer. More than two thirds are full-time employees; the same proportion are union members. A small percentage (6%) is in
FIGURE 1.Ontario Hospital Association Quality Healthcare Workplace Model
Enabling context: strong values - compelling vision - clear mission - committed leadership
DRIVERS INDIVIDUALOUTCOMES
ORGANIZATIONALOUTCOMES
WorkEnvironment
Engaged andcapable employeesand physicians
Quality andpatient safety
JobCharacteristics
Retention,recruitment,and employerreputation
OrganizationalSupports
Employee andphysician health,safety and qualityof work-life
Employeeproductivityand costs
Source: Reproduced with permission from the Ontario Hospital Association.
How Employee Engagement Matters for Hospital Performance Graham Lowe

Healthcare Quarterly Vol.15 No.2 2012 31
Graham Lowe How Employee Engagement Matters for Hospital Performance
temporary, per-diem or standby arrangements. About one in five have management responsibilities. And two thirds have frequent patient contact. Most (86%) respondents are female, and there is a good representation of older and younger employees (9% are under the age of 30 years, 18% are between the ages of 30 and 39, 31% are 40–49, 34% are 50–59 and 8% are 60 years and older).
How Employees Experience Their Work The EES asks employees to assess 36 features of their job, training and development opportunities, their team, their super-visor, senior management and how the organization supports its employees. These factors are on the left side of the OHA model (see Figure 1). Logically, they can be considered upstream influ-ences on – or “drivers” of – employee engagement.
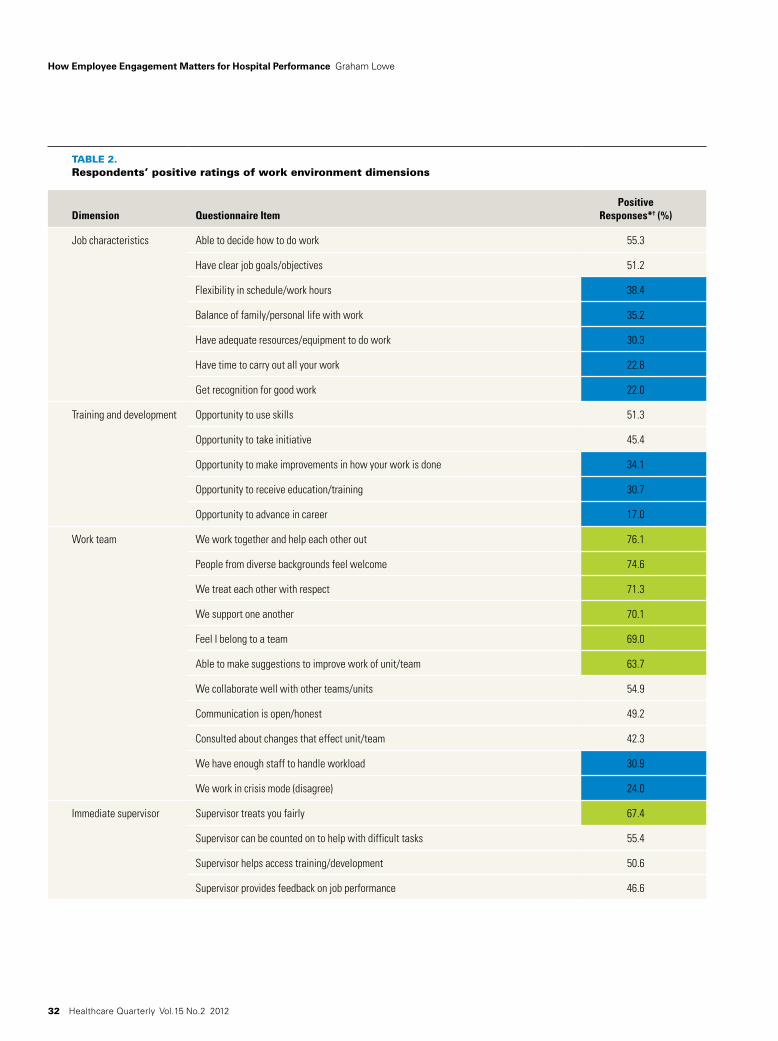
Presented in Table 2 are the percentage of positive answers to each of the evaluative items (combining responses of four and five on five-point response scales). Items receiving positive ratings of 60% or higher are called “strengths,” and items with positive scores of 40% or less are labelled “improvement priori-ties” (each is colour coded in Table 2). These cut points are based on results for the entire sample; individual organizations are encouraged to use this approach to interpret their own employee survey results and plan follow-up actions.
A quick look at Table 2 reveals that the responses are most positive regarding aspects of respondents’ team or work unit. It is notable that 70% or more of respondents positively rate their team as working well together, welcoming people from diverse backgrounds and being respectful and supportive of each other. Supervisors also receive a positive rating for fair treatment of employees. And senior managers are widely seen to be committed to high-quality care and to improving workplace safety.
The items with the lowest positive ratings identify opportuni-ties for improvement. Beginning with teams, this general area of strength received low positive ratings on two measures of workload: the percentage of respondents disagreeing or strongly
disagreeing with the statement, “We work in ‘crisis mode’ trying to do too much, too quickly,” and the percentage agreeing or strongly agreeing with the statement, “We have enough staff to handle the workload.” None of the supervisory ratings fall at or below 40% positive. However, one senior management behaviour – acting on staff feedback – receives only a 31% positive rating.
The lowest ratings are on two dimensions: training and devel-opment, and job characteristics. Career development opportu-nities receives the lowest positive rating (17%) of any of the 36 items being considered here. Furthermore, only one in three respondents positively rate the opportunities they have to make improvements in how their work is done, or to receive education and training. In terms of job characteristics, there is consider-able room for improvement in three areas: recognition, work-life balance and flexibility in hours and schedules. Lack of time and other resources to do one’s work also receive low positive ratings.
Employee EngagementA high level of engagement is a strategic goal for a growing number of organizations in many industries, including health-care. Engaged employees are committed to their employer, satis-fied with their work and willing to give extra effort to achieve the organization’s goals. Evidence suggests that engagement influences other major human resources goals, such as reten-tion, job performance, absenteeism and (indirectly through the employer’s reputation) recruitment (Gibbons and Schutt 2010; Macey and Schneider 2008).
Human resources experts prefer a multi-dimensional approach to measuring engagement. This combines a number of questionnaire items into a scale, yielding a single engagement score. The resulting composite engagement metric can be useful to employers for tracking progress on actions taken to improve employee engagement. Employee engagement scales typically combine job satisfaction, organizational commitment and other performance-related indicators of a motivated employee.
TABLE 1.Sample characteristics by peer group
Peer Group Number of Respondents Response Rate (%)
Percentage of Total Sample
Community hospitals (n = 5) 4,613 45 43
Teaching hospitals (n = 2) 3,260 45 30
Non-acute facilities: complex continuing care, rehabilitation and mental health, community health centres (n = 5)
1,986 49 19
Small hospitals (n = 4) 843 54 8
Total (n = 16) 10,702 46 100
32 Healthcare Quarterly Vol.15 No.2 2012
TABLE 2.Respondents’ positive ratings of work environment dimensions
Dimension Questionnaire ItemPositive
Responses*† (%)
Job characteristics Able to decide how to do work 55.3
Have clear job goals/objectives 51.2
Flexibility in schedule/work hours 38.4
Balance of family/personal life with work 35.2
Have adequate resources/equipment to do work 30.3
Have time to carry out all your work 22.8
Get recognition for good work 22.0
Training and development Opportunity to use skills 51.3
Opportunity to take initiative 45.4
Opportunity to make improvements in how your work is done 34.1
Opportunity to receive education/training 30.7
Opportunity to advance in career 17.0
Work team We work together and help each other out 76.1
People from diverse backgrounds feel welcome 74.6
We treat each other with respect 71.3
We support one another 70.1
Feel I belong to a team 69.0
Able to make suggestions to improve work of unit/team 63.7
We collaborate well with other teams/units 54.9
Communication is open/honest 49.2
Consulted about changes that effect unit/team 42.3
We have enough staff to handle workload 30.9
We work in crisis mode (disagree) 24.0
Immediate supervisor Supervisor treats you fairly 67.4
Supervisor can be counted on to help with difficult tasks 55.4
Supervisor helps access training/development 50.6
Supervisor provides feedback on job performance 46.6
How Employee Engagement Matters for Hospital Performance Graham Lowe

Healthcare Quarterly Vol.15 No.2 2012 33
Measuring EngagementThe use of a multi-item scale score can streamline survey follow-up and support a more detailed statistical analysis of results, especially testing predictive models that show the “net” impact of specific drivers on engagement. Standard social science practices were followed in constructing the EES engagement scale. Scale items were selected based on frequency distribu-tions, correlations, face and construct validity considerations and factor analysis. (Factor loadings for the six items range between .77 and .89 [i.e., these items measure the same under-lying concept – engagement] and Cronbach’s reliability a is .92. The engagement scale has a range of six to 29 [five items are measured on five-point “disagree-agree” scales, and one item is measured using a four-point scale], a mean of 20.4 and a standard deviation of 5.2.) The resulting engagement scale has high internal reliability (tested using Cronbach’s a, a statistic with a range of zero to one, with closer to one being better).
The six items in the engagement scale measure the key dimensions researchers have identified as being central to the concept of employee engagement (Gibbons and Schutt 2010). Specifically, the engagement scale developed for the EES measures three dimensions of engagement:
• Emotional: I am proud to tell others I am part of the organi-zation. I find that my values and the organization’s values are similar.
• Rational: I am satisfied with (my) job overall. Overall rating of the hospital as a place to work (from poor to excellent).
• Behavioural: I look forward to going to work. This organiza-tion really inspires the best in me in the way of job perfor-mance.
This scale provides a robust and comprehensive measure of employee engagement, captured in a single metric.
Identifying High-, Medium- and Low-Engagement GroupsTo simplify further analysis and reporting, engagement scale scores were grouped into low, medium and high categories, based on the distribution of scale scores. The high-engagement group consists of individuals who responded four or five on the five-point items and three or four on the one four-point item (their score was 23 or higher out of 29). The medium-engagement group had scale scores between 19 and 22 (note that the overall scale mean is 20.3 and the median is 21, both falling within this group). The low-engagement group scored 18 or lower.
Consistent with the distribution of engagement scores, which is skewed slightly toward the low end of the scale, 33% (n = 3,323) of all respondents are in the low category, while 39% (n = 3,958) are in the medium- and 29% (n = 2,925) are in the high-engagement categories, respectively.
TABLE 2.Continued
Dimension Questionnaire ItemPositive
Responses*† (%)
Senior management Senior management is committed to high-quality care 62.3
Senior management is committed to improving workplace safety 62.0
Senior management communicates clearly with staff regarding goals 48.9
Senior management acts on staff feedback 30.7
Organization I understand the goals of this organization 67.3
Organization provides a clean work environment 60.4
Organization promotes staff health/wellness 52.3
Organization values my work 46.1
I feel that I can trust this organization 37.3
*Combines responses of 4 and 5 on a 5-point scale, where 1 = strongly disagree, 2 = disagree, 3 = neither agree nor disagree, 4 = agree and 5 = strongly agree. Green shading indicates strengths
(60% positive or more); blue shading indicates improvement priorities (40% positive or less).†Numbers of respondents for items vary between 10,177 and 10,596 due to missing data.
Graham Lowe How Employee Engagement Matters for Hospital Performance

34 Healthcare Quarterly Vol.15 No.2 2012
Basic Variations in Engagement A higher percentage of high-engagement employees work in non-acute facilities (i.e., community health centres, continuing care, rehabilitation and mental health facilities) compared with other peer groups. Furthermore, small hospitals have a slightly higher percentage of fully engaged employees, compared with teaching hospitals and community hospitals. These differences underline the need to develop peer group benchmarks for tracking employee engagement and other key workplace metrics.
Variations in peer group engagement levels may, however, reflect differences in staff composition, the populations being served, organizational contexts or other factors. Thus, it is important to compare the organizations within peer groups to gain a fuller understanding of the range of factors influencing engagement. For example, additional analysis revealed more variation among the five organizations within the community hospital peer group than among the peer groups as a whole. The same is true for the four small hospitals in that peer group.
Furthermore, highly engaged employees are more likely to be found in certain demographic or employee groups. While there are no significant gender differences in engagement levels, there are interesting differences among age groups. Survey respond-ents under age 30 years and those 60 years and older are more likely to be highly engaged than their coworkers between the ages of 30 and 59 years.
There also is a “newness effect,” with new recruits to the organization and continuing employees who recently moved into another position experiencing an initially heightened sense of engagement. However, this newness effect wears off by the five-year mark. The biggest drop in engagement happens between a new hire’s first and second year with the organization, signalling a problem that orientation programs must address. The same is true for ongoing employees settling into a new position. Indeed, 42% of respondents who have been in their job less than one year are in the high-engagement group. This drops to 34% for those who have been in their job one to two years and declines further, to 30%, in years three to five.
Also notable is that engagement levels are slightly higher among part-time employees and those employed other than in full-time positions. Temporary, per-diem and on-call workers also report slightly higher engagement levels. Both these findings raise some interesting questions about the role that employment flexibility and length of work hours may play in engagement.
Finally, survey respondents who are not union members are slightly more engaged than their unionized counterparts. And employees with managerial responsibilities also are somewhat more engaged, compared with non-managerial employees (these are overlapping groups).
We cannot read too much into these findings. After all, we are looking at the relationship between each demographic or employment characteristic and engagement in isolation from
other possible influences. Many factors, particularly the work experiences discussed in the previous section, may also be important. To illustrate, new recruits (who also are likely to be young) may initially receive adequate training and career devel-opment and get regular recognition for their work – three work environment features that generally receive low ratings. So these initial job experiences, not seniority, would explain the higher engagement levels of new recruits. The next section sheds light on the factors that influence engagement.
Drivers of EngagementThe variations in engagement scores just discussed raise further questions about what job, work environment, management and other organizational factors influence engagement. The EES can provide answers.
Top-10 Engagement DriversRegression analysis was used to identify “net impacts” on engagement scale scores. (The multivariate statistical analysis reported in this section uses linear regression models that do not determine “causation” but, rather, can measure how much of the variation in the engagement score is explained by each factor [measured by a questionnaire item], after taking into account all other factors included in the regression model. So the term net impact is a non-technical way of describing the explanatory power of a particular variable on an outcome, in this case engagement, after having taken into account the influ-ence of all other variables in the model on that outcome.) This statistical modelling finds that most (over 70%) of the varia-tion in engagement scores among all survey respondents can be accounted for by 10 questionnaire items. Here are the top-10 work environment drivers of engagement, rank ordered by their net influence on engagement scores:
1. I feel I can trust this organization.2. I have an opportunity to make improvements in work.3. The organization values my work.4. Senior management is committed to high-quality care.5. I have clear job goals/objectives.6. I feel I belong to a team.7. My organization promotes staff health/wellness.8. I have a good balance of family/personal life with work.9. My supervisor can be counted on to help with difficult tasks.
10. I have adequate resources/equipment to do my work.
Two points should be kept in mind when considering the top-10 engagement drivers. First, the regression analysis included 36 EES items assessing jobs, training and develop-ment opportunities, work team, immediate supervisor, senior management and organizational supports. Second, the analysis also took into account the possible influences on engagement of
How Employee Engagement Matters for Hospital Performance Graham Lowe

Healthcare Quarterly Vol.15 No.2 2012 35
peer group, as well as the demographic and employment charac-teristics shown, in our earlier discus-sion, to be related to engagement.
O n e c o u l d argue that t rust is an outcome of these other work experiences and, as such, should not be included in the multivariate analysis as a potential driver of engagement. Trust is a complex property of organizational life, being both a cause and effect of work expe r i ence s and performance. After removing trust from the regression model, the list of top-10 drivers of engagement remains largely the same, with only two minor changes. First, the rank ordering shifts slightly: the top three factors are (1) the organization values my work, (2) senior management is committed to high-quality care and (3) I have clear job goals/objectives. And, second, while the role of super-visors remains important, “My supervisor can be counted on to help with difficult tasks” is replaced by “My supervisor treats me fairly.”
Other Influences on EngagementBeyond the top-10 engagement drivers, other work environment factors influence engagement scores. Employees’ assessments of the following work environment factors had a statistically significant influence on engagement scores, albeit less so than the top-10 factors:
• Ihavetheopportunitytousemyskills.• Iunderstandthegoalsofthisorganization.• Iamabletodecidehowtodowork.• Wehaveenoughstafftohandleworkload.• Mysupervisortreatsmefairly.• Ihaveanopportunitytoreceiveeducation/training.• Myunitorteamdoesnotworkincrisismode.• Myunitorteammemberstreateachotherwithrespect.• Ihavetheopportunityforcareeradvancement.• Seniormanagementcommunicateswithstaffaboutwhat
they are trying to achieve.
The newness effect on engagement, discussed earlier, disap-pears when a broad range of work environment factors is taken into account. Facility type (being employed in a teaching hospital) and employment status (part-time or “other” employ-ment status, being temporary/per diem or standby and not being a union member) have very small positive effects on engagement. Each of these factors explains less than 1% of the variation in engagement scores.
Engagement and Key OutcomesThe OHA Quality Healthcare Workplace Model suggests that more-engaged employees are better able than their less-engaged colleagues to achieve organizational goals. This section provides empirical confirmation that this indeed is the case, focusing on four outcomes: retention, quality of patient care or services provided by the respondent’s team/unit, patient safety culture and patient-centred care.
RetentionOne of the major human resource goals of any healthcare organi-zation is to retain competent staff. Turnover is costly. It is widely assumed that more-engaged employees stay and contribute. As Figure 2 shows, this is the case among EES respondents. While close to half of disengaged employees will be job hunting in the next 12 months, only one in 10 of those who are highly engaged will be looking for a new job with a different employer. In other words, 90% of highly engaged employees plan to stay with the organization, at least for the near future.
FIGURE 2.Retention by level of engagement
52.1%
79.7%
89.7%
47.9%
20.3%
10.3%
0% 10% 20% 30% 40% 50% 60% 70% 80% 90% 100%
Low
Medium
High
Leve
l of E
ngag
emen
t
Unlikely to look for a new job in next 12 months Likely to look for a new job in next 12 months
n = 10,053. Group differences are statistically significant (p < .001).
Graham Lowe How Employee Engagement Matters for Hospital Performance

36 Healthcare Quarterly Vol.15 No.2 2012
Work Unit Service QualityIncreasingly, healthcare organizations are using a variety of tools to assess the quality of patient care and of the non-clinical services provided. These tools range from wait times and hospital readmissions to patient satisfaction surveys, awards for service quality and informal client feedback. The EES provides another equally useful metric for assessing quality: employees’ percep-tions of the quality of patient care and other services provided by their work unit.
Figures 3 and 4 document a clear pattern in patient care and service quality. These results suggest that achieving higher levels of employee engagement is part of the solution to quality improvement. In both clinical and non-clinical units (based on whether or not EES respondents have direct patient contact), two thirds of highly engaged employees report that their work units “always” provide top-quality service. This stands in contrast to the low-engagement group, where only about one in five believe that excellent quality service is always provided.
Patient-Centred CareCreating and maintaining a patient-centred care environ-ment has become a strategic goal for many hospitals. The EES captures the main dimensions of a patient-centred care environ-ment. Using the same statistical techniques described above to create the EES, we constructed a multi-item Patient-Centred Work Environment Scale (PCWE). (This six-item scale has a range of six to 30, a mean of 21.2, a standard deviation of 4.8 and a Cronbach reliability a of .88, and factor loadings were
between .63 and .81.) The scale combines the following six questionnaire items:
1. I support and involve family members when requested by the patient.
2. I involve patients in decisions about their care.3. I have the time I need to talk with my patients to make
sure they get the information they want about their medical condition, treatment or tests.
4. I get timely information about my patients’ condition/treat-ment/tests.
5. I have the time and information to prepare patients for leaving the hospital/program.
6. I treat patients as individuals with unique needs and prefer-ences.
The scores for the PCWE were divided into quartiles, making it easier to examine the relationship to engagement. Figure 5 shows the percentage of employees in the three engage-
ment groups who are in each of the PCWE quarti les. Employees in the highest quartile have the most positive assessment of the six items measuring patient-centred work environment. We find a strong and consistent relation-ship between engage-ment and assessments of such an environ-ment. Specifically, 4 6 % o f h i g h l y engaged employees have PCWE scores in the top quartile. By contrast, only 21% of disengaged employees are in the
top PCWE quartile. Equally important, while 6% of highly engaged employees fall into the lowest PCWE quartile, this rises to 38% among the least-engaged employees.
Safety CultureThe EES also measured patient safety culture. These measures are designed to inform improvements in patient safety, which is a priority for the Canadian healthcare system. Applying the same methodology as above, a six-item Patient Safety Culture (PSC)
FIGURE 3.Work unit provides top-quality patient care by level of engagement*
33.0%
8.1%
1.9%
46.5%
49.8%
30.5%
20.5%
42.2%
67.6%
0% 10% 20% 30% 40% 50% 60% 70% 80% 90% 100%
Low
Medium
High
Leve
l of E
ngag
emen
t
Never/sometimes Usually Always
* Includes only respondents with frequent or occasional direct patient contact (n = 6,988). Group differences are statistically significant (p < .001).
How Employee Engagement Matters for Hospital Performance Graham Lowe

Healthcare Quarterly Vol.15 No.2 2012 37
scale was created. (This six-item scale has a range of six to 30, a mean of 20.6, a standard deviation of 3.5 and a Cronbach reliability a of .78, and factor loadings were between .53 and .76.) The following questionnaire items make up this scale:
• E r r o r s , n e a rm i s s e s a n d incidents have led to positive changes here.
• After we makec h a n g e s t o improve patient safety, we evaluate their effectiveness.
• Weare informeda b o u t e r ro r s , near misses and incidents.
• My organizationencourages us to report errors, near misses and incidents.
• Our proceduresa n d s y s t e m s a r e g o o d a t preventing errors, near misses and incidents from happening.
• Staff in my unitare actively doing things to improve patient safety.
Figure 6 reports the results of the relationship between engagement and PSC scores, using quartiles for the latter. These results mirror what we saw in Figure 5 regarding a patient-centred work environment. If anything, the relationship between engagement and safety culture is even stronger, given that 58% of highly engaged employees are in the top quartile of PSC scores, while only 3% are in the lowest quartile.
ConclusionThis survey of hospital employees provides a unique opportu-nity to explore the dynamics of employee engagement in health-care. The results show a consistently strong relationship between employee engagement and organizational performance, as suggested in the OHA’s Quality Healthcare Workplace Model. However, we should be careful not to infer causation. Further analysis of EES and other employee survey data is required to
FIGURE 4.Work unit provides top-quality services by level of engagement*
27.5%
6.9%
2.8%
49.2%
50.0%
31.7%
23.3%
43.1%
65.5%
0% 10% 20% 30% 40% 50% 60% 70% 80% 90% 100%
Low
Medium
High Le
vel o
f Eng
agem
ent
Never/sometimes Usually Always
*Includes only respondents with no direct patient contact (n = 1,983). Group differences are statistically significant (p < .001).
FIGURE 5.Patient-centred work environment scale scores (in quartiles) by level of engagement*
38.4%
16.3%
5.8%
26.2% 21.1%
29.4% 28.3%
20.2% 45.6%
14.4%
26.0%
28.3%
0% 10% 20% 30% 40% 50% 60% 70% 80% 90% 100%
Low
Medium
High
Leve
l of E
ngag
emen
t
Lowest quartile 2nd quartile 3rd quartile Highest quartile
*Includes respondents with frequent or occasional patient contact (n = 6,949). Group differences are statistically significant (p < .001).
Graham Lowe How Employee Engagement Matters for Hospital Performance

38 Healthcare Quarterly Vol.15 No.2 2012
test the direction of causation in these relationships and how they change over time. It is possible, for example, that being part of a high-performing team is among the “causes” of high engagement. Still, the results show that engagement levels are positively and consistently related to a range of mission-critical organizational outcomes in the 16 hospitals being studied.
While the study may not be fully representative of all Ontario hospitals, it does provide insights that will be useful to Ontario healthcare employers. The province’s Excellent Care for All Act requires hospitals to measure, report and improve the work environment as part of their overall quality improvement plan. This study illustrates the types of employee survey measures that can contribute to overall quality improvement initiatives. And as more Ontario hospitals use the EES, its benchmarking potential will grow. Also useful would be national benchmarks of key outcome measures. This could include an engagement scale score, such as the one used in this study, or a single-item component of the engagement scale, such as job satisfaction (Lowe and Chan 2010).
We now have an evidence-based definition of employee engagement relevant to healthcare. Engaged employees have strong emotional, rational and behavioural attachments to their job and their organization. They experience pride, values congru-ence, and job and organizational satisfaction, and they feel enthu-siastic and inspired in their work. In short, the engaged employee is the ideal employee. As the EES documents, engaged employees benefit patients and reduce the workforce costs associated with turnover. For healthcare leaders and policy makers, the overall conclusion is that higher levels of employee engagement must
become a strategic goal for all healthcare organizations.
C l o s i n g t h e engagement gap must be a priority. Indeed, the fact that one third of employees surveyed have low levels of engage-ment poses a signifi-cant risk to patient care, internal service quality and staffing budgets. Reducing the engagement gap must become part of risk management by hospital boards and executive teams. Results from surveys such as the EES can
help managers and employees to identify actions that will close the gap between the lowest- and highest-scoring groups by raising the lowest scores. In this study, the gap is wide, with a spread of between 45 and 73 percentage points in positive response levels on key drivers between the low-engagement and high-engagement groups. At the organizational level, focused and persistent efforts will be required to narrow this gap.
The EES results also highlight the importance of trust. Indeed, the key to unlocking higher levels of engagement is for managers at all levels to build trust with employees. Demonstrating basic respect, fairness and integrity in all dealings with staff is the basis for trust (Burchell and Robin 2011). Trust building is an incremental and ongoing process that happens in every interaction and becomes engrained in an organization’s culture. A prerequisite in this regard is open communication. As well, culture becomes the vital link between positive staff experiences and performance. Other studies show that high-performance hospitals have distinctive cultures that empower middle managers, champion pro-performance values and clearly communicate a corporate vision that guides their actions (Mannion et al. 2005).
The profile of the engaged employee emerging from this study reinforces the importance of effective people practices (Michie and West 2004). Any manager can carry out a simple self-assessment by reflecting on how closely the organization’s employees fit this profile. Highly engaged employees not only trust their employer, they also are able to improve how they work, feel valued and have clear job goals and a sense of team membership. They are able to perform effectively in their
FIGURE 6.Patient safety culture scale scores (in quartiles) by level of engagement*
34.4%
10.8%
2.9%
38.6% 10.7%
33.8% 28.7%
17.5% 57.5%
16.3%
26.7%
22.1%
0% 10% 20% 30% 40% 50% 60% 70% 80% 90% 100%
Low
Medium
High
Leve
l of E
ngag
emen
t
Lowest quartile 2nd quartile 3rd quartile Highest quartile
*Includes respondents with frequent or occasional patient contact (n = 6,862). Group differences are statistically significant (p < .001).
How Employee Engagement Matters for Hospital Performance Graham Lowe

Healthcare Quarterly Vol.15 No.2 2012 39
job because they have a supportive supervisor and adequate resources and equipment. Their quality of work life is enhanced because the organization takes steps to promote staff wellness and work-life balance. And they understand that senior manage-ment is committed to high-quality care. None of these engage-ment drivers requires costly new programs. If anything, they call for a back-to-basics approach to how healthcare organizations manage and motivate their employees.
AcknowledgementsI would like to thank OHA and NRC Picker Canada for making available the data analyzed in this article. Useful comments on earlier drafts were provided by Kimberly Burrows and Dana Ross at the Ontario Hospital Association, as well as Heather Dawson and Melanie Jameson at NRC Picker Canada.
ReferencesBaruch, Y. and B.C. Holtom. 2008. “Survey Response Rate Levels and Trends in Organizational Research.” Human Relations 61(8): 1139–60.
Burchell, M. and J. Robin. 2011. The Great Workplace: How to Build It, How to Keep It, and Why It Matters. San Francisco: Jossey-Bass.
Collins, K.S., S.K. Collins, R. McKinnies and S. Jensen. 2008. “Employee Satisfaction and Employee Retention: Catalysts to Patient Satisfaction.” Health Care Manager 27: 245–51.
Eisenberg, J.M., C.C. Bowman and N.E. Foster. 2001. “Does a Healthy Health Care Workplace Produce Higher-Quality Care?” Journal of Quality Improvement 27: 444–57.
Gibbons, J. and R. Schutt. 2010. A Global Barometer for Measuring Employee Engagement. (Research Working Group Report No. 1460-09-RR). New York: Conference Board.
Harmon, J. and S.J. Behson. 2007. “Links among High-Performance Work Environment, Service Quality, and Customer Satisfaction: An Extension to the Healthcare Sector.” Journal of Healthcare Management 52: 109–24.
Heskett, J.L., W.E. Sasser and J. Wheeler. 2008. The Ownership Quotient: Putting the Service Profit Chain to Work for Unbeatable Competitive Advantage. Boston, MA: Harvard Business Press.
Lowe, G. 2010. Creating Healthy Organizations. How Vibrant Workplaces Inspire Employees to Achieve Sustainable Success. Toronto, ON: Rotman/UTP Publishing.
Lowe, G. and B. Chan. 2010. “Using Common Work Environment Metrics to Improve Performance in Healthcare Organizations.” Healthcare Papers 10(3): 43–47.
Macey, W.H. and B. Schneider. 2008. “The Meaning of Employee Engagement.” Industrial and Organizational Psychology 1: 3–30.
Mannion, R., T.O. Davies and M.N. Marshall. 2005. “Cultural Characteristics of ‘High’ and ‘Low’ Performing Hospitals.” Journal of Health Organization and Management 19: 431–39.
Michie, S. and M.A. West. 2004. “Managing People and Performance: An Evidence-Based Framework Applied to Health Service Organizations.” International Journal of Management Reviews 5/6: 91–111.
Sikorska-Simmons, E. 2006. “Linking Resident Satisfaction to Staff Perceptions of the Work Environment in Assisted Living: A Multilevel Analysis.” The Gerontologist 46: 590–98.
Rondeau, K.V. and T. Wagar. 2006. “Nurse and Resident Satisfaction in Magnet Long-Term Care Organizations: Do High Involvement Approaches Matter?” Journal of Nursing Management 14: 244–50.
West, M., J. Dawson, L. Admasachew and A. Topakas. 2011. NHS Staff Management and Health Service Quality: Results from the NHS Staff Survey and Related Data. Birmingham, England: Aston Business School. Retrieved February 2, 2012. <http://www.dh.gov.uk/en/Publicationsandstatistics/Publications/PublicationsPolicyAndGuidance/DH_129643>.
About the AuthorGraham Lowe, PhD, is president of the Graham lowe Group Inc. (www.grahamlowe.ca), a workplace consulting firm based in Kelowna, British columbia, and the author of creating Healthy organizations (Rotman/utP Publishing, 2010). He can be reached at [email protected].
Graham Lowe How Employee Engagement Matters for Hospital Performance
Longwoods.com