how ecological restoration alters ecosystem services: an analysis of carbon sequestration in...
TRANSCRIPT

How ecological restoration altersecosystem services: an analysis ofcarbon sequestration in China’s LoessPlateauXiaoming Feng1, Bojie Fu1, Nan Lu1, Yuan Zeng2 & Bingfang Wu2
1State Key Laboratory of Urban and Regional Ecology, Research Center for Eco-Environmental Sciences, Chinese Academy ofSciences, Beijing 100085, China, 2Institute of Remote Sensing and Digital Earth, Chinese Academy of Sciences, Beijing 100094,China.
Restoring disturbed and over-exploited ecosystems is important to mitigate human pressures on naturalecosystems. China has launched an ambitious national ecosystem restoration program called Grain to GreenProgram (GTGP) over the last decade. By using remote sensing techniques and ecosystem modelling, wequantitatively evaluated the changes in ecosystem carbon sequestration since China’s GTGP programduring period of 2000–2008. It was found the NPP and NEP in this region had steadily increased after theinitiative of the GTGP program, and a total of 96.1 Tg of additional carbon had been sequestered during thatperiod. Changes in soil carbon storage were lagged behind and thus insignificant over the period, but wasexpected to follow in the coming decades. As a result, the Loess Plateau ecosystem had shifted from a netcarbon source in 2000 to a net carbon sink in 2008. The carbon sequestration efficiency was constrained byprecipitation, and appropriate choices of restoration types (trees, shrubs, and grasses) in accordance to localclimate are critical for achieving the best benefit/cost efficiency.
Ecological restoration, which aims to restore disturbed ecosystems, has been an important approach tomitigate human pressures on natural ecosystems1 and to improve ecosystem services2. China’s Grain toGreen Program (GTGP) is such a national ecological restoration program. Started in 1999, GTGP is the
largest ecological restoration program in the developing world, with an ambitious goal to rehab China’s degradedand disturbed ecosystems. The Chinese government has committed a spending over $US 40 billion on the GTGPprogram by 20503, and over the past decade approximately $US 28.8 billion has already been invested on theconversion of cultivated land on steep slopes ($25u) to perennial vegetation.
Since its implementation in 1999, the GTGP program has made remarkable contribution to China’s vegetationrecovery. Both ground based inventory data and satellite based Normalized Different Vegetation Index (NDVI)data has revealed a significant increase in the area of natural and semi-natural vegetation over the regions coveredby the GTGP program4,5. For instance, inventory data show that the GTGP program has helped re-establish semi-natural vegetation on 14.7 million hectares of previously cultivated slopes and 17.3 million hectares on abandonedagricultural lands4. This continuous increase in vegetation cover is expected to change ecosystem services,including the potential in sequestrating greenhouse gases, which has not yet been quantitatively evaluated.Furthermore, the effectiveness of ecological restoration as well as its carbon sequestration consequence can behighly variable across climatic gradients6. For example, vegetation in humid southern China now accounts formore than 65% of national carbon sequestration since the implementation of national ecosystem restoration7,while the effectiveness of vegetation restoration is limited in arid regions8. Therefore, it is also important toexamine the spatial and regional variances in the ecosystem services from large-scale restoration program. Suchinformation is particularly important for adjusting current and planning for future restoration program in a morebenefit/cost efficient way.
In this paper, we investigated the ecosystem carbon sequestration in the Loess Plateau, a prioritized pilot regioncovered by the ongoing GTGP program (Fig. 1), over the period of 2000–2008. Home to 108 million people, theLoess Plateau in Northern China is one of the world’s most eroded regions, as a result of thousands of years ofover-exploitation over its fragile ecosystems built on dry powdery wind-blown soil9. Effectively restoring the
OPEN
SUBJECT AREAS:RESTORATION ECOLOGY
ECOSYSTEM SERVICES
SUSTAINABILITY
CLIMATE-CHANGE MITIGATION
Received18 January 2013
Accepted17 September 2013
Published3 October 2013
Correspondence andrequests for materials
should be addressed toB.F. ([email protected])
SCIENTIFIC REPORTS | 3 : 2846 | DOI: 10.1038/srep02846 1
semi-natural and natural vegetation through the GTGP program inthis over-exploited fragile ecosystem is therefore a critical measurefor the welfare of the people inhabited in this plateau and beyond10.Thus, our aim in this paper is to quantitatively evaluate the efficiencyof the GTGP program in improving carbon sequestration in waterlimited arid Loess Plateau. By incorporating satellite derived NDVIdata, climate data, and ecosystem modeling, we investigated thechange in ecosystem net primary productivity (NPP), soil carbonstorage and net ecosystem productivity (NEP) over the LoessPlateau since the implementation of the GTGP program. Finally,
we also discussed how the amount of precipitation may affect theGTGP efficiency in carbon sequestration.
ResultsAnnual NPP increased over the Loess Plateau since the implemen-tation of the GTGP program. We first examined the change inannual NPP over the Loess Plateau, which showed an increasingtrend during the period 2000–2008. The total annual NPPincreased from 0.170 Pg C in 2000 to 0.217 Pg C in 2008: a signi-ficant rate of 9.4 g C m22 per year (P , 0.01). This increasing trend in
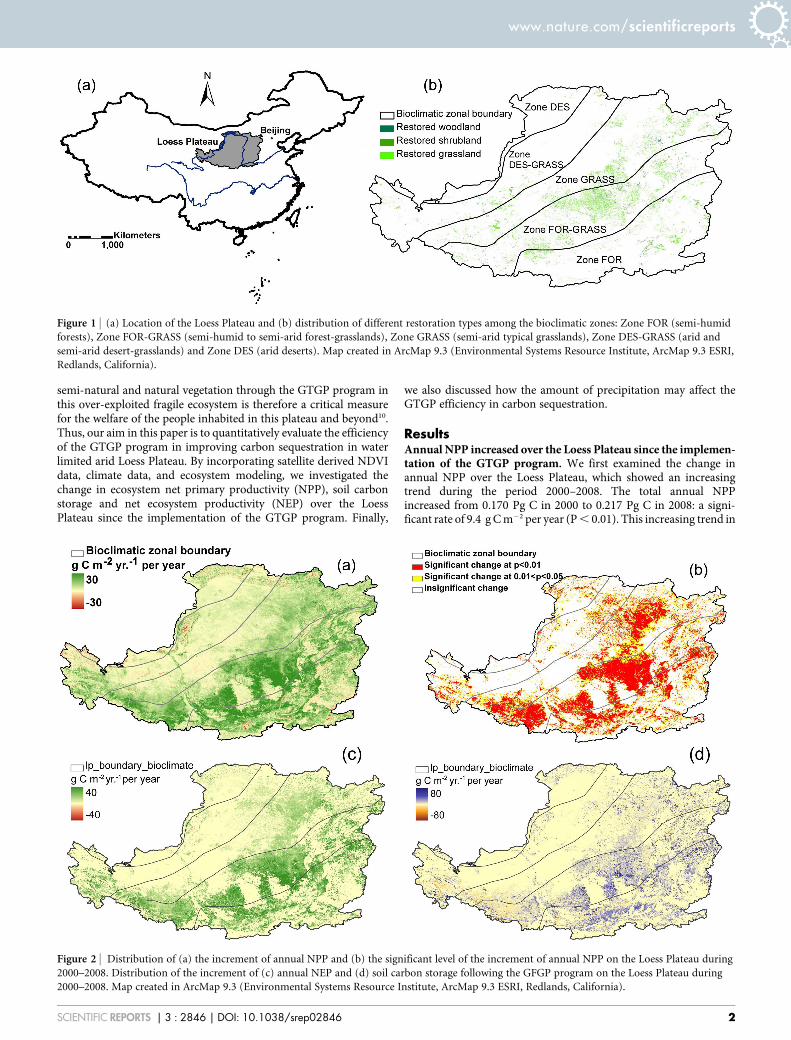
Figure 2 | Distribution of (a) the increment of annual NPP and (b) the significant level of the increment of annual NPP on the Loess Plateau during
2000–2008. Distribution of the increment of (c) annual NEP and (d) soil carbon storage following the GFGP program on the Loess Plateau during
2000–2008. Map created in ArcMap 9.3 (Environmental Systems Resource Institute, ArcMap 9.3 ESRI, Redlands, California).
Figure 1 | (a) Location of the Loess Plateau and (b) distribution of different restoration types among the bioclimatic zones: Zone FOR (semi-humid
forests), Zone FOR-GRASS (semi-humid to semi-arid forest-grasslands), Zone GRASS (semi-arid typical grasslands), Zone DES-GRASS (arid and
semi-arid desert-grasslands) and Zone DES (arid deserts). Map created in ArcMap 9.3 (Environmental Systems Resource Institute, ArcMap 9.3 ESRI,
Redlands, California).
www.nature.com/scientificreports
SCIENTIFIC REPORTS | 3 : 2846 | DOI: 10.1038/srep02846 2

annual NPP is also significant (P , 0.05) in 37% of the Loess Plateauarea, where the mean rate of annual NPP accumulation was 17.1 g Cm22 per year (Fig. 2a).
The plateau can be divided into five bioclimatic zones: semi-humid forests (FOR), semi-humid to semi-arid forest-grasslands(FOR-GRASS), semi-arid typical grasslands (GRASS), arid andsemi-arid desert-grasslands (DES-GRASS) and arid deserts (DES),descending by the amount of annual precipitation received11 (Fig. 1,Supplementary Table S1). The increasing trend in annual NPP dur-ing 2000–2008 is also found for each of the five bioclimatic zones,with varied magnitudes. The largest increasing trend was found inZone FOR-GRASS (15.3 g C m22 per year, P , 0.01), followed byZone FOR (12.4 g C m22 per year, P , 0.01), Zone GRASS (7.4 g Cm22 per year, P , 0.01) and Zone DES-GRASS (3.8 g C m22 per year,P , 0.05). The change is less obvious in Zone DES (2.5 g C m22 peryear, P 5 0.08) (Fig. 2a, Fig. 2b).
Increased annual NEP over the Loess Plateau during 2000–2008.NEP of the Loess Plateau also significantly increased from a carbonsource of 20.011 Pg C in 2000 to a carbon sink of 0.108 Pg C in 2008,equaling to a rate of 19.2 g C m22 per year (P , 0.01). While all ofthem except Zone FOR were net carbon sources in the year 2000, by2008, all five zones functioned as net carbon sinks with annual NEPbeing 0.040 Pg C (37.1% of the total annual NEP), 0.035 Pg C(31.9%), 0.016 Pg C (14.6%), 0.014 Pg C (12.4%) and 0.004 Pg C(4.1%), respectively (Fig. 2c).
The significantly increasing NEP trend was also found for eachbioclimatic zone during 2000–2008, with variable magnitudes. ZoneFOR-GRASS had the highest trend of annual NEP increase (26.7 g Cm22 per year, P , 0.01), followed by Zone FOR (24.8 g C m22 peryear, P 5 0.01), Zone DES-GRASS (17.1 g C m22 per year, P , 0.01),Zone GRASS (11.5 g C m22 per year, P , 0.01), and Zone DES (9.9 gC m22 per year, P , 0.01) (Fig. 2c).
Increased soil carbon storage over the Loess Plateau during 2000–2008. Soil carbon storage for the Loess Plateau increased from2.639 Pg C in 2000 to 2.682 Pg C in 2008, a rate of 8.5 g C m22 peryear. The increasing trend was also found for each bioclimatic zonewith variable magnitudes. Zone FOR had the highest trend (13.9 g Cm22 per year), followed by Zone FOR-GRASS (9.7 g C m22 per year),zone DES-GRASS (6.3 g C m22 per year), Zone GRASS (4.8 g C m22
per year) and Zone DES (3.2 g C m22 per year) (Fig. 2d). Yet all thetrends were statistically insignificant (P . 0.05), probably due to theshort time duration since the implementation of the GTGP program.
Ecosystem restoration and carbon sequestration. Apart from theimplemented GTGP program, changes in climate may also havecontributed to the past decade’s significant ecosystem carbonsequestration in the Loess Plateau. Thus we also examined thechanges in annual precipitation (P) and mean annual temperature(MAT) over 2000–2008. However, we found no significant change inP or MAT for either the entire region or any of the separatebioclimatic zones (Fig. 3). Statistical analyses also showed nosignificant correlations between NPP or NEP and the climatevariables (P . 0.45). Hence the observed significant increases inNPP and NEP over the Loess Plateau were unlikely caused byclimate change. On the other hand, the places experiencing asignificant increase in annual NPP were found mostly within theGTGP program areas (comparing Fig. 1b and Fig. 2b). In addition,the rates of annual NPP and NEP increase for each zone were linearlycorrelated with the acreage of restored shrubland in that zone (R2 $
0.78, P # 0.04) (Fig. 4). These results suggest that the increasedannual NPP and net ecosystem sequestration across the LoessPlateau from 2000–2008 were mostly due to the implementedecological restoration program.
While changes in climate may not be responsible for the signifi-cantly increased NPP in the Loess Plateau, the carbon sequestration
efficiency of the GTGP program was still limited by precipitation.Precipitation can have a direct effect on plant characteristics such assize, plant structure as well as plant density of the restored vegeta-tion12,13. For Zone FOR, the woodland restoration type had the high-est amounts of NPP and NEP. For Zone FOR-GRASS, restoredshrubland had the highest amounts of NPP and NEP; and forZone GRASS, shrubland restoration resulted in the highest amountof NPP, and woodland restoration had the highest NEP. For ZoneDES, restored grassland performed best in terms of the amount ofNPP or NEP (Table 1). The results suggest the appropriate restora-tion types in accordance to local climate should be considered forachieving the best efficiency.
Figure 3 | Time series of (a) annual NPP, (b) annual precipitation and (c)temperature during 2000–2008 across the Loess Plateau. The dotted lines
are linear regression fits for each set of data: y 5 9.4x 2 18232.0
(R2 5 0.88, P 5 0.0001) for annual NPP, y 5 22.1x 1 441.3(R2 5 0.01, P
5 0.81) for annual precipitation and y 5 0.004x 1 8.5 (R2 5 0.00, P 5
0.93) for temperature. The inset of each diagram shows trends for each
bioclimatic zone. ** means a significant trend at P , 0.01, and * means a
significant trend at P , 0.05.
www.nature.com/scientificreports
SCIENTIFIC REPORTS | 3 : 2846 | DOI: 10.1038/srep02846 3

DiscussionOur results demonstrated a significantly increasing trend in ecosys-tem carbon sequestration over the fragile Loess Plateau (19.2 g C m22
per year on average) since the implementation of the GTGP pro-gram, which resulted in a total of 96.1 Tg C fixed in this land. TheLoess Plateau ecosystem had shifted from a net carbon source in 2000to a net carbon sink in 2008. This sequestration of carbon is equi-valent to 6.4% of China’s total fossil fuel carbon dioxide emissions in200614. It should be noted that the restored area in the Loess Plateauaccounted for about 6.4% of the total area covered by the GTGPprogram15. Therefore, the GTGP program has made substantial con-tribution in mitigating China’s anthropogenic CO2 emission.
Our analysis showed that the current increase of NEP was mainlycontributed by enhanced NPP, and the trend of soil carbon storage inthe first nine years of the GFGP program was found insignificant.This might be because changes in soil carbon storage usually lagbehind that of aboveground productivity16,17. The time of source-to-sink transition was 3–8 years and SOC recovery was 10–15 years.In a recent study18, China’s forest soil in 2000–2007 was estimated acarbon sink as large as 28 Tg C yr21. However, this large soil carbonsink may be overestimated by assuming a constant ratio of biomass/soil carbon storage. Nonetheless, with the progress of the ecologicalrestoration program, enhanced soil carbon storage is expected tofollow in the coming decades because of improved carbon inputsand increased soil carbon storage capacity.
The increment of annual NPP and NEP was highest in Zone FOR-GRASS, where mean annual precipitation is about 450–550 mm.This is the result of both the largest proportion of restored landand the full phenological development of restored trees in theFOR-GRASS region. Where precipitation is less than 500 mm, theplanted trees were found in reduced stature and shrub-like in appear-ance19. Our work also demonstrated the rates of different restorationtypes in increasing annual NPP for different bioclimatic zones. In
terms of carbon sequestration potential, our results showed there isnot a universally best restoration type for all climate types. Thevegetation restoration in the Loess Plateau is especially limited bythe availability of water19. Climate modeling predicts a drier andwarmer climate to be expected for the coming decades in the LoessPlateau, which will cause greater deficits of water availability in thisalready water-limited region. Given the high cost of human aidedecological restoration, it is therefore particularly important to care-fully choose the appropriate restoration vegetation type according tothe local climatic restraints especially precipitation to achieve bestecosystem services.
MethodsStudy region. Located in northern China, the Loess Plateau covers an area ofapproximately 640,000 km2. Annual precipitation in this region varies from 200 to800 mm, and the annual mean air temperature is 7uC. Except for the most humidsoutheastern part which is dominated by forests, over 80% of the Loess Plateau iscovered by arid and semi-arid grassland ecosystems (see Supplementary Fig. S1online). As the core region where Chinese culture was born and cultivated, the LoessPlateau had a long history of agricultural exploitation. Since the implementation ofGTGP program in 1999, grasses (species like Medicago sativa), shrubs (e.g., Caraganamicrophyllla, Hippophae rhamnoides) and trees (e.g., like Robinia pseudoacacia, Pinustabulaeformis, Ziziphus jujube and Malus pumila) have been planted on landformerly cultivated for crops11. Cultivated cropland decreased by 10.8% since theimplementation of the GTGP from 2000–2008. Woodland increased by 4.9%, whileshrubland and grassland increased by 6.6%10.
Estimating NPP from remotely sensed data. We used the terrestrial Carnegie-Ames-Stanford Approach (CASA) ecosystem model to estimate ecosystem netprimary production (NPP) from satellite data. The CASA NPP is calculated as theproduct of the modulated ‘Absorbed Photosynthetically Active Radiation’ (APAR)and the light use efficiency (LUE) factor20:
NPP(x,t)~APAR(x,t)e(x,t)
Where NPP(x,t) represents carbon sequestration in spatial location x and time t (gC m22), APAR(x,t) is the canopy-absorbed incident solar radiation (MJ m22), ande(x,t) is the light use efficiency (g C MJ21) of APAR. Most of the inputs needed to run
Figure 4 | Linear correlation (a) between annual NPP and zonal acreage for restored shrubland: y 5 21540x 2 68463(R2 5 0.95, P 5 0.004); and(b) between annual NEP and zonal acreage for restored shrubland: y 5 14053x 2 142997 (R2 5 0.78, P 5 0.04).
Table 1 | Annual NPP and NEP of the resotred ecosystems and their trends since the implementation of the GFGP program. ** means asignificant trend at P , 0.01, and * means a significant trend at P , 0.05
Annual NPP (g C m22) and the trend (g C m22 per year) Annual NEP (g C m22) and the trend (g C m22 per year)
Restored woodland Restored shrubland Restored grassland Restored woodland Restored shrubland Restored grassland
FOR 652.2 (5.1*) 550.5 (16.5**) 563.7 (17.5**) 304.4 (21.0*) 289.9 (22.2**) 277.2 (24.8*)FOR-GRASS 402.6 (21.4**) 439.4 (19.3**) 429.8 (23.1**) 233.4 (25.1**) 263.7 (23.9**) 235.1 (27.2**)GRASS 257.2 (10.1*) 264.0 (11.0**) 228.7 (9.9**) 118.2 (13.6**) 92.8 (10.0*) 106.5 (11.6**)DES-GRASS 290.6 (4.8) 202.9 (3.0) 193.6 (3.5) 148.8 (13.2**) 89.8 (11.7**) 102.2 (12.3**)DES 127.2 (2.9) 181.1 (21.5) 213.4 (3.2) 113.3 (6.6) 108.3 (7.9*) 149.6 (7.3**)Loess Plateau 344.2 (14.5**) 406.0 (13.8**) 372.0 (16.9**) 195.6 (18.6**) 256.6 (21.6**) 191.8 (20.8**)
www.nature.com/scientificreports
SCIENTIFIC REPORTS | 3 : 2846 | DOI: 10.1038/srep02846 4

the CASA model can be derived from remote sensing data21. Compared to otherprocess-based models, the CASA model has been proven of the most efficientapproach in simulating carbon cycles in the Loess Plateau20 (Supplementary Table S2).
Data inputs for the CASA model include land cover, NDVI, and climate data. Landcovers for the Loess Plateau in 2000 and 2008 were extracted from Landsat TM/ETM.We used the 1-km MODIS NDVI data, which were composites of 16-day NDVImaximum values and acquired from the MODIS Land Processes Distributed ArchiveCenter (http://wist.echo.nasa.gov/api). In addition, daily meteorological data (solarradiation, temperature and precipitation) for the period 2000–2008 were obtainedfrom 172 stations within and near the Loess Plateau, and were interpolated to a 1-kmresolution on a 1-km resolution digital elevation model layer with the thin-platesmoothing spline method using ANUSPLIN 3.1. Carbon sequestration rates werecalculated on a monthly basis.
Soil carbon storage and annual NEP. We used the CENTURY model22 to estimatesoil carbon storage in the upper 50 cm soils and annual NEP, the latter is thedifference between NPP and ecosystem microbial respiration. CENTURY iscomposed of a plant production submodel, soil organic matter submodel and waterbudget model. The model runs with a monthly time step. In this study, CENTURYmodel was first run for 50 years under the land use before the GTGP program to getthe initial soil carbon levels of the Loess Plateau. During the period of 1999–2000,remotely sensed NPP was used as the monthly production to drive the modelsimulation. Plant and soil variables in CENTURY model were mainly acquired fromthe Chinese ecosystem research network (CERN) (http://www.cerndata.ac.cn/) Forunavailable parameter values such as extreme temperatures of plant growth,structural death, decomposition rate, and cultivation/harvest factors, archived samplevalues from the CENTURY parameter database were referred to (http://www.nrel.colostate.edu/projects/century/).
Data analysis. We used linear regression to estimate the trends of annual carbonsequestration during 2000–2008 for each 1 3 1 km2 grids, as well as for each of thefive bioclimatic zones and the entire region.
The acreage of cultivated land restored to semi-natural habitats in each bioclimaticzone was used as a proxy for the extent of implementation of the GTGP. We identifiedthe effect of GTGP first by analysing the carbon sequestration trend for each restoredecosystem type (grassland, shrubland and woodland), then by comparing the acreageof restored land with zonal annual carbon sequestratoion increase. Finally, weidentified the effect of local precipitation on carbon uptake by comparing zonalcarbon sequestration with precipitation gradients.
1. Holl, K. D., Crone, E. E. & Schultz, C. B. Landscape restoration: Moving fromgeneralities to methodologies. BioScience 53, 491–502 (2003).
2. Doren, R. F., Trexler, J. C., Gottlieb, A. D. & Harwell, M. C. Ecological indicatorsfor system-wide assessment of the greater everglades ecosystem restorationprogram. Ecol. Indic. 9, 2–16 (2009).
3. Xu, Z., Bennett, M. T., Tao, R. & Xu, J. China’s sloping land conversionprogramme four year on: current situation and pending issues. Int. For. Rev. 6,317–326 (2004).
4. Chen, X., Zhang, X., Zhang, Y. & Wan, C. Carbon sequestration potential of thestands under the Grain for Green Program in Yunnan Province, China. ForestEcol. Man. 258, 199–206 (2009).
5. Xin, Z., Xu, J. & Zheng, W. Spatiotemporal variations of vegetation cover on theChinese Loess Plateau (1981–2006): Impacts of climate changes and humanactivities. Sci. China Ser. D 51, 67–78 (2008).
6. McDowell, N. G. et al. The interdependence of mechanisms underlying climate-driven vegetation mortality. Trends Ecol. Evol. 26, 523–532 (2011).
7. Piao, S. et al. The carbon balance of terrestrial ecosystems in China. Nature 458,1009–1014 (2009).
8. Cao, S. et al. Excessive reliance on afforestation in China’s arid and semi-aridregions: Lessons in ecological restoration. Earth-Sci Rev. 104, 240–245 (2011).
9. Wang, Y. & Shao, M. Spatial variability of soil physical properties in a region of theLoess Plateau of PR China subject to wind and water erosion. Land Degrad. Dev.24, 296–304 (2013).
10. Lu, Y. et al. A policy-driven large scale ecological restoration: Quantifyingecosystem services changes in the Loess Plateau of China. PLoS ONE 7, e31782(2012).
11. Zhang, H. & Huang, Z. Bio-climatic division and restoration of the degradedecosystem on the Loess Plateau. J. Arid Land Res. Environ. 15, 64–71 (2001).
12. Engelbrecht, B. M. J. et al. Drought sensitivity shapes species distribution patternsin tropical forests. Nature 447, 80–82 (2007).
13. Krishnan, P. et al. Impact of changing soil moisture distribution on net ecosystemproductivity of a boreal aspen forest during and following drought. Agr. ForestMeteorol. 139, 208–223 (2006).
14. Gregg, J. S., Andres, R. J. & Marland, G. China: emissions pattern of the worldleader in CO2 emissions from fossil fuel consumption and cement production.Geophys. Res. Lett. 35, L08806 (2008).
15. Zhang, K. et al. Change in soil organic carbon following the ‘Grain for Green’programme in China. Land Degrad. Dev. 21, 13–23 (2010).
16. Poeplau, C. et al. Temporal dynamics of soil organic carbon after land-use changein the temperate zone- carbon response functions as a model approach. GlobalChange Bio. 17, 2415–2427 (2011).
17. Li, D., Niu, S. & Luo, Y. Global patterns of the dynamics of soil carbon andnitrogen stocks following afforestation: a meta-analysis. New Phytol. 195, 172–81(2012).
18. Pan, Y. et al. A large and persistent carbon sink in the world’s forests. Science 333,988–993 (2011).
19. Hou, Q., Huang, X., Han, S. & Zhang, X. Study on the forming of ‘‘small olded treeand transforming way in the Loess Plateau I. the distribution and growth nature ofthe small olded tree. J. Soil Water Conser. 5, 64–72 (1991).
20. Potter, C. S. et al. Terrestrial ecosystem production: a process model based onglobal satellite and surface data. Global Biogeochem. Cy. 7, 811–841 (1993).
21. Xing, X. et al. Simulating net primary production of grasslands in northeasternAsia using MODIS data from 2000 to 2005. J. Geogr. Sci. 20, 193–204 (2010).
22. Parton, W. J. et al. Analysis of factors controlling soil organic matter levels in GreatPlains grasslands. Soil Sci. Soc. Am. J. 51, 1173–1179 (1987).
AcknowledgementsWe thank Prof. Shilong Piao for the comments and suggestions on the manuscript. Theresearch was supported by National Basic Research Program of China (No.2009CB421104), National Natural Science Foundation of China (No. 41230745) and theExternal Cooperation Program of the Chinese Academy of Sciences (GJHZ1215).
Author contributionsX.F. provided ecosystem modelling, statistical analysis and wrote the manuscript. B.F.designed the research. N.L. provided strategic advice and comments on the manuscript.Y.Z. and B.W. provided remotely sensed NPP and land cover for the Loess Plateau.
Additional informationSupplementary information accompanies this paper at http://www.nature.com/scientificreports
Competing financial interests: The authors declare no competing financial interests.
How to cite this article: Feng, X., Fu, B., Lu, N., Zeng, Y. & Wu, B. How ecologicalrestoration alters ecosystem services: an analysis of carbon sequestration in China’s LoessPlateau. Sci. Rep. 3, 2846; DOI:10.1038/srep02846 (2013).
This work is licensed under a Creative Commons Attribution-NonCommercial-NoDerivs 3.0 Unported license. To view a copy of this license,
visit http://creativecommons.org/licenses/by-nc-nd/3.0
www.nature.com/scientificreports
SCIENTIFIC REPORTS | 3 : 2846 | DOI: 10.1038/srep02846 5