how do teachers with self-reported voice problems differ from their peers with self-reported voice...
TRANSCRIPT

How Do Teachers With Self-Reported Voice Problems
Differ From Their Peers With Self-Reported
Voice Health?
*Viveka Lyberg �Ahlander, *,†Roland Rydell, and *Anders L€ofqvist, *yLund, Sweden
Summary: Objectives. This randomized case-control study compares teachers with self-reported voice problems to
AccepFrom
Lund UnLund, SwAddre
of LogopE-mail: VJourna0892-1� 201doi:10
age-, gender-, and school-matched colleagues with self-reported voice health. The self-assessed voice function is relatedto factors known to influence the voice: laryngeal findings, voice quality, personality, psychosocial and coping aspects,searching for causative factors of voice problems in teachers.Methods. Subjects and controls, recruited from a teacher group in an earlier questionnaire study, underwent exami-nations of the larynx by high-speed imaging and kymograms; voice recordings; voice range profile; audiometry; self-assessment of voice handicap and voice function; teaching and environmental aspects; personality; coping; burnout, andwork-related issues. The laryngeal and voice recordings were assessed by experienced phoniatricians and speechpathologists.Results. The subjects with self-assessed voice problems differed from their peers with self-assessed voice healthby significantly longer recovery time from voice problems and scored higher on all subscales of the Voice HandicapIndex-Throat.Conclusions. The results show that the cause of voice dysfunction in this group of teachers with self-reported voiceproblems is not found in the vocal apparatus or within the individual. The individual’s perception of a voice problemseems to be based on a combination of the number of symptoms and of how often the symptoms occur, along withthe recovery time. The results also underline the importance of using self-assessed reports of voice dysfunction.Key Words: Voice–Teachers–High-speed imaging–Psychosocial–Coping–VRP–Audiogram–Voice Handicap Index–Throat.
BACKGROUND AND AIM
This article is a sequel to our epidemiological study of voiceproblems in Swedish school teachers1 that examined the influ-ence of working environment on teachers’ voices and vocalbehavior. Here, we look at etiological factors that may differen-tiate teachers with self-reported voice problems from teacherswithout such problems. The self-assessed voice function is re-lated to factors known to influence the voice: laryngeal findings,voice quality, personality, psychosocial and coping aspects,searching for causative factors of voice problems in teachers.
Voice problems are common in teachers, and teachers are athigh risk of voice disorders compared with other occupations;this has been shown in a number of studies.1–12 There isa general agreement that vocal load is the major cause ofvoice problems in the teaching staff. The vocal loading thatoccurs in the daily life of teachers has several causes.13 Longteaching hours, poor room acoustics, and bad air quality areseen as the leading causes of voice problems in teachers. Psy-chological and emotional aspects may also contribute to voicedisorders.14–18 Teachers commonly work in a stressfulenvironment with high vocal and psychological demands andan increasing number of students along with noticeable cut
ted for publication June 28, 2011.the *Department of Logopedics, Phoniatrics and Audiology, Clinical Sciences,iversity, Lund, Sweden; and the yENT Department, Lund University Hospital,eden.ss correspondence and reprint requests to Viveka Lyberg �Ahlander, Departmentedics, Phoniatrics and Audiology, University Hospital, SE-221 85 Lund, [email protected] of Voice, Vol. 26, No. 4, pp. e149-e161997/$36.002 The Voice Foundation.1016/j.jvoice.2011.06.005
downs of resources in Sweden. It is often argued that thephysical and psychosocial environments influence voicedisorders in teachers, but there are, as far as we know, onlya few studies that have investigated this relationship.1,19,20
Several studies8,11,21,22 have investigated the relationshipbetween self-reported voice problems in teachers and objectivefindings, primarily laryngeal structures, laryngeal function,and voice quality. They suggest, however, that the relationshipis not all that clear. Rantala et al23–25 investigated therelationship between subjective complaints and objectiveacoustic measures in a group of teachers and reported lackof correlation between the subjective complaints and theobjective measurements. A recent study by Tavares andMartins26 did however indicate a connection between laryngealfindings and reports of hoarseness in a teaching population, andGotaas and Starr27 found voice quality to correlate to reports ofvoice fatigue at certain time points.
Teachers have high occupational voice demands. They needa flexible voice to instruct, discipline, clarify, and attract interestand attention. The increased voice load and the voice load’simpact on the voice are evident when teachers are comparedwith occupational groups with lesser occupational voicedemands.8,11,28 However, commonly, not all the staff ata workplace is affected by voice problems. Thus, the aim ofthe present study is to compare teachers with self-reported voiceproblems to age-, gender-, and school-matched colleagues withself-reported voice health. We relate the self-assessed voicefunction to factors known to influence the voice function: laryn-geal findings, voice quality, personality, and psychosocialcircumstances. In addition, we investigate the teachers’ estima-tion of their voice function and test their hearing, aiming at

Journal of Voice, Vol. 26, No. 4, 2012e150
investigating possible causative factors of voice problems inteachers. The study has a case-control design with the sourcepopulation being the group of teachers investigated in the earlierstudy.1
METHODS AND MATERIALS
Subjects
All participants in the present study were recruited fromthe population of teachers who participated in our earliercross-sectional questionnaire survey.1 The teachers in thecross-sectional study were accessed at regular, prescheduled,compulsory collegial meetings at 22 randomly selectedschools. All the teachers present at the meetings (n¼ 467)were asked to complete a questionnaire on voice, the interplayof the voice with the classroom acoustics, and ambient environ-mental aspects. Planned continuation of the project was ex-plained, and the teachers were asked if they were interestedin participating, and 220 teachers marked their interest on thequestionnaire.
Matching of subjects and controls. In the questionnairestudy,1 the grouping of subjects with voice problems and voicehealthy subjects was based on the subjects’ own ratings oftheir voice problems. The subjects’ rated the statement ‘‘Ihave voice problems’’ (item 32) on a frequency-based scale(0¼ never; 1¼ once in a while; 2¼ sometimes; 3¼ often;and 4¼ always). For further information about the question-naire and survey, the reader can consult ref. 1. One group ofthe subjects for the present study was recruited among the 41teachers who, in the questionnaire study, rated themselves assuffering from voice problems (2–4 on the rating scale) andwho also had agreed to further participation. Because it was im-portant to find pairs of cases and controls working at the sameschool, we searched for possible controls among the subjectswho had assessed themselves as voice healthy (0–1)(n¼ 179) and who worked at the same schools as the voiceaffected cases.
Among the subjects with self-assessed voice problems, onesubject was excluded because of lack of any control at theschool. In addition, two smokers were excluded because itwas not possible to find a gender- and age-matched smokingcontrol at the school. The remaining 38 subjects with self-assessed voice problems were contacted by phone, and theywere informed both orally and in writing about the examinationprocedures. One subject was not possible to reach, and six sub-jects declined to participate. Two subjects had changed occupa-tion and no longer worked as teachers. Four subjects declinedfurther participation because of lack of time or interest. A totalof 31 teachers with voice problems ended up in the study.
For each subject, a control subject (n¼ 31) was selected fromthe same school, among those teachers who had estimated novoice problems in the questionnaire study (n¼ 179). The con-trols were contacted and informed in accordance with the pro-cedure for the case subjects. The pairs were matched for genderand, as closely as possible, for age.
Two paired groups of teachers were thus formed: group I(N¼ 31, 26F/5M) included teachers with self-assessed voice
problems with a mean age of 48.7 years (standard deviation[SD]¼ 10.7) and a median time in occupation of 15 years(range, 1–40); group II (N¼ 31, 26F/5M) had teachers withoutvoice problems with a mean age of 44.6 years (SD¼ 9.9) andmedian time in occupation of 14 years (range, 2–39). All theparticipants had given their written consent to participate inthe study. The pairs came from 12 of the 22 schools from theearlier cross-sectional study.
Examination procedure
The teachers were examined at the Department of Logopedics,Phoniatrics and Audiology at Lund University Hospitalbetween May 2009 and February 2010, 6–9 months after thequestionnaire study.Written information about the examinationprocedures was e-mailed to all teachers before the examinationand was repeated orally by one of the authors (V.L.�A.) at thetime of the examination. All teachers were subjectively freefrom upper airway infections and allergies at the time of theexamination. For most teachers, the examinations were per-formed during ordinary work weeks and after school hours;however, three came for the examination at a day off work;two teachers from the case group and one control. The orderof examinations followed the same routine of voice recordings,laryngeal examination, and last the phonetogram/voice rangeprofile (VRP). There was no fixed order between answeringthe questionnaires and the audiometry.
Recordings and analyses
Larynx and the vocal folds. The teachers underwent exam-ination of the larynx and vocal folds (VFs) with a 70� rigid la-ryngoscope. A digital documentation system (HRES Endocam;Wolf GmbH, Knittlingen, Germany) was used. First, high-resolution mode was used for evaluation of organic lesions, ad-duction, and abduction. In high-speed mode, 2000 frames/swere recorded for male subjects and 4000 frames/s for femalesubjects. These recordings were used to evaluate mode andsymmetry of vibration at the glottic level. Kymograms werecalculated at the midportion of the membraneous VF. The ex-aminations were performed without local anesthetic in 56/62subjects, but in six cases (three subjects and three controls),xylocain spray was used (1–3 doses of 10 mg each). Theseindividuals did not differ from their respective groups by theresults of the examination. All examinations were performedby one of the authors (R.R.), who was unaware of the groupto which each participant belonged to.
Analyses of larynx and VFs. The recordings were codedand randomized. The final evaluation of the recordings wasmade in consensus by two experienced phoniatricians (with29/20 years of experience and also well trained and experienced(11/7 years) in using high-speed imaging in daily clinic)unaware of the grouping of the subjects. Following clinicalpractice, the guidelines by the Committee on Phoniatrics ofthe European Laryngological Society,29 and suggestions byKendall30 for high-speed imaging, a protocol was constructedto assess the following (parentheses refer to the presentationof results):
T
N
(G
P
M
A
A
C
C
M
M
M
M
P
F
F
0
A
Viveka Lyberg �Ahlander, et al Teachers With Self-Reported Voice Problems e151
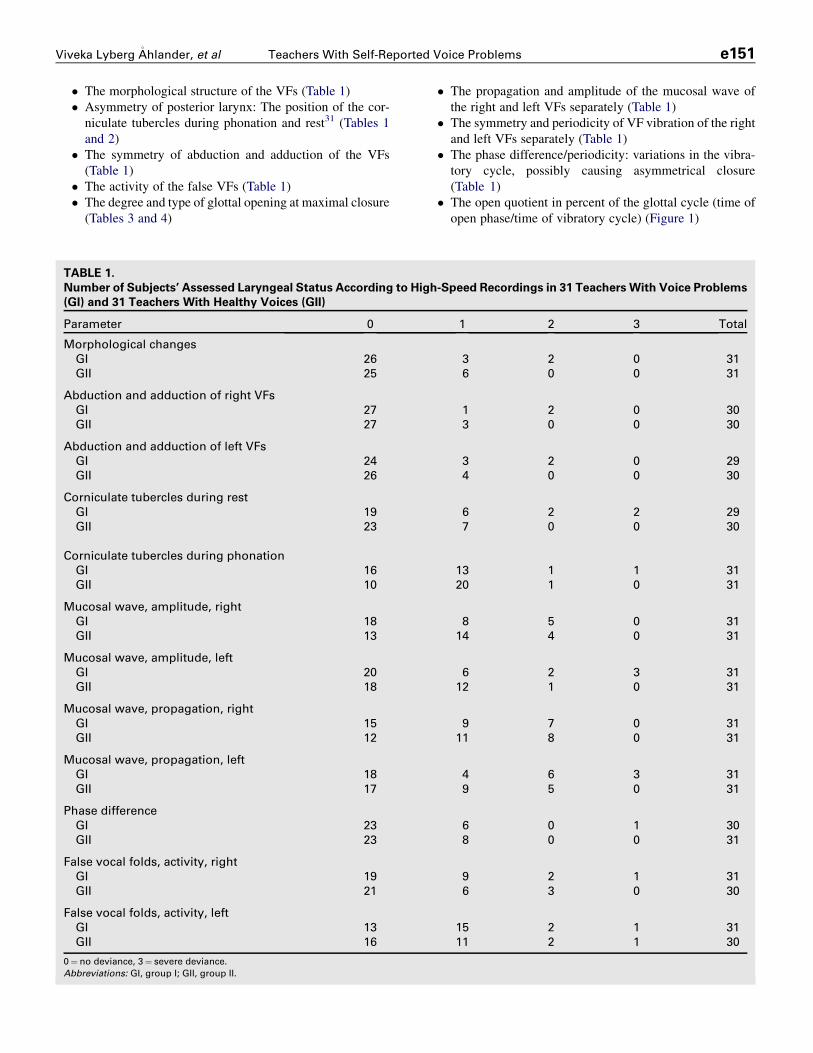
� The morphological structure of the VFs (Table 1)� Asymmetry of posterior larynx: The position of the cor-
niculate tubercles during phonation and rest31 (Tables 1and 2)
� The symmetry of abduction and adduction of the VFs(Table 1)
� The activity of the false VFs (Table 1)� The degree and type of glottal opening at maximal closure
(Tables 3 and 4)
ABLE 1.
umber of Subjects’ Assessed Laryngeal Status According to High
I) and 31 Teachers With Healthy Voices (GII)
arameter 0
orphological changes
GI 26
GII 25
bduction and adduction of right VFs
GI 27
GII 27
bduction and adduction of left VFs
GI 24
GII 26
orniculate tubercles during rest
GI 19
GII 23
orniculate tubercles during phonation
GI 16
GII 10
ucosal wave, amplitude, right
GI 18
GII 13
ucosal wave, amplitude, left
GI 20
GII 18
ucosal wave, propagation, right
GI 15
GII 12
ucosal wave, propagation, left
GI 18
GII 17
hase difference
GI 23
GII 23
alse vocal folds, activity, right
GI 19
GII 21
alse vocal folds, activity, left
GI 13
GII 16
¼ no deviance, 3¼ severe deviance.
bbreviations: GI, group I; GII, group II.
� The propagation and amplitude of the mucosal wave ofthe right and left VFs separately (Table 1)
� The symmetry and periodicity of VF vibration of the rightand left VFs separately (Table 1)
� The phase difference/periodicity: variations in the vibra-tory cycle, possibly causing asymmetrical closure(Table 1)
� The open quotient in percent of the glottal cycle (time ofopen phase/time of vibratory cycle) (Figure 1)
-Speed Recordings in 31 Teachers With Voice Problems
1 2 3 Total
3 2 0 31
6 0 0 31
1 2 0 30
3 0 0 30
3 2 0 29
4 0 0 30
6 2 2 29
7 0 0 30
13 1 1 31
20 1 0 31
8 5 0 31
14 4 0 31
6 2 3 31
12 1 0 31
9 7 0 31
11 8 0 31
4 6 3 31
9 5 0 31
6 0 1 30
8 0 0 31
9 2 1 31
6 3 0 30
15 2 1 31
11 2 1 30

TABLE 2.
Position of the Most Anterior Corniculate Tubercle in 31
Teachers With Voice Problems (GI) and 31 Teachers with
Healthy Voices (GII)
Group/Type of Closure Right Left No Difference Total
GI 8 7 16 31
GII 12 7 11 30
Abbreviations: GI, group I; GII, group II.
TABLE 4.
Number of Subjects With Deviating Pattern of Glottal
Closure in Two Groups of Teachers
Type of Closure 1 2 3 4 Total
GI 2 4 3 9
GII 1 2 3 6
Total 3 6 0 6 15
GI: teachers with voice problems (n¼ 31) and GII: teachers with healthy
voices (n¼ 31). 1: Spindle-shaped incomplete closure, closure at the vocal
processes. 2: Spindle-shaped incomplete closure at the posterior third of
the folds, closure at the vocal processes. 3: Spindle-shaped incomplete
closure at the anterior third of the folds, closure at the vocal processes.
4: Spindle-shaped incomplete closure at the posterior and anterior thirds
of the folds, closure at the vocal processes and at the middle of the mem-
branous portion (‘‘hourglass’’).
Abbreviations: GI, group I; GII, group II.
Journal of Voice, Vol. 26, No. 4, 2012e152
The glottic open phase and phase difference were assessedfrom kymograms. All parameters were judged on a four-pointscale (0, no deviance; 3, severe deviance) except for the degreeof glottal closure, which was judged on a six-point rating scaleaccording to S€odersten and Lindestad32 and the pattern of glot-tal closure, which was also categorized according to S€oderstenand Lindestad32:
� 1. Spindle-shaped incomplete closure, with closure at thevocal processes.
� 2. Spindle-shaped incomplete closure at the posteriorthird of the folds, with closure at the vocal processes.
� 3. Spindle-shaped incomplete closure at the anterior thirdof the folds, with closure at the vocal processes.
� 4. Incomplete closure at the posterior and anterior thirdsof the folds, closure at the vocal processes, and at the mid-dle of the membranous portion (‘‘hourglass’’).
To assess intrarater reliability, eight randomly selected re-cordings were analyzed twice.
Voice. The voice signal was digitized at 16 kHz with 16-bitresolution in a soundproof booth during the reading of a stan-dard text (the North Wind and the Sun) using SoundswellCore 4.0 + Soundswell Voice 4.0 (Hitech Development AB,T€aby, Sweden) and a headworn microphone (MkE2 Sennheiser,www.sennheiser.com), placed 30 cm from the mouth. Becauseof a change of computer equipment, five of the voices wererecorded on MiniDisc (Sony MDS-101), with the same micro-phone. All recordings were made by one of the authors(V.L.�A.).
Perceptual rating of voice quality. The voice recordingswith a total duration of about 45 seconds each were organized
TABLE 3.
Distribution of Assessed Degree of Closure in Two
Groups of Teachers: 31 Teachers With Voice Problems
(GI) and 31 Teachers With Healthy Voices (GII)
Degree of Closure 1 2 3 4 5 6 Total
GI 6 17 5 1 1 1 31
GII 8 10 11 1 1 — 31
Total 14 27 16 2 2 1 62
1–6 denotes increasing degree of incomplete closure.
Abbreviations: GI, group I; GII, group II.
in three differently randomized ‘‘lists’’ so that all 62 voiceswere presented in a different order on each list. A panel of threeexperienced voice pathologists (who had worked for 32, 30, and16 years with voice and voice judgments) rated all voices inconsensus on a visual analog scale (VAS), which was presentedthrough the Spruce listening test: Judge 2.0 (Hitech Medical,T€aby, Sweden). The voices were judged for five parameters,defined according to Hammarberg33: hyperfunction, breathi-ness, vocal fry, hard glottal onsets, and instability. In addition,grade of voice disorder was estimated in analogy with theGrade, Roughness, Breathiness, Asthenia, Strain scale.34 Thechoice of parameters was limited by the number of parameterspossible to present in the Judge application. The judges weregiven written information with instructions to listen to eachvoice at a maximum of three times. They were also instructednot to return to a voice that already had been rated. The judgeswere further instructed to comment on other aspects than thosepresented through the Judge application, and in such cases, add
FIGURE 1. The distribution of subjects’ glottal open phase accord-
ing to kymogram in 31 teachers with voice problems (group I) and 31
teachers with healthy voices (group II). Open quotient defined as per-
centage of vibratory cycle time.

Viveka Lyberg �Ahlander, et al Teachers With Self-Reported Voice Problems e153
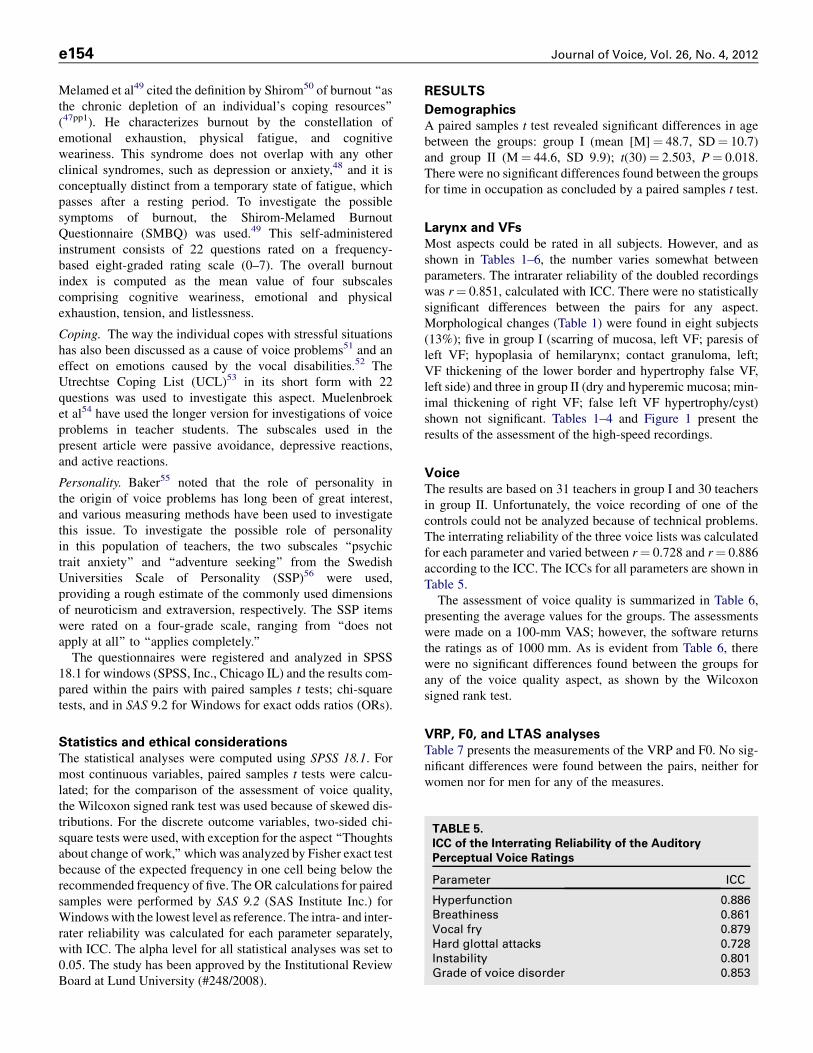
the comments to a protocol. The results were then calculated foroverall differences and intraclass correlation coefficients(ICCs).
Voice range profile. A maximum phonetogram (VRP) wasperformed with the teacher standing in front of a laptopcomputer and recorded on a real-time phonetograph Phog 2.5(Hitech Medical, T€aby, Sweden) with a headworn microphone(AKG C420) at a distance of 7 cm from the lips. The phoneto-gram (VRP) was always recorded last during the examinationprocess to avoid possible laryngeal fatigue.
According to the guidelines by the European Union of Pho-niatricians,29 the signal was corrected to equal 30-cm distancefrom the mouth. The teachers phonated with glissandos on thevowel /a/ trying to cover as large an area as possible infrequency and sound pressure level (SPL) with connected con-tours. The teachers started at a habitual fundamental frequencygliding downward to the softest phonation and thereafter, keep-ing as soft a phonation as possible, working upward through thefrequency range toward the highest possible frequency. Theprocedure was then repeated in loud voice. When this was com-pleted, the teacher was asked to fill out blank spots and try to‘‘connect’’ the contours. The teachers were free to take thetime they needed to complete the VRP. The glissando was prac-ticed a few times before the recording started. All instructionsand prompting were carried out by the same author (V.L.�A.).
The analysis of the VRP followed the procedure describedin Ma et al.35 All VRPs were measured by the same author(V.L.�A.). Four boundary points were analyzed for each record-ing: the highest frequency, lowest frequency, and maximumand minimum intensity. The maximum area, insemitones 3 decibels, and the frequency ranges were automat-ically calculated by the Phog 2.5 software.
Analyzes of F0 and long-time average spectrum. Thesound files were explored with the help of Soundswell Voice,and the fundamental frequency was calculated for each voice.A long-time average spectrum (LTAS) was made to obtain in-formation on the voice source, in particular the tilt of thesource spectrum.36 For the analysis, silence and periods of un-voiced sounds were eliminated. For the latter, a comparisonwas made of the spectral levels below and above 1 kHz. Ifthe lower frequency band dominated a frame, this frame wasretained as voiced; otherwise, it was discarded. The ratio ofenergy in the frequency bands 0–1 and 1–5 kHz was calcu-lated. This measure provides information on the tilt of thesource spectrum, that is, how rapidly the amplitude of thehigher partials decreases. The second one was the energy inthe frequency band 5–8 kHz. A large amount of energy inthis band can be a sign of noise because of an incomplete glot-tal closure.37
Audiometry. Audiograms were obtained by the same audi-ologist. The equipment used was a GSI16 (Grason-StadlerInc., Madison, WI) audiometer together with one pair of Tele-phonics TDH-39P supraaural earphones with MX-41/ARcushions. The equipment was calibrated in accordance withIEC 60318-338 and ISO 389-1.39 Test stimuli were pure tonesof 1–2 seconds’ duration (35-ms rise and fall times). The
following test order was used: 1000, 1500, 2000, 3000,4000, 6000, 8000, 500, 250, and 125 Hz. Audiometry was con-ducted in accordance with ISO 8253-140 using the manual de-scending technique (�10/+5 dB). The threshold was defined asthe lowest level, where three responses had been recorded. Thetest was performed in a double-walled soundproof booth(complying with the maximum permissible ambient SPL asspecified in ISO 8252-1) during one session.40 The mean valueof 500, 1000, 2000, 4000 Hz was calculated for each ear. TheSPLs for 3000, 4000, and 6000 Hz were also analyzedseparately.
Subjective assessments
Questionnaires. Voice handicap, self-assessment of voice,voice- and teaching-related aspects, and environment. Theteachers were asked to complete the Voice Handicap Index-Throat (VHI-T),41 which consists of the original three VHIsubscales (physical, functional, and emotional aspects onvoice problems)42 along with a subscale on throat-relatedproblems (see the Appendix for the statements of the throatsubscale). Each subscale consists of 10 statements, and theoccurrence of symptoms is estimated on a frequency-basedscale (0¼ never, 1¼ almost never, 2¼ sometimes, 3¼ almostalways, 4¼ always). Each subscale might be summed to40 points and the total of the VHI-T might thus be 160 p. A100-mm VAS was included for the teachers to mark theirperception of their current voice status. The VA-scale waslabeled with ‘‘no voice problems’’ resp. ‘‘maximum voiceproblems at its ends. In addition, the subjects were askedabout demographics and teaching circumstances (posture,native tongue, and the language(s) of the students); voiceproblems during teaching (frequency of voice problems, timeof voice recovery, if problems occur with or withouta simultaneous cold), and teaching environment (changesmade in teaching style or teaching environment because ofvoice problems and smell in classroom). These questionswere answered on a separate questionnaire.
Demand, control, and support. Aspects related to work weremeasured with the Job Content Questionnaire (JCQ). TheJCQ is a self-administrated instrument designed to measuresocial and psychological characteristics of work according tothe high demand/low control model of job strain developmentand covering issues relevant to work demands, such asdecision making, social interaction, and so on.43,44
The 26 questions, rated on a four-graded rating scale(1¼ disagrees completely, 4¼ agrees completely), comprisethe dimensions of job control, demands, and support. The jobdemands, control, and support variables are further dichoto-mized into high and low categories based on current meansfrom a large population study.45 JCQ has been widely usedfor research. At least 70 publications are presented up to date;however, only two in teachers46,47 and none in relation tovoice problems. The JCQ has been translated and assessed forstability in 23 languages until today.43
Burnout or exhaustion disorder. A frequently discussed prob-lem in the society today is burnout or exhaustion disorder.48
Journal of Voice, Vol. 26, No. 4, 2012e154
Melamed et al49 cited the definition by Shirom50 of burnout ‘‘asthe chronic depletion of an individual’s coping resources’’(47pp1). He characterizes burnout by the constellation ofemotional exhaustion, physical fatigue, and cognitiveweariness. This syndrome does not overlap with any otherclinical syndromes, such as depression or anxiety,48 and it isconceptually distinct from a temporary state of fatigue, whichpasses after a resting period. To investigate the possiblesymptoms of burnout, the Shirom-Melamed BurnoutQuestionnaire (SMBQ) was used.49 This self-administeredinstrument consists of 22 questions rated on a frequency-based eight-graded rating scale (0–7). The overall burnoutindex is computed as the mean value of four subscalescomprising cognitive weariness, emotional and physicalexhaustion, tension, and listlessness.
Coping. The way the individual copes with stressful situationshas also been discussed as a cause of voice problems51 and aneffect on emotions caused by the vocal disabilities.52 TheUtrechtse Coping List (UCL)53 in its short form with 22questions was used to investigate this aspect. Muelenbroeket al54 have used the longer version for investigations of voiceproblems in teacher students. The subscales used in thepresent article were passive avoidance, depressive reactions,and active reactions.
Personality. Baker55 noted that the role of personality inthe origin of voice problems has long been of great interest,and various measuring methods have been used to investigatethis issue. To investigate the possible role of personalityin this population of teachers, the two subscales ‘‘psychictrait anxiety’’ and ‘‘adventure seeking’’ from the SwedishUniversities Scale of Personality (SSP)56 were used,providing a rough estimate of the commonly used dimensionsof neuroticism and extraversion, respectively. The SSP itemswere rated on a four-grade scale, ranging from ‘‘does notapply at all’’ to ‘‘applies completely.’’
The questionnaires were registered and analyzed in SPSS18.1 for windows (SPSS, Inc., Chicago IL) and the results com-pared within the pairs with paired samples t tests; chi-squaretests, and in SAS 9.2 for Windows for exact odds ratios (ORs).
TABLE 5.
ICC of the Interrating Reliability of the Auditory
Perceptual Voice Ratings
Parameter ICC
Hyperfunction 0.886
Breathiness 0.861
Vocal fry 0.879
Hard glottal attacks 0.728
Instability 0.801
Grade of voice disorder 0.853
Statistics and ethical considerations
The statistical analyses were computed using SPSS 18.1. Formost continuous variables, paired samples t tests were calcu-lated; for the comparison of the assessment of voice quality,the Wilcoxon signed rank test was used because of skewed dis-tributions. For the discrete outcome variables, two-sided chi-square tests were used, with exception for the aspect ‘‘Thoughtsabout change of work,’’ which was analyzed by Fisher exact testbecause of the expected frequency in one cell being below therecommended frequency of five. The OR calculations for pairedsamples were performed by SAS 9.2 (SAS Institute Inc.) forWindowswith the lowest level as reference. The intra- and inter-rater reliability was calculated for each parameter separately,with ICC. The alpha level for all statistical analyses was set to0.05. The study has been approved by the Institutional ReviewBoard at Lund University (#248/2008).
RESULTS
Demographics
A paired samples t test revealed significant differences in agebetween the groups: group I (mean [M]¼ 48.7, SD¼ 10.7)and group II (M¼ 44.6, SD 9.9); t(30)¼ 2.503, P¼ 0.018.There were no significant differences found between the groupsfor time in occupation as concluded by a paired samples t test.
Larynx and VFs
Most aspects could be rated in all subjects. However, and asshown in Tables 1–6, the number varies somewhat betweenparameters. The intrarater reliability of the doubled recordingswas r¼ 0.851, calculated with ICC. There were no statisticallysignificant differences between the pairs for any aspect.Morphological changes (Table 1) were found in eight subjects(13%); five in group I (scarring of mucosa, left VF; paresis ofleft VF; hypoplasia of hemilarynx; contact granuloma, left;VF thickening of the lower border and hypertrophy false VF,left side) and three in group II (dry and hyperemic mucosa; min-imal thickening of right VF; false left VF hypertrophy/cyst)shown not significant. Tables 1–4 and Figure 1 present theresults of the assessment of the high-speed recordings.
Voice
The results are based on 31 teachers in group I and 30 teachersin group II. Unfortunately, the voice recording of one of thecontrols could not be analyzed because of technical problems.The interrating reliability of the three voice lists was calculatedfor each parameter and varied between r¼ 0.728 and r¼ 0.886according to the ICC. The ICCs for all parameters are shown inTable 5.The assessment of voice quality is summarized in Table 6,
presenting the average values for the groups. The assessmentswere made on a 100-mm VAS; however, the software returnsthe ratings as of 1000 mm. As is evident from Table 6, therewere no significant differences found between the groups forany of the voice quality aspect, as shown by the Wilcoxonsigned rank test.
VRP, F0, and LTAS analyses
Table 7 presents the measurements of the VRP and F0. No sig-nificant differences were found between the pairs, neither forwomen nor for men for any of the measures.

TABLE 6.
Mean Values of Voice Parameter Judgments for 30
TeachersWith Voice Problems (GI) and 31 TeachersWith
Healthy Voices (GII), Assessed on a 1000-mm VAS (See
Text for Further Details)
Parameter
GI GII
Mean (SD) Mean (SD)
Hyperfunction 46 (98) 61 (106)
Breathiness 95 (128) 45 (67)
Vocal fry 67 (69) 103 (101)
Hard glottal attacks 23 (62) 13 (18)
Instability 11 (29) 8 (37)
Grade of voice disorder 78 (124) 65 (65)
Abbreviations: GI, group I; GII, group II.
Viveka Lyberg �Ahlander, et al Teachers With Self-Reported Voice Problems e155
Audiometry
The results of the audiograms are based on audiograms from 22teachers from group I and 29 controls from group II. The differ-ence in number of obtained audiograms was because of unfor-tunate logistic complications. Thus, a groupwise comparisonwas made. There were no significant differences between thegroups at any other level. Tinnitus was reported by seven per-sons; three in group I and four in group II. The use of hearingaid was reported by three participants; two in group I and onein group II.
Questionnaires
VHI-T, self-assessment of voice problems, and VAS
judgment. The paired samples t test revealed statistically sig-nificant differences for all four subscales of the VHI-T and forVHI-T total. The results are summarized in Table 8.
The teachers rated their overall voice problems on a 100-mmVAS. A paired samples t test revealed significant differencesbetween the groups, group I (M¼ 34, SD¼ 23.0) and groupII (M¼ 13, SD¼ 16.3); t(25)¼ 4.890, P� 0.001, OR¼ 1.12.
For the frequency of occurrence of voice problems, a chi-square test showed significant differences between the two
TABLE 7.
Values of VRPs and F0 in Running Speech: Area dB (Semitones
Maximum F0 (Hertz), F0 in Running Speech for Women and Me
Task Measurements F,
VRP Area Area 82
F0 statistics F0 36
Min F0 11
Max F0 100
SPL statistics SPL 6
Min dB 5
Max dB 9
Running speech F0 20
Teachers with voice problems (GI) and teachers without voice problems (GII). (M
Abbreviations: GI, group I; GII, group II; F, female; M, male; dB, decibel; Min, min
* Running speech: n¼ 25, see text.
groups: c2 (5, n¼ 60)¼ 20.138, P¼ 0.01, OR¼ 3.99, the ORindicating that teachers with voice problems were close tofour times as likely to rate a high frequency of voice problems.The occurrence of voice problems is shown in Table 9. Therewere also significant differences between the groups for voiceproblems occurring without a concurrent upper airway infec-tion, c2 (2, n¼ 60)¼ 18.670, P¼ 0.0008, OR¼ 3.60, as shownin Table 10.
A chi-square test also revealed significant differencesbetween the groups for the time span for voice recovery, c2
(7, n¼ 60)¼ 17.608, P¼ 0.014, cf. Table 11 with OR¼ 2.03.
Teaching- and environmentally related issues. Fisherexact test showed differences (P¼ 0.029) between the case-control pairs for considerations about changing occupation be-cause of voice problems, where 18% in group I had considereda change of occupation but none in group II, OR¼ 2.03. No fur-ther differences were found within the pairs for either social sta-tus, number of children, age, or time in occupation. Nor werethere any differences in most teaching-related aspects. Mostteachers taught in their native language and stood up duringteaching. Most students were speaking the same language asthe teacher. Similarly, there were no differences in changes inteaching methods or teaching environment because of possiblevoice problems.
Control-demand-support, burnout, coping, and per-
sonality. No differences were found within the pairs forsymptoms of burnout syndrome (SMBQ), personality traits(SSP), or coping strategies (UCL) using paired samples t tests.The mean values for SMBQ-global were group I¼ 2.7(SD¼ 1.0) and group II¼ 2.5 (SD¼ 1.1), which can be com-pared with reference scores of 3.2 for females and 2.9 for malesin a Swedish healthy population.57 However, among the threemain dimensions (job demand, control, and support) of theJCQ, significant differences were found for the subscale ‘‘jobcontrol’’: group I (M¼ 3.48, SD¼ 0.20) and group II(M¼ 3.27, SD¼ 0.29), t(28)¼ 3.047, P¼ 0.005. The ratingsof job demand and job support showed no statistical differences.Job demand: group I (M¼ 2.84, SD¼ 0.51) and group II
3 dB), Minimum and Maximum dB, Minimum and
n in Two Groups of Teachers
GI GII
N¼ 26 M, N¼ 5 F, N¼ 26* M, N¼ 5
8 (254) 822 (246) 868 (198) 906 (131)
2 (67) 230 (44) 370 (54) 230 (31)
8 (18) 73 (13) 115 (19) 67 (11)
4 (277) 750 (221) 1006 (204) 666 (146)
9 (7) 70 (8) 69 (4) 72 (4)
0 (4) 56 (18) 48 (3) 50 (4)
4 (9) 94 (11) 93 (7) 98 (7)
3 (21) 131 (12) 199 (13) 127 (12)
ean and SD).
imum; Max, maximum.

TABLE 8.
Mean and t and P Values for Paired Samples t test Along With ORs for VHI-T in Two Groups of Teachers: Teachers With
Voice Problems (GI, N¼ 31) and Teachers Without Voice Problems (GII, N¼ 31)
Subscale
GI GII
t(df) P ORM (SD) M (SD)
Throat 15.3 (5.9) 8.7 (5.0) 5.451 (29) 0.0001 1.43
Physical 13.8 (8.6) 6.7 (6.6) 4.394 (29) 0.0001 1.27
Functional 8.5 (7.0) 2.5 (3.6) 4.199 (29) 0.0001 1.26
Emotional 9.0 (9.5) 1.7 (3.2) 4.248 (29) 0.0002 2.03
VHI-T total 46.7 (22.2) 19.3 (15.0) 6.406 (29) 0.0005 1.93
Abbreviations: GI, group I; GII, group II.
Journal of Voice, Vol. 26, No. 4, 2012e156
(M¼ 2.72, SD¼ 0.45), t(28)¼ 0.946, P¼ 0.352; job support:group I (M¼ 3.79, SD¼ 0.35) and group II (M¼ 3.78,SD¼ 0.06), t(28)¼ 3.047, P¼ 0.888.
As shown by the t test, the ratings of ‘‘job demands’’ are mod-erately and equally high in both groups, whereas ‘‘job control’’is significantly higher in group I. The JCQ results were summa-rized through combinations of the dichotomized ratings of thethree main dimensions (demand, control, and support) to definea specific work situation. High demands and low control aredefined as ‘‘job strain,’’ high demands and high control formthe category ‘‘active,’’ low demands and low control are definedas ‘‘passive,’’ and low demands and high control form the cate-gory ‘‘relaxed.’’ In addition, low support (support from col-leagues and management) in combination with ‘‘job strain’’ isdefined as ‘‘isostrain,’’ a particularly unfavorable work situa-tion. Table 12 shows the distribution of the subjects accordingto this classification. A larger number of teachers from groupI are found in the ‘‘active’’ category, where a combination ofhigh demands and high control is represented, whereas moreteachers in group II are found in ‘‘job strain’’ category becauseof ratings of high demands and low control. However, the chi-square and Fisher exact test showed no significant differences injob strain (P¼ 0.056) between the groups. Isostrain was notfound for any teacher.
Correlations
Correlations were computed with Spearman’s rho for aspectsthat could be expected to correlate: frequency of symptoms,voice quality ratings, age, morphological findings, and recoverytime. Almost all correlations were below 0.5 for most aspects.These are weak-to-moderate correlations and are thus not pre-sented. However, in individuals from group I who had deviant
TABLE 9.
Occurrence of Voice Problems in Two Groups of Teachers
Percent
No Voice
Problem Every Year
Less Than
Once a Month O
GI (N¼ 31) 0 32 6
GII (N¼ 29) 34 41 7
Teachers with voice problems (GI) and teachers without voice problems (GII).
Abbreviations: GI, group I; GII, group II.
morphological laryngeal structure (top row in Table 1), the cor-relations between the rating of morphological structure andgrade, VHI-T, and recovery time were structure and grade:0.577; structure and recovery time: 0.866, and structure andVHI-T: 0.881. Grade, VHI-T, and recovery time for the controlswith remarks on laryngeal structure did not correlate.
DISCUSSION
Voice function is a complex phenomenon and has an undispu-table relation to the voice load and occupational demands. Asfar as we know, this study differs from earlier studies with re-spect to the matching of the participants. To isolate the possibleinfluences from environment and the persons’ behavior in theclassroom, we selected gender- and age-matched pairs fromthe same schools and examined differences in their laryngeal,vocal, hearing, and psychosocial aspects. By selecting subjectsfrom the same schools, we wanted to control the influence fromthe work environment. Overall, the present results show verysmall differences within the pairs. The most noteworthy differ-ences are the findings of VHI-T and the time it takes to recoverfrom voice problems. Apart from these differences, there wereno statistically significant differences in structure or functionthat may explain why the teachers who do have voice problemsactually have them in contrast to their peers. The results mightindicate that the differences would be more clear in action, thatis, in the teaching situation. The present article aimed at inves-tigating the subjects’ medical/functional characteristics to clar-ify their relation to the reports of voice problems/voice health.The selection of the case-control pairs in this study was based
on the teachers’ own assessment of the statement ‘‘I have voiceproblems’’ in the earlier questionnaire survey.1 The definition of
More Than
nce a Month Every Week Every Day Percentage
26 19 16 100
14 3 0 100

TABLE 10.
Occurrence of Voice Problems in Teachers Who Have Voice Problems Without a Simultaneous Upper Airway Infection
Group Every Year Less Than Once a Month More Than Once a Month Every Week Every Day Percentage
GI (N¼ 26) 27 (7) 4 (1) 27 (7) 23 (6) 19 (5) 100 (26)
GII (N¼ 10) 40 (4) 20 (2) 30 (3) 0 10 (1) 100 (10)
Teachers with voice problems (GI) and teachers without voice problems (GII), in percentage.
Abbreviations: GI, group I; GII, group II.
Viveka Lyberg �Ahlander, et al Teachers With Self-Reported Voice Problems e157
‘‘voice problem’’ is thus based on the individuals’ conception oftheir ownvoice. Despite the large number of studies of teachers’voices today, there is still no consensus about the criteria fordefining a voice disorder.58 Commonly, the definition hasbeen based on the number and frequency of symptoms of voicedisorders5,8,21 or on the clinician’s observations of laryngealfindings or on remarks on the voice quality.21,22 The questionof the individual’s perception of the symptoms has seldombeen raised. In analogy with others, our results show thateven the teachers who assess themselves as being voicehealthy report a number of symptoms. There were as manymorphological laryngeal findings in the controls as in thegroup of teachers with voice problems. However, the controlsubjects obviously do not view their voice symptoms—or theeffect of them—severe enough to call them problematic. Notbeing aware of a functional deficiency, because of not havingbeen exposed to higher vocal demands, might also contributeto the rating. We thus consider it to be very important toinclude the subjects’ own conception of the voice function,not least in clinic. According to Deary et al15p374: People’s rat-ings of their symptoms are an important guide in gauging theseverity of medical disorders and are specially useful in assess-ing the response to treatment.’’
Time aspects might have brought bias into the results.Between 6 and 9 months elapsed between the questionnairestudy1 and the present investigation. We think this is unlikely,however, because the present reports of voice function by thetwo groups are almost identical to those in the questionnairestudy.1
The teachers’ motives for participating in the study are notknown. However, the selection can be considered to be reason-ably free from bias because the selection of both cases and con-trols was madewithin a group of teachers who rated their voicesand voice problems during compulsory meetings. Thus, there isno reason to believe that the teachers attended the meeting outof special interest in their voice.
TABLE 11.
Time for Recovery From Voice Problems in Two Groups of Tea
Without Voice Problems (GII), in Percent
Group
No Voice
Problem
One Hour
or Less
A Couple
of Hours Over
GI (N¼ 31) 0 13 10 2
GII (N¼ 29) 34 17 7 2
Abbreviations: GI, group I; GII, group II.
Laryngeal findings
High-speed digital imaging was used for the laryngeal exami-nations. One reason is that this is the current standard techniqueat our department and another one is that it is a new tool in thevoice clinic, and there is thus a need of compiling normativedata from high-speed examinations.59 Kendall30 concludesthat the use of high-speed filming offers benefits over standardvideostroboscopy for studying aperiodic VF motion, which isoften thought to be a contributing factor in voice disorders.All subjects could be examined because of the short durationof the examination. Because of the high frame rate (2000 formales and 4000 in females), only a very short sequence isneeded. There is not yet any gold standard for the assessmentof high-speed digital image recordings.
Most subjects in our study were found to be medically nor-mal in all laryngeal aspects. There were findings of asymmetryand structural deviations but without any significant differenceswithin the matched pairs. The importance of asymmetrical VFadduction movements as an explanatory factor in voice disor-ders has been long discussed.31 Lindestad et al found that laryn-geal adduction asymmetries were frequent in normal voices(Ibid.) but no findings of morphological deviations arementioned.
It is, however, no surprise that there are no differences be-tween the groups. Most studies that have included laryngeal ex-aminations in investigations of teachers’ voices have beenunable to establish a connection between the laryngeal statusand the subjective symptoms: Urrutikoetxea et al4 examined1046 teachers and found structural deviations in 20.8%. Ilom€akiet al21 found severe organic changes in 14% of the 78 preschoolteachers investigated. Sala et al8 made organic findings in 29%of 262 teachers. None of these studies found a correlation be-tween laryngeal findings and subjective symptoms of voice dis-orders. So, does a laryngeal deviation have no impact on vocalbehavior? There is firm clinical evidence about such a relation-ship, but little is known about an individual’s capacity to cope
chers, Teachers With Voice Problems (GI) and Teachers
Night Weekend Holiday Never Percentage
7 23 17 10 100
4 7 10 0 100
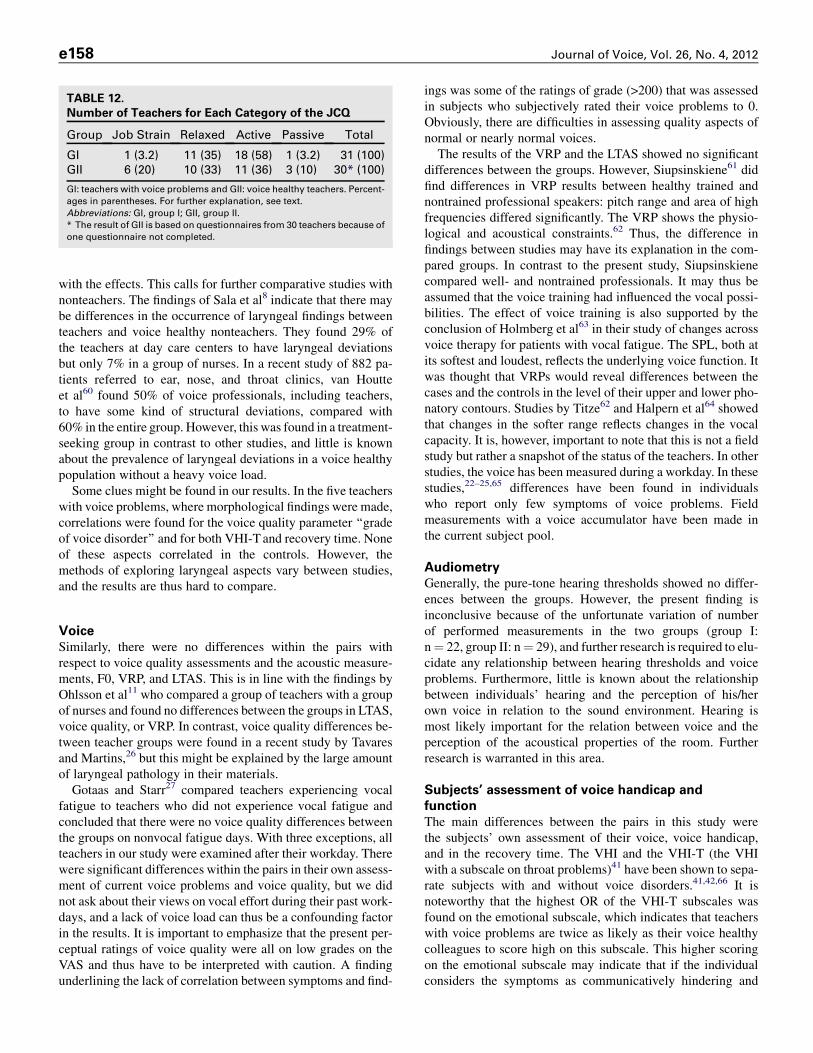
TABLE 12.
Number of Teachers for Each Category of the JCQ
Group Job Strain Relaxed Active Passive Total
GI 1 (3.2) 11 (35) 18 (58) 1 (3.2) 31 (100)
GII 6 (20) 10 (33) 11 (36) 3 (10) 30* (100)
GI: teachers with voice problems and GII: voice healthy teachers. Percent-
ages in parentheses. For further explanation, see text.
Abbreviations: GI, group I; GII, group II.
* The result of GII is based on questionnaires from 30 teachers because of
one questionnaire not completed.
Journal of Voice, Vol. 26, No. 4, 2012e158
with the effects. This calls for further comparative studies withnonteachers. The findings of Sala et al8 indicate that there maybe differences in the occurrence of laryngeal findings betweenteachers and voice healthy nonteachers. They found 29% ofthe teachers at day care centers to have laryngeal deviationsbut only 7% in a group of nurses. In a recent study of 882 pa-tients referred to ear, nose, and throat clinics, van Houtteet al60 found 50% of voice professionals, including teachers,to have some kind of structural deviations, compared with60% in the entire group. However, this was found in a treatment-seeking group in contrast to other studies, and little is knownabout the prevalence of laryngeal deviations in a voice healthypopulation without a heavy voice load.
Some clues might be found in our results. In the five teacherswith voice problems, where morphological findings were made,correlations were found for the voice quality parameter ‘‘gradeof voice disorder’’ and for both VHI-Tand recovery time. Noneof these aspects correlated in the controls. However, themethods of exploring laryngeal aspects vary between studies,and the results are thus hard to compare.
Voice
Similarly, there were no differences within the pairs withrespect to voice quality assessments and the acoustic measure-ments, F0, VRP, and LTAS. This is in line with the findings byOhlsson et al11 who compared a group of teachers with a groupof nurses and found no differences between the groups in LTAS,voice quality, or VRP. In contrast, voice quality differences be-tween teacher groups were found in a recent study by Tavaresand Martins,26 but this might be explained by the large amountof laryngeal pathology in their materials.
Gotaas and Starr27 compared teachers experiencing vocalfatigue to teachers who did not experience vocal fatigue andconcluded that there were no voice quality differences betweenthe groups on nonvocal fatigue days. With three exceptions, allteachers in our study were examined after their workday. Therewere significant differences within the pairs in their own assess-ment of current voice problems and voice quality, but we didnot ask about their views on vocal effort during their past work-days, and a lack of voice load can thus be a confounding factorin the results. It is important to emphasize that the present per-ceptual ratings of voice quality were all on low grades on theVAS and thus have to be interpreted with caution. A findingunderlining the lack of correlation between symptoms and find-
ings was some of the ratings of grade (>200) that was assessedin subjects who subjectively rated their voice problems to 0.Obviously, there are difficulties in assessing quality aspects ofnormal or nearly normal voices.The results of the VRP and the LTAS showed no significant
differences between the groups. However, Siupsinskiene61 didfind differences in VRP results between healthy trained andnontrained professional speakers: pitch range and area of highfrequencies differed significantly. The VRP shows the physio-logical and acoustical constraints.62 Thus, the difference infindings between studies may have its explanation in the com-pared groups. In contrast to the present study, Siupsinskienecompared well- and nontrained professionals. It may thus beassumed that the voice training had influenced the vocal possi-bilities. The effect of voice training is also supported by theconclusion of Holmberg et al63 in their study of changes acrossvoice therapy for patients with vocal fatigue. The SPL, both atits softest and loudest, reflects the underlying voice function. Itwas thought that VRPs would reveal differences between thecases and the controls in the level of their upper and lower pho-natory contours. Studies by Titze62 and Halpern et al64 showedthat changes in the softer range reflects changes in the vocalcapacity. It is, however, important to note that this is not a fieldstudy but rather a snapshot of the status of the teachers. In otherstudies, the voice has been measured during a workday. In thesestudies,22–25,65 differences have been found in individualswho report only few symptoms of voice problems. Fieldmeasurements with a voice accumulator have been made inthe current subject pool.
Audiometry
Generally, the pure-tone hearing thresholds showed no differ-ences between the groups. However, the present finding isinconclusive because of the unfortunate variation of numberof performed measurements in the two groups (group I:n¼ 22, group II: n¼ 29), and further research is required to elu-cidate any relationship between hearing thresholds and voiceproblems. Furthermore, little is known about the relationshipbetween individuals’ hearing and the perception of his/herown voice in relation to the sound environment. Hearing ismost likely important for the relation between voice and theperception of the acoustical properties of the room. Furtherresearch is warranted in this area.
Subjects’ assessment of voice handicap and
function
The main differences between the pairs in this study werethe subjects’ own assessment of their voice, voice handicap,and in the recovery time. The VHI and the VHI-T (the VHIwith a subscale on throat problems)41 have been shown to sepa-rate subjects with and without voice disorders.41,42,66 It isnoteworthy that the highest OR of the VHI-T subscales wasfound on the emotional subscale, which indicates that teacherswith voice problems are twice as likely as their voice healthycolleagues to score high on this subscale. This higher scoringon the emotional subscale may indicate that if the individualconsiders the symptoms as communicatively hindering and

Viveka Lyberg �Ahlander, et al Teachers With Self-Reported Voice Problems e159
even embarrassing, (s)he is more apt to consider the symptomsproblematic.
Furthermore, the discrepancy within the pairs in terms of therecovery time from voice symptoms after vocal load is veryinteresting. Similar findings were made by Sala et al8 wherethe day care center teachers reported a longer time for the symp-toms to disappear than the group of nurses. This might indicatemicrostructural changes in the larynx that we are not able todetect with today’s technology. Further studies are warrantedin the area of vocal recovery/vocal loading in and duringteaching.
Control-demand-support, burnout, coping, and
personality
There is an increasing number of studies linking psychologicalfactors to functional dysphonia.15,67 These factors includehigher levels of anxiety, lower levels of sense of control,quality of life, and coping.15,16,18 Roy et al68 found that mostpeople with functional dysphonia were introverts. Anderssonand Schal�en17 noted that interpersonal conflicts related to fam-ily and work were one of the important contributing factors inpsychogenic voice disorders, and Gassull et al51 found in a re-cent study that teachers with voice problems were highly reac-tive to stress.
We used a battery of questionnaires to investigate thoseaspects that have been found to contribute to the etiology ofdysphonia and also the JCQ to cover aspects of demand-control-support. The JCQ was the only scale that showedsome differences between the groups. The underlying theoryof the JCQ is that a combination of high demands and low con-trol/low support causes job strain, which is defined as harmful.That is, when there is a combination of high psychologicaldemands and a low worker’s decision latitude, there is anincreased risk of harmful job strain. If the social support atthe workplace is low, this further increases the risk. However,the active or passive behavior of the employee needs to be takeninto account. An active behavior gives rise to ‘‘good stress,’’predicting motivation, new learning behavior, and new copingstrategies.43 The differences within the pairs did not supportthe hypothesis of a higher degree of job strain (high demandsand low control) in the teachers with voice problems. Instead,the results showed that both groups rated high degrees of jobdemands and job support but differed in the aspect of job con-trol, where the group with voice problems rated significantlyhigher values.
The results may be because of a selection bias. In the ques-tionnaire study, we asked the respondents whowanted to furthertake part of the project to mark this on the questionnaire. Thismay have caused the more active teachers with feelings of con-trol of their social life and work situation to step forward. Thenondifference within the pairs may also depend on the normal-ity of the data, as there were no large differences in any scale ascompared with a normal population. Buck et al69 found differ-ences between groups of dysphonics, functional versus organic,but only a minority (17%) of patients in the functional groupshowed clinically significant levels of psychological distress.The difference between the present study and others might
also be because of the use of different instruments. We useda battery of tests that have been developed for a Swedish pop-ulation (SSP)56 or had been tried and on a Swedish population(JCQ and SMBQ).43,50 The UCL, measuring coping, has beenused in teachers with voice problems.54 It was, howevera time-consuming battery of tests that took the most part ofthe examination to complete. There is no consensus aboutwhich questionnaire/questionnaires to use for investigatingpsychological factors in dysphonic patients or in researchgroups, and further studies are thus warranted in this area. How-ever, for the investigation of work-related issues, we found thejob content model very useful and thus recommend it for furtherinvestigations of work-related dimensions in connection tovoice problems.
CONCLUSION
For the two groups in this study, the main differences werefound for the VHI-T and recovery time after voice problems.Thus, the combination of the number of symptoms and ofhow often the symptoms occur, along with the time it takes torecover, seems to underlie the individual’s perception of thevoice problem. The results also underline the importance ofinvestigating the individual’s view of the severity of the voicedysfunction. It is, furthermore, important to consider that theinclusion of the subjects was based on their own assessmentof their voice function. The teachers with voice problemswere not referred to a voice clinic as voice patients. The con-trols exist in the same surrounding with the same kind of exter-nal voice load. Why, then, do the controls not report voiceproblems? A speculation might be that when rating the state-ment ‘‘I have problems with my voice’’ one’s daily voice useis included in this consideration. As clinicians, we base ourjudgment on what is seen or heard at the examinations we per-form in clinic. What is seen or heard might not be representativeof what actually happens when the subjects act in their dailylife. The difference between teachers with or without voiceproblems might thus be the reaction to the teaching situation,where the voice is exposed to a number of different and interact-ing loading factors. The results from the questionnaire study1
support this line of reasoning. The subjects who rated them-selves as having a voice problem were significantly more react-ing to most vocally loading factors as compared with the voicehealthy (self-assessed) subjects.
The main conclusion of this study is that the cause of voicedysfunction in the group of teachers with self-reported voiceproblems is not found in the vocal apparatus or within the indi-vidual. It may instead be found in the interplay of the individ-ual’s behavior and the work environment that we plan tostudy in a future project.
Future research
It is important to record voice use in the daily communicativesetting. Thus, a field study has been carried out of voice use dur-ing teaching in 14 voice-affected teachers and their 14 age- andgender-matched voice healthy peers.
Journal of Voice, Vol. 26, No. 4, 2012e160
Acknowledgment
The kind and persistent cooperation of the teachers is gratefullyacknowledged. We are greatly indebted to Associate ProfessorKai €Osterberg, Division of Occupational and EnvironmentalMedicine, Lund University for kind and generous guiding andassistance with choice and interpretation of the instrumentsmeasuring psychological and psychosocial aspects. We alsolike to express our thanks to Audiologist, Ingrid Lennart,MSc, for performing the audiometry and to Audiologist,Jonas Br€annstr€om, PhD, for valuable comments on the manu-script. This work was founded by grants from AFA Insurance,Stockholm, Sweden.
REFERENCES1. �Ahlander VL, Rydell R, L€ofqvist A. Speaker’s comfort in teaching environ-
ments: voice problems in Swedish teaching staff. J Voice. 2011;25:
430–440.
2. Fritzell B. Voice disorders and occupations. Logoped Phoniatr Vocol. 1996;
21:7–12.
3. Titze IR, Lemke J, Montequin D. Populations in the U.S. workforce who
rely on voice as a primary tool of trade: a preliminary report. J Voice.
1997;11:254–259.
4. UrrutikoetxeaA, IspizuaA,Matellanes F. Pathologievocale chez les profes-
seurs:Une�etudevid�eo-laryngo-stroboscopiquede 1.046professeurs. [Vocal
pathology in teachers: a videolaryngostroboscopic study in 1046 teachers].
Rev Laryngol Otol Rhinol (Bord). 1995;116:255–262. [in French].
5. Smith E, Gray SD, Dove H, Kirchner L, Heras H. Frequency and effects of
teachers’ voice problems. J Voice. 1997;11:81–87.
6. Simberg S, Sala E, Vehmas K, Laine A. Changes in the prevalence of vocal
symptoms among teachers during a twelve-year period. J Voice. 2005;19:
95–102.
7. Sapir S, Keidar A, Mathers-Schmidt B. Vocal attrition in teachers: survey
findings. Eur J Disord Commun. 1993;28:177–185.
8. Sala E, Laine A, Simberg S, Pentti J, Suonpaa J. The prevalence of voice
disorders among day care center teachers compared with nurses—a ques-
tionnaire and clinical study. J Voice. 2001;15:413–423.
9. Russell A, Oates J, Greenwood KM. Prevalence of voice problems in
teachers. J Voice. 1998;12:467–479.
10. Roy N, Merrill RM, Thibeault S, Gray SD, Smith EM. Voice disorders in
teachers and the general population: effects on work performance, atten-
dance, and future career choices. J Speech Lang Hear Res. 2004;47:
542–551.
11. Ohlsson AC, J€arvholmB, L€ofqvist A. Vocal symptoms and vocal behaviour
in teachers. Scand J Logoped Phoniatr. 1987;12:61–69.
12. Morton V, Watson D. The teaching voice: problems and perceptions.
Logoped Phoniatr Vocol. 1998;23:133–139.
13. Vilkman E. Occupational safety and health aspects of voice and speech pro-
fessions. Folia Phoniatr Logop. 2004;56:220–253.
14. Kooijman PGC, Thomas G, Graamans K, de Jong FICRS. Psychosocial im-
pact of the teacher’s voice throughout the career. J Voice. 2007;21:316–324.
15. Deary IJ,Wilson JA, Carding PN,Mackenzie K. The dysphonic voice heard
by me, you and it: differential associations with personality and psycholog-
ical distress. Clin Otolaryngol Allied Sci. 2003;28:374–378.
16. Roy N, Bless DM. Personality traits and psychological factors in voice
pathology: a foundation for future research. J Speech Lang Hear Res.
2000;43:737–749.
17. Andersson K, Schal�en L. Etiology and treatment of psychogenic voice dis-
order: results of a follow-up study of thirty patients. J Voice. 1998;12:
96–106.
18. Wilson JA, Deary IJ, Millar A, Mackenzie K. The quality of life impact of
dysphonia. Clin Otolaryngol Allied Sci. 2002;27:179–182.
19. McAleavy GJ, Adamson G, Hazlett DE, Donegan HA, Livesey GE. Mod-
elling determinants of the vocal health of teachers in Northern Ireland:
implications for educational policy and practice. Public Health. 2008;
122:691–699.
20. Sala E, Airo E, Olkinuora P, et al. Vocal loading among day care center
teachers. Logoped Phoniatr Vocol. 2002;27:21–28.
21. Ilom€aki I, Lepp€anen K, Kleemola L, Tyrmi J, Laukkanen AM, Vilkman E.
Relationships between self-evaluations of voice and working conditions,
background factors, and phoniatric findings in female teachers. Logoped
Phoniatr Vocol. 2009;34:20–31.
22. LaukkanenAM, Ilomaki I, LeppanenK, Vilkman E. Acoustic measures and
self-reports of vocal fatigue by female teachers. J Voice. 2008;22:283–289.
23. Rantala L, Paavola L, Korkko P, Vilkman E. Working-day effects on the
spectral characteristics of teaching voice. Folia Phoniatr Logop. 1998;50:
205–211.
24. Rantala L, Vilkman E. Relationship between subjective voice complaints and
acoustic parameters in female teachers’ voices. J Voice. 1999;13:484–495.
25. Rantala L, Vilkman E, Bloigu R. Voice changes during work—subjective
complaints and objective measurements for female primary and secondary
schoolteachers. J Voice. 2002;16:344–355.
26. Tavares ELM, Martins RHG. Vocal evaluation in teachers with or without
symptoms. J Voice. 2007;21:407–414.
27. Gotaas C, Starr CD. Vocal fatigue among teachers. Folia Phoniatr Logop.
1993;45:120–129.
28. Smith E, Lemke J, Taylor M, Kirchner HL, Hoffman H. Frequency of voice
problems among teachers and other occupations. J Voice. 1998;12:
480–488.
29. Dejonckere PH, Bradley P, Clemente P, et al. A basic protocol for functional
assessment of voice pathology, especially for investigating the efficacy of
(phonosurgical) treatments and evaluating new assessment techniques.
Guideline elaborated by the Committee on Phoniatrics of the European Lar-
yngological Society (ELS). Eur Arch Otorhinolaryngol. 2001;258:77–82.
30. Kendall KA. High-speed laryngeal imaging compared with videostrobo-
scopy in healthy subjects. Arch Otolaryngol Head Neck Surg. 2009;135:
274–281.
31. Lindestad P�A, Herteg�ard S, Bj€orck G. Laryngeal adduction asymmetries in
normal speaking subjects. Logoped Phoniatr Vocol. 2004;29:128–134.
32. S€odersten M, Lindestad PA. Glottal closure and perceived breathiness dur-
ing phonation in normally speaking subjects. J Speech Lang Hear Res.
1990;33:601–611.
33. Hammarberg B. Voice research and clinical needs. Folia Phoniatr Logop.
2000;52:93–102.
34. Hirano M. Clinical Examination of Voice. New York, NY: Springer; 1981.
35. Ma E, Robertson J, Radford C, Vagne S, El-Halabi R, Yiu E. Reliability of
speaking and maximum voice range measures in screening for dysphonia.
J Voice. 2007;21:397–406.
36. L€ofqvist A, Mandersson B. Long-time average spectrum of speech and
voice analysis. Folia Phoniatr Logop. 1987;39:221–229.
37. Hanson HM, Stevens KN, Kuo HKJ, ChenMY, Slifka J. Towards models of
phonation. J Phonetics. 2001;29:451–480.
38. InternationalElectrotechnicalCommission. IEC60318-3Electroacoustics—
Simulators of Human Head and Ear—Part 3: Acoustic Coupler for the Cal-
ibration of Supra-Aural Earphones Used in Audiometry. Geneva, Switzer-
land: International Electrotechnical Commission; 1998.
39. ISO 389-1. Acoustics—Reference zero for the Calibration of Audiometric
Equipment—Part 1: Reference Equivalent Threshold Sound Pressure
Levels for Pure Tones and Supra-Aural Earphones. ISO 389–1. Geneva,
Switzerland: International Organization for Standardization 389-1; 2003.
Available at: http://www.iso.org/iso. Accessed on June 20, 2011.
40. ISO 8253-1. In: Acoustics: Audiometric Test Methods—Part 1. Basic Pure
Tone Air and Bone Conduction Threshold Audiometry. ISO 8253-1, Vol.
389-1. Geneva, Switzerland: International Organization for Standardiza-
tion; 1998.
41. Lyberg-�Ahlander V, Rydell R, Eriksson J, Schal�en L. Throat related symp-
toms and voice: development of an instrument for self assessment of throat-
problems. BMC Ear Nose Throat Disord. 2010;10:5. Available at: http://
www.biomedcentral.com/1472-6815/10/5. Accessed on June 20, 2011.
42. Jacobson B, Johnson A, Grywalski C, Silbergleit A, Jacobson G,
Benninger M. The Voice Handicap Index (VHI): development and valida-
tion. Am J Speech Lang Pathol. 1997;6:66–70.
43. Karasek R, Brisson C, Kawakami N, Houtman I, Bongers P, Amick B. The
Job Content Questionnaire (JCQ): an instrument for internationally
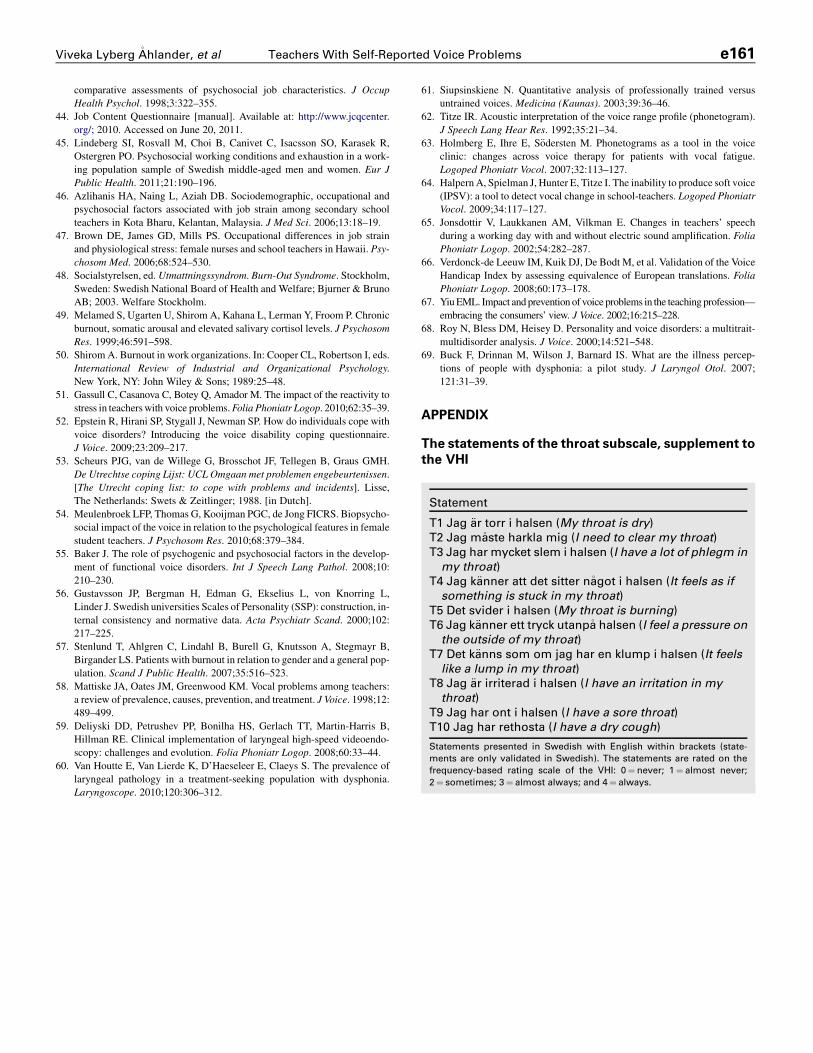
Statement
T1 Jag €ar torr i halsen (My throat is dry)T2 Jag m�aste harkla mig (I need to clear my throat)T3 Jag har mycket slem i halsen (I have a lot of phlegm inmy throat)
T4 Jag k€anner att det sitter n�agot i halsen (It feels as ifsomething is stuck in my throat)
T5 Det svider i halsen (My throat is burning)T6 Jag k€anner ett tryck utanp�a halsen (I feel a pressure on
the outside of my throat)T7 Det k€anns som om jag har en klump i halsen (It feelslike a lump in my throat)
T8 Jag €ar irriterad i halsen (I have an irritation in mythroat)
T9 Jag har ont i halsen (I have a sore throat)T10 Jag har rethosta (I have a dry cough)
Statements presented in Swedish with English within brackets (state-
ments are only validated in Swedish). The statements are rated on the
frequency-based rating scale of the VHI: 0¼ never; 1¼ almost never;
2¼ sometimes; 3¼ almost always; and 4¼ always.
Viveka Lyberg �Ahlander, et al Teachers With Self-Reported Voice Problems e161
comparative assessments of psychosocial job characteristics. J Occup
Health Psychol. 1998;3:322–355.
44. Job Content Questionnaire [manual]. Available at: http://www.jcqcenter.
org/; 2010. Accessed on June 20, 2011.
45. Lindeberg SI, Rosvall M, Choi B, Canivet C, Isacsson SO, Karasek R,
Ostergren PO. Psychosocial working conditions and exhaustion in a work-
ing population sample of Swedish middle-aged men and women. Eur J
Public Health. 2011;21:190–196.
46. Azlihanis HA, Naing L, Aziah DB. Sociodemographic, occupational and
psychosocial factors associated with job strain among secondary school
teachers in Kota Bharu, Kelantan, Malaysia. J Med Sci. 2006;13:18–19.
47. Brown DE, James GD, Mills PS. Occupational differences in job strain
and physiological stress: female nurses and school teachers in Hawaii. Psy-
chosom Med. 2006;68:524–530.
48. Socialstyrelsen, ed. Utmattningssyndrom. Burn-Out Syndrome. Stockholm,
Sweden: Swedish National Board of Health and Welfare; Bjurner & Bruno
AB; 2003. Welfare Stockholm.
49. Melamed S, Ugarten U, Shirom A, Kahana L, Lerman Y, Froom P. Chronic
burnout, somatic arousal and elevated salivary cortisol levels. J Psychosom
Res. 1999;46:591–598.
50. Shirom A. Burnout in work organizations. In: Cooper CL, Robertson I, eds.
International Review of Industrial and Organizational Psychology.
New York, NY: John Wiley & Sons; 1989:25–48.
51. Gassull C, Casanova C, Botey Q, Amador M. The impact of the reactivity to
stress in teacherswith voice problems.Folia Phoniatr Logop. 2010;62:35–39.
52. Epstein R, Hirani SP, Stygall J, Newman SP. How do individuals cope with
voice disorders? Introducing the voice disability coping questionnaire.
J Voice. 2009;23:209–217.
53. Scheurs PJG, van de Willege G, Brosschot JF, Tellegen B, Graus GMH.
De Utrechtse coping Lijst: UCL Omgaan met problemen engebeurtenissen.
[The Utrecht coping list: to cope with problems and incidents]. Lisse,
The Netherlands: Swets & Zeitlinger; 1988. [in Dutch].
54. Meulenbroek LFP, Thomas G, Kooijman PGC, de Jong FICRS. Biopsycho-
social impact of the voice in relation to the psychological features in female
student teachers. J Psychosom Res. 2010;68:379–384.
55. Baker J. The role of psychogenic and psychosocial factors in the develop-
ment of functional voice disorders. Int J Speech Lang Pathol. 2008;10:
210–230.
56. Gustavsson JP, Bergman H, Edman G, Ekselius L, von Knorring L,
Linder J. Swedish universities Scales of Personality (SSP): construction, in-
ternal consistency and normative data. Acta Psychiatr Scand. 2000;102:
217–225.
57. Stenlund T, Ahlgren C, Lindahl B, Burell G, Knutsson A, Stegmayr B,
Birgander LS. Patients with burnout in relation to gender and a general pop-
ulation. Scand J Public Health. 2007;35:516–523.
58. Mattiske JA, Oates JM, Greenwood KM. Vocal problems among teachers:
a review of prevalence, causes, prevention, and treatment. J Voice. 1998;12:
489–499.
59. Deliyski DD, Petrushev PP, Bonilha HS, Gerlach TT, Martin-Harris B,
Hillman RE. Clinical implementation of laryngeal high-speed videoendo-
scopy: challenges and evolution. Folia Phoniatr Logop. 2008;60:33–44.
60. Van Houtte E, Van Lierde K, D’Haeseleer E, Claeys S. The prevalence of
laryngeal pathology in a treatment-seeking population with dysphonia.
Laryngoscope. 2010;120:306–312.
61. Siupsinskiene N. Quantitative analysis of professionally trained versus
untrained voices. Medicina (Kaunas). 2003;39:36–46.
62. Titze IR. Acoustic interpretation of the voice range profile (phonetogram).
J Speech Lang Hear Res. 1992;35:21–34.
63. Holmberg E, Ihre E, S€odersten M. Phonetograms as a tool in the voice
clinic: changes across voice therapy for patients with vocal fatigue.
Logoped Phoniatr Vocol. 2007;32:113–127.
64. HalpernA, Spielman J, Hunter E, Titze I. The inability to produce soft voice
(IPSV): a tool to detect vocal change in school-teachers. Logoped Phoniatr
Vocol. 2009;34:117–127.
65. Jonsdottir V, Laukkanen AM, Vilkman E. Changes in teachers’ speech
during a working day with and without electric sound amplification. Folia
Phoniatr Logop. 2002;54:282–287.
66. Verdonck-de Leeuw IM, Kuik DJ, De Bodt M, et al. Validation of the Voice
Handicap Index by assessing equivalence of European translations. Folia
Phoniatr Logop. 2008;60:173–178.
67. YiuEML. Impact and prevention of voice problems in the teaching profession—
embracing the consumers’ view. J Voice. 2002;16:215–228.
68. Roy N, Bless DM, Heisey D. Personality and voice disorders: a multitrait-
multidisorder analysis. J Voice. 2000;14:521–548.
69. Buck F, Drinnan M, Wilson J, Barnard IS. What are the illness percep-
tions of people with dysphonia: a pilot study. J Laryngol Otol. 2007;
121:31–39.
APPENDIX
The statements of the throat subscale, supplement to
the VHI