how did the financial crisis affect small-business lending in the u.s.?
DESCRIPTION
Rebel A. Cole Driehaus College of Business DePaul University Email: [email protected] Presentation for the 2014 Annual Meetings of the Midwest Finance Association Orlando, FL USA Mar. 07, 2014. How Did the Financial Crisis Affect Small-Business Lending in the U.S.?. Summary. - PowerPoint PPT PresentationTRANSCRIPT

HOW DID THE FINANCIAL CRISIS AFFECT SMALL-BUSINESS LENDING IN THE U.S.?
Rebel A. ColeDriehaus College of BusinessDePaul UniversityEmail: [email protected]
Presentation for the 2014 Annual Meetings of the Midwest Finance AssociationOrlando, FL USAMar. 07, 2014
Summary
In this study, I use a panel regression model with bank- and year-fixed effects to analyze changes in U.S. bank lending to businesses, as reported by banks to their regulators.
I find that bank lending to all businesses and, in particular, to small businesses, declined precipitously following onset of the financial crisis.
Summary
I also examine the relative changes in business lending by banks that did, and did not, receive TARP funds from the U.S. Treasury following onset of the crisis in 2008.
My analysis reveals that banks receiving capital injections from the TARP failed to increase their small-business lending, even though this was the primary goal of the TARP; instead, these banks decreased their lending by even more than other banks.
Additional analysis incorporating county-year fixed effects reveals that the relative declines in lending by TARP banks appear to be demand driven, but re-confirms the failure of TARP banks to increase small-business lending.
Summary
My study also provides important new evidence on the determinants of business lending.
Most importantly, I find a strong and significant positive relation between bank capital adequacy and business lending, especially small-business lending.
This new evidence refutes claims by U.S. banking industry lobbyists that higher capital standards would reduce business lending and hurt the economy.
Instead, it shows that higher capital standards would improve the availability of credit to U.S. firms, especially to small businesses.
Introduction
When the U.S. residential housing bubble burst in 2007 – 2008, credit markets in the U.S. and around the world seized up.
Anecdotal evidence suggests that small businesses, which largely rely upon banks for credit, were especially hard hit by the financial crisis.
In response, the U.S. Treasury injected more than $200 billion of capital into more than 700 U.S. banking organizations to stabilize their subsidiary banks and promote lending, especially lending to small businesses.
Introduction
Here, I provide the first rigorous evidence on how successful, or, more accurately, how unsuccessful the CPP turned out to be.
My evidence points to serious failure, as small-business lending by banks participating in the CPP fell by even more than at banks not receiving funds from the CPP.
In other words, TARP banks took the taxpayers’ money, but then cut back on lending by even more than banks not receiving taxpayer dollars.
Introduction
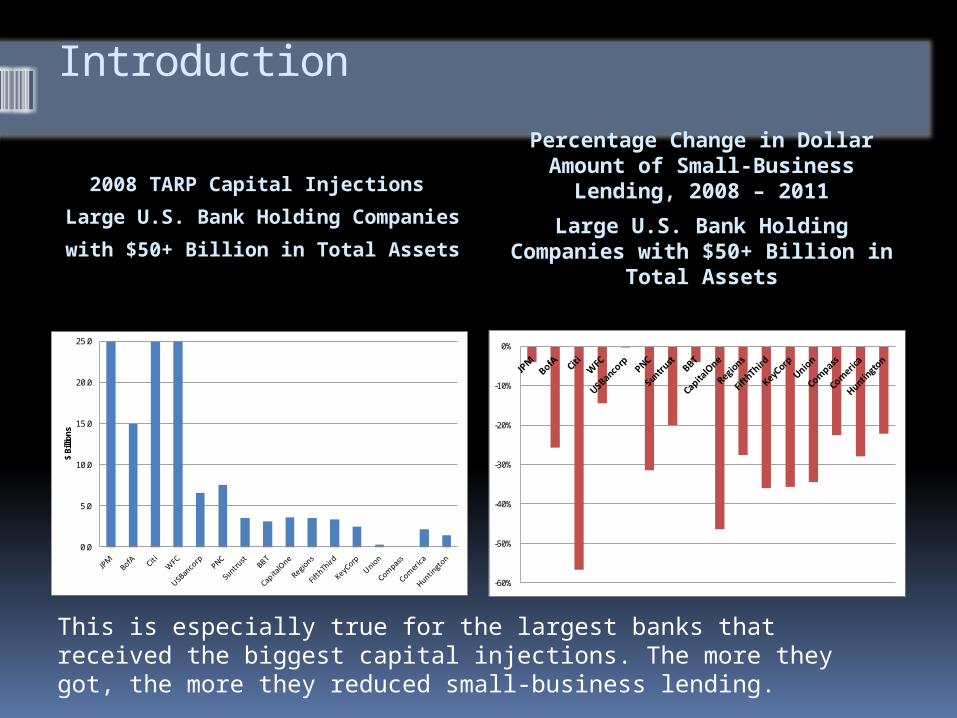
2008 TARP Capital Injections
Large U.S. Bank Holding Companies
with $50+ Billion in Total Assets
Percentage Change in Dollar Amount of Small-Business
Lending, 2008 – 2011
Large U.S. Bank Holding Companies with $50+ Billion in
Total Assets
0.0
5.0
10.0
15.0
20.0
25.0
$ Bi
llion
s
-60%
-50%
-40%
-30%
-20%
-10%
0%
This is especially true for the largest banks that received the biggest capital injections. The more they got, the more they reduced small-business lending.
Related Literature
The study most closely related to mine, from a methodological viewpoint, is Peek and Rosengren (1998), which examines the impact of bank mergers on small business lending.
Like me, they examine the change in small business lending (as measured by the ratio of small-business loans to total assets) by groups of banks subject to different “treatments.”
Related Literature
Another closely related study is Berger and Udell (2004), which examines changes in bank lending to test what they call the “institutional memory” hypothesis.
They regress the annual change in the dollar amount of business lending against a set of explanatory variables designed to measure “institutional memory” (their primary variable of interest), as well as variables designed to measure the health of the bank and overall loan demand.
Related Literature
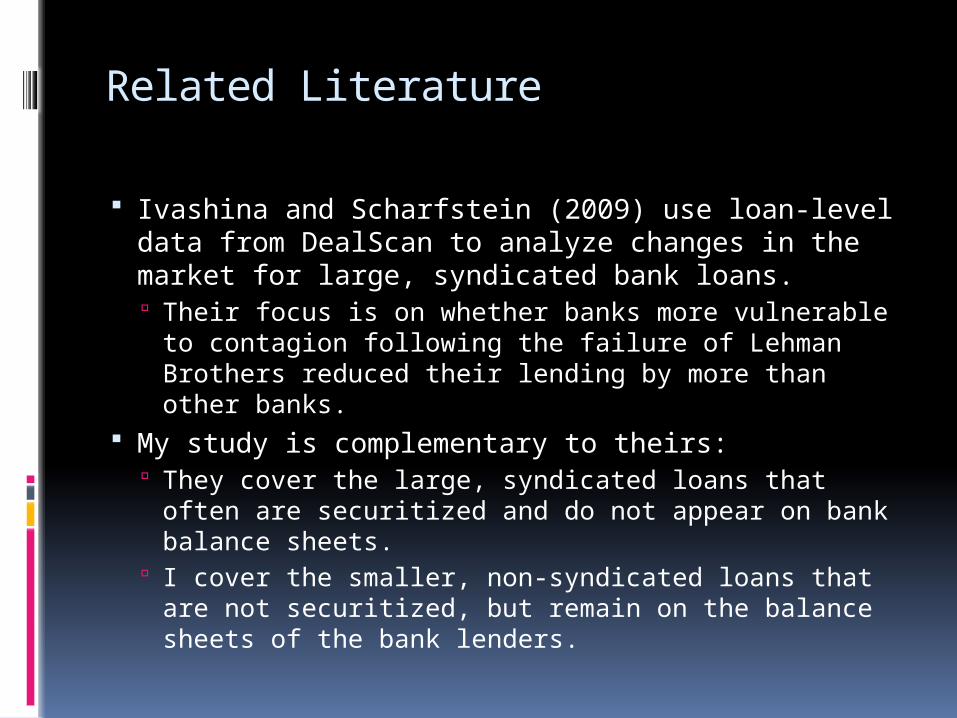
Ivashina and Scharfstein (2009) use loan-level data from DealScan to analyze changes in the market for large, syndicated bank loans. Their focus is on whether banks more vulnerable to
contagion following the failure of Lehman Brothers reduced their lending by more than other banks.
My study is complementary to theirs: They cover the large, syndicated loans that often
are securitized and do not appear on bank balance sheets.
I cover the smaller, non-syndicated loans that are not securitized, but remain on the balance sheets of the bank lenders.
Related Literature
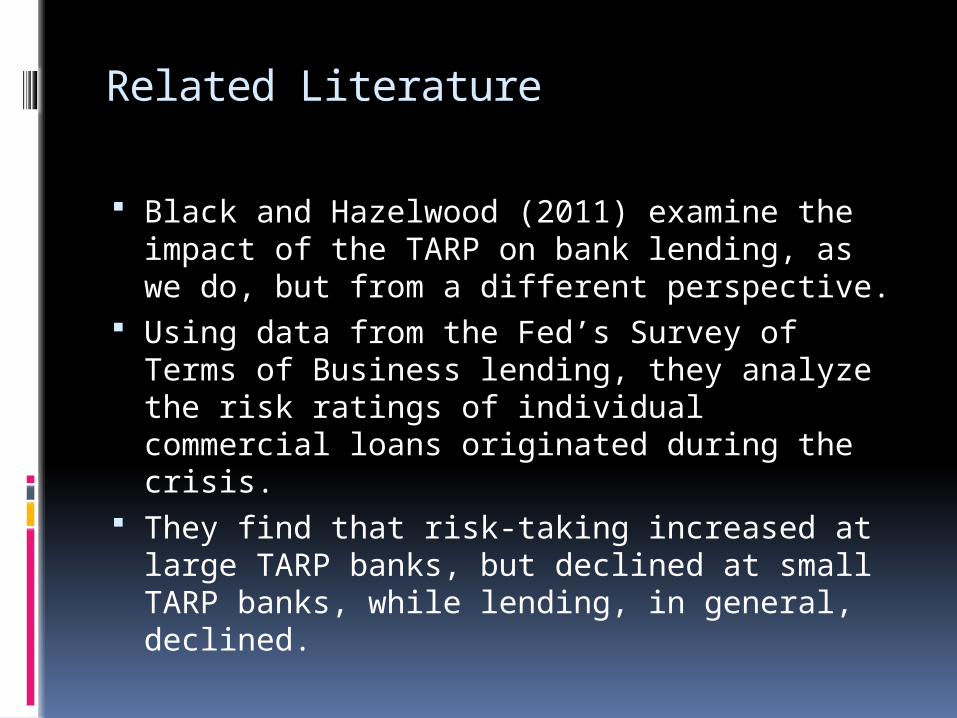
Black and Hazelwood (2011) examine the impact of the TARP on bank lending, as we do, but from a different perspective.
Using data from the Fed’s Survey of Terms of Business lending, they analyze the risk ratings of individual commercial loans originated during the crisis.
They find that risk-taking increased at large TARP banks, but declined at small TARP banks, while lending, in general, declined.
Related Literature
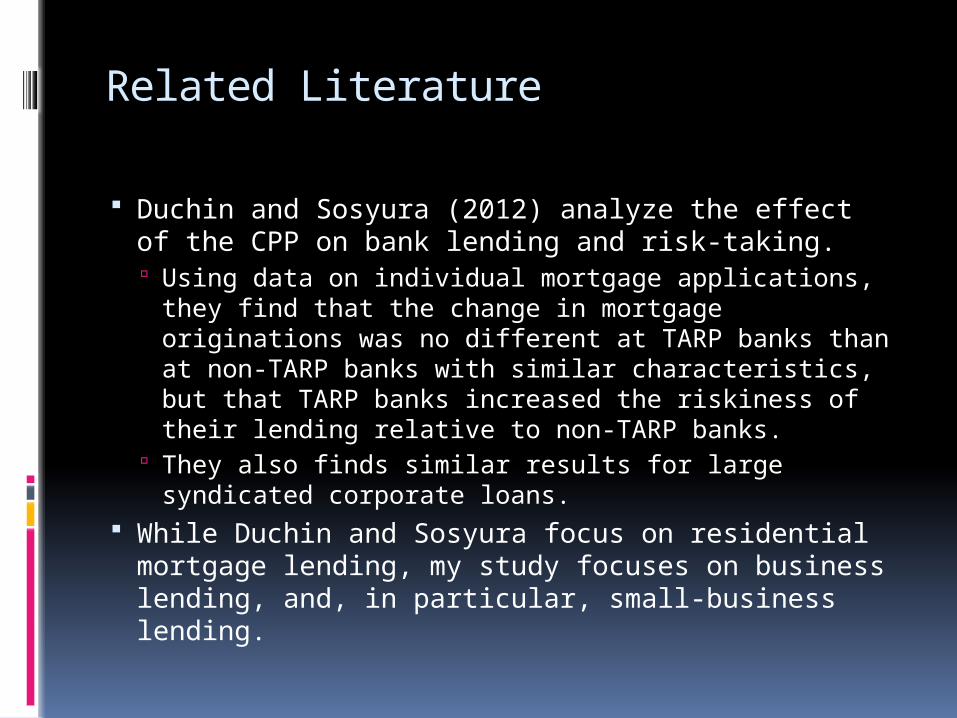
Duchin and Sosyura (2012) analyze the effect of the CPP on bank lending and risk-taking. Using data on individual mortgage applications,
they find that the change in mortgage originations was no different at TARP banks than at non-TARP banks with similar characteristics, but that TARP banks increased the riskiness of their lending relative to non-TARP banks.
They also finds similar results for large syndicated corporate loans.
While Duchin and Sosyura focus on residential mortgage lending, my study focuses on business lending, and, in particular, small-business lending.
Data: FFIEC Call Reports
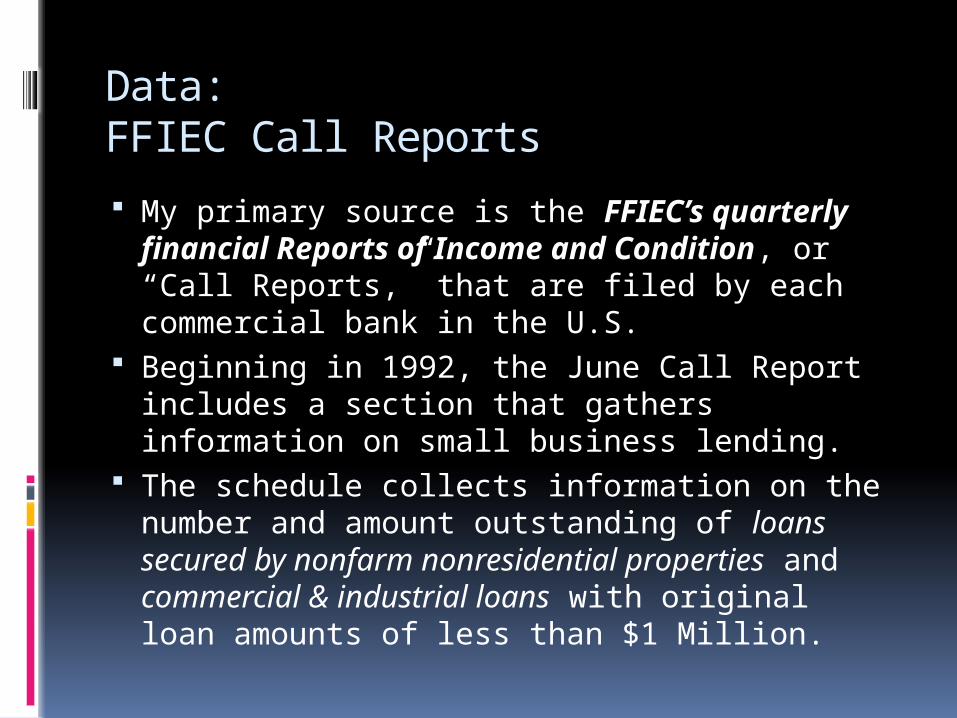
My primary source is the FFIEC’s quarterly financial Reports of Income and Condition, or “Call Reports,” that are filed by each commercial bank in the U.S.
Beginning in 1992, the June Call Report includes a section that gathers information on small business lending.
The schedule collects information on the number and amount outstanding of loans secured by nonfarm nonresidential properties and commercial & industrial loans with original loan amounts of less than $1 Million.
Data:FDIC Institution Directory
It is important to account for the effect of mergers in calculating changes in bank balance-sheet data over time.
During our 1994 – 2011 sample period, more than 9,000 banks disappeared via mergers.
To account for the impact of mergers on the balance sheets of acquiring banks, I identify the acquirer and target, as well as the date of each acquisition, using information from the FDIC’s Institution Directory, and aggregate data from acquirer and target for the pre-merger period.
Data:TARP Capital Purchase Program
My third source of data for information on the Troubled Asset Relief Program (“TARP”) is the website of the U.S. Treasury, where I obtain information on which banks participated in the Capital Purchase Program (“CPP”).
One of the stated goals of the CPP was to encourage lending to small businesses.
Data:TARP Capital Purchase Program
I identify 743 transactions totaling to $205 billion in capital injections during the period from Oct. 28, 2008 through Dec. 31, 2009.
I eliminate multiple transactions, and OTS-regulated thrifts.
I then match holding companies with subsidiary banks from June 2009, resulting in my final sample of 851 TARP banks.
Methodology
I utilize a fixed-effects regression model that exploits the panel nature of our dataset to explain three different measures of small-business lending: (1) the year-over-year percentage change in
the dollar value of small-business loans (as measured by Berger and Udell (2004));
(2) the year-over-year change in the ratio of small-business loans to total assets (as measured by Peek and Rosengren (1998)); and
(3) the natural logarithm of the dollar value of small-business loans.
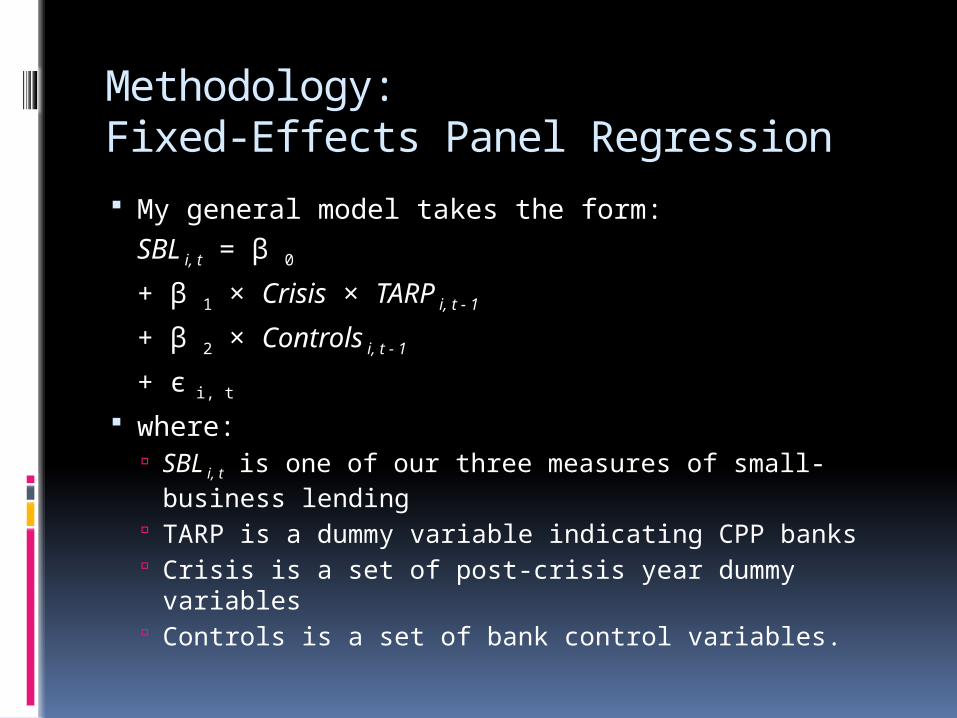
Methodology:Fixed-Effects Panel Regression
My general model takes the form: SBL i, t = β 0
+ β 1 × Crisis × TARP i, t - 1
+ β 2 × Controls i, t - 1
+ є i, t where:
SBL i, t is one of our three measures of small-business lending
TARP is a dummy variable indicating CPP banks Crisis is a set of post-crisis year dummy variables Controls is a set of bank control variables.
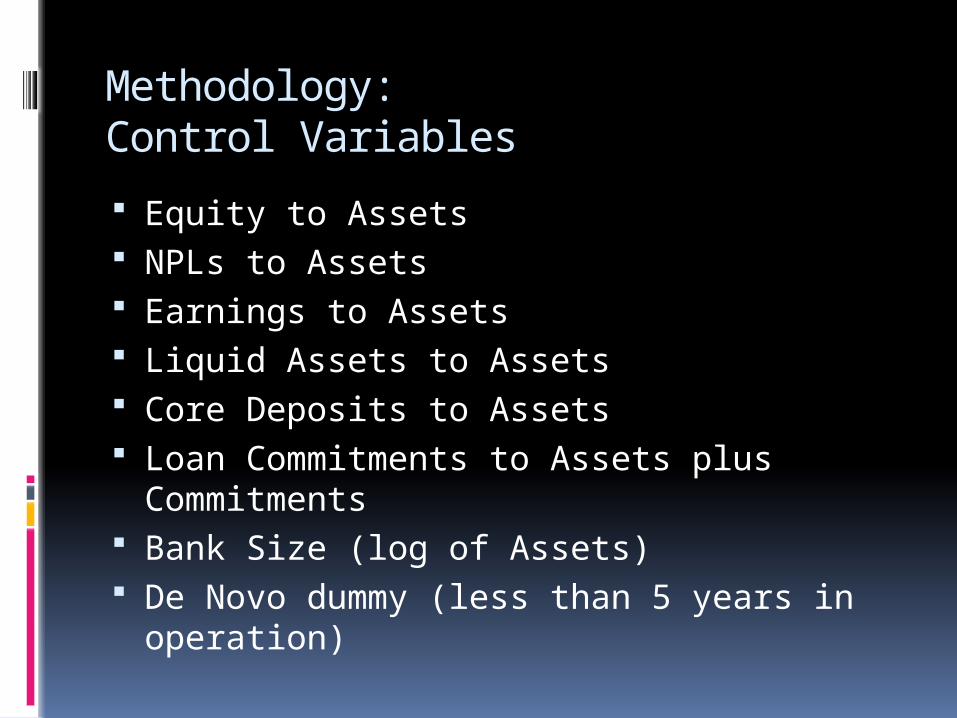
Methodology:Control Variables
Equity to Assets NPLs to Assets Earnings to Assets Liquid Assets to Assets Core Deposits to Assets Loan Commitments to Assets plus
Commitments Bank Size (log of Assets) De Novo dummy (less than 5 years in
operation)
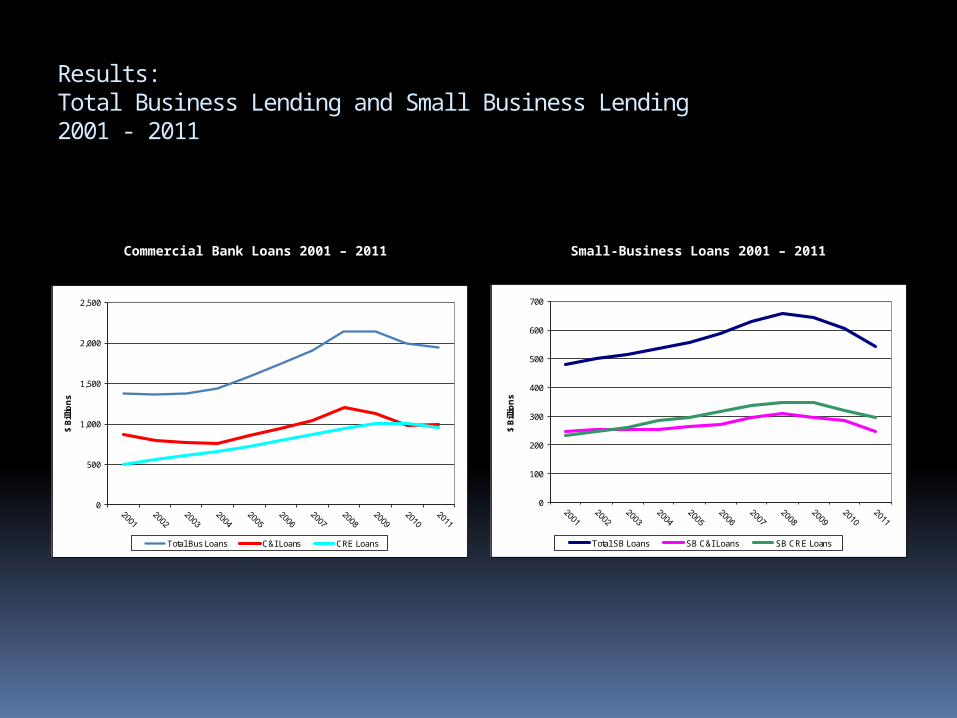
Results:Total Business Lending and Small Business Lending2001 - 2011
0
500
1,000
1,500
2,000
2,500
$ B
illio
ns
Total Bus Loans C&I Loans CRE Loans
0
100
200
300
400
500
600
700
$ B
illio
ns
Total SB Loans SB C&I Loans SB CRE Loans
Commercial Bank Loans 2001 – 2011 Small-Business Loans 2001 – 2011
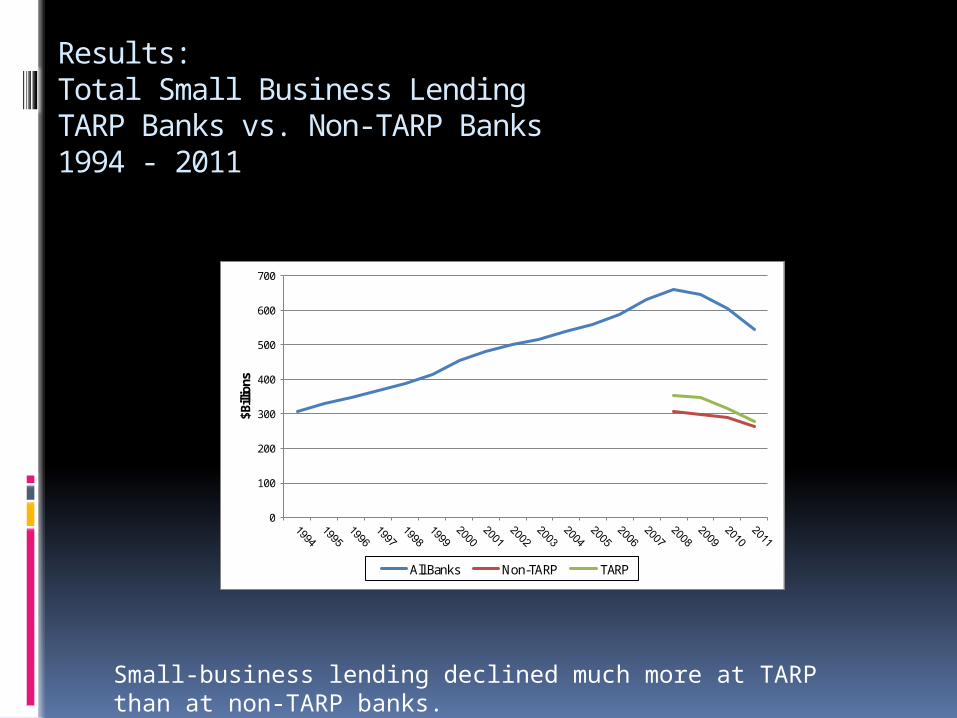
Results:Total Small Business LendingTARP Banks vs. Non-TARP Banks1994 - 2011
0
100
200
300
400
500
600
700
$Bill
ions
All Banks Non-TARP TARP
Small-business lending declined much more at TARP than at non-TARP banks.
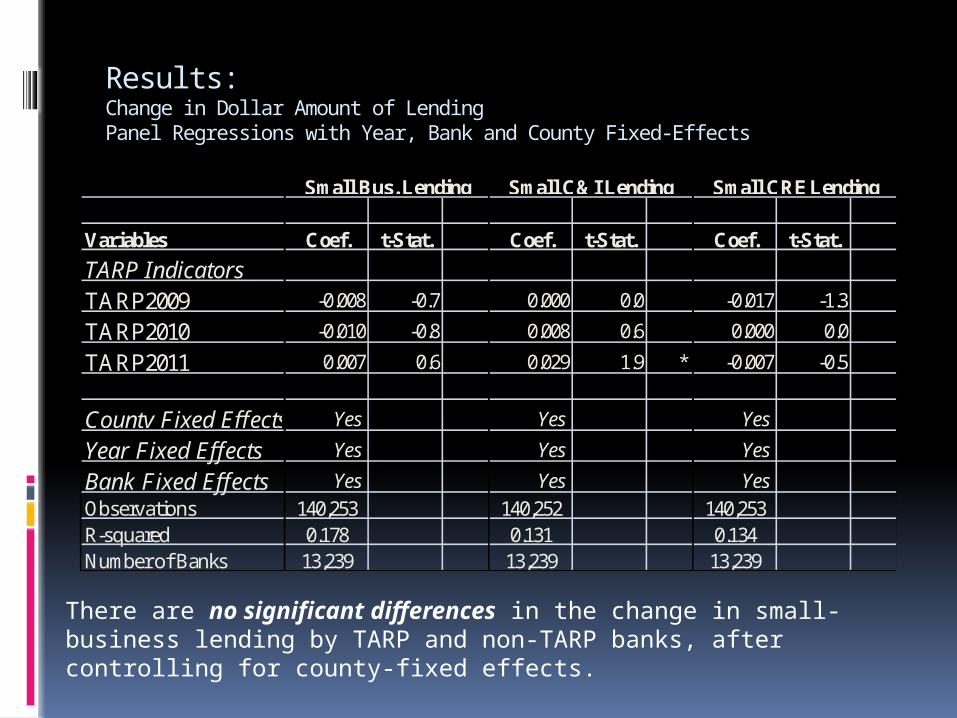
Results:Change in Dollar Amount of LendingPanel Regressions with Year, Bank and County Fixed-Effects
Variables Coef. t-Stat. Coef. t-Stat. Coef. t-Stat.
TARP IndicatorsTARP2009 -0.008 -0.7 0.000 0.0 -0.017 -1.3
TARP2010 -0.010 -0.8 0.008 0.6 0.000 0.0
TARP2011 0.007 0.6 0.029 1.9 * -0.007 -0.5
County Fixed Effects Yes Yes Yes
Year Fixed Effects Yes Yes Yes
Bank Fixed Effects Yes Yes Yes
Observations 140,253 140,252 140,253R-squared 0.178 0.131 0.134Number of Banks 13,239 13,239 13,239
Small Bus. Lending Small C&I Lending Small CRE Lending
There are no significant differences in the change in small-business lending by TARP and non-TARP banks, after controlling for county-fixed effects.
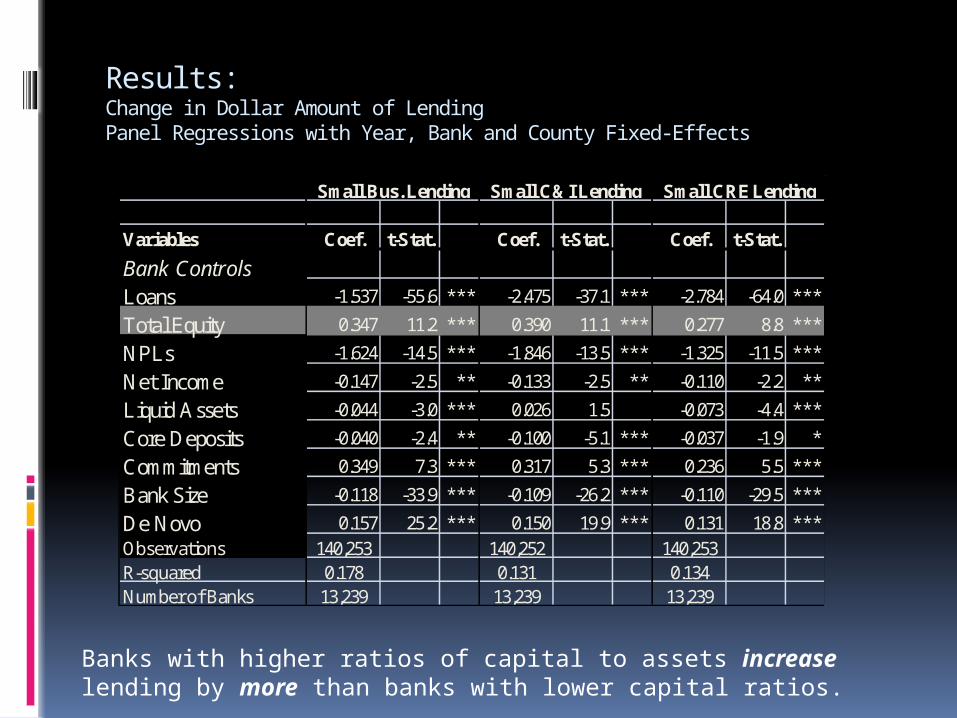
Results:Change in Dollar Amount of LendingPanel Regressions with Year, Bank and County Fixed-Effects
Variables Coef. t-Stat. Coef. t-Stat. Coef. t-Stat.
Bank ControlsLoans -1.537 -55.6 *** -2.475 -37.1 *** -2.784 -64.0 ***
Total Equity 0.347 11.2 *** 0.390 11.1 *** 0.277 8.8 ***
NPLs -1.624 -14.5 *** -1.846 -13.5 *** -1.325 -11.5 ***
Net Income -0.147 -2.5 ** -0.133 -2.5 ** -0.110 -2.2 **
Liquid Assets -0.044 -3.0 *** 0.026 1.5 -0.073 -4.4 ***
Core Deposits -0.040 -2.4 ** -0.100 -5.1 *** -0.037 -1.9 *
Commitments 0.349 7.3 *** 0.317 5.3 *** 0.236 5.5 ***
Bank Size -0.118 -33.9 *** -0.109 -26.2 *** -0.110 -29.5 ***
De Novo 0.157 25.2 *** 0.150 19.9 *** 0.131 18.8 ***Observations 140,253 140,252 140,253R-squared 0.178 0.131 0.134Number of Banks 13,239 13,239 13,239
Small Bus. Lending Small C&I Lending Small CRE Lending
Banks with higher ratios of capital to assets increase lending by more than banks with lower capital ratios.
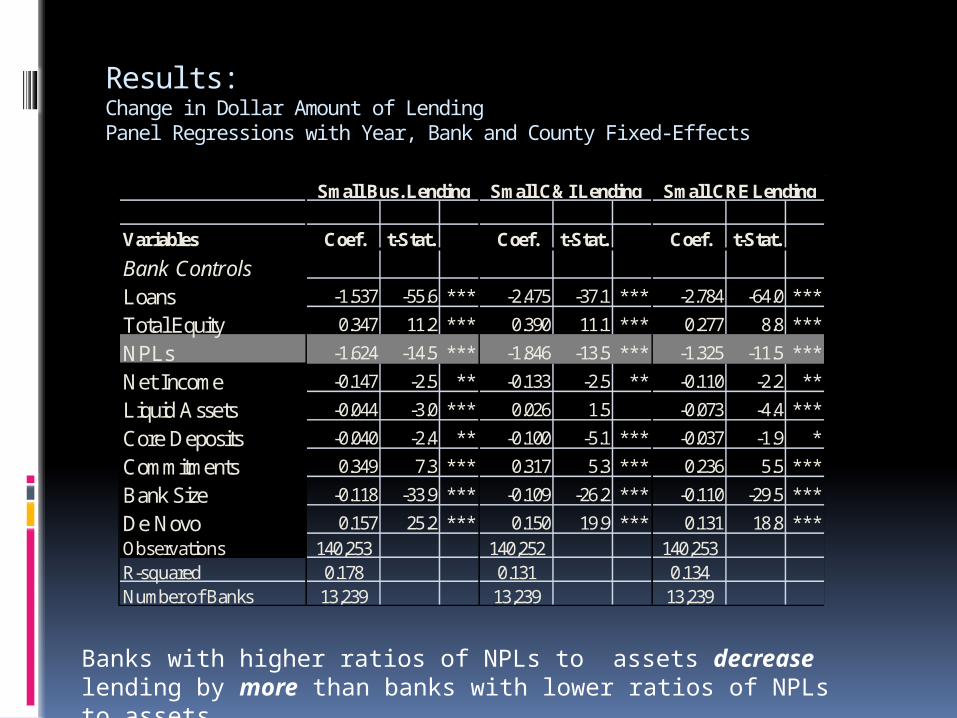
Results:Change in Dollar Amount of LendingPanel Regressions with Year, Bank and County Fixed-Effects
Variables Coef. t-Stat. Coef. t-Stat. Coef. t-Stat.
Bank ControlsLoans -1.537 -55.6 *** -2.475 -37.1 *** -2.784 -64.0 ***
Total Equity 0.347 11.2 *** 0.390 11.1 *** 0.277 8.8 ***
NPLs -1.624 -14.5 *** -1.846 -13.5 *** -1.325 -11.5 ***
Net Income -0.147 -2.5 ** -0.133 -2.5 ** -0.110 -2.2 **
Liquid Assets -0.044 -3.0 *** 0.026 1.5 -0.073 -4.4 ***
Core Deposits -0.040 -2.4 ** -0.100 -5.1 *** -0.037 -1.9 *
Commitments 0.349 7.3 *** 0.317 5.3 *** 0.236 5.5 ***
Bank Size -0.118 -33.9 *** -0.109 -26.2 *** -0.110 -29.5 ***
De Novo 0.157 25.2 *** 0.150 19.9 *** 0.131 18.8 ***Observations 140,253 140,252 140,253R-squared 0.178 0.131 0.134Number of Banks 13,239 13,239 13,239
Small Bus. Lending Small C&I Lending Small CRE Lending
Banks with higher ratios of NPLs to assets decrease lending by more than banks with lower ratios of NPLs to assets.
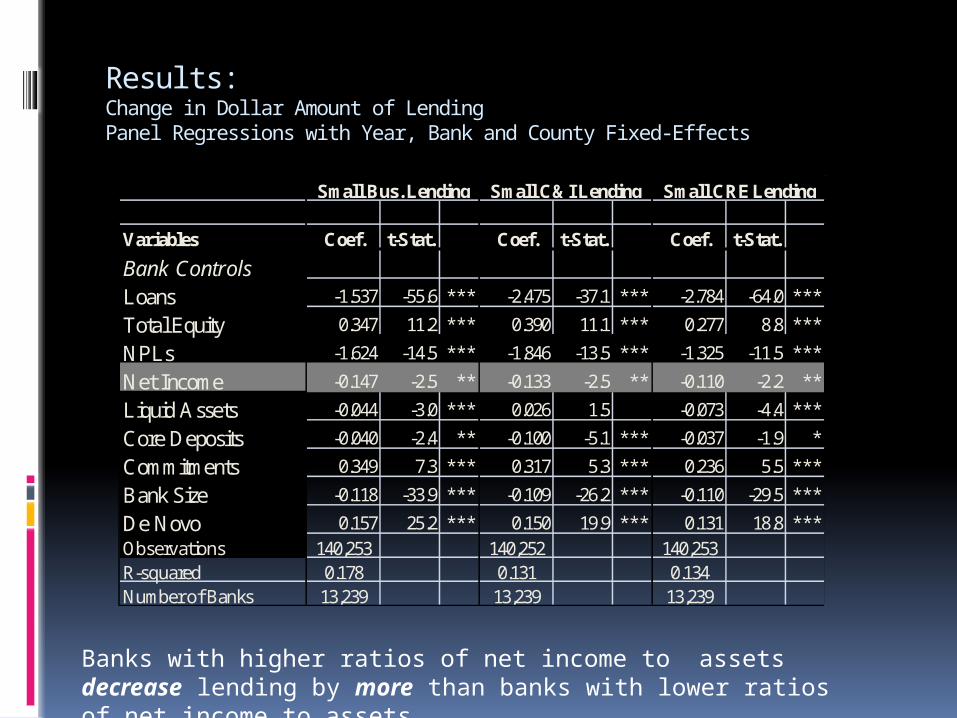
Results:Change in Dollar Amount of LendingPanel Regressions with Year, Bank and County Fixed-Effects
Variables Coef. t-Stat. Coef. t-Stat. Coef. t-Stat.
Bank ControlsLoans -1.537 -55.6 *** -2.475 -37.1 *** -2.784 -64.0 ***
Total Equity 0.347 11.2 *** 0.390 11.1 *** 0.277 8.8 ***
NPLs -1.624 -14.5 *** -1.846 -13.5 *** -1.325 -11.5 ***
Net Income -0.147 -2.5 ** -0.133 -2.5 ** -0.110 -2.2 **
Liquid Assets -0.044 -3.0 *** 0.026 1.5 -0.073 -4.4 ***
Core Deposits -0.040 -2.4 ** -0.100 -5.1 *** -0.037 -1.9 *
Commitments 0.349 7.3 *** 0.317 5.3 *** 0.236 5.5 ***
Bank Size -0.118 -33.9 *** -0.109 -26.2 *** -0.110 -29.5 ***
De Novo 0.157 25.2 *** 0.150 19.9 *** 0.131 18.8 ***Observations 140,253 140,252 140,253R-squared 0.178 0.131 0.134Number of Banks 13,239 13,239 13,239
Small Bus. Lending Small C&I Lending Small CRE Lending
Banks with higher ratios of net income to assets decrease lending by more than banks with lower ratios of net income to assets.
Results:Change in Dollar Amount of LendingPanel Regressions with Year, Bank and County Fixed-Effects
Variables Coef. t-Stat. Coef. t-Stat. Coef. t-Stat.
Bank ControlsLoans -1.537 -55.6 *** -2.475 -37.1 *** -2.784 -64.0 ***
Total Equity 0.347 11.2 *** 0.390 11.1 *** 0.277 8.8 ***
NPLs -1.624 -14.5 *** -1.846 -13.5 *** -1.325 -11.5 ***
Net Income -0.147 -2.5 ** -0.133 -2.5 ** -0.110 -2.2 **
Liquid Assets -0.044 -3.0 *** 0.026 1.5 -0.073 -4.4 ***
Core Deposits -0.040 -2.4 ** -0.100 -5.1 *** -0.037 -1.9 *
Commitments 0.349 7.3 *** 0.317 5.3 *** 0.236 5.5 ***
Bank Size -0.118 -33.9 *** -0.109 -26.2 *** -0.110 -29.5 ***
De Novo 0.157 25.2 *** 0.150 19.9 *** 0.131 18.8 ***Observations 140,253 140,252 140,253R-squared 0.178 0.131 0.134Number of Banks 13,239 13,239 13,239
Small Bus. Lending Small C&I Lending Small CRE Lending
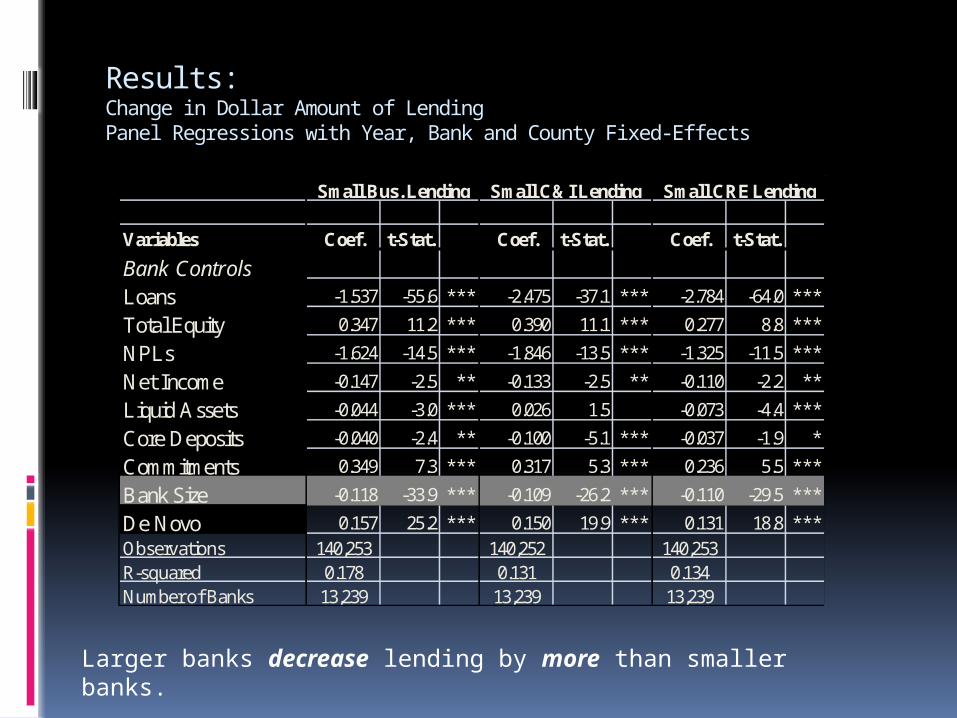
Larger banks decrease lending by more than smaller banks.
Results:Change in Dollar Amount of LendingPanel Regressions with Year, Bank and County Fixed-Effects
Variables Coef. t-Stat. Coef. t-Stat. Coef. t-Stat.
Bank ControlsLoans -1.537 -55.6 *** -2.475 -37.1 *** -2.784 -64.0 ***
Total Equity 0.347 11.2 *** 0.390 11.1 *** 0.277 8.8 ***
NPLs -1.624 -14.5 *** -1.846 -13.5 *** -1.325 -11.5 ***
Net Income -0.147 -2.5 ** -0.133 -2.5 ** -0.110 -2.2 **
Liquid Assets -0.044 -3.0 *** 0.026 1.5 -0.073 -4.4 ***
Core Deposits -0.040 -2.4 ** -0.100 -5.1 *** -0.037 -1.9 *
Commitments 0.349 7.3 *** 0.317 5.3 *** 0.236 5.5 ***
Bank Size -0.118 -33.9 *** -0.109 -26.2 *** -0.110 -29.5 ***
De Novo 0.157 25.2 *** 0.150 19.9 *** 0.131 18.8 ***Observations 140,253 140,252 140,253R-squared 0.178 0.131 0.134Number of Banks 13,239 13,239 13,239
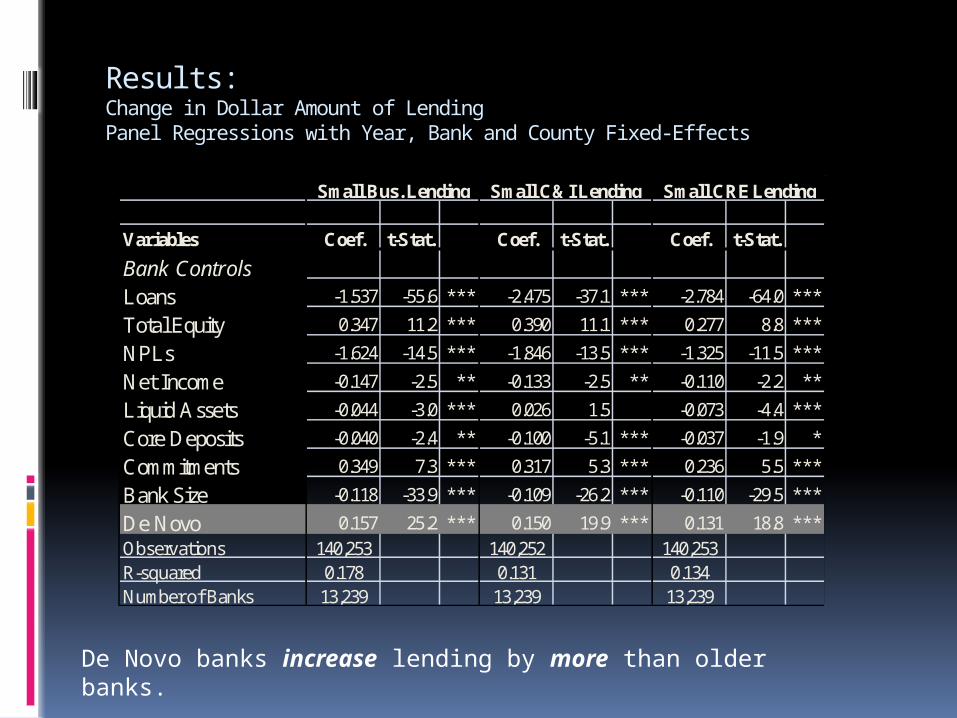
Small Bus. Lending Small C&I Lending Small CRE Lending
De Novo banks increase lending by more than older banks.
Results:Other Dependent Variables
Results for Change in Loan to Asset Ratio and for log of Loan Amount are qualitatively similar to results for Change in Loan Amount.
Results for Total Business Lending also are qualitatively similar.
Conclusions
In this study, I analyze how the financial crisis of 2007 – 2008 and its aftermath affected U.S. bank lending to businesses and, in particular, lending to small-businesses.
I find that bank lending to businesses in the U.S. declined significantly following the crisis, and that it declined by significantly more for small firms than for larger firms.
These results hold in both univariate and multivariate analyses.
Conclusions
I also find that banks receiving capital injections from the TARP’s $200 billion Capital Purchase Program decreased their lending to businesses both large and small by even more than did banks not receiving government capital.
One of the key goals of the TARP was to boost business lending, especially to small businesses.
In this respect, my results show that the TARP was a failure.

Conclusions
My analysis also reveals some other interesting results unrelated to lending during the crisis, but that provide important new evidence on the determinants of business lending.
Most importantly, I find a strong and significant positive relation between bank capital adequacy and business lending.
This has important policy implications for regulators who are considering proposals to increase minimum capital requirements, especially for systemically important institutions.
My results suggest that higher capital requirements will lead to more business lending rather than less business lending, as the U.S. banking lobby has claimed.