housing development finance corporation limited presentation nov 2015.pdf · premier and largest...
TRANSCRIPT
Housing Development Finance
Corporation Limited
November 2015
2
CONTENTS
• HDFC Snapshot
• Mortgage Market in India
• Operational and Financial Highlights: Mortgages
• Valuations and Shareholding
• Financials: Standalone
• Key Subsidiaries and Associates
• Financials: Consolidated
3
HDFC SNAPSHOT
4
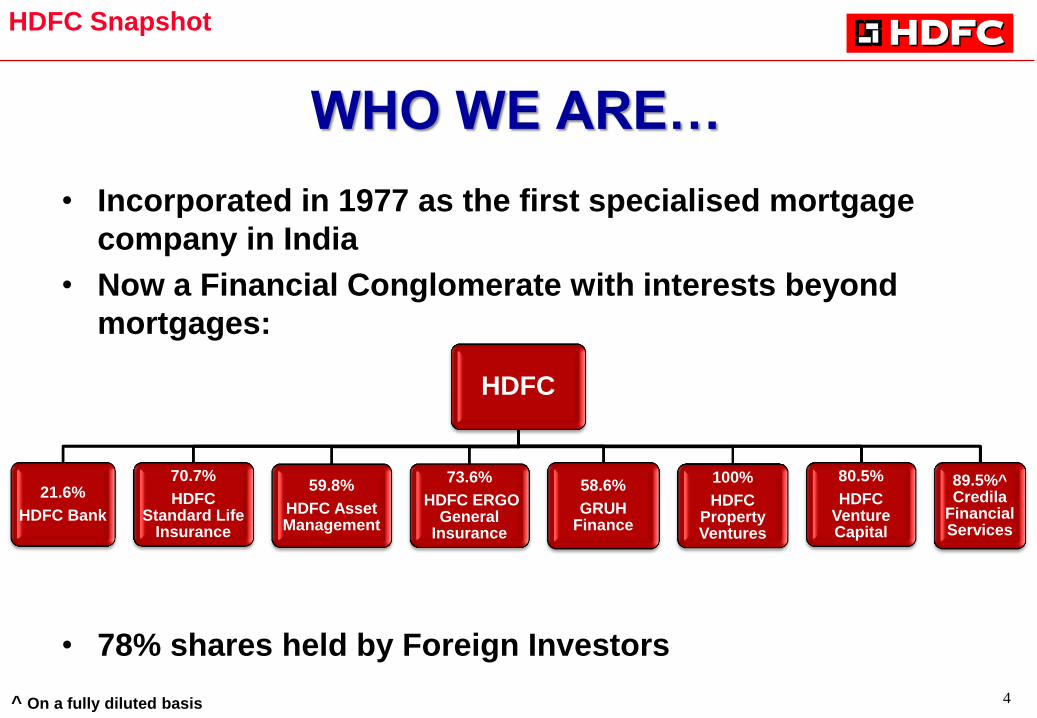
WHO WE ARE…
• Incorporated in 1977 as the first specialised mortgage
company in India
• Now a Financial Conglomerate with interests beyond
mortgages:
• 78% shares held by Foreign Investors
HDFC
21.6%
HDFC Bank
70.7%
HDFC Standard Life
Insurance
59.8%
HDFC Asset Management
73.6%
HDFC ERGO General
Insurance
58.6%
GRUH Finance
100%
HDFC Property Ventures
80.5%
HDFC Venture Capital
89.5%^ Credila
Financial Services
HDFC Snapshot
^ On a fully diluted basis
5
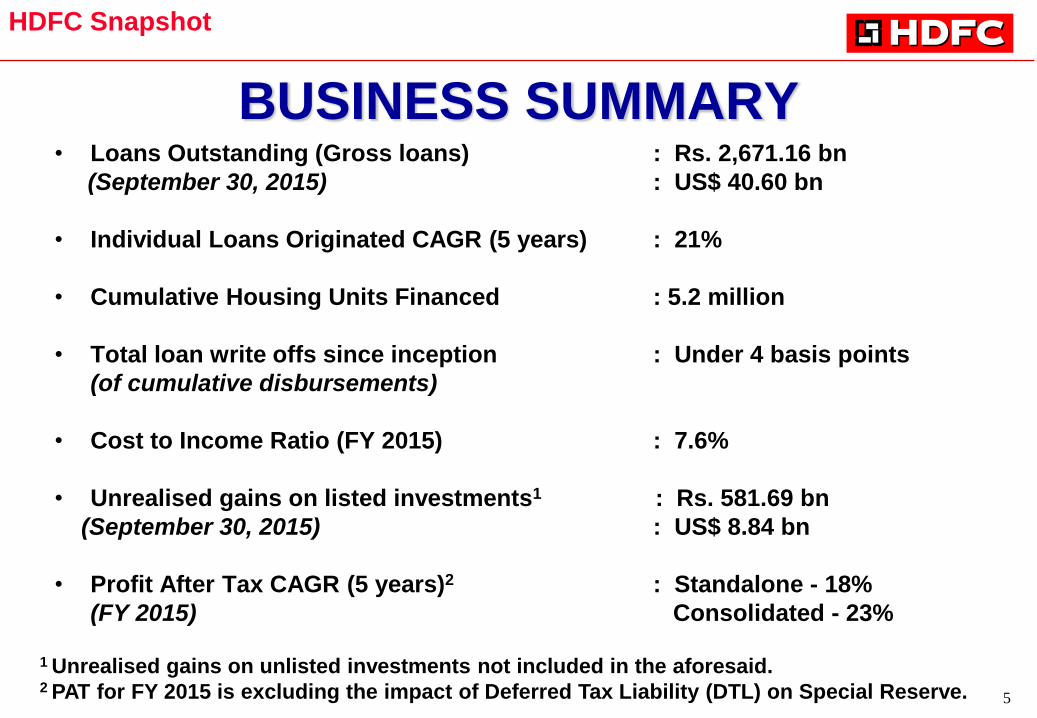
BUSINESS SUMMARY • Loans Outstanding (Gross loans) : Rs. 2,671.16 bn
(September 30, 2015) : US$ 40.60 bn
• Individual Loans Originated CAGR (5 years) : 21%
• Cumulative Housing Units Financed : 5.2 million
• Total loan write offs since inception : Under 4 basis points
(of cumulative disbursements)
• Cost to Income Ratio (FY 2015) : 7.6%
• Unrealised gains on listed investments1 : Rs. 581.69 bn
(September 30, 2015) : US$ 8.84 bn
• Profit After Tax CAGR (5 years)2 : Standalone - 18%
(FY 2015) Consolidated - 23%
HDFC Snapshot
1 Unrealised gains on unlisted investments not included in the aforesaid. 2 PAT for FY 2015 is excluding the impact of Deferred Tax Liability (DTL) on Special Reserve.
6
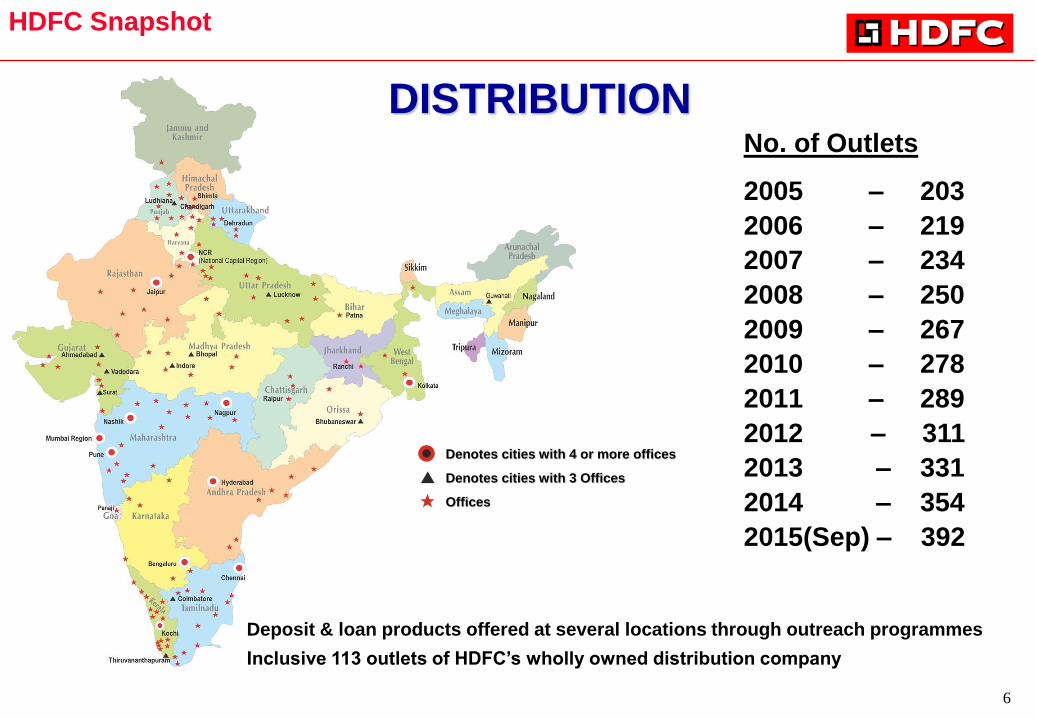
No. of Outlets
2005 – 203
2006 – 219
2007 – 234
2008 – 250
2009 – 267
2010 – 278
2011 – 289
2012 – 311
2013 – 331
2014 – 354
2015(Sep) – 392
HDFC Snapshot
Denotes cities with 4 or more offices
Denotes cities with 3 Offices
Offices
DISTRIBUTION
Deposit & loan products offered at several locations through outreach programmes
Inclusive 113 outlets of HDFC’s wholly owned distribution company

7
MORTGAGE MARKET IN INDIA
8
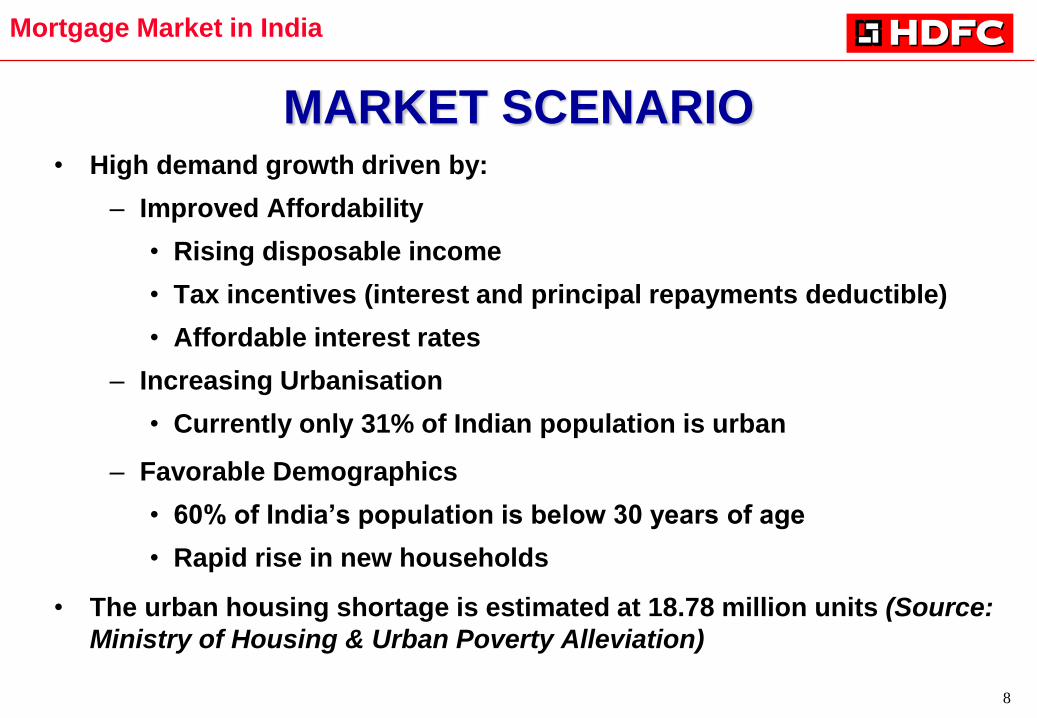
• High demand growth driven by:
– Improved Affordability
• Rising disposable income
• Tax incentives (interest and principal repayments deductible)
• Affordable interest rates
– Increasing Urbanisation
• Currently only 31% of Indian population is urban
– Favorable Demographics
• 60% of India’s population is below 30 years of age
• Rapid rise in new households
• The urban housing shortage is estimated at 18.78 million units (Source:
Ministry of Housing & Urban Poverty Alleviation)
MARKET SCENARIO
Mortgage Market in India
9
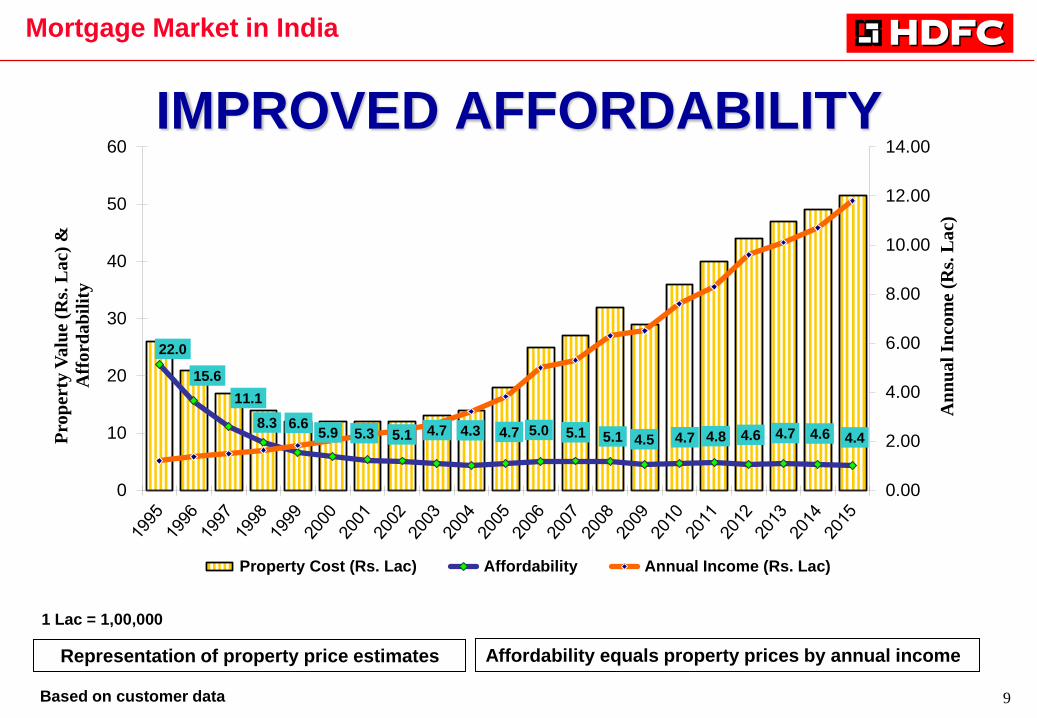
IMPROVED AFFORDABILITY
22.0
15.6
11.1
8.3 6.6 5.9 5.3 5.1 4.7 4.3 4.7 5.0 5.1 5.1 4.5 4.7 4.8 4.6 4.7 4.6 4.4
0.00
2.00
4.00
6.00
8.00
10.00
12.00
14.00
0
10
20
30
40
50
60
An
nu
al
Inco
me
(Rs.
La
c)
Pro
per
ty V
alu
e (R
s. L
ac)
&
Aff
ord
ab
ilit
y
Property Cost (Rs. Lac) Affordability Annual Income (Rs. Lac)
Mortgage Market in India
1 Lac = 1,00,000
Representation of property price estimates Affordability equals property prices by annual income
Based on customer data
10
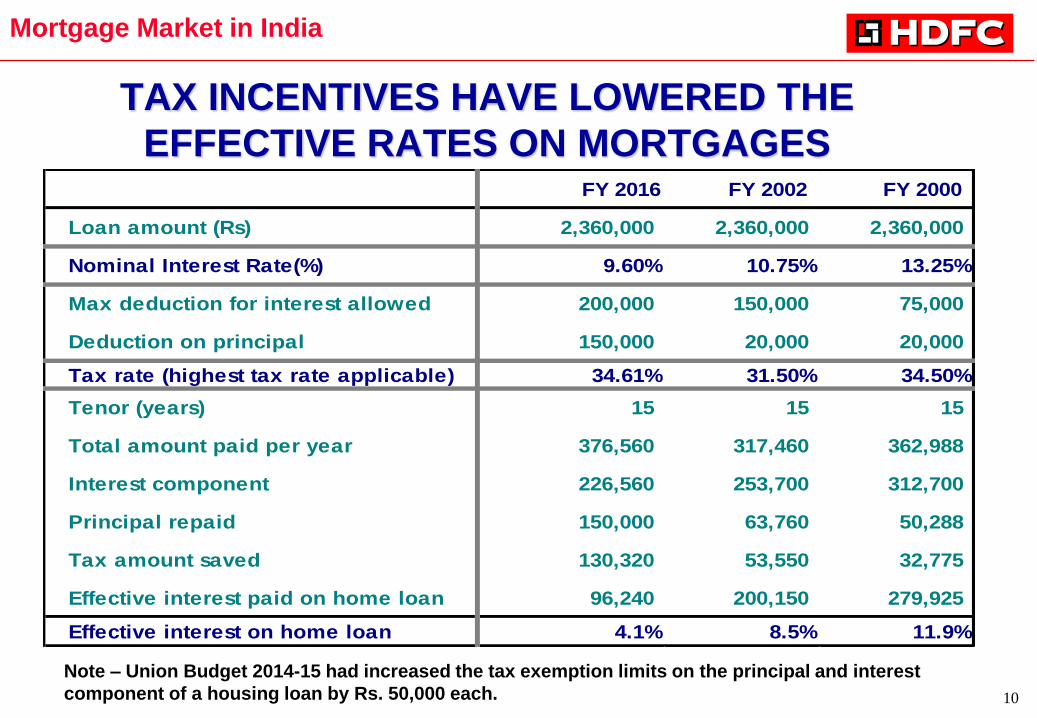
TAX INCENTIVES HAVE LOWERED THE
EFFECTIVE RATES ON MORTGAGES
Mortgage Market in India
FY 2016 FY 2002 FY 2000
Loan amount (Rs) 2,360,000 2,360,000 2,360,000
Nominal Interest Rate(%) 9.60% 10.75% 13.25%
Max deduction for interest allowed 200,000 150,000 75,000
Deduction on principal 150,000 20,000 20,000
Tax rate (highest tax rate applicable) 34.61% 31.50% 34.50%
Tenor (years) 15 15 15
Total amount paid per year 376,560 317,460 362,988
Interest component 226,560 253,700 312,700
Principal repaid 150,000 63,760 50,288
Tax amount saved 130,320 53,550 32,775
Effective interest paid on home loan 96,240 200,150 279,925
Effective interest on home loan 4.1% 8.5% 11.9%
Note – Union Budget 2014-15 had increased the tax exemption limits on the principal and interest
component of a housing loan by Rs. 50,000 each.
11
0%
20%
40%
60%
80%
100%
120%
9%
18% 20%
32% 36% 40%
45% 45%
56% 62%
81%
94%
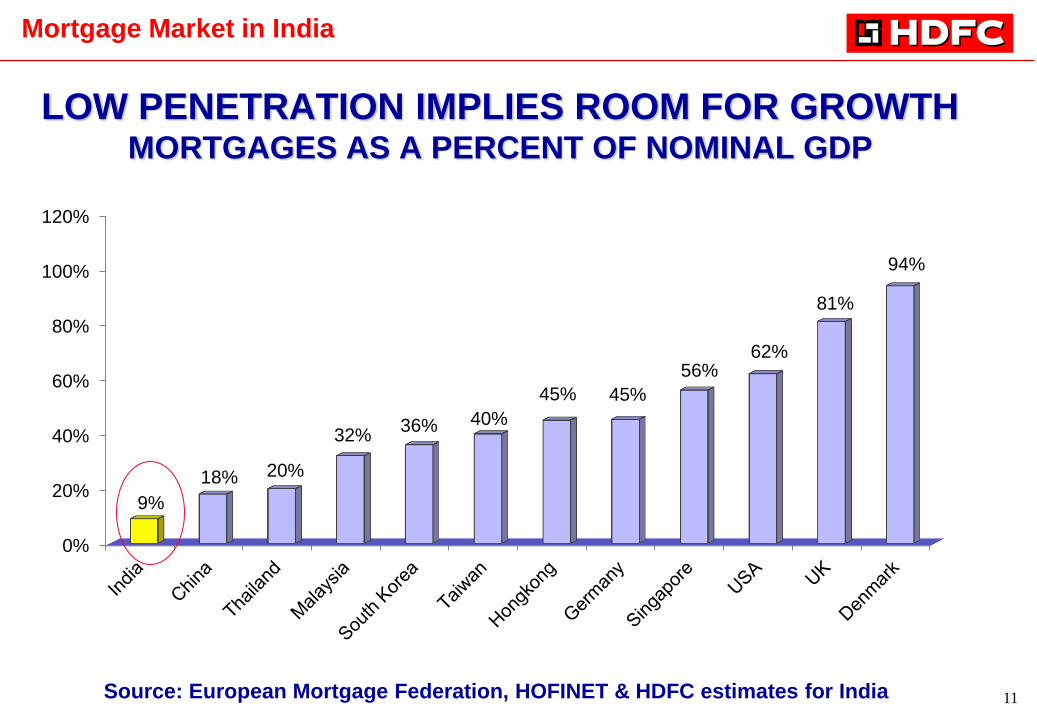
LOW PENETRATION IMPLIES ROOM FOR GROWTH MORTGAGES AS A PERCENT OF NOMINAL GDP
Mortgage Market in India
Source: European Mortgage Federation, HOFINET & HDFC estimates for India
12
OPERATIONAL & FINANCIAL
HIGHLIGHTS: MORTGAGES
13
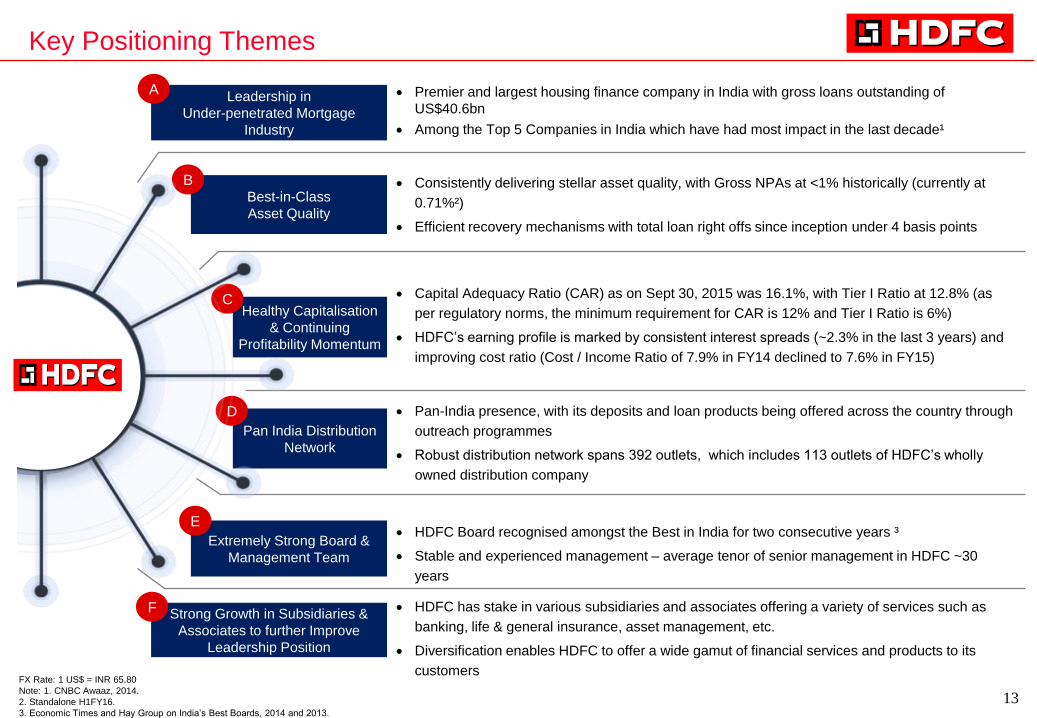
Premier and largest housing finance company in India with gross loans outstanding of
US$40.6bn
Among the Top 5 Companies in India which have had most impact in the last decade¹
Pan India Distribution
Network
Healthy Capitalisation
& Continuing
Profitability Momentum
Strong Growth in Subsidiaries &
Associates to further Improve
Leadership Position
Best-in-Class
Asset Quality
Consistently delivering stellar asset quality, with Gross NPAs at <1% historically (currently at
0.71%²)
Efficient recovery mechanisms with total loan right offs since inception under 4 basis points
Leadership in
Under-penetrated Mortgage
Industry
Extremely Strong Board &
Management Team
A
B
E
D
C
F
Pan-India presence, with its deposits and loan products being offered across the country through
outreach programmes
Robust distribution network spans 392 outlets, which includes 113 outlets of HDFC’s wholly
owned distribution company
HDFC Board recognised amongst the Best in India for two consecutive years ³
Stable and experienced management – average tenor of senior management in HDFC ~30
years
HDFC has stake in various subsidiaries and associates offering a variety of services such as
banking, life & general insurance, asset management, etc.
Diversification enables HDFC to offer a wide gamut of financial services and products to its
customers
Capital Adequacy Ratio (CAR) as on Sept 30, 2015 was 16.1%, with Tier I Ratio at 12.8% (as
per regulatory norms, the minimum requirement for CAR is 12% and Tier I Ratio is 6%)
HDFC’s earning profile is marked by consistent interest spreads (~2.3% in the last 3 years) and
improving cost ratio (Cost / Income Ratio of 7.9% in FY14 declined to 7.6% in FY15)
FX Rate: 1 US$ = INR 65.80
Note: 1. CNBC Awaaz, 2014.
2. Standalone H1FY16.
3. Economic Times and Hay Group on India’s Best Boards, 2014 and 2013.
Key Positioning Themes
14
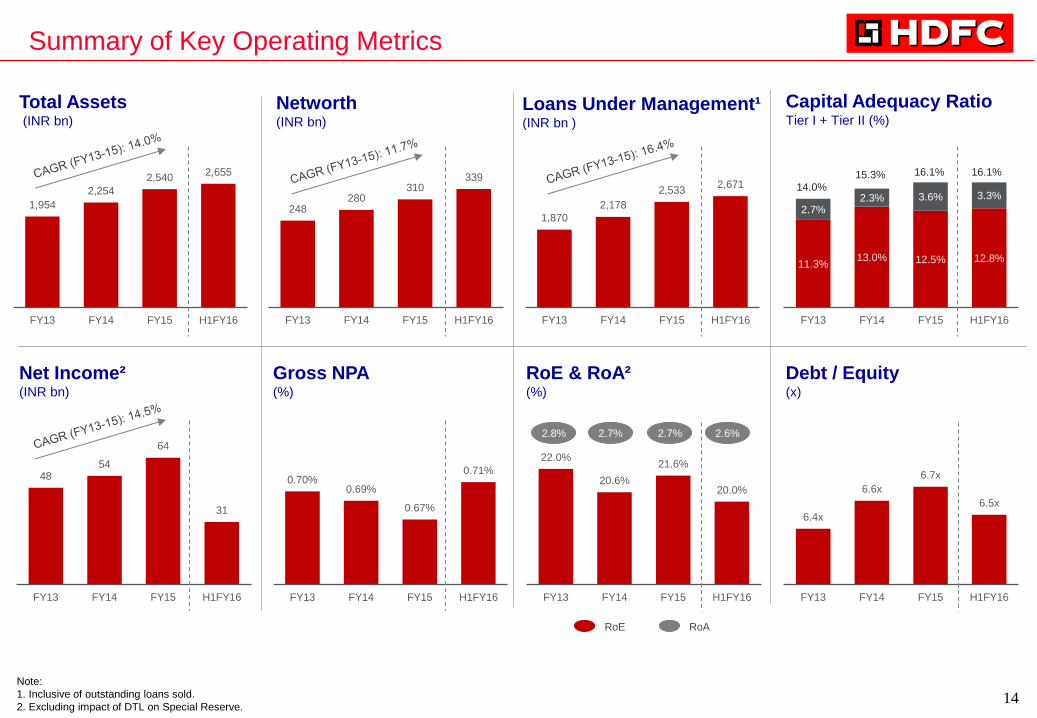
Note:
1. Inclusive of outstanding loans sold.
2. Excluding impact of DTL on Special Reserve.
1,954
2,254
2,540 2,655
FY13 FY14 FY15 H1FY16
1,870
2,178
2,533 2,671
FY13 FY14 FY15 H1FY16
Total Assets (INR bn)
11.3% 13.0% 12.5% 12.8%
2.7% 2.3% 3.6% 3.3%
FY13 FY14 FY15 H1FY16
248 280
310 339
FY13 FY14 FY15 H1FY16
Networth (INR bn)
Loans Under Management¹ (INR bn )
48 54
64
31
FY13 FY14 FY15 H1FY16
Net Income² (INR bn)
0.70% 0.69%
0.67%
0.71%
FY13 FY14 FY15 H1FY16
6.4x
6.6x
6.7x
6.5x
FY13 FY14 FY15 H1FY16
Gross NPA (%)
22.0%
20.6%
21.6%
20.0%
FY13 FY14 FY15 H1FY16
RoE & RoA² (%)
14.0% 15.3% 16.1% 16.1%
2.8% 2.7%
RoE RoA
Debt / Equity (x)
2.7% 2.6%
Summary of Key Operating Metrics
Capital Adequacy Ratio Tier I + Tier II (%)
15
KEY HIGHLIGHTS • Raised an External Commercial Borrowing (ECB) of US$ 500 million under Reserve Bank of
India’s ECB for Low Cost Affordable Housing in the second quarter of FY 2016.
• In August 2015, the Corporation agreed to sell 9% of the equity shares in HDFC Life to Standard
Life (Mauritius Holdings) 2006 Limited, subject to the receipt of regulatory approvals.
• In October 2015, the Corporation concluded the issue of Warrants simultaneously with the issue
of Non-Convertible Debentures (NCDs) to Qualified Institutional Buyers (QIBs) on a Qualified
Institutions Placement (QIP) basis. The Corporation received an amount of Rs. 50.51 billion
towards the NCDs and upfront Warrant payment.
– A warrant holder can exchange each Warrant for one equity share at any time before
October 5, 2018 at an exercise price of Rs. 1,475 per equity share, thus representing a
premium of 25% over the SEBI floor price.
– NCDs aggregating Rs. 50 billion due March 2017 has a coupon of 1.43% p.a.
• In-principle board approval to issue Rupee denominated bonds overseas up to US$ 750 million.
• In-principle board approval to establish a Level 1 American Depository Receipt programme (non-
capital raising).
16
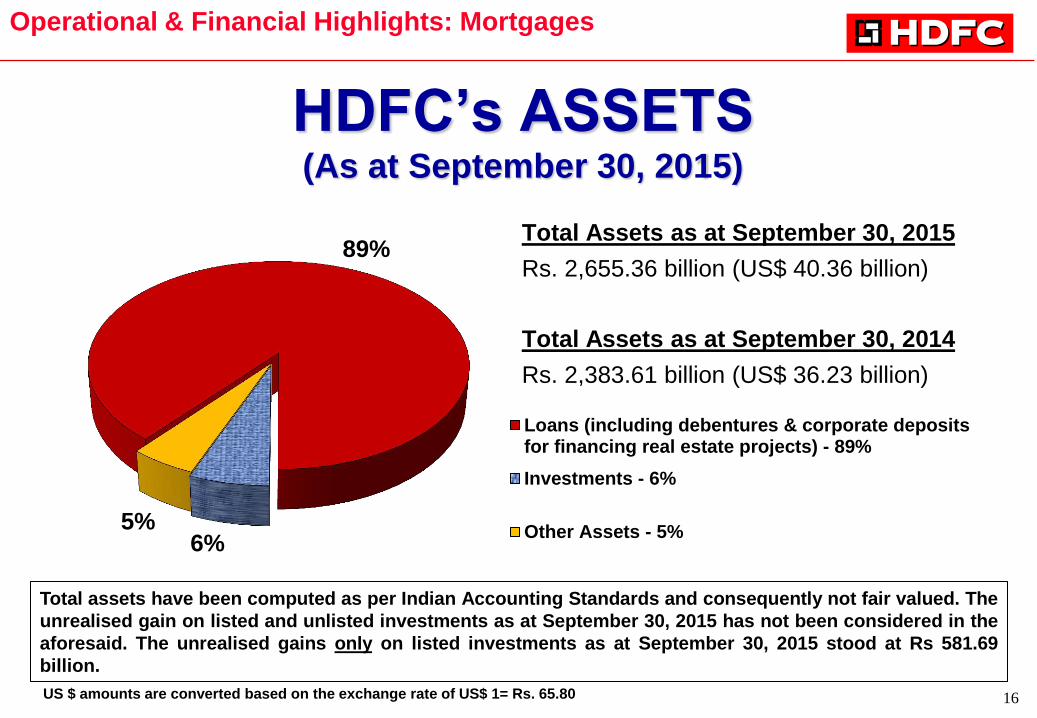
HDFC’s ASSETS (As at September 30, 2015)
89%
6% 5%
Loans (including debentures & corporate depositsfor financing real estate projects) - 89%
Investments - 6%
Other Assets - 5%
Total Assets as at September 30, 2015
Rs. 2,655.36 billion (US$ 40.36 billion)
Total Assets as at September 30, 2014
Rs. 2,383.61 billion (US$ 36.23 billion)
Total assets have been computed as per Indian Accounting Standards and consequently not fair valued. The
unrealised gain on listed and unlisted investments as at September 30, 2015 has not been considered in the
aforesaid. The unrealised gains only on listed investments as at September 30, 2015 stood at Rs 581.69
billion.
Operational & Financial Highlights: Mortgages
US $ amounts are converted based on the exchange rate of US$ 1= Rs. 65.80
17
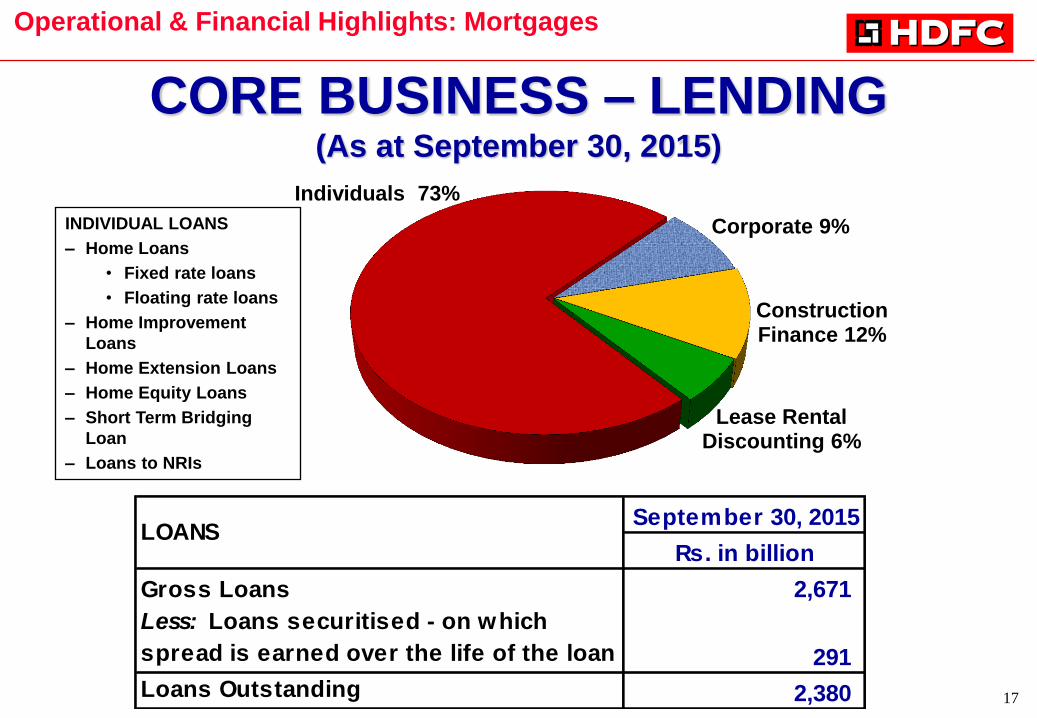
INDIVIDUAL LOANS
– Home Loans
• Fixed rate loans
• Floating rate loans
– Home Improvement
Loans
– Home Extension Loans
– Home Equity Loans
– Short Term Bridging
Loan
– Loans to NRIs
CORE BUSINESS – LENDING (As at September 30, 2015)
Operational & Financial Highlights: Mortgages
Individuals 73%
Corporate 9%
Construction Finance 12%
Lease Rental Discounting 6%
September 30, 2015
Rs. in billion
Gross Loans 2,671
Less: Loans securitised - on which
spread is earned over the life of the loan 291
Loans Outstanding 2,380
LOANS
18
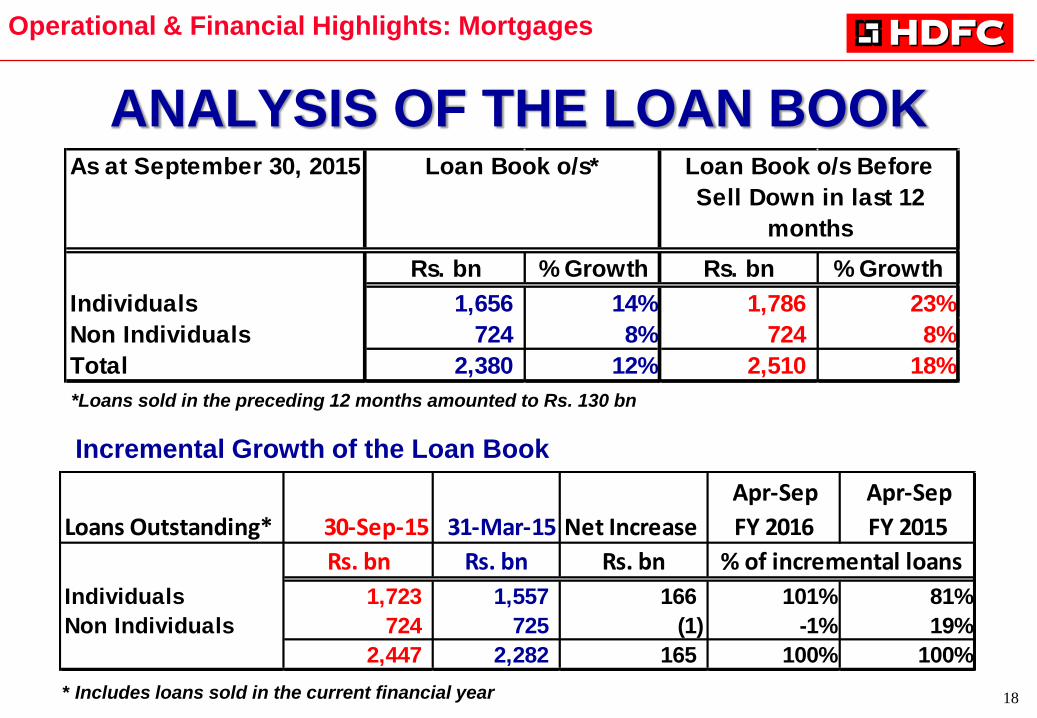
ANALYSIS OF THE LOAN BOOK
Loans Outstanding* 30-Sep-15 31-Mar-15 Net Increase
Apr-Sep
FY 2016
Apr-Sep
FY 2015
Rs. bn Rs. bn Rs. bn
Individuals 1,723 1,557 166 101% 81%
Non Individuals 724 725 (1) -1% 19%
2,447 2,282 165 100% 100%
% of incremental loans
* Includes loans sold in the current financial year
Operational & Financial Highlights: Mortgages
As at September 30, 2015
Rs. bn % Growth Rs. bn % Growth
Individuals 1,656 14% 1,786 23%
Non Individuals 724 8% 724 8%
Total 2,380 12% 2,510 18%
Loan Book o/s* Loan Book o/s Before
Sell Down in last 12
months
Incremental Growth of the Loan Book
*Loans sold in the preceding 12 months amounted to Rs. 130 bn
19
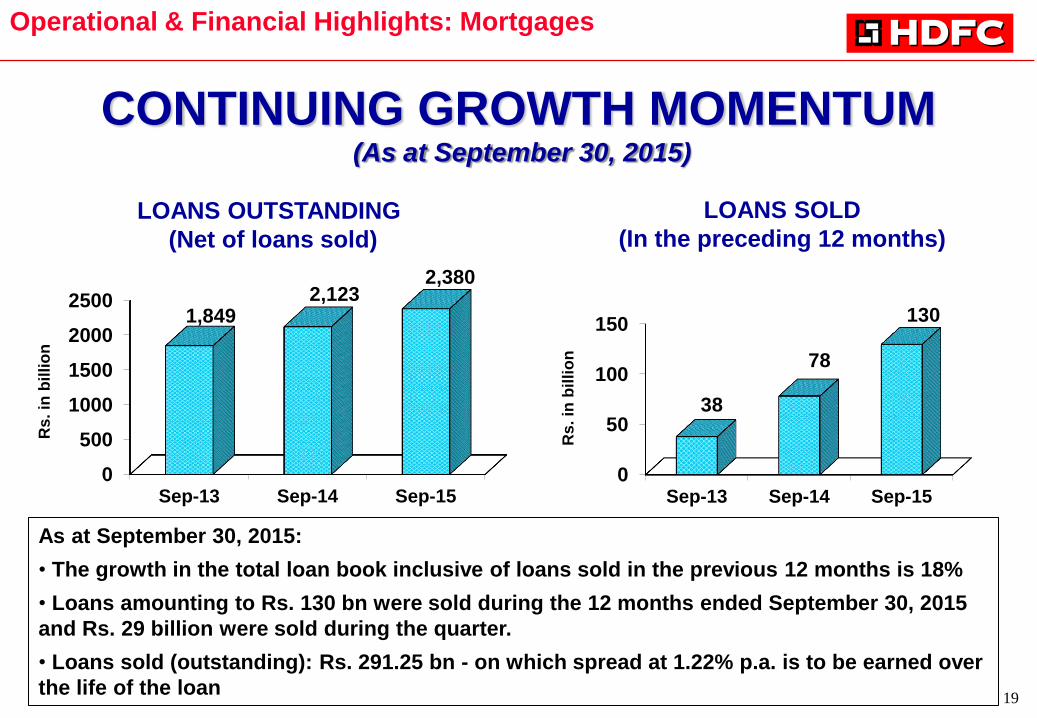
CONTINUING GROWTH MOMENTUM (As at September 30, 2015)
0
500
1000
1500
2000
2500
Sep-13 Sep-14 Sep-15
1,849 2,123
2,380
Rs. in
bil
lio
n
Operational & Financial Highlights: Mortgages
LOANS OUTSTANDING
(Net of loans sold)
0
50
100
150
Sep-13 Sep-14 Sep-15
38
78
130
Rs
. in
bil
lio
n
LOANS SOLD
(In the preceding 12 months)
As at September 30, 2015:
• The growth in the total loan book inclusive of loans sold in the previous 12 months is 18%
• Loans amounting to Rs. 130 bn were sold during the 12 months ended September 30, 2015
and Rs. 29 billion were sold during the quarter.
• Loans sold (outstanding): Rs. 291.25 bn - on which spread at 1.22% p.a. is to be earned over
the life of the loan
20
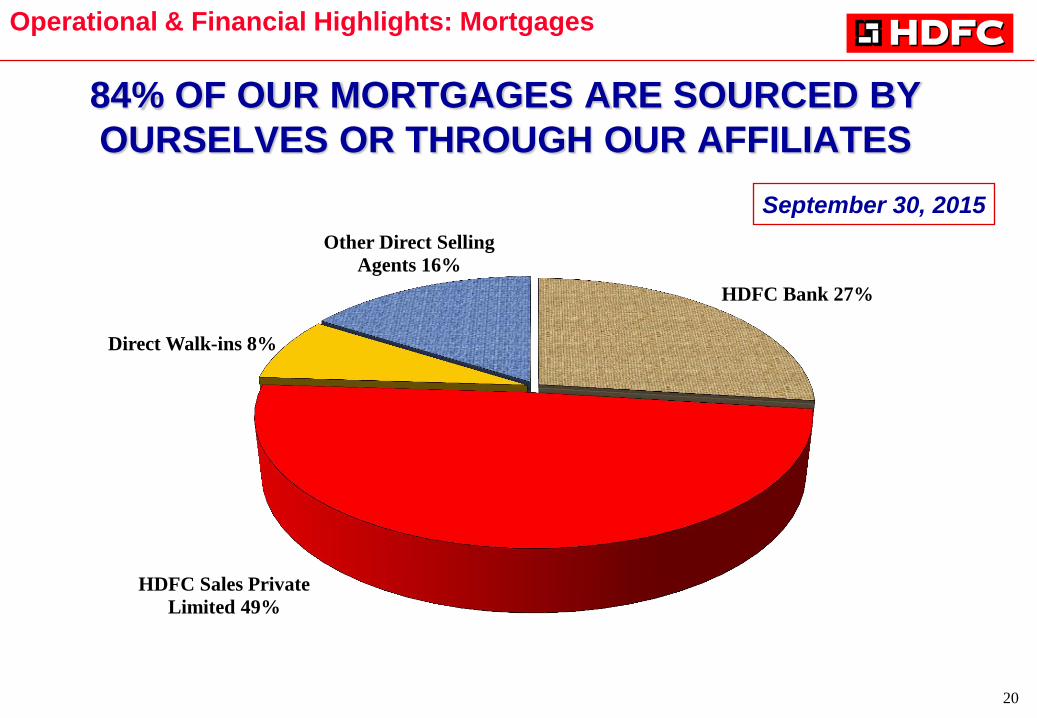
HDFC Bank 27%
HDFC Sales Private
Limited 49%
Direct Walk-ins 8%
Other Direct Selling
Agents 16%
84% OF OUR MORTGAGES ARE SOURCED BY
OURSELVES OR THROUGH OUR AFFILIATES
Operational & Financial Highlights: Mortgages
September 30, 2015
21
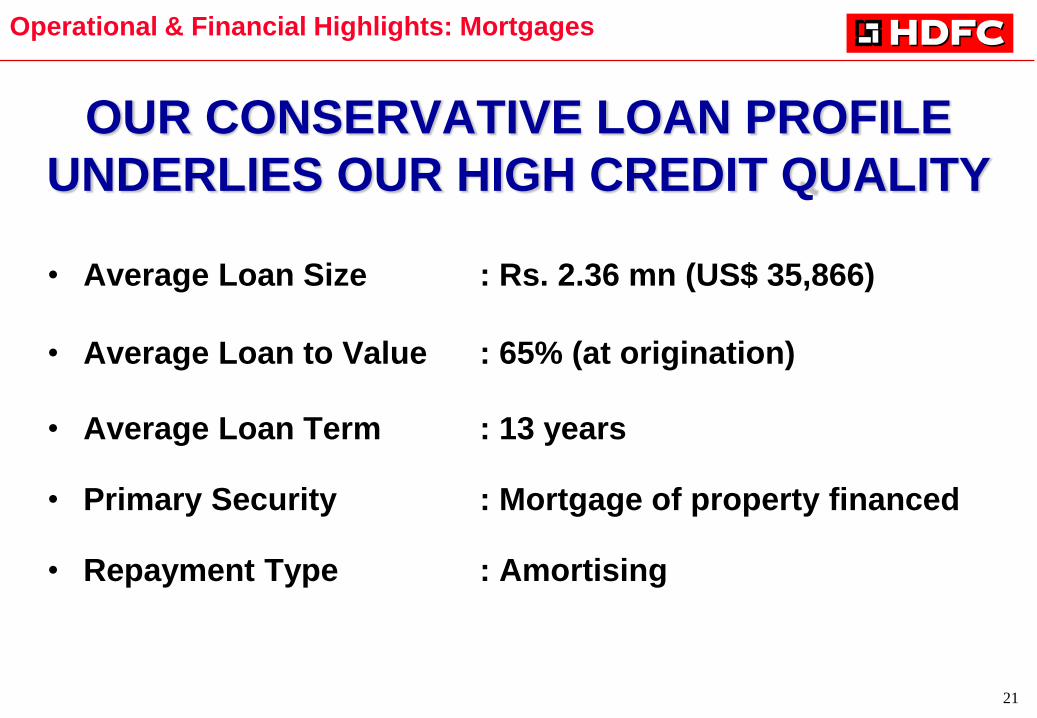
OUR CONSERVATIVE LOAN PROFILE
UNDERLIES OUR HIGH CREDIT QUALITY
• Average Loan Size : Rs. 2.36 mn (US$ 35,866)
• Average Loan to Value : 65% (at origination)
• Average Loan Term : 13 years
• Primary Security : Mortgage of property financed
• Repayment Type : Amortising
Operational & Financial Highlights: Mortgages
22
0.00%
0.20%
0.40%
0.60%
0.80%
1.00%
1.20%
Sep-13 Sep-14 Sep-15
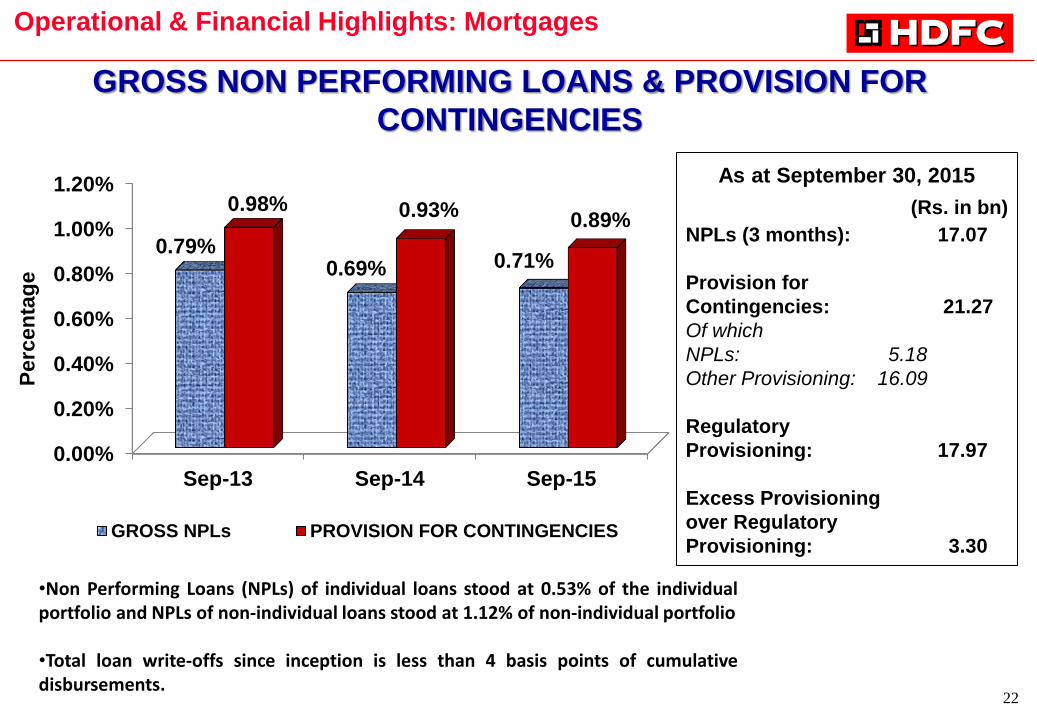
0.79% 0.69% 0.71%
0.98% 0.93% 0.89%
GROSS NPLs PROVISION FOR CONTINGENCIES
GROSS NON PERFORMING LOANS & PROVISION FOR
CONTINGENCIES
Operational & Financial Highlights: Mortgages
•Non Performing Loans (NPLs) of individual loans stood at 0.53% of the individual portfolio and NPLs of non-individual loans stood at 1.12% of non-individual portfolio
•Total loan write-offs since inception is less than 4 basis points of cumulative disbursements.
Perc
en
tag
e
As at September 30, 2015
(Rs. in bn)
NPLs (3 months): 17.07
Provision for
Contingencies: 21.27
Of which
NPLs: 5.18
Other Provisioning: 16.09
Regulatory
Provisioning: 17.97
Excess Provisioning
over Regulatory
Provisioning: 3.30
23
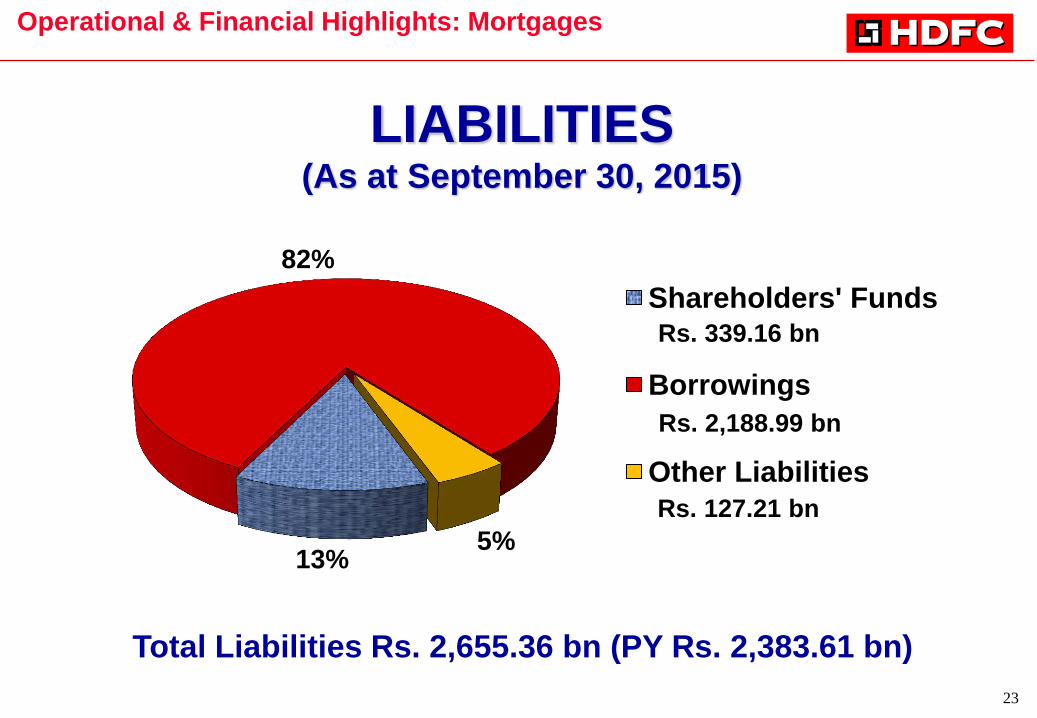
13%
82%
5%
Shareholders' Funds
Borrowings
Other Liabilities
Rs. 339.16 bn
Rs. 2,188.99 bn
Rs. 127.21 bn
LIABILITIES (As at September 30, 2015)
Operational & Financial Highlights: Mortgages
Total Liabilities Rs. 2,655.36 bn (PY Rs. 2,383.61 bn)
24
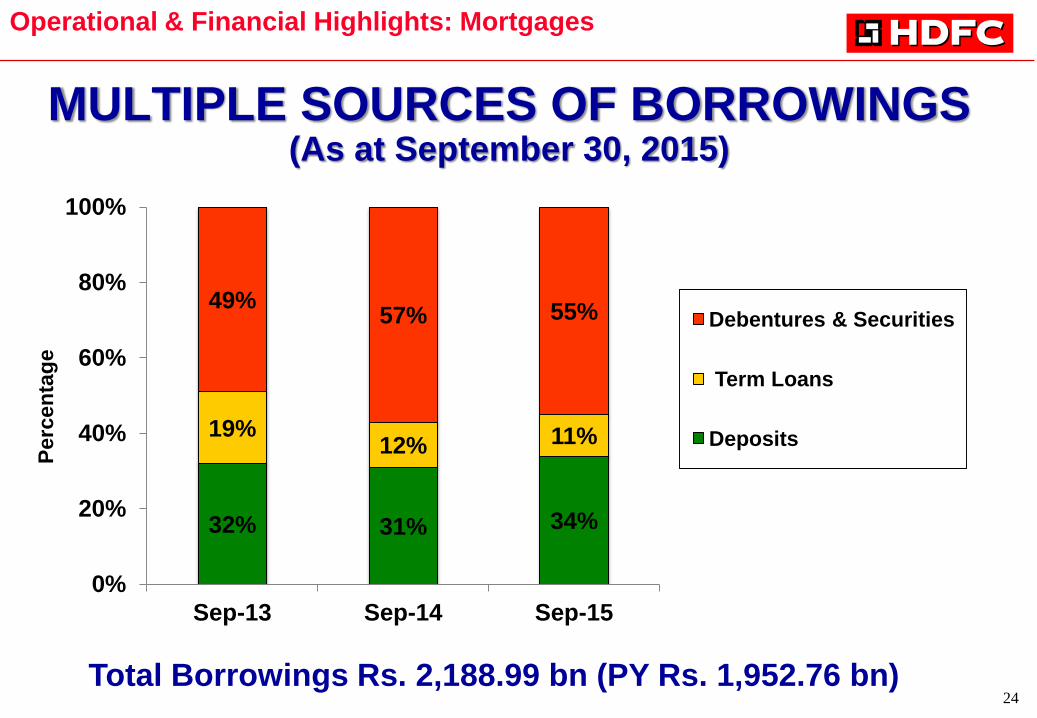
32% 31% 34%
19% 12% 11%
49% 57% 55%
0%
20%
40%
60%
80%
100%
Sep-13 Sep-14 Sep-15
Debentures & Securities
Term Loans
Deposits
MULTIPLE SOURCES OF BORROWINGS (As at September 30, 2015)
Total Borrowings Rs. 2,188.99 bn (PY Rs. 1,952.76 bn)
Operational & Financial Highlights: Mortgages P
erc
en
tag
e
25
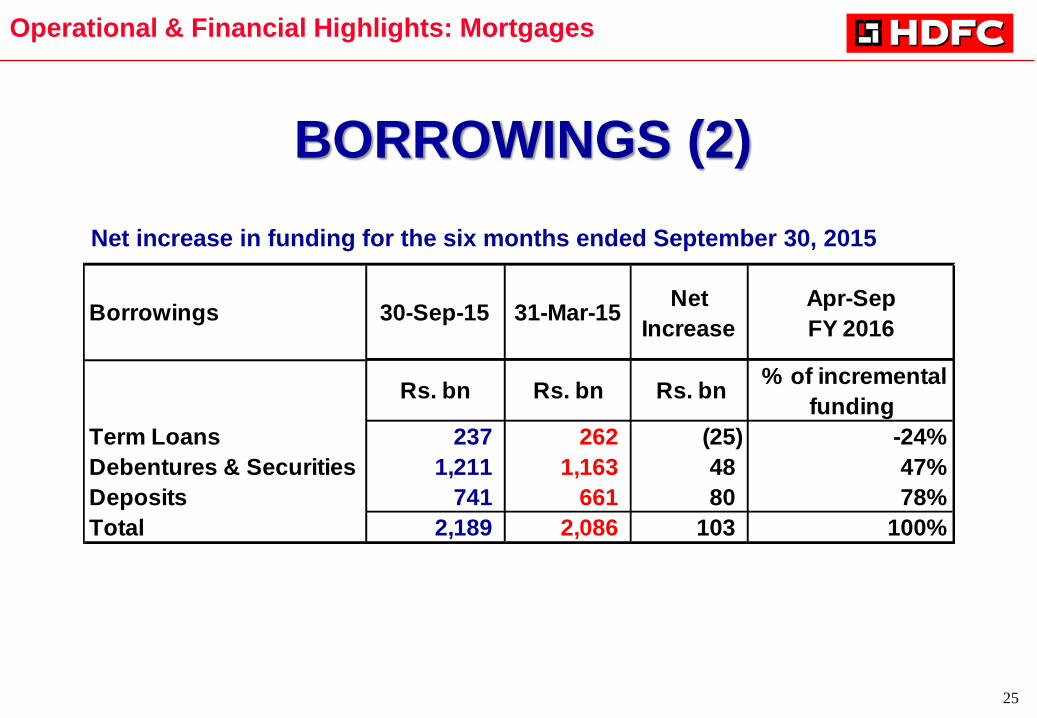
BORROWINGS (2)
Operational & Financial Highlights: Mortgages
Borrowings 30-Sep-15 31-Mar-15Net
Increase
Apr-Sep
FY 2016
Rs. bn Rs. bn Rs. bn % of incremental
funding
Term Loans 237 262 (25) -24%
Debentures & Securities 1,211 1,163 48 47%
Deposits 741 661 80 78%
Total 2,189 2,086 103 100%
Net increase in funding for the six months ended September 30, 2015
26
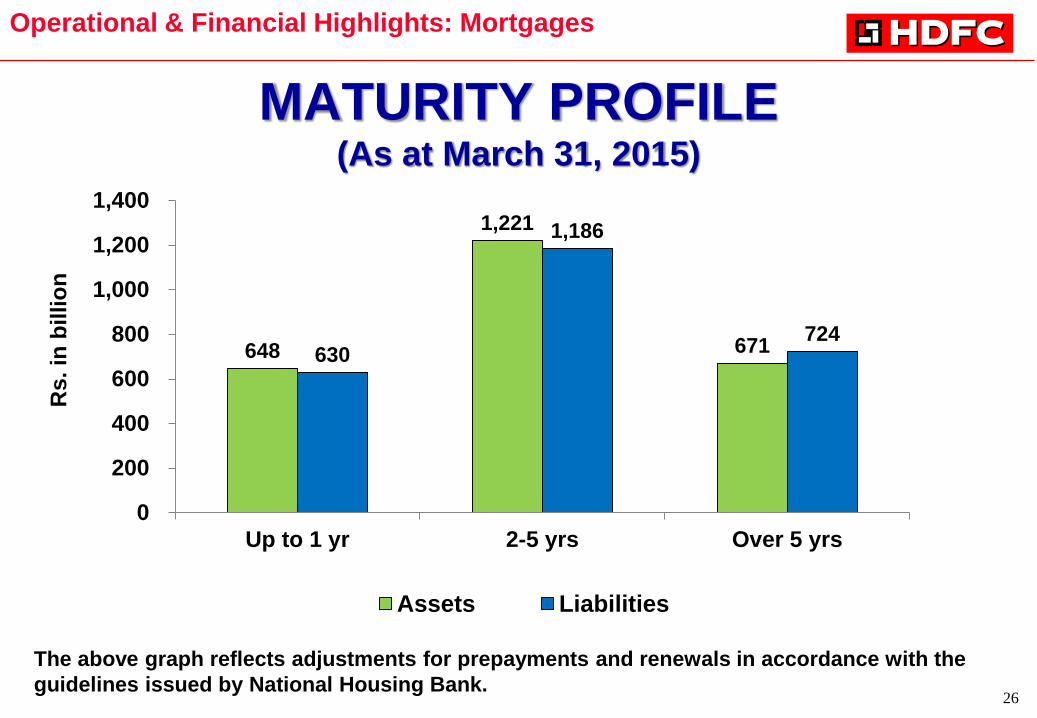
648
1,221
671 630
1,186
724
0
200
400
600
800
1,000
1,200
1,400
Up to 1 yr 2-5 yrs Over 5 yrs
Assets Liabilities
Rs
. in
billio
n
MATURITY PROFILE (As at March 31, 2015)
The above graph reflects adjustments for prepayments and renewals in accordance with the
guidelines issued by National Housing Bank.
Operational & Financial Highlights: Mortgages
27
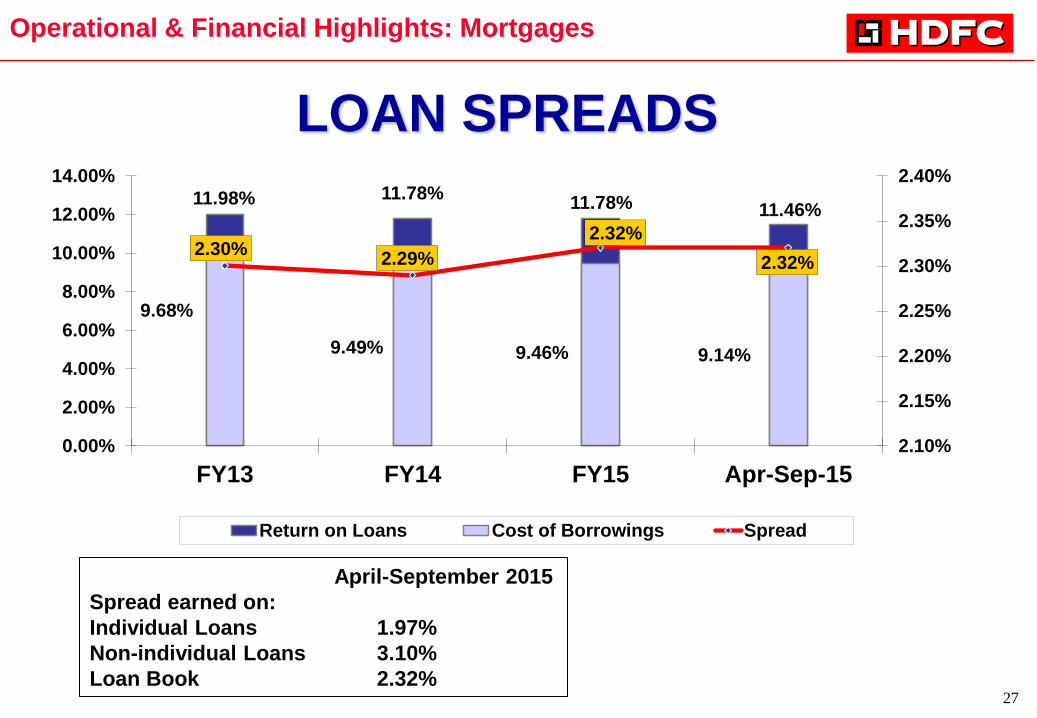
11.98% 11.78% 11.78% 11.46%
9.68%
9.49% 9.46% 9.14%
2.30% 2.29%
2.32%
2.32%
2.10%
2.15%
2.20%
2.25%
2.30%
2.35%
2.40%
0.00%
2.00%
4.00%
6.00%
8.00%
10.00%
12.00%
14.00%
FY13 FY14 FY15 Apr-Sep-15
Return on Loans Cost of Borrowings Spread
LOAN SPREADS
Operational & Financial Highlights: Mortgages
April-September 2015
Spread earned on:
Individual Loans 1.97%
Non-individual Loans 3.10%
Loan Book 2.32%
28
STRENGTHS Home Loan Strengths
• Low average loan to value ratio and instalment to income ratios
• Efficient recovery mechanisms
• Steady level of prepayments
• Quality underwriting with experience of over 38 years
Corporate Strengths
• Strong brand – customer base of 5.2 million
• Stable and experienced management – average tenor of senior
management in HDFC ~ 30 years
• High service standards
• Low cost income ratio: 7.6% (For year ended March 31, 2015)
Operational & Financial Highlights: Mortgages
29
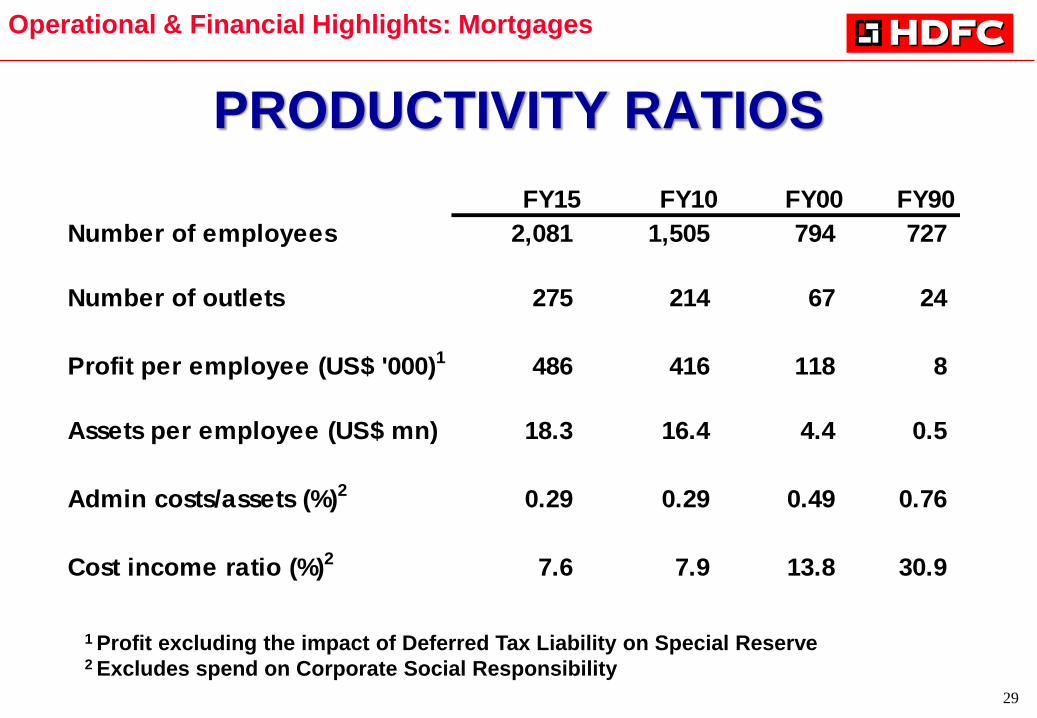
PRODUCTIVITY RATIOS
Operational & Financial Highlights: Mortgages
FY15 FY10 FY00 FY90
Number of employees 2,081 1,505 794 727
Number of outlets 275 214 67 24
Profit per employee (US$ '000)1 486 416 118 8
Assets per employee (US$ mn) 18.3 16.4 4.4 0.5
Admin costs/assets (%)2 0.29 0.29 0.49 0.76
Cost income ratio (%)2 7.6 7.9 13.8 30.9
1 Profit excluding the impact of Deferred Tax Liability on Special Reserve 2 Excludes spend on Corporate Social Responsibility
30
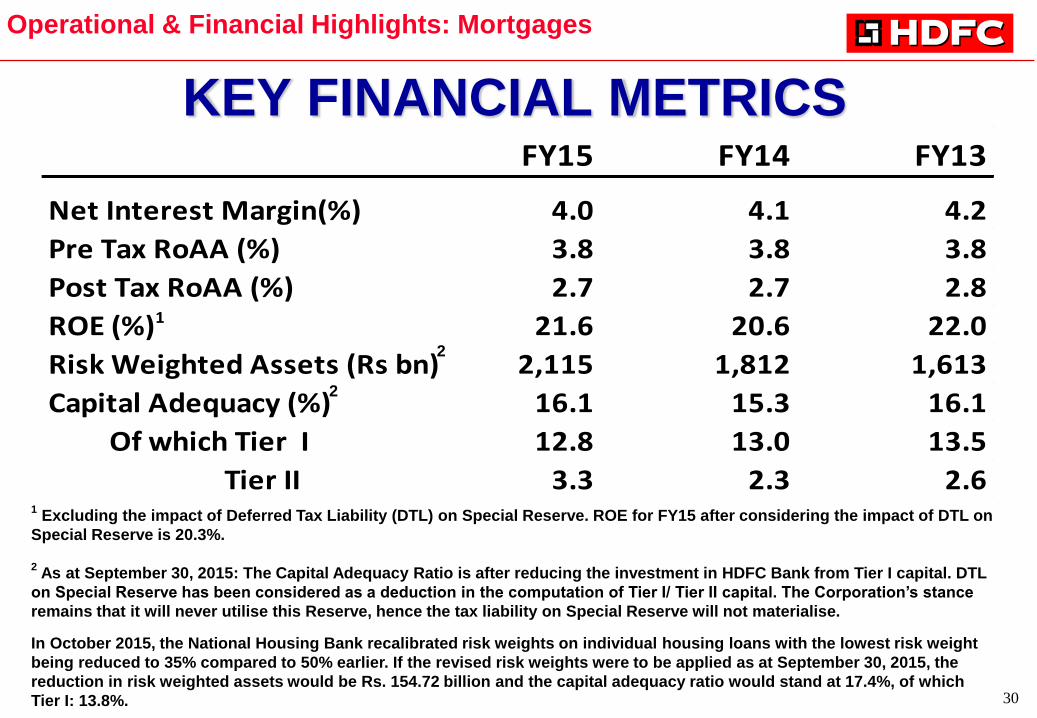
KEY FINANCIAL METRICS
Operational & Financial Highlights: Mortgages
FY15 FY14 FY13
Net Interest Margin(%) 4.0 4.1 4.2
Pre Tax RoAA (%) 3.8 3.8 3.8
Post Tax RoAA (%) 2.7 2.7 2.8
ROE (%)1 21.6 20.6 22.0
Risk Weighted Assets (Rs bn) 2,115 1,812 1,613
Capital Adequacy (%) 16.1 15.3 16.1
Of which Tier I 12.8 13.0 13.5
Tier II 3.3 2.3 2.61 Excluding the impact of Deferred Tax Liability (DTL) on Special Reserve. ROE for FY15 after considering the impact of DTL on
Special Reserve is 20.3%.
2 As at September 30, 2015: The Capital Adequacy Ratio is after reducing the investment in HDFC Bank from Tier I capital. DTL
on Special Reserve has been considered as a deduction in the computation of Tier I/ Tier II capital. The Corporation’s stance
remains that it will never utilise this Reserve, hence the tax liability on Special Reserve will not materialise.
In October 2015, the National Housing Bank recalibrated risk weights on individual housing loans with the lowest risk weight
being reduced to 35% compared to 50% earlier. If the revised risk weights were to be applied as at September 30, 2015, the
reduction in risk weighted assets would be Rs. 154.72 billion and the capital adequacy ratio would stand at 17.4%, of which
Tier I: 13.8%.
2
2
31
VALUATIONS & SHAREHOLDING
32
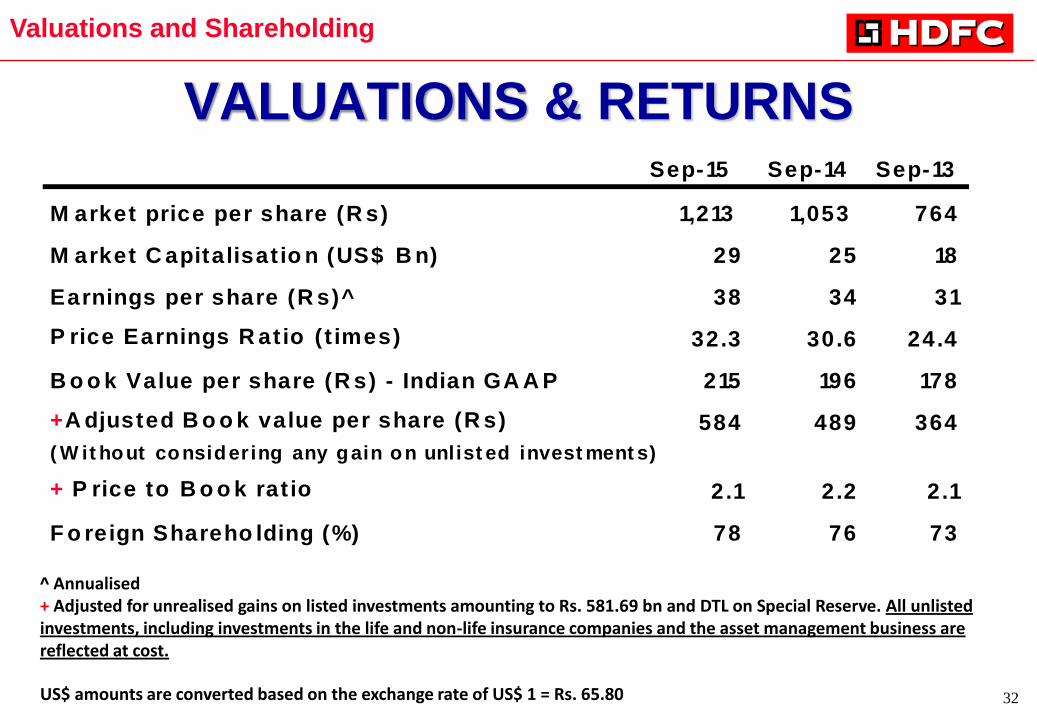
VALUATIONS & RETURNS
^ Annualised + Adjusted for unrealised gains on listed investments amounting to Rs. 581.69 bn and DTL on Special Reserve. All unlisted investments, including investments in the life and non-life insurance companies and the asset management business are reflected at cost. US$ amounts are converted based on the exchange rate of US$ 1 = Rs. 65.80
Valuations and Shareholding
Sep-15 Sep-14 Sep-13
M arket price per share (R s) 1,213 1,053 764
M arket C apitalisat io n (US$ B n) 29 25 18
Earnings per share (R s)^ 38 34 31
P rice Earnings R atio ( t imes) 32.3 30.6 24.4
B o o k Value per share (R s) - Indian GA A P 215 196 178
+A djusted B o o k value per share (R s) 584 489 364
( W it hout considering any gain on unlist ed invest ment s)
+ P rice to B o o k rat io 2.1 2.2 2.1
F o reign Shareho lding (%) 78 76 73
33
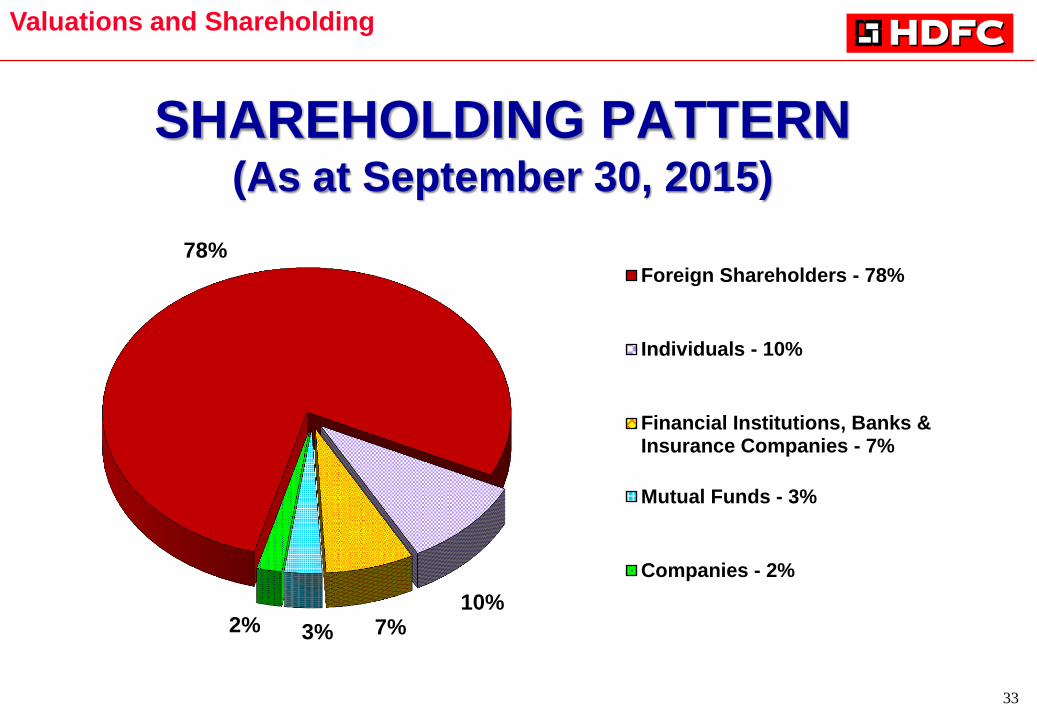
SHAREHOLDING PATTERN (As at September 30, 2015)
78%
10% 7% 3% 2%
Foreign Shareholders - 78%
Individuals - 10%
Financial Institutions, Banks &Insurance Companies - 7%
Mutual Funds - 3%
Companies - 2%
Valuations and Shareholding
34
FINANCIALS Standalone
35
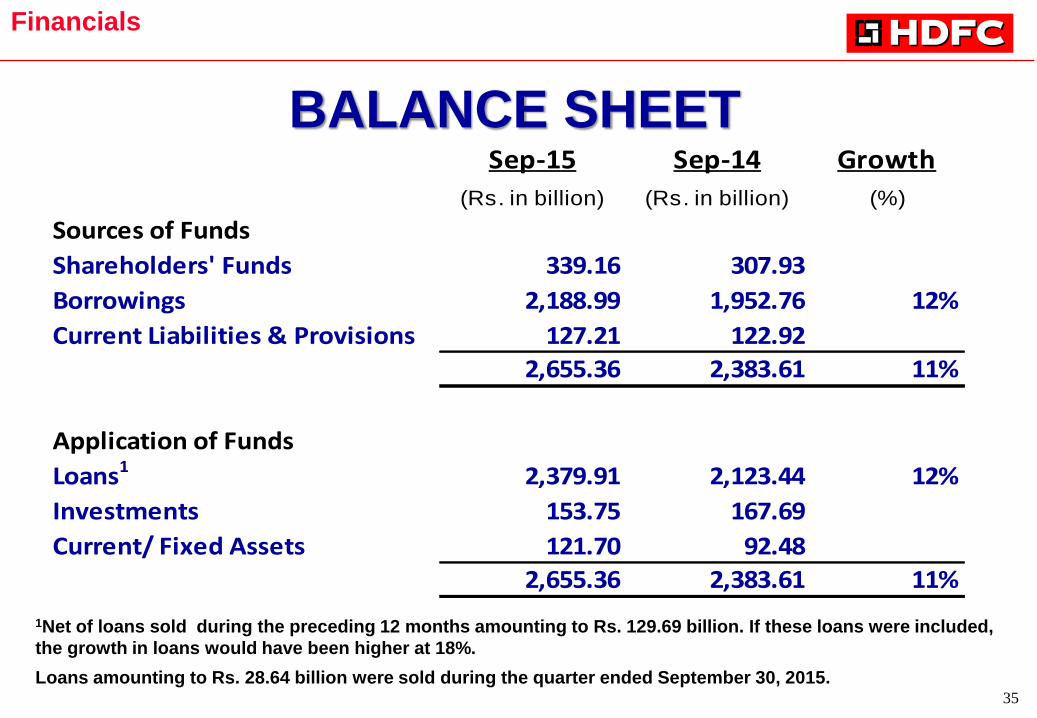
BALANCE SHEET
1Net of loans sold during the preceding 12 months amounting to Rs. 129.69 billion. If these loans were included,
the growth in loans would have been higher at 18%.
Loans amounting to Rs. 28.64 billion were sold during the quarter ended September 30, 2015.
Financials
Sep-15 Sep-14 Growth
(Rs. in billion) (Rs. in billion) (%)
Sources of Funds
Shareholders' Funds 339.16 307.93
Borrowings 2,188.99 1,952.76 12%
Current Liabilities & Provisions 127.21 122.92
2,655.36 2,383.61 11%
Application of Funds
Loans1 2,379.91 2,123.44 12%
Investments 153.75 167.69
Current/ Fixed Assets 121.70 92.48
2,655.36 2,383.61 11%
36
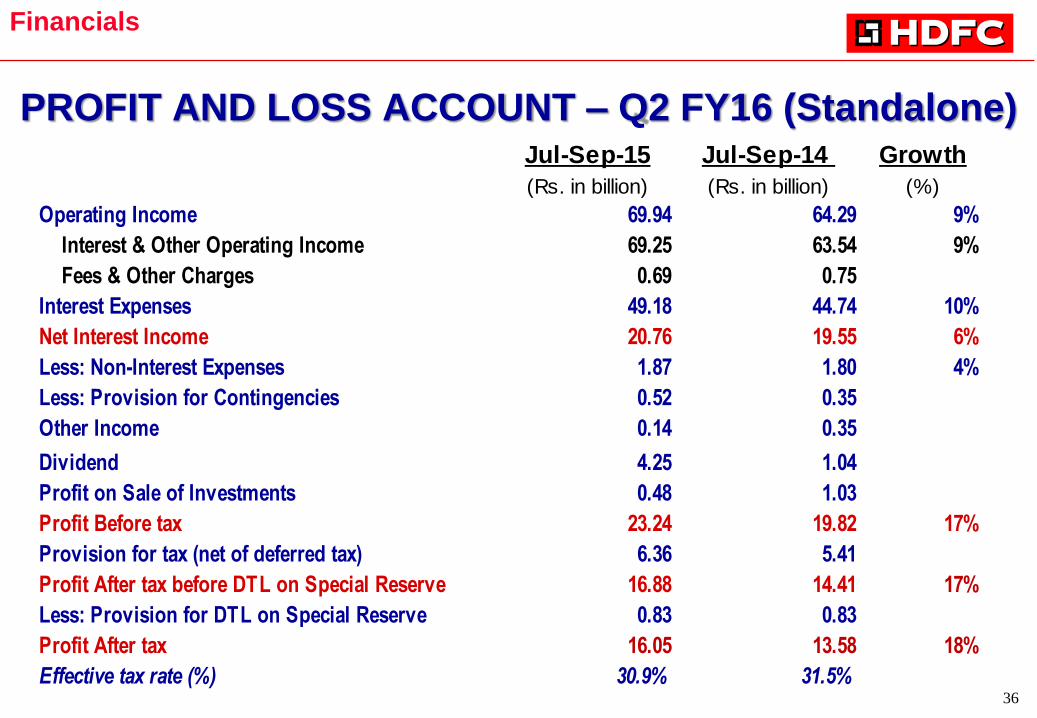
PROFIT AND LOSS ACCOUNT – Q2 FY16 (Standalone)
Financials
Jul-Sep-15 Jul-Sep-14 Growth
(Rs. in billion) (Rs. in billion) (%)
Operating Income 69.94 64.29 9%
Interest & Other Operating Income 69.25 63.54 9%
Fees & Other Charges 0.69 0.75
Interest Expenses 49.18 44.74 10%
Net Interest Income 20.76 19.55 6%
Less: Non-Interest Expenses 1.87 1.80 4%
Less: Provision for Contingencies 0.52 0.35
Other Income 0.14 0.35
Dividend 4.25 1.04
Profit on Sale of Investments 0.48 1.03
Profit Before tax 23.24 19.82 17%
Provision for tax (net of deferred tax) 6.36 5.41
Profit After tax before DTL on Special Reserve 16.88 14.41 17%
Less: Provision for DTL on Special Reserve 0.83 0.83
Profit After tax 16.05 13.58 18%
Effective tax rate (%) 30.9% 31.5%
37
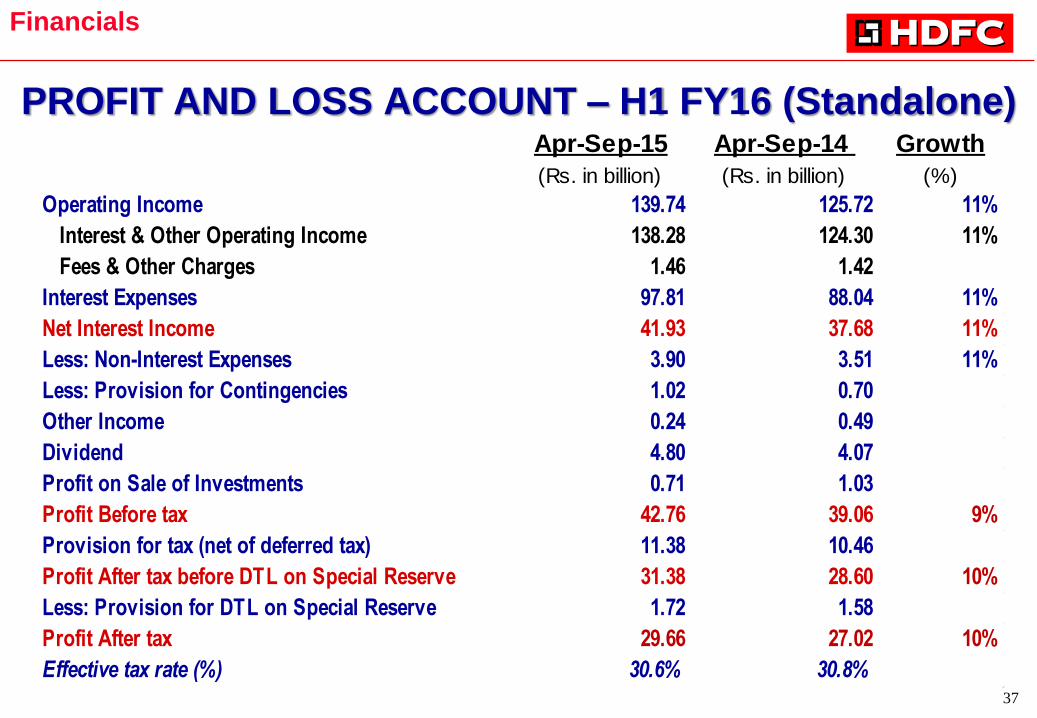
PROFIT AND LOSS ACCOUNT – H1 FY16 (Standalone)
Financials
Apr-Sep-15 Apr-Sep-14 Growth
(Rs. in billion) (Rs. in billion) (%)
Operating Income 139.74 125.72 11%
Interest & Other Operating Income 138.28 124.30 11%
Fees & Other Charges 1.46 1.42
Interest Expenses 97.81 88.04 11%
Net Interest Income 41.93 37.68 11%
Less: Non-Interest Expenses 3.90 3.51 11%
Less: Provision for Contingencies 1.02 0.70
Other Income 0.24 0.49
Dividend 4.80 4.07
Profit on Sale of Investments 0.71 1.03
Profit Before tax 42.76 39.06 9%
Provision for tax (net of deferred tax) 11.38 10.46
Profit After tax before DTL on Special Reserve 31.38 28.60 10%
Less: Provision for DTL on Special Reserve 1.72 1.58
Profit After tax 29.66 27.02 10%
Effective tax rate (%) 30.6% 30.8%
38
KEY ASSOCIATES AND
SUBSIDIARIES
39
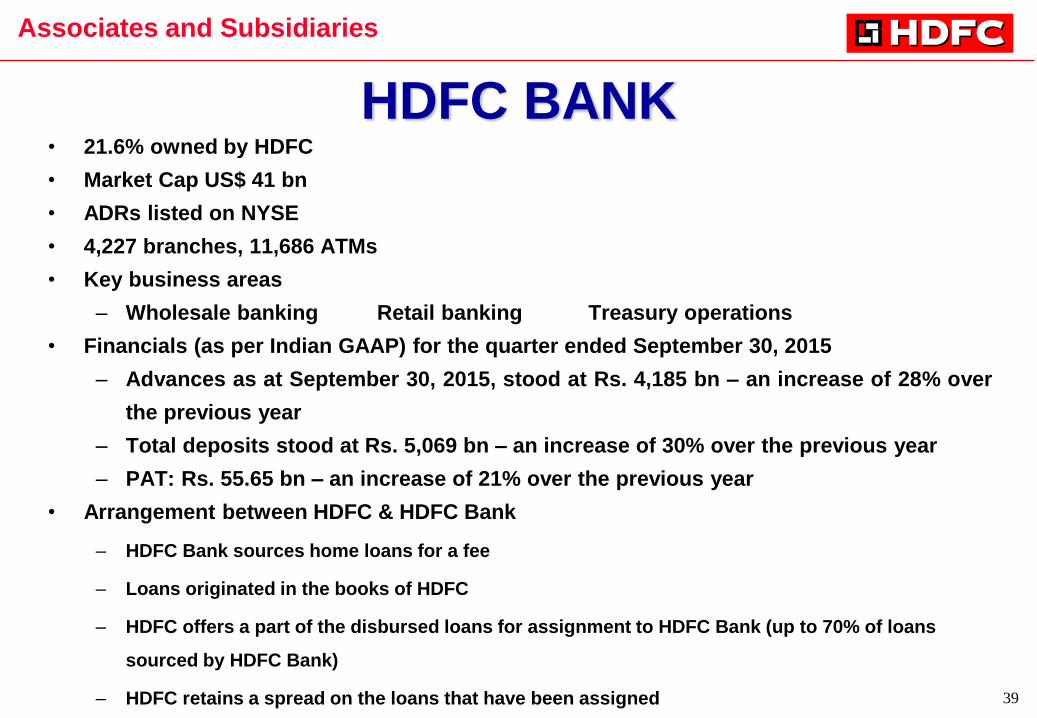
HDFC BANK • 21.6% owned by HDFC
• Market Cap US$ 41 bn
• ADRs listed on NYSE
• 4,227 branches, 11,686 ATMs
• Key business areas
– Wholesale banking Retail banking Treasury operations
• Financials (as per Indian GAAP) for the quarter ended September 30, 2015
– Advances as at September 30, 2015, stood at Rs. 4,185 bn – an increase of 28% over
the previous year
– Total deposits stood at Rs. 5,069 bn – an increase of 30% over the previous year
– PAT: Rs. 55.65 bn – an increase of 21% over the previous year
• Arrangement between HDFC & HDFC Bank
– HDFC Bank sources home loans for a fee
– Loans originated in the books of HDFC
– HDFC offers a part of the disbursed loans for assignment to HDFC Bank (up to 70% of loans
sourced by HDFC Bank)
– HDFC retains a spread on the loans that have been assigned
Associates and Subsidiaries
40
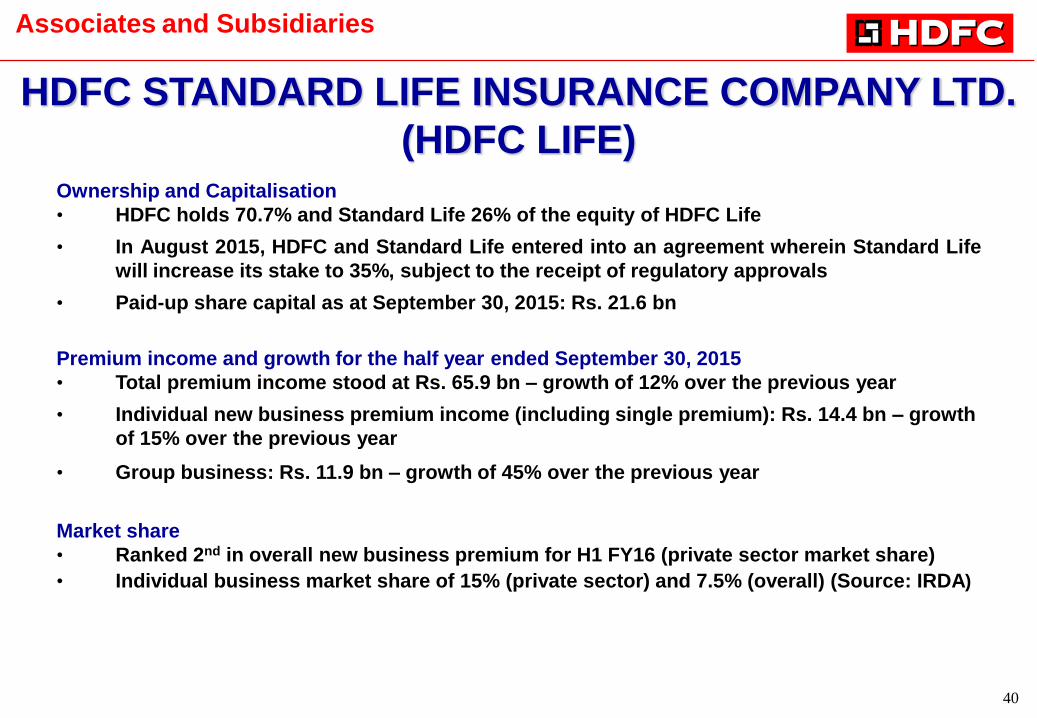
Ownership and Capitalisation
• HDFC holds 70.7% and Standard Life 26% of the equity of HDFC Life
• In August 2015, HDFC and Standard Life entered into an agreement wherein Standard Life
will increase its stake to 35%, subject to the receipt of regulatory approvals
• Paid-up share capital as at September 30, 2015: Rs. 21.6 bn
Premium income and growth for the half year ended September 30, 2015
• Total premium income stood at Rs. 65.9 bn – growth of 12% over the previous year
• Individual new business premium income (including single premium): Rs. 14.4 bn – growth
of 15% over the previous year
• Group business: Rs. 11.9 bn – growth of 45% over the previous year
Market share
• Ranked 2nd in overall new business premium for H1 FY16 (private sector market share)
• Individual business market share of 15% (private sector) and 7.5% (overall) (Source: IRDA)
HDFC STANDARD LIFE INSURANCE COMPANY LTD.
(HDFC LIFE)
Associates and Subsidiaries
41
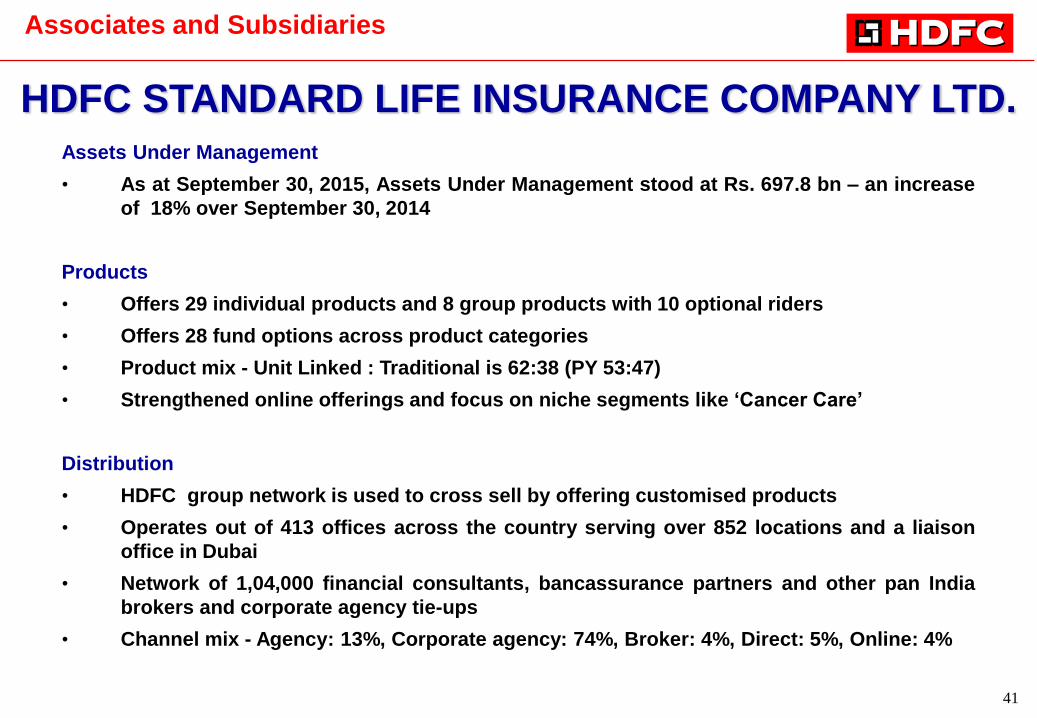
Assets Under Management
• As at September 30, 2015, Assets Under Management stood at Rs. 697.8 bn – an increase
of 18% over September 30, 2014
Products
• Offers 29 individual products and 8 group products with 10 optional riders
• Offers 28 fund options across product categories
• Product mix - Unit Linked : Traditional is 62:38 (PY 53:47)
• Strengthened online offerings and focus on niche segments like ‘Cancer Care’
Distribution
• HDFC group network is used to cross sell by offering customised products
• Operates out of 413 offices across the country serving over 852 locations and a liaison
office in Dubai
• Network of 1,04,000 financial consultants, bancassurance partners and other pan India
brokers and corporate agency tie-ups
• Channel mix - Agency: 13%, Corporate agency: 74%, Broker: 4%, Direct: 5%, Online: 4%
HDFC STANDARD LIFE INSURANCE COMPANY LTD.
Associates and Subsidiaries
42
Solvency Ratio
• As at September 30, 2015: 204% (as against regulatory requirement of 150%)
Operating highlights (Half year ended September 30, 2015)
• Commission ratio: 3.9% (PY 4.2%)
• Operating expenses: 11% (PY 10.9%)
• Conservation ratio: 81% (PY 92.5%)
Financial highlights
• Indian GAAP profits for the half year ended September 30, 2015 stood at Rs. 4.1 bn (PY Rs. 4.5 bn)
• For the half year ended September 30, 2015, pre overrun new business margin {based on loaded
acquisition expenses} for individual business stood at 22.3% (PY 20.7%)
• At the company level, pre overrun margin stood at 23.8%
• Market Consistent Embedded Value as at September 30, 2015: Rs. 95.5 bn – an increase of 22.7%
over September 30, 2014
• As at March 31, 2015: New business margin for individual business post overrun {after impact of
acquisition overrun}: 17.5% (PY 16.1%). At the company level, the post overrun margins {after the
impact of acquisition overrun}: 18.5%.
HDFC STANDARD LIFE INSURANCE COMPANY LTD.
Associates and Subsidiaries
43
HDFC ASSET MANAGEMENT • HDFC holds 59.8% of HDFC Asset Management, Standard Life Investments holds
39.9%
• HDFC MF manages 56 schemes comprising debt, equity, gold exchange traded fund
and fund of funds scheme
• Earned a Profit After Tax of Rs. 4.16 bn for FY 2015
• Average Assets under Management (AUM) for the month of September 2015, stood at
Rs. 1.73 trillion, which is inclusive of assets under discretionary portfolio management
and advisory services
• Average equity assets of HDFC MF as a proportion of total MF assets is 40%
• Largest in the industry on the basis of quarterly average assets under management
(Source: AMFI)
• Overall market share: 13.0%
• Market share of equity oriented funds: 17.9%
Associates and Subsidiaries
44
HDFC ERGO GENERAL INSURANCE COMPANY LTD.
Ownership and Capitalisation
• HDFC holds 73.6% and ERGO 26% of the equity of HDFC ERGO
• Paid up share capital as at September 30, 2015: Rs. 5.39 bn
Market share
• Market share of 7.6% (private sector) and 3.6% (overall) in terms of gross direct premium for the
half year ended September 30, 2015 (Source: GI Council)
Products
• Motor, health, travel, home and personal accident in the retail segment and property, marine,
aviation and liability insurance in the corporate segment
• Retail accounts for 60% of the total business
Distribution
• Operates out of 108 branches across the country
• HDFC group network is used to cross sell home and health insurance products
For the half year ended September 30, 2015
• Gross direct premium: Rs. 15.93 bn
• Profit After Tax: Rs. 0.69 bn (PY Rs. 0.50 bn)
• Combined Ratio as at September 30, 2015: 105.8% (after motor & declined risk pool losses)
• Solvency as at September 30, 2015: 167% (as against regulatory requirement of 150%)
Associates and Subsidiaries
45
GRUH FINANCE LIMITED (GRUH) • 58.6% owned by HDFC
• Registered housing finance company offering loans to individuals for purchase,
construction and renovation of dwelling units
• Also offers loans to the self-employed segment where formal income
proofs are not available.
• Retail network of 171 offices across 8 states in India – Gujarat, Maharashtra,
Karnataka, Madhya Pradesh, Rajasthan, Chhattisgarh, Tamil Nadu and Uttar
Pradesh
• Financials for half year ended September 30, 2015
• Loan portfolio as at September 30, 2015, stood at Rs. 99.13 bn – an increase
of 25% over the previous year
• Gross non-performing assets (NPAs): 0.58%
• PAT: Rs. 1.02 billion – an increase of 20% over the previous year
• Market Capitalisation: US$ 1.47 bn
Associates and Subsidiaries
46
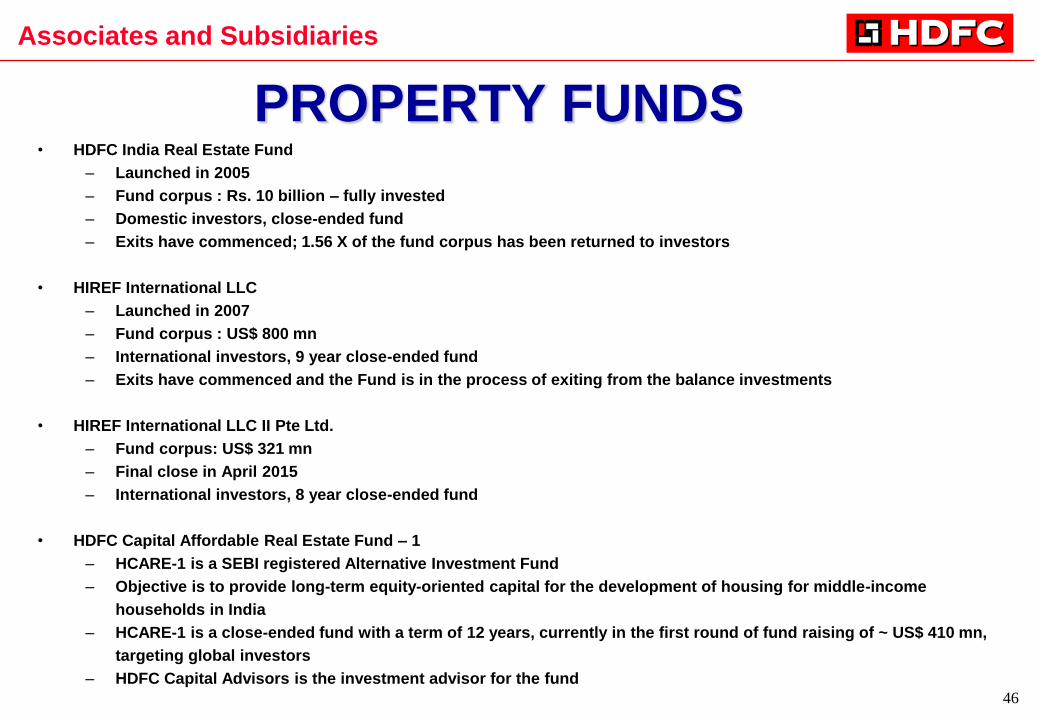
PROPERTY FUNDS • HDFC India Real Estate Fund
– Launched in 2005
– Fund corpus : Rs. 10 billion – fully invested
– Domestic investors, close-ended fund
– Exits have commenced; 1.56 X of the fund corpus has been returned to investors
• HIREF International LLC
– Launched in 2007
– Fund corpus : US$ 800 mn
– International investors, 9 year close-ended fund
– Exits have commenced and the Fund is in the process of exiting from the balance investments
• HIREF International LLC II Pte Ltd.
– Fund corpus: US$ 321 mn
– Final close in April 2015
– International investors, 8 year close-ended fund
• HDFC Capital Affordable Real Estate Fund – 1
– HCARE-1 is a SEBI registered Alternative Investment Fund
– Objective is to provide long-term equity-oriented capital for the development of housing for middle-income
households in India
– HCARE-1 is a close-ended fund with a term of 12 years, currently in the first round of fund raising of ~ US$ 410 mn,
targeting global investors
– HDFC Capital Advisors is the investment advisor for the fund
Associates and Subsidiaries
47
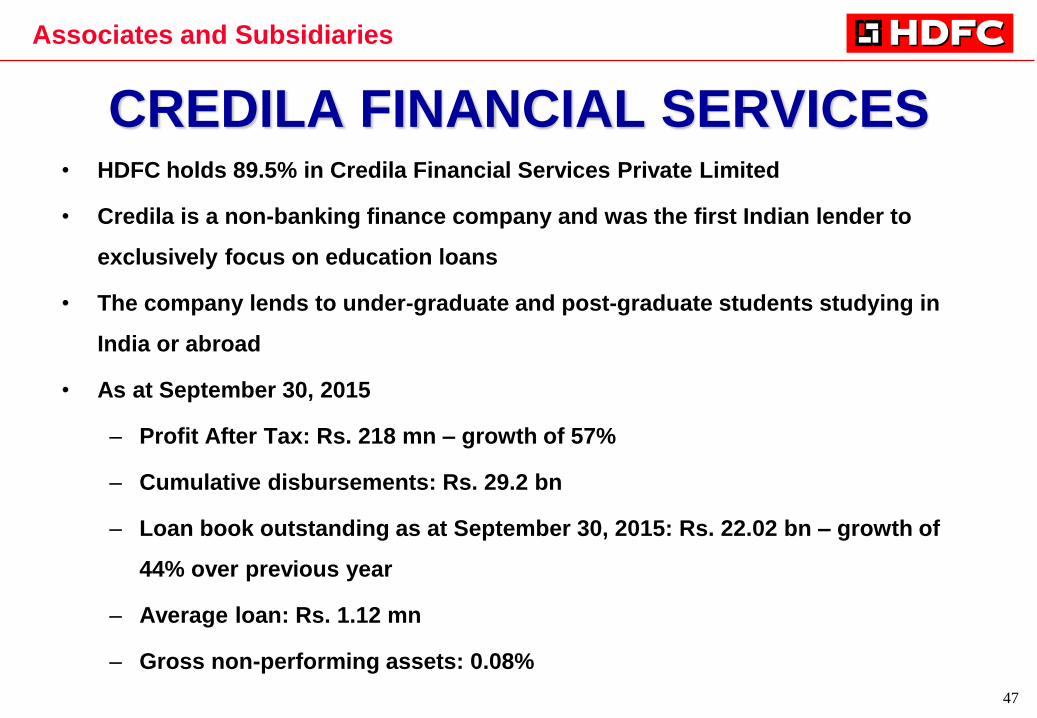
CREDILA FINANCIAL SERVICES • HDFC holds 89.5% in Credila Financial Services Private Limited
• Credila is a non-banking finance company and was the first Indian lender to
exclusively focus on education loans
• The company lends to under-graduate and post-graduate students studying in
India or abroad
• As at September 30, 2015
– Profit After Tax: Rs. 218 mn – growth of 57%
– Cumulative disbursements: Rs. 29.2 bn
– Loan book outstanding as at September 30, 2015: Rs. 22.02 bn – growth of
44% over previous year
– Average loan: Rs. 1.12 mn
– Gross non-performing assets: 0.08%
Associates and Subsidiaries
48
FINANCIALS Consolidated
49
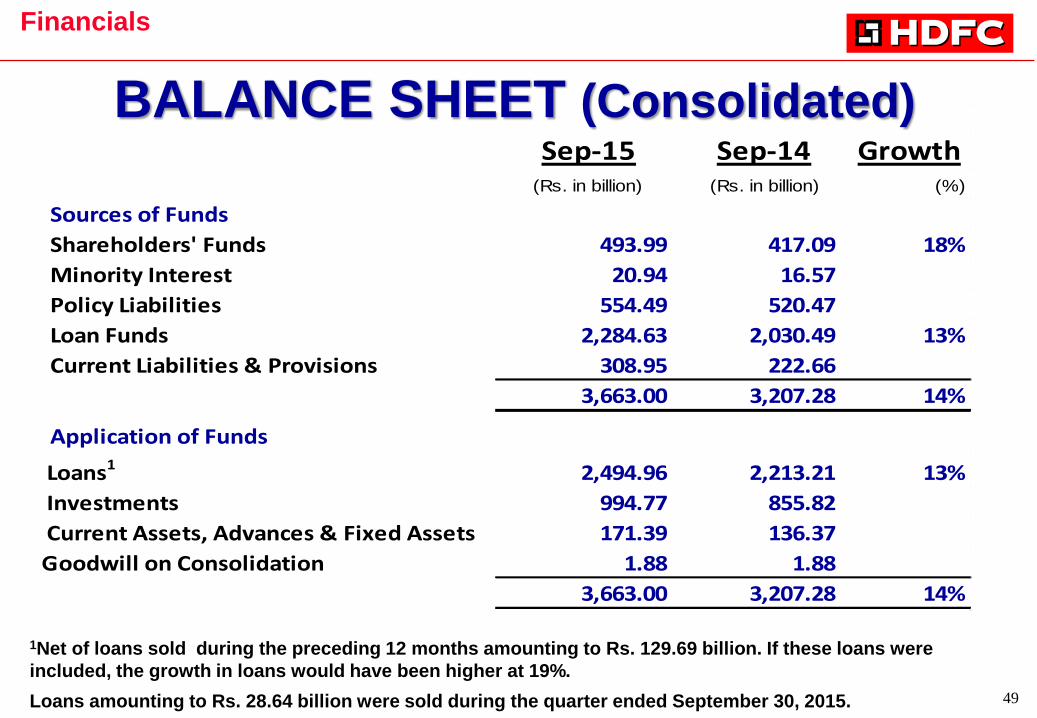
Sep-15 Sep-14 Growth(Rs. in billion) (Rs. in billion) (%)
Sources of Funds
Shareholders' Funds 493.99 417.09 18%
Minority Interest 20.94 16.57
Policy Liabilities 554.49 520.47
Loan Funds 2,284.63 2,030.49 13%
Current Liabilities & Provisions 308.95 222.66
3,663.00 3,207.28 14%
Application of Funds
Loans1 2,494.96 2,213.21 13%
Investments 994.77 855.82
Current Assets, Advances & Fixed Assets 171.39 136.37
Goodwill on Consolidation 1.88 1.88
3,663.00 3,207.28 14%
BALANCE SHEET (Consolidated)
Financials
1Net of loans sold during the preceding 12 months amounting to Rs. 129.69 billion. If these loans were
included, the growth in loans would have been higher at 19%.
Loans amounting to Rs. 28.64 billion were sold during the quarter ended September 30, 2015.
50
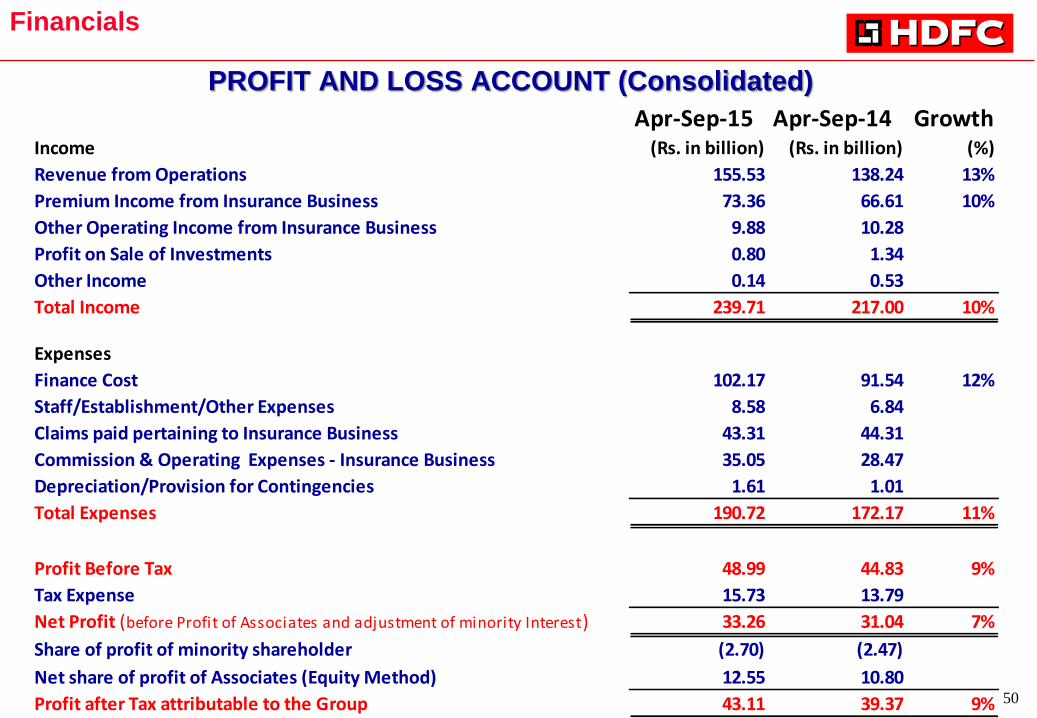
PROFIT AND LOSS ACCOUNT (Consolidated)
Financials
Apr-Sep-15 Apr-Sep-14 GrowthIncome (Rs. in billion) (Rs. in billion) (%)
Revenue from Operations 155.53 138.24 13%
Premium Income from Insurance Business 73.36 66.61 10%
Other Operating Income from Insurance Business 9.88 10.28
Profit on Sale of Investments 0.80 1.34
Other Income 0.14 0.53
Total Income 239.71 217.00 10%
Expenses
Finance Cost 102.17 91.54 12%
Staff/Establishment/Other Expenses 8.58 6.84
Claims paid pertaining to Insurance Business 43.31 44.31
Commission & Operating Expenses - Insurance Business 35.05 28.47
Depreciation/Provision for Contingencies 1.61 1.01
Total Expenses 190.72 172.17 11%
Profit Before Tax 48.99 44.83 9%
Tax Expense 15.73 13.79
Net Profit (before Profit of Associates and adjustment of minority Interest) 33.26 31.04 7%
Share of profit of minority shareholder (2.70) (2.47)
Net share of profit of Associates (Equity Method) 12.55 10.80
Profit after Tax attributable to the Group 43.11 39.37 9%
51
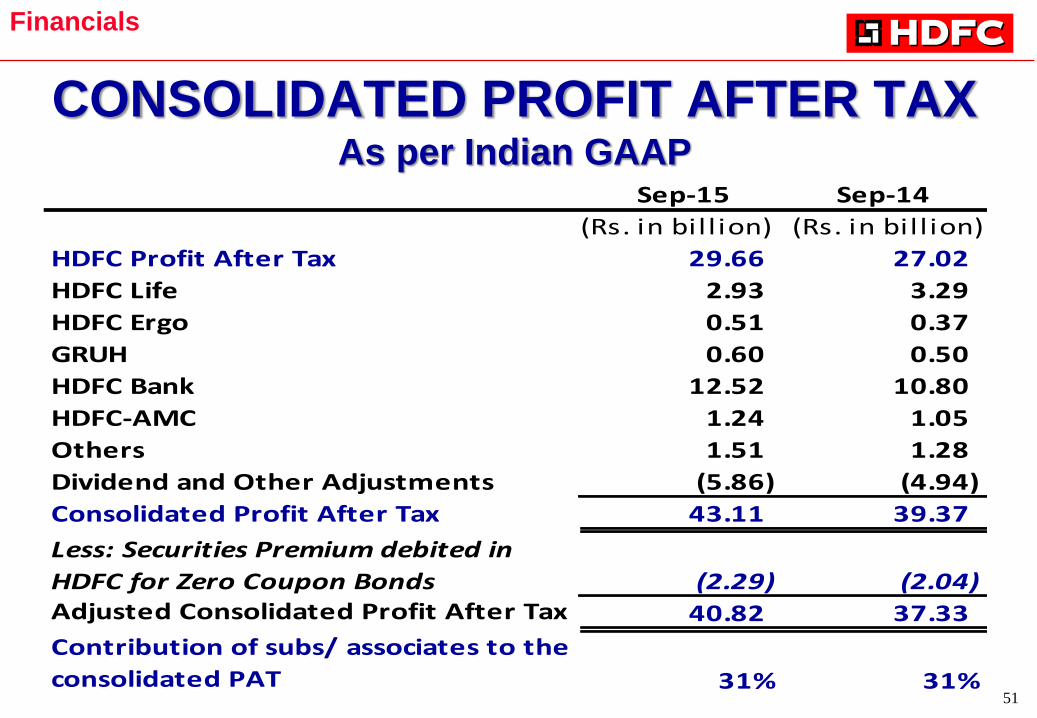
Sep-15 Sep-14
(Rs. in bil l ion) (Rs. in bil l ion)
HDFC Profit After Tax 29.66 27.02
HDFC Life 2.93 3.29
HDFC Ergo 0.51 0.37
GRUH 0.60 0.50
HDFC Bank 12.52 10.80
HDFC-AMC 1.24 1.05
Others 1.51 1.28
Dividend and Other Adjustments (5.86) (4.94)
Consolidated Profit After Tax 43.11 39.37
Less: Securities Premium debited in
HDFC for Zero Coupon Bonds (2.29) (2.04) Adjusted Consolidated Profit After Tax 40.82 37.33
Contribution of subs/ associates to the
consolidated PAT 31% 31%
CONSOLIDATED PROFIT AFTER TAX As per Indian GAAP
Financials
52
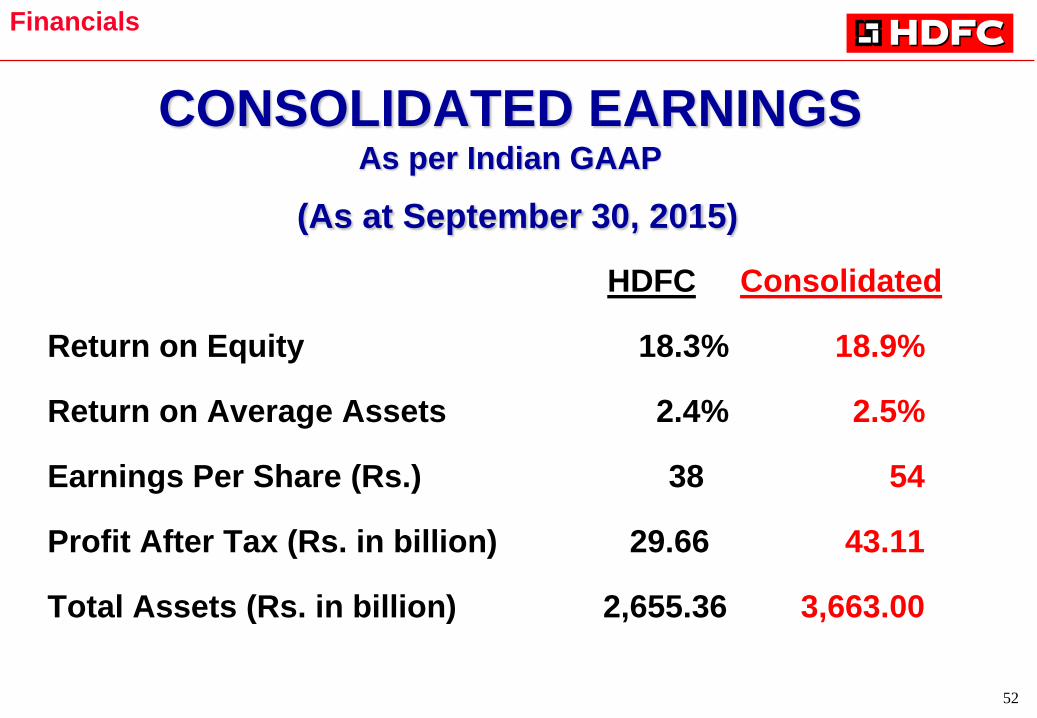
CONSOLIDATED EARNINGS As per Indian GAAP
(As at September 30, 2015)
HDFC Consolidated
Return on Equity 18.3% 18.9%
Return on Average Assets 2.4% 2.5%
Earnings Per Share (Rs.) 38 54
Profit After Tax (Rs. in billion) 29.66 43.11
Total Assets (Rs. in billion) 2,655.36 3,663.00
Financials
53
AWARDS & ACCOLADES HDFC among the Top 5 Most Impactful Companies of the last decade – CNBC Awaaz, 2014
HDFC awarded the Best Loan Finance Bank & Best Overall Bank for Real Estate in India’ at EUROMONEY Real
Estate Awards 2014
HDFC board recognised amongst the “Best Boards” by The Economic Times and Hay Group on India's Best
Boards for two consecutive years – 2013 and 2014.
Top Indian Company in the ‘Financial Institutions/Non-Banking Financial Companies/Financial Services’
category at the Dun & Bradstreet Corporate Awards 2014. The Corporation has won this award seven times.
HDFC selected as the Best Home Loan Provider by CNBC Awaaz – CNBC Awaaz Real Estate Awards 2013
HDFC adjudged the ‘Best Home Loan Provider’ for third consecutive year – Outlook Money Awards, 2013
Awarded the Qimpro-Best Prax Benchmark 2013 in Leadership Governance
HDFC is the only Indian company to be included in the fifth annual list of the ‘2011 World’s Most Ethical
Companies’ by Ethisphere Institute, USA
HDFC voted ‘Best Investor Relations’ in India – Finance Asia’s 2011 Annual Poll
HDFC ranked amongst India’s best companies to work for – Great Place to Work Institute®, 2012
Awarded the ‘Best Foreign Enterprise with a Developmental Role in Housing Finance in Africa’ – African Real
Estate & Housing Finance Academy
HDFC one of India’s ‘Best Managed Companies’ for two consecutive years – Finance Asia’s 2010 and 2011
Annual Poll
54
Disclaimer
This presentation has been prepared by Housing Development Finance Corporation Limited (HDFC) . This presentation is strictly confidential and is being provided to you solely for your information, and may not be distributed to the press
or any other person, and may not be reproduced in any form, in whole or in part. Failure to comply with this restriction may constitute a violation of applicable securities laws. No reliance may be placed for any purposes whatsoever on the
information contained in this presentation or any other material discussed verbally or on its completeness, accuracy or fairness. No representation or warranty, expressed or implied, is given by, or on behalf of, the HDFC or any of HDFC
directors, officers or employees or any other person as to the accuracy or completeness of the information or opinions contained in this document and no liability whatsoever by HDFC or any of HDFC directors, officers or employees or any
other person for any loss howsoever arising, directly or indirectly, from any use of such information or opinions or otherwise arising in connection therewith. The information in this presentation is subject to verification, completion and
change.
This presentation is not a prospectus or offering document and does not constitute or form part of and should not be construed as, an offer to sell or issue or the solicitation of an offer to buy or acquire securities of HDFC in any jurisdiction
or an inducement to enter into investment activity in any jurisdiction. Neither this presentation nor any part thereof, nor the fact of its distribution, shall form the basis of, or be relied on in connection with, any contract or commitment or
investment decision whatsoever. Investors and prospective investors in the securities of the Group are required to make their own independent investigation and appraisal of the business and financial condition of the Group and the nature
of the securities. This presentation does not constitute a recommendation regarding securities of HDFC . Any prospective purchaser of securities of HDFC is recommended to seek its own independent financial advice.
This presentation does not constitute an offer to sell, offer to purchase, or a solicitation to sell or solicitation to purchase or subscribe for securities (whether to the public or by way of private placement) within the meaning of the Indian
Companies Act, 1956, as amended, the Indian Companies Act, 2013, (including any rules made thereunder), as amended, (the “Companies Act”), the Securities and Exchange Board of India (Issue of Capital and Disclosure Requirements)
Regulations, 2009, as amended or other applicable laws of India. This presentation is not an offer document or a prospectus or a private placement offer letter or an offering circular under the Companies Act. This presentation has not
been and will not be registered as a “prospectus” with any Registrar of Companies in India and no such document will be circulated or distributed to any person in India. Any failure to comply with these restrictions may result in a violation
of applicable laws of India and other jurisdictions. No money, securities or other consideration is being solicited by this presentation or the information contained herein and, if sent in response to this presentation or the information
contained herein, will not be accepted. Neither this presentation nor any information herein nor the fact of its distribution shall form the basis of, or be relied on in connection with, any contract or commitment or investment decision
whatsoever.
This presentation is only addressed to, made available to and directed at persons who are (i) from jurisdictions that are Financial Action Task Force compliant; and (ii) are not banks incorporated in India.
No action has been made or will be taken that would permit a public offering of any securities of HDFC . This presentation is made to and directed only at (i) persons outside the United Kingdom, (ii) qualified investors or investment
professionals falling within Article 19(5) and Article 49(2)(a) to (d) of the Financial Services and Markets Act 2000 (Financial Promotion) Order 2005 (the “Order”), (iii) high net worth individuals, and other persons to whom it may lawfully be
communicated, falling within Article 49(2)(a) to (d) of the Order and (iv) persons who are “qualified investors” within the meaning of Article 2(1)(e) of the Prospectus Directive (Directive 2003/71/EC as amended by Directive 2010/73/EU)
(“qualified investors”) (such persons collectively being referred to as “Relevant Persons”). Any person who acquires securities in any offer or to whom any offer of any securities is made will be deemed to have represented and agreed that
it is a Relevant Person. By receiving this presentation you acknowledge that you will be solely responsible for your own assessment of the market and the market position of HDFC and that you will conduct your own analysis and be solely
responsible for forming your own opinion of the potential future performance of HDFC business and in all cases are capable of being categorised as a Professional Client or Eligible Counterparty for the purposes of the UK Financial
Conduct Authority’s conduct of business rules (such persons being referred to as “Relevant Persons”). This presentation must not be acted or relied on by persons who are not Relevant Persons.
Neither this presentation nor any copy of it, nor the information contained herein, in whole or in part, may be taken or transmitted into, or distributed, directly or indirectly to the United States or to any U.S person (as defined under
Regulation S under the U.S. Securities Act of 1933, as amended (“the Securities Act”). Any failure to comply with this restriction may constitute a violation of U.S. securities laws. This presentation does not constitute, and should not be
construed as, an offer to sell or the solicitation of an offer to buy securities in the United States as defined in Regulation S under the Securities Act or to any U.S. person. No securities of HDFC have been, or will be, registered under the
Securities Act or the securities laws of any state of the United States.
The distribution of this presentation in other jurisdictions (including, but by no means limited to, Singapore and Hong Kong) may also be restricted by law, and persons into whose possession this document comes should inform themselves
about, and observe, any such restrictions.
Matters discussed in this presentation may constitute forward-looking statements. Forward-looking statements are statements other than in respect of historical facts. The words “believe”, “expect”, “anticipate”, “intends”, “estimate”, “will”,
“may”, "continue”, “should” and similar expressions identify forward-looking statements. Forward-looking statements include statements regarding: objectives, goals, strategies, outlook and growth prospects; future plans, events or
performance and potential for future growth; liquidity, capital resources and capital expenditures; economic outlook and industry trends; developments of HDFC markets; the impact of regulatory initiatives; and the strength of HDFC’s
competitors. The forward-looking statements in this presentation are based upon various assumptions, many of which are based, in turn, upon further assumptions, including without limitation, management’s examination of historical
operating trends, data contained in the Group’s records and other data available from third parties. Although HDFC believes that these assumptions were reasonable when made, these assumptions are inherently subject to significant
known and unknown risks, uncertainties, contingencies and other important factors which are difficult or impossible to predict and are beyond its control. Such risks, uncertainties, contingencies and other important factors could cause the
actual results, performance or achievements of HDFC or industry results to differ materially from those results expressed or implied in this presentation by such forward-looking statements.
The information, opinions and forward-looking statements contained in this presentation speak only as at the date of this presentation, and are subject to change without notice. HDFC and its agents, employees or advisers do not intend to,
and expressly disclaim any duty, undertaking or obligation to, make or disseminate any supplement, amendment, update or revision to any of the information, opinions or forward-looking statements contained in this presentation to reflect
any change in events, conditions or circumstances. By attending the presentation to which this document relates or by accepting and/or accessing this presentation you will be taken to have represented, warranted and undertaken that (a)
you are a Relevant Person (as referred to in any context above), and (b) you have read and agree to comply with the contents of this notice.
55
Thank You
November 16, 2015