hot mix asphalt longitudinal joint evaluation · hot mix asphalt longitudinal joint evaluation a...
TRANSCRIPT
University of Arkansas, FayettevilleScholarWorks@UARK
Civil Engineering Undergraduate Honors Theses Civil Engineering
5-2009
Hot mix asphalt longitudinal joint evaluationAnnette PorterUniversity of Arkansas, Fayetteville
Follow this and additional works at: http://scholarworks.uark.edu/cveguht
Part of the Civil Engineering Commons, Construction Engineering and Management Commons,and the Structural Engineering Commons
This Thesis is brought to you for free and open access by the Civil Engineering at ScholarWorks@UARK. It has been accepted for inclusion in CivilEngineering Undergraduate Honors Theses by an authorized administrator of ScholarWorks@UARK. For more information, please [email protected].
Recommended CitationPorter, Annette, "Hot mix asphalt longitudinal joint evaluation" (2009). Civil Engineering Undergraduate Honors Theses. 5.http://scholarworks.uark.edu/cveguht/5


Hot Mix Asphalt Longitudinal Joint Evaluation

Hot Mix Asphalt Longitudinal Joint Evaluation
A thesis submitted in partial
fulfillment of the requirements for
Honors Studies in Civil Engineering
by
Annette Michelle Porter
May 2009
Department of Civil Engineering
College of Engineering
University of Arkansas

Honors Thesis Duplication Release
[Note: to comply with Public Law 94-553-October 19, 1976 of the 94th
Congress, and
Act for the General revision of the Copyright Law, Title 17 or the United States Code, the
following is to be included the paper and signed by the student.]
Honors Paper Duplication and Distribution Release
I hereby authorize the University of Arkansas Libraries to duplicate and distribute this
honors paper in any format (including electronic based distribution) when needed for
research and/or scholarship.
Agreed (Signature and date):______________________________
Name: Annette Michelle Porter______________

iv
Acknowledgements:
I would like to express my gratitude to the following people who have made the
completion of this project possible:
Dr. Stacy Williams, for her continual guidance and assistance
Ashly Pervis, for her help in obtaining the asphalt samples and conducting tests
Leela Soujanya Bhupathiraju, for her help in obtaining the asphalt samples and
conducting tests

v
Table of Contents
Abstract……………………………………………………………………………1
Introduction………………………………………………………………………..3
Background………………………………………………………………………..4
Literature Review………………………………………………………..…….…..12
Objective……………………………………………………………...….…...…....22
Test Methods…………………………………………………….………………....23
Data Analysis………………………………………………………………………25
Conclusion………………………………………………………………………….97
Works Cited………………………………………………………………………...98
Appendix A……………………………………………………………...…………101
G1 Data……………………………………………..101
G2 Data……………………………………………...111
G3 Data……………………………………………...121
G4 Data……………………………………………...131
R1 Data……………………………………………...141
R2 Data……………………………………………...151
R3 Data……………………………………………...161
R4 Data……………………………………………...171
Y1 Data……………………………………………...181
Y2 Data……………………………………………...191
Y3 Data……………………………………………...201
Y4 Data……………………………………………...211
Appendix B…………………………………………………………………………221
SSD Gmb…………………………………….………221
CoreLok Gmb…………………………………….…..222
Kuss Gmb…………………………………..…….…..223

1
Abstract:
Longitudinal joints are the portion of the road where two lanes meet and are
formed because the lanes are paved at different times. Longitudinal joints tend to be the
weakest portion of the roadway, and yet few regulations exist to control their quality.
Currently, Arkansas specifications for asphalt pavement do not include any requirements
for the measurement of joint quality. The purpose of this research project is to determine
the most effective method for evaluating longitudinal joints in hot-mix asphalt (HMA)
pavements.
Most of the literature concerning longitudinal joints focuses on density as the
determining factor of quality because density is easy to measure, and denser pavement is
less likely to allow air and water to penetrate. Numerous studies have determined that
joints with higher densities perform better than those with lower densities. However,
measurement of other asphalt properties could provide a good alternative to density
testing as a means of quality control.
For this project, three field test sites were chosen, one site which was of good
quality, one which was of marginal quality, and one which was of poor quality. Several
cores were taken from these sites across the longitudinal joint and analyzed using the
following methods: AASHTO T-166 (SSD), AASHTO T-331 (CoreLok), Kuss
displacement, percent water absorbed, ASTM PS-129 (permeability), AASHTO T-30
(gradation), and oven derived percent binder content.
The data resulting from the various laboratory tests were visually and statistically
analyzed to determine which method of testing yields data having the most direct
correlation to the performance of the core and provides the greatest discrimination among
2
the different levels of joint quality. The purpose of this study was to identify which
testing method shows the greatest relative differentiation of quality across the joint and
from site to site so that this method may be studied further in order to recommend a
minimum standard for the quality of longitudinal joints.
By testing longitudinal joints and maintaining a minimum quality, the life of the
pavement will be extended and the necessary amount of both scheduled and unscheduled
pavement maintenance will be reduced, thus decreasing the cost of maintenance.
3
Introduction:
Longitudinal joints in asphalt pavement occur where two lanes meet. When the
first lane is paved, it is compacted and allowed to cool. Thus, this side of the road is
referred to as the “cold” side. The second lane is paved afterwards; it is referred to as the
“hot” side because asphalt is hot when it is freshly placed. Longitudinal joints are
vulnerable to failures because the edges of the first lane lack confinement. When another
lane is added, the joint area has a lower density than the other parts of the roadway,
allowing more air and water to enter the pavement in that area.
The presence of air and water within a pavement is a primary instigator and
accelerator of damages. Excess air causes the binder in the mix to oxidize more rapidly,
resulting in dry and brittle pavement which is prone to fatigue cracking failures. Extra
water in the pavement can lead to softening of the subgrade, which results in rutting,
cracking, and potholes. Water can also cause the binder in the asphalt mix to separate
from the aggregate particles, leaving the pavement more vulnerable to damage. Because
joints are prone to having these types of problems, the quality of joints is critical in the
overall durability of the pavement.

4
Background:
Joints are formed where two adjacent lanes meet because the two lanes must be
paved separately. A variety of techniques exist for constructing joints. Some of the more
common methods are described below.
Methods of compacting two adjacent lanes include “rolling from the hot side” and
“rolling from the cold side.” Rolling from the hot side is a method of joint construction
where the hot side is compacted with an overlap onto the cold side. Rolling from the cold
side is the opposite; the cold side is compacted and overlaps onto the hot side. A tack
coat, made of a bituminous liquid asphalt material, may be applied to edges in order to
promote bonding between the two lanes.
Other methods of joint construction involve the formation of the edges. “Cutting
Wheel” is a technique where one to two inches of the unconfined edge of a lane are
removed after initial compaction but before the mix cools. The adjacent lane is then
paved. Edge restraining devices may also be used while paving in order to confine edges
and increase density. “Wedge Joints” may be created by placing a sloped steel plate on
the corner of the paver screed, forming a tapered edge.
Most of the literature concerning longitudinal joints focuses on density as the
determining factor of quality because density is easy to measure, and denser pavement is
less likely to allow air and water to penetrate. Numerous studies have determined that
joints with higher densities perform better than those with lower densities. Denser
pavements have fewer air voids, so the air voids are less likely to be connected to each

5
other. Therefore, denser pavements are less likely to allow air and water to enter the
pavement structure. For this reason, density can be a reasonable measure of quality for
joints.
Although joint quality is typically determined by density, a number of other
properties such as permeability, percent water absorbed, gradation, or percent binder may
be tested to quantify quality.
Permeability could also be an effective descriptor of the quality of pavement
because permeability describes how many of the air voids within the pavement are
connected, allowing air and water to penetrate deep into the pavement structure.
Gradation could also be an important descriptor of quality; if the mix has
segregated near the edge of the lane, the pavement around the joint will be poorly graded.
When segregation occurs, a disproportionate amount of coarse aggregate separates from
the mix forming a section of pavement which has different properties than the
surrounding pavement. The section containing large quantities of coarse aggregate will
likely contain many interconnected voids and thus allow air and water to penetrate
readily.
While joint quality is essential to the performance and life of a pavement, many
states do not have any regulation of joint quality during construction. The regulations of
each state are shown in Table 1 below.
TABLE 1- STATE REGULATIONS
State: AL
Density testing Use nuclear gauge; compare each 1000 ft to theoretical max mix density. Longitudinal joint density requirement no
Other requirements Joints must be rolled on first pass, layers offset by 6 inches
State: AK
Density testing full depth 6 in. core samples taken within 24 hours after final rolling Longitudinal joint density requirement joint must be > 91% of max specific gravity

6
Other requirements layers of longitudinal joints offset by 6 inches
State: AZ
Density testing target density is 98% of lab density Longitudinal joint density requirement no
Other requirements no
State: CA
Density testing no Longitudinal joint density requirement no
Other requirements joints should be rolled from lower edge to highest portion
State: CO
Density testing target density is 96% of max theoretical density, tested using cores Longitudinal joint density requirement 92% of max theoretical density
Other requirements no
State: CT
Density testing no Longitudinal joint density requirement >90% and <97% of the theoretical void free density
Other requirements no
State: DE
Density testing
mean pavement compaction at least 98% of control strip target density, individual results at least 96%
Longitudinal joint density requirement no
Other requirements no
State: Federal Lands Highways
Density testing
nuclear gauge readings calibrated based on core samples, use control strip, >90% of max specific gravity
Longitudinal joint density requirement no
Other requirements apply an asphalt tack coat to the edge of longitudinal joints
State: FL
Density testing
Gmm based on corresponding sublot, average >93% of Gmm and individuals > 91%
Longitudinal joint density requirement no
Other requirements offset layers of joints by 6-12 inches
State: GA
Density testing
not required for 90 lb/yd2 or less, 4.75 mm mix, or asphaltic concrete OGFC and PEM
Longitudinal joint density requirement no
Other requirements
clean and tack vertical face of longitudinal joint, must not exceed 7.8 % Mean Air Voids
State: HI
Density testing No Longitudinal joint density requirement No
Other requirements longitudinal joints should be rolled first, then follow regular rolling procedures
State: ID
Density testing No
Longitudinal joint No
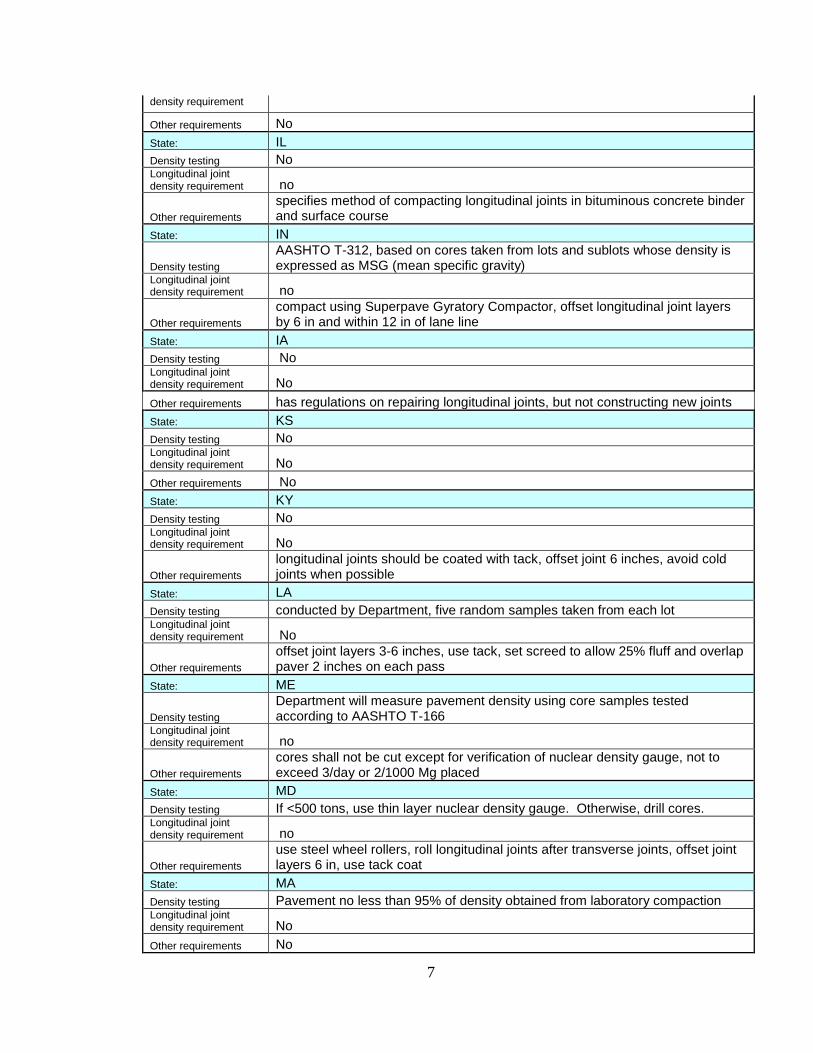
7
density requirement
Other requirements No
State: IL
Density testing No Longitudinal joint density requirement no
Other requirements
specifies method of compacting longitudinal joints in bituminous concrete binder and surface course
State: IN
Density testing
AASHTO T-312, based on cores taken from lots and sublots whose density is expressed as MSG (mean specific gravity)
Longitudinal joint density requirement no
Other requirements
compact using Superpave Gyratory Compactor, offset longitudinal joint layers by 6 in and within 12 in of lane line
State: IA
Density testing No Longitudinal joint density requirement No
Other requirements has regulations on repairing longitudinal joints, but not constructing new joints
State: KS
Density testing No Longitudinal joint density requirement No
Other requirements No
State: KY
Density testing No Longitudinal joint density requirement No
Other requirements
longitudinal joints should be coated with tack, offset joint 6 inches, avoid cold joints when possible
State: LA
Density testing conducted by Department, five random samples taken from each lot Longitudinal joint density requirement No
Other requirements
offset joint layers 3-6 inches, use tack, set screed to allow 25% fluff and overlap paver 2 inches on each pass
State: ME
Density testing
Department will measure pavement density using core samples tested according to AASHTO T-166
Longitudinal joint density requirement no
Other requirements
cores shall not be cut except for verification of nuclear density gauge, not to exceed 3/day or 2/1000 Mg placed
State: MD
Density testing If <500 tons, use thin layer nuclear density gauge. Otherwise, drill cores. Longitudinal joint density requirement no
Other requirements
use steel wheel rollers, roll longitudinal joints after transverse joints, offset joint layers 6 in, use tack coat
State: MA
Density testing Pavement no less than 95% of density obtained from laboratory compaction Longitudinal joint density requirement No
Other requirements No

8
State: MI
Density testing No Longitudinal joint density requirement No
Other requirements
longitudinal joints shall be vertical or tapered and coincide with painted lane lines
State: MN
Density testing
Use AASHTO T-166 Mn/DOT modified for bulk specific gravity. Two cores must not differ by more than 0.03.
Longitudinal joint density requirement subject to density requirements of pavement
Other requirements No
State: MS
Density testing
avg lot density must be 92-95% of max density based on AASHTO T-209. Use nuclear gauge and cores.
Longitudinal joint density requirement No
Other requirements No
State: MO
Density testing 94+or- 2% of theoretical max specific gravity for all mixes except SP125xSM Longitudinal joint density requirement No less than 2% below specified density within 6 inches of a joint.
Other requirements
VMA shall be within -0.5 or +2.0% and air voids shall be within +or-1.0% of requirement for mix type.
State: MT
Density testing No Longitudinal joint density requirement No
Other requirements No
State: NE
Density testing use core samples for density testing Longitudinal joint density requirement No
Other requirements all voids shall be filled when constructing longitudinal joints
State: NV
Density testing No Longitudinal joint density requirement No
Other requirements
offset joint layers by 6 in., within 12 in. of final traffic lanes, no more than one joint within same traffic lane
State: NH
Density testing No Longitudinal joint density requirement No
Other requirements
no joints over 3/4 in. high left open to traffic unless wedge joint is used, no joint open more than 30 hours.
State: NM
Density testing
mean density >92% of theoretical max density determined by AASHTO T-209. Each test shall be 89-98%.
Longitudinal joint density requirement No
Other requirements No
State: NY
Density testing 2 options: 1) if avg of cores is <88% of theoretical density, must be evaluated
2) cores should be 92-97% of mix avg daily max theoretical density

9
test section: density is 96-103% of PTD in a test, 98% of PTD as moving avg of last 10 tests by nuclear gauge.
Longitudinal joint density requirement No
Other requirements No
State: NC
Density testing pavement at least 92% of Gmm by AASHTO T-209 Longitudinal joint density requirement No
Other requirements No
State: ND
Density testing
avg density of field cores at least 91% of daily avg MTD, each sublot must avg 89% of daily avg MTD
Longitudinal joint density requirement No
Other requirements air voids 3-5%, joints tacked
State: OH
Density testing take 10 cores to determine MSG, pavement should be 92-97% of MSG. Longitudinal joint density requirement No
Other requirements max slope of 3:1 for wedge joint,
State: OK
Density testing avg lot density should be 92-97% of MTD Longitudinal joint density requirement No
Other requirements joints must be within 1 ft of lane lines, top layer at lane line, use tack coat
State: OR
Density testing No Longitudinal joint density requirement No
Other requirements No
State: PA
Density testing use control strip and nuclear gauge Longitudinal joint density requirement No
Other requirements
offset joint layers by 6 in, paint edge of lane with thin coating of bituminous material before abutting lanes
State: RI
Density testing
95% of lab Marshall specimens by AASHTO T-245, measure using nuclear gauge
Longitudinal joint density requirement No
Other requirements
joints brush-painted or pressure sprayed with bituminous tack coat, stagger joints by 6 in.
State: SC
Density testing 92% of MSG Longitudinal joint density requirement No
Other requirements
offset joint layers by 6 in., within 12 in. of lane line. For confined edges, first pass adjacent to edge shall be on hot
mat 6 in. from joint. For unconfined edges, compaction shall extend 6 in. beyond the edge of the mat.
State: TN
Density testing
bituminous plant mix base: grades A,B avg density >92%, individual >90% of TMD. Grades B-M, C avg 92%,

10
individual 90%, Grade C-W, avg >88%, individual >85%. Asphaltic Concrete Surface Course: Grade D avg
92%,individual >90%, Grade F avg 92%, individual 89%, Grade A,B,B-M, C, D, E avg 90%, individual 87% for
ADT of >1000, avg 91%, individual 89% for ADT between 1000 and 3000. Determine BSG by AASHTO T-166, Method A or C.
Longitudinal joint density requirement No
Other requirements No
State: TX
Density testing test by Tex-207-F and Tex-227-F, optimum density is 96% +or-1.5% Longitudinal joint density requirement No
Other requirements
compact 5-9% air voids calculated using max theoretical specific gravity by Tex-227-F
State: UT
Density testing No
Longitudinal joint density requirement
take at least one core per sublot from joint for density test, used for information only.
Other requirements
offset joints 6-12 in, top course within 12 in. of centerline, if previous pass cooled below 175F,tack edge
State: VT
Density testing
density 92-96% of daily avg specific gravity. Values >98% or <90% will be evaluated by Engineer
Longitudinal joint density requirement No
Other requirements contains specific directions on construction of butt or tapered joints
State: VA
Density testing
use control strip, mean density of section at least 98% of mean density of control strip, individual at least 95%.
Use thin-lift nuclear gage on backscatter Longitudinal joint density requirement No
Other requirements No
State: WA
Density testing No
Longitudinal joint density requirement
check for density below 90% of reference maximum density. If one is found, $200/lot price adjustment.
Other requirements No
State: WV
Density testing pavement density 92-96% of target density Longitudinal joint density requirement No
Other requirements No
State: WI
Density testing
calculate max specific gravity by AASHTO T-209 and bulk specific gravity by AASHTO T-166.
Traffic lanes must be 91.5% of target max density for mix types E-0.3, E-1, and E-3; 92% for E-10, E-30, and E-30X, 94% of SMA. Use nuclear gauge.
Longitudinal joint density requirement No
Other requirements No
State: WY
Density testing use test strip, avg density of 10 samples at least 95% of max density, individual

11
no less than 92% Longitudinal joint density requirement No
Other requirements No
Currently, Arkansas specifications for asphalt pavement do not include any
requirements for the measurement of joint quality. The purpose of this research project is
to determine the most effective method for evaluating longitudinal joints in hot-mix
asphalt (HMA) pavements based on the method’s ability to provide relative
differentiation of quality across the joint of the pavement. By improving the quality of
longitudinal joints, the life of the pavement extended, and the overall quality of the road
will be improved.
12
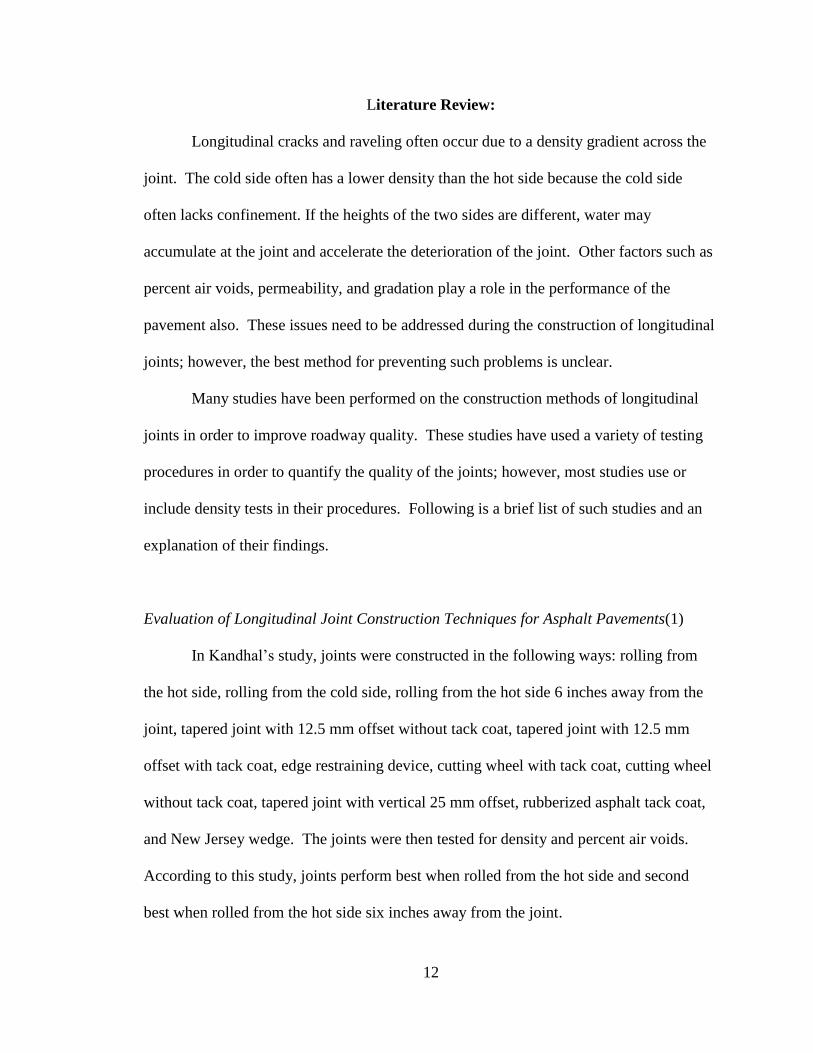
Literature Review:
Longitudinal cracks and raveling often occur due to a density gradient across the
joint. The cold side often has a lower density than the hot side because the cold side
often lacks confinement. If the heights of the two sides are different, water may
accumulate at the joint and accelerate the deterioration of the joint. Other factors such as
percent air voids, permeability, and gradation play a role in the performance of the
pavement also. These issues need to be addressed during the construction of longitudinal
joints; however, the best method for preventing such problems is unclear.
Many studies have been performed on the construction methods of longitudinal
joints in order to improve roadway quality. These studies have used a variety of testing
procedures in order to quantify the quality of the joints; however, most studies use or
include density tests in their procedures. Following is a brief list of such studies and an
explanation of their findings.
Evaluation of Longitudinal Joint Construction Techniques for Asphalt Pavements(1)
In Kandhal’s study, joints were constructed in the following ways: rolling from
the hot side, rolling from the cold side, rolling from the hot side 6 inches away from the
joint, tapered joint with 12.5 mm offset without tack coat, tapered joint with 12.5 mm
offset with tack coat, edge restraining device, cutting wheel with tack coat, cutting wheel
without tack coat, tapered joint with vertical 25 mm offset, rubberized asphalt tack coat,
and New Jersey wedge. The joints were then tested for density and percent air voids.
According to this study, joints perform best when rolled from the hot side and second
best when rolled from the hot side six inches away from the joint.
13
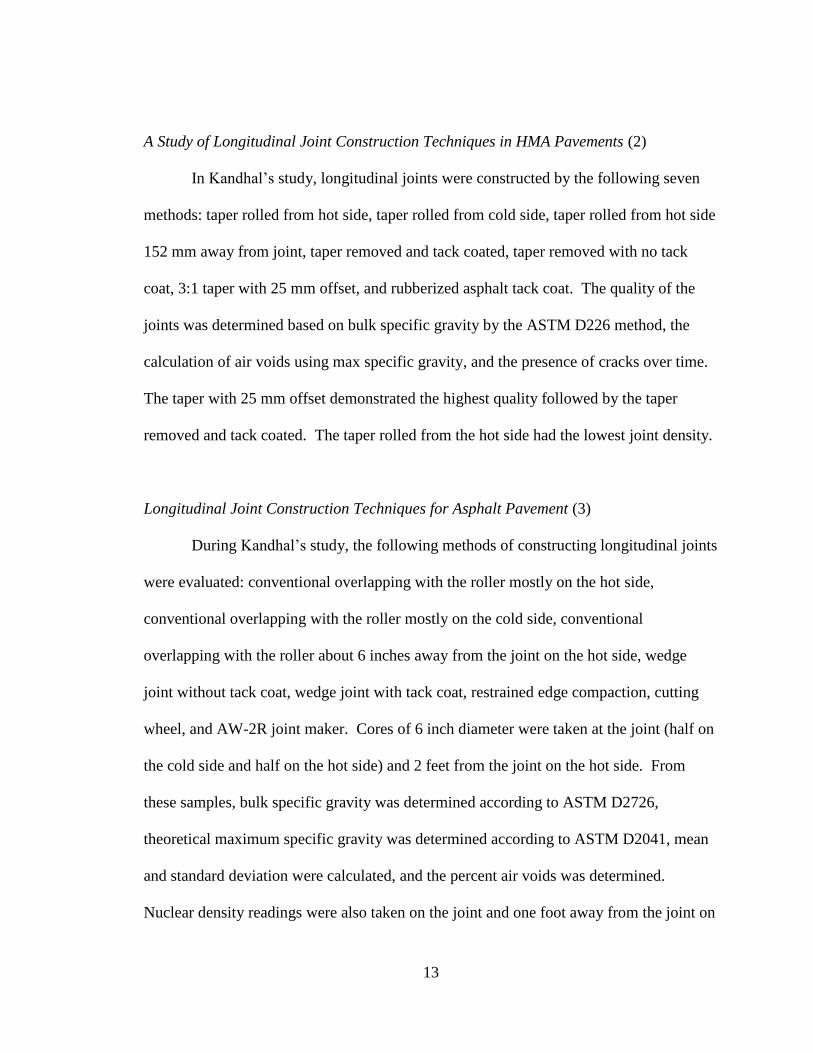
A Study of Longitudinal Joint Construction Techniques in HMA Pavements (2)
In Kandhal’s study, longitudinal joints were constructed by the following seven
methods: taper rolled from hot side, taper rolled from cold side, taper rolled from hot side
152 mm away from joint, taper removed and tack coated, taper removed with no tack
coat, 3:1 taper with 25 mm offset, and rubberized asphalt tack coat. The quality of the
joints was determined based on bulk specific gravity by the ASTM D226 method, the
calculation of air voids using max specific gravity, and the presence of cracks over time.
The taper with 25 mm offset demonstrated the highest quality followed by the taper
removed and tack coated. The taper rolled from the hot side had the lowest joint density.
Longitudinal Joint Construction Techniques for Asphalt Pavement (3)
During Kandhal’s study, the following methods of constructing longitudinal joints
were evaluated: conventional overlapping with the roller mostly on the hot side,
conventional overlapping with the roller mostly on the cold side, conventional
overlapping with the roller about 6 inches away from the joint on the hot side, wedge
joint without tack coat, wedge joint with tack coat, restrained edge compaction, cutting
wheel, and AW-2R joint maker. Cores of 6 inch diameter were taken at the joint (half on
the cold side and half on the hot side) and 2 feet from the joint on the hot side. From
these samples, bulk specific gravity was determined according to ASTM D2726,
theoretical maximum specific gravity was determined according to ASTM D2041, mean
and standard deviation were calculated, and the percent air voids was determined.
Nuclear density readings were also taken on the joint and one foot away from the joint on
14
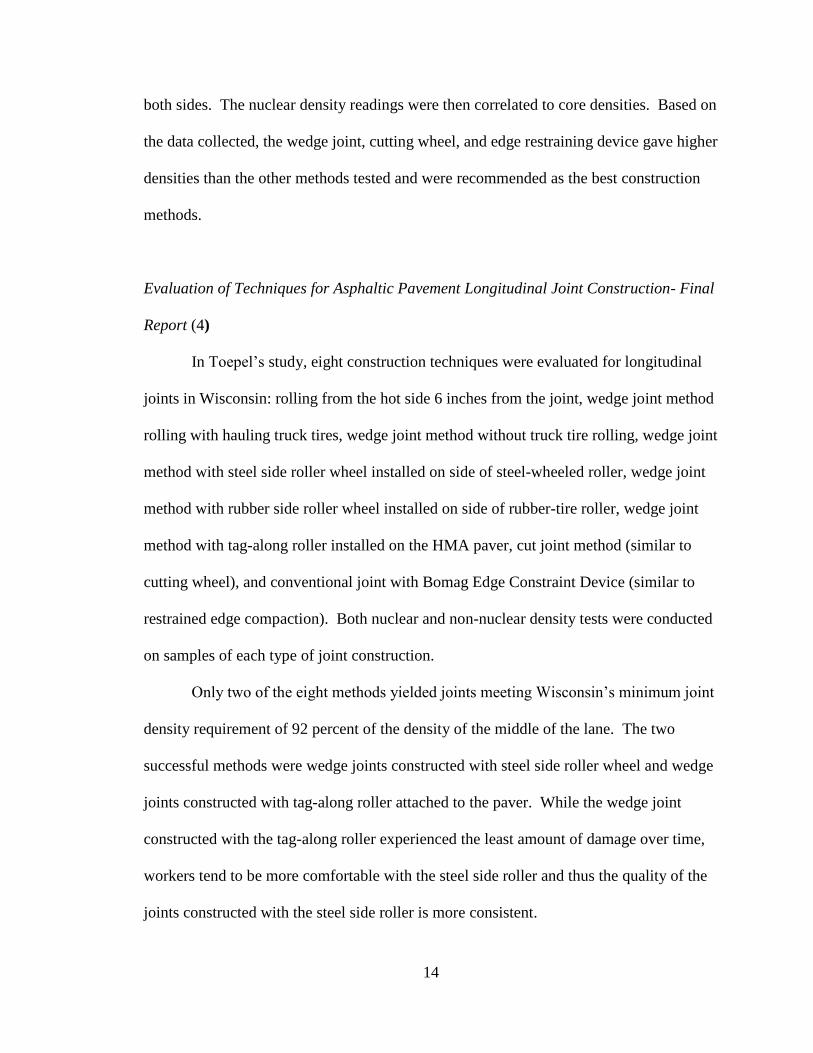
both sides. The nuclear density readings were then correlated to core densities. Based on
the data collected, the wedge joint, cutting wheel, and edge restraining device gave higher
densities than the other methods tested and were recommended as the best construction
methods.
Evaluation of Techniques for Asphaltic Pavement Longitudinal Joint Construction- Final
Report (4)
In Toepel’s study, eight construction techniques were evaluated for longitudinal
joints in Wisconsin: rolling from the hot side 6 inches from the joint, wedge joint method
rolling with hauling truck tires, wedge joint method without truck tire rolling, wedge joint
method with steel side roller wheel installed on side of steel-wheeled roller, wedge joint
method with rubber side roller wheel installed on side of rubber-tire roller, wedge joint
method with tag-along roller installed on the HMA paver, cut joint method (similar to
cutting wheel), and conventional joint with Bomag Edge Constraint Device (similar to
restrained edge compaction). Both nuclear and non-nuclear density tests were conducted
on samples of each type of joint construction.
Only two of the eight methods yielded joints meeting Wisconsin’s minimum joint
density requirement of 92 percent of the density of the middle of the lane. The two
successful methods were wedge joints constructed with steel side roller wheel and wedge
joints constructed with tag-along roller attached to the paver. While the wedge joint
constructed with the tag-along roller experienced the least amount of damage over time,
workers tend to be more comfortable with the steel side roller and thus the quality of the
joints constructed with the steel side roller is more consistent.
15
Evaluation of Various Longitudinal Joint Construction Techniques for Asphalt
Airfield Pavements (5)
Several techniques were tested for density and endurance over time in Kandhal’s
study. From highest to lowest density, the tested techniques ranked as follows: 3:1
tapered joint with 25 mm offset, cutting wheel with tack coat, cutting wheel without tack
coat, 3:1 taper rolled from hot side 152 mm from joint, 3:1 taper rolled from the cold
side, and 3:1 taper rolled from the hot side. From highest to lowest crack resistance, the
techniques ranked as follows: 3:1 tapered joint with 25 mm vertical offset, cutting wheel
with tack coat, rubberized asphalt tack coat, cutting wheel without tack coat, 3:1 taper
rolled from hot side 152 mm away from joint, 3:1 taper rolled from hot side, and 3:1
taper rolled from cold side.
Although the rankings for density were not exactly the same as the rankings for
crack resistance, a strong correlation is evident between density and crack resistance over
time. This study also found that the optimum density was obtained when 1.25 inches of
uncompacted hot mix asphalt was poured on the hot side for each 1 inch of compacted lift
thickness on the cold side. In addition, raking and luting can be avoided when the correct
amount of overlapping material is poured. Not only must the proper construction
technique be selected, but the construction must be properly administered, compacted,
and tested for proper quality.
Density Evaluation of the Longitudinal Construction Joint of Hot-Mix Asphalt
Pavements (6)

16
Several case studies were performed by Estakhri on pavements which underwent
significant damage within the first few years of service. A study was conducted on
Interstate Highway 10 near Yoakum District in Texas. This highway was experiencing
stripping and water penetration. Several tests were conducted on samples obtained from
two locations along this highway, and the following data was obtained concerning in-
place density for the top layer: at location 1 the longitudinal joint density was 90.5
percent, wheel path density was 94.2 percent, and density between the wheel paths was
93.2 percent of the target density. At location 2, the longitudinal joint density was 90.8
percent, wheel path density was 95.6 percent, and density between the wheel paths was
93.7 percent of the target density. The longitudinal joint density was consistently and
significantly lower than the densities obtained in other locations of the pavement.
The second case study occurred on the US 277 loop in Eagle Pass, Laredo
District. This roadway had potholes and cracking along the joint. Laboratory tests
included: verify mix design, compare density of joint to mid-lane density, and identify
moisture susceptibility and rutting susceptibility. The mix design met the specifications
but the asphalt cement content and percent passing a number 200 sieve were both high.
The pavement had marginal rutting susceptibility, failed the tensile strength ratio of 0.8
for three out of six locations tested, had low joint density, and had high moisture
susceptibility. However, low joint density was believed to be the main culprit of the
potholes and cracking within the pavement.
After this case study, thirty-five pavements of many different asphalt types were
sampled using nuclear gauges, and nearly all of the pavements had lower densities at
unconfined edges or longitudinal joints. These areas had a range of two to twelve pounds
17
per cubic foot and an average of six to seven pounds per cubic foot below the density in
the middle of the lane. Ideally, joint densities should fall within five pounds per cubic
foot of the internal mat density. Clearly, low quality of longitudinal joints is a common
problem which leads to premature deterioration of roads.
A third case study was conducted on IH20 near Pecos in Odessa District. This
pavement contained alligator cracking and had a lip along the longitudinal joint which
held water. The joint was poorly compacted and contained 16.6 percent air voids while
other parts of the lane contained ten percent air voids. It is believed that the poor
compaction and high air voids of this roadway are the primary causes of this early failure.
Other Studies
Many theories have been developed concerning the best construction technique
for longitudinal joints; most of these theories are based on density testing, but a wide
variety of methods have been used for justification of a construction method.
Based on the findings of national research supported by INDOT, the highest
longitudinal joint density is achieved when the hot mat is laid 6 mm higher than the cold
mat, the first and second passes overlap the cold mat by six inches, and the entire width
of the mat receives the same number of passes (7).
A study by Brown sought to specifying density by three methods: percent of the
control strip density, percent of laboratory density, and percent of theoretical maximum
density. According to the results of this study, the hot side should be poured 20 percent
thicker than the cold side, and the free edge should not be rolled with a rubber tire roller
because it will round the edges causing difficulties in compaction. Furthermore, heating
18
the cold side could improve the density at the joint if done correctly. Unfortunately, the
evenness of the heating can be difficult to control, and overheating may damage the
binder (8).
Rather than using various testing methods to identify best construction
techniques, another approach is to focus on minimum or maximum values for the results
of certain testing methods. Few regulations currently exist, and most of these regulations
are related to density. For example, PANYNJ increased the lower limit for longitudinal
joint density from 93.3 percent of the density specified by the FAA to 94.3 percent of the
Marshall density with payment reductions for any longitudinal joints having over ten
percent of the test densities below the requirement (9). Many density related regulations
simply specify that the joint density be no more than two percent below the required mat
density.
Many different methods for determining density exist, and opinions on which
method is best also vary. Many people prefer the nuclear density test because it yields
quick results and is non-destructive. However, the nuclear gauge is difficult to set
properly over the joint due to the sloped nature of the pavement surface and often
includes data from material well outside of the joint (10). In order for nuclear gauges to
be properly calibrated, cores must be drilled and tested in the laboratory to determine
their bulk specific gravity (11).
Since cores must be drilled regardless of testing method and the testing of cores
tends to provide more accurate results, some argue that laboratory testing should be
required for quality control of longitudinal joints. According to the Asphalt Technology
19
News, the AASHTO T-166 method is good for testing fine-graded mixes, but other
methods may be more accurate for coarse graded mixes (12). If a core absorbs more than
1percent moisture during the AASHTO T-166 test, then the vacuum-seal test should be
conducted because the weight measurements in air and water during the testing of a core
may be inaccurate if the core is porous (10). According to AASHTO T-166, the
allowable absorption level to use this method is two percent; but for greater accuracy, one
percent is a better limit because density readings tend to be high when the absorption
level exceeds one percent (11).
Both the vacuum-sealing and AASHTO T-166 methods are accurate at low air
voids, but at air voids above five percent, the vacuum-seal method is more accurate than
the AASHTO T-166 method (11). According to Asphalt Technology News, the vacuum-
sealing method should be used for field samples with void ratios of six percent or more
(12). Asphalt Technology News also states that the water displacement and vacuum-
sealing methods are both acceptable for calculating bulk specific gravity at low water
absorption rates (12).
While density is the most common descriptor of roadway quality, other properties
which are closely related to density may provide good alternatives to density as a method
for quality control testing.
Permeability describes the amount of interconnected voids within the pavement;
therefore, a high percentage of air voids will likely result in a highly permeable
pavement. When asphalt pavement contains over eight percent air voids, permeability
increases quickly with only a small increase in the in-place air voids (11). Although eight
percent in-place air voids is commonly accepted as the point at which pavement becomes

20
excessively permeable, studies show that pavements may be excessively permeable at
values below eight percent (12). Therefore, the air voids should not exceed seven
percent to ensure that permeability is not a problem (11).
Factors such as lift thickness, NMAS (nominal maximum aggregate size), and
gradation shape are also related to the permeability of a pavement. Because lift thickness
is inversely related to permeability, the Florida Department of Transportation suggests a
lift thickness to NMAS ratio of four for coarse-graded mixes and three for fine-graded
mixes (12). As the NMAS increases, the in-place air void sizes increase causing the
probability of interconnected voids within the pavement to increase. Coarse-graded
mixes tend to be more permeable than fine-graded mixes at a given air void level (11).
At eight percent air voids, coarse-graded mixes have a permeability of 60E-5 cm/s while
fine-graded mixes have a permeability of 10E/5 cm/s (11). Therefore, maintaining some
standard maximum gradation and/or minimum percent air voids may greatly improve the
quality of longitudinal joints. Following is a study by Cooley which has recommended
ranges for these properties.
Development of Critical Field Permeability and Pavement Density Values for Coarse-
Graded Superpave Pavements (13)
Cooley’s study combined density, gradation, and air voids to identify a point at
which pavements become excessively permeable. The study yielded the following
results: 9.5-12.5 mm NMAS mixes became permeable at 7.7 percent in place air voids
and 92.3 percent density with a field permeability of 100E-5 cm/s, 19 mm NMAS
became permeable at 5.5 percent air voids and 94.5 percent density with a field
21
permeability of 120E-5 cm/s, and 25 mm NMAS became permeable at 4.4 percent air
voids and 95.6 percent density with a field permeability of 150E-5 cm/s. Based on these
results, an in-place air void content of three to eight percent for dense-graded mixes is
recommended because low air voids lead to rutting or shoving while high air voids lead
to air and water penetration, moisture damage, raveling, and cracking.
In spite of the number of studies which have been conducted in order to identify
ways of improving the quality of longitudinal joints, no common solution has been
agreed upon by professionals, and few regulations on longitudinal joint quality exist. At
this time, only four states have a minimum density requirement for longitudinal joints.
Of the states which test for density, typically either a control strip is used in order to
conduct the AASHTO T-166 test or a nuclear gauge is used to determine the density of
the roadway as a whole, regardless of the asphalt mix design.
By nature, longitudinal joints are more vulnerable to damage than other parts of
the road. Therefore, minimum quality requirements are necessary. While many have
tried to specify a standard construction method, this may not be the most effective way to
meet a specified level of quality because so many factors influence the effectiveness of a
construction method in individual situations. For example, construction workers may not
have experience with a particular construction method, and their inexperience could
result in improper practices and lower quality joints. Many regulations focus on density;
however, it is unclear whether this is the best test method for quality control. Perhaps
tests for percent air voids or permeability might be more appropriate in the determination
of the joint quality.
22
Objective:
The purpose of this project is to identify the best laboratory testing procedure to
use as a quality control standard for longitudinal joints in asphalt based on the method’s
ability to provide relative differentiation of quality across the joint and from site to site.
Therefore, samples were taken from three roadways of varying quality and were tested
for a variety of properties using several different commonly accepted laboratory
procedures. Data was collected for each sample and analyzed in order to determine
which testing procedure most clearly and reliably differentiates between levels of quality
in a pavement and across the joint of a pavement.

23
Test Methods
For this project, cores were taken from three roadways of varying quality and
from four locations on each roadway. Five samples were taken across the joint at each
location, at twelve inches and six inches to either side of the joint and directly on the
joint.
The tests conducted in the laboratory include bulk specific gravity tests,
permeability tests, and gradation tests.
Bulk specific gravity tests were performed using the AASHTO T331 CoreLok
method, the AASHTO T 166 SSD (saturated surface dry) method , and the Kuss
methods, and density values were calculated based on the data collected.
The CoreLok method measures specific gravity by vacuum sealing a sample of
pavement in a puncture resistant polymer bag and measuring the amount of water
displaced by the sample. The SSD method involves weighing the pavement sample when
dry, when saturated, and when saturated surface dry and using these values to calculate
the specific gravity. The Kuss method involves submerging the sample into a device
using a patented volume displacement technology, which compares the sample to a
standard of known density and then calculates the sample’s density. This method does
not have an AASHTO standard specification.
Once the densities of the cores were determined, permeability tests were
conducted according to ASTM PS-129. This specification was withdrawn years ago;
however, it is still used because it has not been replaced by another specification for
permeability testing. These tests involve the use of a Karol-Warner flexible wall
laboratory permeameter to measure the degree to which water passes through the cores,
24
thus identifying which areas of pavement are more likely to allow penetration of air and
water in the field.
Upon completion of the permeability test, the cores were burned in an ignition
oven in order to obtain the bare aggregate for gradation testing by means of a sieve
analysis. The gradations were then observed to identify any changes across the joint or
from location to location. This gradation testing was performed according to AASHTO
T30.
Once all laboratory tests were completed, the results were analyzed visually and
then statistically using the ANOVA two factor without replication and single factor
methods. The ANOVA two factor without replication test analyzes the statistical
significance of the site location as well as distance from the joint. The ANOVA single
factor test analyzes the significance of the distance from joint only. At the completion of
these analyses, the test methods best suited for a quality control standard of longitudinal
joints were recommended.

25
Data Analysis:
Laboratory tests were conducted on core samples taken from varying distances
on, to the east or south, and to the west or north of the joint of three different roadways.
The samples that were taken from Gregg Street in Fayetteville begin with “G,” the
samples taken from Russellville begin with “R,” and the samples taken from Yellville
begin with “Y.”
Four sample groups were taken in the transverse direction across the joint; the
roadway identifier (G, R, or Y) is followed by a number 1 through 4 as a way of
identifying to which sample group the core belongs. The identifier then contains a
hyphen followed by either a “12” for twelve inches from the joint, a “6” for six inches
from the joint, or a “J” for directly on the joint.
Samples taken to the side of the joint are identified with “E” for east of the joint,
“S” for south, “W” for west, or “N” for north of the joint. So, the core taken from the
first group of samples on Gregg Street and located six inches to the east of the joint
would be identified as “G1-6E.” The following laboratory tests were performed on the
core samples collected: SSD Gmb, CoreLok Gmb, Kuss Gmb, permeability, and gradation.
The data collected for these tests are shown in Appendix A.
During the testing procedures, three of the Russellville joint samples (R2-J, R3-J,
and R4-J) and one of the Yellville joint samples (Y4-J) cracked. Due to the cracks, data
was unobtainable for these samples. In order to conduct the statistical analyses, however,
data for every sample was necessary. Therefore, specific gravity values were estimated
using averages from the nuclear density readings taken before sampling. This allowed
for a reasonable estimation of the values for all of the density methods tested. However,
26
no method was determined for estimating the missing values of permeability or percent
water absorbed. The nuclear data used to estimate the density is shown in Appendix B.
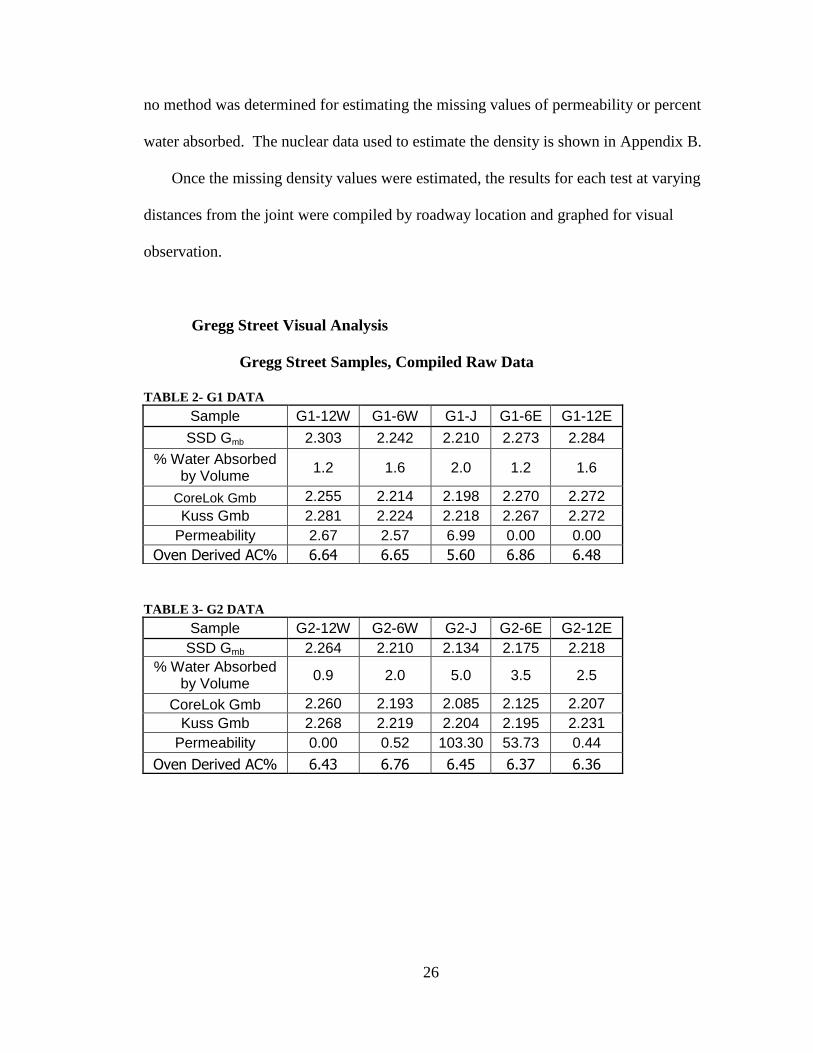
Once the missing density values were estimated, the results for each test at varying
distances from the joint were compiled by roadway location and graphed for visual
observation.
Gregg Street Visual Analysis
Gregg Street Samples, Compiled Raw Data
TABLE 2- G1 DATA
TABLE 3- G2 DATA
Sample G2-12W G2-6W G2-J G2-6E G2-12E
SSD Gmb 2.264 2.210 2.134 2.175 2.218
% Water Absorbed by Volume
0.9 2.0 5.0 3.5 2.5
CoreLok Gmb 2.260 2.193 2.085 2.125 2.207
Kuss Gmb 2.268 2.219 2.204 2.195 2.231
Permeability 0.00 0.52 103.30 53.73 0.44
Oven Derived AC% 6.43 6.76 6.45 6.37 6.36
Sample G1-12W G1-6W G1-J G1-6E G1-12E
SSD Gmb 2.303 2.242 2.210 2.273 2.284
% Water Absorbed by Volume
1.2 1.6 2.0 1.2 1.6
CoreLok Gmb 2.255 2.214 2.198 2.270 2.272
Kuss Gmb 2.281 2.224 2.218 2.267 2.272
Permeability 2.67 2.57 6.99 0.00 0.00
Oven Derived AC% 6.64 6.65 5.60 6.86 6.48
27
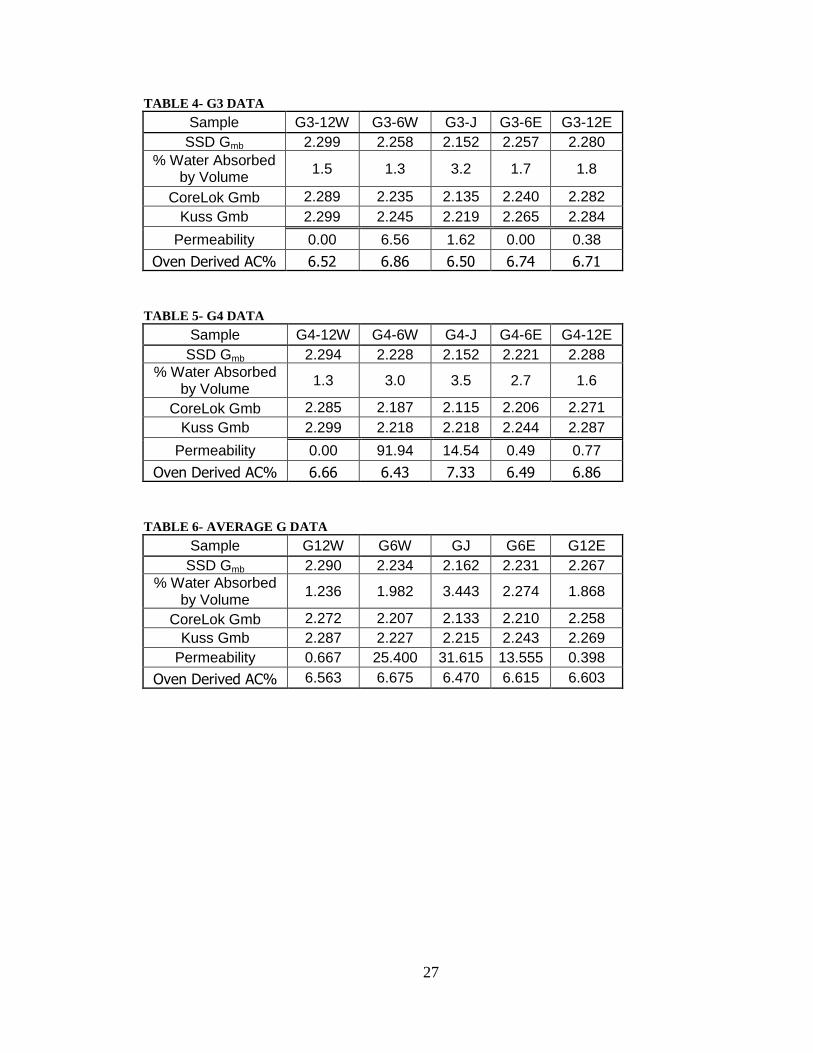
TABLE 4- G3 DATA
Sample G3-12W G3-6W G3-J G3-6E G3-12E
SSD Gmb 2.299 2.258 2.152 2.257 2.280
% Water Absorbed by Volume
1.5 1.3 3.2 1.7 1.8
CoreLok Gmb 2.289 2.235 2.135 2.240 2.282
Kuss Gmb 2.299 2.245 2.219 2.265 2.284
Permeability 0.00 6.56 1.62 0.00 0.38
Oven Derived AC% 6.52 6.86 6.50 6.74 6.71
TABLE 5- G4 DATA
Sample G4-12W G4-6W G4-J G4-6E G4-12E
SSD Gmb 2.294 2.228 2.152 2.221 2.288
% Water Absorbed by Volume
1.3 3.0 3.5 2.7 1.6
CoreLok Gmb 2.285 2.187 2.115 2.206 2.271
Kuss Gmb 2.299 2.218 2.218 2.244 2.287
Permeability 0.00 91.94 14.54 0.49 0.77
Oven Derived AC% 6.66 6.43 7.33 6.49 6.86
TABLE 6- AVERAGE G DATA
Sample G12W G6W GJ G6E G12E
SSD Gmb 2.290 2.234 2.162 2.231 2.267
% Water Absorbed by Volume
1.236 1.982 3.443 2.274 1.868
CoreLok Gmb 2.272 2.207 2.133 2.210 2.258
Kuss Gmb 2.287 2.227 2.215 2.243 2.269
Permeability 0.667 25.400 31.615 13.555 0.398
Oven Derived AC% 6.563 6.675 6.470 6.615 6.603
28
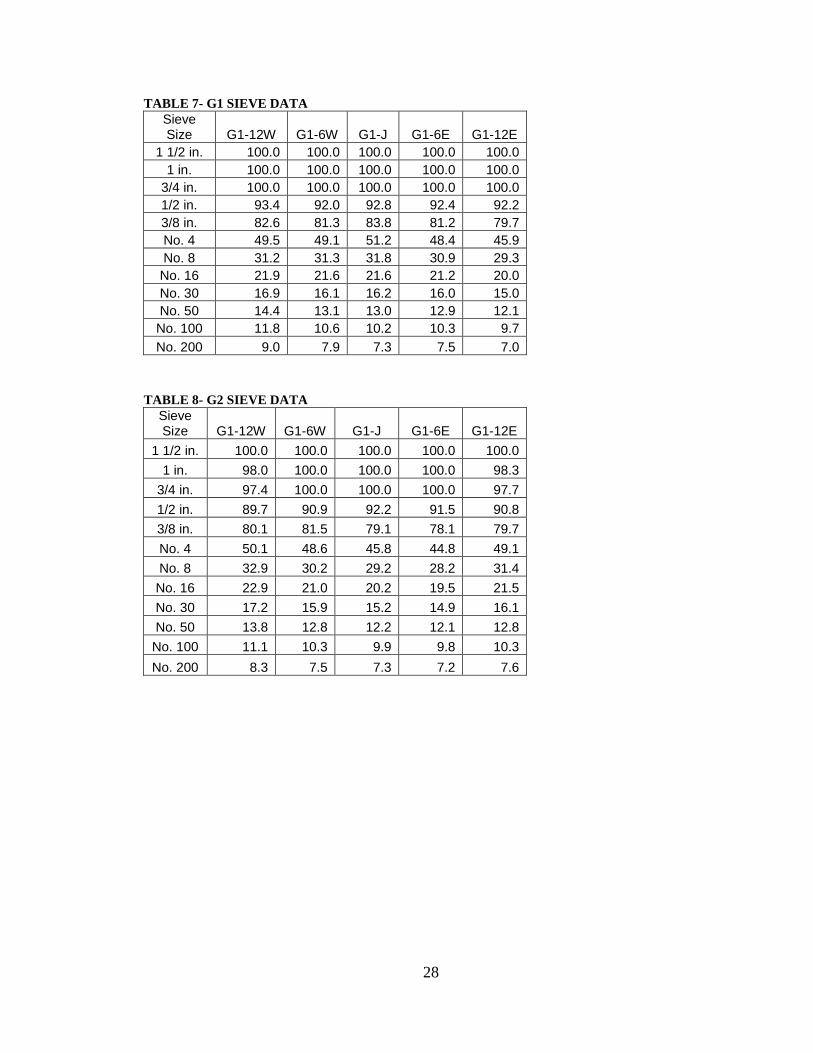
TABLE 7- G1 SIEVE DATA
Sieve Size G1-12W G1-6W G1-J G1-6E G1-12E
1 1/2 in. 100.0 100.0 100.0 100.0 100.0
1 in. 100.0 100.0 100.0 100.0 100.0
3/4 in. 100.0 100.0 100.0 100.0 100.0
1/2 in. 93.4 92.0 92.8 92.4 92.2
3/8 in. 82.6 81.3 83.8 81.2 79.7
No. 4 49.5 49.1 51.2 48.4 45.9
No. 8 31.2 31.3 31.8 30.9 29.3
No. 16 21.9 21.6 21.6 21.2 20.0
No. 30 16.9 16.1 16.2 16.0 15.0
No. 50 14.4 13.1 13.0 12.9 12.1
No. 100 11.8 10.6 10.2 10.3 9.7
No. 200 9.0 7.9 7.3 7.5 7.0
TABLE 8- G2 SIEVE DATA
Sieve Size G1-12W G1-6W G1-J G1-6E G1-12E
1 1/2 in. 100.0 100.0 100.0 100.0 100.0
1 in. 98.0 100.0 100.0 100.0 98.3
3/4 in. 97.4 100.0 100.0 100.0 97.7
1/2 in. 89.7 90.9 92.2 91.5 90.8
3/8 in. 80.1 81.5 79.1 78.1 79.7
No. 4 50.1 48.6 45.8 44.8 49.1
No. 8 32.9 30.2 29.2 28.2 31.4
No. 16 22.9 21.0 20.2 19.5 21.5
No. 30 17.2 15.9 15.2 14.9 16.1
No. 50 13.8 12.8 12.2 12.1 12.8
No. 100 11.1 10.3 9.9 9.8 10.3
No. 200 8.3 7.5 7.3 7.2 7.6
29
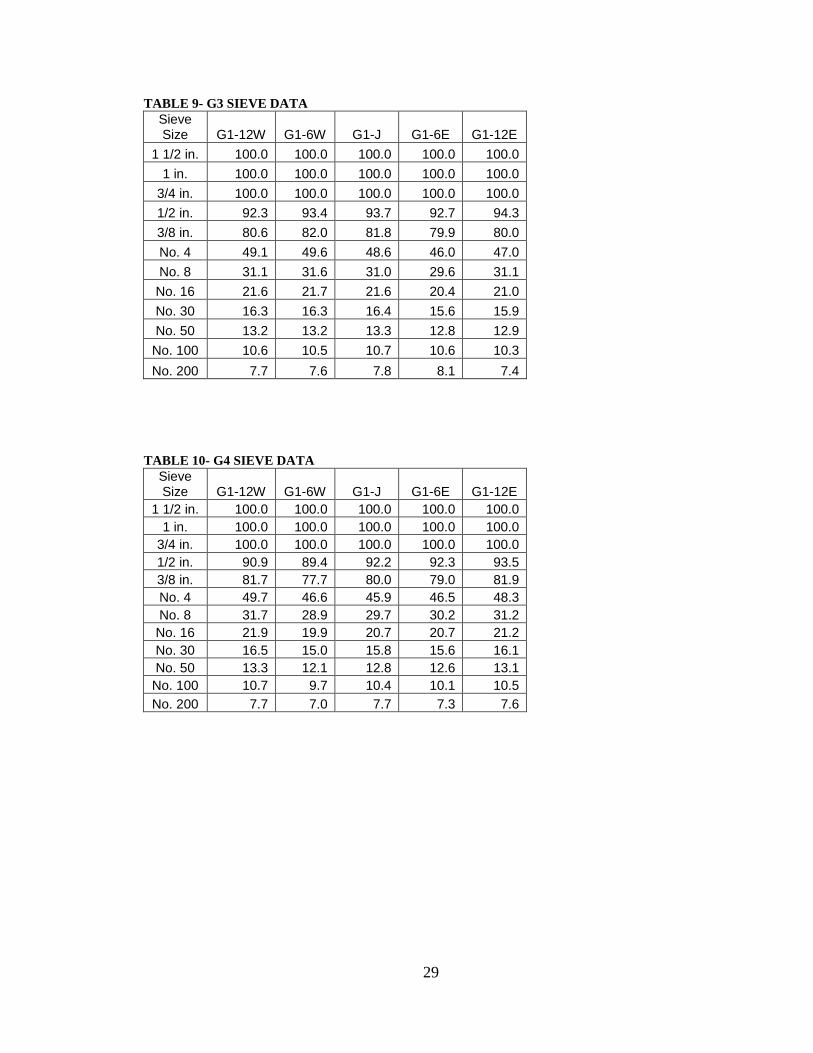
TABLE 9- G3 SIEVE DATA
Sieve Size G1-12W G1-6W G1-J G1-6E G1-12E
1 1/2 in. 100.0 100.0 100.0 100.0 100.0
1 in. 100.0 100.0 100.0 100.0 100.0
3/4 in. 100.0 100.0 100.0 100.0 100.0
1/2 in. 92.3 93.4 93.7 92.7 94.3
3/8 in. 80.6 82.0 81.8 79.9 80.0
No. 4 49.1 49.6 48.6 46.0 47.0
No. 8 31.1 31.6 31.0 29.6 31.1
No. 16 21.6 21.7 21.6 20.4 21.0
No. 30 16.3 16.3 16.4 15.6 15.9
No. 50 13.2 13.2 13.3 12.8 12.9
No. 100 10.6 10.5 10.7 10.6 10.3
No. 200 7.7 7.6 7.8 8.1 7.4
TABLE 10- G4 SIEVE DATA
Sieve Size G1-12W G1-6W G1-J G1-6E G1-12E
1 1/2 in. 100.0 100.0 100.0 100.0 100.0
1 in. 100.0 100.0 100.0 100.0 100.0
3/4 in. 100.0 100.0 100.0 100.0 100.0
1/2 in. 90.9 89.4 92.2 92.3 93.5
3/8 in. 81.7 77.7 80.0 79.0 81.9
No. 4 49.7 46.6 45.9 46.5 48.3
No. 8 31.7 28.9 29.7 30.2 31.2
No. 16 21.9 19.9 20.7 20.7 21.2
No. 30 16.5 15.0 15.8 15.6 16.1
No. 50 13.3 12.1 12.8 12.6 13.1
No. 100 10.7 9.7 10.4 10.1 10.5
No. 200 7.7 7.0 7.7 7.3 7.6

30
TABLE 11- G AVERAGE SIEVE DATA
Sieve Size G1-12W G1-6W G1-J G1-6E G1-12E
1 1/2 in. 100.0 100.0 100.0 100.0 100.0
1 in. 99.5 100.0 100.0 100.0 99.6
3/4 in. 99.3 100.0 100.0 100.0 99.4
1/2 in. 91.6 91.4 92.7 92.2 92.7
3/8 in. 81.2 80.6 81.2 79.5 80.3
No. 4 49.6 48.5 47.9 46.4 47.6
No. 8 31.7 30.5 30.4 29.8 30.7
No. 16 22.1 21.1 21.0 20.5 20.9
No. 30 16.7 15.8 15.9 15.5 15.7
No. 50 13.7 12.8 12.8 12.6 12.7
No. 100 11.0 10.3 10.3 10.2 10.2
No. 200 8.2 7.5 7.5 7.5 7.4
Gregg Street samples, Water Absorbed
FIGURE 1- G1, WATER ABSORBED
% Water Absorbed for G1
0.0
1.0
2.0
3.0
4.0
5.0
6.0
-12 -6 0 6 12
Distance from Joint, in.
Wate
r A
bso
rbed
, %
31
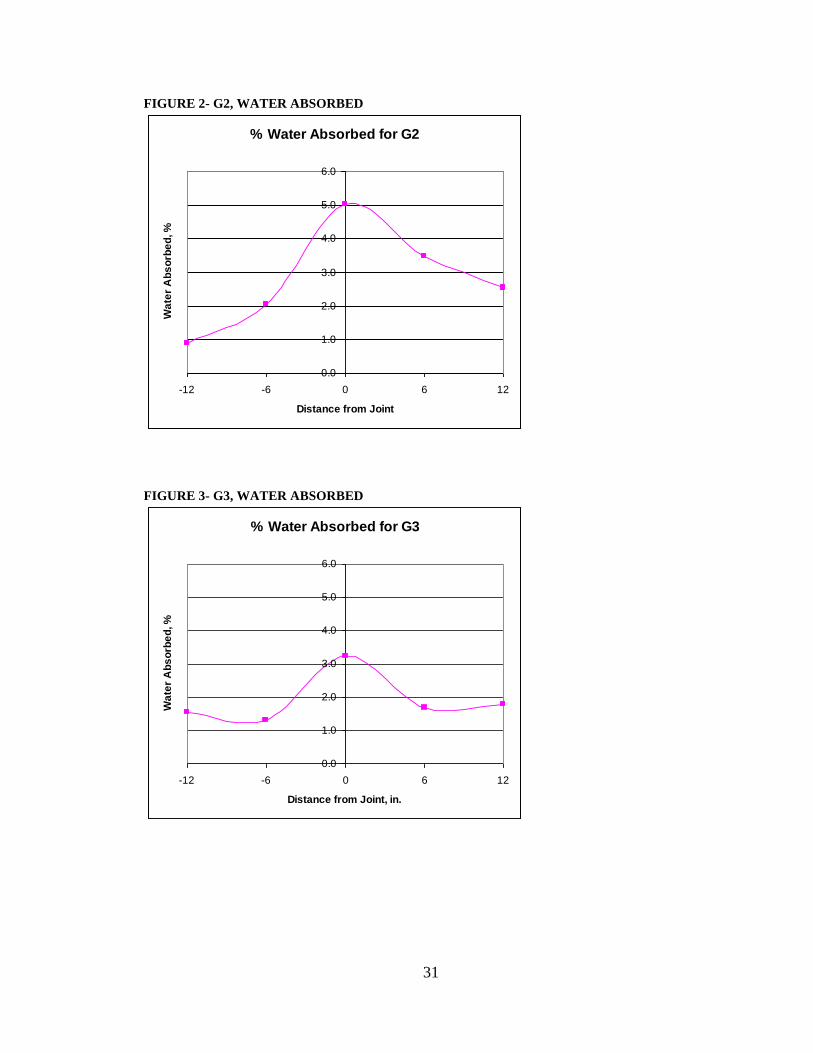
FIGURE 2- G2, WATER ABSORBED
% Water Absorbed for G2
0.0
1.0
2.0
3.0
4.0
5.0
6.0
-12 -6 0 6 12
Distance from Joint
Wa
ter
Ab
so
rbe
d, %
FIGURE 3- G3, WATER ABSORBED
% Water Absorbed for G3
0.0
1.0
2.0
3.0
4.0
5.0
6.0
-12 -6 0 6 12
Distance from Joint, in.
Wa
ter
Ab
so
rbe
d, %

32
FIGURE 4- G4, WATER ABSORBED
% Water Absorbed for G4
0.0
1.0
2.0
3.0
4.0
5.0
6.0
-12 -6 0 6 12
Distance from Joint, in.
Wa
ter A
bs
orb
ed
, %
FIGURE 5- AVERAGE, WATER ABSORBED
% Water Absorbed for G Avg
0.0
1.0
2.0
3.0
4.0
5.0
6.0
-12 -6 0 6 12
Distance from Joint, in.
Wate
r A
bso
rbed
, %
The average difference in percent water absorbed across the joint was 2.207.
Figures 1-5 all show an increase in the amount of water absorbed at the joint and a
decrease with distance from the core. This indicates that the joint area holds more water
than other parts of the road, which indicates poor quality and can lead to deterioration of
the road. Figures 1, 2, 3, and 5 all show a slight increase in amount of water absorbed by

33
samples located six to twelve inches from the joint.. This may indicate a different
problem in that area such as a crack, poor confinement of the edges, or a poor sample
representation. While the trend is consistent among these samples, the magnitude varies
quite a bit, especially between Figures 1 and 2.
Gregg Street Samples, Density
FIGURE 6- G1, DENSITY
Density of G1
2.05
2.10
2.15
2.20
2.25
2.30
2.35
2.40
-12 -6 0 6 12
Distance from Joint, in.
Den
sit
y,
g/c
m3
SSD Gmb
CoreLok Gmb
Kuss Gmb
FIGURE 7- G2 DENSITY
Density of G2
2.05
2.10
2.15
2.20
2.25
2.30
2.35
2.40
-12 -6 0 6 12
Distance from Joint, in.
De
ns
ity
, g
/cm
3
SSD Gmb
CoreLok Gmb
Kuss Gmb
34
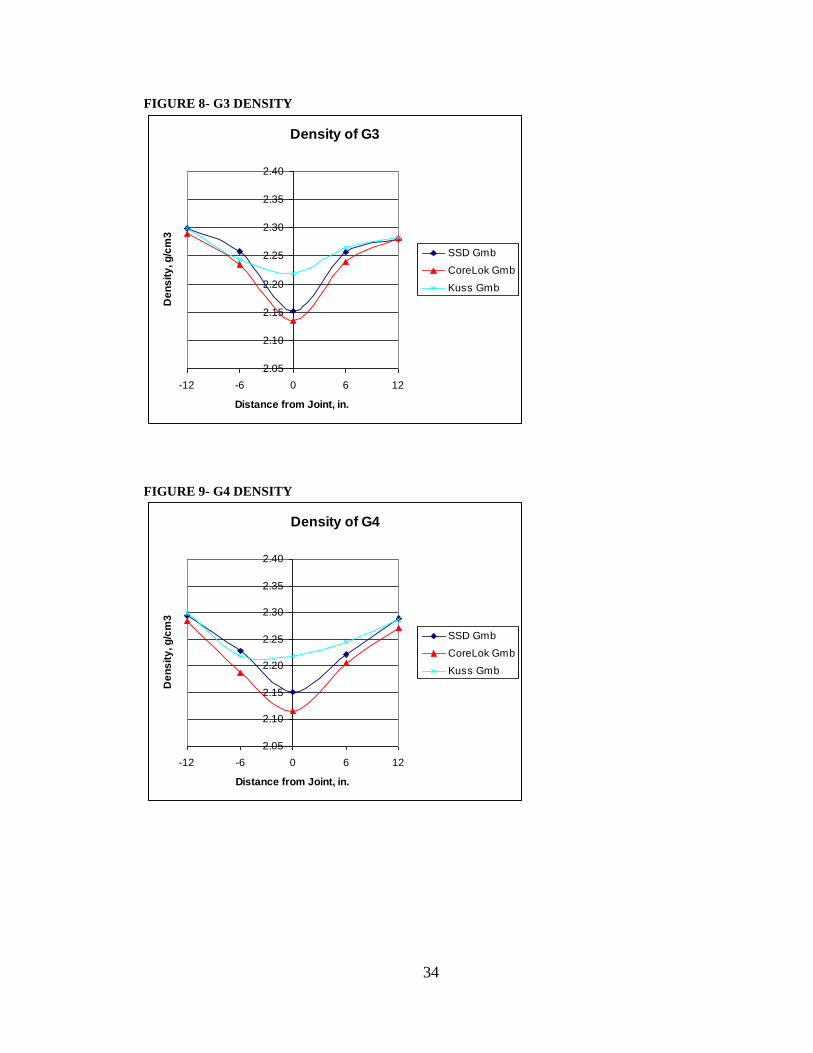
FIGURE 8- G3 DENSITY
Density of G3
2.05
2.10
2.15
2.20
2.25
2.30
2.35
2.40
-12 -6 0 6 12
Distance from Joint, in.
De
ns
ity
, g
/cm
3
SSD Gmb
CoreLok Gmb
Kuss Gmb
FIGURE 9- G4 DENSITY
Density of G4
2.05
2.10
2.15
2.20
2.25
2.30
2.35
2.40
-12 -6 0 6 12
Distance from Joint, in.
De
ns
ity
, g
/cm
3
SSD Gmb
CoreLok Gmb
Kuss Gmb

35
FIGURE 10- G AVERAGE DENSITY
Density of G Average
2.05
2.10
2.15
2.20
2.25
2.30
2.35
2.40
-12 -6 0 6 12
Distance from Joint, in.
De
ns
ity
, g
/cm
3
SSD Gmb
CoreLok Gmb
Kuss Gmb
Based on all three density tests performed, the density decreases as it nears the
joint, indicating lower quality in that area. The SSD method produced an average change
in density across the joint of 0.128 g/cm3
(a difference of approximately 5.3 percent
compaction), the CoreLok method had a change of 0.139 g/cm3 (a difference of
approximately 5.8 percent compaction), and the Kuss method had a change of 0.072
g/cm3 (a difference of approximately 3.0 percent compaction). Upon inspection of
Figures 6-10, the CoreLok density test consistently shows the greatest difference in
density between the outside samples and the joint sample, except possibly in Figure 6
where it is comparable to the SSD method only with lower data values. Not only is the
trend line consistent across the joint, but the range of values is also fairly consistent. The
Kuss method provides results consistent with the CoreLok and SSD methods for samples
away from the joint; however, for the lower density samples taken at the joint, the Kuss
method yields much higher density values than the other testing methods.

36
Gregg Street Samples, Permeability
FIGURE 11- G1, PERMEABILITY
Permeability of G1
-20.0
0.0
20.0
40.0
60.0
80.0
100.0
120.0
-12 -6 0 6 12
Distance from Joint, in.
Pe
rme
ab
ilit
y, c
m2
/s
Permeability of G1 (Zoomed In)
-1.0
0.0
1.0
2.0
3.0
4.0
5.0
6.0
7.0
8.0
-12 -6 0 6 12
Distance from Joint, in.
Perm
eab
ilit
y,
cm
2/s
FIGURE 12- G2, PERMEABILITY
Permeability of G2
-20.0
0.0
20.0
40.0
60.0
80.0
100.0
120.0
-12 -6 0 6 12
Distance from Joint, in.
Perm
eab
ilit
y,
cm
2/s

37
FIGURE 13- G3, PERMEABILITY
Permeability of G3
-20.0
0.0
20.0
40.0
60.0
80.0
100.0
120.0
-12 -6 0 6 12
Distance from Joint, in.
Perm
eab
ilit
y,
cm
2/s
Permeability of G3 (Zoomed In)
-1.0
0.0
1.0
2.0
3.0
4.0
5.0
6.0
7.0
-12 -6 0 6 12
Distance from Joint, in.
Perm
eab
ilit
y,
cm
2/s
FIGURE 14- G4, PERMEABILITY
Permeability of G4
-20.0
0.0
20.0
40.0
60.0
80.0
100.0
120.0
-12 -6 0 6 12
Distance from Joint, in.
Perm
eab
ilit
y,
g/c
m3
38
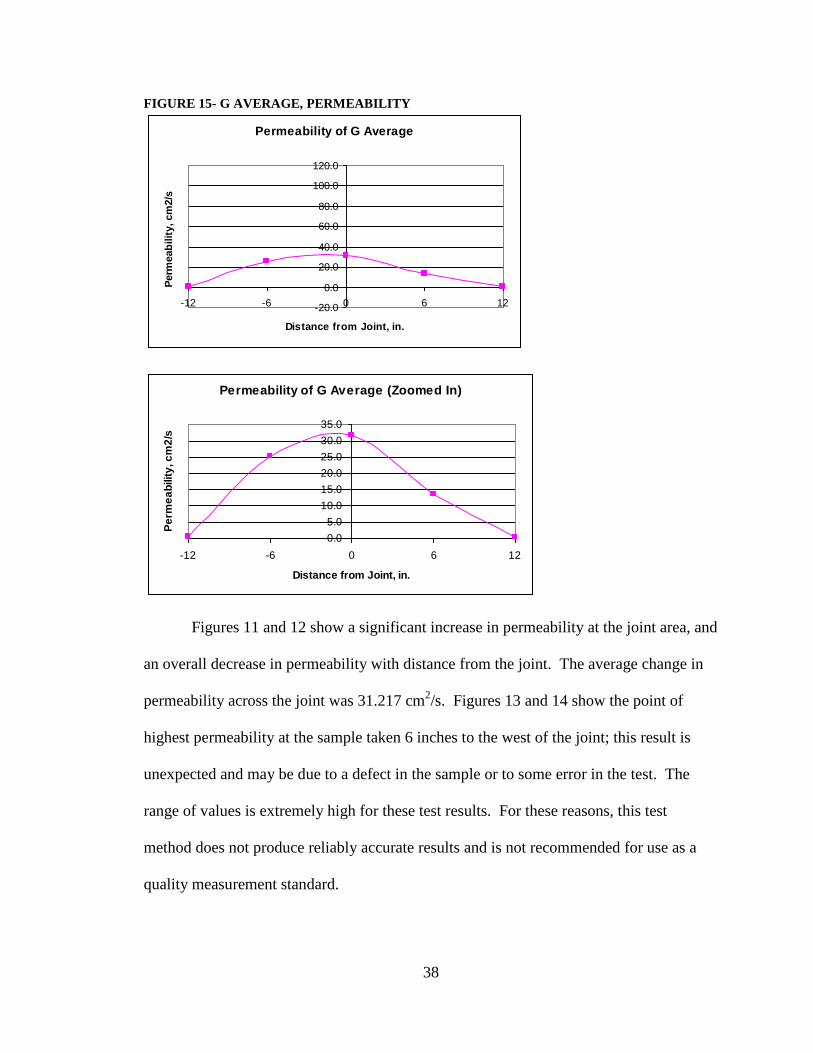
FIGURE 15- G AVERAGE, PERMEABILITY
Permeability of G Average
-20.0
0.0
20.0
40.0
60.0
80.0
100.0
120.0
-12 -6 0 6 12
Distance from Joint, in.
Perm
eab
ilit
y, cm
2/s
Permeability of G Average (Zoomed In)
0.0
5.0
10.0
15.0
20.0
25.0
30.0
35.0
-12 -6 0 6 12
Distance from Joint, in.
Pe
rme
ab
ilit
y, c
m2
/s
Figures 11 and 12 show a significant increase in permeability at the joint area, and
an overall decrease in permeability with distance from the joint. The average change in
permeability across the joint was 31.217 cm2/s. Figures 13 and 14 show the point of
highest permeability at the sample taken 6 inches to the west of the joint; this result is
unexpected and may be due to a defect in the sample or to some error in the test. The
range of values is extremely high for these test results. For these reasons, this test
method does not produce reliably accurate results and is not recommended for use as a
quality measurement standard.
39
Gregg Street Samples, Oven Derived AC%
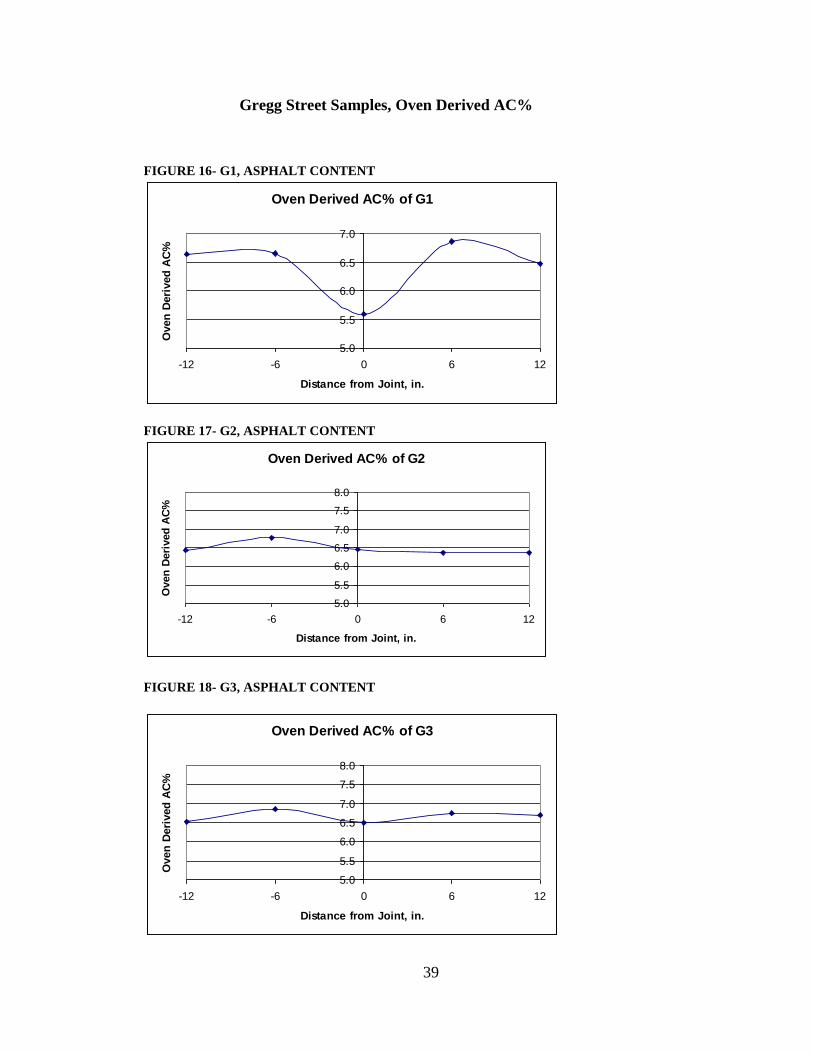
FIGURE 16- G1, ASPHALT CONTENT
Oven Derived AC% of G1
5.0
5.5
6.0
6.5
7.0
-12 -6 0 6 12
Distance from Joint, in.
Oven
Deri
ved
AC
%
FIGURE 17- G2, ASPHALT CONTENT
Oven Derived AC% of G2
5.0
5.5
6.0
6.5
7.0
7.5
8.0
-12 -6 0 6 12
Distance from Joint, in.
Oven
Deri
ved
AC
%
FIGURE 18- G3, ASPHALT CONTENT
Oven Derived AC% of G3
5.0
5.5
6.0
6.5
7.0
7.5
8.0
-12 -6 0 6 12
Distance from Joint, in.
Oven
Deri
ved
AC
%

40
FIGURE 19- G4, ASPHALT CONTENT
Oven Derived AC% of G4
5.0
5.5
6.0
6.5
7.0
7.5
8.0
-12 -6 0 6 12
Distance from Joint, in.
Oven
Deri
ved
AC
%
FIGURE 20- G AVERAGE, ASPHALT CONTENT
Oven Derived AC% of G Avg
5.0
5.5
6.0
6.5
7.0
7.5
8.0
-12 -6 0 6 12
Distance from Joint, in.
Oven
Deri
ved
AC
%
The average change in the oven derived asphalt content across the joint was 0.205
percent. Figures 16-20 show no significant pattern. The values across the joint are
inconsistent from sample to sample. Therefore, this test method is not recommended for
use as a quality measurement standard.

41
Gregg Street Samples, Gradation
FIGURE 21- GRADATION OF G1 SAMPLES
Gradation for G1
0.0
20.0
40.0
60.0
80.0
100.0
Sieve Size
% P
assin
g
G1-12W
G1-6W
G1-J
G1-6E
G1-12E
No. 501 in.3/4 in.
1/2 in.3/8 in.No. 4No. 8No. 16
No. 30No. 100
No. 2001 1/2 in.
Gradation for G1-12W
0.0
20.0
40.0
60.0
80.0
100.0
Sieve Size
% P
assin
g
Gradation for G1-6W
0.0
20.0
40.0
60.0
80.0
100.0
Sieve Size
% P
assin
g
No. 501 in.3/4 in.
1/2 in.3/8 in. No. 4No. 8No. 16
No. 30No. 100
No. 2001 1/2 in.
Gradation for G1-J
0.0
20.0
40.0
60.0
80.0
100.0
Sieve Size
% P
assin
g
No. 501 in.3/4 in.
1/2 in.3/8 in.No. 4No. 8No. 16
No. 30No. 100
No. 2001 1/2 in.
Gradation for G1-6E
0.0
20.0
40.0
60.0
80.0
100.0
Sieve Size
% P
assin
g
No. 501 in.3/4 in.
1/2 in.3/8 in.No. 4No. 8No. 16
No. 30No. 100
No. 2001 1/2 in.
Gradation for G1-12E
0.0
20.0
40.0
60.0
80.0
100.0
Sieve Size
% P
assin
g
No. 501 in.3/4 in.
1/2 in.3/8 in.No. 4No. 8No. 16
No. 30No. 100
No. 2001 1/2 in.
42
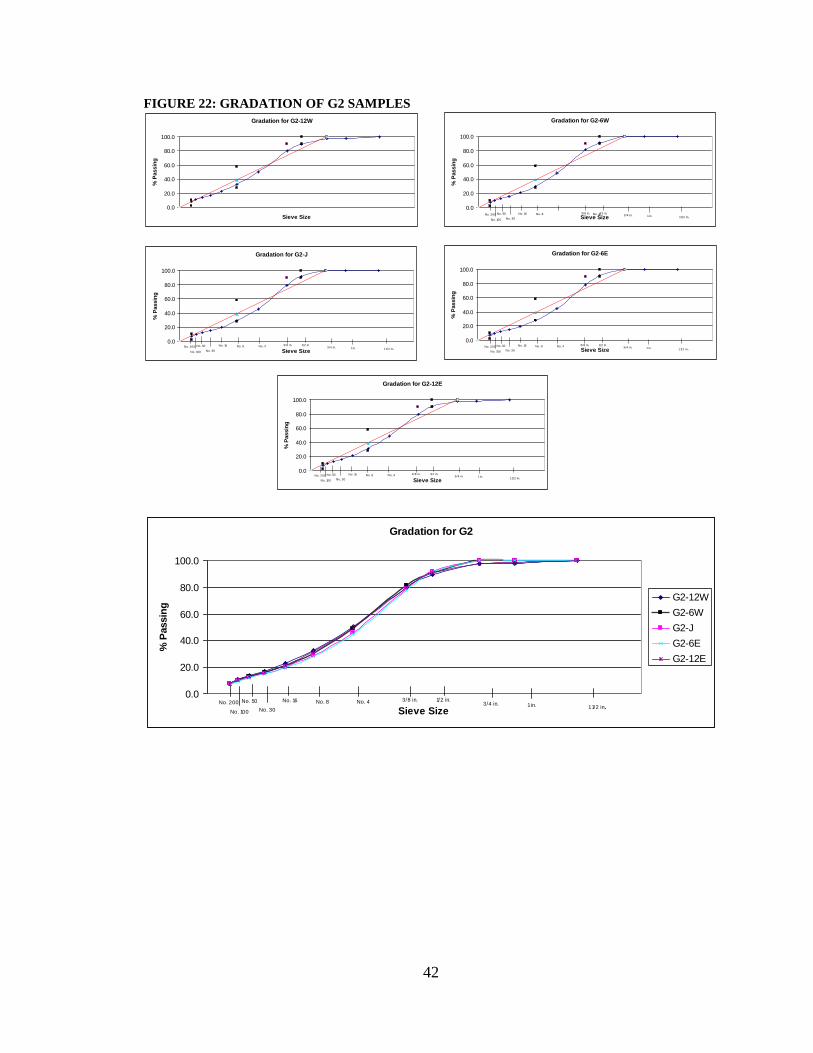
FIGURE 22: GRADATION OF G2 SAMPLES
Gradation for G2
0.0
20.0
40.0
60.0
80.0
100.0
Sieve Size
% P
assin
g
G2-12W
G2-6W
G2-J
G2-6E
G2-12E
No. 501 in.3/4 in.
1/2 in.3/8 in.No. 4No. 8No. 16
No. 30No. 100
No. 2001 1/2 in.
Gradation for G2-12W
0.0
20.0
40.0
60.0
80.0
100.0
Sieve Size
% P
assin
g
Gradation for G2-6W
0.0
20.0
40.0
60.0
80.0
100.0
Sieve Size
% P
assin
g
No. 501 in.3/4 in.
1/2 in.3/8 in. No. 4No. 8No. 16
No. 30No. 100
No. 2001 1/2 in.
Gradation for G2-J
0.0
20.0
40.0
60.0
80.0
100.0
Sieve Size
% P
assin
g
No. 501 in.3/4 in.
1/2 in.3/8 in.No. 4No. 8No. 16
No. 30No. 100
No. 2001 1/2 in.
Gradation for G2-6E
0.0
20.0
40.0
60.0
80.0
100.0
Sieve Size
% P
assin
g
No. 501 in.3/4 in.
1/2 in.3/8 in.No. 4No. 8No. 16
No. 30No. 100
No. 2001 1/2 in.
Gradation for G2-12E
0.0
20.0
40.0
60.0
80.0
100.0
Sieve Size
% P
assin
g
No. 501 in.3/4 in.
1/2 in.3/8 in.No. 4No. 8No. 16
No. 30No. 100
No. 2001 1/2 in.

43
FIGURE 23: GRADATION OF G3 SAMPLES
Gradation for G3
0.0
20.0
40.0
60.0
80.0
100.0
Sieve Size
% P
assin
g
G3-12W
G3-6W
G3-J
G3-6E
G3-12E
No. 501 in.3/4 in.
1/2 in.3/8 in.No. 4No. 8No. 16
No. 30No. 100
No. 2001 1/2 in.
Gradation for G3-12W
0.0
20.0
40.0
60.0
80.0
100.0
Sieve Size
% P
assin
g
Gradation for G3-6W
0.0
20.0
40.0
60.0
80.0
100.0
Sieve Size
% P
assin
g
No. 501 in.3/4 in.
1/2 in.3/8 in. No. 4No. 8No. 16
No. 30No. 100
No. 2001 1/2 in.
Gradation for G3-J
0.0
20.0
40.0
60.0
80.0
100.0
Sieve Size
% P
assin
g
No. 501 in.3/4 in.
1/2 in.3/8 in.No. 4No. 8No. 16
No. 30No. 100
No. 2001 1/2 in.
Gradation for G3-6E
0.0
20.0
40.0
60.0
80.0
100.0
Sieve Size
% P
assin
g
No. 501 in.3/4 in.
1/2 in.3/8 in.No. 4No. 8No. 16
No. 30No. 100
No. 2001 1/2 in.
Gradation for G3-12E
0.0
20.0
40.0
60.0
80.0
100.0
Sieve Size
% P
assin
g
No. 501 in.3/4 in.
1/2 in.3/8 in.No. 4No. 8No. 16
No. 30No. 100
No. 2001 1/2 in.
44
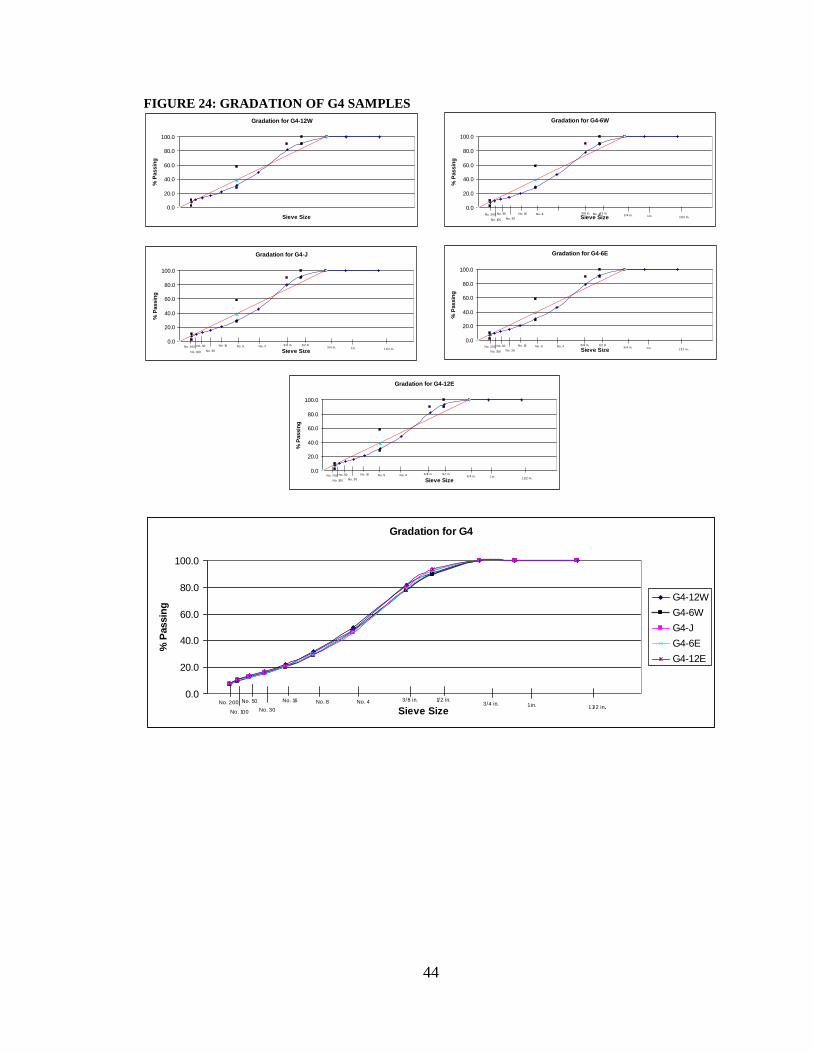
FIGURE 24: GRADATION OF G4 SAMPLES
Gradation for G4
0.0
20.0
40.0
60.0
80.0
100.0
Sieve Size
% P
assin
g
G4-12W
G4-6W
G4-J
G4-6E
G4-12E
No. 501 in.3/4 in.
1/2 in.3/8 in.No. 4No. 8No. 16
No. 30No. 100
No. 2001 1/2 in.
Gradation for G4-12W
0.0
20.0
40.0
60.0
80.0
100.0
Sieve Size
% P
assin
g
Gradation for G4-6W
0.0
20.0
40.0
60.0
80.0
100.0
Sieve Size
% P
assin
g
No. 501 in.3/4 in.
1/2 in.3/8 in. No. 4No. 8No. 16
No. 30No. 100
No. 2001 1/2 in.
Gradation for G4-J
0.0
20.0
40.0
60.0
80.0
100.0
Sieve Size
% P
assin
g
No. 501 in.3/4 in.
1/2 in.3/8 in.No. 4No. 8No. 16
No. 30No. 100
No. 2001 1/2 in.
Gradation for G4-6E
0.0
20.0
40.0
60.0
80.0
100.0
Sieve Size
% P
assin
g
No. 501 in.3/4 in.
1/2 in.3/8 in.No. 4No. 8No. 16
No. 30No. 100
No. 2001 1/2 in.
Gradation for G4-12E
0.0
20.0
40.0
60.0
80.0
100.0
Sieve Size
% P
assin
g
No. 501 in.3/4 in.
1/2 in.3/8 in.No. 4No. 8No. 16
No. 30No. 100
No. 2001 1/2 in.
45
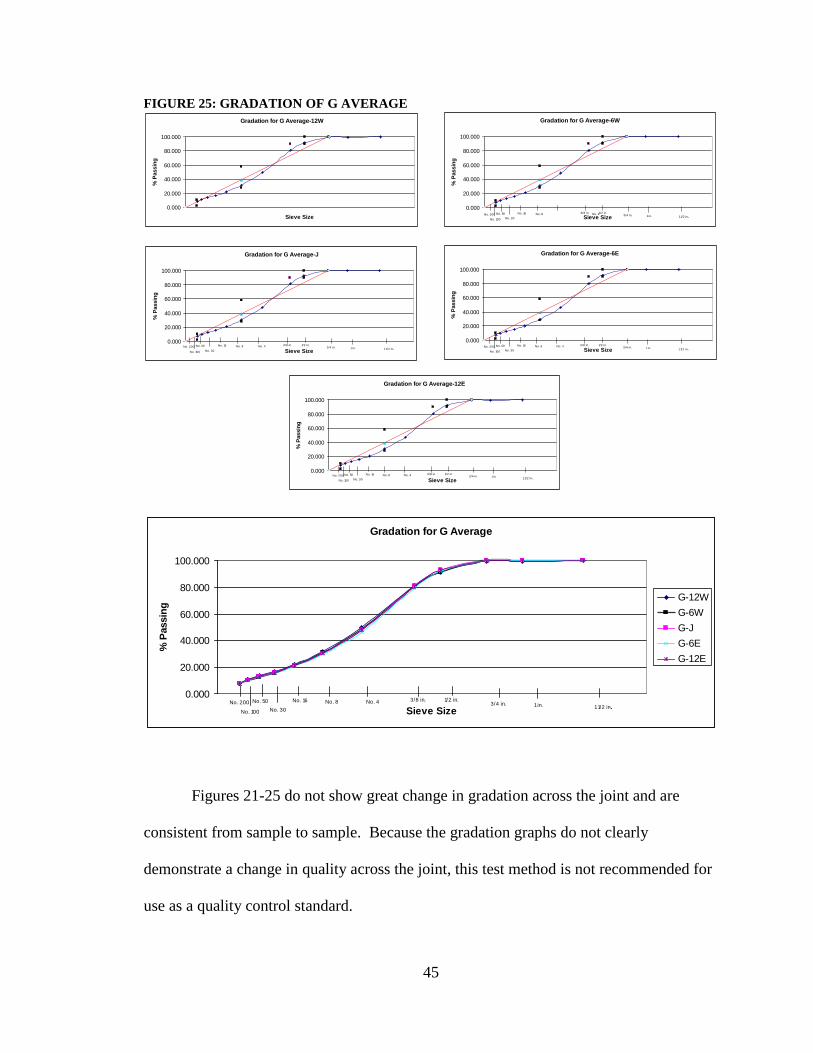
FIGURE 25: GRADATION OF G AVERAGE
Gradation for G Average
0.000
20.000
40.000
60.000
80.000
100.000
Sieve Size
% P
assin
g
G-12W
G-6W
G-J
G-6E
G-12E
No. 501 in.3/4 in.
1/2 in.3/8 in.No. 4No. 8No. 16
No. 30No. 100
No. 2001 1/2 in.
Figures 21-25 do not show great change in gradation across the joint and are
consistent from sample to sample. Because the gradation graphs do not clearly
demonstrate a change in quality across the joint, this test method is not recommended for
use as a quality control standard.
Gradation for G Average-12W
0.000
20.000
40.000
60.000
80.000
100.000
Sieve Size
% P
assin
g
Gradation for G Average-6W
0.000
20.000
40.000
60.000
80.000
100.000
Sieve Size
% P
assin
g
No. 501 in.3/4 in.
1/2 in.3/8 in. No. 4No. 8No. 16
No. 30No. 100
No. 2001 1/2 in.
Gradation for G Average-J
0.000
20.000
40.000
60.000
80.000
100.000
Sieve Size
% P
assin
g
No. 501 in.3/4 in.
1/2 in.3/8 in.No. 4No. 8No. 16
No. 30No. 100
No. 2001 1/2 in.
Gradation for G Average-6E
0.000
20.000
40.000
60.000
80.000
100.000
Sieve Size
% P
assin
g
No. 501 in.3/4 in.
1/2 in.3/8 in.No. 4No. 8No. 16
No. 30No. 100
No. 2001 1/2 in.
Gradation for G Average-12E
0.000
20.000
40.000
60.000
80.000
100.000
Sieve Size
% P
assin
g
No. 501 in.3/4 in.
1/2 in.3/8 in.No. 4No. 8No. 16
No. 30No. 100
No. 2001 1/2 in.

46
Russellville Visual Analysis
Russellville Samples, Compiled Raw Data
TABLE 12- R1 RAW DATA
Sample R1-12W R1-6W R1-J R1-6E R1-12E
SSD Gmb 2.264 2.235 2.091 2.120 2.128
% Water Absorbed by Volume
2.3 3.2 9.5 7.6 7.1
CoreLok Gmb 2.261 2.229 2.032 2.077 2.112
Kuss Gmb 2.617 2.289 2.270 2.287 2.263
Permeability 2.57 3.20 118.51 40.88 34.17
Oven Derived AC% 6.87 7.00 6.74 7.05
TABLE 13- R2 RAW DATA
Sample R2-12W R2-6W R2-J R2-6E R2-12E
SSD Gmb 2.267 2.245 2.160 2.131 2.165
% Water Absorbed by Volume
3.3 2.8 7.7 4.7
CoreLok Gmb 2.259 2.238 2.128 2.099 2.129
Kuss Gmb 2.298 2.289 2.322 2.289 2.273
Permeability 1.20 3.59 16.96 9.46
Oven Derived AC% 7.09 7.36 6.27 7.20
TABLE 14- R3 RAW DATA
Sample R3-12W R3-6W R3-J R3-6E R3-12E
SSD Gmb 2.267 2.271 2.130 2.173 2.233
% Water Absorbed by Volume
3.0 2.3 5.6 3.3
CoreLok Gmb 2.255 2.267 2.075 2.151 2.220
Kuss Gmb 2.297 2.290 2.181 2.268 2.271
Permeability 2.22 26.64 22.13 36.53
Oven Derived AC% 6.87 6.33 7.80

47
TABLE 15- R4 RAW DATA
Sample R4-12W R4-6W R4-J R4-6E R4-12E
SSD Gmb 2.303 2.279 2.099 2.163 2.204
% Water Absorbed by Volume
1.5 2.7 7.0 5.4
CoreLok Gmb 2.287 2.261 2.085 2.115 2.261
Kuss Gmb 2.339 2.312 2.143 2.263 2.303
Permeability 22.13 16.91 0.87 47.53
Oven Derived AC% 6.46 7.33 6.92
TABLE 16- R AVERAGE RAW DATA
Sample R12W R6W RJ R6E R12E
SSD Gmb 2.275 2.258 2.120 2.147 2.183
% Water Absorbed by Volume
2.540 2.729 9.484 6.987 5.134
CoreLok Gmb 2.266 2.249 2.080 2.110 2.181
Kuss Gmb 2.388 2.295 2.229 2.277 2.278
Permeability 7.031 118.511 20.426
Oven Derived AC% 6.823 5.173 6.740 7.113 3.530
TABLE 17- R1 SIEVE DATA
Sieve Size R1-12W R1-6W R1-J R1-6E R1-12E
1 1/2 in. 100.0 100.0 100.000 100.000 100.0
1 in. 100.0 100.0 100.000 100.000 100.0
3/4 in. 99.5 99.2 99.986 99.993 100.0
1/2 in. 94.7 95.9 97.321 94.539 96.4
3/8 in. 85.1 85.0 85.914 83.750 86.4
No. 4 53.6 54.7 55.639 51.848 55.4
No. 8 36.3 38.1 36.437 33.931 35.9
No. 16 27.1 28.3 26.128 24.073 23.2
No. 30 21.9 22.9 20.962 19.446 17.1
No. 50 16.8 17.6 16.836 16.403 13.0
No. 100 10.9 11.4 11.144 11.227 9.2
No. 200 9.0 6.87 8.543 8.677 5.4

48
TABLE 18- R2 SIEVE DATA
Sieve Size R2-12W R2-6W R2-J R2-6E R2-12E
1 1/2 in. 100.000 100.000 100.000 100.000 100.000
1 in. 100.000 100.000 100.000 100.000 100.000
3/4 in. 99.987 99.715 99.587 100.000 99.975
1/2 in. 92.160 97.927 98.700 93.667 94.513
3/8 in. 80.955 88.833 86.770 81.545 86.889
No. 4 52.537 57.260 55.882 52.418 54.602
No. 8 35.719 39.145 37.781 34.976 35.892
No. 16 26.816 28.609 27.405 24.271 24.354
No. 30 21.654 22.940 21.589 19.550 19.507
No. 50 16.611 17.314 17.456 16.400 16.341
No. 100 10.630 10.803 11.440 11.028 10.892
No. 200 8.127 6.232 8.798 6.467 6.446
TABLE 19- R3 SIEVE DATA
Sieve Size R3-12W R3-6W R3-J R3-6E R3-12E
1 1/2 in. 100.0 100.0 100.0 100.0 100.0
1 in. 100.0 100.0 100.0 100.0 100.0
3/4 in. 100.0 100.0 100.0 100.0 100.0
1/2 in. 95.8 96.2 96.6 94.6 93.3
3/8 in. 85.0 87.6 87.4 84.2 86.0
No. 4 50.8 55.0 62.8 51.4 55.0
No. 8 35.3 37.8 46.2 33.7 32.2
No. 16 26.5 28.3 34.7 23.4 22.0
No. 30 21.4 22.7 29.1 18.6 17.1
No. 40 21.4 22.7 29.1 18.6 17.1
No. 100 10.7 11.3 15.4 10.1 8.8
No. 200 8.5 9.0 10.9 7.3 5.4
49
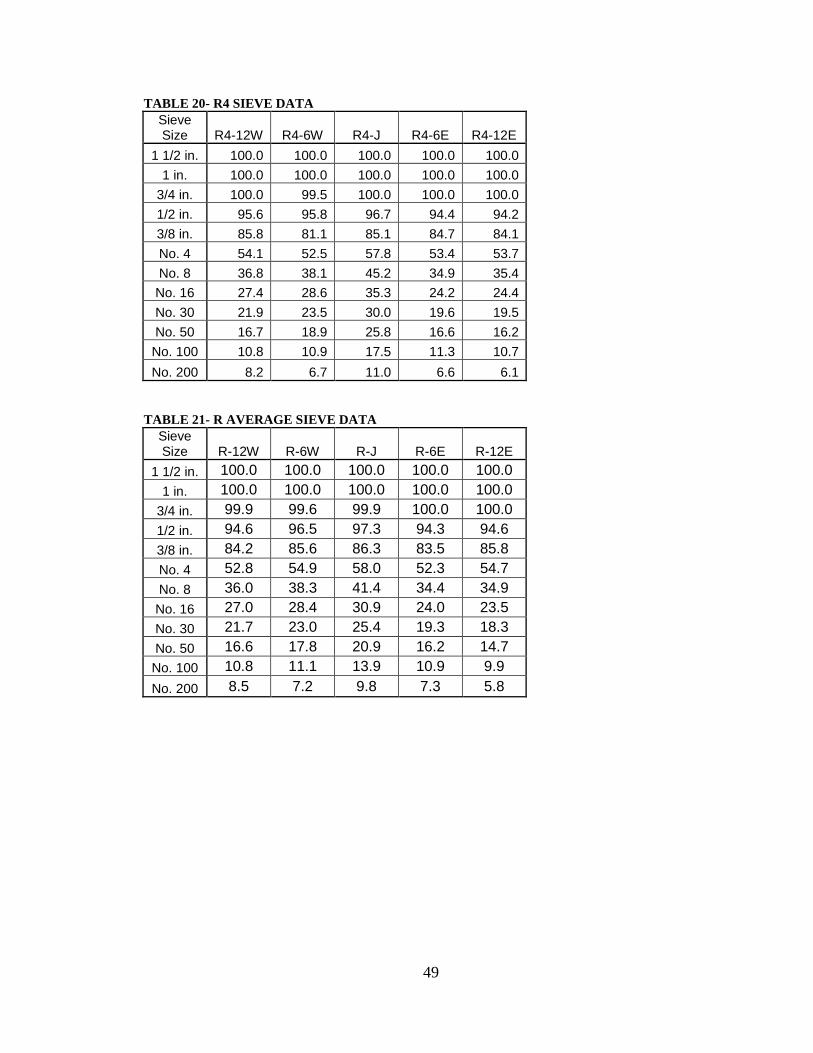
TABLE 20- R4 SIEVE DATA
Sieve Size R4-12W R4-6W R4-J R4-6E R4-12E
1 1/2 in. 100.0 100.0 100.0 100.0 100.0
1 in. 100.0 100.0 100.0 100.0 100.0
3/4 in. 100.0 99.5 100.0 100.0 100.0
1/2 in. 95.6 95.8 96.7 94.4 94.2
3/8 in. 85.8 81.1 85.1 84.7 84.1
No. 4 54.1 52.5 57.8 53.4 53.7
No. 8 36.8 38.1 45.2 34.9 35.4
No. 16 27.4 28.6 35.3 24.2 24.4
No. 30 21.9 23.5 30.0 19.6 19.5
No. 50 16.7 18.9 25.8 16.6 16.2
No. 100 10.8 10.9 17.5 11.3 10.7
No. 200 8.2 6.7 11.0 6.6 6.1
TABLE 21- R AVERAGE SIEVE DATA
Sieve Size R-12W R-6W R-J R-6E R-12E
1 1/2 in. 100.0 100.0 100.0 100.0 100.0
1 in. 100.0 100.0 100.0 100.0 100.0
3/4 in. 99.9 99.6 99.9 100.0 100.0
1/2 in. 94.6 96.5 97.3 94.3 94.6
3/8 in. 84.2 85.6 86.3 83.5 85.8
No. 4 52.8 54.9 58.0 52.3 54.7
No. 8 36.0 38.3 41.4 34.4 34.9
No. 16 27.0 28.4 30.9 24.0 23.5
No. 30 21.7 23.0 25.4 19.3 18.3
No. 50 16.6 17.8 20.9 16.2 14.7
No. 100 10.8 11.1 13.9 10.9 9.9
No. 200 8.5 7.2 9.8 7.3 5.8
50
Russellville samples, Water Absorbed
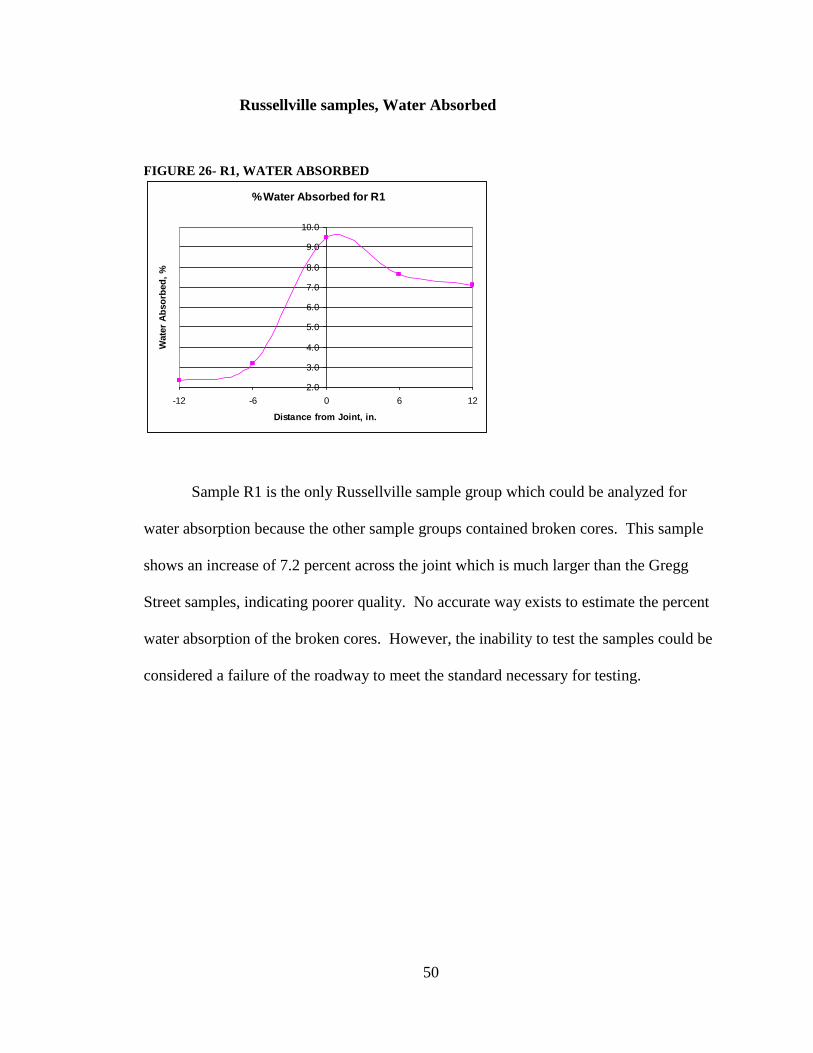
FIGURE 26- R1, WATER ABSORBED
%Water Absorbed for R1
2.0
3.0
4.0
5.0
6.0
7.0
8.0
9.0
10.0
-12 -6 0 6 12
Distance from Joint, in.
Wate
r A
bso
rbed
, %
Sample R1 is the only Russellville sample group which could be analyzed for
water absorption because the other sample groups contained broken cores. This sample
shows an increase of 7.2 percent across the joint which is much larger than the Gregg
Street samples, indicating poorer quality. No accurate way exists to estimate the percent
water absorption of the broken cores. However, the inability to test the samples could be
considered a failure of the roadway to meet the standard necessary for testing.
51
Russellville samples, Density
FIGURE 27- R1, DENSITY
Density of R1
2.0
2.1
2.2
2.3
2.4
2.5
2.6
-12 -6 0 6 12
Distance from Joint, in.
Den
sit
y,
g/c
m3
SSD Gmb
CoreLok Gmb
Kuss Gmb
FIGURE 28- R2, DENSITY
Density of R2
2.0
2.1
2.2
2.3
2.4
2.5
2.6
-12 -6 0 6 12
Distance from Joint, in.
De
ns
ity
, g
/cm
3
SSD Gmb
CoreLok Gmb
Kuss Gmb
52
FIGURE 29- R3, DENSITY
Density of R3
2.0
2.1
2.2
2.3
2.4
2.5
2.6
-20 -10 0 10 20
Distance from Joint, in.
De
ns
ity
, g
/cm
3
SSD Gmb
CoreLok Gmb
Kuss Gmb
FIGURE 30- R4, DENSITY
Density of R4
2.0
2.1
2.2
2.3
2.4
2.5
2.6
-20 -10 0 10 20
Distance from Joint, in.
De
ns
ity
, g
/cm
3
SSD Gmb
CoreLok Gmb
Kuss Gmb
53
FIGURE 31- R AVERAGE, DENSITY
Density of R Average
2.0
2.1
2.2
2.3
2.4
2.5
2.6
-20 -10 0 10 20
Distance from Joint, in.
De
ns
ity
, g
/cm
3
SSD Gmb
CoreLok Gmb
Kuss Gmb
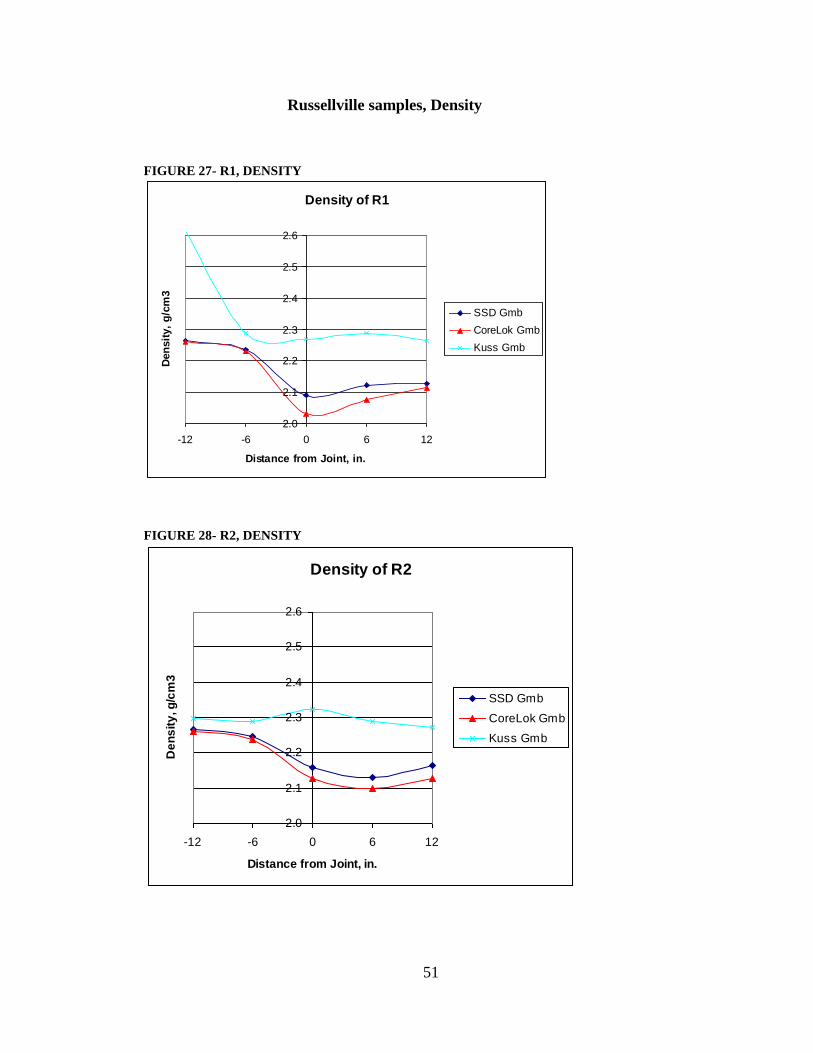
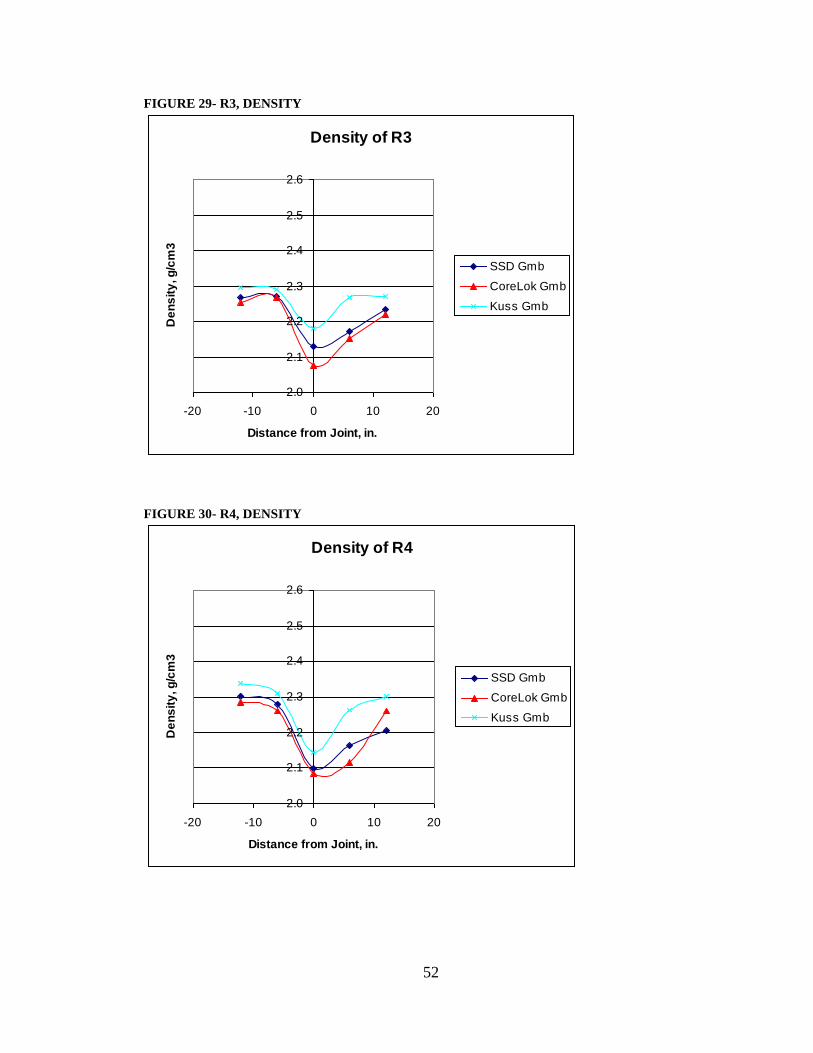
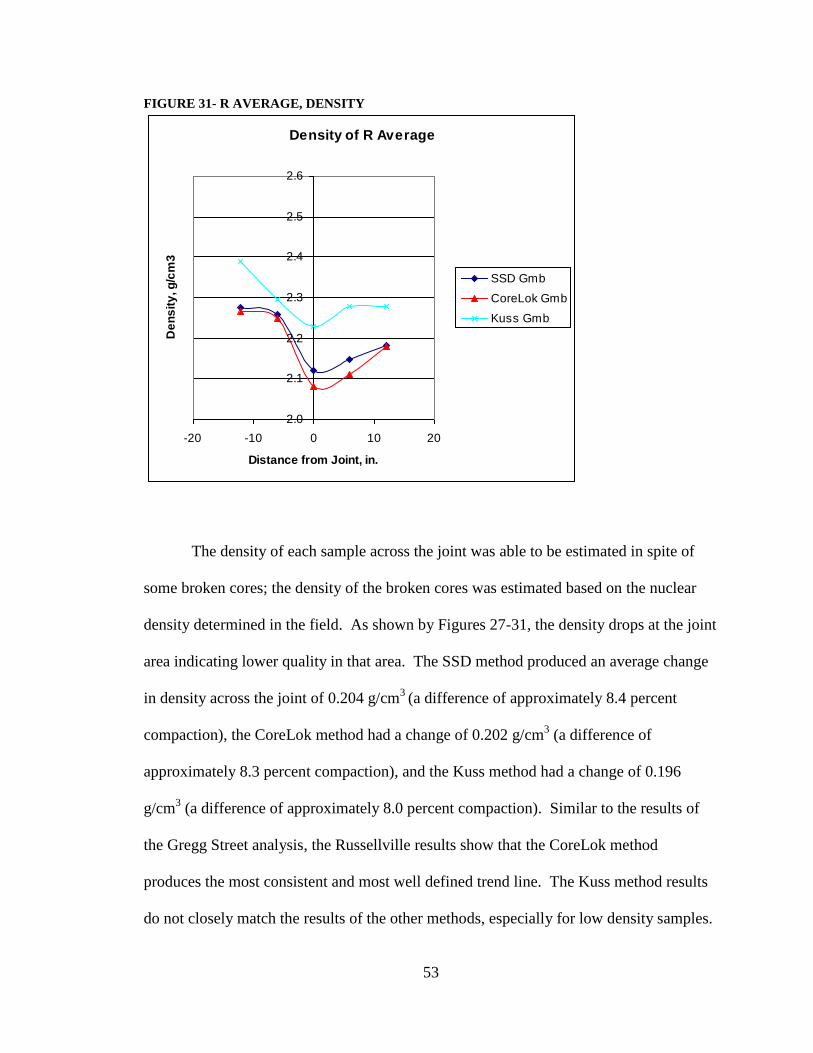
The density of each sample across the joint was able to be estimated in spite of
some broken cores; the density of the broken cores was estimated based on the nuclear
density determined in the field. As shown by Figures 27-31, the density drops at the joint
area indicating lower quality in that area. The SSD method produced an average change
in density across the joint of 0.204 g/cm3
(a difference of approximately 8.4 percent
compaction), the CoreLok method had a change of 0.202 g/cm3 (a difference of
approximately 8.3 percent compaction), and the Kuss method had a change of 0.196
g/cm3 (a difference of approximately 8.0 percent compaction). Similar to the results of
the Gregg Street analysis, the Russellville results show that the CoreLok method
produces the most consistent and most well defined trend line. The Kuss method results
do not closely match the results of the other methods, especially for low density samples.
54
Russellville samples, Permeability
FIGURE 32- R1, PERMEABILITY
Permeability of R1
-20
0
20
40
60
80
100
120
140
-12 -6 0 6 12
Distance from Joint, in.
Perm
eab
ilit
y,
cm
2/s
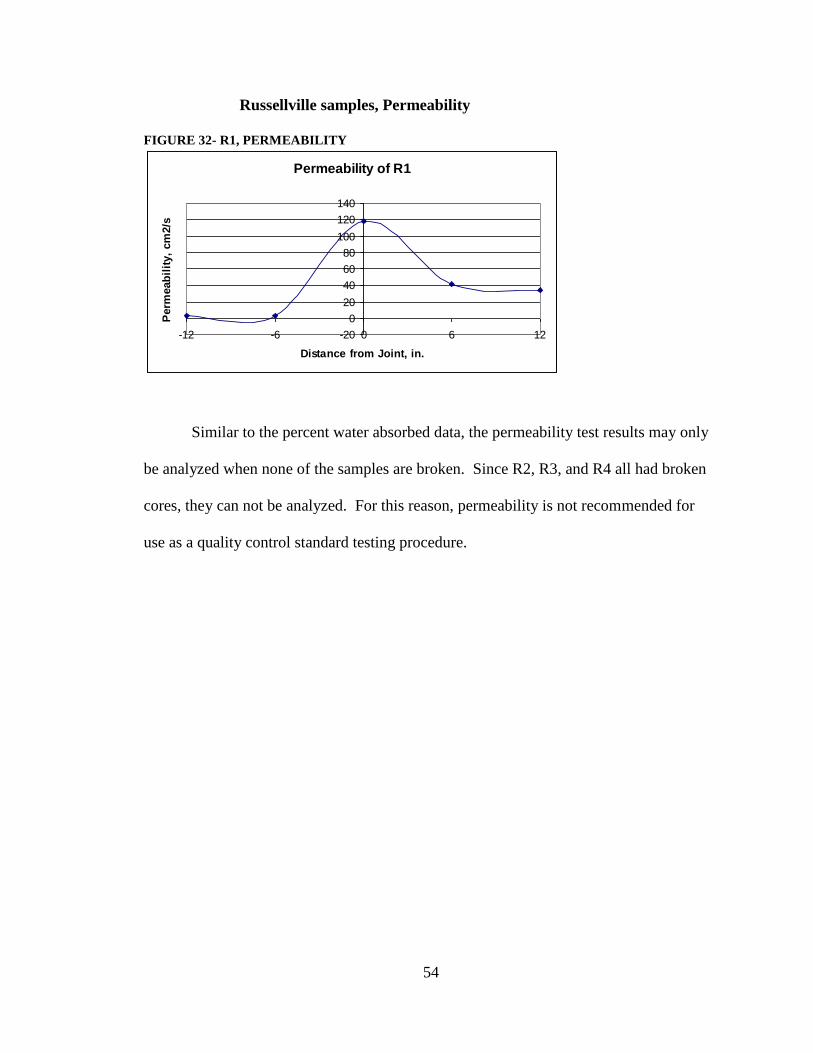
Similar to the percent water absorbed data, the permeability test results may only
be analyzed when none of the samples are broken. Since R2, R3, and R4 all had broken
cores, they can not be analyzed. For this reason, permeability is not recommended for
use as a quality control standard testing procedure.
55
Russellville samples, Oven Derived AC %
FIGURE 33-R AVERAGE, ASPHALT CONTENT
Oven Derived AC% of R Average
0
1
2
3
4
5
6
7
8
-12 -6 0 6 12
Distance from Joint, in.
Oven
Deri
ved
AC
%
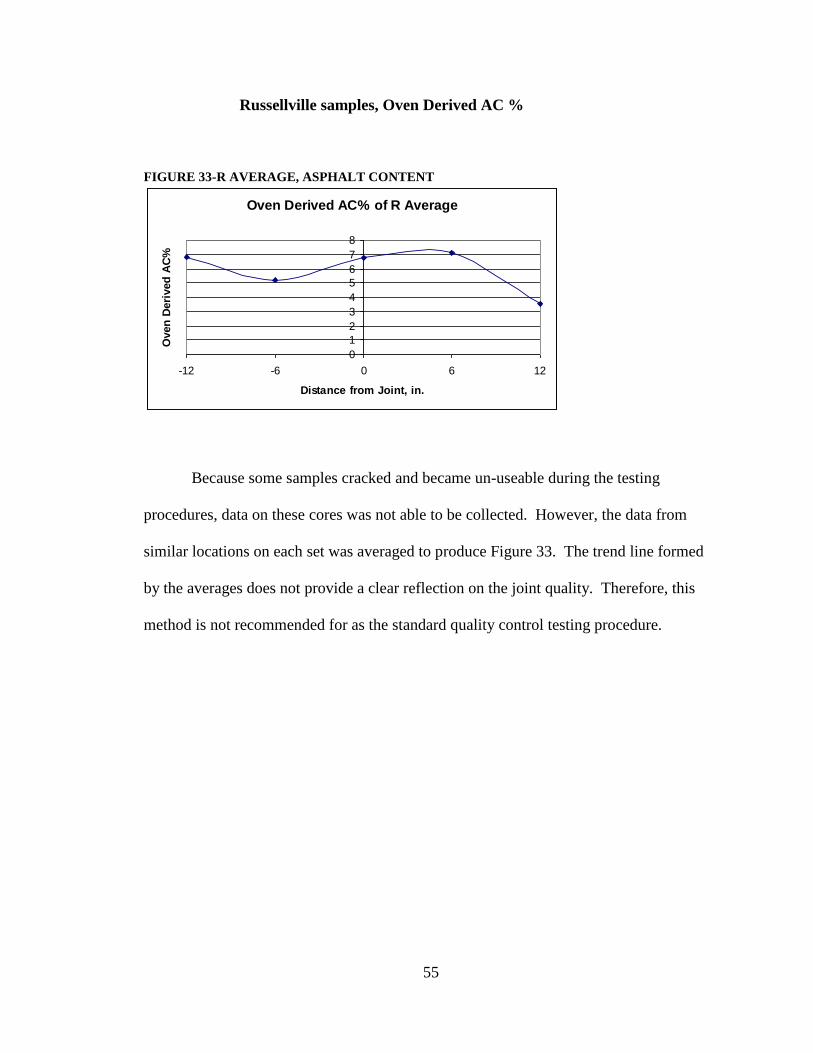
Because some samples cracked and became un-useable during the testing
procedures, data on these cores was not able to be collected. However, the data from
similar locations on each set was averaged to produce Figure 33. The trend line formed
by the averages does not provide a clear reflection on the joint quality. Therefore, this
method is not recommended for as the standard quality control testing procedure.

56
Russellville Samples, Gradation
FIGURE 34- GRADATION OF R1 SAMPLES
Gradation for R1
0.0
20.0
40.0
60.0
80.0
100.0
Sieve Size
% P
assin
g
R1-12W
R1-6W
R1-J
R1-6E
R1-12E
No. 501 in.3/4 in.
1/2 in.3/8 in.No. 4No. 8No. 16
No. 30No. 100
No. 2001 1/2 in.
Gradation for R1-12W
0.0
20.0
40.0
60.0
80.0
100.0
Sieve Size
% P
assin
g
Gradation for R1-6W
0.000
20.000
40.000
60.000
80.000
100.000
Sieve Size
% P
assin
g
No. 501 in.3/4 in.
1/2 in.3/8 in. No. 4No. 8No. 16
No. 30No. 100
No. 2001 1/2 in.
Gradation for R1-J
0.000
20.000
40.000
60.000
80.000
100.000
Sieve Size
% P
assin
g
No. 501 in.3/4 in.
1/2 in.3/8 in.No. 4No. 8No. 16
No. 30No. 100
No. 2001 1/2 in.
Gradation for R1-6E
0.000
20.000
40.000
60.000
80.000
100.000
Sieve Size
% P
assin
g
No. 501 in.3/4 in.
1/2 in.3/8 in.No. 4No. 8No. 16
No. 30No. 100
No. 2001 1/2 in.
Gradation for R1-12E
0.0
20.0
40.0
60.0
80.0
100.0
Sieve Size
% P
assin
g
No. 501 in.3/4 in.
1/2 in.3/8 in.No. 4No. 8No. 16
No. 30No. 100
No. 2001 1/2 in.

57
FIGURE 35- GRADATION OF R2 SAMPLES
Gradation for R2
0.000
20.000
40.000
60.000
80.000
100.000
Sieve Size
% P
assin
g
R2-12W
R2-6W
R2-J
R2-6E
R2-12E
No. 501 in.3/4 in.
1/2 in.3/8 in.No. 4No. 8No. 16
No. 30No. 100
No. 2001 1/2 in.
Gradation for R2-12W
0.000
20.000
40.000
60.000
80.000
100.000
Sieve Size
% P
assin
g
Gradation for R2-6W
0.000
20.000
40.000
60.000
80.000
100.000
Sieve Size
% P
assin
g
No. 501 in.3/4 in.
1/2 in.3/8 in. No. 4No. 8No. 16
No. 30No. 100
No. 2001 1/2 in.
Gradation for R2-J
0.000
20.000
40.000
60.000
80.000
100.000
Sieve Size
% P
assin
g
No. 501 in.3/4 in.
1/2 in.3/8 in.No. 4No. 8No. 16
No. 30No. 100
No. 2001 1/2 in.
Gradation for R2-6E
0.000
20.000
40.000
60.000
80.000
100.000
Sieve Size
% P
assin
g
No. 501 in.3/4 in.
1/2 in.3/8 in.No. 4No. 8No. 16
No. 30No. 100
No. 2001 1/2 in.
Gradation for R2-12E
0.000
20.000
40.000
60.000
80.000
100.000
Sieve Size
% P
assin
g
No. 501 in.3/4 in.
1/2 in.3/8 in.No. 4No. 8No. 16
No. 30No. 100
No. 2001 1/2 in.

58
FIGURE 36- GRADATION OF R3 SAMPLES
Gradation for R3
0.000
20.000
40.000
60.000
80.000
100.000
Sieve Size
% P
assin
g
R3-12W
R3-6W
R3-J
R3-6E
R3-12E
No. 501 in.3/4 in.
1/2 in.3/8 in.No. 4No. 8No. 16
No. 30No. 100
No. 2001 1/2 in.
Gradation for R3-12W
0.000
20.000
40.000
60.000
80.000
100.000
Sieve Size
% P
assin
g
Gradation for R3-6W
0.000
20.000
40.000
60.000
80.000
100.000
Sieve Size
% P
assin
g
No. 501 in.3/4 in.
1/2 in.3/8 in. No. 4No. 8No. 16
No. 30No. 100
No. 2001 1/2 in.
Gradation for R3-J
0.000
20.000
40.000
60.000
80.000
100.000
Sieve Size
% P
assin
g
No. 501 in.3/4 in.
1/2 in.3/8 in.No. 4No. 8No. 16
No. 30No. 100
No. 2001 1/2 in.
Gradation for R3-6E
0.000
20.000
40.000
60.000
80.000
100.000
Sieve Size
% P
assin
g
No. 501 in.3/4 in.
1/2 in.3/8 in.No. 4No. 8No. 16
No. 30No. 100
No. 2001 1/2 in.
Gradation for R3-12E
0.000
20.000
40.000
60.000
80.000
100.000
Sieve Size
% P
assin
g
No. 501 in.3/4 in.
1/2 in.3/8 in.No. 4No. 8No. 16
No. 30No. 100
No. 2001 1/2 in.

59
FIGURE 37- GRADATION OF R4 SAMPLES
Gradation for R4
0.000
20.000
40.000
60.000
80.000
100.000
Sieve Size
% P
assin
g
R4-12W
R4-6W
R4-J
R4-6E
R4-12E
No. 501 in.3/4 in.
1/2 in.3/8 in.No. 4No. 8No. 16
No. 30No. 100
No. 2001 1/2 in.
Gradation for R4-12W
0.000
20.000
40.000
60.000
80.000
100.000
Sieve Size
% P
assin
g
Gradation for R4-6W
0.000
20.000
40.000
60.000
80.000
100.000
Sieve Size
% P
assin
g
No. 501 in.3/4 in.
1/2 in.3/8 in. No. 4No. 8No. 16
No. 30No. 100
No. 2001 1/2 in.
Gradation for R4-J
0.000
20.000
40.000
60.000
80.000
100.000
Sieve Size
% P
assin
g
No. 501 in.3/4 in.
1/2 in.3/8 in.No. 4No. 8No. 16
No. 30No. 100
No. 2001 1/2 in.
Gradation for R4-6E
0.000
20.000
40.000
60.000
80.000
100.000
Sieve Size
% P
assin
g
No. 501 in.3/4 in.
1/2 in.3/8 in.No. 4No. 8No. 16
No. 30No. 100
No. 2001 1/2 in.
Gradation for R4-12E
0.000
20.000
40.000
60.000
80.000
100.000
Sieve Size
% P
assin
g
No. 501 in.3/4 in.
1/2 in.3/8 in.No. 4No. 8No. 16
No. 30No. 100
No. 2001 1/2 in.
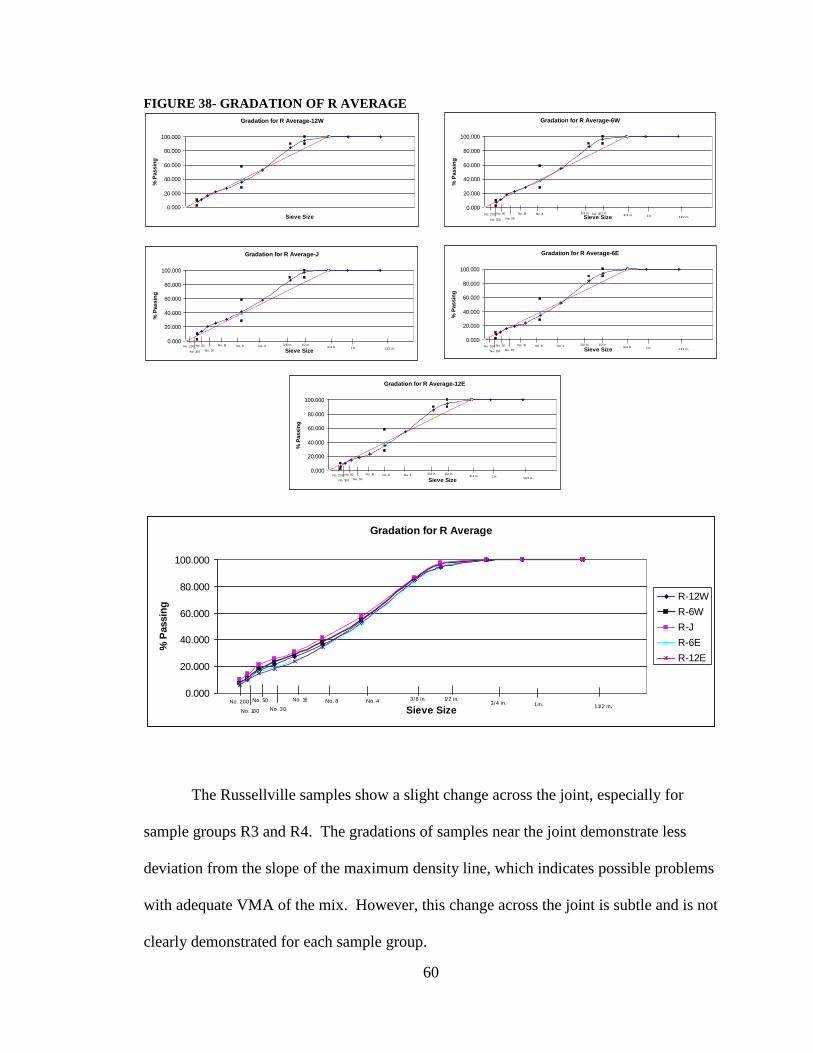
60
FIGURE 38- GRADATION OF R AVERAGE
Gradation for R Average
0.000
20.000
40.000
60.000
80.000
100.000
Sieve Size
% P
assin
g
R-12W
R-6W
R-J
R-6E
R-12E
No. 501 in.3/4 in.
1/2 in.3/8 in.No. 4No. 8No. 16
No. 30No. 100
No. 2001 1/2 in.
The Russellville samples show a slight change across the joint, especially for
sample groups R3 and R4. The gradations of samples near the joint demonstrate less
deviation from the slope of the maximum density line, which indicates possible problems
with adequate VMA of the mix. However, this change across the joint is subtle and is not
clearly demonstrated for each sample group.
Gradation for R Average-12W
0.000
20.000
40.000
60.000
80.000
100.000
Sieve Size
% P
assin
g
Gradation for R Average-6W
0.000
20.000
40.000
60.000
80.000
100.000
Sieve Size
% P
assin
g
No. 501 in.3/4 in.
1/2 in.3/8 in. No. 4No. 8No. 16
No. 30No. 100
No. 2001 1/2 in.
Gradation for R Average-J
0.000
20.000
40.000
60.000
80.000
100.000
Sieve Size
% P
assin
g
No. 501 in.3/4 in.
1/2 in.3/8 in.No. 4No. 8No. 16
No. 30No. 100
No. 2001 1/2 in.
Gradation for R Average-6E
0.000
20.000
40.000
60.000
80.000
100.000
Sieve Size
% P
assin
g
No. 501 in.3/4 in.
1/2 in.3/8 in.No. 4No. 8No. 16
No. 30No. 100
No. 2001 1/2 in.
Gradation for R Average-12E
0.000
20.000
40.000
60.000
80.000
100.000
Sieve Size
% P
assin
g
No. 501 in.3/4 in.
1/2 in.3/8 in.No. 4No. 8No. 16
No. 30No. 100
No. 2001 1/2 in.

61
Yellville Visual Analysis
Yellville Samples, Compiled Raw Data
TABLE 22- Y1 RAW DATA
Sample Y1-12S Y1-6S Y1-J Y1-6N Y1-12N
SSD Gmb 2.240 2.130 2.007 2.123 2.157
% Water Absorbed by Volume
3.1 6.4 12.2 7.6 5.7
CoreLok Gmb 2.229 2.133 1.909 2.114 2.147
Kuss Gmb 2.265 2.241 2.253 2.243 2.231
Permeability 568.85 1037.48 1757.08 1288.65 758.27
Oven Derived AC% 5.93
TABLE 23- Y2 RAW DATA
Sample Y2-12S Y2-6S Y2-J Y2-6N Y2-12N
SSD Gmb 2.262 2.217 2.035 2.222 2.219
% Water Absorbed by Volume
3.1 3.7 10.3 3.9 3.7
CoreLok Gmb 2.264 2.216 1.984 2.194 2.210
Kuss Gmb 2.292 2.289 2.232 2.256 2.250
Permeability 67.68 267.32 3027.41 391.22 180.45
Oven Derived AC% 3.35 5.49
TABLE 24- Y3 RAW DATA
Sample Y3-12S Y3-6S Y3-J Y3-6N Y3-12N
SSD Gmb 2.229 2.170 2.018 2.216 2.221
% Water Absorbed by Volume
3.6 5.5 11.2 3.5 2.7
CoreLok Gmb 2.230 2.166 1.989 2.209 2.226
Kuss Gmb 2.265 2.234 2.257 1.950 2.269
Permeability 257.83 534.04 1742.69 209.87 171.87
Oven Derived AC% 5.80 6.09
TABLE 25- Y4 RAW DATA
Sample Y4-12S Y4-6S Y4-J Y4-6N Y4-12N
SSD Gmb 2.246 2.160 2.100 2.221 2.238
% Water Absorbed by Volume
2.7 5.3 3.6 3.2
CoreLok Gmb 2.242 2.146 2.091 2.221 2.233
Kuss Gmb 2.279 2.246 2.063 2.279 2.266
Permeability 267.30 592.42 315.81 193.87
Oven Derived AC% 5.14 5.51 5.24 5.04

62
TABLE 26- Y AVERAGE RAW DATA
Sample Y12S Y6S YJ Y6N Y12N
SSD Gmb 2.244 2.169 2.040 2.196 2.209
% Water Absorbed by Volume
3.140 5.233 11.242 4.639 3.841
CoreLok Gmb 2.241 2.165 1.993 2.184 2.204
Kuss Gmb 2.275 2.253 2.201 2.182 2.254
Permeability 290.41 607.81 744.75 551.38 994.89
Oven Derived AC% 2.768 1.378 3.050 4.205 1.260
TABLE 27- Y1 SIEVE DATA
Sieve Size Y1-12W Y1-6W Y1-J Y1-6E Y1-12E
1 1/2 in. 100.0 100.0 100.0 100.0 100.0
1 in. 100.0 100.0 100.0 100.0 100.0
3/4 in. 100.0 100.0 100.0 99.9 100.0
1/2 in. 99.8 99.7 98.3 99.3 97.9
3/8 in. 92.9 91.6 88.9 88.7 85.5
No. 4 63.6 62.0 57.8 55.3 48.6
No. 8 43.8 42.8 41.6 38.3 30.8
No. 16 31.9 31.4 31.9 28.3 21.8
No. 30 26.0 25.3 25.4 23.6 17.1
No. 50 18.6 18.8 18.0 17.2 12.0
No. 100 8.1 9.4 10.3 8.4 6.0
No. 200 4.2 4.3 8.0 6.5 6.0
TABLE 28- Y2 SIEVE DATA
Sieve Size Y2-12W Y2-6W Y2-J Y2-6E Y2-12E
1 1/2 in. 100.0 100.0 100.0 100.0 100.0
1 in. 100.0 100.0 100.0 100.0 100.0
3/4 in. 100.0 100.0 100.0 100.0 99.6
1/2 in. 99.2 99.4 99.8 99.1 96.7
3/8 in. 94.1 92.2 90.9 90.6 87.1
No. 4 64.0 64.2 60.2 57.2 60.4
No. 8 42.8 43.1 41.2 39.1 41.1
No. 16 32.2 31.1 32.6 28.9 28.8
No. 30 24.9 24.9 27.5 23.8 23.4
No. 50 17.7 18.0 21.0 17.7 17.7
No. 100 9.3 9.2 11.1 9.1 8.8
No. 200 6.6 8.4 8.9 6.2 7.1

63
TABLE 29- Y3 SIEVE DATA
Sieve Size Y3-12W Y3-6W Y3-J Y3-6E Y3-12E
1 1/2 in. 100.0 100.0 100.0 100.0 100.0
1 in. 100.0 100.0 100.0 100.0 100.0
3/4 in. 100.0 100.0 100.0 100.0 99.6
1/2 in. 98.8 99.7 98.5 99.7 97.1
3/8 in. 93.3 92.6 89.5 92.9 88.9
No. 4 60.8 63.4 55.5 62.0 58.3
No. 8 40.2 42.1 37.1 42.6 39.3
No. 16 28.4 29.9 27.6 31.9 29.2
No. 30 22.4 23.9 22.5 27.3 23.6
No. 50 16.1 17.2 16.5 20.4 17.2
No. 100 7.8 8.1 8.1 10.4 8.5
No. 200 4.9 4.9 7.3 8.7 8.5
TABLE 30- Y4 SIEVE DATA
Sieve Size Y4-12W Y4-6W Y4-J Y4-6E Y4-12E
1 1/2 in. 100.0 100.0 100.0 100.0 100.0
1 in. 100.0 100.0 100.0 100.0 100.0
3/4 in. 100.0 100.0 99.6 100.0 100.0
1/2 in. 98.1 99.6 97.2 99.5 99.2
3/8 in. 89.7 91.3 88.2 92.5 91.0
No. 4 55.9 60.2 54.9 60.9 57.6
No. 8 37.3 40.8 38.2 41.2 38.7
No. 16 27.1 30.3 27.8 30.4 28.7
No. 30 22.1 25.0 22.0 24.4 23.4
No. 50 16.5 18.7 15.8 17.3 17.2
No. 100 8.2 9.0 7.9 8.6 11.7
No. 200 5.5 5.9 6.5 7.3 10.7

64
TABLE 31- Y AVERAGE SIEVE DATA
Sieve Size Y-12W Y-6W Y-J Y-6E Y-12E
1 1/2 in. 100.0 100.0 100.0 100.0 100.0
1 in. 100.0 100.0 100.0 100.0 100.0
3/4 in. 100.0 100.0 99.9 100.0 99.8
1/2 in. 99.0 99.6 98.4 99.4 97.7
3/8 in. 92.5 91.9 89.4 91.2 88.1
No. 4 61.1 62.5 57.1 58.9 56.2
No. 8 41.0 42.2 39.5 40.3 37.5
No. 16 29.9 30.7 30.0 29.9 27.1
No. 30 23.9 24.8 24.3 24.8 21.9
No. 50 17.2 18.2 17.8 18.1 16.0
No. 100 8.3 8.9 9.3 9.1 8.7
No. 200 5.3 5.9 7.7 7.2 8.1

65
Yellville Samples, % Water Absorbed
FIGURE 39- Y1, % WATER ABSORBED
% Water Absorbed for Y1
2.0
3.0
4.0
5.0
6.0
7.0
8.0
9.0
10.0
11.0
12.0
13.0
-12 -6 0 6 12
Distance from Joint, in.
Wate
r A
bso
rbed
, %
FIGURE 40- Y2, % WATER ABSORBED
% Water Absorbed for Y2
2.0
3.0
4.0
5.0
6.0
7.0
8.0
9.0
10.0
11.0
12.0
13.0
-12 -6 0 6 12
Distance from Joint, in.
Wa
ter
Ab
so
rbe
d, %

66
FIGURE 41- Y3, % WATER ABSORBED
% Water Absorbed for Y3
2.0
3.0
4.0
5.0
6.0
7.0
8.0
9.0
10.0
11.0
12.0
13.0
-12 -6 0 6 12
Distance from Joint, in.
Wa
ter
Ab
so
rbe
d, %
FIGURE 42- Y AVERAGE, % WATER ABSORBED
% Water Absorbed for Y Average
2.0
3.0
4.0
5.0
6.0
7.0
8.0
9.0
10.0
11.0
12.0
13.0
-12 -6 0 6 12
Distance from Joint, in.
Wate
r A
bso
rbed
, %
Figures 29-42 show an even greater increase in percent water absorbed than the
Russellville and the Gregg Street samples, indicating that the Yellville samples are the
poorest quality. The average change in percent water absorbed across the joint was
8.102. These results reflect the expected conditions of each roadway. Furthermore, and
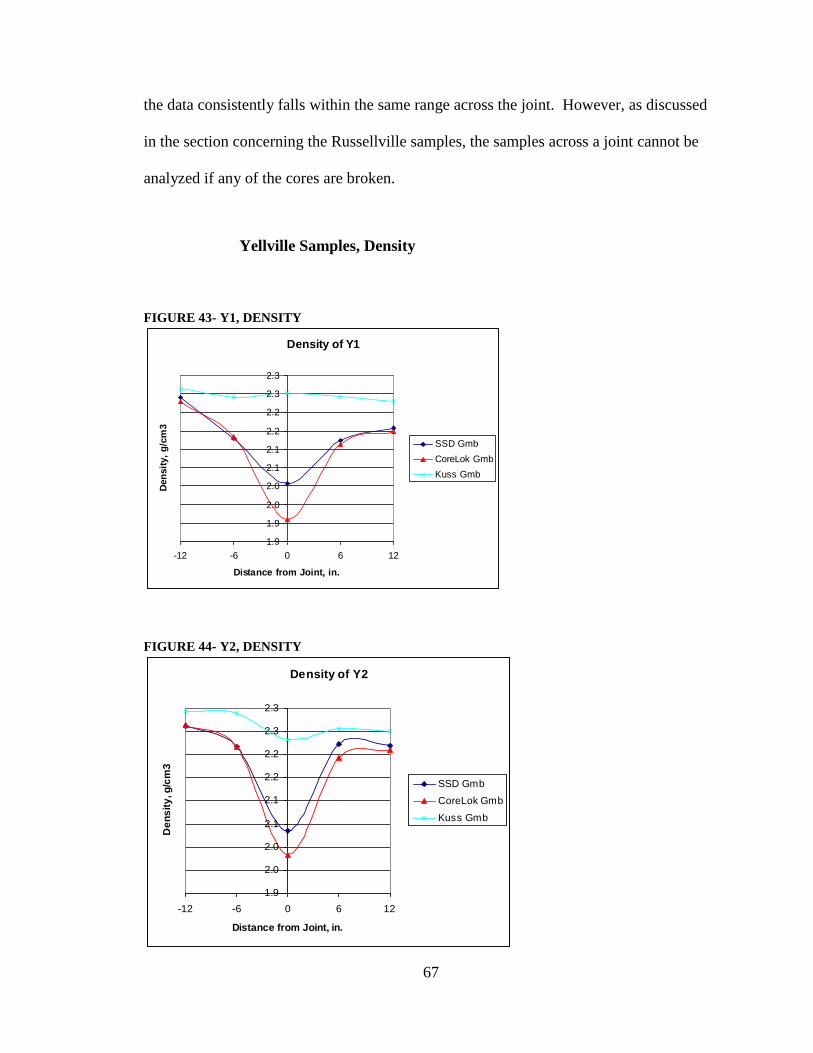
67
the data consistently falls within the same range across the joint. However, as discussed
in the section concerning the Russellville samples, the samples across a joint cannot be
analyzed if any of the cores are broken.
Yellville Samples, Density
FIGURE 43- Y1, DENSITY
Density of Y1
1.9
1.9
2.0
2.0
2.1
2.1
2.2
2.2
2.3
2.3
-12 -6 0 6 12
Distance from Joint, in.
Den
sit
y,
g/c
m3
SSD Gmb
CoreLok Gmb
Kuss Gmb
FIGURE 44- Y2, DENSITY
Density of Y2
1.9
2.0
2.0
2.1
2.1
2.2
2.2
2.3
2.3
-12 -6 0 6 12
Distance from Joint, in.
De
ns
ity
, g
/cm
3
SSD Gmb
CoreLok Gmb
Kuss Gmb

68
FIGURE 45- Y3, DENSITY
Density of Y3
1.9
2.0
2.0
2.1
2.1
2.2
2.2
2.3
2.3
-12 -6 0 6 12
Distance from Joint, in.
De
ns
ity
, g
/cm
3
SSD Gmb
CoreLok Gmb
Kuss Gmb
FIGURE 46- Y4, DENSITY
Density of Y4
1.9
2.0
2.0
2.1
2.1
2.2
2.2
2.3
2.3
-12 -6 0 6 12
Distance from Joint, in.
De
ns
ity
, g
/cm
3
SSD Gmb
CoreLok Gmb
Kuss Gmb

69
FIGURE 47- Y AVERAGE, DENSITY
Density of Y Average
1.9
2.0
2.0
2.1
2.1
2.2
2.2
2.3
2.3
-12 -6 0 6 12
Distance from Joint, in.
De
ns
ity
, g
/cm
3
SSD Gmb
CoreLok Gmb
Kuss Gmb
The SSD method produced an average change in density across the joint of 0.204
g/cm3
(a difference of approximately 8.4 percent compaction), the CoreLok method had a
change of 0.248 g/cm3 (a difference of approximately 10.2 percent compaction), and the
Kuss method had a change of 0.093 g/cm3 (a difference of approximately 3.8 percent
compaction). All of the density graphs show a decrease in density at the joint area, and
all graphs except for Figure 46 show the CoreLok method having the most clear
difference in density across the joint. This agrees with the results of the Gregg Street and
Russellville tests; the CoreLok method is the best of the three density test methods for
determining quality of a joint based on visual analysis because it consistently yields the
clearest description of quality.

70
Yellville Samples, Permeability
FIGURE 48- Y1, PERMEABILITY
Permeability of Y1
0
500
1000
1500
2000
2500
3000
-12 -6 0 6 12
Distance from Joint, in.
Perm
eab
ilit
y,
cm
2/s
FIGURE 49- Y2, PERMEABILITY
Permeability of Y2
0
500
1000
1500
2000
2500
3000
-12 -6 0 6 12
Distance from Joint (in.)
Perm
eab
ilit
y,
cm
2/s

71
FIGURE 50- Y3, PERMEABILITY
Permeability of Y3
0
500
1000
1500
2000
2500
3000
-12 -6 0 6 12
Distance from Joint, in.
Perm
eab
ilit
y,
cm
2/s
FIGURE 51- Y AVERAGE, PERMEABILITY
Permeability of Y Average
0
500
1000
1500
2000
2500
3000
-12 -6 0 6 12
Distance from Joint, in.
Perm
eab
ilit
y,
cm
2/s
Figures 48-51 consistently show an increase in permeability at the joint; however,
the results fall within a very large range. In addition, samples cannot be analyzed when
cores are broken. Therefore, the permeability test is not recommended as a standard
testing procedure for joint quality.

72
Yellville Samples, Oven Derived AC %
None of the samples were able to be analyzed due to broken cores. For this
reason and the lack of any pattern or consistency of results in the Gregg Street and
Russellville results, this testing method is not recommended as a quality control standard
testing procedure.
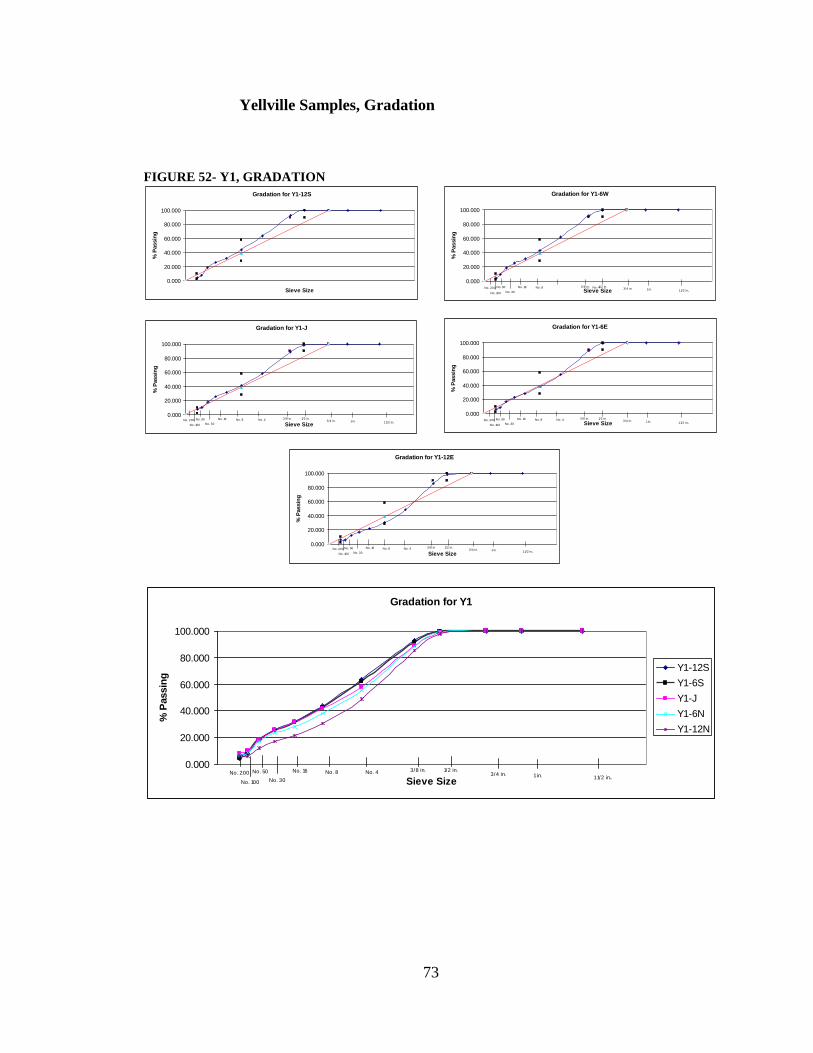
73
Yellville Samples, Gradation
FIGURE 52- Y1, GRADATION
Gradation for Y1
0.000
20.000
40.000
60.000
80.000
100.000
Sieve Size
% P
assin
g
Y1-12S
Y1-6S
Y1-J
Y1-6N
Y1-12N
No. 501 in.3/4 in.
1/2 in.3/8 in.No. 4No. 8No. 16
No. 30No. 100
No. 2001 1/2 in.
Gradation for Y1-12S
0.000
20.000
40.000
60.000
80.000
100.000
Sieve Size
% P
assin
g
Gradation for Y1-6W
0.000
20.000
40.000
60.000
80.000
100.000
Sieve Size
% P
assin
g
No. 501 in.3/4 in.
1/2 in.3/8 in. No. 4No. 8No. 16
No. 30No. 100
No. 2001 1/2 in.
Gradation for Y1-J
0.000
20.000
40.000
60.000
80.000
100.000
Sieve Size
% P
assin
g
No. 501 in.3/4 in.
1/2 in.3/8 in.No. 4No. 8No. 16
No. 30No. 100
No. 2001 1/2 in.
Gradation for Y1-6E
0.000
20.000
40.000
60.000
80.000
100.000
Sieve Size
% P
assin
g
No. 501 in.3/4 in.
1/2 in.3/8 in.No. 4No. 8No. 16
No. 30No. 100
No. 2001 1/2 in.
Gradation for Y1-12E
0.000
20.000
40.000
60.000
80.000
100.000
Sieve Size
% P
assin
g
No. 501 in.3/4 in.
1/2 in.3/8 in.No. 4No. 8No. 16
No. 30No. 100
No. 2001 1/2 in.
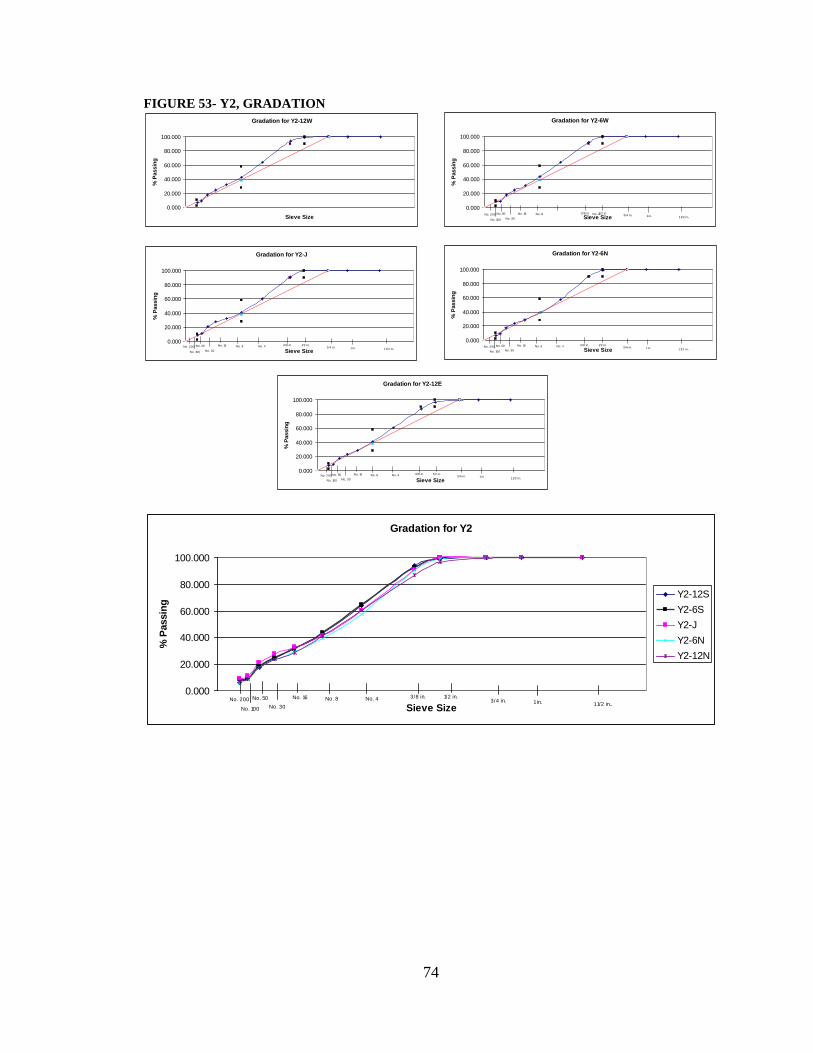
74
FIGURE 53- Y2, GRADATION
Gradation for Y2
0.000
20.000
40.000
60.000
80.000
100.000
Sieve Size
% P
assin
g
Y2-12S
Y2-6S
Y2-J
Y2-6N
Y2-12N
No. 501 in.3/4 in.
1/2 in.3/8 in.No. 4No. 8No. 16
No. 30No. 100
No. 2001 1/2 in.
Gradation for Y2-12W
0.000
20.000
40.000
60.000
80.000
100.000
Sieve Size
% P
assin
g
Gradation for Y2-6W
0.000
20.000
40.000
60.000
80.000
100.000
Sieve Size
% P
assin
g
No. 501 in.3/4 in.
1/2 in.3/8 in. No. 4No. 8No. 16
No. 30No. 100
No. 2001 1/2 in.
Gradation for Y2-J
0.000
20.000
40.000
60.000
80.000
100.000
Sieve Size
% P
assin
g
No. 501 in.3/4 in.
1/2 in.3/8 in.No. 4No. 8No. 16
No. 30No. 100
No. 2001 1/2 in.
Gradation for Y2-6N
0.000
20.000
40.000
60.000
80.000
100.000
Sieve Size
% P
assin
g
No. 501 in.3/4 in.
1/2 in.3/8 in.No. 4No. 8No. 16
No. 30No. 100
No. 2001 1/2 in.
Gradation for Y2-12E
0.000
20.000
40.000
60.000
80.000
100.000
Sieve Size
% P
assin
g
No. 501 in.3/4 in.
1/2 in.3/8 in.No. 4No. 8No. 16
No. 30No. 100
No. 2001 1/2 in.
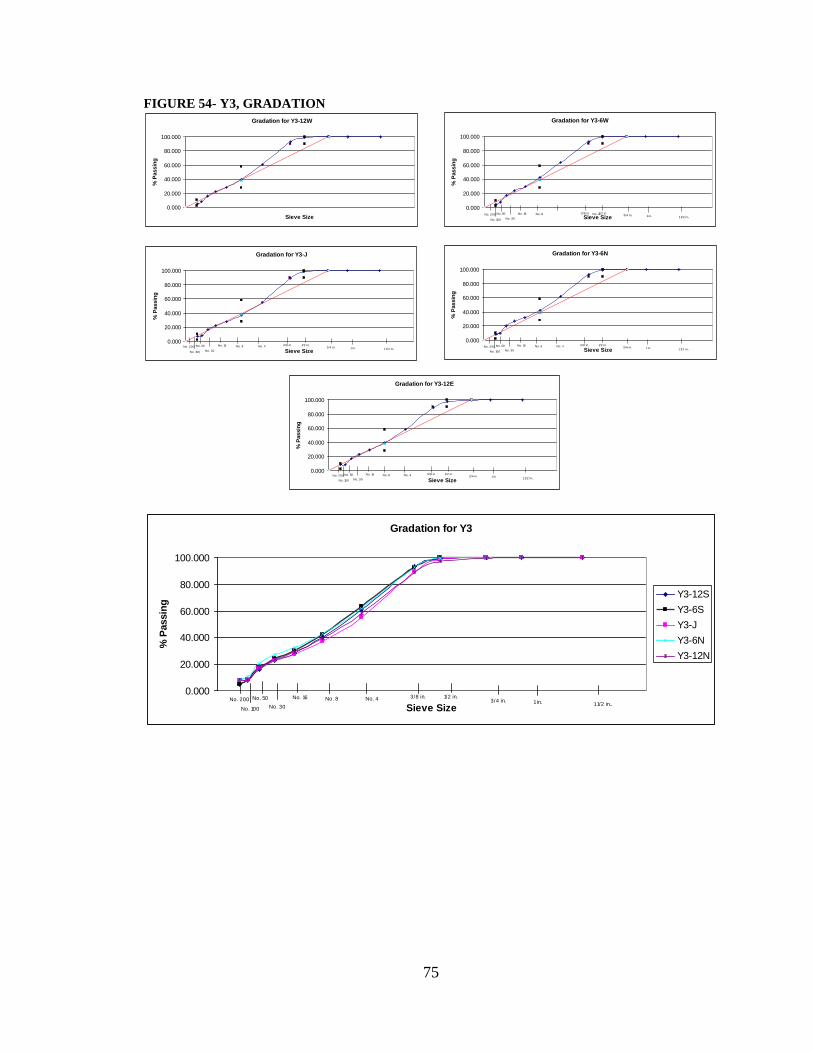
75
FIGURE 54- Y3, GRADATION
Gradation for Y3
0.000
20.000
40.000
60.000
80.000
100.000
Sieve Size
% P
assin
g
Y3-12S
Y3-6S
Y3-J
Y3-6N
Y3-12N
No. 501 in.3/4 in.
1/2 in.3/8 in.No. 4No. 8No. 16
No. 30No. 100
No. 2001 1/2 in.
Gradation for Y3-12W
0.000
20.000
40.000
60.000
80.000
100.000
Sieve Size
% P
assin
g
Gradation for Y3-6W
0.000
20.000
40.000
60.000
80.000
100.000
Sieve Size
% P
assin
g
No. 501 in.3/4 in.
1/2 in.3/8 in. No. 4No. 8No. 16
No. 30No. 100
No. 2001 1/2 in.
Gradation for Y3-J
0.000
20.000
40.000
60.000
80.000
100.000
Sieve Size
% P
assin
g
No. 501 in.3/4 in.
1/2 in.3/8 in.No. 4No. 8No. 16
No. 30No. 100
No. 2001 1/2 in.
Gradation for Y3-6N
0.000
20.000
40.000
60.000
80.000
100.000
Sieve Size
% P
assin
g
No. 501 in.3/4 in.
1/2 in.3/8 in.No. 4No. 8No. 16
No. 30No. 100
No. 2001 1/2 in.
Gradation for Y3-12E
0.000
20.000
40.000
60.000
80.000
100.000
Sieve Size
% P
assin
g
No. 501 in.3/4 in.
1/2 in.3/8 in.No. 4No. 8No. 16
No. 30No. 100
No. 2001 1/2 in.
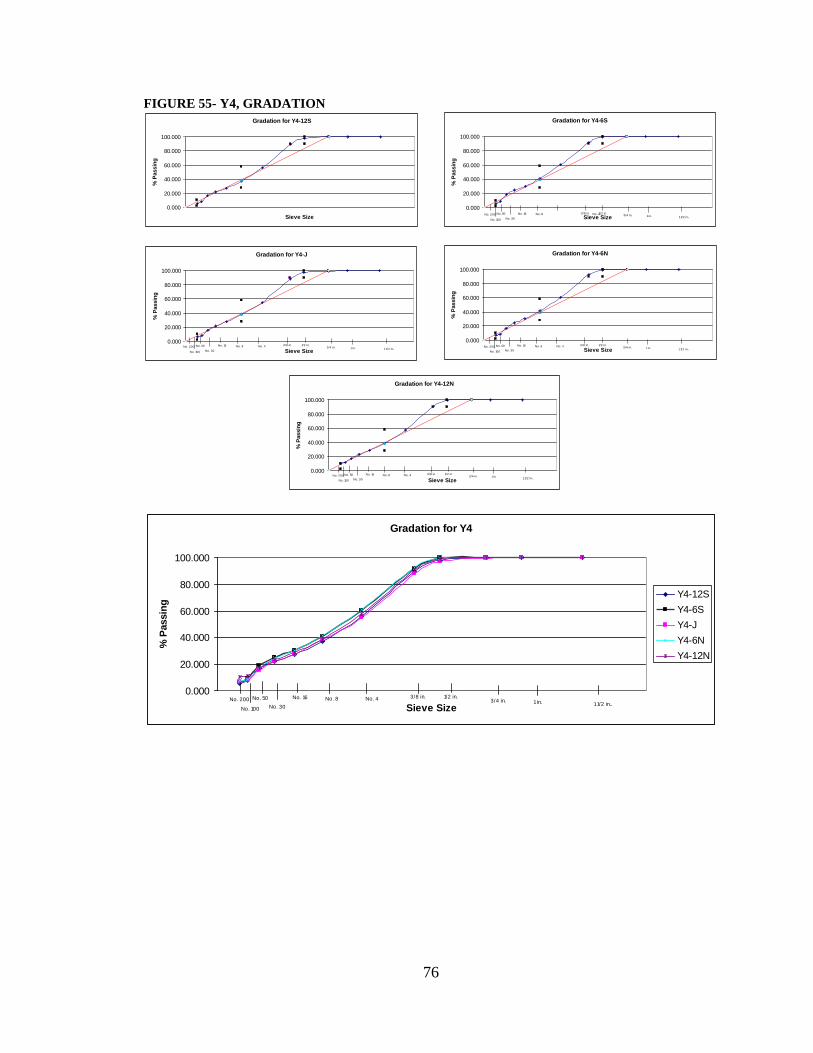
76
FIGURE 55- Y4, GRADATION
Gradation for Y4
0.000
20.000
40.000
60.000
80.000
100.000
Sieve Size
% P
assin
g
Y4-12S
Y4-6S
Y4-J
Y4-6N
Y4-12N
No. 501 in.3/4 in.
1/2 in.3/8 in.No. 4No. 8No. 16
No. 30No. 100
No. 2001 1/2 in.
Gradation for Y4-12S
0.000
20.000
40.000
60.000
80.000
100.000
Sieve Size
% P
assin
g
Gradation for Y4-6S
0.000
20.000
40.000
60.000
80.000
100.000
Sieve Size
% P
assin
g
No. 501 in.3/4 in.
1/2 in.3/8 in. No. 4No. 8No. 16
No. 30No. 100
No. 2001 1/2 in.
Gradation for Y4-J
0.000
20.000
40.000
60.000
80.000
100.000
Sieve Size
% P
assin
g
No. 501 in.3/4 in.
1/2 in.3/8 in.No. 4No. 8No. 16
No. 30No. 100
No. 2001 1/2 in.
Gradation for Y4-6N
0.000
20.000
40.000
60.000
80.000
100.000
Sieve Size
% P
assin
g
No. 501 in.3/4 in.
1/2 in.3/8 in.No. 4No. 8No. 16
No. 30No. 100
No. 2001 1/2 in.
Gradation for Y4-12N
0.000
20.000
40.000
60.000
80.000
100.000
Sieve Size
% P
assin
g
No. 501 in.3/4 in.
1/2 in.3/8 in.No. 4No. 8No. 16
No. 30No. 100
No. 2001 1/2 in.
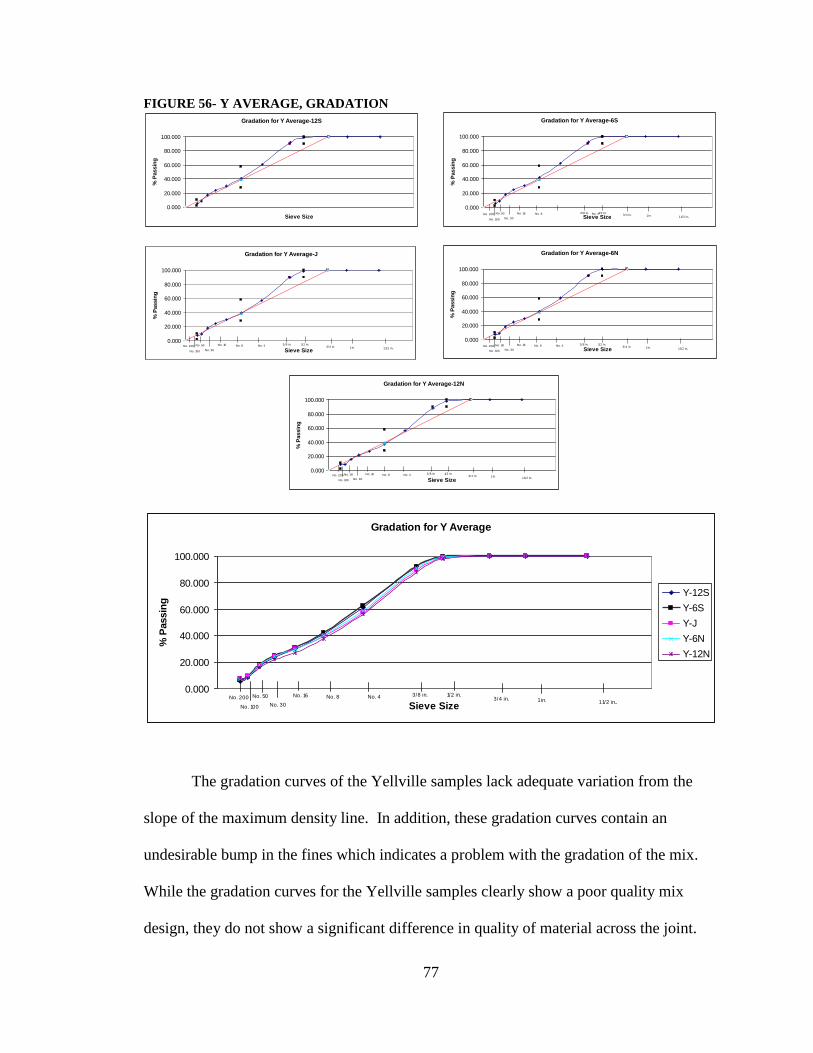
77
FIGURE 56- Y AVERAGE, GRADATION
Gradation for Y Average
0.000
20.000
40.000
60.000
80.000
100.000
Sieve Size
% P
assin
g
Y-12S
Y-6S
Y-J
Y-6N
Y-12N
No. 501 in.3/4 in.
1/2 in.3/8 in.No. 4No. 8No. 16
No. 30No. 100
No. 2001 1/2 in.
The gradation curves of the Yellville samples lack adequate variation from the
slope of the maximum density line. In addition, these gradation curves contain an
undesirable bump in the fines which indicates a problem with the gradation of the mix.
While the gradation curves for the Yellville samples clearly show a poor quality mix
design, they do not show a significant difference in quality of material across the joint.
Gradation for Y Average-12S
0.000
20.000
40.000
60.000
80.000
100.000
Sieve Size
% P
assin
g
Gradation for Y Average-6S
0.000
20.000
40.000
60.000
80.000
100.000
Sieve Size
% P
assin
g
No. 501 in.3/4 in.
1/2 in.3/8 in. No. 4No. 8No. 16
No. 30No. 100
No. 2001 1/2 in.
Gradation for Y Average-J
0.000
20.000
40.000
60.000
80.000
100.000
Sieve Size
% P
assin
g
No. 501 in.3/4 in.
1/2 in.3/8 in.No. 4No. 8No. 16
No. 30No. 100
No. 2001 1/2 in.
Gradation for Y Average-6N
0.000
20.000
40.000
60.000
80.000
100.000
Sieve Size
% P
assin
g
No. 501 in.3/4 in.
1/2 in.3/8 in.No. 4No. 8No. 16
No. 30No. 100
No. 2001 1/2 in.
Gradation for Y Average-12N
0.000
20.000
40.000
60.000
80.000
100.000
Sieve Size
% P
assin
g
No. 501 in.3/4 in.
1/2 in.3/8 in.No. 4No. 8No. 16
No. 30No. 100
No. 2001 1/2 in.

78
The gradation test would be useful as a general quality control test for the roadway as a
whole; however, this test is not recommended as a quality control measure for the joint
due to the lack of discrimination among samples at and away from the joint.
Location Comparison, % Water Absorbed
FIGURE 57- % WATER ABSORBED
% Water Absorbed Location Comparison
0.0
2.0
4.0
6.0
8.0
10.0
12.0
-12 -6 0 6 12
Distance from Joint, in.
Wate
r A
bso
rbed
,%
Gregg
Russellville
Yellville
The percent water absorbed for each site was plotted using the average values of
the unbroken samples. This method accurately reflects the quality of the roadways,
showing Yellville as the worst and Gregg Street as the best. The main disadvantage of
this method is that results cannot be analyzed if any of the samples across the joint are
broken.
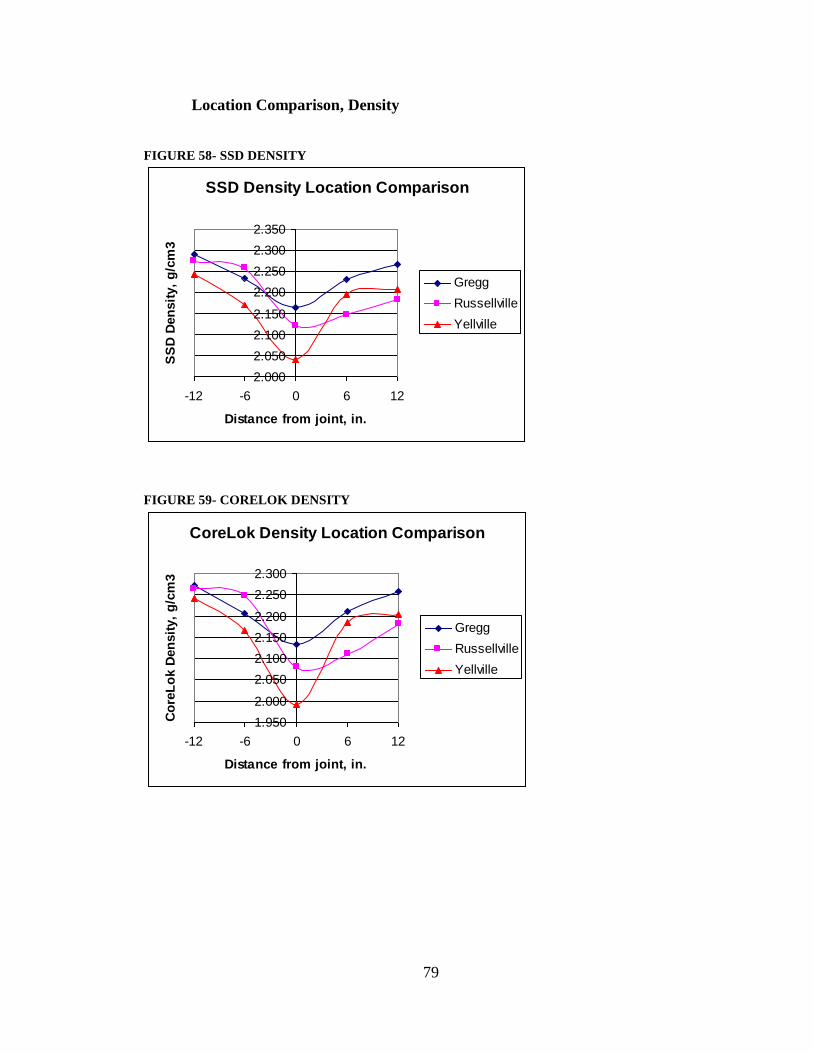
79
Location Comparison, Density
FIGURE 58- SSD DENSITY
SSD Density Location Comparison
2.000
2.050
2.100
2.150
2.200
2.250
2.300
2.350
-12 -6 0 6 12
Distance from joint, in.
SS
D D
en
sit
y,
g/c
m3
Gregg
Russellville
Yellville
FIGURE 59- CORELOK DENSITY
CoreLok Density Location Comparison
1.950
2.000
2.050
2.100
2.150
2.200
2.250
2.300
-12 -6 0 6 12
Distance from joint, in.
Co
reL
ok D
en
sit
y,
g/c
m3
Gregg
Russellville
Yellville
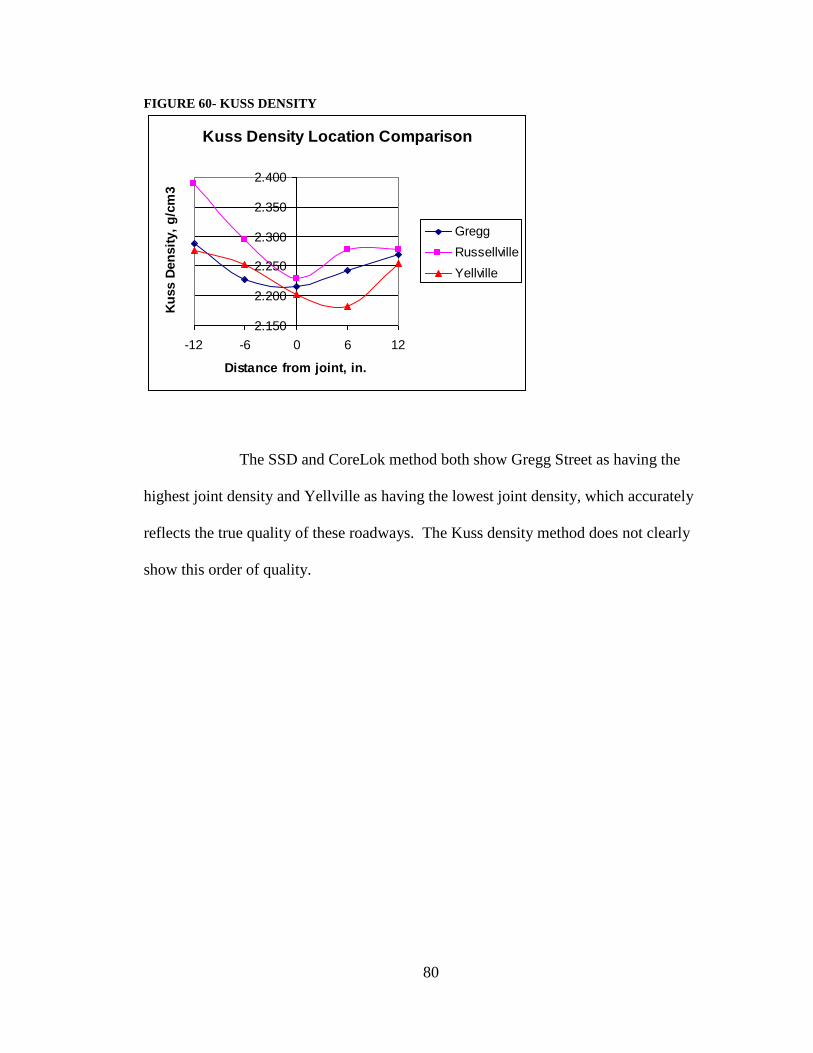
80
FIGURE 60- KUSS DENSITY
Kuss Density Location Comparison
2.150
2.200
2.250
2.300
2.350
2.400
-12 -6 0 6 12
Distance from joint, in.
Ku
ss D
en
sit
y,
g/c
m3
Gregg
Russellville
Yellville
The SSD and CoreLok method both show Gregg Street as having the
highest joint density and Yellville as having the lowest joint density, which accurately
reflects the true quality of these roadways. The Kuss density method does not clearly
show this order of quality.
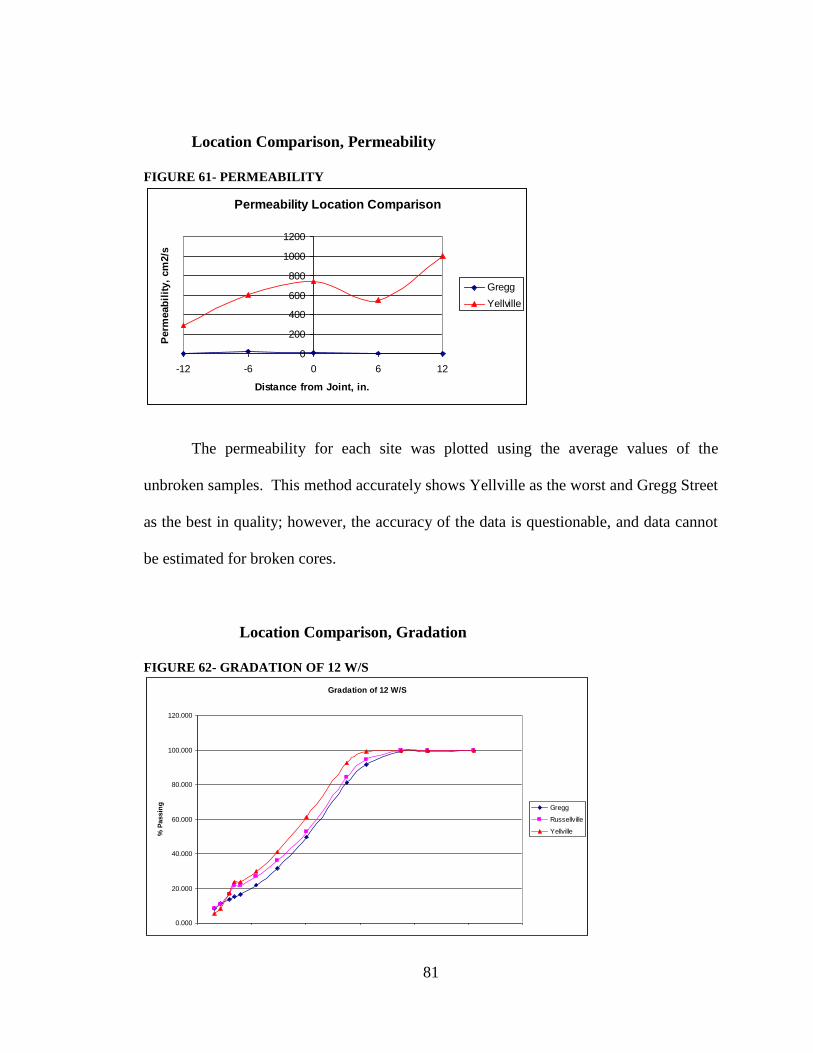
81
Location Comparison, Permeability
FIGURE 61- PERMEABILITY
Permeability Location Comparison
0
200
400
600
800
1000
1200
-12 -6 0 6 12
Distance from Joint, in.
Perm
eab
ilit
y,
cm
2/s
Gregg
Yellville
The permeability for each site was plotted using the average values of the
unbroken samples. This method accurately shows Yellville as the worst and Gregg Street
as the best in quality; however, the accuracy of the data is questionable, and data cannot
be estimated for broken cores.
Location Comparison, Gradation
FIGURE 62- GRADATION OF 12 W/S
Gradation of 12 W/S
0.000
20.000
40.000
60.000
80.000
100.000
120.000
% P
assin
g
Gregg
Russellville
Yellville

82
FIGURE 63- GRADATION OF 6 W/S
Gradation of 6 W/S
0.000
20.000
40.000
60.000
80.000
100.000
120.000%
Passin
g
Gregg
Russellville
Yellville
FIGURE 64- GRADATION OF J
Gradation of Joints
0.000
20.000
40.000
60.000
80.000
100.000
120.000
% P
assin
g
Gregg
Russellville
Yellville

83
FIGURE 65- GRADATION OF 6 E/N
Gradation of 6 E/N
0.000
20.000
40.000
60.000
80.000
100.000
120.000%
Passin
g
Gregg
Russellville
Yellville
FIGURE 66- GRADATION OF 12 E/N
Gradation of 12 E/N
0.000
20.000
40.000
60.000
80.000
100.000
120.000
% P
as
sin
g
Gregg
Russellville
Yellville
The gradation curve does not show noticeable change across the joint of any of
the locations; however, each of Figures 62-66 show Yellville highest and Gregg lowest
across the sieve sizes in terms of percent passing. However, this reflects more on the

84
quality of the roadway as a whole than it does on the difference in quality across the
roadway.
ANOVA Statistical Analysis
Based on the visual analyses, density is clearly the most reliable method of
determining the quality of longitudinal joints. Upon inspection of the graphs created
using the data from the density tests, it appears that the CoreLok method will be best;
however, the density test method yielding the most statistically significant results across
the joint should be the choice method. Therefore, an ANOVA statistical analysis was
performed, and the results are listed below.
Kuss Method
Single Factor Analysis of Gregg Street
TABLE 32- KUSS DENSITY DATA FOR GREGG STREET
12W 6W J 6E 12E
G1 2.281 2.224 2.218 2.267 2.272
G2 2.268 2.219 2.204 2.195 2.231
G3 2.299 2.245 2.219 2.265 2.284
G4 2.299 2.218 2.218 2.244 2.287
TABLE 33- SUMMARY OF KUSS CALCULATIONS FOR GREGG STREET
Groups Count Sum Average Variance
12W Column 4 9.147 2.28675 0.000228
6W Column 4 8.906 2.2265 0.000159
J Column 4 8.859 2.21475 5.16E-05
6E Column 4 8.971 2.24275 0.001122
12E Column 4 9.074 2.2685 0.000667

85
TABLE 34- RESULTS OF KUSS SINGLE FACTOR ANALYSIS OF GREGG STREET
Source of Variation SS df MS F P-value F crit
Between Locations Across Joint 0.0140683 4 0.003517 7.894964 0.00124 3.055568 Within Location From Joint 0.00668225 15 0.000445
Total 0.02075055 19
Gregg distance is significant because P-value<.05 and F>Fcrit
Single Factor Analysis of Russellville
TABLE 35- KUSS DENSITY DATA FOR RUSSELLVILLE
12W 6W J 6E 12E
R1 2.617 2.289 2.270 2.287 2.263
R2 2.298 2.289 2.322 2.289 2.273
R3 2.297 2.290 2.181 2.268 2.271
R4 2.339 2.312 2.143 2.263 2.303
*bold values indicate estimated value for broken sample
TABLE 36- SUMMARY OF KUSS CALCULATIONS FOR RUSSELLVILLE
Groups Count Sum Average Variance
12W Column 4 9.551 2.38775 0.023741
6W Column 4 9.18 2.295 0.000129
J Column 4 8.915 2.228993 0.006646
6E Column 4 9.107 2.27675 0.000174
12E Column 4 9.11 2.2775 0.000308
TABLE 37- RESULTS OF KUSS SINGLE FACTOR ANALYSIS OF RUSSELLVILLE
Source of Variation SS df MS F P-value F crit
Between Locations Across Joint 0.054330404 4 0.013583 2.190987 0.119445 3.055568 Within Location From Joint 0.092989621 15 0.006199
Total 0.147320025 19
Russellville distance is NOT significant because P-value>.05 and F<Fcrit

86
Single Factor Analysis of Yellville
TABLE 38- KUSS DENSITY DATA FOR YELLVILLE
12S 6S J 6N 12N
Y1 2.265 2.241 2.253 2.243 2.231
Y2 2.292 2.289 2.232 2.256 2.250
Y3 2.265 2.234 2.257 1.950 2.269
Y4 2.279 2.246 2.063 2.279 2.266
*bold values indicate estimated value for broken sample
TABLE 39-SUMMARY OF KUSS CALCULATIONS FOR YELLVILLE
Groups Count Sum Average Variance
12S Column 4 9.101 2.2752 0.000168
6S Column 4 9.01 2.2525 0.000616
J Column 4 8.804 2.2012 0.00863
6E Column 4 8.728 2.182 0.024143
12E Column 4 9.016 2.254 0.000305
TABLE 40- RESULTS OF KUSS SINGLE FACTOR ANALYSIS OF YELLVILLE
Source of Variation SS df MS F P-value F crit
Between Locations Across Joint 0.024872089 4 0.006218 0.918118 0.478918 3.055568 Within Location From Joint 0.101588604 15 0.006773
Total 0.126460693 19
Yellville distance is NOT significant because P-value>.05

87
Two Factor Without Replacement Analysis
TABLE 41- KUSS DENSITY DATA FOR ALL LOCATIONS
Site Kuss Gmb
12W/S 6W/S J 6W/S 12W/S
G1 1 2.281 2.224 2.218 2.267 2.272
G2 1 2.268 2.219 2.204 2.195 2.231
G3 1 2.299 2.245 2.219 2.265 2.284
G4 1 2.299 2.218 2.218 2.244 2.287
R1 2 2.617 2.289 2.270 2.287 2.263
R2 2 2.298 2.289 2.322 2.289 2.273
R3 2 2.297 2.290 2.181 2.268 2.271
R4 2 2.339 2.312 2.143 2.263 2.303
Y1 3 2.265 2.241 2.253 2.243 2.231
Y2 3 2.292 2.289 2.232 2.256 2.250
Y3 3 2.265 2.234 2.257 1.950 2.269
Y4 3 2.279 2.246 2.063 2.279 2.266
*bold values indicate estimated value for broken sample
TABLE 42- SUMMARY OF KUSS CALCULATIONS FOR ALL LOCATIONS
SUMMARY Count Sum Average Variance
G1 5 11.262 2.2524 0.000851
G2 5 11.117 2.2234 0.000812
G3 5 11.312 2.2624 0.001
G4 5 11.266 2.2532 0.001451
R1 5 11.726 2.3452 0.023208
R2 5 11.47069 2.294138 0.000318
R3 5 11.30716 2.261432 0.002165
R4 5 11.36012 2.272024 0.005935
Y1 5 11.233 2.2466 0.000167
Y2 5 11.319 2.2638 0.000673
Y3 5 10.975 2.195 0.018942
Y4 5 11.13283 2.226567 0.00856
12W/S 12 27.799 2.316583 0.00937
6W/S 12 27.096 2.258 0.001116
J 12 26.5798 2.214984 0.004321
6E/N 12 26.806 2.233833 0.008613
12E/N 12 27.2 2.266667 0.000451
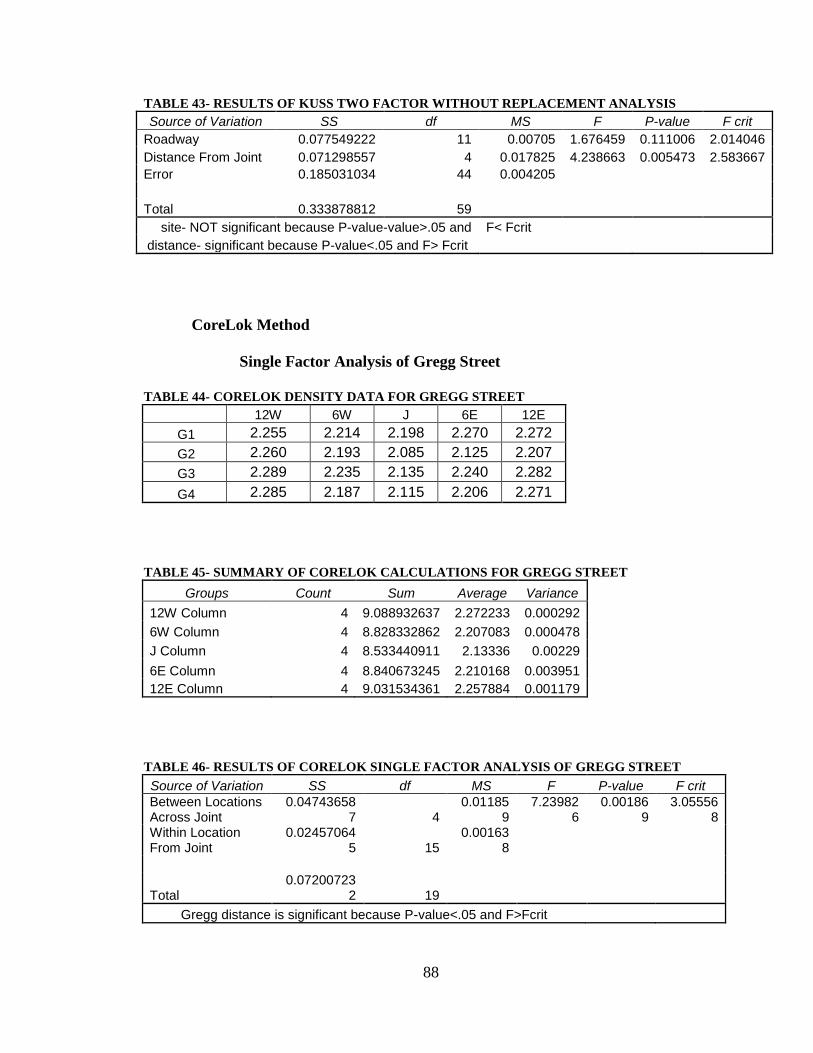
88
TABLE 43- RESULTS OF KUSS TWO FACTOR WITHOUT REPLACEMENT ANALYSIS
Source of Variation SS df MS F P-value F crit
Roadway 0.077549222 11 0.00705 1.676459 0.111006 2.014046
Distance From Joint 0.071298557 4 0.017825 4.238663 0.005473 2.583667
Error 0.185031034 44 0.004205
Total 0.333878812 59
site- NOT significant because P-value-value>.05 and F< Fcrit
distance- significant because P-value<.05 and F> Fcrit
CoreLok Method
Single Factor Analysis of Gregg Street
TABLE 44- CORELOK DENSITY DATA FOR GREGG STREET
12W 6W J 6E 12E
G1 2.255 2.214 2.198 2.270 2.272
G2 2.260 2.193 2.085 2.125 2.207
G3 2.289 2.235 2.135 2.240 2.282
G4 2.285 2.187 2.115 2.206 2.271
TABLE 45- SUMMARY OF CORELOK CALCULATIONS FOR GREGG STREET
Groups Count Sum Average Variance
12W Column 4 9.088932637 2.272233 0.000292
6W Column 4 8.828332862 2.207083 0.000478
J Column 4 8.533440911 2.13336 0.00229
6E Column 4 8.840673245 2.210168 0.003951
12E Column 4 9.031534361 2.257884 0.001179
TABLE 46- RESULTS OF CORELOK SINGLE FACTOR ANALYSIS OF GREGG STREET
Source of Variation SS df MS F P-value F crit
Between Locations Across Joint
0.047436587 4
0.011859
7.239826
0.001869
3.055568
Within Location From Joint
0.024570645 15
0.001638
Total 0.07200723
2 19
Gregg distance is significant because P-value<.05 and F>Fcrit
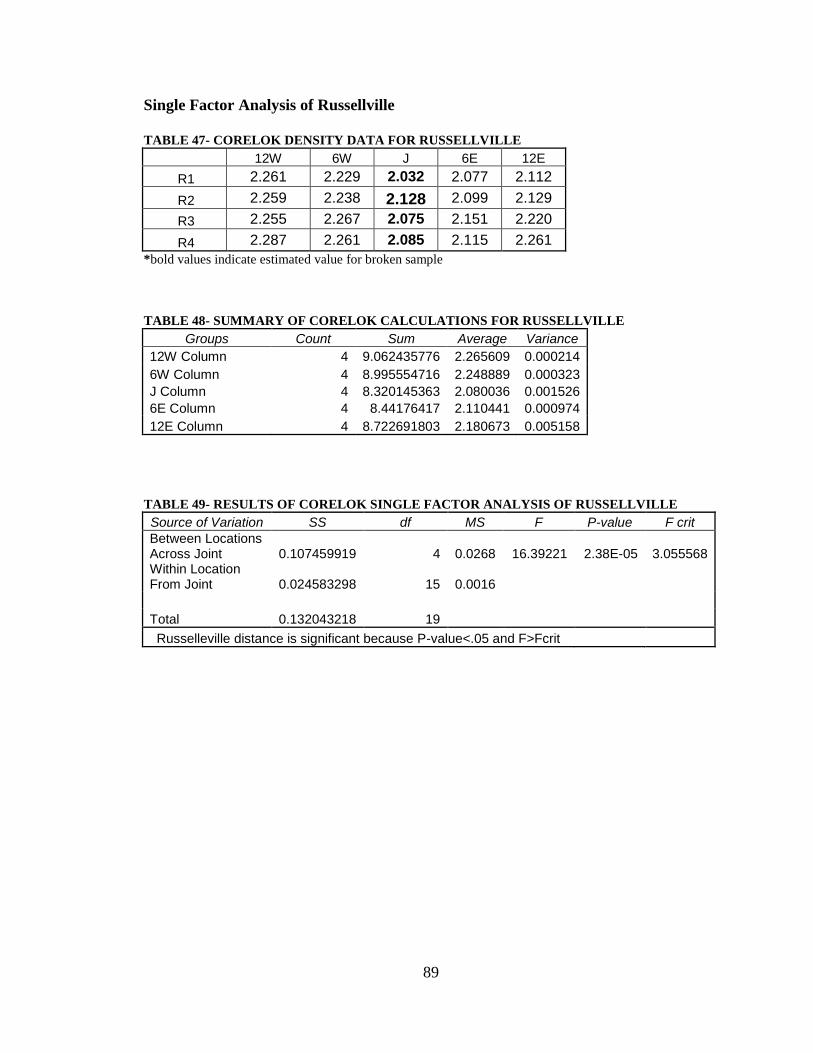
89
Single Factor Analysis of Russellville
TABLE 47- CORELOK DENSITY DATA FOR RUSSELLVILLE
12W 6W J 6E 12E
R1 2.261 2.229 2.032 2.077 2.112
R2 2.259 2.238 2.128 2.099 2.129
R3 2.255 2.267 2.075 2.151 2.220
R4 2.287 2.261 2.085 2.115 2.261
*bold values indicate estimated value for broken sample
TABLE 48- SUMMARY OF CORELOK CALCULATIONS FOR RUSSELLVILLE
Groups Count Sum Average Variance
12W Column 4 9.062435776 2.265609 0.000214
6W Column 4 8.995554716 2.248889 0.000323
J Column 4 8.320145363 2.080036 0.001526
6E Column 4 8.44176417 2.110441 0.000974
12E Column 4 8.722691803 2.180673 0.005158
TABLE 49- RESULTS OF CORELOK SINGLE FACTOR ANALYSIS OF RUSSELLVILLE
Source of Variation SS df MS F P-value F crit
Between Locations Across Joint 0.107459919 4 0.0268 16.39221 2.38E-05 3.055568 Within Location From Joint 0.024583298 15 0.0016
Total 0.132043218 19
Russelleville distance is significant because P-value<.05 and F>Fcrit

90
Single Factor Analysis of Yellville
TABLE 50- CORELOK DENSITY DATA FOR YELLVILLE
12S 6S J 6N 12N
Y1 2.229 2.133 1.909 2.114 2.147
Y2 2.264 2.216 1.984 2.194 2.210
Y3 2.230 2.166 1.989 2.209 2.226
Y4 2.242 2.146 2.091 2.221 2.233
TABLE 51- SUMMARY OF CORELOK CALCULATIONS FOR YELLVILLE
Groups Count Sum Average Variance
12S Column 4 8.964613523 2.241153 0.000266
6S Column 4 8.661138398 2.165285 0.001337
J Column 4 7.971763699 1.992941 0.005612
6N Column 4 8.737385175 2.184346 0.002329
12N Column 4 8.815279706 2.20382 0.001524
TABLE 52- RESULTS OF CORELOK SINGLE FACTOR ANALYSIS OF YELLVILLE
Source of Variation SS df MS F P-value F crit
Between Locations Across Joint 0.148017744 4 0.037004 16.71732
2.11E-05 3.055568
Within Location From Joint 0.033203086 15 0.002214
Total 0.18122083 19
Yellville distance is significant because P-value<.05 and F>Fcrit

91
Two Factor Without Replacement Analysis
TABLE 53- CORELOK DENSITY DATA FOR ALL LOCATIONS
Site CoreLok Gmb
12W/S 6W/S J 6E/N 12E/N
G1 1 2.255 2.214 2.198 2.270 2.272
G2 1 2.260 2.193 2.085 2.125 2.207
G3 1 2.289 2.235 2.135 2.240 2.282
G4 1 2.285 2.187 2.115 2.206 2.271
R1 2 2.261 2.229 2.032 2.077 2.112
R2 2 2.259 2.238 2.128 2.099 2.129
R3 2 2.255 2.267 2.075 2.151 2.220
R4 2 2.287 2.261 2.085 2.115 2.261
Y1 3 2.229 2.133 1.909 2.114 2.147
Y2 3 2.264 2.216 1.984 2.194 2.210
Y3 3 2.230 2.166 1.989 2.209 2.226
Y4 3 2.242 2.146 2.091 2.221 2.233
*bold values indicate estimated value for broken sample
TABLE 54- SUMMARY OF CORELOK CALCULATIONS FOR ALL LOCATIONS
SUMMARY Count Sum Average Variance
G1 5 11.21018 2.242036 0.00114
G2 5 10.86958 2.173917 0.004812
G3 5 11.18001 2.236001 0.003787
G4 5 11.06314 2.212628 0.004687
R1 5 10.71234 2.142469 0.009747
R2 5 10.8531 2.170621 0.005294
R3 5 10.9678 2.19356 0.006392
R4 5 11.00935 2.20187 0.008921
Y1 5 10.53131 2.106263 0.014131
Y2 5 10.86712 2.173424 0.011937
Y3 5 10.8192 2.163841 0.01024
Y4 5 10.93254 2.186509 0.004297
12W/S 12 27.11598 2.259665 0.000405
6W/S 12 26.48503 2.207085 0.001854
J 12 24.82535 2.068779 0.006225
6E/N 12 26.01982 2.168319 0.003927
12E/N 12 26.56951 2.214125 0.003286

92
TABLE 55- RESULTS OF CORELOK TWO FACTOR WITHOUT REPLACEMENT ANALYSIS
Source of Variation SS df MS F P-value F crit
Roadway 0.079369018 11 0.007215 3.402772 0.001797 2.014046
Distance From Joint 0.248239557 4 0.06206 29.26749 6.79E-12 2.583667
Error 0.093299258 44 0.00212
Total 0.420907834 59
site- significant because P-value<.05 and F> Fcrit
distance- very significant because P-value<.05 and F> Fcrit
SSD Method
Single Factor Analysis of Gregg Street
TABLE 56- SSD DENSITY DATA FOR GREGG STREET
12W 6W J 6E 12E
G1 2.303 2.242 2.210 2.273 2.284
G2 2.264 2.210 2.134 2.175 2.218
G3 2.299 2.258 2.152 2.257 2.280
G4 2.294 2.228 2.152 2.221 2.288
TABLE 57- SUMMARY OF SSD CALCULATIONS FOR GREGG STREET
Groups Count Sum Average Variance
12W Column 4 9.159844026 2.289961 0.000307
6W Column 4 8.937912591 2.234478 0.000418
J Column 4 8.648018967 2.162005 0.001098
6E Column 4 8.925249442 2.231312 0.001889
12E Column 4 9.069827027 2.267457 0.001112
TABLE 58- RESULTS OF SSD SINGLE FACTOR ANALYSIS OF GREGG STREET
Source of Variation SS df MS F P-value F crit
Between Locations Across Joint
0.037581884 4
0.009395
9.738869
0.000434
3.055568
Within Location From Joint
0.014471092 15
0.000965
Total 0.05205297
6 19
Gregg distance is significant because P-value<.05 and F>Fcrit

93
Single Factor Analysis of Russellville
TABLE 59- SSD DENSITY DATA FOR RUSSELLVILLE
12W 6W J 6E 12E
R1 2.264 2.235 2.091 2.120 2.128
R2 2.267 2.245 2.160 2.131 2.165
R3 2.267 2.271 2.130 2.173 2.233
R4 2.303 2.279 2.099 2.163 2.204
*bold values indicate estimated value for broken sample
TABLE 60-SUMMARY OF SSD CALCULATIONS FOR RUSSELLVILLE
Groups Count Sum Average Variance
12W Column 4 9.101026205 2.275257 0.00034
6W Column 4 9.03017795 2.257544 0.000447
J Column 4 8.479820989 2.119955 0.000997
6E Column 4 8.587701008 2.146925 0.000631
12E Column 4 8.73050144 2.182625 0.002097
TABLE 61- RESULTS OF SSD SINGLE FACTOR ANALYSIS OF RUSSELLVILLE
Source of Variation SS df MS F P-value F crit
Between Locations Across Joint 0.073753107 4 0.0184 20.42725 6.24E-06 3.055568 Within Location From Joint 0.013539469 15 0.000903
Total 0.087292576 19
Russellville distance is significant because P-value<.05 and F>Fcrit

94
Single Factor Analysis of Yellville
TABLE 62- SSD DENSITY DATA FOR YELLVILLE
12S 6S J 6N 12N
Y1 2.240 2.130 2.007 2.123 2.157
Y2 2.262 2.217 2.035 2.222 2.219
Y3 2.229 2.170 2.018 2.216 2.221
Y4 2.246 2.160 2.100 2.221 2.238
*bold values indicate estimated value for broken sample
TABLE 63- SUMMARY OF SSD CALCULATIONS FOR YELLVILLE
Groups Count Sum Average Variance
12S Column 4 8.97680585 2.244201 0.000186
6S Column 4 8.676914611 2.169229 0.001279
J Column 4 8.160352107 2.040088 0.001729
6N Column 4 8.782672037 2.195668 0.002369
12N Column 4 8.834483129 2.208621 0.001282
TABLE 64- RESULTS OF SSD SINGLE FACTOR ANALYSIS OF YELLVILLE
Source of Variation SS df MS F P-value F crit
Between Locations Across Joint 0.098087179 4 0.024522 17.90824 1.4E-05 3.055568 Within Location From Joint 0.020539536 15 0.001369
Total 0.118626715 19
Yellville distance is significant because P-value<.05 and F>Fcrit
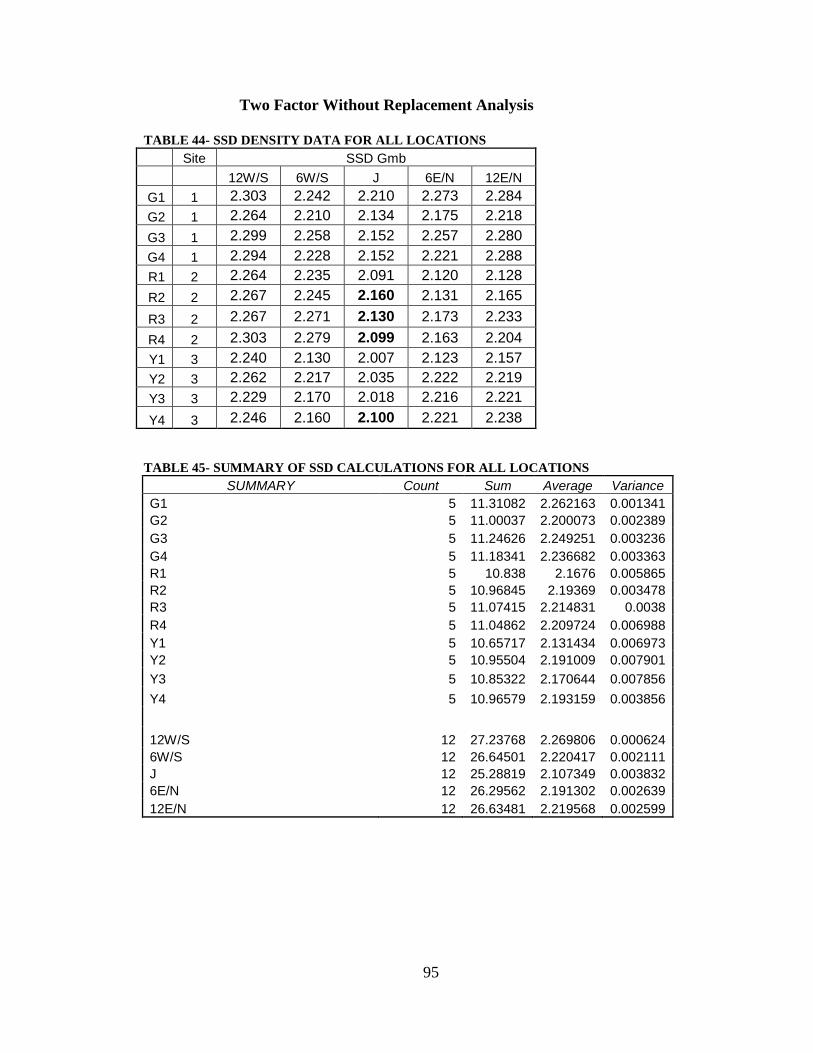
95
Two Factor Without Replacement Analysis
TABLE 44- SSD DENSITY DATA FOR ALL LOCATIONS
Site SSD Gmb
12W/S 6W/S J 6E/N 12E/N
G1 1 2.303 2.242 2.210 2.273 2.284
G2 1 2.264 2.210 2.134 2.175 2.218
G3 1 2.299 2.258 2.152 2.257 2.280
G4 1 2.294 2.228 2.152 2.221 2.288
R1 2 2.264 2.235 2.091 2.120 2.128
R2 2 2.267 2.245 2.160 2.131 2.165
R3 2 2.267 2.271 2.130 2.173 2.233
R4 2 2.303 2.279 2.099 2.163 2.204
Y1 3 2.240 2.130 2.007 2.123 2.157
Y2 3 2.262 2.217 2.035 2.222 2.219
Y3 3 2.229 2.170 2.018 2.216 2.221
Y4 3 2.246 2.160 2.100 2.221 2.238
TABLE 45- SUMMARY OF SSD CALCULATIONS FOR ALL LOCATIONS
SUMMARY Count Sum Average Variance
G1 5 11.31082 2.262163 0.001341
G2 5 11.00037 2.200073 0.002389
G3 5 11.24626 2.249251 0.003236
G4 5 11.18341 2.236682 0.003363
R1 5 10.838 2.1676 0.005865
R2 5 10.96845 2.19369 0.003478
R3 5 11.07415 2.214831 0.0038
R4 5 11.04862 2.209724 0.006988
Y1 5 10.65717 2.131434 0.006973
Y2 5 10.95504 2.191009 0.007901
Y3 5 10.85322 2.170644 0.007856
Y4 5 10.96579 2.193159 0.003856
12W/S 12 27.23768 2.269806 0.000624
6W/S 12 26.64501 2.220417 0.002111
J 12 25.28819 2.107349 0.003832
6E/N 12 26.29562 2.191302 0.002639
12E/N 12 26.63481 2.219568 0.002599

96
TABLE 46- RESULTS OF SSD TWO FACTOR WITHOUT REPLACEMENT ANALYSIS
Source of Variation SS df MS F P-value F crit
Roadway 0.073480855 11 0.00668 5.214154 3.4E-05 2.014046
Distance From Joint 0.171818679 4 0.042955 33.52839 7.68E-
13 2.583667
Error 0.056370299 44 0.001281
Total 0.301669833 59
site- significant because P-value<.05 and F> Fcrit distance- very significant because P-value<.05 and F> Fcrit
Based on the ANOVA analyses of each test method, the SSD method yields the
most statistically significant results; however, this data may be skewed due to the
estimated values for broken cores. The ANOVA analysis of the CoreLok method shows
that this method also yields statistically significant results.

97
Conclusion:
Based on the results of this study, the percent water absorbed, CoreLok, and SSD
methods are recommended as possible laboratory quality control testing procedures for
judging the quality of longitudinal joints. The percent asphalt method shows no clear
indication of roadway quality, and the permeability method often yields results which are
inaccurate and unrepeatable. The gradation method does not provide results which
clearly show changes in quality across the joint. Therefore, these methods are not
recommended.
The percent water absorbed may serve as a good replacement to the permeability
test because it is closely related to permeability and yields more precise and consistent
results. The main disadvantage of this method is the inability to predict values for
samples which are cracked. However, a solution to this problem could be to simply
reject roadways which cannot produce in-tact samples. Further testing is recommended
to investigate the possibility of using this method as a quality control standard.
Out of the three density tests examined, the CoreLok method showed the greatest
visual differentiation between various levels of quality of the roadways. Also, as
mentioned in the literature review, the CoreLok method may be more accurate for highly
absorptive samples. However, the SSD method is more economical to conduct.
Furthermore, the SSD method showed the most statistically significant results based on
the ANOVA calculations. Since some density values were estimated, the results of the
ANOVA analysis may be skewed. Further testing is recommended for the CoreLok and
SSD methods to determine which of these two density testing methods is more
appropriate to use as a quality control standard.

98
Works Cited:
1. Kandhal, Prithvi S., et al. “Evaluation of Longitudinal Joint Construction
Techniques for Asphalt Pavements (Michigan and Wisconsin Projects- Interim
Report)” NCAT Report 94-1, National Center for Asphalt Technology, January
1994
2. Kandhal, Prithvi S., et al. “A Study of Longitudinal Joint Construction
Techniques in HMA Pavements (Interim Report- Colorado Project)” NCAT
Report 96-03, Auburn University, February 1996.
3. Kandhal, Prithvi S., et al. “Longitudinal Joint Construction Techniques for
Asphalt Pavement” NCAT Report 97-04, National Center for Asphalt
Technology, August 1997
4. Toepel, A. “Evaluation of Techniques for Asphaltic Pavement Longitudinal Joint
Construction- Final Report” Wisconsin Department of Transportation, Madison,
WI. November 2003.
5. Kandhal, Prithvi S., et al, “Evaluation of Various Longitudinal Joint Construction
Techniques for Asphalt Airfield Pavements” Worcester Polytechnic Institute,
Worchester, MA. Presented for 2007 FAA Worldwide Airport Technology
Transfer Conference, Atlantic City, NJ. April 2007.
6. Estakhri, Cindy K., et al. “Density Evaluation of the Longitudinal Construction
Joint of Hot-Mix Asphalt Pavements” FHWA/TX-01/1757-1, April 2001, Texas
Transportation Institute, Texas A&M, College Station, TX.
7. Bertram, Timothy D. “Memorandum: Longitudinal Joints in HMA” April 9, 1999
8. Brown, E. Ray, et al. “Density of Asphalt Concrete- How Much Is Needed?”
Presented at 69th
Annual Meeting of Transportation Research Board, Washington
D.C., January 1990, NCAT Report No. 90-3
9. Bognacki, Casimir J. “Constructing Longitudinal Joints with Lower Voids” The
Port Authority of New York and New Jersey, from Transportation Research
Circular, Number E-C105
10. Brown, E. Ray. “Basics of Longitudinal Joint Compaction” National Center for
Asphalt Technology, September 2006. From Transportation Research Circular,
Number E-C105 “Factors Affecting Compaction of Asphalt Pavements”
11. Brown, E. Ray, et al. “Relationship of Air Voids, Lift Thickness, and
Permeability in Hot Mix Asphalt Pavement” NCHRP Report 531. Auburn, AL.
2004

99
12. Asphalt Technology News, Auburn University. Volume 16, #1. Spring 2004
13. Cooley, L. Allen, et al. “Development of Critical Field Permeability and
Pavement Density Values for Coarse-Graded Superpave Pavements” NCAT
Report 01-03, September 2001, Auburn University, AL.

100

Appendix A
UNIVERSITY OF ARKANSAS
DEPARTMENT OF CIVIL ENGINEERING
MATERIALS LABORATORY
BULK SPECIFIC GRAVITY AND % AIR VOIDS OF COMPACTED BITUMINOUS
MIXTURES USING SSD SPECIMENS (AASHTO T-166, T-269)
Job Name: TRC 0801 Date: 4/1/2008
Material: Tested By: Annette
Source: Station 1
Sample
NumberG1-12W G1-6W G1-J G1-6E G1-12E
Dry Weight
in Air, gm
(A)
1840.4 1756.5 2048.0 2319.7 2171.7
Submerged
Weight, gm
(C)
1051.0 985.4 1139.7 1311.5 1235.8
SSD
Weight, gm
(B)
1850.3 1769.0 2066.4 2332.2 2186.6
Bulk Specific
Gravity, Gmb
(D)=A/(B-C)
2.303 2.242 2.210 2.273 2.284
Percent Water Absorbed
by Volume
(E)=(B-A)/(B-C) * 100
1.2 1.6 2.0 1.2 1.6
Note: if Percent Water Absorbed > 2%, Determine Gmb using AASHTO T-275
Gregg Street
101

UNIVERSITY OF ARKANSAS
DEPARTMENT OF CIVIL ENGINEERING
ASPHALT LABORATORY
BULK SPECIFIC GRAVITY BY THE CORELOK METHOD
Project: Date:
Source: Tested By:
Sample
NumberG1-12W G1-6W G1-J G1-6E G1-12E
Wt. of Dry Core in Air before
testing, g
(A)
1840.4 1756.5 2048.0 2319.7 2171.7
Wt. of Sealed Core in Air, g
(B)1891.8 1807.7 2099.2 2370.8 2222.7
Wt of Sealed Core in Water, g
(C )1011.4 950.5 1102.4 1283.7 1202.0
Wt. of Dry Core in Air after testing,
g
(D)
1840.4 1756.3 2047.4 2319.5 2171.4
Bag Weight
E = (B - A)51.4 51.2 51.2 51.1 51.0
Bag Ratio
F = A / E35.805 34.307 40.000 45.395 42.582
Large Bag Volume Correction
(-0.00166*F+0.8596)
(G)
0.800 0.803 0.793 0.784 0.789
Total Volume
H = (E + D) - C880.4 857.0 996.2 1086.9 1020.4
Bag Volume
I = E / G64.2 63.8 64.5 65.2 64.6
Sample Volume
J = H - I816.2 793.2 931.7 1021.7 955.8
Bulk Specific Gravity (G mb )
K = A / J2.255 2.214 2.198 2.270 2.272
Check: % wt. change
(must be -0.08% to +0.04%)0.00% 0.01% 0.03% 0.01% 0.01%
TRC 0801 4/1/2008
Gregg Street - Station 1 Annette
102

UNIVERSITY OF ARKANSAS
DEPARTMENT OF CIVIL ENGINEERING
ASPHALT LAB
Job Name: Date:
Material: Tested By:
Source:
Sample
NumberG1-12W G1-6W G1-J G1-6E G1-12E
Dry Weight
in Air, gm 1840.4 1756.3 2047.4 2319.5 2171.4
Sample
Volume, cc806 789 923 1023 955
Bulk Specific
Gravity, Gmb2.281 2.224 2.218 2.267 2.272
KUSS Gmb
4/1/2008
Annette
TRC 0801
Gregg Street
Station 1
103

UNIVERSITY OF ARKANSAS
DEPARTMENT OF CIVIL ENGINEERING
ASPHALT LABORATORY
LABORATORY PERMEABILITY BY THE KAROL-WARNER METHOD
Project: Date:
Source: Tested By:
Sample
NumberG1-12W G1-6W G1-J G1-6E G1-12E
Standpipe inside dia., cm 3.175 3.175 3.175 3.175 3.175
Standpipe area, cm2 7.917304 7.917304 7.917304 7.917304 7.917304
Specimen height, mm 46.38 49.01 53.03 58.25 55.88
Specimen height, mm 50.06 44.51 53.08 59.39 55.12
Specimen height, mm 46.67 44.17 54.22 59.70 55.13
Specimen height, mm 52.06 49.30 55.66 59.07 55.27
Average specimen height, cm 4.879 4.675 5.400 5.910 5.535
Specimen diameter, mm 151.15 151.47 152.26 151.64 151.65
Specimen diameter, mm 151.02 152.07 151.41 151.75 152.13
Specimen diameter, mm 150.80 151.22 152.34 151.02 151.80
Specimen diameter, mm 150.72 151.78 151.92 151.28 151.46
Average specimen diameter, cm 15.092 15.164 15.198 15.142 15.176
Specimen Area, cm2 178.895 180.588 181.417 180.082 180.886
Time, initial (min.) 0.0 0.0 0.0 0.0 0.0
Ht. @ Time, initial 59.6 62.5 63.5 62.1 61.4
Time, final (min.) 15.0 18.0 15.0 15.0 16.0
Ht @ Time, final 51.7 52.9 45.7 62.1 61.4
Permeability 1 (k x 10-5
) 2.66 2.49 6.70 0.00 0.00
Time, initial (min.) 15.0 18.0 15.0 15.0 16.0
Ht. @ Time, initial 51.7 52.9 45.7 62.1 61.4
Time, final (min.) 30.0 30.0 30.0 30.0 30.0
Ht @ Time, final 44.6 47.1 30.4 62.1 61.4
Permeability 2 (k x 10-5
) 2.67 2.52 7.50 0.00 0.00
Average Permeability (k x 10-5
) 2.67 2.50 7.10 0.00 0.00
Water Temp, F 68.0 66.0 69.0 66.0 66.0
Water Temp, C 20.0 18.9 20.6 18.9 18.9
RT Factor 1.0000 1.0276 0.9856 1.0276 1.0276
PERMEABILITY (k x 10-5) 2.67 2.57 6.99 0.00 0.00
REP #2
TRC 0801 4/1/2008
Gregg Street - Station 1 Annette
REP #1
104

UNIVERSITY OF ARKANSAS
DEPARTMENT OF CIVIL ENGINEERING
MATERIALS LABORATORY
Job Name: Date:
Material: Tested By:
Source:
ASPHALT CONTENT BY THE IGNITION METHOD
Test Samples
Sample ID G1-12W G1-6W G1-J G1-6E G1-12E
Weight of Basket (g) 3267.00 3259.00 3268.00 3266.00 3260.00
Specimen + Basket (g) 5082.00 4996.00 5277.00 5553.00 5401.00
Net Wt. of Specimen (g) 1815.00 1737.00 2009.00 2287.00 2141.00
Calibration Factor 0.00 0.00 0.00 0.00 0.00
Temperature Correction Factor 0.11 0.10 0.10 0.08 0.07
Oven Derived AC% 6.64 6.65 5.60 6.86 6.48
Corrected Value (if CF not used) 6.64 6.65 5.60 6.86 6.48
Station 1
ASPHALT CONTENT BY THE IGNITION METHOD(AASHTO T 308)
TRC 0801 4/1/2008
Gregg Street Annette
105

UNIVERSITY OF ARKANSAS
DEPARTMENT OF CIVIL ENGINEERING
MATERIALS LABORATORY
Job Name: Date:
Material: Tested By:
Source:
WET and DRY SIEVE ANALYSIS
Sieve Size
(U.S. Std.)
Sieve Size
(mm)
Sieve + Agg
Weight
Sieve
Weight
Individual
Weight Ret.
Cum. Wt.
Retained
Cum.
% Ret.
%
Passing
Reported
% Passing
2 50.0
1-1/2 37.5 0.00 0.00 0.00 100.00 100.0
1 25.0 0.00 0.00 0.00 100.00 100.0
3/4 19.0 0.00 0.00 0.00 100.00 100.0
1/2 12.5 637.50 526.50 111.00 111.00 6.56 93.44 93.4
3/8 9.5 711.20 528.00 183.20 294.20 17.38 82.62 82.6
#4 4.750 1055.10 494.10 561.00 855.20 50.53 49.47 49.5
#8 2.360 782.30 473.30 309.00 1164.20 68.79 31.21 31.2
#16 1.180 573.20 415.10 158.10 1322.30 78.13 21.87 21.9
#30 0.600 462.90 378.00 84.90 1407.20 83.15 16.85 16.9
#40 0.425 382.00 359.80 22.20 1429.40 84.46 15.54 15.5
#50 0.300 370.20 351.00 19.20 1448.60 85.59 14.41 14.4
#100 0.150 379.50 335.90 43.60 1492.20 88.17 11.83 11.8
#200 0.075 373.90 326.10 47.80 1540.00 91.00 9.00 9.00
Pan Pan 381.00 365.90 15.10 1555.10
A) Weight of Original Sample, g AHTD Dust Proportion
B) Weight after Wash, g
C) Wash Loss, g (A-B) Fineness Modulus
D) Minus #200 From Sieve, g
Total Minus #200, g (C+D) Acceptance Check
Wash Loss 8.11 %
0.58
1555.10
137.30 4.718
Gregg Street Annette
SIEVE ANALYSIS OF COARSE AND FINE AGGREGATE(AASHTO T-11 and AASHTO T-27)
TRC 0801 4/1/2008
15.10
152.40 1.0000
Station 1 - 12W
1692.40
106

UNIVERSITY OF ARKANSAS
DEPARTMENT OF CIVIL ENGINEERING
MATERIALS LABORATORY
Job Name: Date:
Material: Tested By:
Source:
WET and DRY SIEVE ANALYSIS
Sieve Size
(U.S. Std.)
Sieve Size
(mm)
Sieve + Agg
Weight
Sieve
Weight
Individual
Weight Ret.
Cum. Wt.
Retained
Cum.
% Ret.
%
Passing
Reported
% Passing
2 50.0
1-1/2 37.5 0.00 0.00 0.00 100.00 100.0
1 25.0 0.00 0.00 0.00 100.00 100.0
3/4 19.0 0.00 0.00 0.00 100.00 100.0
1/2 12.5 656.10 526.50 129.60 129.60 8.00 92.00 92.0
3/8 9.5 702.00 528.10 173.90 303.50 18.74 81.26 81.3
#4 4.750 1015.20 493.90 521.30 824.80 50.92 49.08 49.1
#8 2.360 760.40 472.60 287.80 1112.60 68.69 31.31 31.3
#16 1.180 572.80 414.80 158.00 1270.60 78.45 21.55 21.6
#30 0.600 466.00 377.70 88.30 1358.90 83.90 16.10 16.1
#40 0.425 386.10 359.40 26.70 1385.60 85.55 14.45 14.5
#50 0.300 372.90 350.80 22.10 1407.70 86.91 13.09 13.1
#100 0.150 375.70 335.80 39.90 1447.60 89.37 10.63 10.6
#200 0.075 370.50 325.90 44.60 1492.20 92.13 7.87 7.87
Pan Pan 378.00 365.80 12.20 1504.40
A) Weight of Original Sample, g AHTD Dust Proportion
B) Weight after Wash, g
C) Wash Loss, g (A-B) Fineness Modulus
D) Minus #200 From Sieve, g
Total Minus #200, g (C+D) Acceptance Check
Wash Loss 7.12 %
0.54
1504.40
115.30 4.770
Gregg Street Annette
SIEVE ANALYSIS OF COARSE AND FINE AGGREGATE(AASHTO T-11 and AASHTO T-27)
TRC 0801 4/1/2008
12.20
127.50 1.0000
Station 1 - 6W
1619.70
107
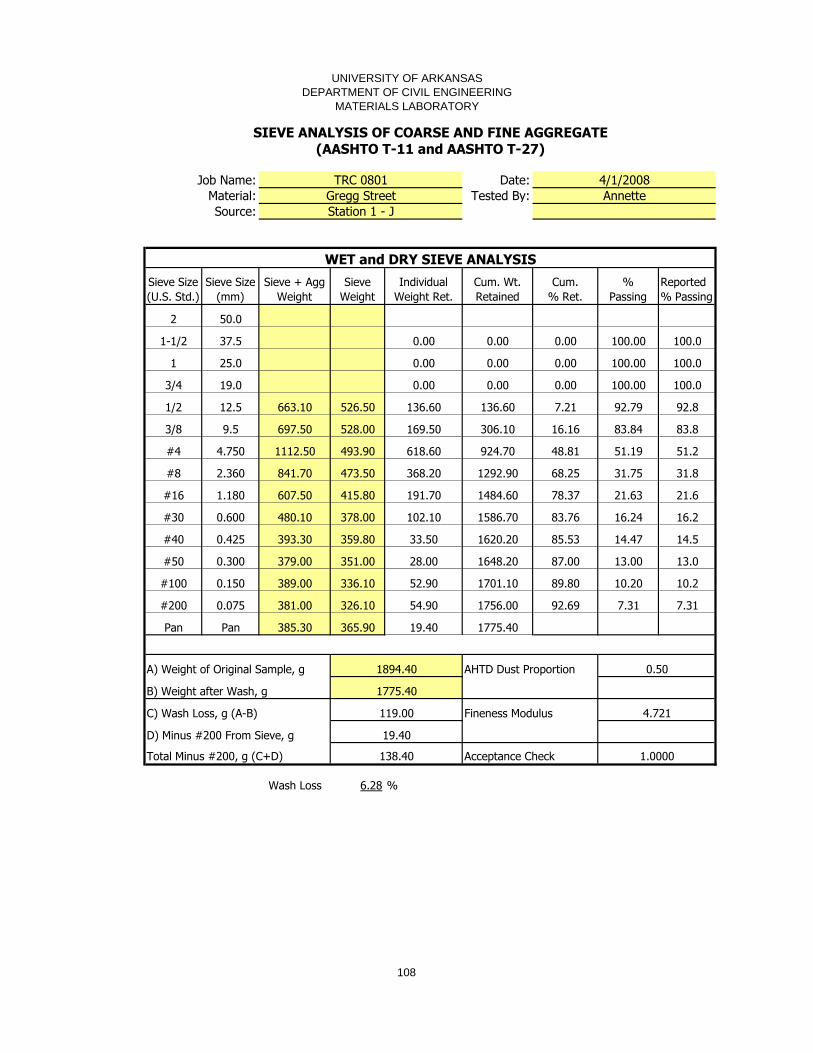
UNIVERSITY OF ARKANSAS
DEPARTMENT OF CIVIL ENGINEERING
MATERIALS LABORATORY
Job Name: Date:
Material: Tested By:
Source:
WET and DRY SIEVE ANALYSIS
Sieve Size
(U.S. Std.)
Sieve Size
(mm)
Sieve + Agg
Weight
Sieve
Weight
Individual
Weight Ret.
Cum. Wt.
Retained
Cum.
% Ret.
%
Passing
Reported
% Passing
2 50.0
1-1/2 37.5 0.00 0.00 0.00 100.00 100.0
1 25.0 0.00 0.00 0.00 100.00 100.0
3/4 19.0 0.00 0.00 0.00 100.00 100.0
1/2 12.5 663.10 526.50 136.60 136.60 7.21 92.79 92.8
3/8 9.5 697.50 528.00 169.50 306.10 16.16 83.84 83.8
#4 4.750 1112.50 493.90 618.60 924.70 48.81 51.19 51.2
#8 2.360 841.70 473.50 368.20 1292.90 68.25 31.75 31.8
#16 1.180 607.50 415.80 191.70 1484.60 78.37 21.63 21.6
#30 0.600 480.10 378.00 102.10 1586.70 83.76 16.24 16.2
#40 0.425 393.30 359.80 33.50 1620.20 85.53 14.47 14.5
#50 0.300 379.00 351.00 28.00 1648.20 87.00 13.00 13.0
#100 0.150 389.00 336.10 52.90 1701.10 89.80 10.20 10.2
#200 0.075 381.00 326.10 54.90 1756.00 92.69 7.31 7.31
Pan Pan 385.30 365.90 19.40 1775.40
A) Weight of Original Sample, g AHTD Dust Proportion
B) Weight after Wash, g
C) Wash Loss, g (A-B) Fineness Modulus
D) Minus #200 From Sieve, g
Total Minus #200, g (C+D) Acceptance Check
Wash Loss 6.28 %
0.50
1775.40
119.00 4.721
Gregg Street Annette
SIEVE ANALYSIS OF COARSE AND FINE AGGREGATE(AASHTO T-11 and AASHTO T-27)
TRC 0801 4/1/2008
19.40
138.40 1.0000
Station 1 - J
1894.40
108

UNIVERSITY OF ARKANSAS
DEPARTMENT OF CIVIL ENGINEERING
MATERIALS LABORATORY
Job Name: Date:
Material: Tested By:
Source:
WET and DRY SIEVE ANALYSIS
Sieve Size
(U.S. Std.)
Sieve Size
(mm)
Sieve + Agg
Weight
Sieve
Weight
Individual
Weight Ret.
Cum. Wt.
Retained
Cum.
% Ret.
%
Passing
Reported
% Passing
2 50.0
1-1/2 37.5 0.00 0.00 0.00 100.00 100.0
1 25.0 0.00 0.00 0.00 100.00 100.0
3/4 19.0 0.00 0.00 0.00 100.00 100.0
1/2 12.5 687.90 526.40 161.50 161.50 7.58 92.42 92.4
3/8 9.5 766.90 527.80 239.10 400.60 18.81 81.19 81.2
#4 4.750 1192.20 494.00 698.20 1098.80 51.59 48.41 48.4
#8 2.360 845.60 473.30 372.30 1471.10 69.07 30.93 30.9
#16 1.180 622.60 415.60 207.00 1678.10 78.78 21.22 21.2
#30 0.600 489.70 378.00 111.70 1789.80 84.03 15.97 16.0
#40 0.425 395.60 359.70 35.90 1825.70 85.71 14.29 14.3
#50 0.300 380.20 351.00 29.20 1854.90 87.08 12.92 12.9
#100 0.150 391.00 336.10 54.90 1909.80 89.66 10.34 10.3
#200 0.075 387.40 326.00 61.40 1971.20 92.54 7.46 7.46
Pan Pan 389.20 366.00 23.20 1994.40
A) Weight of Original Sample, g AHTD Dust Proportion
B) Weight after Wash, g
C) Wash Loss, g (A-B) Fineness Modulus
D) Minus #200 From Sieve, g
Total Minus #200, g (C+D) Acceptance Check
Wash Loss 6.37 %
0.52
1994.40
135.60 4.790
Gregg Street Annette
SIEVE ANALYSIS OF COARSE AND FINE AGGREGATE(AASHTO T-11 and AASHTO T-27)
TRC 0801 4/1/2008
23.20
158.80 1.0000
Station 1 - 6E
2130.00
109
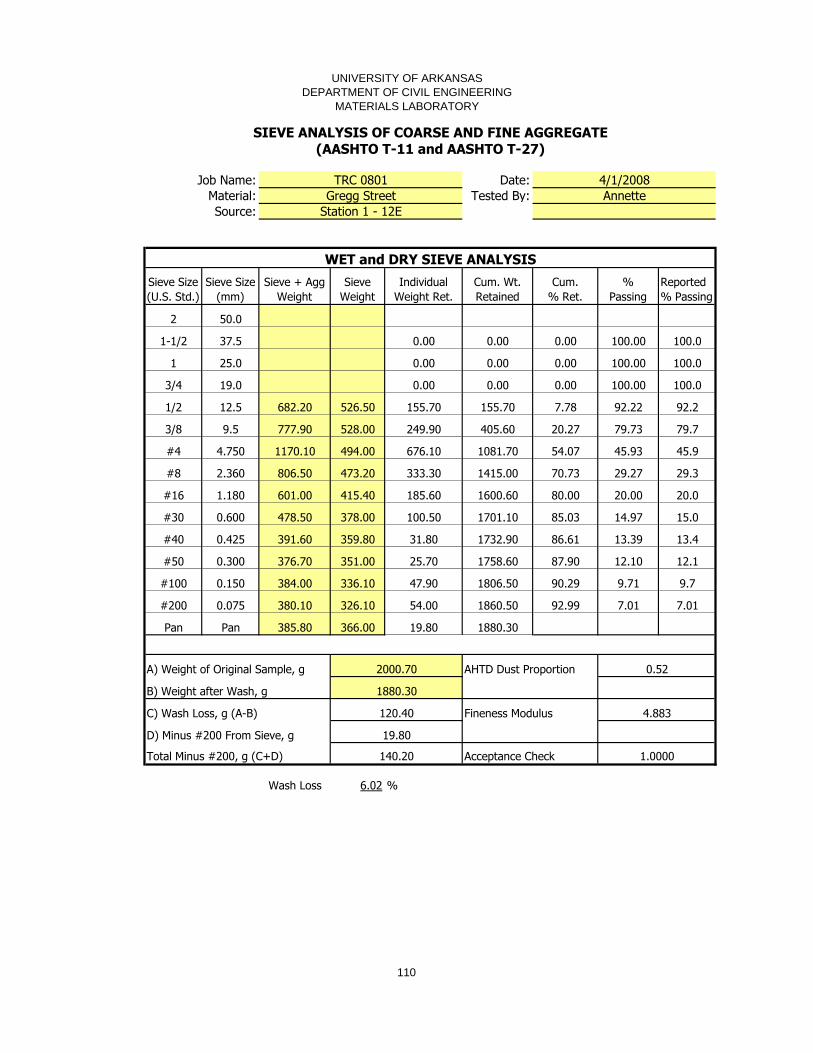
UNIVERSITY OF ARKANSAS
DEPARTMENT OF CIVIL ENGINEERING
MATERIALS LABORATORY
Job Name: Date:
Material: Tested By:
Source:
WET and DRY SIEVE ANALYSIS
Sieve Size
(U.S. Std.)
Sieve Size
(mm)
Sieve + Agg
Weight
Sieve
Weight
Individual
Weight Ret.
Cum. Wt.
Retained
Cum.
% Ret.
%
Passing
Reported
% Passing
2 50.0
1-1/2 37.5 0.00 0.00 0.00 100.00 100.0
1 25.0 0.00 0.00 0.00 100.00 100.0
3/4 19.0 0.00 0.00 0.00 100.00 100.0
1/2 12.5 682.20 526.50 155.70 155.70 7.78 92.22 92.2
3/8 9.5 777.90 528.00 249.90 405.60 20.27 79.73 79.7
#4 4.750 1170.10 494.00 676.10 1081.70 54.07 45.93 45.9
#8 2.360 806.50 473.20 333.30 1415.00 70.73 29.27 29.3
#16 1.180 601.00 415.40 185.60 1600.60 80.00 20.00 20.0
#30 0.600 478.50 378.00 100.50 1701.10 85.03 14.97 15.0
#40 0.425 391.60 359.80 31.80 1732.90 86.61 13.39 13.4
#50 0.300 376.70 351.00 25.70 1758.60 87.90 12.10 12.1
#100 0.150 384.00 336.10 47.90 1806.50 90.29 9.71 9.7
#200 0.075 380.10 326.10 54.00 1860.50 92.99 7.01 7.01
Pan Pan 385.80 366.00 19.80 1880.30
A) Weight of Original Sample, g AHTD Dust Proportion
B) Weight after Wash, g
C) Wash Loss, g (A-B) Fineness Modulus
D) Minus #200 From Sieve, g
Total Minus #200, g (C+D) Acceptance Check
Wash Loss 6.02 %
0.52
1880.30
120.40 4.883
Gregg Street Annette
SIEVE ANALYSIS OF COARSE AND FINE AGGREGATE(AASHTO T-11 and AASHTO T-27)
TRC 0801 4/1/2008
19.80
140.20 1.0000
Station 1 - 12E
2000.70
110
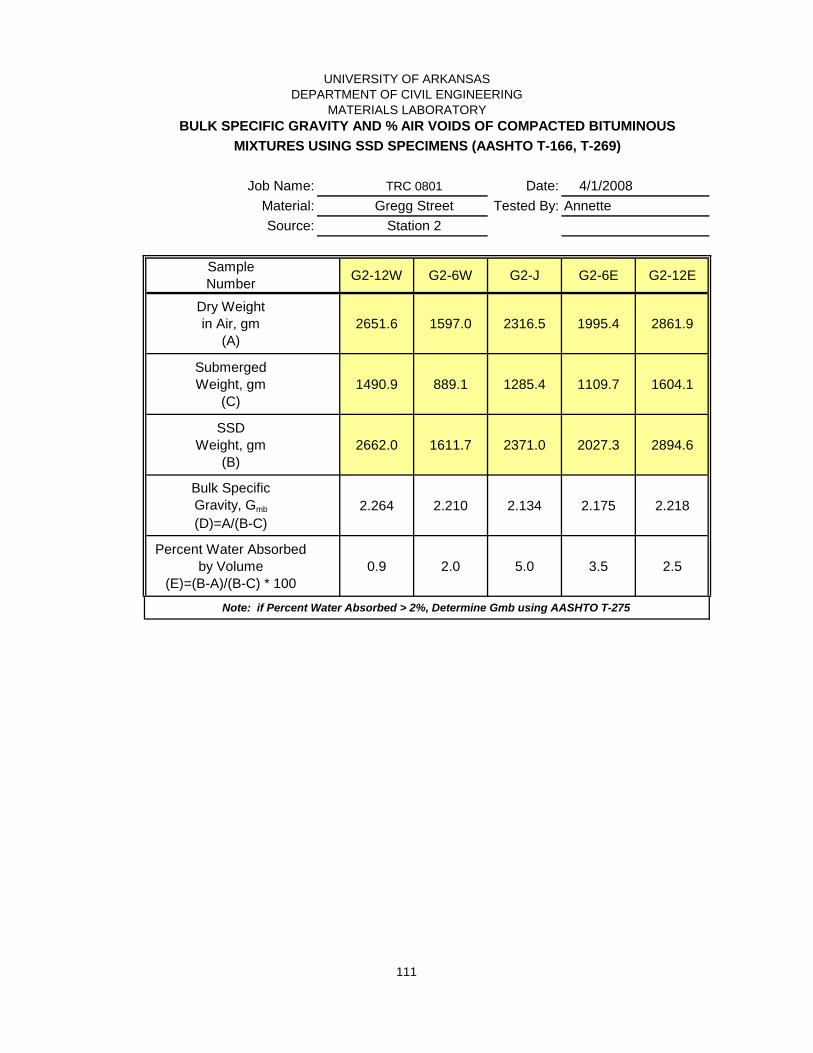
UNIVERSITY OF ARKANSAS
DEPARTMENT OF CIVIL ENGINEERING
MATERIALS LABORATORY
BULK SPECIFIC GRAVITY AND % AIR VOIDS OF COMPACTED BITUMINOUS
MIXTURES USING SSD SPECIMENS (AASHTO T-166, T-269)
Job Name: TRC 0801 Date: 4/1/2008
Material: Tested By: Annette
Source: Station 2
Sample
NumberG2-12W G2-6W G2-J G2-6E G2-12E
Dry Weight
in Air, gm
(A)
2651.6 1597.0 2316.5 1995.4 2861.9
Submerged
Weight, gm
(C)
1490.9 889.1 1285.4 1109.7 1604.1
SSD
Weight, gm
(B)
2662.0 1611.7 2371.0 2027.3 2894.6
Bulk Specific
Gravity, Gmb
(D)=A/(B-C)
2.264 2.210 2.134 2.175 2.218
Percent Water Absorbed
by Volume
(E)=(B-A)/(B-C) * 100
0.9 2.0 5.0 3.5 2.5
Note: if Percent Water Absorbed > 2%, Determine Gmb using AASHTO T-275
Gregg Street
111
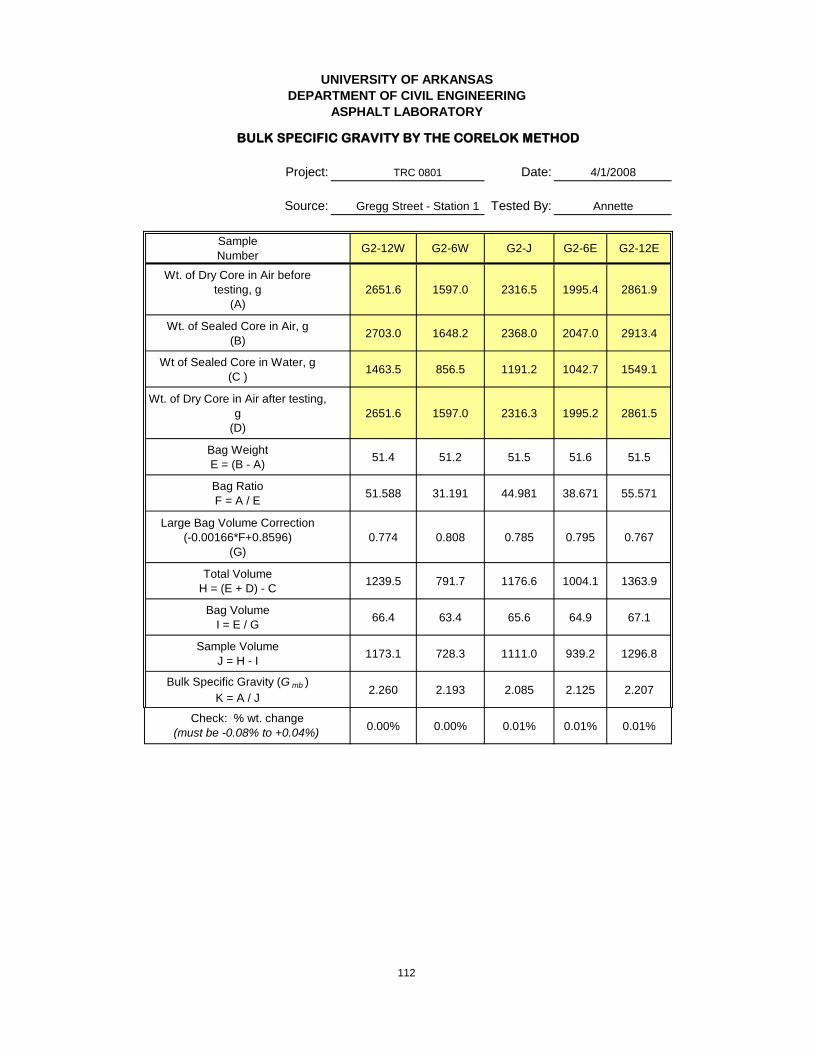
UNIVERSITY OF ARKANSAS
DEPARTMENT OF CIVIL ENGINEERING
ASPHALT LABORATORY
BULK SPECIFIC GRAVITY BY THE CORELOK METHOD
Project: Date:
Source: Tested By:
Sample
NumberG2-12W G2-6W G2-J G2-6E G2-12E
Wt. of Dry Core in Air before
testing, g
(A)
2651.6 1597.0 2316.5 1995.4 2861.9
Wt. of Sealed Core in Air, g
(B)2703.0 1648.2 2368.0 2047.0 2913.4
Wt of Sealed Core in Water, g
(C )1463.5 856.5 1191.2 1042.7 1549.1
Wt. of Dry Core in Air after testing,
g
(D)
2651.6 1597.0 2316.3 1995.2 2861.5
Bag Weight
E = (B - A)51.4 51.2 51.5 51.6 51.5
Bag Ratio
F = A / E51.588 31.191 44.981 38.671 55.571
Large Bag Volume Correction
(-0.00166*F+0.8596)
(G)
0.774 0.808 0.785 0.795 0.767
Total Volume
H = (E + D) - C1239.5 791.7 1176.6 1004.1 1363.9
Bag Volume
I = E / G66.4 63.4 65.6 64.9 67.1
Sample Volume
J = H - I1173.1 728.3 1111.0 939.2 1296.8
Bulk Specific Gravity (G mb )
K = A / J2.260 2.193 2.085 2.125 2.207
0.00% 0.00% 0.01% 0.01% 0.01%
Check: % wt. change
(must be -0.08% to +0.04%)
TRC 0801 4/1/2008
Gregg Street - Station 1 Annette
112

UNIVERSITY OF ARKANSAS
DEPARTMENT OF CIVIL ENGINEERING
ASPHALT LABORATORY
Job Name: Date:
Material: Tested By:
Source:
Sample
NumberG2-12W G2-6W G2-J G2-6E G2-12E
Dry Weight
in Air, gm 2651.6 1597.0 2316.3 1995.2 2861.5
Sample
Volume, cc1169 719 1050 908 1282
Bulk Specific
Gravity, Gmb2.268 2.219 2.204 2.195 2.231
Station 1
4/1/2008
Annette
KUSS Gmb
TRC 0801
Gregg Street
113

UNIVERSITY OF ARKANSAS
DEPARTMENT OF CIVIL ENGINEERING
ASPHALT LABORATORYLABORATORY PERMEABILITY BY THE KAROL-WARNER METHOD
Project: Date:
Source: Tested By:
Sample
NumberG2-12W G2-6W G2-J G2-6E G2-12E
Standpipe inside dia., cm 3.175 3.175 3.175 3.175 3.175
Standpipe area, cm2 7.917304 7.917304 7.917304 7.917304 7.917304
Specimen height, mm 68.81 44.45 63.72 54.84 75.46
Specimen height, mm 69.80 42.77 64.51 56.94 74.51
Specimen height, mm 69.63 40.18 64.46 52.49 74.18
Specimen height, mm 67.26 40.70 62.62 52.23 75.67
Average specimen height, cm 6.888 4.203 6.383 5.413 7.496
Specimen diameter, mm 151.05 152.05 151.08 152.01 151.79
Specimen diameter, mm 150.97 152.37 151.42 151.95 152.42
Specimen diameter, mm 150.67 151.21 151.46 151.65 152.35
Specimen diameter, mm 151.08 152.61 151.59 152.99 151.59
Average specimen diameter, cm 15.094 15.206 15.139 15.215 15.204
Specimen Area, cm2 178.942 181.602 179.999 181.817 181.548
Time, initial (min.) 0.0 0.0 0.0 0.0 0.0
Ht. @ Time, initial 65.2 59.0 61.0 58.0 61.0
Time, final (min.) 15.0 15.0 6.8 10.9 15.0
Ht @ Time, final 65.2 56.7 0.0 0.0 60.2
Permeability 1 (k x 10-5
) 0.00 0.64 110.05 55.75 0.41
Time, initial (min.) 15.0 15.0 0.0 0.0 15.0
Ht. @ Time, initial 65.2 56.7 57.0 59.0 60.2
Time, final (min.) 30.0 30.0 7.2 11.5 30.0
Ht @ Time, final 65.2 55.1 0.0 0.0 59.2
Permeability 2 (k x 10-5
) 0.00 0.46 99.57 53.28 0.46
Average Permeability (k x 10-5
) 0.00 0.55 104.81 54.51 0.43
Water Temp, F 68.0 71.0 69.0 69.0 66.5
Water Temp, C 20.0 21.7 20.6 20.6 19.2
RT Factor 1.0000 0.9602 0.9856 0.9856 1.0202
PERMEABILITY (k x 10-5) 0.00 0.52 103.30 53.73 0.44
REP #2
TRC 0801 4/1/2008
Gregg Street - Station 1 Annette
REP #1
114

UNIVERSITY OF ARKANSAS
DEPARTMENT OF CIVIL ENGINEERING
MATERIALS LABORATORY
Job Name: Date:
Material: Tested By:
Source:
Test SamplesSample ID G2-12W G2-6W G2-J G2-6E G2-12E
Weight of Basket (g) 3264.00 3271.00 3262.00 3264.00 3257.00
Specimen + Basket (g) 5869.00 4864.00 5557.00 5243.00 6081.00
Net Wt. of Specimen (g) 2605.00 1593.00 2295.00 1979.00 2824.00
Calibration Factor 0.00 0.00 0.00 0.00 0.00
Temperature Correction Factor 0.11 0.18 0.08 0.10 0.05
Oven Derived AC% 6.43 6.76 6.45 6.37 6.36
Corrected Value (if CF not used) 6.43 6.76 6.45 6.37 6.36
Gregg Street Annette
Station 1
ASPHALT CONTENT BY THE IGNITION METHOD(AASHTO T 308)
TRC 0801 4/1/2008
115

UNIVERSITY OF ARKANSAS
DEPARTMENT OF CIVIL ENGINEERING
MATERIALS LABORATORY
Job Name: Date:
Material: Tested By:
Source:
WET and DRY SIEVE ANALYSIS
Sieve Size
(U.S. Std.)
Sieve Size
(mm)
Sieve + Agg
Weight
Sieve
Weight
Individual
Weight Ret.
Cum. Wt.
Retained
Cum.
% Ret.
%
Passing
Reported
% Passing
2 50.0
1-1/2 37.5 0.00 0.00 0.00 100.00 100.0
1 25.0 579.60 530.00 49.60 49.60 2.04 97.96 98.0
3/4 19.0 550.80 535.90 14.90 64.50 2.65 97.35 97.4
1/2 12.5 713.40 526.60 186.80 251.30 10.32 89.68 89.7
3/8 9.5 762.10 528.00 234.10 485.40 19.94 80.06 80.1
#4 4.750 1224.60 494.10 730.50 1215.90 49.95 50.05 50.1
#8 2.360 891.80 473.20 418.60 1634.50 67.14 32.86 32.9
#16 1.180 657.30 415.40 241.90 1876.40 77.08 22.92 22.9
#30 0.600 516.90 378.00 138.90 2015.30 82.78 17.22 17.2
#40 0.425 405.40 359.80 45.60 2060.90 84.66 15.34 15.3
#50 0.300 388.30 351.00 37.30 2098.20 86.19 13.81 13.8
#100 0.150 401.60 336.10 65.50 2163.70 88.88 11.12 11.1
#200 0.075 395.60 326.10 69.50 2233.20 91.74 8.26 8.26
Pan Pan 382.50 366.00 16.50 2249.70
A) Weight of Original Sample, g AHTD Dust Proportion
B) Weight after Wash, g
C) Wash Loss, g (A-B) Fineness Modulus
D) Minus #200 From Sieve, g
Total Minus #200, g (C+D) Acceptance Check
Wash Loss 7.59 %
Gregg Street Annette
SIEVE ANALYSIS OF COARSE AND FINE AGGREGATE(AASHTO T-11 and AASHTO T-27)
TRC 0801 4/1/2008
16.50
201.20 1.0000
Station 2 - 12W
2434.40 0.54
2249.70
184.70 4.746
116

UNIVERSITY OF ARKANSAS
DEPARTMENT OF CIVIL ENGINEERING
MATERIALS LABORATORY
Job Name: Date:
Material: Tested By:
Source:
WET and DRY SIEVE ANALYSIS
Sieve Size
(U.S. Std.)
Sieve Size
(mm)
Sieve + Agg
Weight
Sieve
Weight
Individual
Weight Ret.
Cum. Wt.
Retained
Cum.
% Ret.
%
Passing
Reported
% Passing
2 50.0
1-1/2 37.5 0.00 0.00 0.00 100.00 100.0
1 25.0 0.00 0.00 0.00 100.00 100.0
3/4 19.0 0.00 0.00 0.00 100.00 100.0
1/2 12.5 661.90 526.50 135.40 135.40 9.13 90.87 90.9
3/8 9.5 668.60 529.50 139.10 274.50 18.52 81.48 81.5
#4 4.750 981.40 494.40 487.00 761.50 51.37 48.63 48.6
#8 2.360 746.60 473.50 273.10 1034.60 69.80 30.20 30.2
#16 1.180 551.40 415.70 135.70 1170.30 78.95 21.05 21.0
#30 0.600 454.50 378.00 76.50 1246.80 84.11 15.89 15.9
#40 0.425 384.60 359.80 24.80 1271.60 85.79 14.21 14.2
#50 0.300 371.30 351.00 20.30 1291.90 87.16 12.84 12.8
#100 0.150 374.30 336.10 38.20 1330.10 89.73 10.27 10.3
#200 0.075 367.00 326.10 40.90 1371.00 92.49 7.51 7.51
Pan Pan 378.00 366.00 12.00 1383.00
A) Weight of Original Sample, g AHTD Dust Proportion
B) Weight after Wash, g
C) Wash Loss, g (A-B) Fineness Modulus
D) Minus #200 From Sieve, g
Total Minus #200, g (C+D) Acceptance Check
Wash Loss 6.70 %
Gregg Street Annette
SIEVE ANALYSIS OF COARSE AND FINE AGGREGATE(AASHTO T-11 and AASHTO T-27)
TRC 0801 4/1/2008
12.00
111.30 1.0000
Station 2 - 6W
1482.30 0.53
1383.00
99.30 4.796
117

UNIVERSITY OF ARKANSAS
DEPARTMENT OF CIVIL ENGINEERING
MATERIALS LABORATORY
Job Name: Date:
Material: Tested By:
Source:
WET and DRY SIEVE ANALYSIS
Sieve Size
(U.S. Std.)
Sieve Size
(mm)
Sieve + Agg
Weight
Sieve
Weight
Individual
Weight Ret.
Cum. Wt.
Retained
Cum.
% Ret.
%
Passing
Reported
% Passing
2 50.0
1-1/2 37.5 0.00 0.00 0.00 100.00 100.0
1 25.0 0.00 0.00 0.00 100.00 100.0
3/4 19.0 0.00 0.00 0.00 100.00 100.0
1/2 12.5 693.40 526.50 166.90 166.90 7.79 92.21 92.2
3/8 9.5 809.40 527.90 281.50 448.40 20.93 79.07 79.1
#4 4.750 1206.10 493.90 712.20 1160.60 54.18 45.82 45.8
#8 2.360 830.10 473.20 356.90 1517.50 70.84 29.16 29.2
#16 1.180 606.50 415.50 191.00 1708.50 79.75 20.25 20.2
#30 0.600 485.50 378.00 107.50 1816.00 84.77 15.23 15.2
#40 0.425 395.00 359.70 35.30 1851.30 86.42 13.58 13.6
#50 0.300 379.60 351.00 28.60 1879.90 87.76 12.24 12.2
#100 0.150 387.30 336.10 51.20 1931.10 90.15 9.85 9.9
#200 0.075 380.80 326.10 54.70 1985.80 92.70 7.30 7.30
Pan Pan 381.20 366.00 15.20 2001.00
A) Weight of Original Sample, g AHTD Dust Proportion
B) Weight after Wash, g
C) Wash Loss, g (A-B) Fineness Modulus
D) Minus #200 From Sieve, g
Total Minus #200, g (C+D) Acceptance Check
Wash Loss 6.59 %
Gregg Street Annette
SIEVE ANALYSIS OF COARSE AND FINE AGGREGATE(AASHTO T-11 and AASHTO T-27)
TRC 0801 4/1/2008
15.20
156.40 1.0000
Station 2 - J
2142.20 0.54
2001.00
141.20 4.884
118
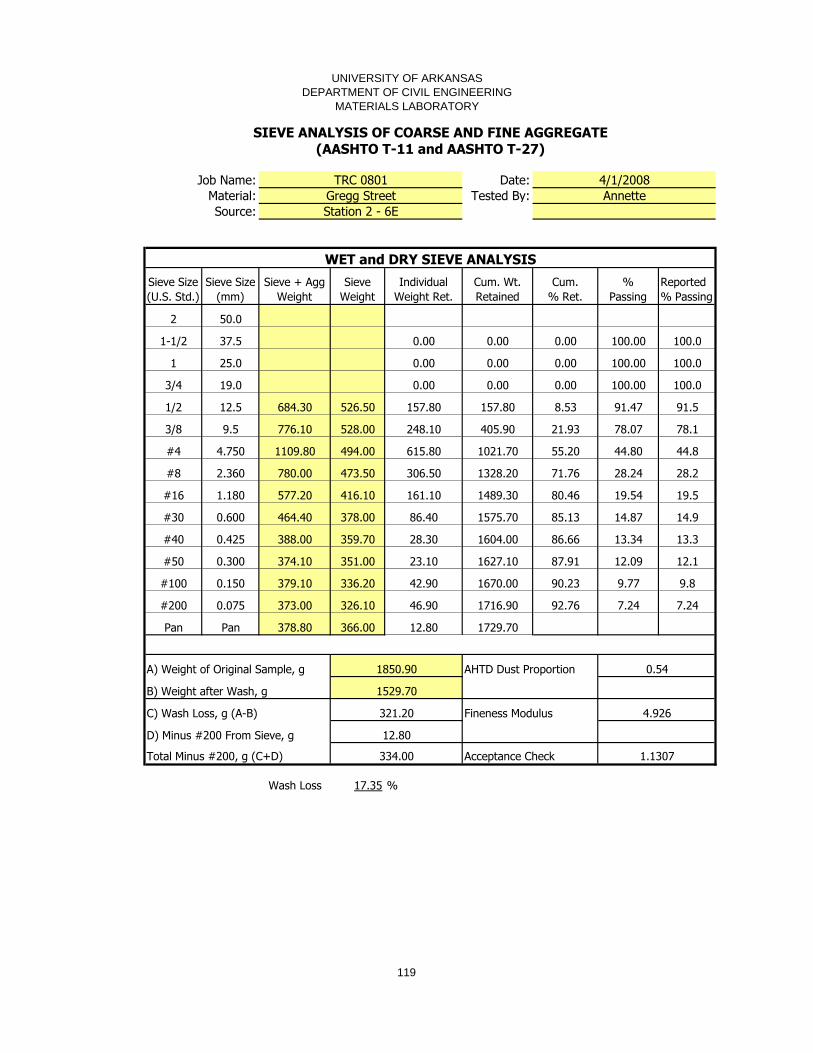
UNIVERSITY OF ARKANSAS
DEPARTMENT OF CIVIL ENGINEERING
MATERIALS LABORATORY
Job Name: Date:
Material: Tested By:
Source:
WET and DRY SIEVE ANALYSIS
Sieve Size
(U.S. Std.)
Sieve Size
(mm)
Sieve + Agg
Weight
Sieve
Weight
Individual
Weight Ret.
Cum. Wt.
Retained
Cum.
% Ret.
%
Passing
Reported
% Passing
2 50.0
1-1/2 37.5 0.00 0.00 0.00 100.00 100.0
1 25.0 0.00 0.00 0.00 100.00 100.0
3/4 19.0 0.00 0.00 0.00 100.00 100.0
1/2 12.5 684.30 526.50 157.80 157.80 8.53 91.47 91.5
3/8 9.5 776.10 528.00 248.10 405.90 21.93 78.07 78.1
#4 4.750 1109.80 494.00 615.80 1021.70 55.20 44.80 44.8
#8 2.360 780.00 473.50 306.50 1328.20 71.76 28.24 28.2
#16 1.180 577.20 416.10 161.10 1489.30 80.46 19.54 19.5
#30 0.600 464.40 378.00 86.40 1575.70 85.13 14.87 14.9
#40 0.425 388.00 359.70 28.30 1604.00 86.66 13.34 13.3
#50 0.300 374.10 351.00 23.10 1627.10 87.91 12.09 12.1
#100 0.150 379.10 336.20 42.90 1670.00 90.23 9.77 9.8
#200 0.075 373.00 326.10 46.90 1716.90 92.76 7.24 7.24
Pan Pan 378.80 366.00 12.80 1729.70
A) Weight of Original Sample, g AHTD Dust Proportion
B) Weight after Wash, g
C) Wash Loss, g (A-B) Fineness Modulus
D) Minus #200 From Sieve, g
Total Minus #200, g (C+D) Acceptance Check
Wash Loss 17.35 %
Gregg Street Annette
SIEVE ANALYSIS OF COARSE AND FINE AGGREGATE(AASHTO T-11 and AASHTO T-27)
TRC 0801 4/1/2008
12.80
334.00 1.1307
Station 2 - 6E
1850.90 0.54
1529.70
321.20 4.926
119

UNIVERSITY OF ARKANSAS
DEPARTMENT OF CIVIL ENGINEERING
MATERIALS LABORATORY
Job Name: Date:
Material: Tested By:
Source:
WET and DRY SIEVE ANALYSIS
Sieve Size
(U.S. Std.)
Sieve Size
(mm)
Sieve + Agg
Weight
Sieve
Weight
Individual
Weight Ret.
Cum. Wt.
Retained
Cum.
% Ret.
%
Passing
Reported
% Passing
2 50.0
1-1/2 37.5 0.00 0.00 0.00 100.00 100.0
1 25.0 574.80 530.00 44.80 44.80 1.69 98.31 98.3
3/4 19.0 550.90 535.80 15.10 59.90 2.27 97.73 97.7
1/2 12.5 708.70 526.50 182.20 242.10 9.16 90.84 90.8
3/8 9.5 822.90 528.00 294.90 537.00 20.31 79.69 79.7
#4 4.750 1301.60 494.00 807.60 1344.60 50.85 49.15 49.1
#8 2.360 941.20 473.20 468.00 1812.60 68.55 31.45 31.4
#16 1.180 678.70 415.10 263.60 2076.20 78.52 21.48 21.5
#30 0.600 520.90 377.90 143.00 2219.20 83.93 16.07 16.1
#40 0.425 406.70 359.70 47.00 2266.20 85.70 14.30 14.3
#50 0.300 389.50 351.00 38.50 2304.70 87.16 12.84 12.8
#100 0.150 403.00 336.00 67.00 2371.70 89.69 10.31 10.3
#200 0.075 396.70 326.10 70.60 2442.30 92.36 7.64 7.64
Pan Pan 387.10 366.00 21.10 2463.40
A) Weight of Original Sample, g AHTD Dust Proportion
B) Weight after Wash, g
C) Wash Loss, g (A-B) Fineness Modulus
D) Minus #200 From Sieve, g
Total Minus #200, g (C+D) Acceptance Check
Wash Loss 6.84 %
Gregg Street Annette
SIEVE ANALYSIS OF COARSE AND FINE AGGREGATE(AASHTO T-11 and AASHTO T-27)
TRC 0801 4/1/2008
21.10
201.90 1.0000
Station 2 - 12E
2644.20 0.53
2463.40
180.80 4.813
120

UNIVERSITY OF ARKANSAS
DEPARTMENT OF CIVIL ENGINEERING
MATERIALS LABORATORY
BULK SPECIFIC GRAVITY AND % AIR VOIDS OF COMPACTED BITUMINOUS
MIXTURES USING SSD SPECIMENS (AASHTO T-166, T-269)
Job Name: TRC 0801 Date: 4/1/2008
Material: Tested By: Annette
Source: Station 3
Sample
NumberG3-12W G3-6W G3-J G3-6E G3-12E
Dry Weight
in Air, gm
(A)
1692.5 1838.9 1849.3 2039.1 2117.7
Submerged
Weight, gm
(C)
967.7 1035.4 1018.0 1150.7 1205.4
SSD
Weight, gm
(B)
1703.9 1849.7 1877.2 2054.3 2134.2
Bulk Specific
Gravity, Gmb
(D)=A/(B-C)
2.299 2.258 2.152 2.257 2.280
Percent Water Absorbed
by Volume
(E)=(B-A)/(B-C) * 100
1.5 1.3 3.2 1.7 1.8
Note: if Percent Water Absorbed > 2%, Determine Gmb using AASHTO T-275
Gregg Street
121
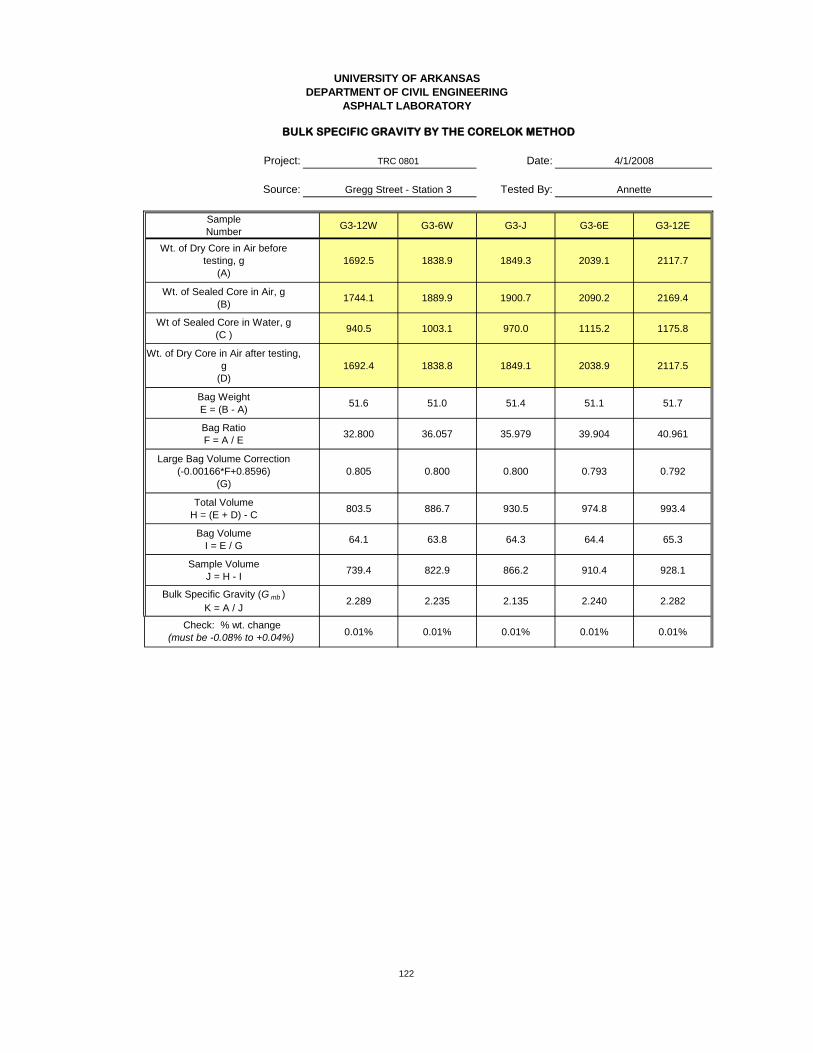
UNIVERSITY OF ARKANSAS
DEPARTMENT OF CIVIL ENGINEERING
ASPHALT LABORATORY
BULK SPECIFIC GRAVITY BY THE CORELOK METHOD
Project: Date:
Source: Tested By:
Sample
NumberG3-12W G3-6W G3-J G3-6E G3-12E
Wt. of Dry Core in Air before
testing, g
(A)
1692.5 1838.9 1849.3 2039.1 2117.7
Wt. of Sealed Core in Air, g
(B)1744.1 1889.9 1900.7 2090.2 2169.4
Wt of Sealed Core in Water, g
(C )940.5 1003.1 970.0 1115.2 1175.8
Wt. of Dry Core in Air after testing,
g
(D)
1692.4 1838.8 1849.1 2038.9 2117.5
Bag Weight
E = (B - A)51.6 51.0 51.4 51.1 51.7
Bag Ratio
F = A / E32.800 36.057 35.979 39.904 40.961
Large Bag Volume Correction
(-0.00166*F+0.8596)
(G)
0.805 0.800 0.800 0.793 0.792
Total Volume
H = (E + D) - C803.5 886.7 930.5 974.8 993.4
Bag Volume
I = E / G64.1 63.8 64.3 64.4 65.3
Sample Volume
J = H - I739.4 822.9 866.2 910.4 928.1
Bulk Specific Gravity (G mb )
K = A / J2.289 2.235 2.135 2.240 2.282
0.01% 0.01% 0.01% 0.01% 0.01%
Check: % wt. change
(must be -0.08% to +0.04%)
TRC 0801 4/1/2008
Gregg Street - Station 3 Annette
122

Job Name: Date:
Material: Tested By:
Source:
Sample
NumberG3-12W G3-6W G3-J G3-6E G3-12E
Dry Weight
in Air, gm 1692.4 1838.8 1849.1 2038.9 2117.5
Sample
Volume, cc735 818 833 900 927
Bulk Specific
Gravity, Gmb2.299 2.245 2.219 2.265 2.284
KUSS Gmb
4/1/2008
Annette
TRC 0801
Gregg Street
Station 3
123
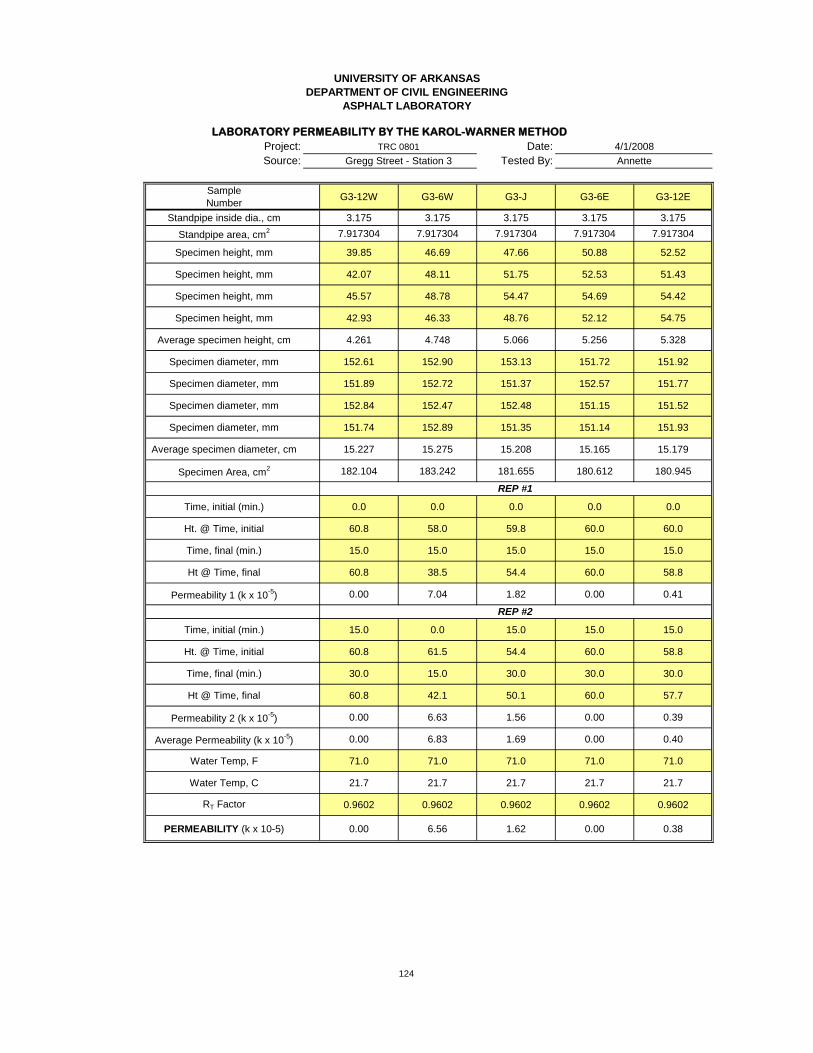
UNIVERSITY OF ARKANSAS
DEPARTMENT OF CIVIL ENGINEERING
ASPHALT LABORATORY
LABORATORY PERMEABILITY BY THE KAROL-WARNER METHOD
Project: Date:
Source: Tested By:
Sample
NumberG3-12W G3-6W G3-J G3-6E G3-12E
Standpipe inside dia., cm 3.175 3.175 3.175 3.175 3.175
Standpipe area, cm2 7.917304 7.917304 7.917304 7.917304 7.917304
Specimen height, mm 39.85 46.69 47.66 50.88 52.52
Specimen height, mm 42.07 48.11 51.75 52.53 51.43
Specimen height, mm 45.57 48.78 54.47 54.69 54.42
Specimen height, mm 42.93 46.33 48.76 52.12 54.75
Average specimen height, cm 4.261 4.748 5.066 5.256 5.328
Specimen diameter, mm 152.61 152.90 153.13 151.72 151.92
Specimen diameter, mm 151.89 152.72 151.37 152.57 151.77
Specimen diameter, mm 152.84 152.47 152.48 151.15 151.52
Specimen diameter, mm 151.74 152.89 151.35 151.14 151.93
Average specimen diameter, cm 15.227 15.275 15.208 15.165 15.179
Specimen Area, cm2 182.104 183.242 181.655 180.612 180.945
Time, initial (min.) 0.0 0.0 0.0 0.0 0.0
Ht. @ Time, initial 60.8 58.0 59.8 60.0 60.0
Time, final (min.) 15.0 15.0 15.0 15.0 15.0
Ht @ Time, final 60.8 38.5 54.4 60.0 58.8
Permeability 1 (k x 10-5
) 0.00 7.04 1.82 0.00 0.41
Time, initial (min.) 15.0 0.0 15.0 15.0 15.0
Ht. @ Time, initial 60.8 61.5 54.4 60.0 58.8
Time, final (min.) 30.0 15.0 30.0 30.0 30.0
Ht @ Time, final 60.8 42.1 50.1 60.0 57.7
Permeability 2 (k x 10-5
) 0.00 6.63 1.56 0.00 0.39
Average Permeability (k x 10-5
) 0.00 6.83 1.69 0.00 0.40
Water Temp, F 71.0 71.0 71.0 71.0 71.0
Water Temp, C 21.7 21.7 21.7 21.7 21.7
RT Factor 0.9602 0.9602 0.9602 0.9602 0.9602
PERMEABILITY (k x 10-5) 0.00 6.56 1.62 0.00 0.38
REP #2
TRC 0801 4/1/2008
Gregg Street - Station 3 Annette
REP #1
124

UNIVERSITY OF ARKANSAS
DEPARTMENT OF CIVIL ENGINEERING
MATERIALS LABORATORY
Job Name: Date:
Material: Tested By:
Source:
ASPHALT CONTENT BY THE IGNITION METHOD
Test Samples
Sample ID G3-12W G3-6W G3-J G3-6E G3-12E
Weight of Basket (g) 3267.00 3267.00 3273.00 3271.00 3275.00
Specimen + Basket (g) 4941.00 5098.00 5106.00 5293.00 5359.00
Net Wt. of Specimen (g) 1674.00 1831.00 1833.00 2022.00 2084.00
Calibration Factor 0.00 0.00 0.00 0.00 0.00
Temperature Correction Factor 0.12 0.16 0.13 0.14 0.10
Oven Derived AC% 6.52 6.86 6.50 6.74 6.71
Corrected Value (if CF not used) 6.52 6.86 6.50 6.74 6.71
Gregg Street Annette
Station 3
ASPHALT CONTENT BY THE IGNITION METHOD(AASHTO T 308)
TRC 0801 4/1/2008
125

UNIVERSITY OF ARKANSAS
DEPARTMENT OF CIVIL ENGINEERING
MATERIALS LABORATORY
Job Name: Date:
Material: Tested By:
Source:
WET and DRY SIEVE ANALYSIS
Sieve Size
(U.S. Std.)
Sieve Size
(mm)
Sieve + Agg
Weight
Sieve
Weight
Individual
Weight Ret.
Cum. Wt.
Retained
Cum.
% Ret.
%
Passing
Reported
% Passing
2 50.0
1-1/2 37.5 0.00 0.00 0.00 100.00 100.0
1 25.0 0.00 0.00 0.00 100.00 100.0
3/4 19.0 0.00 0.00 0.00 100.00 100.0
1/2 12.5 647.50 526.40 121.10 121.10 7.75 92.25 92.3
3/8 9.5 709.90 527.80 182.10 303.20 19.40 80.60 80.6
#4 4.750 986.00 494.40 491.60 794.80 50.86 49.14 49.1
#8 2.360 756.50 474.90 281.60 1076.40 68.88 31.12 31.1
#16 1.180 565.30 416.50 148.80 1225.20 78.40 21.60 21.6
#30 0.600 461.20 378.20 83.00 1308.20 83.71 16.29 16.3
#40 0.425 386.70 359.90 26.80 1335.00 85.43 14.57 14.6
#50 0.300 372.90 351.10 21.80 1356.80 86.82 13.18 13.2
#100 0.150 377.10 336.10 41.00 1397.80 89.45 10.55 10.6
#200 0.075 371.00 326.10 44.90 1442.70 92.32 7.68 7.68
Pan Pan 377.00 366.00 11.00 1453.70
A) Weight of Original Sample, g AHTD Dust Proportion
B) Weight after Wash, g
C) Wash Loss, g (A-B) Fineness Modulus
D) Minus #200 From Sieve, g
Total Minus #200, g (C+D) Acceptance Check
Wash Loss 6.98 %
11.00
120.00 1.0000
Station 3 - 12W
1562.70 0.53
1453.70
109.00 4.775
Gregg Street Annette
SIEVE ANALYSIS OF COARSE AND FINE AGGREGATE(AASHTO T-11 and AASHTO T-27)
TRC 0801 4/1/2008
126

UNIVERSITY OF ARKANSAS
DEPARTMENT OF CIVIL ENGINEERING
MATERIALS LABORATORY
Job Name: Date:
Material: Tested By:
Source:
WET and DRY SIEVE ANALYSIS
Sieve Size
(U.S. Std.)
Sieve Size
(mm)
Sieve + Agg
Weight
Sieve
Weight
Individual
Weight Ret.
Cum. Wt.
Retained
Cum.
% Ret.
%
Passing
Reported
% Passing
2 50.0
1-1/2 37.5 0.00 0.00 0.00 100.00 100.0
1 25.0 0.00 0.00 0.00 100.00 100.0
3/4 19.0 0.00 0.00 0.00 100.00 100.0
1/2 12.5 639.20 526.40 112.80 112.80 6.63 93.37 93.4
3/8 9.5 721.20 528.00 193.20 306.00 17.97 82.03 82.0
#4 4.750 1046.40 494.10 552.30 858.30 50.42 49.58 49.6
#8 2.360 780.40 473.70 306.70 1165.00 68.43 31.57 31.6
#16 1.180 584.20 415.90 168.30 1333.30 78.32 21.68 21.7
#30 0.600 469.30 378.00 91.30 1424.60 83.68 16.32 16.3
#40 0.425 389.20 359.80 29.40 1454.00 85.41 14.59 14.6
#50 0.300 374.70 351.00 23.70 1477.70 86.80 13.20 13.2
#100 0.150 381.30 336.10 45.20 1522.90 89.46 10.54 10.5
#200 0.075 376.00 326.10 49.90 1572.80 92.39 7.61 7.61
Pan Pan 384.50 366.00 18.50 1591.30
A) Weight of Original Sample, g AHTD Dust Proportion
B) Weight after Wash, g
C) Wash Loss, g (A-B) Fineness Modulus
D) Minus #200 From Sieve, g
Total Minus #200, g (C+D) Acceptance Check
Wash Loss 6.53 %
18.50
129.60 1.0000
Station 3 - 6W
1702.40 0.52
1591.30
111.10 4.751
Gregg Street Annette
SIEVE ANALYSIS OF COARSE AND FINE AGGREGATE(AASHTO T-11 and AASHTO T-27)
TRC 0801 4/1/2008
127

UNIVERSITY OF ARKANSAS
DEPARTMENT OF CIVIL ENGINEERING
MATERIALS LABORATORY
Job Name: Date:
Material: Tested By:
Source:
WET and DRY SIEVE ANALYSIS
Sieve Size
(U.S. Std.)
Sieve Size
(mm)
Sieve + Agg
Weight
Sieve
Weight
Individual
Weight Ret.
Cum. Wt.
Retained
Cum.
% Ret.
%
Passing
Reported
% Passing
2 50.0
1-1/2 37.5 0.00 0.00 0.00 100.00 100.0
1 25.0 0.00 0.00 0.00 100.00 100.0
3/4 19.0 0.00 0.00 0.00 100.00 100.0
1/2 12.5 633.50 526.30 107.20 107.20 6.26 93.74 93.7
3/8 9.5 732.90 527.90 205.00 312.20 18.24 81.76 81.8
#4 4.750 1062.50 494.20 568.30 880.50 51.45 48.55 48.6
#8 2.360 773.50 473.40 300.10 1180.60 68.98 31.02 31.0
#16 1.180 577.60 416.00 161.60 1342.20 78.43 21.57 21.6
#30 0.600 466.80 377.90 88.90 1431.10 83.62 16.38 16.4
#40 0.425 388.80 359.70 29.10 1460.20 85.32 14.68 14.7
#50 0.300 374.60 350.90 23.70 1483.90 86.71 13.29 13.3
#100 0.150 380.10 336.00 44.10 1528.00 89.28 10.72 10.7
#200 0.075 375.10 326.00 49.10 1577.10 92.15 7.85 7.85
Pan Pan 378.00 365.90 12.10 1589.20
A) Weight of Original Sample, g AHTD Dust Proportion
B) Weight after Wash, g
C) Wash Loss, g (A-B) Fineness Modulus
D) Minus #200 From Sieve, g
Total Minus #200, g (C+D) Acceptance Check
Wash Loss 7.14 %
12.10
134.30 1.0000
Station 3 - J
1711.40 0.53
1589.20
122.20 4.767
Gregg Street Annette
SIEVE ANALYSIS OF COARSE AND FINE AGGREGATE(AASHTO T-11 and AASHTO T-27)
TRC 0801 4/1/2008
128

UNIVERSITY OF ARKANSAS
DEPARTMENT OF CIVIL ENGINEERING
MATERIALS LABORATORY
Job Name: Date:
Material: Tested By:
Source:
WET and DRY SIEVE ANALYSIS
Sieve Size
(U.S. Std.)
Sieve Size
(mm)
Sieve + Agg
Weight
Sieve
Weight
Individual
Weight Ret.
Cum. Wt.
Retained
Cum.
% Ret.
%
Passing
Reported
% Passing
2 50.0
1-1/2 37.5 0.00 0.00 0.00 100.00 100.0
1 25.0 0.00 0.00 0.00 100.00 100.0
3/4 19.0 0.00 0.00 0.00 100.00 100.0
1/2 12.5 664.70 526.50 138.20 138.20 7.34 92.66 92.7
3/8 9.5 767.60 527.90 239.70 377.90 20.07 79.93 79.9
#4 4.750 1132.30 494.10 638.20 1016.10 53.97 46.03 46.0
#8 2.360 782.80 473.90 308.90 1325.00 70.38 29.62 29.6
#16 1.180 589.80 416.10 173.70 1498.70 79.60 20.40 20.4
#30 0.600 468.70 378.10 90.60 1589.30 84.42 15.58 15.6
#40 0.425 388.90 359.80 29.10 1618.40 85.96 14.04 14.0
#50 0.300 374.70 351.00 23.70 1642.10 87.22 12.78 12.8
#100 0.150 377.40 336.10 41.30 1683.40 89.41 10.59 10.6
#200 0.075 373.30 326.10 47.20 1730.60 91.92 8.08 8.08
Pan Pan 376.40 365.90 10.50 1741.10
A) Weight of Original Sample, g AHTD Dust Proportion
B) Weight after Wash, g
C) Wash Loss, g (A-B) Fineness Modulus
D) Minus #200 From Sieve, g
Total Minus #200, g (C+D) Acceptance Check
Wash Loss 7.52 %
10.50
152.10 1.0000
Station 3 - 6E
1882.70 0.58
1741.10
141.60 4.851
Gregg Street Annette
SIEVE ANALYSIS OF COARSE AND FINE AGGREGATE(AASHTO T-11 and AASHTO T-27)
TRC 0801 4/1/2008
129

UNIVERSITY OF ARKANSAS
DEPARTMENT OF CIVIL ENGINEERING
MATERIALS LABORATORY
Job Name: Date:
Material: Tested By:
Source:
WET and DRY SIEVE ANALYSIS
Sieve Size
(U.S. Std.)
Sieve Size
(mm)
Sieve + Agg
Weight
Sieve
Weight
Individual
Weight Ret.
Cum. Wt.
Retained
Cum.
% Ret.
%
Passing
Reported
% Passing
2 50.0
1-1/2 37.5 0.00 0.00 0.00 100.00 100.0
1 25.0 0.00 0.00 0.00 100.00 100.0
3/4 19.0 0.00 0.00 0.00 100.00 100.0
1/2 12.5 636.20 526.40 109.80 109.80 5.65 94.35 94.3
3/8 9.5 807.30 527.90 279.40 389.20 20.04 79.96 80.0
#4 4.750 1134.60 494.10 640.50 1029.70 53.03 46.97 47.0
#8 2.360 782.60 474.40 308.20 1337.90 68.90 31.10 31.1
#16 1.180 611.90 416.40 195.50 1533.40 78.96 21.04 21.0
#30 0.600 478.10 378.20 99.90 1633.30 84.11 15.89 15.9
#40 0.425 391.70 359.70 32.00 1665.30 85.76 14.24 14.2
#50 0.300 377.00 351.10 25.90 1691.20 87.09 12.91 12.9
#100 0.150 387.00 336.20 50.80 1742.00 89.71 10.29 10.3
#200 0.075 382.70 326.10 56.60 1798.60 92.62 7.38 7.38
Pan Pan 383.20 365.90 17.30 1815.90
A) Weight of Original Sample, g AHTD Dust Proportion
B) Weight after Wash, g
C) Wash Loss, g (A-B) Fineness Modulus
D) Minus #200 From Sieve, g
Total Minus #200, g (C+D) Acceptance Check
Wash Loss 6.49 %
17.30
143.30 1.0000
Station 3 - 12E
1941.90 0.52
1815.90
126.00 4.818
Gregg Street Annette
SIEVE ANALYSIS OF COARSE AND FINE AGGREGATE(AASHTO T-11 and AASHTO T-27)
TRC 0801 4/1/2008
130
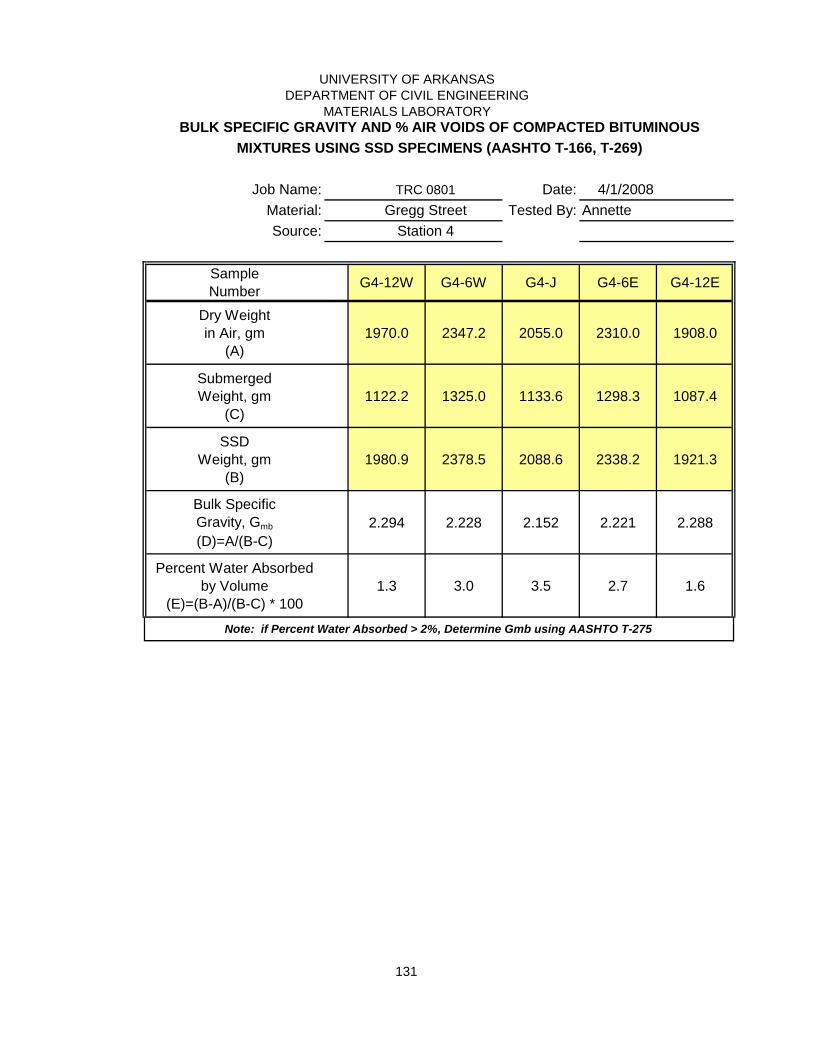
UNIVERSITY OF ARKANSAS
DEPARTMENT OF CIVIL ENGINEERING
MATERIALS LABORATORY
BULK SPECIFIC GRAVITY AND % AIR VOIDS OF COMPACTED BITUMINOUS
MIXTURES USING SSD SPECIMENS (AASHTO T-166, T-269)
Job Name: TRC 0801 Date: 4/1/2008
Material: Tested By: Annette
Source: Station 4
Sample
NumberG4-12W G4-6W G4-J G4-6E G4-12E
Dry Weight
in Air, gm
(A)
1970.0 2347.2 2055.0 2310.0 1908.0
Submerged
Weight, gm
(C)
1122.2 1325.0 1133.6 1298.3 1087.4
SSD
Weight, gm
(B)
1980.9 2378.5 2088.6 2338.2 1921.3
Bulk Specific
Gravity, Gmb
(D)=A/(B-C)
2.294 2.228 2.152 2.221 2.288
Percent Water Absorbed
by Volume
(E)=(B-A)/(B-C) * 100
1.3 3.0 3.5 2.7 1.6
Note: if Percent Water Absorbed > 2%, Determine Gmb using AASHTO T-275
Gregg Street
131

UNIVERSITY OF ARKANSAS
DEPARTMENT OF CIVIL ENGINEERING
ASPHALT LABORATORY
BULK SPECIFIC GRAVITY BY THE CORELOK METHOD
Project: Date:
Source: Tested By:
Sample
NumberG4-12W G4-6W G4-J G4-6E G4-12E
Wt. of Dry Core in Air before
testing, g
(A)
1970.1 2347.2 2055.9 2310.1 1908.2
Wt. of Sealed Core in Air, g
(B)2020.9 2398.5 2106.4 2361.1 1958.9
Wt of Sealed Core in Water, g
(C )1094.6 1259.6 1069.8 1248.8 1054.7
Wt. of Dry Core in Air after testing,
g
(D)
1970.0 2347.2 2055.0 2310.0 1908.0
Bag Weight
E = (B - A)50.8 51.3 50.5 51.0 50.7
Bag Ratio
F = A / E38.781 45.754 40.711 45.296 37.637
Large Bag Volume Correction
(-0.00166*F+0.8596)
(G)
0.795 0.784 0.792 0.784 0.797
Total Volume
H = (E + D) - C926.2 1138.9 1035.7 1112.2 904.0
Bag Volume
I = E / G63.9 65.5 63.8 65.0 63.6
Sample Volume
J = H - I862.3 1073.4 971.9 1047.2 840.4
Bulk Specific Gravity (G mb )
K = A / J2.285 2.187 2.115 2.206 2.271
Check: % wt. change
(must be -0.08% to +0.04%)0.01% 0.00% 0.04% 0.00% 0.01%
TRC 0801 4/1/2008
Gregg Street - Station 4 Annette
132

UNIVERSITY OF ARKANSAS
DEPARTMENT OF CIVIL ENGINEERING
ASPHALT LABORATORY
Job Name: Date:
Material: Tested By:
Source: Station 4
Sample
NumberG4-12W G4-6W G4-J G4-6E G4-12E
Dry Weight
in Air, gm 1970.0 2347.2 2055.0 2310.0 1908.0
Sample
Volume, cc856 1058 926 1029 834
Bulk Specific
Gravity, Gmb2.299 2.218 2.218 2.244 2.287
4/1/2008
Annette
TRC 0801
Gregg Street
KUSS Gmb
133

UNIVERSITY OF ARKANSAS
DEPARTMENT OF CIVIL ENGINEERING
ASPHALT LABORATORYLABORATORY PERMEABILITY BY THE KAROL-WARNER METHOD
Project: Date:
Source: Tested By:
Sample
NumberG4-12W G4-6W G4-J G4-6E G4-12E
Standpipe inside dia., cm 3.175 3.175 3.175 3.175 3.175
Standpipe area, cm2 7.917304 7.917304 7.917304 7.917304 7.917304
Specimen height, mm 51.23 62.18 56.26 60.24 47.30
Specimen height, mm 49.61 61.69 61.36 60.59 48.03
Specimen height, mm 50.78 60.22 56.38 59.60 48.81
Specimen height, mm 50.34 62.14 53.79 60.37 76.76
Average specimen height, cm 5.049 6.156 5.695 6.020 5.523
Specimen diameter, mm 151.47 152.50 151.93 152.32 152.11
Specimen diameter, mm 151.22 153.53 151.76 152.22 153.52
Specimen diameter, mm 151.26 152.83 151.32 151.67 152.02
Specimen diameter, mm 151.20 152.91 151.91 151.92 151.89
Average specimen diameter, cm 15.129 15.294 15.173 15.203 15.239
Specimen Area, cm2 179.761 183.716 180.814 181.536 182.379
Time, initial (min.) 0.0 0.0 0.0 0.0 0.0
Ht. @ Time, initial 60.5 60.0 58.5 62.5 61.6
Time, final (min.) 15.0 7.4 15.0 15.0 15.0
Ht @ Time, final 60.5 0.0 26.8 61.1 59.1
Permeability 1 (k x 10-5
) 0.00 93.74 15.47 0.53 0.88
Time, initial (min.) 15.0 0.0 0.0 15.0 15.0
Ht. @ Time, initial 60.5 56.0 58.5 61.1 59.1
Time, final (min.) 30.0 7.5 15.0 30.0 30.0
Ht @ Time, final 60.5 0.0 27.8 59.8 57.1
Permeability 2 (k x 10-5
) 0.00 90.15 14.82 0.50 0.72
Average Permeability (k x 10-5
) 0.00 91.94 15.14 0.51 0.80
Water Temp, F 71.0 68.0 71.0 71.0 71.0
Water Temp, C 21.7 20.0 21.7 21.7 21.7
RT Factor 0.9602 1.0000 0.9602 0.9602 0.9602
PERMEABILITY (k x 10-5) 0.00 91.94 14.54 0.49 0.77
REP #2
TRC 0801 4/1/2008
Gregg Street - Station 4 Annette
REP #1
134
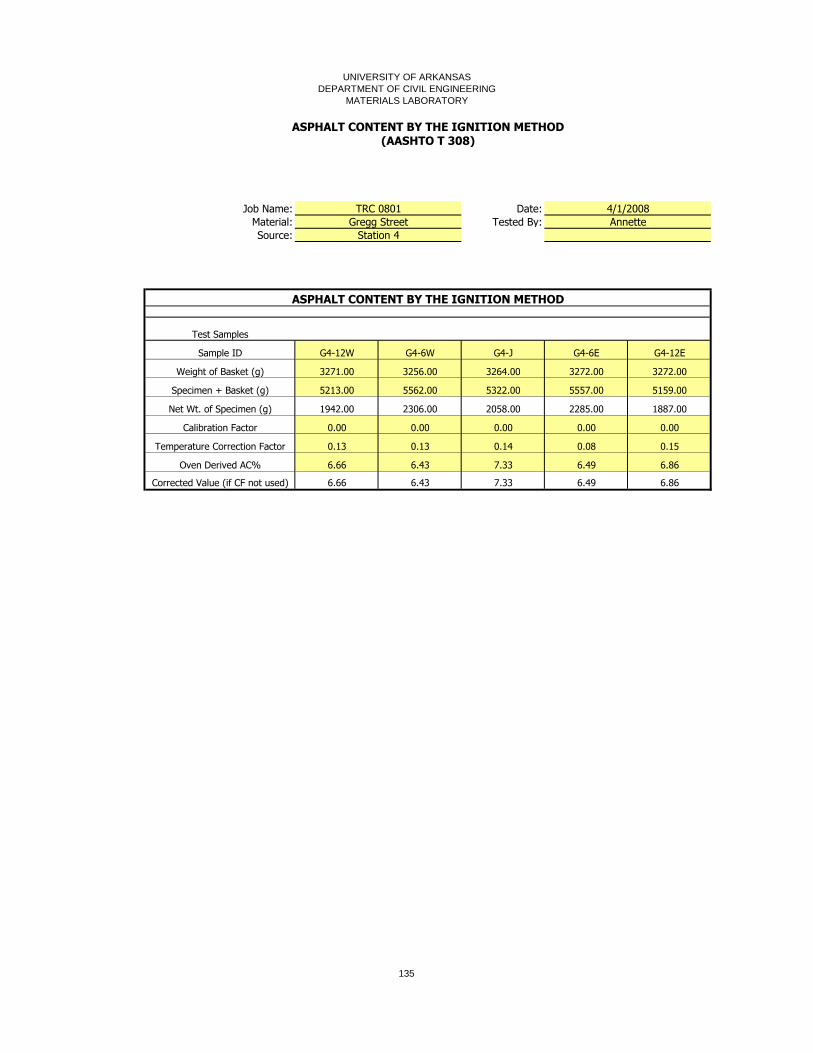
UNIVERSITY OF ARKANSAS
DEPARTMENT OF CIVIL ENGINEERING
MATERIALS LABORATORY
Job Name: Date:
Material: Tested By:
Source:
ASPHALT CONTENT BY THE IGNITION METHOD
Test Samples
Sample ID G4-12W G4-6W G4-J G4-6E G4-12E
Weight of Basket (g) 3271.00 3256.00 3264.00 3272.00 3272.00
Specimen + Basket (g) 5213.00 5562.00 5322.00 5557.00 5159.00
Net Wt. of Specimen (g) 1942.00 2306.00 2058.00 2285.00 1887.00
Calibration Factor 0.00 0.00 0.00 0.00 0.00
Temperature Correction Factor 0.13 0.13 0.14 0.08 0.15
Oven Derived AC% 6.66 6.43 7.33 6.49 6.86
Corrected Value (if CF not used) 6.66 6.43 7.33 6.49 6.86
Gregg Street Annette
Station 4
ASPHALT CONTENT BY THE IGNITION METHOD(AASHTO T 308)
TRC 0801 4/1/2008
135

UNIVERSITY OF ARKANSAS
DEPARTMENT OF CIVIL ENGINEERING
MATERIALS LABORATORY
Job Name: Date:
Material: Tested By:
Source:
WET and DRY SIEVE ANALYSIS
Sieve Size
(U.S. Std.)
Sieve Size
(mm)
Sieve + Agg
Weight
Sieve
Weight
Individual
Weight Ret.
Cum. Wt.
Retained
Cum.
% Ret.
%
Passing
Reported
% Passing
2 50.0
1-1/2 37.5 0.00 0.00 0.00 100.00 100.0
1 25.0 0.00 0.00 0.00 100.00 100.0
3/4 19.0 0.00 0.00 0.00 100.00 100.0
1/2 12.5 691.60 526.40 165.20 165.20 9.13 90.87 90.9
3/8 9.5 694.90 528.00 166.90 332.10 18.35 81.65 81.7
#4 4.750 1073.10 494.00 579.10 911.20 50.34 49.66 49.7
#8 2.360 797.80 473.50 324.30 1235.50 68.26 31.74 31.7
#16 1.180 593.90 415.60 178.30 1413.80 78.11 21.89 21.9
#30 0.600 476.10 377.90 98.20 1512.00 83.54 16.46 16.5
#40 0.425 391.20 359.70 31.50 1543.50 85.28 14.72 14.7
#50 0.300 376.30 351.00 25.30 1568.80 86.67 13.33 13.3
#100 0.150 384.50 336.10 48.40 1617.20 89.35 10.65 10.7
#200 0.075 379.80 326.10 53.70 1670.90 92.31 7.69 7.69
Pan Pan 381.20 366.00 15.20 1686.10
A) Weight of Original Sample, g AHTD Dust Proportion
B) Weight after Wash, g
C) Wash Loss, g (A-B) Fineness Modulus
D) Minus #200 From Sieve, g
Total Minus #200, g (C+D) Acceptance Check
Wash Loss 6.85 %
Gregg Street Annette
SIEVE ANALYSIS OF COARSE AND FINE AGGREGATE(AASHTO T-11 and AASHTO T-27)
TRC 0801 4/1/2008
15.20
139.10 1.0000
Station 4 - 12W
1810.00 0.52
1686.10
123.90 4.746
136

UNIVERSITY OF ARKANSAS
DEPARTMENT OF CIVIL ENGINEERING
MATERIALS LABORATORY
Job Name: Date:
Material: Tested By:
Source:
WET and DRY SIEVE ANALYSIS
Sieve Size
(U.S. Std.)
Sieve Size
(mm)
Sieve + Agg
Weight
Sieve
Weight
Individual
Weight Ret.
Cum. Wt.
Retained
Cum.
% Ret.
%
Passing
Reported
% Passing
2 50.0
1-1/2 37.5 0.00 0.00 0.00 100.00 100.0
1 25.0 0.00 0.00 0.00 100.00 100.0
3/4 19.0 0.00 0.00 0.00 100.00 100.0
1/2 12.5 755.80 526.50 229.30 229.30 10.64 89.36 89.4
3/8 9.5 778.50 528.10 250.40 479.70 22.27 77.73 77.7
#4 4.750 1165.30 494.00 671.30 1151.00 53.42 46.58 46.6
#8 2.360 846.10 465.50 380.60 1531.60 71.09 28.91 28.9
#16 1.180 607.80 414.50 193.30 1724.90 80.06 19.94 19.9
#30 0.600 485.10 377.80 107.30 1832.20 85.04 14.96 15.0
#40 0.425 393.40 358.50 34.90 1867.10 86.66 13.34 13.3
#50 0.300 378.40 351.00 27.40 1894.50 87.93 12.07 12.1
#100 0.150 386.80 336.00 50.80 1945.30 90.29 9.71 9.7
#200 0.075 383.70 325.80 57.90 2003.20 92.98 7.02 7.02
Pan Pan 379.50 366.00 13.50 2016.70
A) Weight of Original Sample, g AHTD Dust Proportion
B) Weight after Wash, g
C) Wash Loss, g (A-B) Fineness Modulus
D) Minus #200 From Sieve, g
Total Minus #200, g (C+D) Acceptance Check
Wash Loss 6.40 %
Gregg Street Annette
SIEVE ANALYSIS OF COARSE AND FINE AGGREGATE(AASHTO T-11 and AASHTO T-27)
TRC 0801 4/1/2008
13.50
151.30 1.0000
Station 4 - 6W
2154.50 0.53
2016.70
137.80 4.901
137

UNIVERSITY OF ARKANSAS
DEPARTMENT OF CIVIL ENGINEERING
MATERIALS LABORATORY
Job Name: Date:
Material: Tested By:
Source:
WET and DRY SIEVE ANALYSIS
Sieve Size
(U.S. Std.)
Sieve Size
(mm)
Sieve + Agg
Weight
Sieve
Weight
Individual
Weight Ret.
Cum. Wt.
Retained
Cum.
% Ret.
%
Passing
Reported
% Passing
2 50.0
1-1/2 37.5 0.00 0.00 0.00 100.00 100.0
1 25.0 0.00 0.00 0.00 100.00 100.0
3/4 19.0 0.00 0.00 0.00 100.00 100.0
1/2 12.5 674.10 526.40 147.70 147.70 7.76 92.24 92.2
3/8 9.5 762.00 528.00 234.00 381.70 20.05 79.95 80.0
#4 4.750 1142.80 494.40 648.40 1030.10 54.10 45.90 45.9
#8 2.360 782.60 473.70 308.90 1339.00 70.32 29.68 29.7
#16 1.180 586.30 415.80 170.50 1509.50 79.28 20.72 20.7
#30 0.600 472.40 377.90 94.50 1604.00 84.24 15.76 15.8
#40 0.425 390.80 359.70 31.10 1635.10 85.87 14.13 14.1
#50 0.300 376.20 351.00 25.20 1660.30 87.20 12.80 12.8
#100 0.150 382.70 336.10 46.60 1706.90 89.64 10.36 10.4
#200 0.075 376.60 326.10 50.50 1757.40 92.30 7.70 7.70
Pan Pan 379.20 366.00 13.20 1770.60
A) Weight of Original Sample, g AHTD Dust Proportion
B) Weight after Wash, g
C) Wash Loss, g (A-B) Fineness Modulus
D) Minus #200 From Sieve, g
Total Minus #200, g (C+D) Acceptance Check
Wash Loss 7.01 %
Gregg Street Annette
SIEVE ANALYSIS OF COARSE AND FINE AGGREGATE(AASHTO T-11 and AASHTO T-27)
TRC 0801 4/1/2008
13.20
146.70 1.0000
Station 4 - J
1904.10 0.55
1770.60
133.50 4.848
138

UNIVERSITY OF ARKANSAS
DEPARTMENT OF CIVIL ENGINEERING
MATERIALS LABORATORY
Job Name: Date:
Material: Tested By:
Source:
WET and DRY SIEVE ANALYSIS
Sieve Size
(U.S. Std.)
Sieve Size
(mm)
Sieve + Agg
Weight
Sieve
Weight
Individual
Weight Ret.
Cum. Wt.
Retained
Cum.
% Ret.
%
Passing
Reported
% Passing
2 50.0
1-1/2 37.5 0.00 0.00 0.00 100.00 100.0
1 25.0 0.00 0.00 0.00 100.00 100.0
3/4 19.0 0.00 0.00 0.00 100.00 100.0
1/2 12.5 691.50 526.40 165.10 165.10 7.73 92.27 92.3
3/8 9.5 811.60 527.90 283.70 448.80 21.02 78.98 79.0
#4 4.750 1187.20 494.20 693.00 1141.80 53.49 46.51 46.5
#8 2.360 821.10 473.50 347.60 1489.40 69.77 30.23 30.2
#16 1.180 620.10 415.70 204.40 1693.80 79.34 20.66 20.7
#30 0.600 486.30 378.00 108.30 1802.10 84.42 15.58 15.6
#40 0.425 394.70 359.80 34.90 1837.00 86.05 13.95 13.9
#50 0.300 379.60 351.00 28.60 1865.60 87.39 12.61 12.6
#100 0.150 390.00 336.10 53.90 1919.50 89.91 10.09 10.1
#200 0.075 386.00 326.10 59.90 1979.40 92.72 7.28 7.28
Pan Pan 385.30 366.00 19.30 1998.70
A) Weight of Original Sample, g AHTD Dust Proportion
B) Weight after Wash, g
C) Wash Loss, g (A-B) Fineness Modulus
D) Minus #200 From Sieve, g
Total Minus #200, g (C+D) Acceptance Check
Wash Loss 6.38 %
Gregg Street Annette
SIEVE ANALYSIS OF COARSE AND FINE AGGREGATE(AASHTO T-11 and AASHTO T-27)
TRC 0801 4/1/2008
19.30
155.40 1.0000
Station 4 - 6E
2134.80 0.52
1998.70
136.10 4.853
139

UNIVERSITY OF ARKANSAS
DEPARTMENT OF CIVIL ENGINEERING
MATERIALS LABORATORY
Job Name: Date:
Material: Tested By:
Source:
WET and DRY SIEVE ANALYSIS
Sieve Size
(U.S. Std.)
Sieve Size
(mm)
Sieve + Agg
Weight
Sieve
Weight
Individual
Weight Ret.
Cum. Wt.
Retained
Cum.
% Ret.
%
Passing
Reported
% Passing
2 50.0
1-1/2 37.5 0.00 0.00 0.00 100.00 100.0
1 25.0 0.00 0.00 0.00 100.00 100.0
3/4 19.0 0.00 0.00 0.00 100.00 100.0
1/2 12.5 639.60 526.40 113.20 113.20 6.45 93.55 93.5
3/8 9.5 733.20 528.00 205.20 318.40 18.15 81.85 81.9
#4 4.750 1083.20 494.10 589.10 907.50 51.72 48.28 48.3
#8 2.360 773.80 473.60 300.20 1207.70 68.83 31.17 31.2
#16 1.180 590.80 416.20 174.60 1382.30 78.78 21.22 21.2
#30 0.600 468.70 378.10 90.60 1472.90 83.95 16.05 16.1
#40 0.425 389.10 359.80 29.30 1502.20 85.61 14.39 14.4
#50 0.300 374.80 351.40 23.40 1525.60 86.95 13.05 13.1
#100 0.150 381.20 336.10 45.10 1570.70 89.52 10.48 10.5
#200 0.075 377.00 326.10 50.90 1621.60 92.42 7.58 7.58
Pan Pan 382.70 365.90 16.80 1638.40
A) Weight of Original Sample, g AHTD Dust Proportion
B) Weight after Wash, g
C) Wash Loss, g (A-B) Fineness Modulus
D) Minus #200 From Sieve, g
Total Minus #200, g (C+D) Acceptance Check
Wash Loss 6.62 %
Gregg Street Annette
SIEVE ANALYSIS OF COARSE AND FINE AGGREGATE(AASHTO T-11 and AASHTO T-27)
TRC 0801 4/1/2008
16.80
133.00 1.0000
Station 4 - 12E
1754.60 0.53
1638.40
116.20 4.779
140

UNIVERSITY OF ARKANSAS
DEPARTMENT OF CIVIL ENGINEERING
MATERIALS LABORATORY
BULK SPECIFIC GRAVITY AND % AIR VOIDS OF COMPACTED BITUMINOUS
MIXTURES USING SSD SPECIMENS (AASHTO T-166, T-269)
Job Name: TRC 0801 Date: 4/1/2008
Material: Tested By: Annette
Source: Station 1
Sample
NumberR1-12W R1-6W R1-J R1-6E R1-12E
Dry Weight
in Air, gm
(A)
1577.8 1622.3 1510.2 1548.6 1751.2
Submerged
Weight, gm
(C)
897.0 919.2 856.4 874.0 986.8
SSD
Weight, gm
(B)
1593.9 1645.2 1578.7 1604.3 1809.7
Bulk Specific
Gravity, Gmb
(D)=A/(B-C)
2.264 2.235 2.091 2.120 2.128
Percent Water Absorbed
by Volume
(E)=(B-A)/(B-C) * 100
2.3 3.2 9.5 7.6 7.1
Note: if Percent Water Absorbed > 2%, Determine Gmb using AASHTO T-275
Russellville - Hwy. 7
141

UNIVERSITY OF ARKANSAS
DEPARTMENT OF CIVIL ENGINEERING
ASPHALT LABORATORY
BULK SPECIFIC GRAVITY BY THE CORELOK METHOD
Project: Date:
Source: Tested By:
Sample
NumberR1-12W R1-6W R1-J R1-6E R1-12E
Wt. of Dry Core in Air before
testing, g
(A)
1578.5 1623.6 1510.2 1549.8 1753.5
Wt. of Sealed Core in Air, g
(B)1629.4 1673.7 1561.4 1599.8 1802.3
Wt of Sealed Core in Water, g
(C )867.7 881.9 755.2 790.5 908.9
Wt. of Dry Core in Air after testing,
g
(D)
1577.8 1622.3 1510.2 1548.6 1751.2
Bag Weight
E = (B - A)50.9 50.1 51.2 50.0 48.8
Bag Ratio
F = A / E31.012 32.407 29.496 30.996 35.932
Large Bag Volume Correction
(-0.00166*F+0.8596)
(G)
0.808 0.806 0.811 0.808 0.800
Total Volume
H = (E + D) - C761.0 790.5 806.2 808.1 891.1
Bag Volume
I = E / G63.0 62.2 63.2 61.9 61.0
Sample Volume
J = H - I698.0 728.3 743.0 746.2 830.1
Bulk Specific Gravity (G mb )
K = A / J2.261 2.229 2.032 2.077 2.112
0.04% 0.08% 0.00% 0.08% 0.13%
Check: % wt. change
(must be -0.08% to +0.04%)
TRC 0801 4/1/2008
Russellville - Hwy. 7 - Station 1 Annette
142

UNIVERSITY OF ARKANSAS
DEPARTMENT OF CIVIL ENGINEERING
ASPHALT LABORATORY
Job Name: Date:
Material: Tested By:
Source:
Sample
NumberR1-12W R1-6W R1-J R1-6E R1-12E
Dry Weight
in Air, gm 1802.3 1622.3 1510.2 1548.6 1751.2
Sample
Volume, cc688 708 665 677 773
Bulk Specific
Gravity, Gmb2.617 2.289 2.270 2.287 2.263
KUSS Gmb
4/1/2008
Annette
TRC 0801
Russellville - Hwy. 7
Station 1
143

UNIVERSITY OF ARKANSAS
DEPARTMENT OF CIVIL ENGINEERING
ASPHALT LABORATORY
LABORATORY PERMEABILITY BY THE KAROL-WARNER METHOD
Project: Date:
Source: Tested By:
Sample
NumberR1-J R1-6E R1-12E
Standpipe inside dia., cm 3.175 3.175 3.175 3.175 3.175 3.175 3.175
Standpipe area, cm2 7.917304 7.917304 7.917304 7.917304 7.917304 7.917304 7.917304
Specimen height, mm 40.65 40.65 41.05 41.05 44.07 40.29 45.43
Specimen height, mm 39.02 39.02 41.01 41.01 42.92 40.43 45.56
Specimen height, mm 37.37 37.37 41.11 41.11 42.56 41.62 48.94
Specimen height, mm 39.28 39.28 41.58 41.58 43.21 40.59 49.78
Average specimen height, cm 3.908 3.908 4.119 4.119 4.319 4.073 4.743
Specimen diameter, mm 150.86 150.86 150.80 150.80 151.32 150.59 150.97
Specimen diameter, mm 150.31 150.31 150.91 150.91 152.13 150.49 150.52
Specimen diameter, mm 150.48 150.48 148.86 148.86 151.54 150.99 150.78
Specimen diameter, mm 150.11 150.11 150.48 150.48 150.40 149.43 150.76
Average specimen diameter, cm 15.044 15.044 15.026 15.026 15.135 15.038 15.076
Specimen Area, cm2 177.753 177.753 177.334 177.334 179.904 177.599 178.504
Time, initial (min.) 0.0 0.0 0.0 0.0 0.0 0.0 0.0
Ht. @ Time, initial 59.0 59.0 59.0 59.0 59.0 59.0 59.0
Time, final (min.) 15.4 29.3 15.1 26.5 4.1 11.4 16.7
Ht @ Time, final 48.0 42.0 47.0 41.0 0.0 0.0 0.0
Permeability 1 (k x 10-5
) 3.00 2.56 3.56 3.19 120.16 41.42 32.88
Time, initial (min.) 0.0 0.0 0.0 0.0 0.0 0.0 0.0
Ht. @ Time, initial 59.0 59.0 59.0 59.0 59.0 59.0 59.0
Time, final (min.) 18.2 34.4 17.3 28.9 4.2 11.7 15.5
Ht @ Time, final 48.0 42.0 47.0 41.0 0.0 0.0 0.0
Permeability 2 (k x 10-5
) 2.54 2.18 3.10 2.93 116.87 40.34 35.47
Average Permeability (k x 10-5
) 2.77 2.37 3.33 3.06 118.51 40.88 34.17
Water Temp, F 68.0 68.0 68.0 68.0 68.0 68.0 68.0
Water Temp, C 20.0 20.0 20.0 20.0 20.0 20.0 20.0
RT Factor 1.0000 1.0000 1.0000 1.0000 1.0000 1.0000 1.0000
PERMEABILITY (k x 10-5) 2.77 2.37 3.33 3.06 118.51 40.88 34.17
PERMEABILITY (k x 10-5) 118.51 40.88 34.17
REP #2
R1-12W
2.57
R1-6W
3.20
TRC 0801
Russelville - Hwy. 7 - Station 1
Started 5/27/2008
Leela
REP #1
9/14/2010 144 R1, pages 141-150.xls

UNIVERSITY OF ARKANSAS
DEPARTMENT OF CIVIL ENGINEERING
MATERIALS LABORATORY
Job Name: Date:
Material: Tested By:
Source:
ASPHALT CONTENT BY THE IGNITION METHOD
Test Samples
Sample ID R1-12W R1-6W R1-J R1-6E R1-12E
Weight of Basket (g) 3264.30 3266.90 3273.30 3267.70
Specimen + Basket (g) 4842.60 4888.40 4783.00 4823.10
Net Wt. of Specimen (g) 1578.30 1621.50 1509.70 1555.40
Calibration Factor 0.00 0.00 0.00 0.00
Temperature Correction Factor 0.19 0.17 0.37 0.19
Oven Derived AC% 6.87 7.00 6.74 7.05
Corrected Value (if CF not used) 6.87 7.00 6.74 7.05
ASPHALT CONTENT BY THE IGNITION METHOD(AASHTO T 308)
TRC 0801 6/1/2008
Russellville - Hwy. 7 Ashly
Station 1
145

UNIVERSITY OF ARKANSAS
DEPARTMENT OF CIVIL ENGINEERING
MATERIALS LABORATORY
Job Name: Date:
Material: Tested By:
Source:
WET and DRY SIEVE ANALYSIS
Sieve Size
(U.S. Std.)
Sieve Size
(mm)
Sieve + Agg
Weight
Sieve
Weight
Individual
Weight Ret.
Cum. Wt.
Retained
Cum.
% Ret.
%
Passing
Reported
% Passing
2 50.0
1-1/2 37.5 0.00 0.00 0.00 100.00 100.0
1 25.0 0.00 0.00 0.00 100.00 100.0
3/4 19.0 559.00 551.70 7.30 7.30 0.50 99.50 99.5
1/2 12.5 598.20 527.50 70.70 78.00 5.32 94.68 94.7
3/8 9.5 661.10 521.10 140.00 218.00 14.87 85.13 85.1
#4 4.750 969.50 507.30 462.20 680.20 46.40 53.60 53.6
#8 2.360 723.00 469.10 253.90 934.10 63.72 36.28 36.3
#16 1.180 587.60 453.50 134.10 1068.20 72.87 27.13 27.1
#30 0.600 466.20 389.50 76.70 1144.90 78.10 21.90 21.9
#40 0.425 0.00 1144.90 78.10 21.90 21.9
#50 0.300 434.70 360.40 74.30 1219.20 83.17 16.83 16.8
#100 0.150 430.00 343.60 86.40 1305.60 89.06 10.94 10.9
#200 0.075 350.70 322.50 28.20 1333.80 90.99 9.01 9.01
Pan Pan 426.60 370.10 56.50 1390.30
A) Weight of Original Sample, g AHTD Dust Proportion
B) Weight after Wash, g
C) Wash Loss, g (A-B) Fineness Modulus
D) Minus #200 From Sieve, g
Total Minus #200, g (C+D) Acceptance Check
Wash Loss 4.99 %
73.20 4.487
SIEVE ANALYSIS OF COARSE AND FINE AGGREGATE(AASHTO T-11 and AASHTO T-27)
TRC 0801 6/1/2008
Russellville - Hwy. 7 Ashly
56.50
129.70 0.9983
Station 1 - 12W
1465.90 0.41
1392.70
146

UNIVERSITY OF ARKANSAS
DEPARTMENT OF CIVIL ENGINEERING
MATERIALS LABORATORY
Job Name: Date:
Material: Tested By:
Source:
WET and DRY SIEVE ANALYSIS
Sieve Size
(U.S. Std.)
Sieve Size
(mm)
Sieve + Agg
Weight
Sieve
Weight
Individual
Weight Ret.
Cum. Wt.
Retained
Cum.
% Ret.
%
Passing
Reported
% Passing
2 50.0
1-1/2 37.5 0.00 0.00 0.00 100.00 100.0
1 25.0 0.00 0.00 0.00 100.00 100.0
3/4 19.0 572.80 560.10 12.70 12.70 0.84 99.16 99.2
1/2 12.5 571.50 523.10 48.40 61.10 4.06 95.94 95.9
3/8 9.5 713.20 549.10 164.10 225.20 14.98 85.02 85.0
#4 4.750 960.90 505.90 455.00 680.20 45.25 54.75 54.7
#8 2.360 691.30 441.00 250.30 930.50 61.90 38.10 38.1
#16 1.180 590.60 442.60 148.00 1078.50 71.75 28.25 28.3
#30 0.600 457.70 377.40 80.30 1158.80 77.09 22.91 22.9
#40 0.425 0.00 1158.80 77.09 22.91 22.9
#50 0.300 446.80 367.20 79.60 1238.40 82.38 17.62 17.6
#100 0.150 433.20 339.20 94.00 1332.40 88.64 11.36 11.4
#200 0.075 393.30 325.80 67.50 1399.90 93.13 6.87 6.87
Pan Pan 384.70 368.50 16.20 1416.10
A) Weight of Original Sample, g AHTD Dust Proportion
B) Weight after Wash, g
C) Wash Loss, g (A-B) Fineness Modulus
D) Minus #200 From Sieve, g
Total Minus #200, g (C+D) Acceptance Check
Wash Loss 5.26 %
79.10 4.428
SIEVE ANALYSIS OF COARSE AND FINE AGGREGATE(AASHTO T-11 and AASHTO T-27)
TRC 0801 6/1/2008
Russellville - Hwy. 7 Ashly
16.20
95.30 0.9944
Station 1 - 6W
1503.20 0.30
1424.10
147
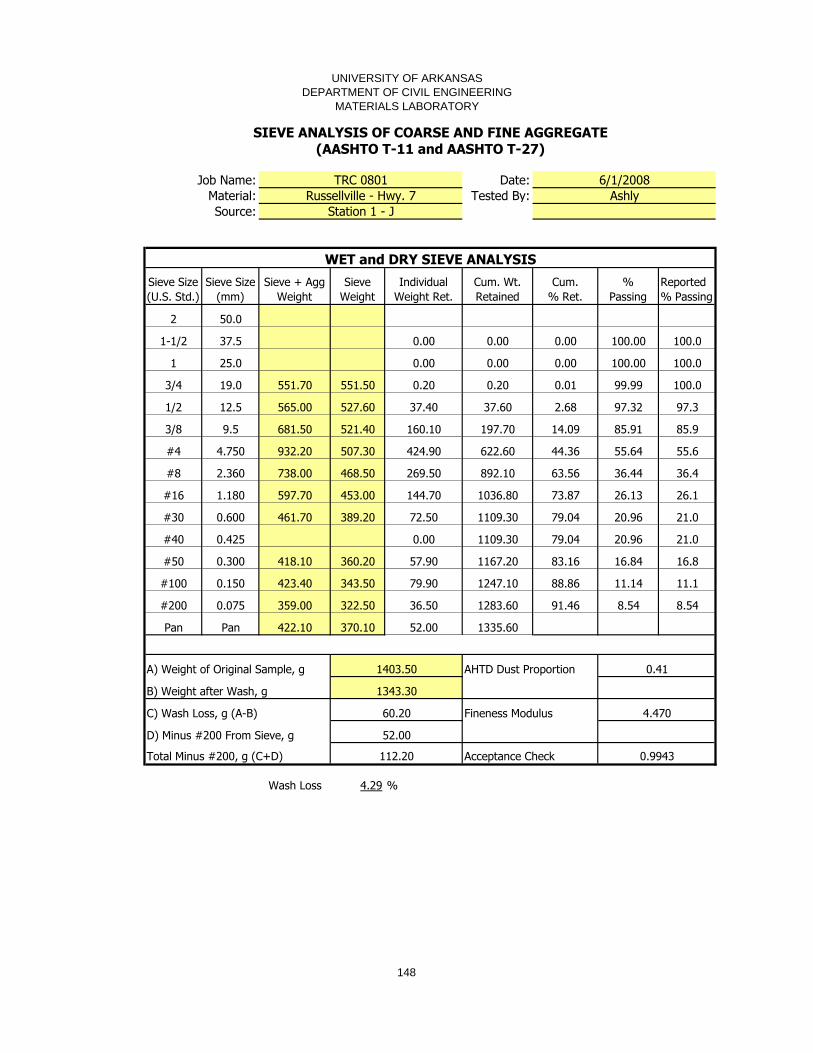
UNIVERSITY OF ARKANSAS
DEPARTMENT OF CIVIL ENGINEERING
MATERIALS LABORATORY
Job Name: Date:
Material: Tested By:
Source:
WET and DRY SIEVE ANALYSIS
Sieve Size
(U.S. Std.)
Sieve Size
(mm)
Sieve + Agg
Weight
Sieve
Weight
Individual
Weight Ret.
Cum. Wt.
Retained
Cum.
% Ret.
%
Passing
Reported
% Passing
2 50.0
1-1/2 37.5 0.00 0.00 0.00 100.00 100.0
1 25.0 0.00 0.00 0.00 100.00 100.0
3/4 19.0 551.70 551.50 0.20 0.20 0.01 99.99 100.0
1/2 12.5 565.00 527.60 37.40 37.60 2.68 97.32 97.3
3/8 9.5 681.50 521.40 160.10 197.70 14.09 85.91 85.9
#4 4.750 932.20 507.30 424.90 622.60 44.36 55.64 55.6
#8 2.360 738.00 468.50 269.50 892.10 63.56 36.44 36.4
#16 1.180 597.70 453.00 144.70 1036.80 73.87 26.13 26.1
#30 0.600 461.70 389.20 72.50 1109.30 79.04 20.96 21.0
#40 0.425 0.00 1109.30 79.04 20.96 21.0
#50 0.300 418.10 360.20 57.90 1167.20 83.16 16.84 16.8
#100 0.150 423.40 343.50 79.90 1247.10 88.86 11.14 11.1
#200 0.075 359.00 322.50 36.50 1283.60 91.46 8.54 8.54
Pan Pan 422.10 370.10 52.00 1335.60
A) Weight of Original Sample, g AHTD Dust Proportion
B) Weight after Wash, g
C) Wash Loss, g (A-B) Fineness Modulus
D) Minus #200 From Sieve, g
Total Minus #200, g (C+D) Acceptance Check
Wash Loss 4.29 %
60.20 4.470
SIEVE ANALYSIS OF COARSE AND FINE AGGREGATE(AASHTO T-11 and AASHTO T-27)
TRC 0801 6/1/2008
Russellville - Hwy. 7 Ashly
52.00
112.20 0.9943
Station 1 - J
1403.50 0.41
1343.30
148

UNIVERSITY OF ARKANSAS
DEPARTMENT OF CIVIL ENGINEERING
MATERIALS LABORATORY
Job Name: Date:
Material: Tested By:
Source:
WET and DRY SIEVE ANALYSIS
Sieve Size
(U.S. Std.)
Sieve Size
(mm)
Sieve + Agg
Weight
Sieve
Weight
Individual
Weight Ret.
Cum. Wt.
Retained
Cum.
% Ret.
%
Passing
Reported
% Passing
2 50.0
1-1/2 37.5 0.00 0.00 0.00 100.00 100.0
1 25.0 0.00 0.00 0.00 100.00 100.0
3/4 19.0 551.40 551.30 0.10 0.10 0.01 99.99 100.0
1/2 12.5 606.00 527.50 78.50 78.60 5.46 94.54 94.5
3/8 9.5 675.40 520.10 155.30 233.90 16.25 83.75 83.8
#4 4.750 965.00 505.80 459.20 693.10 48.15 51.85 51.8
#8 2.360 726.30 468.40 257.90 951.00 66.07 33.93 33.9
#16 1.180 595.30 453.40 141.90 1092.90 75.93 24.07 24.1
#30 0.600 456.10 389.50 66.60 1159.50 80.55 19.45 19.4
#40 0.425 0.00 1159.50 80.55 19.45 19.4
#50 0.300 404.30 360.50 43.80 1203.30 83.60 16.40 16.4
#100 0.150 418.10 343.60 74.50 1277.80 88.77 11.23 11.2
#200 0.075 359.00 322.30 36.70 1314.50 91.32 8.68 8.68
Pan Pan 419.70 369.80 49.90 1364.40
A) Weight of Original Sample, g AHTD Dust Proportion
B) Weight after Wash, g
C) Wash Loss, g (A-B) Fineness Modulus
D) Minus #200 From Sieve, g
Total Minus #200, g (C+D) Acceptance Check
Wash Loss 5.21 %
75.00 4.593
SIEVE ANALYSIS OF COARSE AND FINE AGGREGATE(AASHTO T-11 and AASHTO T-27)
TRC 0801 6/1/2008
Russellville - Hwy. 7 Ashly
49.90
124.90 1.0000
Station 1 - 6E
1439.40 0.45
1364.40
149

UNIVERSITY OF ARKANSAS
DEPARTMENT OF CIVIL ENGINEERING
MATERIALS LABORATORY
Job Name: Date:
Material: Tested By:
Source:
WET and DRY SIEVE ANALYSIS
Sieve Size
(U.S. Std.)
Sieve Size
(mm)
Sieve + Agg
Weight
Sieve
Weight
Individual
Weight Ret.
Cum. Wt.
Retained
Cum.
% Ret.
%
Passing
Reported
% Passing
2 50.0
1-1/2 37.5 0.00 0.00 0.00 100.00 100.0
1 25.0 0.00 0.00 0.00 100.00 100.0
3/4 19.0 551.40 551.40 0.00 0.00 0.00 100.00 100.0
1/2 12.5 589.30 527.50 61.80 61.80 3.63 96.37 96.4
3/8 9.5 689.30 520.00 169.30 231.10 13.58 86.42 86.4
#4 4.750 1033.80 505.80 528.00 759.10 44.61 55.39 55.4
#8 2.360 799.60 468.50 331.10 1090.20 64.07 35.93 35.9
#16 1.180 670.40 453.50 216.90 1307.10 76.81 23.19 23.2
#30 0.600 492.80 389.50 103.30 1410.40 82.88 17.12 17.1
#40 0.425 0.00 1410.40 82.88 17.12 17.1
#50 0.300 429.90 360.50 69.40 1479.80 86.96 13.04 13.0
#100 0.150 409.10 343.40 65.70 1545.50 90.82 9.18 9.2
#200 0.075 387.40 322.30 65.10 1610.60 94.65 5.35 5.35
Pan Pan 387.30 369.60 17.70 1628.30
A) Weight of Original Sample, g AHTD Dust Proportion
B) Weight after Wash, g
C) Wash Loss, g (A-B) Fineness Modulus
D) Minus #200 From Sieve, g
Total Minus #200, g (C+D) Acceptance Check
Wash Loss 3.79 %
64.50 4.597
SIEVE ANALYSIS OF COARSE AND FINE AGGREGATE(AASHTO T-11 and AASHTO T-27)
TRC 0801 6/1/2008
Russellville - Hwy. 7 Ashly
17.70
82.20 0.9946
Station 1 - 12E
1701.70 0.31
1637.20
150

UNIVERSITY OF ARKANSAS
DEPARTMENT OF CIVIL ENGINEERING
MATERIALS LABORATORY
BULK SPECIFIC GRAVITY AND % AIR VOIDS OF COMPACTED BITUMINOUS
MIXTURES USING SSD SPECIMENS (AASHTO T-166, T-269)
Job Name: TRC 0801 Date: 4/1/2008
Material: Tested By: Annette
Source: Station 2
Sample
NumberR2-12W R2-6W R2-J R2-6E R2-12E
Dry Weight
in Air, gm
(A)
1723.2 1794.1 1602.7 1721.6
Submerged
Weight, gm
(C)
988.1 1017.1 908.7 964.2
SSD
Weight, gm
(B)
1748.2 1816.2 1660.8 1759.3
Bulk Specific
Gravity, Gmb
(D)=A/(B-C)
2.267 2.245 2.131 2.165
Percent Water Absorbed
by Volume
(E)=(B-A)/(B-C) * 100
3.3 2.8 7.7 4.7
Note: if Percent Water Absorbed > 2%, Determine Gmb using AASHTO T-275
Russellville - Hwy. 7
151

UNIVERSITY OF ARKANSAS
DEPARTMENT OF CIVIL ENGINEERING
ASPHALT LABORATORY
BULK SPECIFIC GRAVITY BY THE CORELOK METHOD
Project: Date:
Source: Tested By:
Sample
NumberR2-12W R2-6W R2-J R2-6E R2-12E
Wt. of Dry Core in Air before
testing, g
(A)
1723.4 1793.9 1604.0 1722.7
Wt. of Sealed Core in Air, g
(B)1774.7 1844.9 1654.0 1773.0
Wt of Sealed Core in Water, g
(C )947.9 980.0 826.6 899.9
Wt. of Dry Core in Air after testing,
g
(D)
1723.2 1794.1 1602.7 1721.6
Bag Weight
E = (B - A)51.3 51.0 50.0 50.3
Bag Ratio
F = A / E33.595 35.175 32.080 34.249
Large Bag Volume Correction
(-0.00166*F+0.8596)
(G)
0.804 0.801 0.806 0.803
Total Volume
H = (E + D) - C826.6 865.1 826.1 872.0
Bag Volume
I = E / G63.8 63.7 62.0 62.7
Sample Volume
J = H - I762.8 801.4 764.1 809.3
Bulk Specific Gravity (G mb )
K = A / J2.259 2.238 2.099 2.129
0.01% -0.01% 0.08% 0.06%
Check: % wt. change
(must be -0.08% to +0.04%)
TRC 0801 4/1/2008
Russellville - Hwy. 7 - Station 2 Annette
152
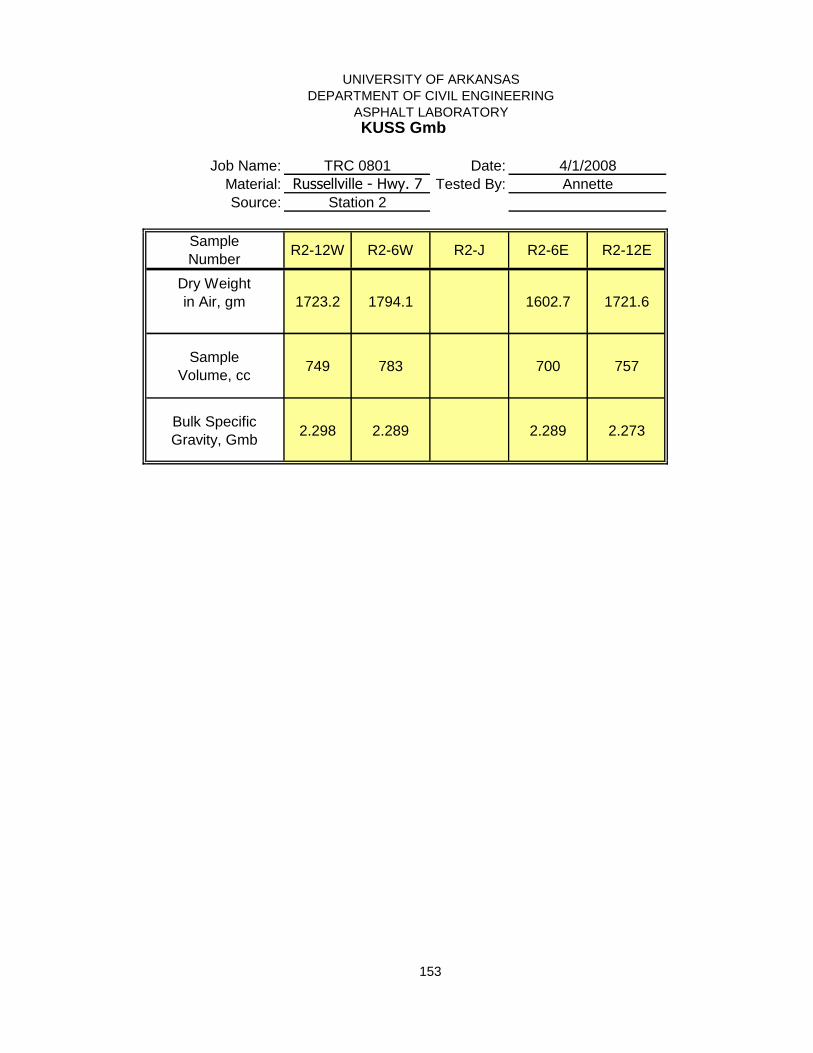
UNIVERSITY OF ARKANSAS
DEPARTMENT OF CIVIL ENGINEERING
ASPHALT LABORATORY
Job Name: Date:
Material: Tested By:
Source:
Sample
NumberR2-12W R2-6W R2-J R2-6E R2-12E
Dry Weight
in Air, gm 1723.2 1794.1 1602.7 1721.6
Sample
Volume, cc749 783 700 757
Bulk Specific
Gravity, Gmb2.298 2.289 2.289 2.273
KUSS Gmb
4/1/2008
Annette
TRC 0801
Russellville - Hwy. 7
Station 2
153
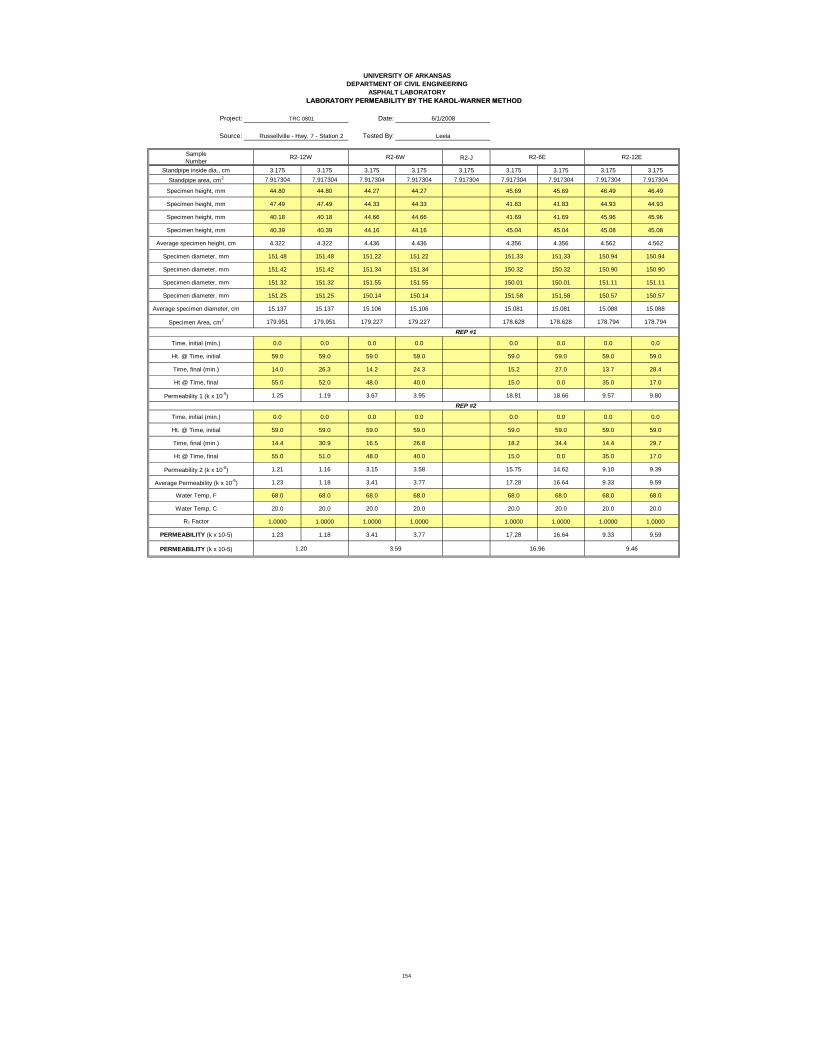
UNIVERSITY OF ARKANSAS
DEPARTMENT OF CIVIL ENGINEERING
ASPHALT LABORATORY
Project: Date:
Source: Tested By:
Sample
NumberR2-J
Standpipe inside dia., cm 3.175 3.175 3.175 3.175 3.175 3.175 3.175 3.175 3.175
Standpipe area, cm2 7.917304 7.917304 7.917304 7.917304 7.917304 7.917304 7.917304 7.917304 7.917304
Specimen height, mm 44.80 44.80 44.27 44.27 45.69 45.69 46.49 46.49
Specimen height, mm 47.49 47.49 44.33 44.33 41.83 41.83 44.93 44.93
Specimen height, mm 40.18 40.18 44.66 44.66 41.69 41.69 45.96 45.96
Specimen height, mm 40.39 40.39 44.16 44.16 45.04 45.04 45.08 45.08
Average specimen height, cm 4.322 4.322 4.436 4.436 4.356 4.356 4.562 4.562
Specimen diameter, mm 151.48 151.48 151.22 151.22 151.33 151.33 150.94 150.94
Specimen diameter, mm 151.42 151.42 151.34 151.34 150.32 150.32 150.90 150.90
Specimen diameter, mm 151.32 151.32 151.55 151.55 150.01 150.01 151.11 151.11
Specimen diameter, mm 151.25 151.25 150.14 150.14 151.58 151.58 150.57 150.57
Average specimen diameter, cm 15.137 15.137 15.106 15.106 15.081 15.081 15.088 15.088
Specimen Area, cm2 179.951 179.951 179.227 179.227 178.628 178.628 178.794 178.794
Time, initial (min.) 0.0 0.0 0.0 0.0 0.0 0.0 0.0 0.0
Ht. @ Time, initial 59.0 59.0 59.0 59.0 59.0 59.0 59.0 59.0
Time, final (min.) 14.0 26.3 14.2 24.3 15.2 27.0 13.7 28.4
Ht @ Time, final 55.0 52.0 48.0 40.0 15.0 0.0 35.0 17.0
Permeability 1 (k x 10-5
) 1.25 1.19 3.67 3.95 18.81 18.66 9.57 9.80
Time, initial (min.) 0.0 0.0 0.0 0.0 0.0 0.0 0.0 0.0
Ht. @ Time, initial 59.0 59.0 59.0 59.0 59.0 59.0 59.0 59.0
Time, final (min.) 14.4 30.9 16.5 26.8 18.2 34.4 14.4 29.7
Ht @ Time, final 55.0 51.0 48.0 40.0 15.0 0.0 35.0 17.0
Permeability 2 (k x 10-5
) 1.21 1.16 3.15 3.58 15.75 14.62 9.10 9.39
Average Permeability (k x 10-5
) 1.23 1.18 3.41 3.77 17.28 16.64 9.33 9.59
Water Temp, F 68.0 68.0 68.0 68.0 68.0 68.0 68.0 68.0
Water Temp, C 20.0 20.0 20.0 20.0 20.0 20.0 20.0 20.0
RT Factor 1.0000 1.0000 1.0000 1.0000 1.0000 1.0000 1.0000 1.0000
PERMEABILITY (k x 10-5) 1.23 1.18 3.41 3.77 17.28 16.64 9.33 9.59
PERMEABILITY (k x 10-5)
LABORATORY PERMEABILITY BY THE KAROL-WARNER METHOD
R2-12E
TRC 0801 6/1/2008
Russellville - Hwy. 7 - Station 2 Leela
R2-6WR2-12W
9.4616.963.591.20
REP #1
REP #2
R2-6E
154

UNIVERSITY OF ARKANSAS
DEPARTMENT OF CIVIL ENGINEERING
MATERIALS LABORATORY
Job Name: Date:
Material: Tested By:
Source:
ASPHALT CONTENT BY THE IGNITION METHOD
Test Samples
Sample ID R2-12W R2-6W R2-J R2-6E R2-12E
Weight of Basket (g) 3264.40 3268.90 3267.70 3276.30
Specimen + Basket (g) 4996.40 5064.20 4866.10 5001.30
Net Wt. of Specimen (g) 1732.00 1795.30 1598.40 1725.00
Calibration Factor 0.00 0.00 0.00 0.00
Temperature Correction Factor 0.17 0.16 0.28 0.17
Oven Derived AC% 7.09 7.36 6.27 7.20
Corrected Value (if CF not used) 7.09 7.36 6.27 7.20
ASPHALT CONTENT BY THE IGNITION METHOD(AASHTO T 308)
TRC 0801 6/1/2008
Russellville - Hwy. 7 Ashly
Station 2
155

UNIVERSITY OF ARKANSAS
DEPARTMENT OF CIVIL ENGINEERING
MATERIALS LABORATORY
Job Name: Date:
Material: Tested By:
Source:
WET and DRY SIEVE ANALYSIS
Sieve Size
(U.S. Std.)
Sieve Size
(mm)
Sieve + Agg
Weight
Sieve
Weight
Individual
Weight Ret.
Cum. Wt.
Retained
Cum.
% Ret.
%
Passing
Reported
% Passing
2 50.0
1-1/2 37.5 0.00 0.00 0.00 100.00 100.0
1 25.0 0.00 0.00 0.00 100.00 100.0
3/4 19.0 551.60 551.40 0.20 0.20 0.01 99.99 100.0
1/2 12.5 652.60 527.50 125.10 125.30 7.84 92.16 92.2
3/8 9.5 700.30 521.20 179.10 304.40 19.05 80.95 81.0
#4 4.750 961.50 507.30 454.20 758.60 47.46 52.54 52.5
#8 2.360 737.90 469.10 268.80 1027.40 64.28 35.72 35.7
#16 1.180 596.10 453.80 142.30 1169.70 73.18 26.82 26.8
#30 0.600 472.20 389.70 82.50 1252.20 78.35 21.65 21.7
#40 0.425 0.00 1252.20 78.35 21.65 21.7
#50 0.300 441.20 360.60 80.60 1332.80 83.39 16.61 16.6
#100 0.150 439.30 343.70 95.60 1428.40 89.37 10.63 10.6
#200 0.075 362.60 322.60 40.00 1468.40 91.87 8.13 8.13
Pan Pan 429.30 370.20 59.10 1527.50
A) Weight of Original Sample, g AHTD Dust Proportion
B) Weight after Wash, g
C) Wash Loss, g (A-B) Fineness Modulus
D) Minus #200 From Sieve, g
Total Minus #200, g (C+D) Acceptance Check
Wash Loss 4.34 %
Russellville - Hwy. 7 Ashly
SIEVE ANALYSIS OF COARSE AND FINE AGGREGATE(AASHTO T-11 and AASHTO T-27)
TRC 0801 6/1/2008
59.10
128.50 0.9991
Station 2 - 12W
1598.30 0.38
1528.90
69.40 4.551
156

UNIVERSITY OF ARKANSAS
DEPARTMENT OF CIVIL ENGINEERING
MATERIALS LABORATORY
Job Name: Date:
Material: Tested By:
Source:
WET and DRY SIEVE ANALYSIS
Sieve Size
(U.S. Std.)
Sieve Size
(mm)
Sieve + Agg
Weight
Sieve
Weight
Individual
Weight Ret.
Cum. Wt.
Retained
Cum.
% Ret.
%
Passing
Reported
% Passing
2 50.0
1-1/2 37.5 0.00 0.00 0.00 100.00 100.0
1 25.0 0.00 0.00 0.00 100.00 100.0
3/4 19.0 564.80 560.10 4.70 4.70 0.28 99.72 99.7
1/2 12.5 552.60 523.10 29.50 34.20 2.07 97.93 97.9
3/8 9.5 699.20 549.20 150.00 184.20 11.17 88.83 88.8
#4 4.750 1026.80 506.00 520.80 705.00 42.74 57.26 57.3
#8 2.360 738.70 439.90 298.80 1003.80 60.85 39.15 39.1
#16 1.180 616.30 442.50 173.80 1177.60 71.39 28.61 28.6
#30 0.600 470.90 377.40 93.50 1271.10 77.06 22.94 22.9
#40 0.425 0.00 1271.10 77.06 22.94 22.9
#50 0.300 460.00 367.20 92.80 1363.90 82.69 17.31 17.3
#100 0.150 446.60 339.20 107.40 1471.30 89.20 10.80 10.8
#200 0.075 401.10 325.70 75.40 1546.70 93.77 6.23 6.23
Pan Pan 397.70 368.50 29.20 1575.90
A) Weight of Original Sample, g AHTD Dust Proportion
B) Weight after Wash, g
C) Wash Loss, g (A-B) Fineness Modulus
D) Minus #200 From Sieve, g
Total Minus #200, g (C+D) Acceptance Check
Wash Loss 4.38 %
Russellville - Hwy. 7 Ashly
SIEVE ANALYSIS OF COARSE AND FINE AGGREGATE(AASHTO T-11 and AASHTO T-27)
TRC 0801 6/1/2008
29.20
101.40 0.9991
Station 2 - 6W
1649.50 0.27
1577.30
72.20 4.354
157

UNIVERSITY OF ARKANSAS
DEPARTMENT OF CIVIL ENGINEERING
MATERIALS LABORATORY
Job Name: Date:
Material: Tested By:
Source:
WET and DRY SIEVE ANALYSIS
Sieve Size
(U.S. Std.)
Sieve Size
(mm)
Sieve + Agg
Weight
Sieve
Weight
Individual
Weight Ret.
Cum. Wt.
Retained
Cum.
% Ret.
%
Passing
Reported
% Passing
2 50.0
1-1/2 37.5 0.00 0.00 0.00 100.00 100.0
1 25.0 0.00 0.00 0.00 100.00 100.0
3/4 19.0 568.10 560.10 8.00 8.00 0.41 99.59 99.6
1/2 12.5 540.30 523.10 17.20 25.20 1.30 98.70 98.7
3/8 9.5 780.40 549.20 231.20 256.40 13.23 86.77 86.8
#4 4.750 1104.60 506.00 598.60 855.00 44.12 55.88 55.9
#8 2.360 790.70 439.90 350.80 1205.80 62.22 37.78 37.8
#16 1.180 643.60 442.50 201.10 1406.90 72.60 27.40 27.4
#30 0.600 490.10 377.40 112.70 1519.60 78.41 21.59 21.6
#40 0.425 0.00 1519.60 78.41 21.59 21.6
#50 0.300 447.30 367.20 80.10 1599.70 82.54 17.46 17.5
#100 0.150 455.80 339.20 116.60 1716.30 88.56 11.44 11.4
#200 0.075 376.90 325.70 51.20 1767.50 91.20 8.80 8.80
Pan Pan 452.50 368.50 84.00 1851.50
A) Weight of Original Sample, g AHTD Dust Proportion
B) Weight after Wash, g
C) Wash Loss, g (A-B) Fineness Modulus
D) Minus #200 From Sieve, g
Total Minus #200, g (C+D) Acceptance Check
Wash Loss 4.03 %
Russellville - Hwy. 7 Ashly
SIEVE ANALYSIS OF COARSE AND FINE AGGREGATE(AASHTO T-11 and AASHTO T-27)
TRC 0801 6/1/2008
84.00
162.10 0.9955
Station 2 - J
1938.00 0.41
1859.90
78.10 4.421
158

UNIVERSITY OF ARKANSAS
DEPARTMENT OF CIVIL ENGINEERING
MATERIALS LABORATORY
Job Name: Date:
Material: Tested By:
Source:
WET and DRY SIEVE ANALYSIS
Sieve Size
(U.S. Std.)
Sieve Size
(mm)
Sieve + Agg
Weight
Sieve
Weight
Individual
Weight Ret.
Cum. Wt.
Retained
Cum.
% Ret.
%
Passing
Reported
% Passing
2 50.0
1-1/2 37.5 0.00 0.00 0.00 100.00 100.0
1 25.0 0.00 0.00 0.00 100.00 100.0
3/4 19.0 560.40 560.40 0.00 0.00 0.00 100.00 100.0
1/2 12.5 616.80 522.50 94.30 94.30 6.33 93.67 93.7
3/8 9.5 730.20 549.70 180.50 274.80 18.46 81.54 81.5
#4 4.750 939.70 506.00 433.70 708.50 47.58 52.42 52.4
#8 2.360 700.40 440.70 259.70 968.20 65.02 34.98 35.0
#16 1.180 601.90 442.50 159.40 1127.60 75.73 24.27 24.3
#30 0.600 447.70 377.40 70.30 1197.90 80.45 19.55 19.6
#40 0.425 0.00 1197.90 80.45 19.55 19.6
#50 0.300 414.10 367.20 46.90 1244.80 83.60 16.40 16.4
#100 0.150 418.70 338.70 80.00 1324.80 88.97 11.03 11.0
#200 0.075 393.80 325.90 67.90 1392.70 93.53 6.47 6.47
Pan Pan 389.80 368.50 21.30 1414.00
A) Weight of Original Sample, g AHTD Dust Proportion
B) Weight after Wash, g
C) Wash Loss, g (A-B) Fineness Modulus
D) Minus #200 From Sieve, g
Total Minus #200, g (C+D) Acceptance Check
Wash Loss 5.03 %
Russellville - Hwy. 7 Ashly
SIEVE ANALYSIS OF COARSE AND FINE AGGREGATE(AASHTO T-11 and AASHTO T-27)
TRC 0801 6/1/2008
21.30
96.20 0.9999
Station 2 - 6E
1489.00 0.33
1414.10
74.90 4.598
159
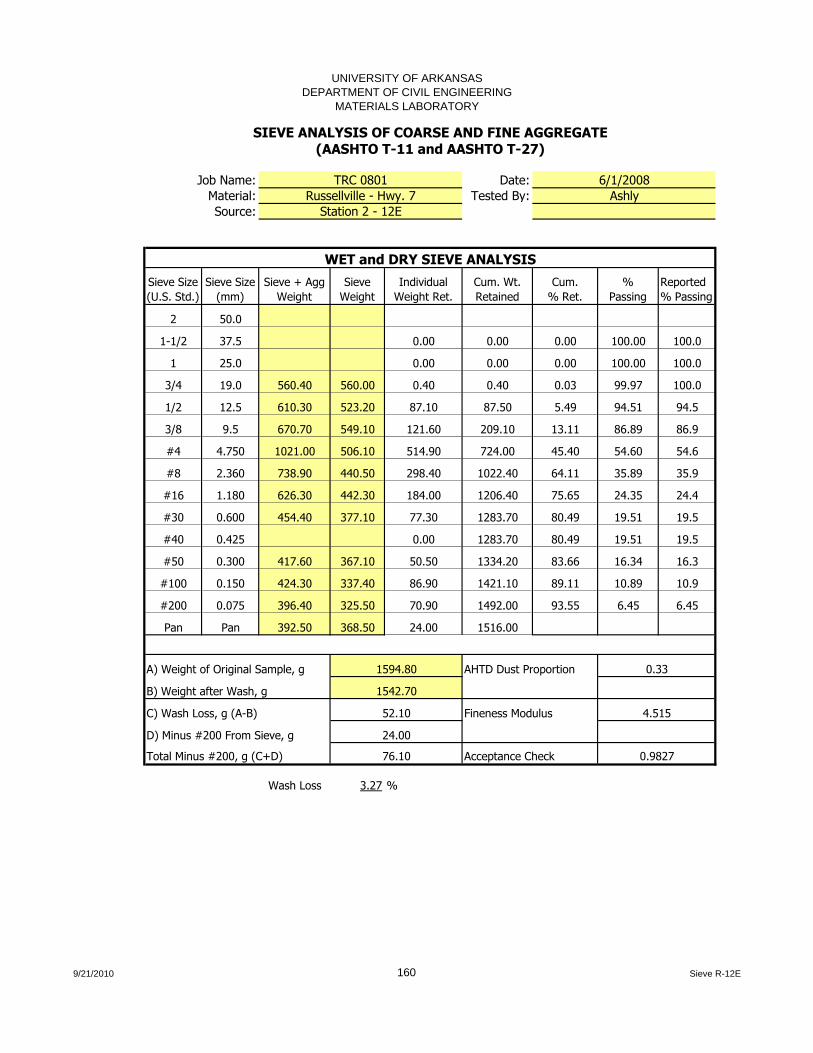
UNIVERSITY OF ARKANSAS
DEPARTMENT OF CIVIL ENGINEERING
MATERIALS LABORATORY
Job Name: Date:
Material: Tested By:
Source:
WET and DRY SIEVE ANALYSIS
Sieve Size
(U.S. Std.)
Sieve Size
(mm)
Sieve + Agg
Weight
Sieve
Weight
Individual
Weight Ret.
Cum. Wt.
Retained
Cum.
% Ret.
%
Passing
Reported
% Passing
2 50.0
1-1/2 37.5 0.00 0.00 0.00 100.00 100.0
1 25.0 0.00 0.00 0.00 100.00 100.0
3/4 19.0 560.40 560.00 0.40 0.40 0.03 99.97 100.0
1/2 12.5 610.30 523.20 87.10 87.50 5.49 94.51 94.5
3/8 9.5 670.70 549.10 121.60 209.10 13.11 86.89 86.9
#4 4.750 1021.00 506.10 514.90 724.00 45.40 54.60 54.6
#8 2.360 738.90 440.50 298.40 1022.40 64.11 35.89 35.9
#16 1.180 626.30 442.30 184.00 1206.40 75.65 24.35 24.4
#30 0.600 454.40 377.10 77.30 1283.70 80.49 19.51 19.5
#40 0.425 0.00 1283.70 80.49 19.51 19.5
#50 0.300 417.60 367.10 50.50 1334.20 83.66 16.34 16.3
#100 0.150 424.30 337.40 86.90 1421.10 89.11 10.89 10.9
#200 0.075 396.40 325.50 70.90 1492.00 93.55 6.45 6.45
Pan Pan 392.50 368.50 24.00 1516.00
A) Weight of Original Sample, g AHTD Dust Proportion
B) Weight after Wash, g
C) Wash Loss, g (A-B) Fineness Modulus
D) Minus #200 From Sieve, g
Total Minus #200, g (C+D) Acceptance Check
Wash Loss 3.27 %
Russellville - Hwy. 7 Ashly
SIEVE ANALYSIS OF COARSE AND FINE AGGREGATE(AASHTO T-11 and AASHTO T-27)
TRC 0801 6/1/2008
24.00
76.10 0.9827
Station 2 - 12E
1594.80 0.33
1542.70
52.10 4.515
9/21/2010 160 Sieve R-12E

UNIVERSITY OF ARKANSAS
DEPARTMENT OF CIVIL ENGINEERING
MATERIALS LABORATORY
BULK SPECIFIC GRAVITY AND % AIR VOIDS OF COMPACTED BITUMINOUS
MIXTURES USING SSD SPECIMENS (AASHTO T-166, T-269)
Job Name: TRC 0801 Date: 4/1/2008
Material: Tested By: Annette
Source: Station 3
Sample
NumberR3-12W R3-6W R3-J R3-6E R3-12E
Dry Weight
in Air, gm
(A)
1788.5 1962.0 1643.9 1801.1
Submerged
Weight, gm
(C)
1023.5 1118.0 929.5 1021.2
SSD
Weight, gm
(B)
1812.4 1981.9 1686.1 1827.7
Bulk Specific
Gravity, Gmb
(D)=A/(B-C)
2.267 2.271 2.173 2.233
Percent Water Absorbed
by Volume
(E)=(B-A)/(B-C) * 100
3.0 2.3 5.6 3.3
Note: if Percent Water Absorbed > 2%, Determine Gmb using AASHTO T-275
Russellville - Hwy. 7
161
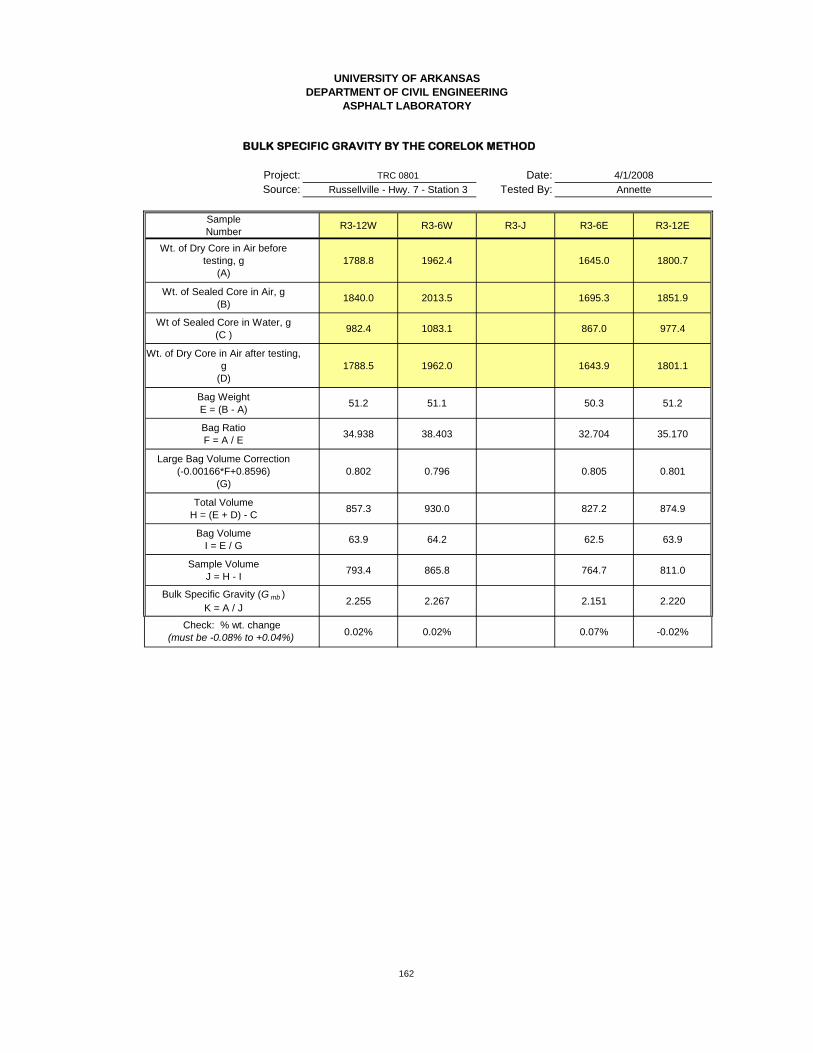
UNIVERSITY OF ARKANSAS
DEPARTMENT OF CIVIL ENGINEERING
ASPHALT LABORATORY
BULK SPECIFIC GRAVITY BY THE CORELOK METHOD
Project: Date:
Source: Tested By:
Sample
NumberR3-12W R3-6W R3-J R3-6E R3-12E
Wt. of Dry Core in Air before
testing, g
(A)
1788.8 1962.4 1645.0 1800.7
Wt. of Sealed Core in Air, g
(B)1840.0 2013.5 1695.3 1851.9
Wt of Sealed Core in Water, g
(C )982.4 1083.1 867.0 977.4
Wt. of Dry Core in Air after testing,
g
(D)
1788.5 1962.0 1643.9 1801.1
Bag Weight
E = (B - A)51.2 51.1 50.3 51.2
Bag Ratio
F = A / E34.938 38.403 32.704 35.170
Large Bag Volume Correction
(-0.00166*F+0.8596)
(G)
0.802 0.796 0.805 0.801
Total Volume
H = (E + D) - C857.3 930.0 827.2 874.9
Bag Volume
I = E / G63.9 64.2 62.5 63.9
Sample Volume
J = H - I793.4 865.8 764.7 811.0
Bulk Specific Gravity (G mb )
K = A / J2.255 2.267 2.151 2.220
0.02% 0.02% 0.07% -0.02%Check: % wt. change
(must be -0.08% to +0.04%)
TRC 0801 4/1/2008
Russellville - Hwy. 7 - Station 3 Annette
162

UNIVERSITY OF ARKANSAS
DEPARTMENT OF CIVIL ENGINEERING
ASPHALT LABORATORY
Job Name: Date:
Material: Tested By:
Source:
Sample
NumberR3-12W R3-6W R3-J R3-6E R3-12E
Dry Weight
in Air, gm 1788.5 1962.0 1643.9 1801.1
Sample
Volume, cc778 856 724 793
Bulk Specific
Gravity, Gmb2.297 2.290 2.268 2.271
KUSS Gmb
4/1/2008
Annette
TRC 0801
Russellville - Hwy. 7
Station 3
163
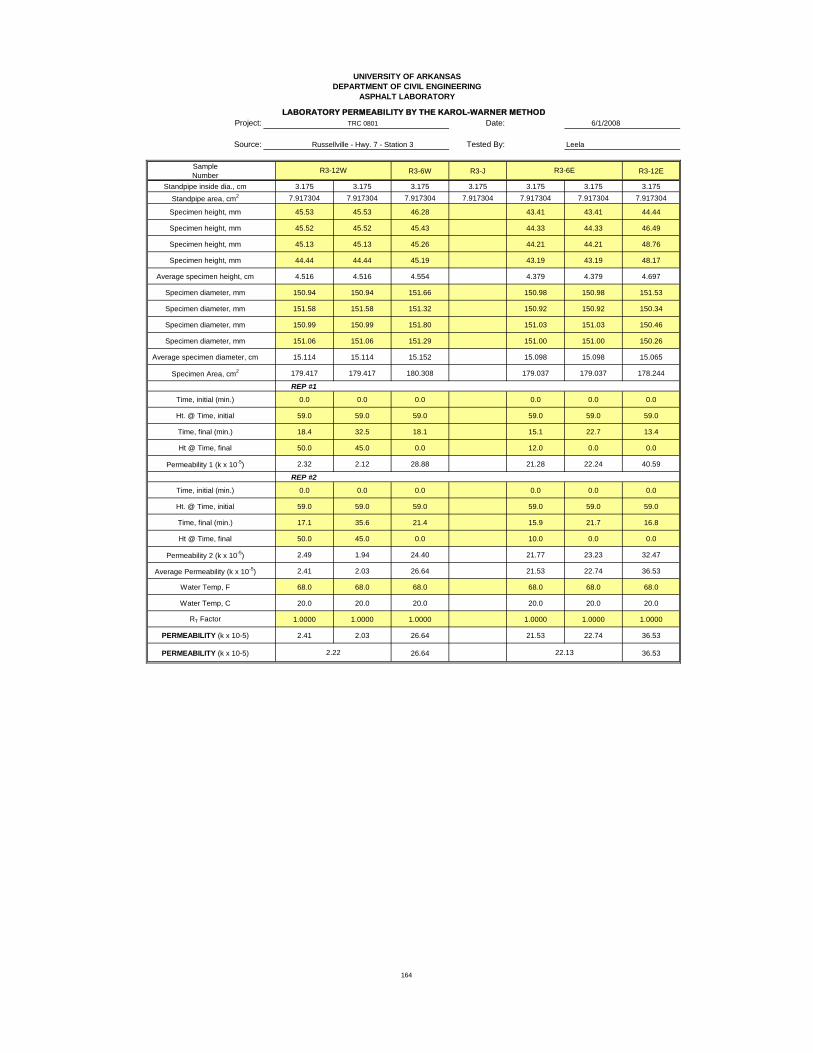
UNIVERSITY OF ARKANSAS
DEPARTMENT OF CIVIL ENGINEERING
ASPHALT LABORATORY
Project: Date: 6/1/2008
Source: Tested By: Leela
Sample
NumberR3-6W R3-J R3-12E
Standpipe inside dia., cm 3.175 3.175 3.175 3.175 3.175 3.175 3.175
Standpipe area, cm2 7.917304 7.917304 7.917304 7.917304 7.917304 7.917304 7.917304
Specimen height, mm 45.53 45.53 46.28 43.41 43.41 44.44
Specimen height, mm 45.52 45.52 45.43 44.33 44.33 46.49
Specimen height, mm 45.13 45.13 45.26 44.21 44.21 48.76
Specimen height, mm 44.44 44.44 45.19 43.19 43.19 48.17
Average specimen height, cm 4.516 4.516 4.554 4.379 4.379 4.697
Specimen diameter, mm 150.94 150.94 151.66 150.98 150.98 151.53
Specimen diameter, mm 151.58 151.58 151.32 150.92 150.92 150.34
Specimen diameter, mm 150.99 150.99 151.80 151.03 151.03 150.46
Specimen diameter, mm 151.06 151.06 151.29 151.00 151.00 150.26
Average specimen diameter, cm 15.114 15.114 15.152 15.098 15.098 15.065
Specimen Area, cm2 179.417 179.417 180.308 179.037 179.037 178.244
REP #1
Time, initial (min.) 0.0 0.0 0.0 0.0 0.0 0.0
Ht. @ Time, initial 59.0 59.0 59.0 59.0 59.0 59.0
Time, final (min.) 18.4 32.5 18.1 15.1 22.7 13.4
Ht @ Time, final 50.0 45.0 0.0 12.0 0.0 0.0
Permeability 1 (k x 10-5
) 2.32 2.12 28.88 21.28 22.24 40.59
REP #2
Time, initial (min.) 0.0 0.0 0.0 0.0 0.0 0.0
Ht. @ Time, initial 59.0 59.0 59.0 59.0 59.0 59.0
Time, final (min.) 17.1 35.6 21.4 15.9 21.7 16.8
Ht @ Time, final 50.0 45.0 0.0 10.0 0.0 0.0
Permeability 2 (k x 10-5
) 2.49 1.94 24.40 21.77 23.23 32.47
Average Permeability (k x 10-5
) 2.41 2.03 26.64 21.53 22.74 36.53
Water Temp, F 68.0 68.0 68.0 68.0 68.0 68.0
Water Temp, C 20.0 20.0 20.0 20.0 20.0 20.0
RT Factor 1.0000 1.0000 1.0000 1.0000 1.0000 1.0000
PERMEABILITY (k x 10-5) 2.41 2.03 26.64 21.53 22.74 36.53
PERMEABILITY (k x 10-5) 26.64 36.53
LABORATORY PERMEABILITY BY THE KAROL-WARNER METHOD
22.132.22
TRC 0801
Russellville - Hwy. 7 - Station 3
R3-12W R3-6E
164

UNIVERSITY OF ARKANSAS
DEPARTMENT OF CIVIL ENGINEERING
MATERIALS LABORATORY
Job Name: Date:
Material: Tested By:
Source:
ASPHALT CONTENT BY THE IGNITION METHOD
Test Samples
Sample ID R3-12W R3-6W R3-J R3-6E R3-12E
Weight of Basket (g) 3263.50 3281.00 3273.10
Specimen + Basket (g) 5051.80 5239.60 4921.30
Net Wt. of Specimen (g) 1788.30 1958.60 1648.20
Calibration Factor 0.00 0.00 0.00
Temperature Correction Factor 0.16 0.15 0.18
Oven Derived AC% 6.87 6.33 7.80
Corrected Value (if CF not used) 6.87 6.33 7.80
ASPHALT CONTENT BY THE IGNITION METHOD(AASHTO T 308)
TRC 0801 6/1/2008
Russellville - Hwy. 7 Ashly
Station 3
165

UNIVERSITY OF ARKANSAS
DEPARTMENT OF CIVIL ENGINEERING
MATERIALS LABORATORY
Job Name: Date:
Material: Tested By:
Source:
WET and DRY SIEVE ANALYSIS
Sieve Size
(U.S. Std.)
Sieve Size
(mm)
Sieve + Agg
Weight
Sieve
Weight
Individual
Weight Ret.
Cum. Wt.
Retained
Cum.
% Ret.
%
Passing
Reported
% Passing
2 50.0
1-1/2 37.5 0.00 0.00 0.00 100.00 100.0
1 25.0 0.00 0.00 0.00 100.00 100.0
3/4 19.0 551.40 551.10 0.30 0.30 0.02 99.98 100.0
1/2 12.5 597.30 527.50 69.80 70.10 4.24 95.76 95.8
3/8 9.5 698.70 521.20 177.50 247.60 14.98 85.02 85.0
#4 4.750 1072.40 507.30 565.10 812.70 49.17 50.83 50.8
#8 2.360 726.50 469.10 257.40 1070.10 64.74 35.26 35.3
#16 1.180 598.10 453.70 144.40 1214.50 73.48 26.52 26.5
#30 0.600 474.10 389.50 84.60 1299.10 78.60 21.40 21.4
#40 0.425 0.00 1299.10 78.60 21.40 21.4
#50 0.300 443.30 360.80 82.50 1381.60 83.59 16.41 16.4
#100 0.150 438.30 343.70 94.60 1476.20 89.31 10.69 10.7
#200 0.075 358.80 322.40 36.40 1512.60 91.51 8.49 8.49
Pan Pan 426.00 370.00 56.00 1568.60
A) Weight of Original Sample, g AHTD Dust Proportion
B) Weight after Wash, g
C) Wash Loss, g (A-B) Fineness Modulus
D) Minus #200 From Sieve, g
Total Minus #200, g (C+D) Acceptance Check
Wash Loss 5.06 %
83.60 4.539
SIEVE ANALYSIS OF COARSE AND FINE AGGREGATE(AASHTO T-11 and AASHTO T-27)
TRC 0801 6/1/2008
Russellville - Hwy. 7 Ashly
56.00
139.60 0.9996
Station 3 - 12W
1652.90 0.40
1569.30
166
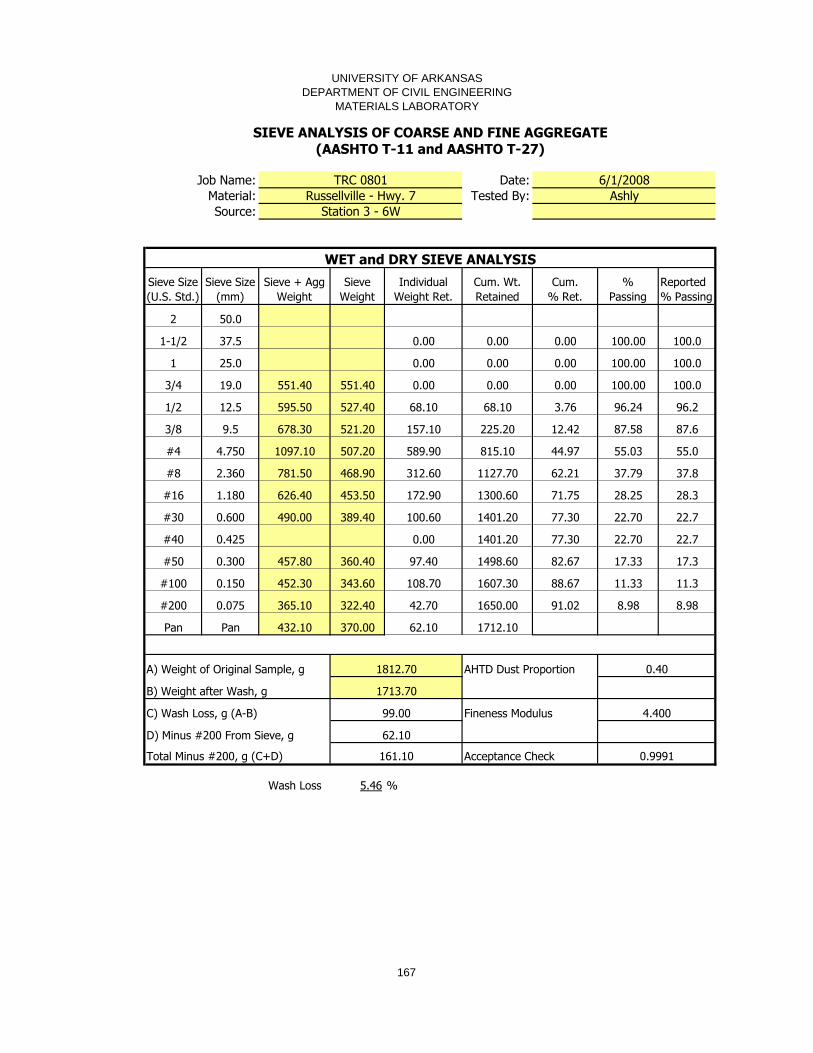
UNIVERSITY OF ARKANSAS
DEPARTMENT OF CIVIL ENGINEERING
MATERIALS LABORATORY
Job Name: Date:
Material: Tested By:
Source:
WET and DRY SIEVE ANALYSIS
Sieve Size
(U.S. Std.)
Sieve Size
(mm)
Sieve + Agg
Weight
Sieve
Weight
Individual
Weight Ret.
Cum. Wt.
Retained
Cum.
% Ret.
%
Passing
Reported
% Passing
2 50.0
1-1/2 37.5 0.00 0.00 0.00 100.00 100.0
1 25.0 0.00 0.00 0.00 100.00 100.0
3/4 19.0 551.40 551.40 0.00 0.00 0.00 100.00 100.0
1/2 12.5 595.50 527.40 68.10 68.10 3.76 96.24 96.2
3/8 9.5 678.30 521.20 157.10 225.20 12.42 87.58 87.6
#4 4.750 1097.10 507.20 589.90 815.10 44.97 55.03 55.0
#8 2.360 781.50 468.90 312.60 1127.70 62.21 37.79 37.8
#16 1.180 626.40 453.50 172.90 1300.60 71.75 28.25 28.3
#30 0.600 490.00 389.40 100.60 1401.20 77.30 22.70 22.7
#40 0.425 0.00 1401.20 77.30 22.70 22.7
#50 0.300 457.80 360.40 97.40 1498.60 82.67 17.33 17.3
#100 0.150 452.30 343.60 108.70 1607.30 88.67 11.33 11.3
#200 0.075 365.10 322.40 42.70 1650.00 91.02 8.98 8.98
Pan Pan 432.10 370.00 62.10 1712.10
A) Weight of Original Sample, g AHTD Dust Proportion
B) Weight after Wash, g
C) Wash Loss, g (A-B) Fineness Modulus
D) Minus #200 From Sieve, g
Total Minus #200, g (C+D) Acceptance Check
Wash Loss 5.46 %
99.00 4.400
SIEVE ANALYSIS OF COARSE AND FINE AGGREGATE(AASHTO T-11 and AASHTO T-27)
TRC 0801 6/1/2008
Russellville - Hwy. 7 Ashly
62.10
161.10 0.9991
Station 3 - 6W
1812.70 0.40
1713.70
167

UNIVERSITY OF ARKANSAS
DEPARTMENT OF CIVIL ENGINEERING
MATERIALS LABORATORY
Job Name: Date:
Material: Tested By:
Source:
WET and DRY SIEVE ANALYSIS
Sieve Size
(U.S. Std.)
Sieve Size
(mm)
Sieve + Agg
Weight
Sieve
Weight
Individual
Weight Ret.
Cum. Wt.
Retained
Cum.
% Ret.
%
Passing
Reported
% Passing
2 50.0
1-1/2 37.5 0.00 0.00 0.00 100.00 100.0
1 25.0 0.00 0.00 0.00 100.00 100.0
3/4 19.0 551.60 551.60 0.00 0.00 0.00 100.00 100.0
1/2 12.5 595.10 527.70 67.40 67.40 3.43 96.57 96.6
3/8 9.5 701.20 521.00 180.20 247.60 12.60 87.40 87.4
#4 4.750 990.80 507.30 483.50 731.10 37.21 62.79 62.8
#8 2.360 795.30 469.60 325.70 1056.80 53.78 46.22 46.2
#16 1.180 679.40 453.60 225.80 1282.60 65.27 34.73 34.7
#30 0.600 500.30 389.40 110.90 1393.50 70.92 29.08 29.1
#40 0.425 0.00 1393.50 70.92 29.08 29.1
#50 0.300 473.50 360.40 113.10 1506.60 76.67 23.33 23.3
#100 0.150 499.30 343.60 155.70 1662.30 84.60 15.40 15.4
#200 0.075 410.20 322.50 87.70 1750.00 89.06 10.94 10.94
Pan Pan 447.30 370.00 77.30 1827.30
A) Weight of Original Sample, g AHTD Dust Proportion
B) Weight after Wash, g
C) Wash Loss, g (A-B) Fineness Modulus
D) Minus #200 From Sieve, g
Total Minus #200, g (C+D) Acceptance Check
Wash Loss 4.76 %
93.50 4.010
SIEVE ANALYSIS OF COARSE AND FINE AGGREGATE(AASHTO T-11 and AASHTO T-27)
TRC 0801 6/1/2008
Russellville - Hwy. 7 Ashly
77.30
170.80 0.9764
Station 3 - J
1965.00 0.38
1871.50
168
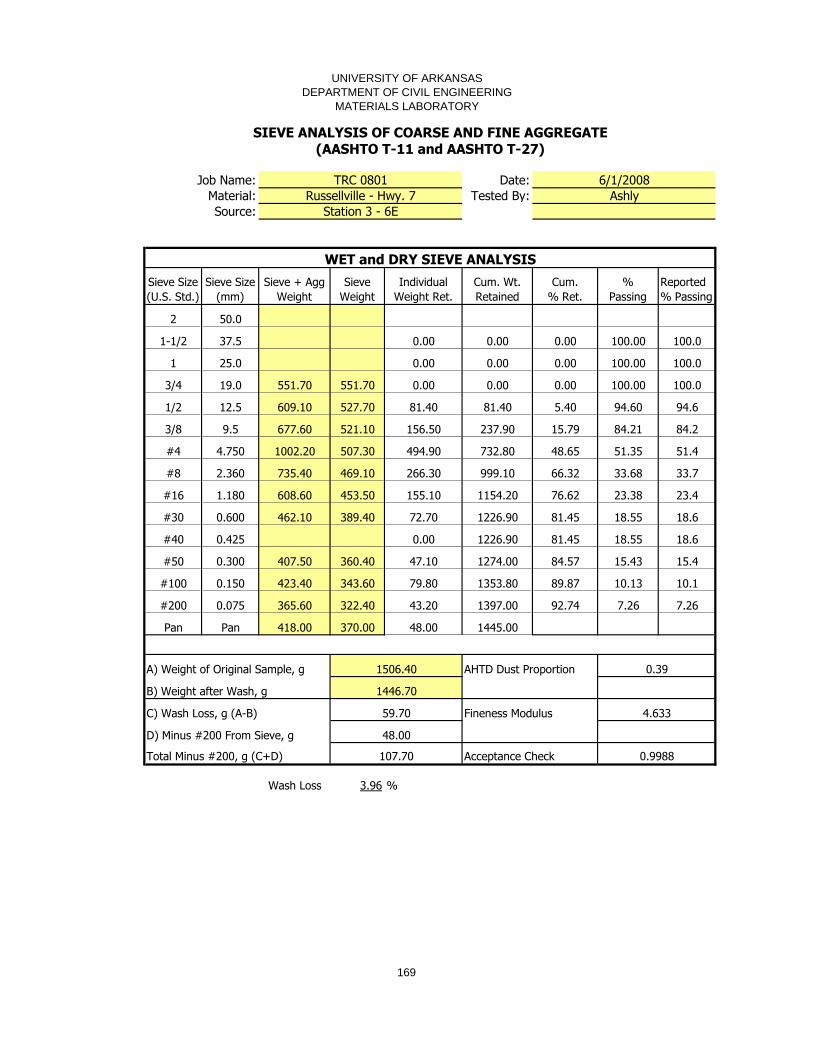
UNIVERSITY OF ARKANSAS
DEPARTMENT OF CIVIL ENGINEERING
MATERIALS LABORATORY
Job Name: Date:
Material: Tested By:
Source:
WET and DRY SIEVE ANALYSIS
Sieve Size
(U.S. Std.)
Sieve Size
(mm)
Sieve + Agg
Weight
Sieve
Weight
Individual
Weight Ret.
Cum. Wt.
Retained
Cum.
% Ret.
%
Passing
Reported
% Passing
2 50.0
1-1/2 37.5 0.00 0.00 0.00 100.00 100.0
1 25.0 0.00 0.00 0.00 100.00 100.0
3/4 19.0 551.70 551.70 0.00 0.00 0.00 100.00 100.0
1/2 12.5 609.10 527.70 81.40 81.40 5.40 94.60 94.6
3/8 9.5 677.60 521.10 156.50 237.90 15.79 84.21 84.2
#4 4.750 1002.20 507.30 494.90 732.80 48.65 51.35 51.4
#8 2.360 735.40 469.10 266.30 999.10 66.32 33.68 33.7
#16 1.180 608.60 453.50 155.10 1154.20 76.62 23.38 23.4
#30 0.600 462.10 389.40 72.70 1226.90 81.45 18.55 18.6
#40 0.425 0.00 1226.90 81.45 18.55 18.6
#50 0.300 407.50 360.40 47.10 1274.00 84.57 15.43 15.4
#100 0.150 423.40 343.60 79.80 1353.80 89.87 10.13 10.1
#200 0.075 365.60 322.40 43.20 1397.00 92.74 7.26 7.26
Pan Pan 418.00 370.00 48.00 1445.00
A) Weight of Original Sample, g AHTD Dust Proportion
B) Weight after Wash, g
C) Wash Loss, g (A-B) Fineness Modulus
D) Minus #200 From Sieve, g
Total Minus #200, g (C+D) Acceptance Check
Wash Loss 3.96 %
59.70 4.633
SIEVE ANALYSIS OF COARSE AND FINE AGGREGATE(AASHTO T-11 and AASHTO T-27)
TRC 0801 6/1/2008
Russellville - Hwy. 7 Ashly
48.00
107.70 0.9988
Station 3 - 6E
1506.40 0.39
1446.70
169

UNIVERSITY OF ARKANSAS
DEPARTMENT OF CIVIL ENGINEERING
MATERIALS LABORATORY
Job Name: Date:
Material: Tested By:
Source:
WET and DRY SIEVE ANALYSIS
Sieve Size
(U.S. Std.)
Sieve Size
(mm)
Sieve + Agg
Weight
Sieve
Weight
Individual
Weight Ret.
Cum. Wt.
Retained
Cum.
% Ret.
%
Passing
Reported
% Passing
2 50.0
1-1/2 37.5 0.00 0.00 0.00 100.00 100.0
1 25.0 0.00 0.00 0.00 100.00 100.0
3/4 19.0 560.10 560.10 0.00 0.00 0.00 100.00 100.0
1/2 12.5 650.50 523.20 127.30 127.30 6.66 93.34 93.3
3/8 9.5 690.40 549.00 141.40 268.70 14.05 85.95 86.0
#4 4.750 1099.20 506.30 592.90 861.60 45.05 54.95 55.0
#8 2.360 875.30 440.50 434.80 1296.40 67.78 32.22 32.2
#16 1.180 638.00 442.30 195.70 1492.10 78.01 21.99 22.0
#30 0.600 470.40 377.00 93.40 1585.50 82.90 17.10 17.1
#40 0.425 0.00 1585.50 82.90 17.10 17.1
#50 0.300 438.10 367.20 70.90 1656.40 86.60 13.40 13.4
#100 0.150 425.90 337.50 88.40 1744.80 91.23 8.77 8.8
#200 0.075 390.70 325.30 65.40 1810.20 94.65 5.35 5.35
Pan Pan 401.20 368.50 32.70 1842.90
A) Weight of Original Sample, g AHTD Dust Proportion
B) Weight after Wash, g
C) Wash Loss, g (A-B) Fineness Modulus
D) Minus #200 From Sieve, g
Total Minus #200, g (C+D) Acceptance Check
Wash Loss 3.32 %
63.50 4.656
SIEVE ANALYSIS OF COARSE AND FINE AGGREGATE(AASHTO T-11 and AASHTO T-27)
TRC 0801 6/1/2008
Russellville - Hwy. 7 Ashly
32.70
96.20 0.9966
Station 3 - 12E
1912.60 0.31
1849.10
170

UNIVERSITY OF ARKANSAS
DEPARTMENT OF CIVIL ENGINEERING
MATERIALS LABORATORY
BULK SPECIFIC GRAVITY AND % AIR VOIDS OF COMPACTED BITUMINOUS
MIXTURES USING SSD SPECIMENS (AASHTO T-166, T-269)
Job Name: TRC 0801 Date: 4/1/2008
Material: Tested By: Annette
Source: Station 4
Sample
NumberR4-12W R4-6W R4-J R4-6E R4-12E
Dry Weight
in Air, gm
(A)
1923.8 1931.3 1713.7 1931.3
Submerged
Weight, gm
(C)
1101.2 1106.8 977.2 1102.2
SSD
Weight, gm
(B)
1936.6 1954.1 1769.3 1978.5
Bulk Specific
Gravity, Gmb
(D)=A/(B-C)
2.303 2.279 2.163 2.204
Percent Water Absorbed
by Volume
(E)=(B-A)/(B-C) * 100
1.5 2.7 7.0 5.4
Note: if Percent Water Absorbed > 2%, Determine Gmb using AASHTO T-275
Russellville - Hwy. 7
171

UNIVERSITY OF ARKANSAS
DEPARTMENT OF CIVIL ENGINEERING
ASPHALT LABORATORY
BULK SPECIFIC GRAVITY BY THE CORELOK METHOD
Project: Date:
Source: Tested By:
Sample
NumberR4-12W R4-6W R4-J R4-6E R4-12E
Wt. of Dry Core in Air before
testing, g
(A)
1925.1 1931.1 1715.3 1931.1
Wt. of Sealed Core in Air, g
(B)1974.8 1981.8 1765.0 1981.8
Wt of Sealed Core in Water, g
(C )1069.3 1064.4 890.3 1064.4
Wt. of Dry Core in Air after testing,
g
(D)
1923.8 1931.3 1713.7 1931.3
Bag Weight
E = (B - A)49.7 50.7 49.7 50.7
Bag Ratio
F = A / E38.734 38.089 34.513 38.089
Large Bag Volume Correction
(-0.00166*F+0.8596)
(G)
0.795 0.796 0.802 0.796
Total Volume
H = (E + D) - C904.2 917.6 873.1 917.6
Bag Volume
I = E / G62.5 63.7 61.9 63.7
Sample Volume
J = H - I841.7 853.9 811.2 853.9
Bulk Specific Gravity (G mb )
K = A / J2.287 2.261 2.115 2.261
Check: % wt. change
(must be -0.08% to +0.04%)0.07% -0.01% 0.09% -0.01%
TRC 0801 4/1/2008
Russellville - Hwy. 7 - Station 4 Annette
172

UNIVERSITY OF ARKANSAS
DEPARTMENT OF CIVIL ENGINEERING
ASPHALT LABORATORY
Job Name: Date:
Material: Tested By:
Source:
Sample
NumberR4-12W R4-6W R4-J R4-6E R4-12E
Dry Weight
in Air, gm 1923.8 1931.3 1713.7 1940.0
Sample
Volume, cc822 835 757 842
Bulk Specific
Gravity, Gmb2.339 2.312 2.263 2.303
KUSS Gmb
4/1/2008
Annette
TRC 0801
Russellville - Hwy. 7
Station 4
173
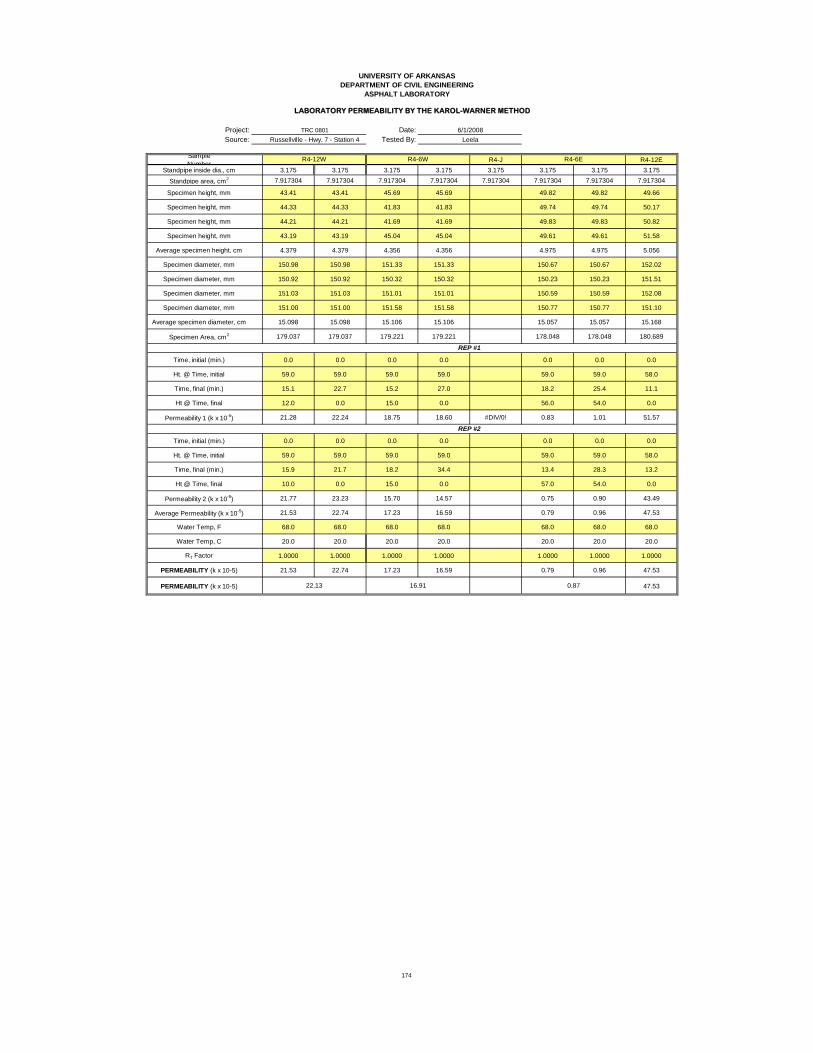
UNIVERSITY OF ARKANSAS
DEPARTMENT OF CIVIL ENGINEERING
ASPHALT LABORATORY
Project: Date:
Source: Tested By:
Sample
NumberR4-J R4-12E
Standpipe inside dia., cm 3.175 3.175 3.175 3.175 3.175 3.175 3.175 3.175
Standpipe area, cm2 7.917304 7.917304 7.917304 7.917304 7.917304 7.917304 7.917304 7.917304
Specimen height, mm 43.41 43.41 45.69 45.69 49.82 49.82 49.66
Specimen height, mm 44.33 44.33 41.83 41.83 49.74 49.74 50.17
Specimen height, mm 44.21 44.21 41.69 41.69 49.83 49.83 50.82
Specimen height, mm 43.19 43.19 45.04 45.04 49.61 49.61 51.58
Average specimen height, cm 4.379 4.379 4.356 4.356 4.975 4.975 5.056
Specimen diameter, mm 150.98 150.98 151.33 151.33 150.67 150.67 152.02
Specimen diameter, mm 150.92 150.92 150.32 150.32 150.23 150.23 151.51
Specimen diameter, mm 151.03 151.03 151.01 151.01 150.59 150.59 152.08
Specimen diameter, mm 151.00 151.00 151.58 151.58 150.77 150.77 151.10
Average specimen diameter, cm 15.098 15.098 15.106 15.106 15.057 15.057 15.168
Specimen Area, cm2 179.037 179.037 179.221 179.221 178.048 178.048 180.689
Time, initial (min.) 0.0 0.0 0.0 0.0 0.0 0.0 0.0
Ht. @ Time, initial 59.0 59.0 59.0 59.0 59.0 59.0 58.0
Time, final (min.) 15.1 22.7 15.2 27.0 18.2 25.4 11.1
Ht @ Time, final 12.0 0.0 15.0 0.0 56.0 54.0 0.0
Permeability 1 (k x 10-5
) 21.28 22.24 18.75 18.60 #DIV/0! 0.83 1.01 51.57
Time, initial (min.) 0.0 0.0 0.0 0.0 0.0 0.0 0.0
Ht. @ Time, initial 59.0 59.0 59.0 59.0 59.0 59.0 58.0
Time, final (min.) 15.9 21.7 18.2 34.4 13.4 28.3 13.2
Ht @ Time, final 10.0 0.0 15.0 0.0 57.0 54.0 0.0
Permeability 2 (k x 10-5
) 21.77 23.23 15.70 14.57 0.75 0.90 43.49
Average Permeability (k x 10-5
) 21.53 22.74 17.23 16.59 0.79 0.96 47.53
Water Temp, F 68.0 68.0 68.0 68.0 68.0 68.0 68.0
Water Temp, C 20.0 20.0 20.0 20.0 20.0 20.0 20.0
RT Factor 1.0000 1.0000 1.0000 1.0000 1.0000 1.0000 1.0000
PERMEABILITY (k x 10-5) 21.53 22.74 17.23 16.59 0.79 0.96 47.53
PERMEABILITY (k x 10-5) 47.53
LABORATORY PERMEABILITY BY THE KAROL-WARNER METHOD
TRC 0801 6/1/2008
Russellville - Hwy. 7 - Station 4 Leela
R4-6W
0.8716.9122.13
R4-6ER4-12W
REP #1
REP #2
174

UNIVERSITY OF ARKANSAS
DEPARTMENT OF CIVIL ENGINEERING
MATERIALS LABORATORY
Job Name: Date:
Material: Tested By:
Source:
ASPHALT CONTENT BY THE IGNITION METHOD
Test Samples
Sample ID R4-12W R4-6W R4-J R4-6E R4-12E
Weight of Basket (g) 3265.60 3274.70 3276.10
Specimen + Basket (g) 5151.90 4999.20 5195.20
Net Wt. of Specimen (g) 1886.30 1724.50 1919.10
Calibration Factor 0.00 0.00 0.00
Temperature Correction Factor 0.31 0.17 0.42
Oven Derived AC% 6.46 7.33 6.92
Corrected Value (if CF not used) 6.46 7.33 6.92
ASPHALT CONTENT BY THE IGNITION METHOD(AASHTO T 308)
TRC 0801 6/1/2008
Russellville - Hwy. 7 Ashly
Station 4
175

UNIVERSITY OF ARKANSAS
DEPARTMENT OF CIVIL ENGINEERING
MATERIALS LABORATORY
Job Name: Date:
Material: Tested By:
Source:
WET and DRY SIEVE ANALYSIS
Sieve Size
(U.S. Std.)
Sieve Size
(mm)
Sieve + Agg
Weight
Sieve
Weight
Individual
Weight Ret.
Cum. Wt.
Retained
Cum.
% Ret.
%
Passing
Reported
% Passing
2 50.0
1-1/2 37.5 0.00 0.00 0.00 100.00 100.0
1 25.0 0.00 0.00 0.00 100.00 100.0
3/4 19.0 551.50 551.50 0.00 0.00 0.00 100.00 100.0
1/2 12.5 604.30 527.20 77.10 77.10 4.38 95.62 95.6
3/8 9.5 694.00 520.90 173.10 250.20 14.20 85.80 85.8
#4 4.750 1064.60 506.70 557.90 808.10 45.87 54.13 54.1
#8 2.360 775.00 469.00 306.00 1114.10 63.23 36.77 36.8
#16 1.180 618.20 453.60 164.60 1278.70 72.58 27.42 27.4
#30 0.600 486.20 389.60 96.60 1375.30 78.06 21.94 21.9
#40 0.425 0.00 1375.30 78.06 21.94 21.9
#50 0.300 452.50 360.60 91.90 1467.20 83.27 16.73 16.7
#100 0.150 448.20 343.30 104.90 1572.10 89.23 10.77 10.8
#200 0.075 368.40 322.60 45.80 1617.90 91.83 8.17 8.17
Pan Pan 433.30 370.30 63.00 1680.90
A) Weight of Original Sample, g AHTD Dust Proportion
B) Weight after Wash, g
C) Wash Loss, g (A-B) Fineness Modulus
D) Minus #200 From Sieve, g
Total Minus #200, g (C+D) Acceptance Check
Wash Loss 4.51 %
63.00
142.50 0.9991
Station 4 - 12W
1761.90 0.37
1682.40
79.50 4.464
Russellville - Hwy. 7 Ashly
SIEVE ANALYSIS OF COARSE AND FINE AGGREGATE(AASHTO T-11 and AASHTO T-27)
TRC 0801 6/1/2008
176

UNIVERSITY OF ARKANSAS
DEPARTMENT OF CIVIL ENGINEERING
MATERIALS LABORATORY
Job Name: Date:
Material: Tested By:
Source:
WET and DRY SIEVE ANALYSIS
Sieve Size
(U.S. Std.)
Sieve Size
(mm)
Sieve + Agg
Weight
Sieve
Weight
Individual
Weight Ret.
Cum. Wt.
Retained
Cum.
% Ret.
%
Passing
Reported
% Passing
2 50.0
1-1/2 37.5 0.00 0.00 0.00 100.00 100.0
1 25.0 0.00 0.00 0.00 100.00 100.0
3/4 19.0 569.60 560.00 9.60 9.60 0.53 99.47 99.5
1/2 12.5 589.40 523.20 66.20 75.80 4.21 95.79 95.8
3/8 9.5 814.30 549.10 265.20 341.00 18.93 81.07 81.1
#4 4.750 1020.40 505.90 514.50 855.50 47.50 52.50 52.5
#8 2.360 701.20 441.10 260.10 1115.60 61.94 38.06 38.1
#16 1.180 612.60 442.50 170.10 1285.70 71.38 28.62 28.6
#30 0.600 470.40 377.50 92.90 1378.60 76.54 23.46 23.5
#40 0.425 0.00 1378.60 76.54 23.46 23.5
#50 0.300 449.40 367.20 82.20 1460.80 81.10 18.90 18.9
#100 0.150 482.70 339.20 143.50 1604.30 89.07 10.93 10.9
#200 0.075 401.50 325.80 75.70 1680.00 93.27 6.73 6.73
Pan Pan 394.20 368.50 25.70 1705.70
A) Weight of Original Sample, g AHTD Dust Proportion
B) Weight after Wash, g
C) Wash Loss, g (A-B) Fineness Modulus
D) Minus #200 From Sieve, g
Total Minus #200, g (C+D) Acceptance Check
Wash Loss 4.95 %
25.70
114.80 0.9963
Station 4 - 6W
1801.20 0.29
1712.10
89.10 4.470
Russellville - Hwy. 7 Ashly
SIEVE ANALYSIS OF COARSE AND FINE AGGREGATE(AASHTO T-11 and AASHTO T-27)
TRC 0801 6/1/2008
177

UNIVERSITY OF ARKANSAS
DEPARTMENT OF CIVIL ENGINEERING
MATERIALS LABORATORY
Job Name: Date:
Material: Tested By:
Source:
WET and DRY SIEVE ANALYSIS
Sieve Size
(U.S. Std.)
Sieve Size
(mm)
Sieve + Agg
Weight
Sieve
Weight
Individual
Weight Ret.
Cum. Wt.
Retained
Cum.
% Ret.
%
Passing
Reported
% Passing
2 50.0
1-1/2 37.5 0.00 0.00 0.00 100.00 100.0
1 25.0 0.00 0.00 0.00 100.00 100.0
3/4 19.0 551.50 551.50 0.00 0.00 0.00 100.00 100.0
1/2 12.5 591.30 527.50 63.80 63.80 3.34 96.66 96.7
3/8 9.5 742.10 521.40 220.70 284.50 14.91 85.09 85.1
#4 4.750 1028.10 507.40 520.70 805.20 42.20 57.80 57.8
#8 2.360 709.40 468.50 240.90 1046.10 54.83 45.17 45.2
#16 1.180 641.60 453.10 188.50 1234.60 64.71 35.29 35.3
#30 0.600 490.50 389.20 101.30 1335.90 70.02 29.98 30.0
#40 0.425 0.00 1335.90 70.02 29.98 30.0
#50 0.300 440.10 360.20 79.90 1415.80 74.20 25.80 25.8
#100 0.150 501.70 343.60 158.10 1573.90 82.49 17.51 17.5
#200 0.075 445.80 322.40 123.40 1697.30 88.96 11.04 11.04
Pan Pan 434.60 370.00 64.60 1761.90
A) Weight of Original Sample, g AHTD Dust Proportion
B) Weight after Wash, g
C) Wash Loss, g (A-B) Fineness Modulus
D) Minus #200 From Sieve, g
Total Minus #200, g (C+D) Acceptance Check
Wash Loss 4.84 %
64.60
157.00 0.9704
Station 4 - J
1908.00 0.37
1815.60
92.40 4.034
Russellville - Hwy. 7 Ashly
SIEVE ANALYSIS OF COARSE AND FINE AGGREGATE(AASHTO T-11 and AASHTO T-27)
TRC 0801 6/1/2008
178

UNIVERSITY OF ARKANSAS
DEPARTMENT OF CIVIL ENGINEERING
MATERIALS LABORATORY
Job Name: Date:
Material: Tested By:
Source:
WET and DRY SIEVE ANALYSIS
Sieve Size
(U.S. Std.)
Sieve Size
(mm)
Sieve + Agg
Weight
Sieve
Weight
Individual
Weight Ret.
Cum. Wt.
Retained
Cum.
% Ret.
%
Passing
Reported
% Passing
2 50.0
1-1/2 37.5 0.00 0.00 0.00 100.00 100.0
1 25.0 0.00 0.00 0.00 100.00 100.0
3/4 19.0 561.00 561.00 0.00 0.00 0.00 100.00 100.0
1/2 12.5 613.10 523.30 89.80 89.80 5.65 94.35 94.4
3/8 9.5 703.20 549.10 154.10 243.90 15.34 84.66 84.7
#4 4.750 1003.30 506.00 497.30 741.20 46.61 53.39 53.4
#8 2.360 735.10 440.60 294.50 1035.70 65.13 34.87 34.9
#16 1.180 611.50 442.30 169.20 1204.90 75.77 24.23 24.2
#30 0.600 451.00 377.30 73.70 1278.60 80.40 19.60 19.6
#40 0.425 0.00 1278.60 80.40 19.60 19.6
#50 0.300 415.10 367.20 47.90 1326.50 83.42 16.58 16.6
#100 0.150 423.60 338.80 84.80 1411.30 88.75 11.25 11.3
#200 0.075 398.60 325.40 73.20 1484.50 93.35 6.65 6.65
Pan Pan 391.70 368.50 23.20 1507.70
A) Weight of Original Sample, g AHTD Dust Proportion
B) Weight after Wash, g
C) Wash Loss, g (A-B) Fineness Modulus
D) Minus #200 From Sieve, g
Total Minus #200, g (C+D) Acceptance Check
Wash Loss 5.10 %
23.20
104.30 0.9991
Station 4 - 6E
1590.20 0.34
1509.10
81.10 4.554
Russellville - Hwy. 7 Ashly
SIEVE ANALYSIS OF COARSE AND FINE AGGREGATE(AASHTO T-11 and AASHTO T-27)
TRC 0801 6/1/2008
179

UNIVERSITY OF ARKANSAS
DEPARTMENT OF CIVIL ENGINEERING
MATERIALS LABORATORY
Job Name: Date:
Material: Tested By:
Source:
WET and DRY SIEVE ANALYSIS
Sieve Size
(U.S. Std.)
Sieve Size
(mm)
Sieve + Agg
Weight
Sieve
Weight
Individual
Weight Ret.
Cum. Wt.
Retained
Cum.
% Ret.
%
Passing
Reported
% Passing
2 50.0
1-1/2 37.5 0.00 0.00 0.00 100.00 100.0
1 25.0 0.00 0.00 0.00 100.00 100.0
3/4 19.0 560.10 560.10 0.00 0.00 0.00 100.00 100.0
1/2 12.5 627.10 523.20 103.90 103.90 5.81 94.19 94.2
3/8 9.5 729.60 548.90 180.70 284.60 15.91 84.09 84.1
#4 4.750 1048.90 506.00 542.90 827.50 46.26 53.74 53.7
#8 2.360 768.60 440.80 327.80 1155.30 64.59 35.41 35.4
#16 1.180 640.00 442.50 197.50 1352.80 75.63 24.37 24.4
#30 0.600 465.00 377.40 87.60 1440.40 80.53 19.47 19.5
#40 0.425 0.00 1440.40 80.53 19.47 19.5
#50 0.300 426.60 367.20 59.40 1499.80 83.85 16.15 16.2
#100 0.150 437.10 339.00 98.10 1597.90 89.33 10.67 10.7
#200 0.075 407.00 325.80 81.20 1679.10 93.87 6.13 6.13
Pan Pan 393.20 368.30 24.90 1704.00
A) Weight of Original Sample, g AHTD Dust Proportion
B) Weight after Wash, g
C) Wash Loss, g (A-B) Fineness Modulus
D) Minus #200 From Sieve, g
Total Minus #200, g (C+D) Acceptance Check
Wash Loss 4.72 %
24.90
109.40 0.9999
Station 4 - 12E
1788.70 0.31
1704.20
84.50 4.561
Russellville - Hwy. 7 Ashly
SIEVE ANALYSIS OF COARSE AND FINE AGGREGATE(AASHTO T-11 and AASHTO T-27)
TRC 0801 6/1/2008
180
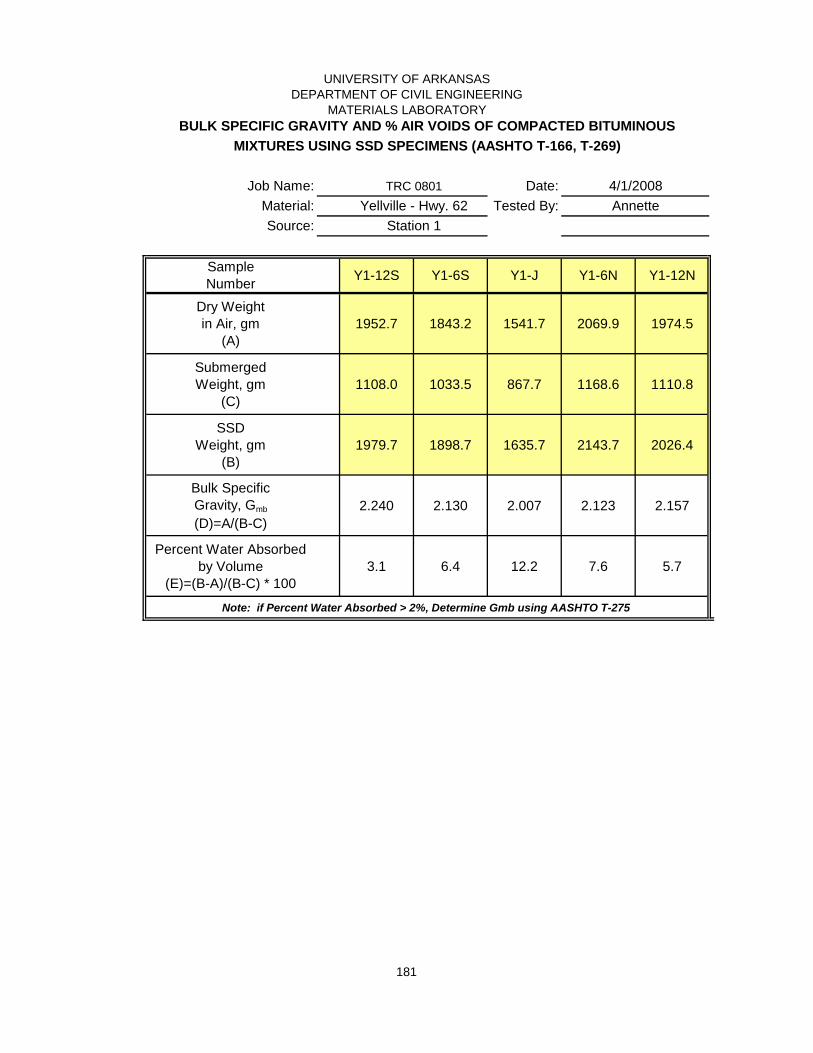
UNIVERSITY OF ARKANSAS
DEPARTMENT OF CIVIL ENGINEERING
MATERIALS LABORATORY
BULK SPECIFIC GRAVITY AND % AIR VOIDS OF COMPACTED BITUMINOUS
MIXTURES USING SSD SPECIMENS (AASHTO T-166, T-269)
Job Name: TRC 0801 Date:
Material: Tested By:
Source: Station 1
Sample
NumberY1-12S Y1-6S Y1-J Y1-6N Y1-12N
Dry Weight
in Air, gm
(A)
1952.7 1843.2 1541.7 2069.9 1974.5
Submerged
Weight, gm
(C)
1108.0 1033.5 867.7 1168.6 1110.8
SSD
Weight, gm
(B)
1979.7 1898.7 1635.7 2143.7 2026.4
Bulk Specific
Gravity, Gmb
(D)=A/(B-C)
2.240 2.130 2.007 2.123 2.157
Percent Water Absorbed
by Volume
(E)=(B-A)/(B-C) * 100
3.1 6.4 12.2 7.6 5.7
Note: if Percent Water Absorbed > 2%, Determine Gmb using AASHTO T-275
Yellville - Hwy. 62 Annette
4/1/2008
181
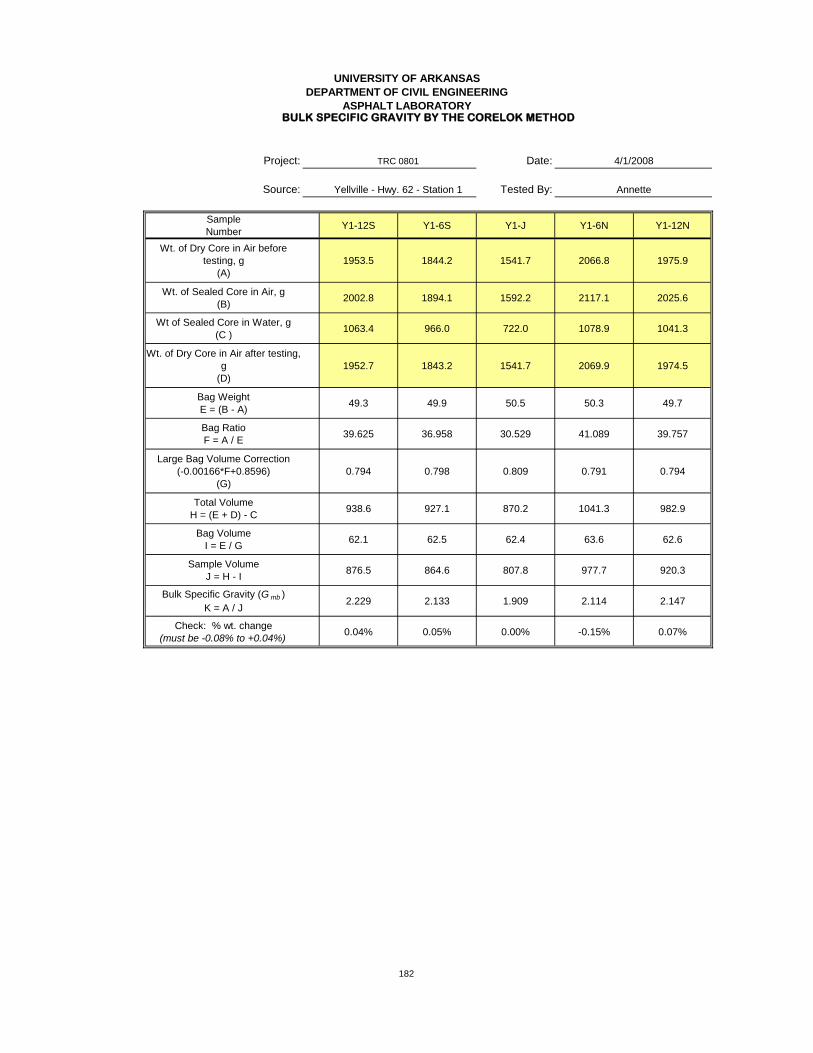
UNIVERSITY OF ARKANSAS
DEPARTMENT OF CIVIL ENGINEERING
ASPHALT LABORATORYBULK SPECIFIC GRAVITY BY THE CORELOK METHOD
Project: Date:
Source: Tested By:
Sample
NumberY1-12S Y1-6S Y1-J Y1-6N Y1-12N
Wt. of Dry Core in Air before
testing, g
(A)
1953.5 1844.2 1541.7 2066.8 1975.9
Wt. of Sealed Core in Air, g
(B)2002.8 1894.1 1592.2 2117.1 2025.6
Wt of Sealed Core in Water, g
(C )1063.4 966.0 722.0 1078.9 1041.3
Wt. of Dry Core in Air after testing,
g
(D)
1952.7 1843.2 1541.7 2069.9 1974.5
Bag Weight
E = (B - A)49.3 49.9 50.5 50.3 49.7
Bag Ratio
F = A / E39.625 36.958 30.529 41.089 39.757
Large Bag Volume Correction
(-0.00166*F+0.8596)
(G)
0.794 0.798 0.809 0.791 0.794
Total Volume
H = (E + D) - C938.6 927.1 870.2 1041.3 982.9
Bag Volume
I = E / G62.1 62.5 62.4 63.6 62.6
Sample Volume
J = H - I876.5 864.6 807.8 977.7 920.3
Bulk Specific Gravity (G mb )
K = A / J2.229 2.133 1.909 2.114 2.147
Check: % wt. change
(must be -0.08% to +0.04%)0.04% 0.05% 0.00% -0.15% 0.07%
TRC 0801 4/1/2008
Yellville - Hwy. 62 - Station 1 Annette
182

UNIVERSITY OF ARKANSAS
DEPARTMENT OF CIVIL ENGINEERING
ASPHALT LABORATORY
Job Name: Date:
Material: Tested By:
Source:
Sample
NumberY1-12S Y1-6S Y1-J Y1-6N Y1-12N
Dry Weight
in Air, gm 1952.7 1843.2 1541.7 2069.9 1974.5
Sample
Volume, cc861 822 684 922 884
Bulk Specific
Gravity, Gmb2.265 2.241 2.253 2.243 2.231
KUSS Gmb
4/1/2008
Annette
TRC 0801
Yellville - Hwy. 62
Station 1
183

UNIVERSITY OF ARKANSAS
DEPARTMENT OF CIVIL ENGINEERING
ASPHALT LABORATORY
KUSS Gmb
183

UNIVERSITY OF ARKANSAS
DEPARTMENT OF CIVIL ENGINEERING
ASPHALT LABORATORYLABORATORY PERMEABILITY BY THE KAROL-WARNER METHOD
Project: Date:
Source: Tested By:
Sample
NumberY1-12S Y1-6S Y1-J Y1-6N Y1-12N
Standpipe inside dia., cm 3.175 3.175 3.175 3.175 3.175
Standpipe area, cm2 7.917304 7.917304 7.917304 7.917304 7.917304
Specimen height, mm 48.01 50.09 48.74 58.27 52.03
Specimen height, mm 51.83 48.13 45.81 56.41 48.96
Specimen height, mm 50.52 48.23 47.92 54.52 51.52
Specimen height, mm 49.24 48.09 46.83 57.83 52.93
Average specimen height, cm 4.990 4.864 4.733 5.676 5.136
Specimen diameter, mm 153.53 151.45 152.26 150.81 152.19
Specimen diameter, mm 152.09 151.71 151.85 150.99 151.84
Specimen diameter, mm 152.10 151.63 151.63 151.46 151.92
Specimen diameter, mm 152.26 151.27 151.92 150.62 151.56
Average specimen diameter, cm 15.250 15.152 15.192 15.097 15.188
Specimen Area, cm2 182.642 180.302 181.256 179.007 181.166
Time, initial (min.) 0.0 0.0 0.0 0.0 0.0
Ht. @ Time, initial 58.0 58.0 58.0 58.0 58.0
Time, final (min.) 0.9 0.5 0.3 0.5 0.7
Ht @ Time, final 0.0 0.0 0.0 0.0 0.0
Permeability 1 (k x 10-5
) 597.90 1055.28 1765.17 1295.04 822.38
Time, initial (min.) 0.0 0.0 0.0 0.0 0.0
Ht. @ Time, initial 58.0 58.0 58.0 58.0 58.0
Time, final (min.) 1.0 0.5 0.3 0.5 0.8
Ht @ Time, final 0.0 0.0 0.0 0.0 0.0
Permeability 2 (k x 10-5
) 539.79 1019.68 1749.00 1282.25 694.17
Average Permeability (k x 10-5
) 568.85 1037.48 1757.08 1288.65 758.27
Water Temp, F 68.0 68.0 68.0 68.0 68.0
Water Temp, C 20.0 20.0 20.0 20.0 20.0
RT Factor 1.0000 1.0000 1.0000 1.0000 1.0000
PERMEABILITY (k x 10-5) 568.85 1037.48 1757.08 1288.65 758.27
REP #2
TRC 0801 7/1/2008
Yellville - Hwy. 62 - Station 1 Leela
REP #1
184
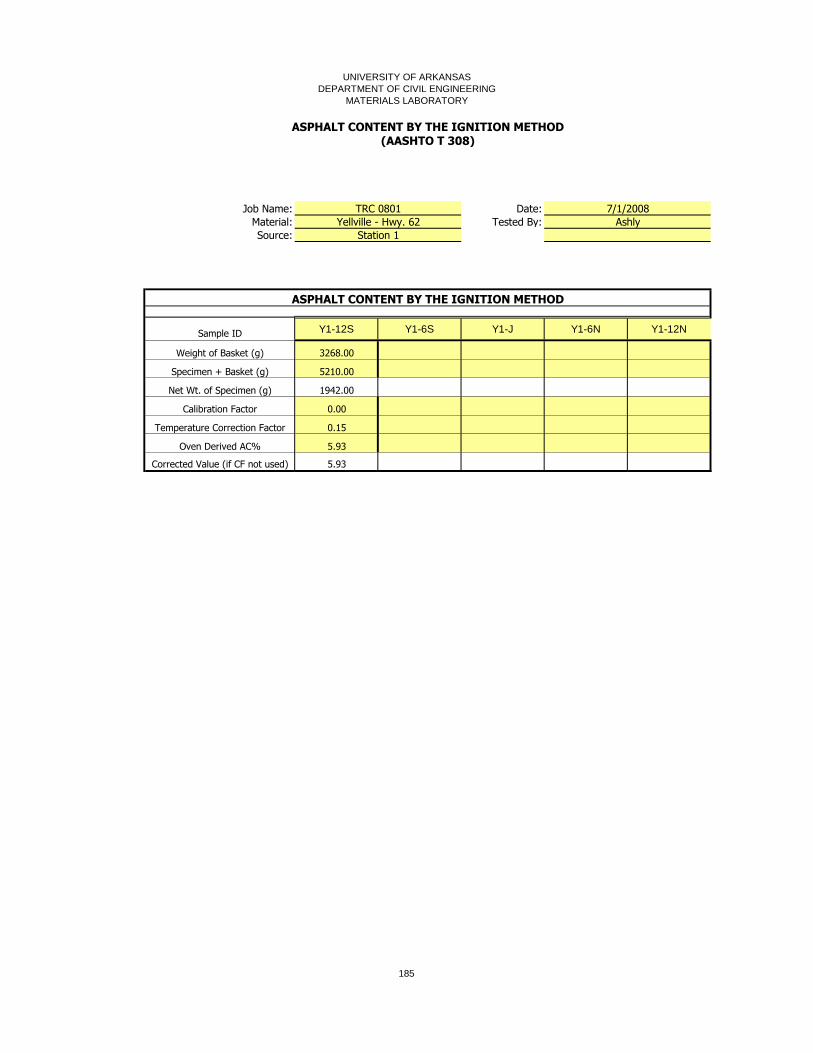
UNIVERSITY OF ARKANSAS
DEPARTMENT OF CIVIL ENGINEERING
MATERIALS LABORATORY
Job Name: Date:
Material: Tested By:
Source:
ASPHALT CONTENT BY THE IGNITION METHOD
Sample ID Y1-12S Y1-6S Y1-J Y1-6N Y1-12N
Weight of Basket (g) 3268.00
Specimen + Basket (g) 5210.00
Net Wt. of Specimen (g) 1942.00
Calibration Factor 0.00
Temperature Correction Factor 0.15
Oven Derived AC% 5.93
Corrected Value (if CF not used) 5.93
ASPHALT CONTENT BY THE IGNITION METHOD(AASHTO T 308)
TRC 0801 7/1/2008
Yellville - Hwy. 62 Ashly
Station 1
185
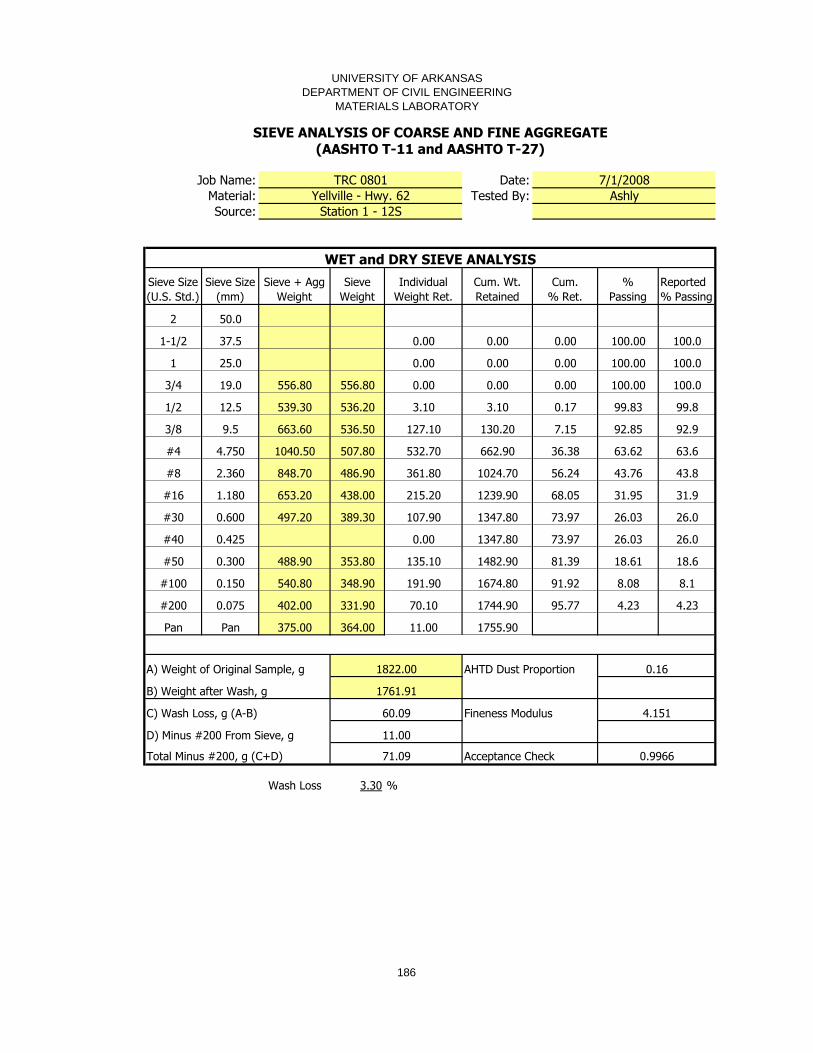
UNIVERSITY OF ARKANSAS
DEPARTMENT OF CIVIL ENGINEERING
MATERIALS LABORATORY
Job Name: Date:
Material: Tested By:
Source:
WET and DRY SIEVE ANALYSIS
Sieve Size
(U.S. Std.)
Sieve Size
(mm)
Sieve + Agg
Weight
Sieve
Weight
Individual
Weight Ret.
Cum. Wt.
Retained
Cum.
% Ret.
%
Passing
Reported
% Passing
2 50.0
1-1/2 37.5 0.00 0.00 0.00 100.00 100.0
1 25.0 0.00 0.00 0.00 100.00 100.0
3/4 19.0 556.80 556.80 0.00 0.00 0.00 100.00 100.0
1/2 12.5 539.30 536.20 3.10 3.10 0.17 99.83 99.8
3/8 9.5 663.60 536.50 127.10 130.20 7.15 92.85 92.9
#4 4.750 1040.50 507.80 532.70 662.90 36.38 63.62 63.6
#8 2.360 848.70 486.90 361.80 1024.70 56.24 43.76 43.8
#16 1.180 653.20 438.00 215.20 1239.90 68.05 31.95 31.9
#30 0.600 497.20 389.30 107.90 1347.80 73.97 26.03 26.0
#40 0.425 0.00 1347.80 73.97 26.03 26.0
#50 0.300 488.90 353.80 135.10 1482.90 81.39 18.61 18.6
#100 0.150 540.80 348.90 191.90 1674.80 91.92 8.08 8.1
#200 0.075 402.00 331.90 70.10 1744.90 95.77 4.23 4.23
Pan Pan 375.00 364.00 11.00 1755.90
A) Weight of Original Sample, g AHTD Dust Proportion
B) Weight after Wash, g
C) Wash Loss, g (A-B) Fineness Modulus
D) Minus #200 From Sieve, g
Total Minus #200, g (C+D) Acceptance Check
Wash Loss 3.30 %
11.00
71.09 0.9966
Station 1 - 12S
1822.00 0.16
1761.91
60.09 4.151
Yellville - Hwy. 62 Ashly
SIEVE ANALYSIS OF COARSE AND FINE AGGREGATE(AASHTO T-11 and AASHTO T-27)
TRC 0801 7/1/2008
186

UNIVERSITY OF ARKANSAS
DEPARTMENT OF CIVIL ENGINEERING
MATERIALS LABORATORY
Job Name: Date:
Material: Tested By:
Source:
WET and DRY SIEVE ANALYSIS
Sieve Size
(U.S. Std.)
Sieve Size
(mm)
Sieve + Agg
Weight
Sieve
Weight
Individual
Weight Ret.
Cum. Wt.
Retained
Cum.
% Ret.
%
Passing
Reported
% Passing
2 50.0
1-1/2 37.5 0.00 0.00 0.00 100.00 100.0
1 25.0 0.00 0.00 0.00 100.00 100.0
3/4 19.0 556.80 556.80 0.00 0.00 0.00 100.00 100.0
1/2 12.5 542.50 536.20 6.30 6.30 0.34 99.66 99.7
3/8 9.5 684.80 536.60 148.20 154.50 8.44 91.56 91.6
#4 4.750 1047.80 507.80 540.00 694.50 37.96 62.04 62.0
#8 2.360 839.20 487.00 352.20 1046.70 57.21 42.79 42.8
#16 1.180 646.80 438.00 208.80 1255.50 68.63 31.37 31.4
#30 0.600 500.30 389.30 111.00 1366.50 74.69 25.31 25.3
#40 0.425 0.00 1366.50 74.69 25.31 25.3
#50 0.300 473.50 353.80 119.70 1486.20 81.24 18.76 18.8
#100 0.150 520.30 348.70 171.60 1657.80 90.61 9.39 9.4
#200 0.075 425.50 332.00 93.50 1751.30 95.73 4.27 4.27
Pan Pan 367.20 364.00 3.20 1754.50
A) Weight of Original Sample, g AHTD Dust Proportion
B) Weight after Wash, g
C) Wash Loss, g (A-B) Fineness Modulus
D) Minus #200 From Sieve, g
Total Minus #200, g (C+D) Acceptance Check
Wash Loss 3.37 %
3.20
64.80 0.9924
Station 1 - 6S
1829.50 0.17
1767.90
61.60 4.188
Yellville - Hwy. 62 Ashly
SIEVE ANALYSIS OF COARSE AND FINE AGGREGATE(AASHTO T-11 and AASHTO T-27)
TRC 0801 7/1/2008
187

UNIVERSITY OF ARKANSAS
DEPARTMENT OF CIVIL ENGINEERING
MATERIALS LABORATORY
Job Name: Date:
Material: Tested By:
Source:
WET and DRY SIEVE ANALYSIS
Sieve Size
(U.S. Std.)
Sieve Size
(mm)
Sieve + Agg
Weight
Sieve
Weight
Individual
Weight Ret.
Cum. Wt.
Retained
Cum.
% Ret.
%
Passing
Reported
% Passing
2 50.0
1-1/2 37.5 0.00 0.00 0.00 100.00 100.0
1 25.0 0.00 0.00 0.00 100.00 100.0
3/4 19.0 551.60 551.50 0.10 0.10 0.01 99.99 100.0
1/2 12.5 557.50 527.60 29.90 30.00 1.73 98.27 98.3
3/8 9.5 683.10 521.50 161.60 191.60 11.06 88.94 88.9
#4 4.750 1046.80 507.30 539.50 731.10 42.22 57.78 57.8
#8 2.360 749.70 469.70 280.00 1011.10 58.38 41.62 41.6
#16 1.180 622.30 453.80 168.50 1179.60 68.11 31.89 31.9
#30 0.600 501.30 389.70 111.60 1291.20 74.56 25.44 25.4
#40 0.425 0.00 1291.20 74.56 25.44 25.4
#50 0.300 489.00 360.80 128.20 1419.40 81.96 18.04 18.0
#100 0.150 478.60 344.00 134.60 1554.00 89.73 10.27 10.3
#200 0.075 363.10 323.00 40.10 1594.10 92.05 7.95 7.95
Pan Pan 440.30 370.50 69.80 1663.90
A) Weight of Original Sample, g AHTD Dust Proportion
B) Weight after Wash, g
C) Wash Loss, g (A-B) Fineness Modulus
D) Minus #200 From Sieve, g
Total Minus #200, g (C+D) Acceptance Check
Wash Loss 2.95 %
69.80
120.90 0.9900
Station 1 - J
1731.80 0.31
1680.70
51.10 4.260
Yellville - Hwy. 62 Ashly
SIEVE ANALYSIS OF COARSE AND FINE AGGREGATE(AASHTO T-11 and AASHTO T-27)
TRC 0801 7/1/2008
188

UNIVERSITY OF ARKANSAS
DEPARTMENT OF CIVIL ENGINEERING
MATERIALS LABORATORY
Job Name: Date:
Material: Tested By:
Source:
WET and DRY SIEVE ANALYSIS
Sieve Size
(U.S. Std.)
Sieve Size
(mm)
Sieve + Agg
Weight
Sieve
Weight
Individual
Weight Ret.
Cum. Wt.
Retained
Cum.
% Ret.
%
Passing
Reported
% Passing
2 50.0
1-1/2 37.5 0.00 0.00 0.00 100.00 100.0
1 25.0 0.00 0.00 0.00 100.00 100.0
3/4 19.0 552.30 551.30 1.00 1.00 0.06 99.94 99.9
1/2 12.5 538.40 527.60 10.80 11.80 0.66 99.34 99.3
3/8 9.5 711.50 521.50 190.00 201.80 11.35 88.65 88.7
#4 4.750 1099.70 507.10 592.60 794.40 44.67 55.33 55.3
#8 2.360 772.10 469.70 302.40 1096.80 61.68 38.32 38.3
#16 1.180 632.40 454.00 178.40 1275.20 71.71 28.29 28.3
#30 0.600 473.80 389.70 84.10 1359.30 76.44 23.56 23.6
#40 0.425 0.00 1359.30 76.44 23.56 23.6
#50 0.300 473.90 360.80 113.10 1472.40 82.80 17.20 17.2
#100 0.150 500.70 344.10 156.60 1629.00 91.60 8.40 8.4
#200 0.075 356.30 323.10 33.20 1662.20 93.47 6.53 6.53
Pan Pan 425.40 370.50 54.90 1717.10
A) Weight of Original Sample, g AHTD Dust Proportion
B) Weight after Wash, g
C) Wash Loss, g (A-B) Fineness Modulus
D) Minus #200 From Sieve, g
Total Minus #200, g (C+D) Acceptance Check
Wash Loss 2.74 %
54.90
103.70 0.9928
Station 1 - 6N
1778.30 0.28
1729.50
48.80 4.403
Yellville - Hwy. 62 Ashly
SIEVE ANALYSIS OF COARSE AND FINE AGGREGATE(AASHTO T-11 and AASHTO T-27)
TRC 0801 7/1/2008
189

UNIVERSITY OF ARKANSAS
DEPARTMENT OF CIVIL ENGINEERING
MATERIALS LABORATORY
Job Name: Date:
Material: Tested By:
Source:
WET and DRY SIEVE ANALYSIS
Sieve Size
(U.S. Std.)
Sieve Size
(mm)
Sieve + Agg
Weight
Sieve
Weight
Individual
Weight Ret.
Cum. Wt.
Retained
Cum.
% Ret.
%
Passing
Reported
% Passing
2 50.0
1-1/2 37.5 0.00 0.00 0.00 100.00 100.0
1 25.0 0.00 0.00 0.00 100.00 100.0
3/4 19.0 551.40 551.40 0.00 0.00 0.00 100.00 100.0
1/2 12.5 567.00 527.60 39.40 39.40 2.13 97.87 97.9
3/8 9.5 750.30 521.50 228.80 268.20 14.47 85.53 85.5
#4 4.750 1192.40 507.20 685.20 953.40 51.45 48.55 48.6
#8 2.360 798.80 469.70 329.10 1282.50 69.21 30.79 30.8
#16 1.180 619.70 453.90 165.80 1448.30 78.16 21.84 21.8
#30 0.600 477.70 389.70 88.00 1536.30 82.90 17.10 17.1
#40 0.425 0.00 1536.30 82.90 17.10 17.1
#50 0.300 454.70 360.80 93.90 1630.20 87.97 12.03 12.0
#100 0.150 456.70 344.10 112.60 1742.80 94.05 5.95 6.0
#200 0.075 322.30 323.00 -0.70 1742.10 94.01 5.99 5.99
Pan Pan 430.40 370.50 59.90 1802.00
A) Weight of Original Sample, g AHTD Dust Proportion
B) Weight after Wash, g
C) Wash Loss, g (A-B) Fineness Modulus
D) Minus #200 From Sieve, g
Total Minus #200, g (C+D) Acceptance Check
Wash Loss 2.53 %
59.90
106.70 0.9976
Station 1 - 12N
1853.10 0.35
1806.30
46.80 4.782
Yellville - Hwy. 62 Ashly
SIEVE ANALYSIS OF COARSE AND FINE AGGREGATE(AASHTO T-11 and AASHTO T-27)
TRC 0801 7/1/2008
190

UNIVERSITY OF ARKANSAS
DEPARTMENT OF CIVIL ENGINEERING
MATERIALS LABORATORY
BULK SPECIFIC GRAVITY AND % AIR VOIDS OF COMPACTED BITUMINOUS
MIXTURES USING SSD SPECIMENS (AASHTO T-166, T-269)
Job Name: TRC 0801 Date:
Material: Tested By:
Source: Station 2
Sample
NumberY2-12S Y2-6S Y2-J Y2-6N Y2-12N
Dry Weight
in Air, gm
(A)
2061.6 1920.9 1533.9 1975.4 2059.2
Submerged
Weight, gm
(C)
1178.6 1086.7 858.1 1121.0 1166.0
SSD
Weight, gm
(B)
2090.2 1953.3 1611.7 2009.9 2093.9
Bulk Specific
Gravity, Gmb
(D)=A/(B-C)
2.262 2.217 2.035 2.222 2.219
Percent Water Absorbed
by Volume
(E)=(B-A)/(B-C) * 100
3.1 3.7 10.3 3.9 3.7
Note: if Percent Water Absorbed > 2%, Determine Gmb using AASHTO T-275
Yellville - Hwy. 62 Annette
4/1/2008
191
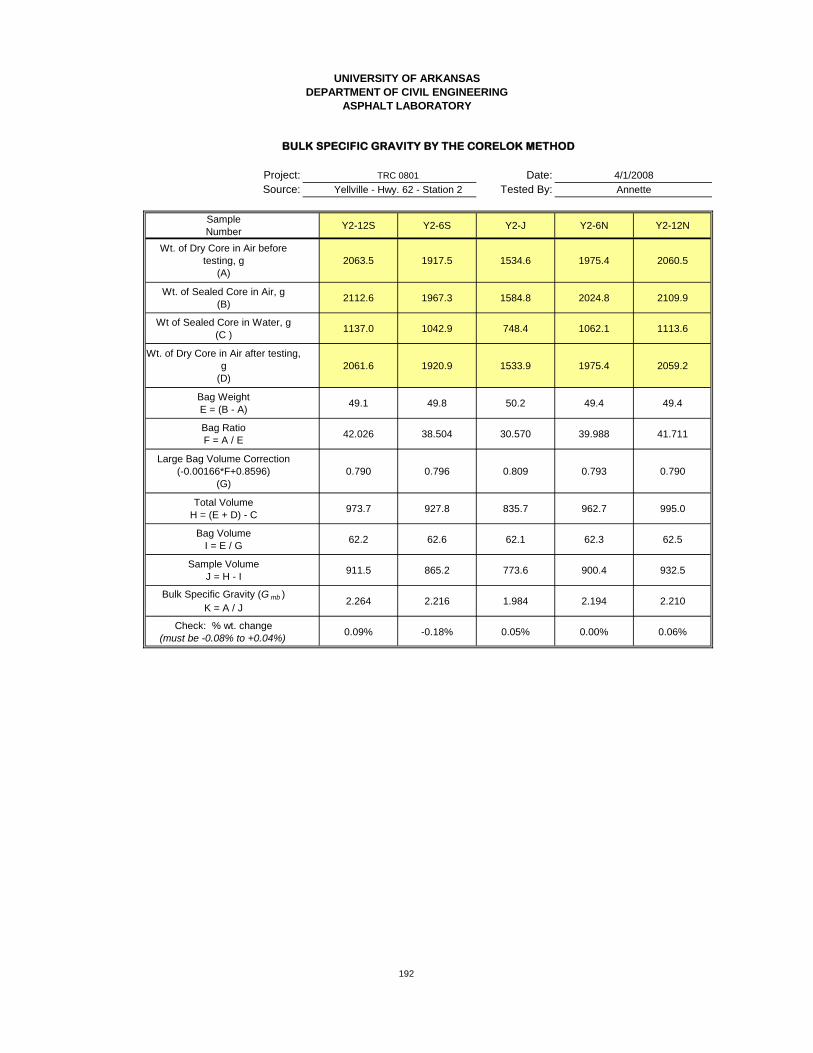
UNIVERSITY OF ARKANSAS
DEPARTMENT OF CIVIL ENGINEERING
ASPHALT LABORATORY
BULK SPECIFIC GRAVITY BY THE CORELOK METHOD
Project: Date:
Source: Tested By:
Sample
NumberY2-12S Y2-6S Y2-J Y2-6N Y2-12N
Wt. of Dry Core in Air before
testing, g
(A)
2063.5 1917.5 1534.6 1975.4 2060.5
Wt. of Sealed Core in Air, g
(B)2112.6 1967.3 1584.8 2024.8 2109.9
Wt of Sealed Core in Water, g
(C )1137.0 1042.9 748.4 1062.1 1113.6
Wt. of Dry Core in Air after testing,
g
(D)
2061.6 1920.9 1533.9 1975.4 2059.2
Bag Weight
E = (B - A)49.1 49.8 50.2 49.4 49.4
Bag Ratio
F = A / E42.026 38.504 30.570 39.988 41.711
Large Bag Volume Correction
(-0.00166*F+0.8596)
(G)
0.790 0.796 0.809 0.793 0.790
Total Volume
H = (E + D) - C973.7 927.8 835.7 962.7 995.0
Bag Volume
I = E / G62.2 62.6 62.1 62.3 62.5
Sample Volume
J = H - I911.5 865.2 773.6 900.4 932.5
Bulk Specific Gravity (G mb )
K = A / J2.264 2.216 1.984 2.194 2.210
Check: % wt. change
(must be -0.08% to +0.04%)0.09% -0.18% 0.05% 0.00% 0.06%
TRC 0801 4/1/2008
Yellville - Hwy. 62 - Station 2 Annette
192
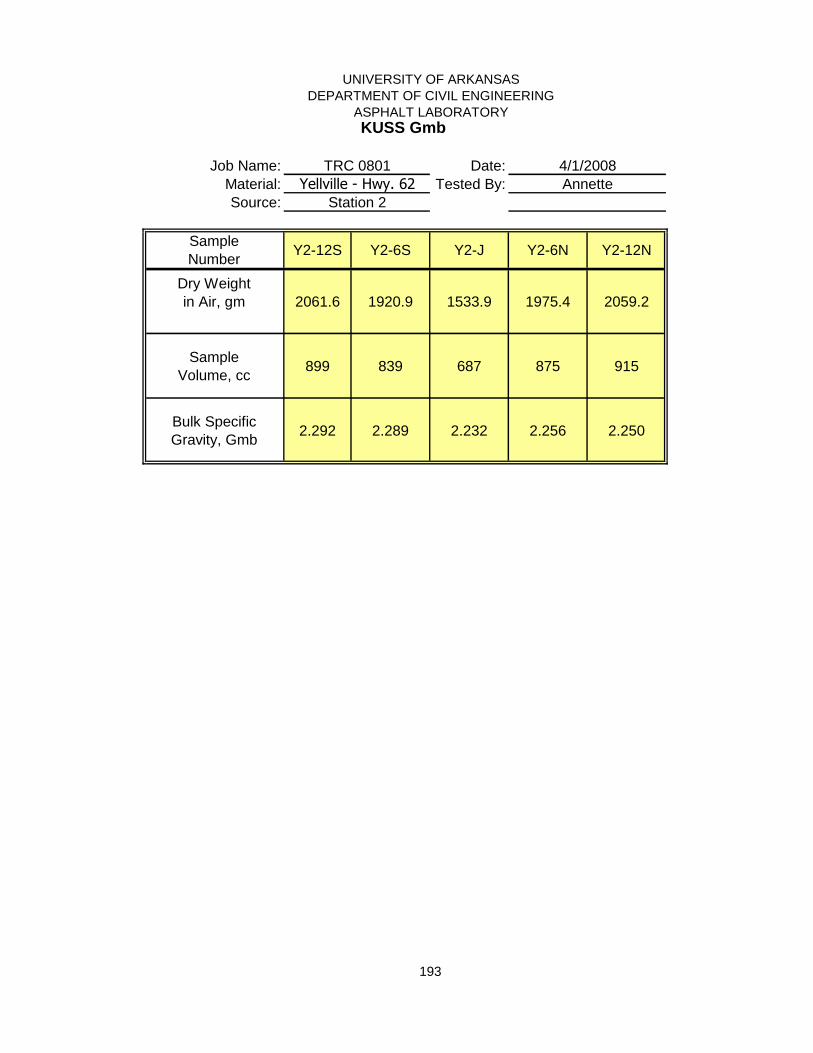
UNIVERSITY OF ARKANSAS
DEPARTMENT OF CIVIL ENGINEERING
ASPHALT LABORATORY
Job Name: Date:
Material: Tested By:
Source:
Sample
NumberY2-12S Y2-6S Y2-J Y2-6N Y2-12N
Dry Weight
in Air, gm 2061.6 1920.9 1533.9 1975.4 2059.2
Sample
Volume, cc899 839 687 875 915
Bulk Specific
Gravity, Gmb2.292 2.289 2.232 2.256 2.250
KUSS Gmb
4/1/2008
Annette
TRC 0801
Yellville - Hwy. 62
Station 2
193

UNIVERSITY OF ARKANSAS
DEPARTMENT OF CIVIL ENGINEERING
ASPHALT LABORATORY
Project: Date:
Source: Tested By:
Sample
NumberY2-12S Y2-6S Y2-J Y2-6N Y2-12N
Standpipe inside dia., cm 3.175 3.175 3.175 3.175 3.175
Standpipe area, cm2 7.917304 7.917304 7.917304 7.917304 7.917304
Specimen height, mm 48.58 50.50 45.60 52.15 52.21
Specimen height, mm 52.54 49.83 44.41 50.27 55.80
Specimen height, mm 54.58 48.33 44.25 51.21 53.53
Specimen height, mm 51.33 47.84 45.15 50.31 51.47
Average specimen height, cm 5.176 4.913 4.485 5.099 5.325
Specimen diameter, mm 151.85 152.49 151.48 153.60 152.61
Specimen diameter, mm 151.22 151.91 151.39 152.18 152.33
Specimen diameter, mm 151.12 151.92 151.70 152.87 152.39
Specimen diameter, mm 152.28 150.94 151.98 152.83 152.25
Average specimen diameter, cm 15.162 15.182 15.164 15.287 15.240
Specimen Area, cm2 180.546 181.017 180.594 183.542 182.403
Time, initial (min.) 0.0 0.0 0.0 0.0 0.0
Ht. @ Time, initial 58.0 58.0 58.0 58.0 58.0
Time, final (min.) 8.6 2.1 0.2 1.4 3.3
Ht @ Time, final 0.0 0.0 0.0 0.0 0.0
Permeability 1 (k x 10-5
) 68.19 270.75 2744.78 395.80 181.78
Time, initial (min.) 0.0 0.0 0.0 0.0 0.0
Ht. @ Time, initial 58.0 58.0 58.0 58.0 58.0
Time, final (min.) 8.7 2.1 0.2 1.5 3.3
Ht @ Time, final 0.0 0.0 0.0 0.0 0.0
Permeability 2 (k x 10-5
) 67.17 263.88 3310.05 386.64 179.11
Average Permeability (k x 10-5
) 67.68 267.32 3027.41 391.22 180.45
Water Temp, F 68.0 68.0 68.0 68.0 68.0
Water Temp, C 20.0 20.0 20.0 20.0 20.0
RT Factor 1.0000 1.0000 1.0000 1.0000 1.0000
PERMEABILITY (k x 10-5) 67.68 267.32 3027.41 391.22 180.45
LABORATORY PERMEABILITY BY THE KAROL-WARNER METHOD
REP #2
TRC 0801 7/1/2008
Yellville - Hwy. 62 - Station 2 Leela
REP #1
194

UNIVERSITY OF ARKANSAS
DEPARTMENT OF CIVIL ENGINEERING
MATERIALS LABORATORY
Job Name: Date:
Material: Tested By:
Source:
ASPHALT CONTENT BY THE IGNITION METHOD
Test Samples
Sample ID Y2-12S Y2-6S Y2-J Y2-6N Y2-12N
Weight of Basket (g) 3274.10 3265.50
Specimen + Basket (g) 4799.50 5186.80
Net Wt. of Specimen (g) 1525.40 1921.30
Calibration Factor 0.00 0.00
Temperature Correction Factor 0.39 0.29
Oven Derived AC% 3.35 5.49
Corrected Value (if CF not used) 3.35 5.49
ASPHALT CONTENT BY THE IGNITION METHOD(AASHTO T 308)
TRC 0801 7/1/2008
Yellville - Hwy. 62 Ashly
Station 2
195

UNIVERSITY OF ARKANSAS
DEPARTMENT OF CIVIL ENGINEERING
MATERIALS LABORATORY
Job Name: Date:
Material: Tested By:
Source:
WET and DRY SIEVE ANALYSIS
Sieve Size
(U.S. Std.)
Sieve Size
(mm)
Sieve + Agg
Weight
Sieve
Weight
Individual
Weight Ret.
Cum. Wt.
Retained
Cum.
% Ret.
%
Passing
Reported
% Passing
2 50.0
1-1/2 37.5 0.00 0.00 0.00 100.00 100.0
1 25.0 0.00 0.00 0.00 100.00 100.0
3/4 19.0 560.60 560.00 0.60 0.60 0.04 99.96 100.0
1/2 12.5 535.70 523.20 12.50 13.10 0.82 99.18 99.2
3/8 9.5 630.60 549.00 81.60 94.70 5.95 94.05 94.1
#4 4.750 984.50 506.20 478.30 573.00 35.98 64.02 64.0
#8 2.360 779.30 441.00 338.30 911.30 57.23 42.77 42.8
#16 1.180 610.30 442.50 167.80 1079.10 67.77 32.23 32.2
#30 0.600 494.90 377.40 117.50 1196.60 75.14 24.86 24.9
#40 0.425 0.00 1196.60 75.14 24.86 24.9
#50 0.300 480.80 367.30 113.50 1310.10 82.27 17.73 17.7
#100 0.150 473.80 339.10 134.70 1444.80 90.73 9.27 9.3
#200 0.075 368.60 325.60 43.00 1487.80 93.43 6.57 6.57
Pan Pan 403.70 368.50 35.20 1523.00
A) Weight of Original Sample, g AHTD Dust Proportion
B) Weight after Wash, g
C) Wash Loss, g (A-B) Fineness Modulus
D) Minus #200 From Sieve, g
Total Minus #200, g (C+D) Acceptance Check
Wash Loss 2.92 %
35.20
81.70 0.9852
Station 2 - 12S
1592.40 0.26
1545.90
46.50 4.151
Yellville - Hwy. 62 Ashly
SIEVE ANALYSIS OF COARSE AND FINE AGGREGATE(AASHTO T-11 and AASHTO T-27)
TRC 0801 7/1/2008
196

UNIVERSITY OF ARKANSAS
DEPARTMENT OF CIVIL ENGINEERING
MATERIALS LABORATORY
Job Name: Date:
Material: Tested By:
Source:
WET and DRY SIEVE ANALYSIS
Sieve Size
(U.S. Std.)
Sieve Size
(mm)
Sieve + Agg
Weight
Sieve
Weight
Individual
Weight Ret.
Cum. Wt.
Retained
Cum.
% Ret.
%
Passing
Reported
% Passing
2 50.0
1-1/2 37.5 0.00 0.00 0.00 100.00 100.0
1 25.0 0.00 0.00 0.00 100.00 100.0
3/4 19.0 551.60 551.60 0.00 0.00 0.00 100.00 100.0
1/2 12.5 538.20 527.70 10.50 10.50 0.59 99.41 99.4
3/8 9.5 649.80 521.40 128.40 138.90 7.76 92.24 92.2
#4 4.750 1008.70 507.20 501.50 640.40 35.78 64.22 64.2
#8 2.360 846.70 469.20 377.50 1017.90 56.87 43.13 43.1
#16 1.180 668.50 453.60 214.90 1232.80 68.88 31.12 31.1
#30 0.600 501.70 389.50 112.20 1345.00 75.15 24.85 24.9
#40 0.425 0.00 1345.00 75.15 24.85 24.9
#50 0.300 483.40 360.40 123.00 1468.00 82.02 17.98 18.0
#100 0.150 501.20 343.30 157.90 1625.90 90.84 9.16 9.2
#200 0.075 335.60 322.50 13.10 1639.00 91.57 8.43 8.43
Pan Pan 462.90 370.10 92.80 1731.80
A) Weight of Original Sample, g AHTD Dust Proportion
B) Weight after Wash, g
C) Wash Loss, g (A-B) Fineness Modulus
D) Minus #200 From Sieve, g
Total Minus #200, g (C+D) Acceptance Check
Wash Loss 2.75 %
92.80
142.10 0.9950
Station 2 - 6S
1789.80 0.34
1740.50
49.30 4.173
Yellville - Hwy. 62 Ashly
SIEVE ANALYSIS OF COARSE AND FINE AGGREGATE(AASHTO T-11 and AASHTO T-27)
TRC 0801 7/1/2008
197

UNIVERSITY OF ARKANSAS
DEPARTMENT OF CIVIL ENGINEERING
MATERIALS LABORATORY
Job Name: Date:
Material: Tested By:
Source:
WET and DRY SIEVE ANALYSIS
Sieve Size
(U.S. Std.)
Sieve Size
(mm)
Sieve + Agg
Weight
Sieve
Weight
Individual
Weight Ret.
Cum. Wt.
Retained
Cum.
% Ret.
%
Passing
Reported
% Passing
2 50.0
1-1/2 37.5 0.00 0.00 0.00 100.00 100.0
1 25.0 0.00 0.00 0.00 100.00 100.0
3/4 19.0 551.50 551.50 0.00 0.00 0.00 100.00 100.0
1/2 12.5 530.60 527.90 2.70 2.70 0.19 99.81 99.8
3/8 9.5 648.50 521.50 127.00 129.70 9.10 90.90 90.9
#4 4.750 945.50 507.60 437.90 567.60 39.85 60.15 60.2
#8 2.360 739.50 469.40 270.10 837.70 58.81 41.19 41.2
#16 1.180 576.90 454.10 122.80 960.50 67.43 32.57 32.6
#30 0.600 462.30 389.50 72.80 1033.30 72.54 27.46 27.5
#40 0.425 0.00 1033.30 72.54 27.46 27.5
#50 0.300 452.90 360.20 92.70 1126.00 79.05 20.95 21.0
#100 0.150 484.10 343.60 140.50 1266.50 88.91 11.09 11.1
#200 0.075 353.20 322.50 30.70 1297.20 91.06 8.94 8.94
Pan Pan 407.20 370.20 37.00 1334.20
A) Weight of Original Sample, g AHTD Dust Proportion
B) Weight after Wash, g
C) Wash Loss, g (A-B) Fineness Modulus
D) Minus #200 From Sieve, g
Total Minus #200, g (C+D) Acceptance Check
Wash Loss 5.38 %
37.00
113.70 0.9899
Station 2 - J
1424.50 0.33
1347.80
76.70 4.157
Yellville - Hwy. 62 Ashly
SIEVE ANALYSIS OF COARSE AND FINE AGGREGATE(AASHTO T-11 and AASHTO T-27)
TRC 0801 7/1/2008
9/21/2010 198 Sieve Y2-J

UNIVERSITY OF ARKANSAS
DEPARTMENT OF CIVIL ENGINEERING
MATERIALS LABORATORY
Job Name: Date:
Material: Tested By:
Source:
WET and DRY SIEVE ANALYSIS
Sieve Size
(U.S. Std.)
Sieve Size
(mm)
Sieve + Agg
Weight
Sieve
Weight
Individual
Weight Ret.
Cum. Wt.
Retained
Cum.
% Ret.
%
Passing
Reported
% Passing
2 50.0
1-1/2 37.5 0.00 0.00 0.00 100.00 100.0
1 25.0 0.00 0.00 0.00 100.00 100.0
3/4 19.0 561.00 561.00 0.00 0.00 0.00 100.00 100.0
1/2 12.5 540.00 524.00 16.00 16.00 0.89 99.11 99.1
3/8 9.5 704.00 550.00 154.00 170.00 9.43 90.57 90.6
#4 4.750 1107.90 507.00 600.90 770.90 42.78 57.22 57.2
#8 2.360 768.40 441.40 327.00 1097.90 60.93 39.07 39.1
#16 1.180 626.00 443.50 182.50 1280.40 71.05 28.95 28.9
#30 0.600 470.60 378.20 92.40 1372.80 76.18 23.82 23.8
#40 0.425 0.00 1372.80 76.18 23.82 23.8
#50 0.300 477.70 368.10 109.60 1482.40 82.26 17.74 17.7
#100 0.150 496.10 340.00 156.10 1638.50 90.93 9.07 9.1
#200 0.075 378.80 326.50 52.30 1690.80 93.83 6.17 6.17
Pan Pan 399.60 369.40 30.20 1721.00
A) Weight of Original Sample, g AHTD Dust Proportion
B) Weight after Wash, g
C) Wash Loss, g (A-B) Fineness Modulus
D) Minus #200 From Sieve, g
Total Minus #200, g (C+D) Acceptance Check
Wash Loss 3.88 %
30.20
100.10 0.9936
Station 2 - 6N
1802.00 0.26
1732.10
69.90 4.336
Yellville - Hwy. 62 Ashly
SIEVE ANALYSIS OF COARSE AND FINE AGGREGATE(AASHTO T-11 and AASHTO T-27)
TRC 0801 7/1/2008
9/21/2010 199 Sieve Y2-6N

UNIVERSITY OF ARKANSAS
DEPARTMENT OF CIVIL ENGINEERING
MATERIALS LABORATORY
Job Name: Date:
Material: Tested By:
Source:
WET and DRY SIEVE ANALYSIS
Sieve Size
(U.S. Std.)
Sieve Size
(mm)
Sieve + Agg
Weight
Sieve
Weight
Individual
Weight Ret.
Cum. Wt.
Retained
Cum.
% Ret.
%
Passing
Reported
% Passing
2 50.0
1-1/2 37.5 0.00 0.00 0.00 100.00 100.0
1 25.0 0.00 0.00 0.00 100.00 100.0
3/4 19.0 558.30 551.40 6.90 6.90 0.37 99.63 99.6
1/2 12.5 582.40 527.50 54.90 61.80 3.28 96.72 96.7
3/8 9.5 701.40 520.10 181.30 243.10 12.92 87.08 87.1
#4 4.750 1007.80 505.60 502.20 745.30 39.60 60.40 60.4
#8 2.360 832.60 468.90 363.70 1109.00 58.93 41.07 41.1
#16 1.180 684.80 453.60 231.20 1340.20 71.21 28.79 28.8
#30 0.600 490.30 389.40 100.90 1441.10 76.57 23.43 23.4
#40 0.425 0.00 1441.10 76.57 23.43 23.4
#50 0.300 468.40 360.40 108.00 1549.10 82.31 17.69 17.7
#100 0.150 510.60 343.30 167.30 1716.40 91.20 8.80 8.8
#200 0.075 353.70 322.40 31.30 1747.70 92.86 7.14 7.14
Pan Pan 427.30 370.00 57.30 1805.00
A) Weight of Original Sample, g AHTD Dust Proportion
B) Weight after Wash, g
C) Wash Loss, g (A-B) Fineness Modulus
D) Minus #200 From Sieve, g
Total Minus #200, g (C+D) Acceptance Check
Wash Loss 3.65 %
57.30
126.00 0.9954
Station 2 - 12N
1882.00 0.30
1813.30
68.70 4.331
Yellville - Hwy. 62 Ashly
SIEVE ANALYSIS OF COARSE AND FINE AGGREGATE(AASHTO T-11 and AASHTO T-27)
TRC 0801 7/1/2008
200

UNIVERSITY OF ARKANSAS
DEPARTMENT OF CIVIL ENGINEERING
MATERIALS LABORATORY
BULK SPECIFIC GRAVITY AND % AIR VOIDS OF COMPACTED BITUMINOUS
MIXTURES USING SSD SPECIMENS (AASHTO T-166, T-269)
Job Name: TRC 0801 Date:
Material: Tested By:
Source: Station 3
Sample
NumberY3-12S Y3-6S Y3-J Y3-6N Y3-12N
Dry Weight
in Air, gm
(A)
1945.3 1679.3 1706.2 1916.6 1985.8
Submerged
Weight, gm
(C)
1103.8 947.7 954.9 1082.4 1116.0
SSD
Weight, gm
(B)
1976.6 1721.6 1800.6 1947.1 2010.3
Bulk Specific
Gravity, Gmb
(D)=A/(B-C)
2.229 2.170 2.018 2.216 2.221
Percent Water Absorbed
by Volume
(E)=(B-A)/(B-C) * 100
3.6 5.5 11.2 3.5 2.7
Note: if Percent Water Absorbed > 2%, Determine Gmb using AASHTO T-275
Yellville - Hwy. 62 Annette
4/1/2008
201

UNIVERSITY OF ARKANSAS
DEPARTMENT OF CIVIL ENGINEERING
ASPHALT LABORATORY
BULK SPECIFIC GRAVITY BY THE CORELOK METHOD
Project: Date:
Source: Tested By:
Sample
NumberY3-12S Y3-6S Y3-J Y3-6N Y3-12N
Wt. of Dry Core in Air before
testing, g
(A)
1945.6 1679.9 1706.2 1918.5 1985.9
Wt. of Sealed Core in Air, g
(B)1995.7 1730.0 1757.0 1967.8 2034.9
Wt of Sealed Core in Water, g
(C )1059.8 891.5 835.8 1035.4 1080.8
Wt. of Dry Core in Air after testing,
g
(D)
1945.3 1679.3 1706.2 1916.6 1985.8
Bag Weight
E = (B - A)50.1 50.1 50.8 49.3 49.0
Bag Ratio
F = A / E38.834 33.531 33.587 38.915 40.529
Large Bag Volume Correction
(-0.00166*F+0.8596)
(G)
0.795 0.804 0.804 0.795 0.792
Total Volume
H = (E + D) - C935.6 837.9 921.2 930.5 954.0
Bag Volume
I = E / G63.0 62.3 63.2 62.0 61.8
Sample Volume
J = H - I872.6 775.6 858.0 868.5 892.2
Bulk Specific Gravity (G mb )
K = A / J2.230 2.166 1.989 2.209 2.226
Check: % wt. change
(must be -0.08% to +0.04%)0.02% 0.04% 0.00% 0.10% 0.01%
TRC 0801 4/1/2008
Yellville - Hwy. 62 - Station 3 Annette
202

UNIVERSITY OF ARKANSAS
DEPARTMENT OF CIVIL ENGINEERING
ASPHALT LABORATORY
Job Name: Date:
Material: Tested By:
Source:
Sample
NumberY3-12S Y3-6S Y3-J Y3-6N Y3-12N
Dry Weight
in Air, gm 1945.3 1679.3 1706.2 1916.6 1985.8
Sample
Volume, cc858 751 756 982 875
Bulk Specific
Gravity, Gmb2.265 2.234 2.257 1.950 2.269
KUSS Gmb
4/1/2008
Annette
TRC 0801
Yellville - Hwy. 62
Station 3
203

UNIVERSITY OF ARKANSAS
DEPARTMENT OF CIVIL ENGINEERING
ASPHALT LABORATORYLABORATORY PERMEABILITY BY THE KAROL-WARNER METHOD
Project: Date:
Source: Tested By:
Sample
NumberY3-12S Y3-6S Y3-J Y3-6N Y3-12N
Standpipe inside dia., cm 3.175 3.175 3.175 3.175 3.175
Standpipe area, cm2 7.917304 7.917304 7.917304 7.917304 7.917304
Specimen height, mm 47.82 45.24 49.27 47.52 52.40
Specimen height, mm 50.41 44.17 50.10 49.60 52.78
Specimen height, mm 51.38 43.85 50.55 47.12 50.99
Specimen height, mm 49.87 44.99 48.22 49.54 49.40
Average specimen height, cm 4.987 4.456 4.954 4.845 5.139
Specimen diameter, mm 152.00 151.68 151.18 151.07 151.24
Specimen diameter, mm 152.33 151.31 152.44 150.59 151.44
Specimen diameter, mm 152.34 151.43 151.96 151.41 151.16
Specimen diameter, mm 152.15 150.74 152.45 151.29 152.32
Average specimen diameter, cm 15.221 15.129 15.201 15.109 15.154
Specimen Area, cm2 181.948 179.767 181.476 179.292 180.362
Time, initial (min.) 0.0 0.0 0.0 0.0 0.0
Ht. @ Time, initial 58.0 58.0 58.0 58.0 58.0
Time, final (min.) 2.3 0.9 0.3 2.5 3.7
Ht @ Time, final 0.0 0.0 0.0 0.0 0.0
Permeability 1 (k x 10-5
) 240.11 539.14 1656.93 222.33 159.73
Time, initial (min.) 0.0 0.0 0.0 0.0 0.0
Ht. @ Time, initial 58.0 58.0 58.0 58.0 58.0
Time, final (min.) 2.0 1.0 0.3 2.8 3.2
Ht @ Time, final 0.0 0.0 0.0 0.0 0.0
Permeability 2 (k x 10-5
) 275.55 528.93 1828.44 197.41 184.02
Average Permeability (k x 10-5
) 257.83 534.04 1742.69 209.87 171.87
Water Temp, F 68.0 68.0 68.0 68.0 68.0
Water Temp, C 20.0 20.0 20.0 20.0 20.0
RT Factor 1.0000 1.0000 1.0000 1.0000 1.0000
PERMEABILITY (k x 10-5) 257.83 534.04 1742.69 209.87 171.87
REP #2
TRC 0801 7/1/2008
Yellville - Hwy. 62 - Station 3 Leela
REP #1
204
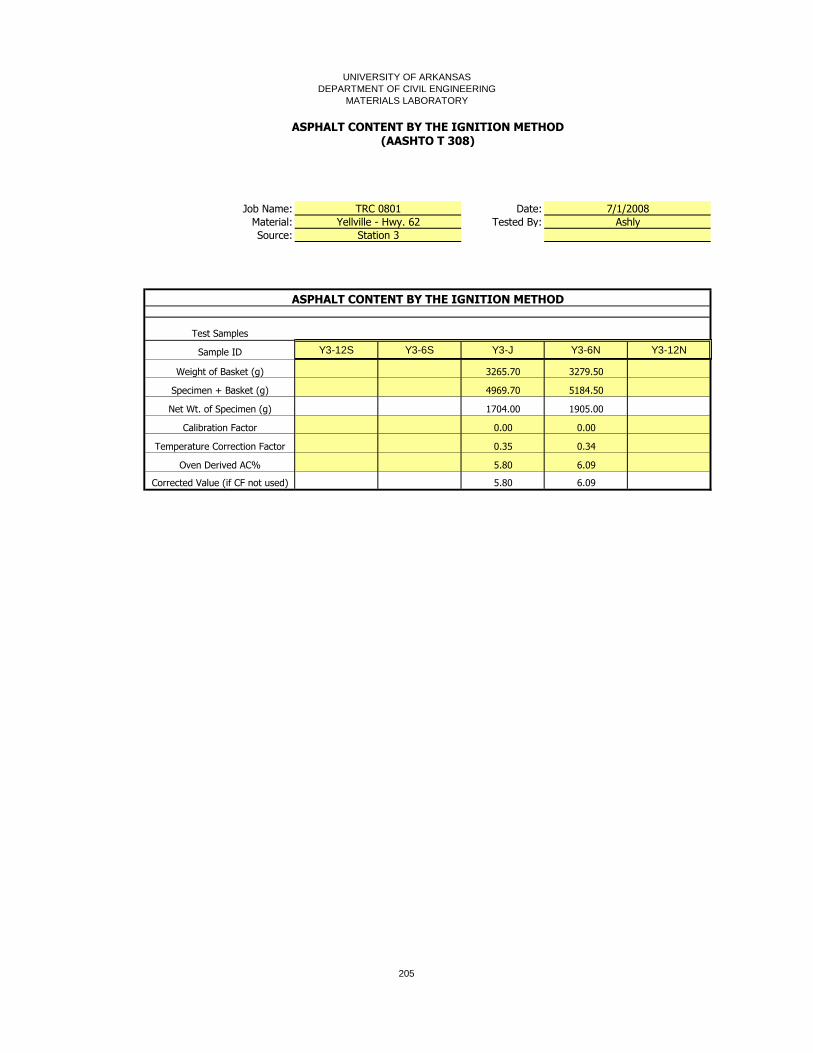
UNIVERSITY OF ARKANSAS
DEPARTMENT OF CIVIL ENGINEERING
MATERIALS LABORATORY
Job Name: Date:
Material: Tested By:
Source:
ASPHALT CONTENT BY THE IGNITION METHOD
Test Samples
Sample ID Y3-12S Y3-6S Y3-J Y3-6N Y3-12N
Weight of Basket (g) 3265.70 3279.50
Specimen + Basket (g) 4969.70 5184.50
Net Wt. of Specimen (g) 1704.00 1905.00
Calibration Factor 0.00 0.00
Temperature Correction Factor 0.35 0.34
Oven Derived AC% 5.80 6.09
Corrected Value (if CF not used) 5.80 6.09
Yellville - Hwy. 62 Ashly
Station 3
ASPHALT CONTENT BY THE IGNITION METHOD(AASHTO T 308)
TRC 0801 7/1/2008
205

UNIVERSITY OF ARKANSAS
DEPARTMENT OF CIVIL ENGINEERING
MATERIALS LABORATORY
Job Name: Date:
Material: Tested By:
Source:
WET and DRY SIEVE ANALYSIS
Sieve Size
(U.S. Std.)
Sieve Size
(mm)
Sieve + Agg
Weight
Sieve
Weight
Individual
Weight Ret.
Cum. Wt.
Retained
Cum.
% Ret.
%
Passing
Reported
% Passing
2 50.0
1-1/2 37.5 0.00 0.00 0.00 100.00 100.0
1 25.0 0.00 0.00 0.00 100.00 100.0
3/4 19.0 560.20 560.00 0.20 0.20 0.01 99.99 100.0
1/2 12.5 544.20 523.20 21.00 21.20 1.16 98.84 98.8
3/8 9.5 650.40 549.10 101.30 122.50 6.73 93.27 93.3
#4 4.750 1096.70 506.20 590.50 713.00 39.17 60.83 60.8
#8 2.360 817.20 440.90 376.30 1089.30 59.84 40.16 40.2
#16 1.180 657.30 442.50 214.80 1304.10 71.63 28.37 28.4
#30 0.600 485.10 377.40 107.70 1411.80 77.55 22.45 22.4
#40 0.425 0.00 1411.80 77.55 22.45 22.4
#50 0.300 483.30 367.30 116.00 1527.80 83.92 16.08 16.1
#100 0.150 489.10 339.00 150.10 1677.90 92.17 7.83 7.8
#200 0.075 379.10 325.60 53.50 1731.40 95.11 4.89 4.89
Pan Pan 406.30 368.40 37.90 1769.30
A) Weight of Original Sample, g AHTD Dust Proportion
B) Weight after Wash, g
C) Wash Loss, g (A-B) Fineness Modulus
D) Minus #200 From Sieve, g
Total Minus #200, g (C+D) Acceptance Check
Wash Loss 2.68 %
Yellville - Hwy. 62 Ashly
SIEVE ANALYSIS OF COARSE AND FINE AGGREGATE(AASHTO T-11 and AASHTO T-27)
TRC 0801 7/1/2008
37.90
86.60 0.9986
Station 3 - 12S
1820.50 0.22
1771.80
48.70 4.310
206

UNIVERSITY OF ARKANSAS
DEPARTMENT OF CIVIL ENGINEERING
MATERIALS LABORATORY
Job Name: Date:
Material: Tested By:
Source:
WET and DRY SIEVE ANALYSIS
Sieve Size
(U.S. Std.)
Sieve Size
(mm)
Sieve + Agg
Weight
Sieve
Weight
Individual
Weight Ret.
Cum. Wt.
Retained
Cum.
% Ret.
%
Passing
Reported
% Passing
2 50.0
1-1/2 37.5 0.00 0.00 0.00 100.00 100.0
1 25.0 0.00 0.00 0.00 100.00 100.0
3/4 19.0 560.20 560.20 0.00 0.00 0.00 100.00 100.0
1/2 12.5 528.00 522.80 5.20 5.20 0.33 99.67 99.7
3/8 9.5 659.40 548.70 110.70 115.90 7.39 92.61 92.6
#4 4.750 964.50 506.00 458.50 574.40 36.60 63.40 63.4
#8 2.360 774.60 441.10 333.50 907.90 57.86 42.14 42.1
#16 1.180 634.70 442.40 192.30 1100.20 70.11 29.89 29.9
#30 0.600 470.90 377.50 93.40 1193.60 76.06 23.94 23.9
#40 0.425 0.00 1193.60 76.06 23.94 23.9
#50 0.300 472.70 367.40 105.30 1298.90 82.77 17.23 17.2
#100 0.150 482.60 339.10 143.50 1442.40 91.92 8.08 8.1
#200 0.075 375.30 325.80 49.50 1491.90 95.07 4.93 4.93
Pan Pan 403.00 368.70 34.30 1526.20
A) Weight of Original Sample, g AHTD Dust Proportion
B) Weight after Wash, g
C) Wash Loss, g (A-B) Fineness Modulus
D) Minus #200 From Sieve, g
Total Minus #200, g (C+D) Acceptance Check
Wash Loss 2.72 %
Yellville - Hwy. 62 Ashly
SIEVE ANALYSIS OF COARSE AND FINE AGGREGATE(AASHTO T-11 and AASHTO T-27)
TRC 0801 7/1/2008
34.30
77.00 0.9998
Station 3 - 6S
1569.20 0.21
1526.50
42.70 4.227
207

UNIVERSITY OF ARKANSAS
DEPARTMENT OF CIVIL ENGINEERING
MATERIALS LABORATORY
Job Name: Date:
Material: Tested By:
Source:
WET and DRY SIEVE ANALYSIS
Sieve Size
(U.S. Std.)
Sieve Size
(mm)
Sieve + Agg
Weight
Sieve
Weight
Individual
Weight Ret.
Cum. Wt.
Retained
Cum.
% Ret.
%
Passing
Reported
% Passing
2 50.0
1-1/2 37.5 0.00 0.00 0.00 100.00 100.0
1 25.0 0.00 0.00 0.00 100.00 100.0
3/4 19.0 551.70 551.70 0.00 0.00 0.00 100.00 100.0
1/2 12.5 551.70 527.80 23.90 23.90 1.50 98.50 98.5
3/8 9.5 664.20 521.20 143.00 166.90 10.46 89.54 89.5
#4 4.750 1050.70 507.20 543.50 710.40 44.50 55.50 55.5
#8 2.360 762.60 469.00 293.60 1004.00 62.90 37.10 37.1
#16 1.180 605.30 453.50 151.80 1155.80 72.40 27.60 27.6
#30 0.600 471.20 389.60 81.60 1237.40 77.52 22.48 22.5
#40 0.425 0.00 1237.40 77.52 22.48 22.5
#50 0.300 456.20 360.60 95.60 1333.00 83.51 16.49 16.5
#100 0.150 477.70 343.60 134.10 1467.10 91.91 8.09 8.1
#200 0.075 335.30 322.50 12.80 1479.90 92.71 7.29 7.29
Pan Pan 431.70 370.00 61.70 1541.60
A) Weight of Original Sample, g AHTD Dust Proportion
B) Weight after Wash, g
C) Wash Loss, g (A-B) Fineness Modulus
D) Minus #200 From Sieve, g
Total Minus #200, g (C+D) Acceptance Check
Wash Loss 3.34 %
Yellville - Hwy. 62 Ashly
SIEVE ANALYSIS OF COARSE AND FINE AGGREGATE(AASHTO T-11 and AASHTO T-27)
TRC 0801 7/1/2008
61.70
115.00 0.9991
Station 3 - J
1596.30 0.32
1543.00
53.30 4.432
208

UNIVERSITY OF ARKANSAS
DEPARTMENT OF CIVIL ENGINEERING
MATERIALS LABORATORY
Job Name: Date:
Material: Tested By:
Source:
WET and DRY SIEVE ANALYSIS
Sieve Size
(U.S. Std.)
Sieve Size
(mm)
Sieve + Agg
Weight
Sieve
Weight
Individual
Weight Ret.
Cum. Wt.
Retained
Cum.
% Ret.
%
Passing
Reported
% Passing
2 50.0
1-1/2 37.5 0.00 0.00 0.00 100.00 100.0
1 25.0 0.00 0.00 0.00 100.00 100.0
3/4 19.0 551.70 551.70 0.00 0.00 0.00 100.00 100.0
1/2 12.5 533.50 527.40 6.10 6.10 0.35 99.65 99.7
3/8 9.5 639.10 520.10 119.00 125.10 7.10 92.90 92.9
#4 4.750 1049.70 505.70 544.00 669.10 37.97 62.03 62.0
#8 2.360 811.00 468.90 342.10 1011.20 57.38 42.62 42.6
#16 1.180 642.10 453.60 188.50 1199.70 68.08 31.92 31.9
#30 0.600 470.60 389.40 81.20 1280.90 72.69 27.31 27.3
#40 0.425 0.00 1280.90 72.69 27.31 27.3
#50 0.300 482.80 360.30 122.50 1403.40 79.64 20.36 20.4
#100 0.150 519.50 343.30 176.20 1579.60 89.64 10.36 10.4
#200 0.075 351.20 322.40 28.80 1608.40 91.27 8.73 8.73
Pan Pan 438.00 370.00 68.00 1676.40
A) Weight of Original Sample, g AHTD Dust Proportion
B) Weight after Wash, g
C) Wash Loss, g (A-B) Fineness Modulus
D) Minus #200 From Sieve, g
Total Minus #200, g (C+D) Acceptance Check
Wash Loss 3.92 %
Yellville - Hwy. 62 Ashly
SIEVE ANALYSIS OF COARSE AND FINE AGGREGATE(AASHTO T-11 and AASHTO T-27)
TRC 0801 7/1/2008
68.00
137.00 0.9901
Station 3 - 6N
1762.20 0.32
1693.20
69.00 4.125
209

UNIVERSITY OF ARKANSAS
DEPARTMENT OF CIVIL ENGINEERING
MATERIALS LABORATORY
Job Name: Date:
Material: Tested By:
Source:
WET and DRY SIEVE ANALYSIS
Sieve Size
(U.S. Std.)
Sieve Size
(mm)
Sieve + Agg
Weight
Sieve
Weight
Individual
Weight Ret.
Cum. Wt.
Retained
Cum.
% Ret.
%
Passing
Reported
% Passing
2 50.0
1-1/2 37.5 0.00 0.00 0.00 100.00 100.0
1 25.0 0.00 0.00 0.00 100.00 100.0
3/4 19.0 558.20 551.60 6.60 6.60 0.36 99.64 99.6
1/2 12.5 574.00 527.80 46.20 52.80 2.85 97.15 97.1
3/8 9.5 673.90 521.60 152.30 205.10 11.08 88.92 88.9
#4 4.750 1074.40 507.60 566.80 771.90 41.71 58.29 58.3
#8 2.360 821.50 469.10 352.40 1124.30 60.75 39.25 39.3
#16 1.180 640.30 453.90 186.40 1310.70 70.82 29.18 29.2
#30 0.600 492.60 390.00 102.60 1413.30 76.37 23.63 23.6
#40 0.425 0.00 1413.30 76.37 23.63 23.6
#50 0.300 479.20 360.80 118.40 1531.70 82.76 17.24 17.2
#100 0.150 505.70 344.00 161.70 1693.40 91.50 8.50 8.5
#200 0.075 323.10 322.20 0.90 1694.30 91.55 8.45 8.45
Pan Pan 458.50 370.20 88.30 1782.60
A) Weight of Original Sample, g AHTD Dust Proportion
B) Weight after Wash, g
C) Wash Loss, g (A-B) Fineness Modulus
D) Minus #200 From Sieve, g
Total Minus #200, g (C+D) Acceptance Check
Wash Loss 3.29 %
Yellville - Hwy. 62 Ashly
SIEVE ANALYSIS OF COARSE AND FINE AGGREGATE(AASHTO T-11 and AASHTO T-27)
TRC 0801 7/1/2008
88.30
149.20 0.9960
Station 3 - 12N
1850.70 0.36
1789.80
60.90 4.353
210

UNIVERSITY OF ARKANSAS
DEPARTMENT OF CIVIL ENGINEERING
MATERIALS LABORATORY
BULK SPECIFIC GRAVITY AND % AIR VOIDS OF COMPACTED BITUMINOUS
MIXTURES USING SSD SPECIMENS (AASHTO T-166, T-269)
Job Name: TRC 0801 Date:
Material: Tested By:
Source: Station 4
Sample
NumberY4-12S Y4-6S Y4-J Y4-6N Y4-12N
Dry Weight
in Air, gm
(A)
2263.9 1854.6 2140.5 2116.5
Submerged
Weight, gm
(C)
1283.7 1041.6 1104.5 1211.3 1201.3
SSD
Weight, gm
(B)
2291.5 1900.2 2058.1 2175.0 2146.9
Bulk Specific
Gravity, Gmb
(D)=A/(B-C)
2.246 2.160 0.000 2.221 2.238
Percent Water Absorbed
by Volume
(E)=(B-A)/(B-C) * 100
2.7 5.3 215.8 3.6 3.2
Note: if Percent Water Absorbed > 2%, Determine Gmb using AASHTO T-275
Yellville - Hwy. 62 Annette
4/1/2008
211

UNIVERSITY OF ARKANSAS
DEPARTMENT OF CIVIL ENGINEERING
ASPHALT LABORATORY
BULK SPECIFIC GRAVITY BY THE CORELOK METHOD
Project: Date:
Source: Tested By:
Sample
NumberY4-12S Y4-6S Y4-J Y4-6N Y4-12N
Wt. of Dry Core in Air before
testing, g
(A)
2259.5 1856.7 2142.7 2118.7
Wt. of Sealed Core in Air, g
(B)2307.2 1906.1 2192.0 2167.8
Wt of Sealed Core in Water, g
(C )1242.9 976.8 1162.3 1154.3
Wt. of Dry Core in Air after testing,
g
(D)
2263.9 1854.6 2140.5 2116.5
Bag Weight
E = (B - A)47.7 49.4 49.3 49.1
Bag Ratio
F = A / E47.369 37.585 43.462 43.151
Large Bag Volume Correction
(-0.00166*F+0.8596)
(G)
0.781 0.797 0.787 0.788
Total Volume
H = (E + D) - C1068.7 927.2 1027.5 1011.3
Bag Volume
I = E / G61.1 62.0 62.6 62.3
Sample Volume
J = H - I1007.6 865.2 964.9 949.0
Bulk Specific Gravity (G mb )
K = A / J2.242 2.146 2.221 2.233
Check: % wt. change
(must be -0.08% to +0.04%)-0.19% 0.11% 0.10% 0.10%
TRC 0801 4/1/2008
Yellville - Hwy. 62 - Station 4 Annette
212

UNIVERSITY OF ARKANSAS
DEPARTMENT OF CIVIL ENGINEERING
ASPHALT LABORATORY
Job Name: Date:
Material: Tested By:
Source:
Sample
NumberY4-12S Y4-6S Y4-J Y4-6N Y4-12N
Dry Weight
in Air, gm 2263.9 1854.6 2140.5 2116.5
Sample
Volume, cc993 825 939 934
Bulk Specific
Gravity, Gmb2.279 2.246 2.279 2.266
KUSS Gmb
4/1/2008
Annette
TRC 0801
Yellville - Hwy. 62
Station 4
213
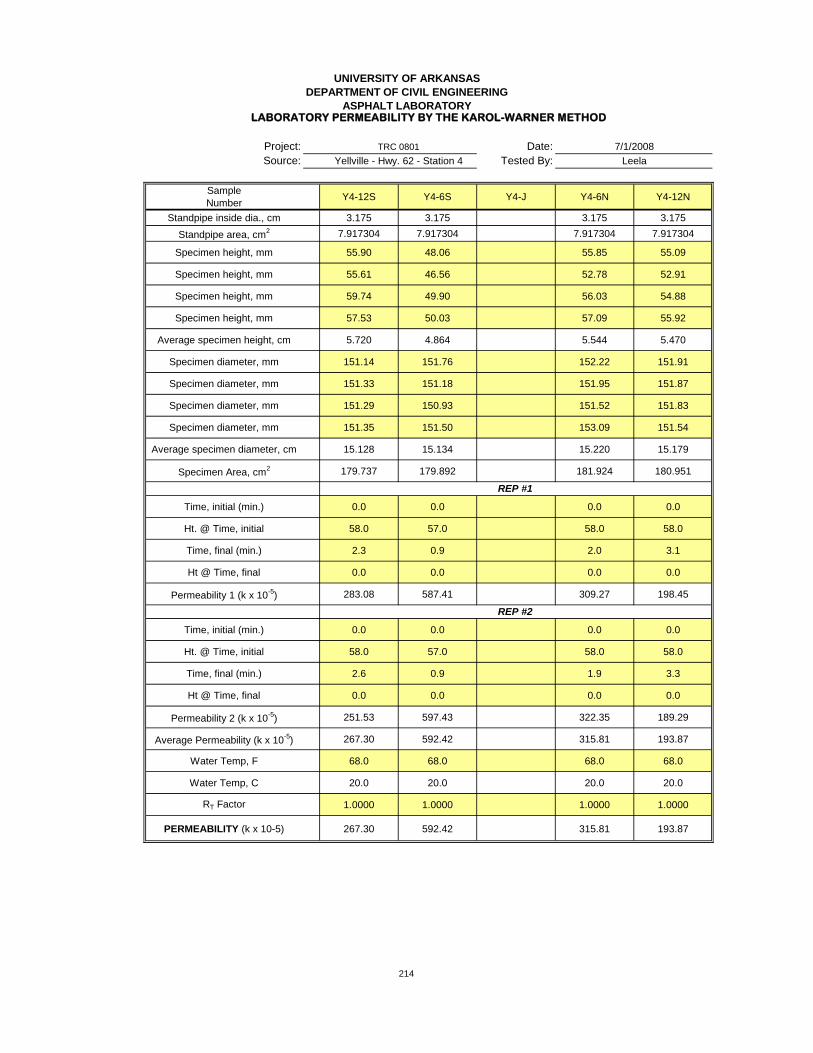
UNIVERSITY OF ARKANSAS
DEPARTMENT OF CIVIL ENGINEERING
ASPHALT LABORATORYLABORATORY PERMEABILITY BY THE KAROL-WARNER METHOD
Project: Date:
Source: Tested By:
Sample
NumberY4-12S Y4-6S Y4-J Y4-6N Y4-12N
Standpipe inside dia., cm 3.175 3.175 3.175 3.175
Standpipe area, cm2 7.917304 7.917304 7.917304 7.917304
Specimen height, mm 55.90 48.06 55.85 55.09
Specimen height, mm 55.61 46.56 52.78 52.91
Specimen height, mm 59.74 49.90 56.03 54.88
Specimen height, mm 57.53 50.03 57.09 55.92
Average specimen height, cm 5.720 4.864 5.544 5.470
Specimen diameter, mm 151.14 151.76 152.22 151.91
Specimen diameter, mm 151.33 151.18 151.95 151.87
Specimen diameter, mm 151.29 150.93 151.52 151.83
Specimen diameter, mm 151.35 151.50 153.09 151.54
Average specimen diameter, cm 15.128 15.134 15.220 15.179
Specimen Area, cm2 179.737 179.892 181.924 180.951
Time, initial (min.) 0.0 0.0 0.0 0.0
Ht. @ Time, initial 58.0 57.0 58.0 58.0
Time, final (min.) 2.3 0.9 2.0 3.1
Ht @ Time, final 0.0 0.0 0.0 0.0
Permeability 1 (k x 10-5
) 283.08 587.41 309.27 198.45
Time, initial (min.) 0.0 0.0 0.0 0.0
Ht. @ Time, initial 58.0 57.0 58.0 58.0
Time, final (min.) 2.6 0.9 1.9 3.3
Ht @ Time, final 0.0 0.0 0.0 0.0
Permeability 2 (k x 10-5
) 251.53 597.43 322.35 189.29
Average Permeability (k x 10-5
) 267.30 592.42 315.81 193.87
Water Temp, F 68.0 68.0 68.0 68.0
Water Temp, C 20.0 20.0 20.0 20.0
RT Factor 1.0000 1.0000 1.0000 1.0000
PERMEABILITY (k x 10-5) 267.30 592.42 315.81 193.87
REP #2
TRC 0801 7/1/2008
Yellville - Hwy. 62 - Station 4 Leela
REP #1
214

UNIVERSITY OF ARKANSAS
DEPARTMENT OF CIVIL ENGINEERING
MATERIALS LABORATORY
Job Name: Date:
Material: Tested By:
Source:
ASPHALT CONTENT BY THE IGNITION METHOD
Test Samples
Sample ID Y4-12S Y4-6S Y4-J Y4-6N Y4-12N
Weight of Basket (g) 3277.10 3270.00 3276.00 3266.90
Specimen + Basket (g) 5509.50 5115.00 5401.00 5368.20
Net Wt. of Specimen (g) 2232.40 1845.00 2125.00 2101.30
Calibration Factor 0.00 0.00 0.00 0.00
Temperature Correction Factor 0.13 0.11 0.09 0.14
Oven Derived AC% 5.14 5.51 5.24 5.04
Corrected Value (if CF not used) 5.14 5.51 5.24 5.04
Yellville - Hwy. 62 Ashly
Station 4
ASPHALT CONTENT BY THE IGNITION METHOD(AASHTO T 308)
TRC 0801 7/1/2008
215

UNIVERSITY OF ARKANSAS
DEPARTMENT OF CIVIL ENGINEERING
MATERIALS LABORATORY
Job Name: Date:
Material: Tested By:
Source:
WET and DRY SIEVE ANALYSIS
Sieve Size
(U.S. Std.)
Sieve Size
(mm)
Sieve + Agg
Weight
Sieve
Weight
Individual
Weight Ret.
Cum. Wt.
Retained
Cum.
% Ret.
%
Passing
Reported
% Passing
2 50.0
1-1/2 37.5 0.00 0.00 0.00 100.00 100.0
1 25.0 0.00 0.00 0.00 100.00 100.0
3/4 19.0 560.10 559.90 0.20 0.20 0.01 99.99 100.0
1/2 12.5 563.10 523.10 40.00 40.20 1.90 98.10 98.1
3/8 9.5 725.80 549.10 176.70 216.90 10.26 89.74 89.7
#4 4.750 1221.90 507.20 714.70 931.60 44.06 55.94 55.9
#8 2.360 834.10 440.30 393.80 1325.40 62.69 37.31 37.3
#16 1.180 658.90 442.30 216.60 1542.00 72.93 27.07 27.1
#30 0.600 481.70 377.20 104.50 1646.50 77.87 22.13 22.1
#40 0.425 0.00 1646.50 77.87 22.13 22.1
#50 0.300 485.70 367.20 118.50 1765.00 83.48 16.52 16.5
#100 0.150 514.80 339.10 175.70 1940.70 91.79 8.21 8.2
#200 0.075 381.70 325.00 56.70 1997.40 94.47 5.53 5.53
Pan Pan 398.50 368.50 30.00 2027.40
A) Weight of Original Sample, g AHTD Dust Proportion
B) Weight after Wash, g
C) Wash Loss, g (A-B) Fineness Modulus
D) Minus #200 From Sieve, g
Total Minus #200, g (C+D) Acceptance Check
Wash Loss 3.47 %
Yellville - Hwy. 62 Ashly
SIEVE ANALYSIS OF COARSE AND FINE AGGREGATE(AASHTO T-11 and AASHTO T-27)
TRC 0801 7/1/2008
30.00
103.40 0.9934
Station 4 - 12S
2114.30 0.25
2040.90
73.40 4.431
216

UNIVERSITY OF ARKANSAS
DEPARTMENT OF CIVIL ENGINEERING
MATERIALS LABORATORY
Job Name: Date:
Material: Tested By:
Source:
WET and DRY SIEVE ANALYSIS
Sieve Size
(U.S. Std.)
Sieve Size
(mm)
Sieve + Agg
Weight
Sieve
Weight
Individual
Weight Ret.
Cum. Wt.
Retained
Cum.
% Ret.
%
Passing
Reported
% Passing
2 50.0
1-1/2 37.5 0.00 0.00 0.00 100.00 100.0
1 25.0 0.00 0.00 0.00 100.00 100.0
3/4 19.0 557.00 557.00 0.00 0.00 0.00 100.00 100.0
1/2 12.5 543.40 535.90 7.50 7.50 0.43 99.57 99.6
3/8 9.5 679.60 536.80 142.80 150.30 8.65 91.35 91.3
#4 4.750 1047.40 507.10 540.30 690.60 39.76 60.24 60.2
#8 2.360 825.50 487.10 338.40 1029.00 59.24 40.76 40.8
#16 1.180 620.90 439.00 181.90 1210.90 69.71 30.29 30.3
#30 0.600 480.00 388.60 91.40 1302.30 74.97 25.03 25.0
#40 0.425 0.00 1302.30 74.97 25.03 25.0
#50 0.300 463.60 354.30 109.30 1411.60 81.27 18.73 18.7
#100 0.150 517.30 348.60 168.70 1580.30 90.98 9.02 9.0
#200 0.075 384.10 330.40 53.70 1634.00 94.07 5.93 5.93
Pan Pan 390.50 364.40 26.10 1660.10
A) Weight of Original Sample, g AHTD Dust Proportion
B) Weight after Wash, g
C) Wash Loss, g (A-B) Fineness Modulus
D) Minus #200 From Sieve, g
Total Minus #200, g (C+D) Acceptance Check
Wash Loss 4.40 %
Yellville - Hwy. 62 Ashly
SIEVE ANALYSIS OF COARSE AND FINE AGGREGATE(AASHTO T-11 and AASHTO T-27)
TRC 0801 7/1/2008
26.10
102.50 0.9997
Station 4 - 6S
1737.00 0.24
1660.60
76.40 4.246
217

UNIVERSITY OF ARKANSAS
DEPARTMENT OF CIVIL ENGINEERING
MATERIALS LABORATORY
Job Name: Date:
Material: Tested By:
Source:
WET and DRY SIEVE ANALYSIS
Sieve Size
(U.S. Std.)
Sieve Size
(mm)
Sieve + Agg
Weight
Sieve
Weight
Individual
Weight Ret.
Cum. Wt.
Retained
Cum.
% Ret.
%
Passing
Reported
% Passing
2 50.0
1-1/2 37.5 0.00 0.00 0.00 100.00 100.0
1 25.0 0.00 0.00 0.00 100.00 100.0
3/4 19.0 559.30 551.70 7.60 7.60 0.40 99.60 99.6
1/2 12.5 573.60 527.70 45.90 53.50 2.82 97.18 97.2
3/8 9.5 691.70 521.20 170.50 224.00 11.82 88.18 88.2
#4 4.750 1138.90 507.20 631.70 855.70 45.15 54.85 54.9
#8 2.360 784.60 469.10 315.50 1171.20 61.79 38.21 38.2
#16 1.180 651.00 453.50 197.50 1368.70 72.22 27.78 27.8
#30 0.600 499.30 389.50 109.80 1478.50 78.01 21.99 22.0
#40 0.425 0.00 1478.50 78.01 21.99 22.0
#50 0.300 477.80 360.60 117.20 1595.70 84.19 15.81 15.8
#100 0.150 492.70 343.50 149.20 1744.90 92.06 7.94 7.9
#200 0.075 349.50 322.50 27.00 1771.90 93.49 6.51 6.51
Pan Pan 418.10 370.00 48.10 1820.00
A) Weight of Original Sample, g AHTD Dust Proportion
B) Weight after Wash, g
C) Wash Loss, g (A-B) Fineness Modulus
D) Minus #200 From Sieve, g
Total Minus #200, g (C+D) Acceptance Check
Wash Loss 3.56 %
Yellville - Hwy. 62 Ashly
SIEVE ANALYSIS OF COARSE AND FINE AGGREGATE(AASHTO T-11 and AASHTO T-27)
TRC 0801 7/1/2008
48.10
115.60 0.9957
Station 4 - J
1895.30 0.30
1827.80
67.50 4.456
218

UNIVERSITY OF ARKANSAS
DEPARTMENT OF CIVIL ENGINEERING
MATERIALS LABORATORY
Job Name: Date:
Material: Tested By:
Source:
WET and DRY SIEVE ANALYSIS
Sieve Size
(U.S. Std.)
Sieve Size
(mm)
Sieve + Agg
Weight
Sieve
Weight
Individual
Weight Ret.
Cum. Wt.
Retained
Cum.
% Ret.
%
Passing
Reported
% Passing
2 50.0
1-1/2 37.5 0.00 0.00 0.00 100.00 100.0
1 25.0 0.00 0.00 0.00 100.00 100.0
3/4 19.0 552.10 552.10 0.00 0.00 0.00 100.00 100.0
1/2 12.5 539.20 528.30 10.90 10.90 0.54 99.46 99.5
3/8 9.5 662.10 522.10 140.00 150.90 7.51 92.49 92.5
#4 4.750 1146.10 511.40 634.70 785.60 39.11 60.89 60.9
#8 2.360 864.90 469.90 395.00 1180.60 58.77 41.23 41.2
#16 1.180 672.40 454.20 218.20 1398.80 69.63 30.37 30.4
#30 0.600 509.70 390.10 119.60 1518.40 75.59 24.41 24.4
#40 0.425 0.00 1518.40 75.59 24.41 24.4
#50 0.300 504.50 361.00 143.50 1661.90 82.73 17.27 17.3
#100 0.150 518.10 344.10 174.00 1835.90 91.39 8.61 8.6
#200 0.075 349.20 323.00 26.20 1862.10 92.70 7.30 7.30
Pan Pan 432.80 370.70 62.10 1924.20
A) Weight of Original Sample, g AHTD Dust Proportion
B) Weight after Wash, g
C) Wash Loss, g (A-B) Fineness Modulus
D) Minus #200 From Sieve, g
Total Minus #200, g (C+D) Acceptance Check
Wash Loss 3.91 %
Yellville - Hwy. 62 Ashly
SIEVE ANALYSIS OF COARSE AND FINE AGGREGATE(AASHTO T-11 and AASHTO T-27)
TRC 0801 7/1/2008
62.10
140.70 0.9969
Station 4 - 6N
2008.80 0.30
1930.20
78.60 4.247
219

UNIVERSITY OF ARKANSAS
DEPARTMENT OF CIVIL ENGINEERING
MATERIALS LABORATORY
Job Name: Date:
Material: Tested By:
Source:
WET and DRY SIEVE ANALYSIS
Sieve Size
(U.S. Std.)
Sieve Size
(mm)
Sieve + Agg
Weight
Sieve
Weight
Individual
Weight Ret.
Cum. Wt.
Retained
Cum.
% Ret.
%
Passing
Reported
% Passing
2 50.0
1-1/2 37.5 0.00 0.00 0.00 100.00 100.0
1 25.0 0.00 0.00 0.00 100.00 100.0
3/4 19.0 551.60 551.20 0.40 0.40 0.02 99.98 100.0
1/2 12.5 542.10 527.40 14.70 15.10 0.76 99.24 99.2
3/8 9.5 683.80 521.10 162.70 177.80 8.96 91.04 91.0
#4 4.750 1170.40 507.40 663.00 840.80 42.37 57.63 57.6
#8 2.360 844.70 468.90 375.80 1216.60 61.31 38.69 38.7
#16 1.180 651.80 453.30 198.50 1415.10 71.31 28.69 28.7
#30 0.600 494.20 389.20 105.00 1520.10 76.60 23.40 23.4
#40 0.425 0.00 1520.10 76.60 23.40 23.4
#50 0.300 484.00 360.00 124.00 1644.10 82.85 17.15 17.2
#100 0.150 451.50 343.40 108.10 1752.20 88.29 11.71 11.7
#200 0.075 341.30 322.10 19.20 1771.40 89.26 10.74 10.74
Pan Pan 442.50 369.90 72.60 1844.00
A) Weight of Original Sample, g AHTD Dust Proportion
B) Weight after Wash, g
C) Wash Loss, g (A-B) Fineness Modulus
D) Minus #200 From Sieve, g
Total Minus #200, g (C+D) Acceptance Check
Wash Loss 4.03 %
Yellville - Hwy. 62 Ashly
SIEVE ANALYSIS OF COARSE AND FINE AGGREGATE(AASHTO T-11 and AASHTO T-27)
TRC 0801 7/1/2008
72.60
152.60 0.9682
Station 4 - 12N
1984.50 0.46
1904.50
80.00 4.317
220

Appendix B
Density Estimates
for Broken Cores
SSD
N E S W C Avg Avg/62.4 Offset Avg Offsett Est. Gmb
Russ 2 12W 139.8 140.5 140.3 139.1 140.3 140 2.244 -0.023
Russ 2 6W 139.8 129.7 141 139.9 139.5 137.98 2.211 -0.034
Russ 2 J 131.5 132.5 128.7 141.3 131.1 133.02 2.132 2.160
Russ 2 6E 131.3 135.4 131 124.5 132.6 130.96 2.099 -0.032
Russ 2 12E 132.4 135.8 133 133 134.3 133.7 2.143 -0.023
Russ 3 12W 139.8 141.7 142 141.6 142.6 141.54 2.268 0.001
Russ 3 6W 135.5 131.4 141.3 141.4 142.3 138.38 2.218 -0.053
Russ 3 J 125.3 136.9 128.6 143 127.7 132.3 2.120 2.130
Russ 3 6E 138.1 140.1 137.3 127.4 135.8 135.74 2.175 0.003
Russ 3 12E 140.9 142.1 140.7 136 140.4 140.02 2.244 0.011
Russ 4 12W 141.7 146.4 144.9 142.8 143.2 143.8 2.304 0.002
Russ 4 6W 142.8 123 141.9 144.4 143.1 139.04 2.228 -0.051
Russ 4 J 124.8 135.9 127 140.1 124.9 130.54 2.092 2.099
Russ 4 6E 138.4 140.6 135.8 122.7 134.6 134.42 2.154 -0.009
Russ 4 12E 138.1 143.3 140.1 136.8 138.9 139.44 2.235 0.031
Yell 4 12W 134.2 141.3 141 139.4 141.9 139.56 2.237 -0.010
Yell 4 6W 125.6 137.6 139.9 138.3 137 135.68 2.174 0.014
Yell 4 J 141.1 126 137.9 126.9 124.9 131.36 2.105 2.100
Yell 4 6E 140.9 139.8 127.5 139.4 141 137.72 2.207 -0.014
Yell 4 12E 142.4 140 145.1 140.9 139.6 141.6 2.269 0.031
12W 6W J 6E 12E
R1 2.264 2.235 2.091 2.120 2.128
R2 2.267 2.245 2.160 2.131 2.165
R3 2.267 2.271 2.130 2.173 2.233
R4 2.303 2.279 2.099 2.163 2.204
Y1 2.240 2.130 2.007 2.123 2.157
Y2 2.262 2.217 2.035 2.222 2.219
Y3 2.229 2.170 2.018 2.216 2.221
Y4 2.246 2.160 2.100 2.221 2.238
0.005
SSD Gmb
-0.028
-0.007
-0.010
SSD Gmb
221

CoreLok
N E S W C Avg Avg/62.4 Offset Avg Offsett Est. Gmb
Russ 2 12W 139.8 140.5 140.3 139.1 140.3 140 2.244 -0.018
Russ 2 6W 139.8 129.7 141 139.9 139.5 137.98 2.211 -0.018
Russ 2 J 131.5 132.5 128.7 141.3 131.1 133.02 2.132 2.128
Russ 2 6E 131.3 135.4 131 124.5 132.6 130.96 2.099 0.022
Russ 2 12E 132.4 135.8 133 133 134.3 133.7 2.143 0.030
Russ 3 12W 139.8 141.7 142 141.6 142.6 141.54 2.268 0.009
Russ 3 6W 135.5 131.4 141.3 141.4 142.3 138.38 2.218 -0.021
Russ 3 J 125.3 136.9 128.6 143 127.7 132.3 2.120 2.075
Russ 3 6E 138.1 140.1 137.3 127.4 135.8 135.74 2.175 0.076
Russ 3 12E 140.9 142.1 140.7 136 140.4 140.02 2.244 0.115
Russ 4 12W 141.7 146.4 144.9 142.8 143.2 143.8 2.304 0.050
Russ 4 6W 142.8 123 141.9 144.4 143.1 139.04 2.228 -0.038
Russ 4 J 124.8 135.9 127 140.1 124.9 130.54 2.092 2.085
Russ 4 6E 138.4 140.6 135.8 122.7 134.6 134.42 2.154 0.003
Russ 4 12E 138.1 143.3 140.1 136.8 138.9 139.44 2.235 0.014
Yell 4 12W 134.2 141.3 141 139.4 141.9 139.56 2.237 0.007 0.014
Yell 4 6W 125.6 137.6 139.9 138.3 137 135.68 2.174 0.008
Yell 4 J 141.1 126 137.9 126.9 124.9 131.36 2.105 2.091
Yell 6E 140.9 139.8 127.5 139.4 141 137.72 2.207 -0.002
Yell 12E 142.4 140 145.1 140.9 139.6 141.6 2.269 0.043
12W 6W J 6E 12E
R1 2 2.261 2.229 2.032 2.077 2.112
R2 2 2.259 2.238 2.128 2.099 2.129
R3 2 2.255 2.267 2.075 2.151 2.220
R4 2 2.287 2.261 2.085 2.115 2.261
Y1 3 2.229 2.133 1.909 2.114 2.147
Y2 3 2.264 2.216 1.984 2.194 2.210
Y3 3 2.230 2.166 1.989 2.209 2.226
Y4 3 2.242 2.146 2.091 2.221 2.233
CoreLok
0.004
0.045
0.007
CoreLok Gmb
222
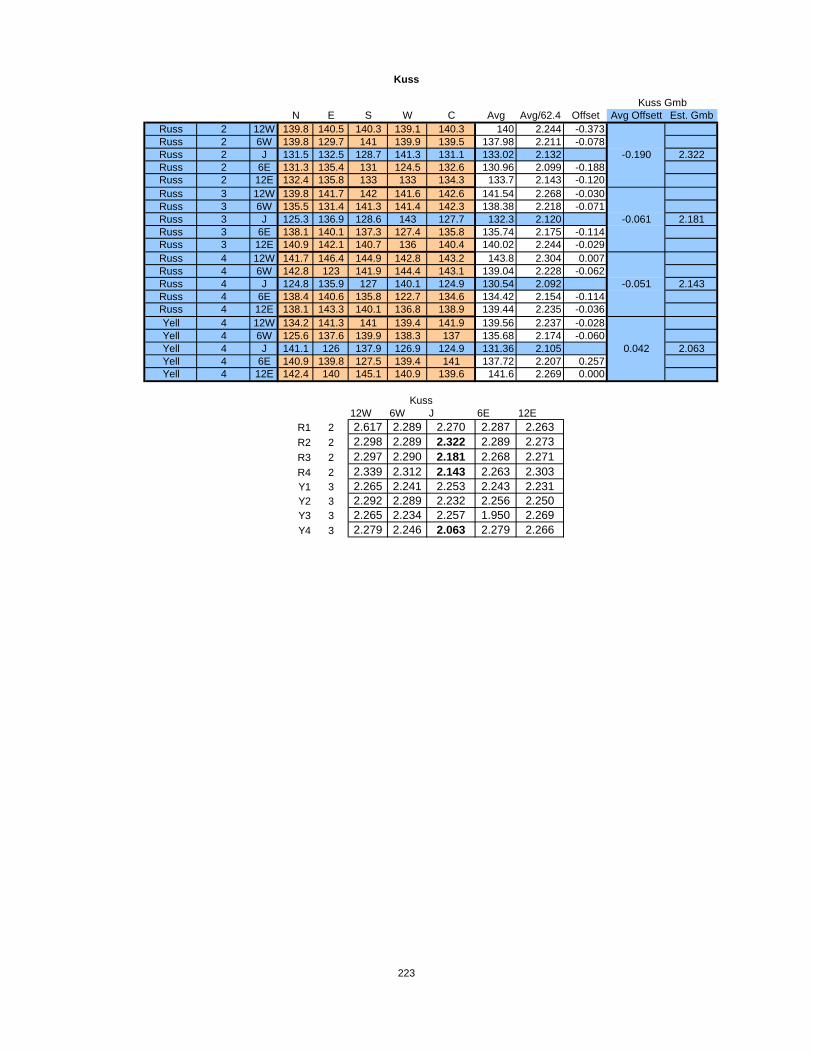
Kuss
N E S W C Avg Avg/62.4 Offset Avg Offsett Est. Gmb
Russ 2 12W 139.8 140.5 140.3 139.1 140.3 140 2.244 -0.373
Russ 2 6W 139.8 129.7 141 139.9 139.5 137.98 2.211 -0.078
Russ 2 J 131.5 132.5 128.7 141.3 131.1 133.02 2.132 2.322
Russ 2 6E 131.3 135.4 131 124.5 132.6 130.96 2.099 -0.188
Russ 2 12E 132.4 135.8 133 133 134.3 133.7 2.143 -0.120
Russ 3 12W 139.8 141.7 142 141.6 142.6 141.54 2.268 -0.030
Russ 3 6W 135.5 131.4 141.3 141.4 142.3 138.38 2.218 -0.071
Russ 3 J 125.3 136.9 128.6 143 127.7 132.3 2.120 2.181
Russ 3 6E 138.1 140.1 137.3 127.4 135.8 135.74 2.175 -0.114
Russ 3 12E 140.9 142.1 140.7 136 140.4 140.02 2.244 -0.029
Russ 4 12W 141.7 146.4 144.9 142.8 143.2 143.8 2.304 0.007
Russ 4 6W 142.8 123 141.9 144.4 143.1 139.04 2.228 -0.062
Russ 4 J 124.8 135.9 127 140.1 124.9 130.54 2.092 2.143
Russ 4 6E 138.4 140.6 135.8 122.7 134.6 134.42 2.154 -0.114
Russ 4 12E 138.1 143.3 140.1 136.8 138.9 139.44 2.235 -0.036
Yell 4 12W 134.2 141.3 141 139.4 141.9 139.56 2.237 -0.028
Yell 4 6W 125.6 137.6 139.9 138.3 137 135.68 2.174 -0.060
Yell 4 J 141.1 126 137.9 126.9 124.9 131.36 2.105 2.063
Yell 4 6E 140.9 139.8 127.5 139.4 141 137.72 2.207 0.257
Yell 4 12E 142.4 140 145.1 140.9 139.6 141.6 2.269 0.000
12W 6W J 6E 12E
R1 2 2.617 2.289 2.270 2.287 2.263
R2 2 2.298 2.289 2.322 2.289 2.273
R3 2 2.297 2.290 2.181 2.268 2.271
R4 2 2.339 2.312 2.143 2.263 2.303
Y1 3 2.265 2.241 2.253 2.243 2.231
Y2 3 2.292 2.289 2.232 2.256 2.250
Y3 3 2.265 2.234 2.257 1.950 2.269
Y4 3 2.279 2.246 2.063 2.279 2.266
Kuss
-0.061
-0.051
0.042
-0.190
Kuss Gmb
223