homing pigeons (columba livia) modulate wingbeat ... · homing pigeons (columba livia) modulate...
TRANSCRIPT
RESEARCH ARTICLE
Homing pigeons (Columba livia) modulate wingbeatcharacteristics as a function of route familiarityLucy A. Taylor1,*, Steven J. Portugal2 and Dora Biro1
ABSTRACTMechanisms of avian navigation have received considerableattention, but whether different navigational strategies areaccompanied by different flight characteristics is unknown.Managing energy expenditure is critical for survival; therefore,understanding how flight characteristics, and hence energyallocation, potentially change with birds’ familiarity with anavigational task could provide key insights into the costs oforientation. We addressed this question by examining changes inthe wingbeat characteristics and airspeed of homing pigeons(Columba livia) as they learned a homing task. Twenty-one pigeonswere released 20 times individually either 3.85 or 7.06 km from home.Birds were equipped with 5 Hz GPS trackers and 200 Hz tri-axialaccelerometers. We found that, as the birds’ route efficiencyincreased during the first six releases, their median peak-to-peakdorsal body (DB) acceleration and median DB amplitude alsoincreased. This, in turn, led to higher airspeeds, suggesting thatbirds fly slower when traversing unfamiliar terrain. By contrast, afterroute efficiency stabilised, birds exhibited increasing wingbeatfrequencies, which did not result in further increases in speed.Overall, higher wind support was also associated with lower wingbeatfrequencies and increased DB amplitude. Our study suggests that thecost of early flights from an unfamiliar location may be higher thansubsequent flights because of both inefficient routes (increaseddistance) and lower airspeeds (increased time). Furthermore, theresults indicate, for the first time, that birds modulate their wingbeatcharacteristics as a function of navigational knowledge, and suggestthat flight characteristics may be used as ‘signatures’ of birds’ routefamiliarity.
KEYWORDS: Airspeed, Flight, Navigation, Route learning,Wingbeatamplitude, Wingbeat frequency
INTRODUCTIONForward flapping flight is the most energetically demanding form ofvertebrate locomotion (Norberg, 1990; Schmidt-Nielsen, 1972). Toreduce the energetic cost of flight, birds utilise behaviouralmechanisms, such as intermittent flight patterns (Rayner, 1985;Tobalske and Dial, 1996), formation flight (Weimerskirch et al.,2001) and modulation of their wingbeat frequency and amplitude(Greenewalt, 1962; Lilienthal, 2001). Whilst energy-savingmechanisms have been identified, little is known about the extent
to which birds employ these mechanisms in relation to navigation,for example, as a function of familiarity with a given landscape.Until now, avian navigation research has primarily focused on thesensory and cognitive underpinnings of orientation (Wiltschkoand Wiltschko, 2009) and the total cost of a flight (Flack et al.,2016). However, a bird navigating from a familiar location, such asa roost or foraging site, may utilise different flight patternscompared with when flying over less familiar terrain where thedistance to be covered and the route to be taken are less wellknown. Energy is frequently considered the currency of life(Butler et al., 2004), which means that managing energyexpenditure is a key aspect of survival. Thus, energy allocationis likely to play a pivotal role in dictating the flight patterns utilisedwhilst navigating. Investigating whether birds modulate, forexample, their wingbeat patterns in relation to their familiaritywith a navigational task could provide key insights into the cost oforientation.
Homing pigeons (Columba liviaGmelin 1789) are an ideal modelspecies for studies investigating flight characteristics in relation tonavigational knowledge because of their innate homing ability,amenability to experimental manipulation, and body size permittingthe attachment of state-of-the-art tracking devices. For researchsubjects, this means we can ensure that the full navigationalexperience of a given individual is known and can be characterisedover successive flights. Although the finer details are still debated, itis generally accepted that over unfamiliar terrain, pigeons navigateby utilising a combination of olfactory cues for position fixing(Gagliardo, 2013), and a solar and magnetic compass for directionalguidance (Kramer, 1957; Schmidt-Koenig, 1990; Wiltschko andWiltschko, 2005). In addition, over familiar terrain, pigeons are alsoable to utilise visual landmarks (Meade et al., 2005). Meade et al.(2005) found that homing pigeons released repeatedly from thesame site gradually developed stereotypical routes, with eachindividual having their own, slightly indirect, route. The results ofthis study and others indicate that pigeons reliably adopt suchindividually idiosyncratic routes as familiarity with the locallandscape increases, and rely more on visual landscape features asthey becomemore experienced (Biro et al., 2004; Guilford and Biro,2014; Meade et al., 2005). Correspondingly, birds’ route efficiency(the straight line distance between the start and end of the routedivided by the distance travelled by the bird) increases steadilyduring the early stages of training and then plateaus once the birdshave developed stable idiosyncratic routes (Guilford and Biro, 2014;Meade et al., 2005). Recapitulating a familiar but less direct route,rather than increasing route efficiency further, suggests that therecould be a higher energetic and/or cognitive cost associated withnavigating in an unfamiliar landscape for homing pigeons, relativeto following a familiar route. However, whether differentnavigational strategies during route learning are accompanied bythe same or different flight characteristics (e.g. wingbeat frequenciesand amplitudes) is still unknown.Received 25 November 2016; Accepted 30 May 2017
1Department of Zoology, University of Oxford, South Parks Road, Oxford OX1 3PS,UK. 2School of Biological Sciences, Royal Holloway, University of London, Egham,Surrey TW20 0EX, UK.
*Author for correspondence ([email protected])
L.A.T., 0000-0003-4443-9456
2908
© 2017. Published by The Company of Biologists Ltd | Journal of Experimental Biology (2017) 220, 2908-2915 doi:10.1242/jeb.154039
Journal
ofEx
perim
entalB
iology

Our study addresses this question by quantifying changes in theflight characteristics of homing pigeons as they learn a homing task.Recent technological advances have led to the introduction ofminiature GPS devices, which provide highly accurate geographicalposition fixes over the full duration of a flight (Steiner et al., 2000),and high-frequency tri-axial accelerometers, which can measure theacceleration of an animal in three different planes, or dimensions, ofmovement (Halsey et al., 2009; Wilson et al., 2006). In turn, thecombination of GPS and accelerometers allows us to simultaneouslyreconstruct birds’ routes, speeds, wingbeat frequencies andamplitudes of dorsal body (DB) displacement. Although the preciserelationship between the DB amplitude and the amplitude of wingmotions is unclear, the former can nevertheless be used as an indirectmeasure of the latter (Hedrick et al., 2004; Usherwood et al., 2011).Together, wingbeat frequency and amplitude are related to thevariation in power and speed of flapping flight, and thus can be usedas a proxy for energy expenditure and/or work rate. By varyingwingbeat frequency and amplitude, a bird is able to adjust the costs offlight. Reducing wingbeat frequency reduces the inertial power costof the flight (i.e. power required to move the wings), as the powerrequirement of horizontal steady flight is proportional to the square ofwingbeat amplitude but the cube of wingbeat frequency (Greenewalt,1962; Lilienthal, 2001). By contrast, increasing wingbeat frequencyand decreasing amplitude reduces the drag of the wings and bodyand increases lift, thereby optimising aerodynamic efficiency (i.e.optimising the forces acting on the bird relative to the air for efficientflight parameters) (Usherwood, 2009; Usherwood et al., 2011). Thus,analysing variation in wingbeat characteristics and speed in relationto navigational knowledge could shed new light on the costs ofnavigation and the energetic strategies employed by birds as theylearn a route to a target.
MATERIALS AND METHODSSubjectsTwenty-one homing pigeons aged either 1 or 3 years were used.All birds had prior homing experience, but had not been releasedat or near the sites used in the present study. The subjects werehoused with ∼120 other pigeons in two neighbouring lofts atthe Oxford University Field Station, Wytham, UK (51°46′58.2″N,1°19′2.7″W). Access to water, grit and a standard pigeon feed mixwere available ad libitum at all times in the loft. All subjects wereable to perform free flights around the loft on a daily basisthroughout the year. In addition, in the month immediatelypreceding the start of the experiment, all subjects participated in aminimum of 24 solo or flock releases from four different releasesites 1–3 km from home, as basic homing training, to familiarise thebirds with the catch-and-release procedures and with being flownfrom an unfamiliar location. The protocols outlined in this paperwere approved by the Local Ethical Review Committee of theUniversity of Oxford’s Department of Zoology.
Experimental protocolsTwo release sites, both on a bearing of 282 deg from the lofts, wereselected. The ‘far’ site (Barnard Gate; 51°47′48.1″ N, 1°25′3.3″W)was 7.06 km from the lofts and the ‘near’ site (Mill Lane, Eynsham;51°47′24.2″N, 1°22′19.5″W) was located 3.85 km from the lofts.Subjects were randomly assigned to two groups in an approximatelyeven age distribution. Individuals in group 1 (10 pigeons; five1-year-old and five 3-year-old birds; mean±s.d. body mass=471±39 g) were released 20 times individually from the ‘far’ site, andindividuals in group 2 (11 pigeons; six 1-year-old and five 3-year-old birds; 471±20 g) were released 20 times individually from the
‘near’ site. Releases were conducted between May and July 2015,on days when the sun was visible and the wind speed was <7 m s−1
when measured 5.5 m above the ground. Subjects participated in amaximum of two releases per day, with a minimum of 3 h betweeneach release. All birds were released individually. Initially, releasesoccurred at 10-min intervals; this was later reduced to a minimum of4 min if it could be visually confirmed that the previously releasedbird had left the vicinity of the release site. If, at any point, a birdaccidentally paired up with another subject, the release wasexcluded for both birds (18 flights). Four additional tracks wereremoved from the analysis. One bird failed to return home before theGPS battery ran out on its first release from the far site; a GPS faultoccurred for two birds, one during the fifth release and one duringthe 14th release; and the devices could not be accuratelysynchronised for a bird on its 10th release. In addition, four birdslanded during their first release. For these landings, the entiredescent, stationary and ascent sections were removed from the trackdata from the point of first descent to the peak of ascent.
Data loggingThe birds were tracked using 5 Hz GPS loggers (BT-Q1300ST,Qstarz International Co., Taipei, Taiwan; 15 g) and 200 Hz tri-axialaccelerometers (AX3, Axivity, Newcastle upon Tyne, UK; ±16 g;11 g). The loggers were attached to the pigeons using Velcro strips,which were glued to trimmed feathers on the back (Fig. 1; Biro et al.,2002). In total, the loggers and fastenings weighed 27 g (less than7% of the subjects’ mean body mass). Two weeks prior to the startof the experiment, clay weights (27 g) were attached to the birds’back via Velcro to accustom them to flying with the additional mass.These were exchanged for GPS devices and accelerometersimmediately prior to each release. GPS and accelerometer datawere downloaded using QTravel [Qstarz International Co.; version1.48(T)] and Open Movement (Om) GUI Application (NewcastleUniversity; version 1.0.0.28), respectively.
The weather, including mean wind speed per minute and arunning mean of the wind bearing over the previous 10 min, was
4 cm
Fig. 1. A homing pigeon with an Axivity AX3 accelerometer (front) andQStarz BT-Q1300ST GPS logger (case removed; back) attached to theback via Velcro strip, which was glued to trimmed feathers.
2909
RESEARCH ARTICLE Journal of Experimental Biology (2017) 220, 2908-2915 doi:10.1242/jeb.154039
Journal
ofEx
perim
entalB
iology
recorded using a WS2083 Professional Wireless Weather Stationwith USB upload (Aercus Instruments, Doncaster, UK) situated5.5 m above the pigeon lofts. Weather data was logged usingCumulus Weather Station Software (Sandaysoft, Sanday, Orkney,UK; version 1.9.4).
Data processingGPS and accelerometer data were synchronised to an accuracy of±0.2 s (GPS frequency) using the point of take-off in both the GPSand accelerometer loggers, which were identified using the markedincreases in GPS speed and dorsal acceleration peaks producedduring take-off. The weather data were combined with the GPS andaccelerometer data using the timestamps from the weather stationand the GPS loggers. For each GPS point, the orthodromic (great-circular) distance travelled and birds’ final bearing from theprevious point were calculated using the haversine formula andforward azimuth, respectively. For each flight, route efficiency wascalculated as the ratio between the total straight-line (great-circular)distance between release and home, divided by the sum of the direct(great-circular) distances between each successive GPS point(straightness index; Batschelet, 1981). Wind support andcrosswind were calculated using the methods described in Safiet al. (2013): wind support represents the length of the wind vectorin the direction of the bird’s flight and crosswind represents theabsolute speed of the wind vector perpendicular to the bird’sdirection of travel (Fig. S1). Airspeed, the speed of the bird relativeto the wind, was then calculated using the speed derived from theGPS devices while taking into account wind support and crosswind(Safi et al., 2013).The dorsal (Z-axis) accelerometer measurements were filtered by
taking a running mean over five data points (0.025 s). Staticacceleration (or gravity) was removed by subtracting a running meanover 15 wingbeat cycles (>2 s). The running mean was calculatedover wingbeat cycles rather than over specific time periods, becausevariation in wingbeat frequencies would have meant includingvarying quantities of partial wingbeat cycles in a time-basedrunningmean. The dorsal acceleration signal was then used to detecteach wingbeat using the upper reversal point in acceleration(Fig. S2) (Norberg, 1990; Portugal et al., 2014). The peak-to-peakDB acceleration (g) and wingbeat frequency (number of wingbeatsper second; Hz) were calculated for each individual wingbeat. Theamplitude of the DB displacement (mm), which is the amount thebody is displaced per wingbeat, was then calculated by the doubleintegration of dorsal accelerometer measurements (Usherwoodet al., 2011). After the first integration, a running mean over 15wingbeat cycles was removed from velocity to remove drift. Thedata were then filtered using a fourth-order high-pass Butterworthfilter with a cut-off frequency of 1 Hz. The procedure was repeatedafter the integration for displacement but with a cut-off frequency of2.5 Hz in the Butterworth filter. The cut-off frequencies weredetermined by visualising the data using fast Fourier transforms. Amore conservative estimate of the amplitude of the DB displacementwas also calculated by passing the raw accelerometer measurementsthrough fourth-order Butterworth filters prior to integration insteadof running means, but this led to no significant difference in theresults (Fig. S3).In order to only compare sections of steady flight, the data were
trimmed in a 1000 m radius around the release site (start point) andthe pigeon lofts (end point). The shortest straight-line distance of theentire steady flight therefore measured 5.08 km for the far site and1.85 km for the near site. In addition to comparing the entire steadyflight, the data were also trimmed to remove sections with lower
wingbeat frequencies (≤3.0 Hz) and sections of tortuous flight toremove any effect of gliding, idling or circling from the dataset.Tortuosity was calculated by taking a running mean of the change inthe birds’ bearing over every 1 s of data (five GPS points), withchanges in direction of ≥3.0 deg removed in order to discardcircling and keep only active straight-line powered flight.
Data analysesPiecewise linear mixed effects (LME) models were used investigatethe effect of repeated releases on route efficiency, median peak-to-peak DB acceleration per wingbeat (g), median DB amplitude perwingbeat (mm), median wingbeat frequency (Hz) and medianairspeed (m s−1). Piecewise, or segmented, regression identifies anabrupt change of the dependent variable (or breakpoint) with respectto the independent variable, which allows one to fit pre- and post-event slopes (Naumova et al., 2001). We used this approachto determine whether changes in wingbeat characteristicscorresponded to changes in route efficiency and to identify thetrends in the data either side of this change. Breakpoints wereobjectively estimated using one-dimensional optimisation.Piecewise LME models were fitted using the fixed effects ofrelease number less than the breakpoint (breakpoint – releasenumber), release number greater than the breakpoint (releasenumber – breakpoint), median wind support, median crosswind andgroup. Individual was also added as a random slope on both releasenumber effects.
To establish the effect of wingbeat characteristics on airspeed,two LME models were used. Firstly, with median peak-to-peak DBacceleration and median wingbeat frequency as fixed effects, andsecondly with median DB amplitude per wingbeat, which isdependent on peak-to-peak DB acceleration (force exerted on thedorsal body) and wingbeat frequency (duration of the wingbeat), asa fixed effect. Group was added as a fixed effect to both models butwas insignificant. Individual was added as a random effect on theintercept. In addition, LMEmodels were used to directly relate routeefficiency with wingbeat characteristics and airspeed betweenreleases 1 and 6 using the fixed effects of route efficiency, medianwind support, median crosswind and group, and the random effectof individual.
Route efficiency was negatively skewed, and was thereforetransformed before analysis by directly inverting values and takingthe logarithm using the formula log10(1−x). From the full models,simpler models were obtained by stepwise deletion of non-significant terms. Likelihood ratio tests were used to test thestatistical significance of each fixed effect in the best-fitting model.LME models were calculated using maximum likelihood andthe models were checked for assumptions of linearity, normality,homoskedasticity and autocorrelation by visual inspection of plottedresiduals. Model fit was assessed by calculating conditionalR-squared values (R2
LME(c)) using the methods described inNakagawa and Schielzeth (2013).
Data processing and analysis were conducted using MATLAB(MathWorks, Natick, MA, USA; version R2015a) and the open-source software R (version 3.2.3; R Foundation for StatisticalComputing, Vienna, Austria) using the packages lme4 (Bates et al.,2015; version 1.1-8) and MuMIn (version 1.15.1; https://cran.r-project.org/package=MuMIn).
RESULTSRoute efficiency improved as the birds became more experienced(Fig. 2). Over the first five releases, route efficiency increasedsignificantly from 0.46±0.27 (mean±s.d.) for release 1 to 0.82±0.18
2910
RESEARCH ARTICLE Journal of Experimental Biology (2017) 220, 2908-2915 doi:10.1242/jeb.154039
Journal
ofEx
perim
entalB
iology

for release 5 (piecewise linear mixed model parameterestimate=0.287; likelihood ratio test for the model without releasenumber: χ1
2=32.9, P<0.001). A breakpoint, which denotes a changeof the dependent variable (route efficiency) in respect to theindependent variable (release number), was then automaticallydetected between releases 5 and 6 {5.5, 95% confidence interval(CI)=[4.3, 6.2]; Fig. 3}. No significant difference in route efficiencywas detected among releases ranging from release 6 (0.88±0.10) torelease 20 (0.87±0.10; χ12=0.7, P=0.390). Group (i.e. releasedistance) also had a significant effect on route efficiency, with
birds released at the nearer site (group 2) flying significantly moreefficient routes than those released at the far site (group 1;estimate=0.316, χ1
2=4.8, P=0.029). However, group had nosignificant effect on wingbeat characteristics or speed, thus theresults from the two groups were pooled for the remainder of theanalyses (Table 1). Route efficiency was also significantly affectedby both median wind support (estimate=−0.05, χ12=14.8, P<0.001)and median crosswind (estimate=0.10, χ12=7.9, P=0.005), withgreater wind support and lower crosswinds associated with higherroute efficiency.
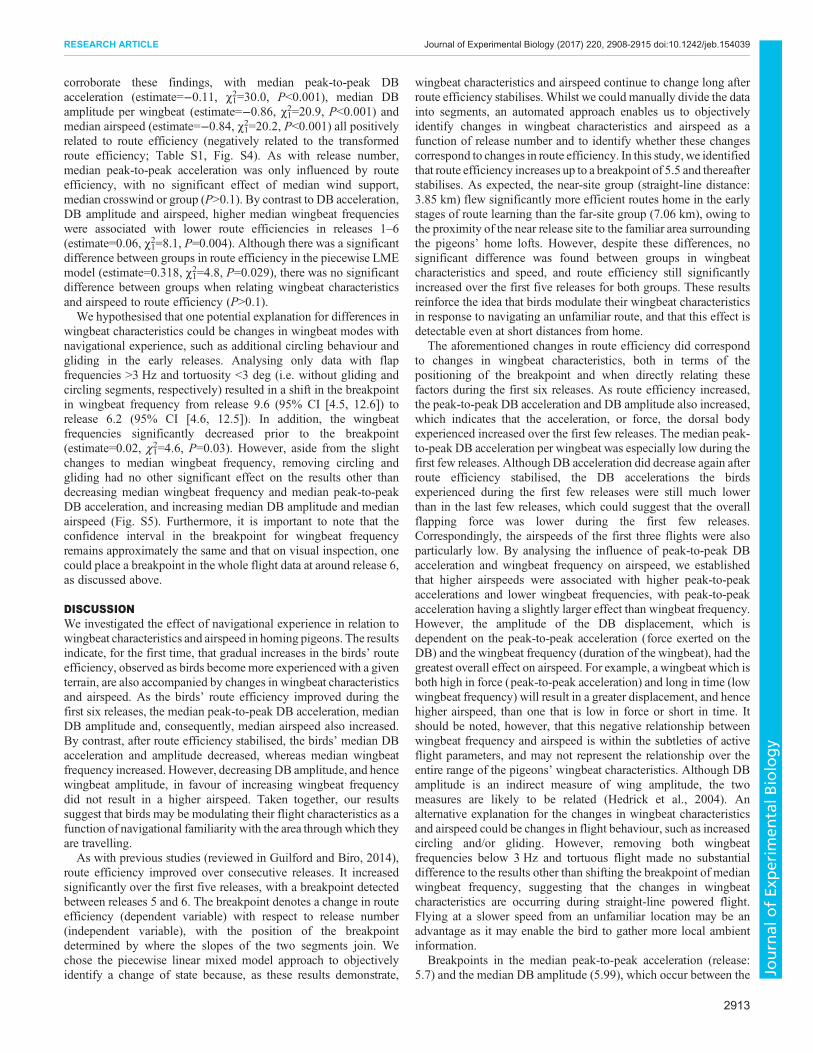
A breakpoint was detected in the median peak-to-peak DBacceleration (5.6, 95% CI [4.1, 6.8]) and in the median DBamplitude (5.99, 95% CI [4.6, 6.9]) between the same releasenumbers (5 and 6) as route efficiency (5.5, 95% CI [4.3, 6.2]). Boththe DB acceleration and amplitude significantly increased prior tothe breakpoint (acceleration: estimate=0.038, χ12=7.4, P=0.007;amplitude: estimate=0.295, χ12=8.5, P=0.004) before decreasing(acceleration: estimate=−0.006, χ12=8.5, P=0.004; amplitude:estimate=−0.123, χ12=16.4, P<0.001; Fig. 4A,B). By contrast, thebreakpoint for median wingbeat frequency appeared later, betweenreleases 9 and 10 (9.6, 95% CI [4.5, 12.6]), with no significantchange prior to the breakpoint (χ12=2.0, P=0.159). Upon visualinspection, one might argue that there is a breakpoint in the medianwingbeat frequency around release 6 (Fig. 4C). Indeed, manuallymoving the breakpoint to the breakpoints of DB acceleration (5.6)and amplitude (5.99) revealed that wingbeat frequency significantlydecreased during the early releases (breakpoint 5.6: estimate=−0.03, χ1
2=2.83, P=0.007; breakpoint 5.99: estimate=−0.02,χ12=6.89, P=0.009). However, the resultant models were weaker
and accounted for less of the variability, which is why the objectivebreakpoint is situated slightly later between releases 9 and 10. Thevisual ambiguity in the breakpoint is reflected in the confidenceinterval, which is large for median wingbeat frequency (95% CI[4.5, 12.6]). After the objective breakpoint, wingbeat frequencyincreased significantly (estimate=0.02, χ1
2=18.6, P<0.001).Median wind support also had a significant effect on both
median wingbeat frequency and median DB amplitude, with higherwind support associated with lower wingbeat frequencies
0
A
B
0.5 1 2
Release 1 Release 20 Release site Home 1000 m data trim
3km
Fig. 2. Examples of routes flown duringthe first (red; release 1) and last release(blue; release 20). (A) From the far site;(B) from the near site. Note the increase inroute efficiency at both sites. Map designedusing ArcGIS 10.4.1 using the WorldTopographic Map (http://services.arcgisonline.com/ArcGIS/rest/services/World_Topo_Map/MapServer).
0 2 4 6 8 10 12 14 16 18 200
0.2
0.4
0.6
0.8
1.0
Release number
Rou
te e
ffici
ency
Group 1 (far site)Group 2 (near site)Breakpoint95% confidence interval
Fig. 3. Route efficiency (mean±s.e.m.) as a function of release number forgroup 1 (far site, n=10) and group 2 (near site, n=11). The dashed lineindicates a computationally optimised piecewise linear mixed modelbreakpoint (±95% CI indicated by dotted lines) denoting a change in responsefunction in respect to release number. Solid lines correspond to localpolynomial regression fitting.
2911
RESEARCH ARTICLE Journal of Experimental Biology (2017) 220, 2908-2915 doi:10.1242/jeb.154039
Journal
ofEx
perim
entalB
iology
(estimate=−0.02, χ12=26.5, P<0.001) and increased DB amplitude(estimate=0.20, χ12=25.3, P<0.001). By contrast, median windsupport had no effect on peak-to-peak DB acceleration, and mediancrosswind had no effect on any of the wingbeat characteristics.Median airspeed (m s−1) increased during the first five releases
(breakpoint 5.2, 95% CI [3.9, 7.8]; estimate=0.53, χ12=32.5,
P<0.001) and thereafter decreased slightly (estimate=−0.07,χ12=10.6, P<0.001; Fig. 4D). The means of the median flightairspeeds for the first three releases were particularly low (release 1:20.1±1.6 m s−1; release 2: 19.2±1.4 m s−1; release 3: 19.7±1.0 m s−1). However, the coefficient of determination for therelationship between median airspeed and release number was low,even when accounting for individual variation (R2
LME(c)=0.22). Byanalysing all 20 releases in an LME model with median peak-to-
peak acceleration and median wingbeat frequency as fixed effects,we found that higher airspeeds were associated with higher peak-to-peak DB accelerations (estimate=1.57, χ12=10.3, P=0.001) andlower wingbeat frequencies (estimate=−0.78, χ12=3.9, P=0.048).Furthermore, in a model with DB amplitude (displacement) as afixed effect, which is dependent on peak-to-peak DB acceleration(force exerted on the DB) and wingbeat frequency (duration of thewingbeat), DB amplitude was positively associated with airspeed(estimate=−0.24, χ12=23.3, P<0.001).
The results thus far indicate that changes in wingbeatcharacteristics and airspeed correspond to changes in our routefamiliarity variable (i.e. route efficiency). To directly relate thesefindings, LME models were used with route efficiency as a fixedeffect between releases 1 and 6. The results of these analyses
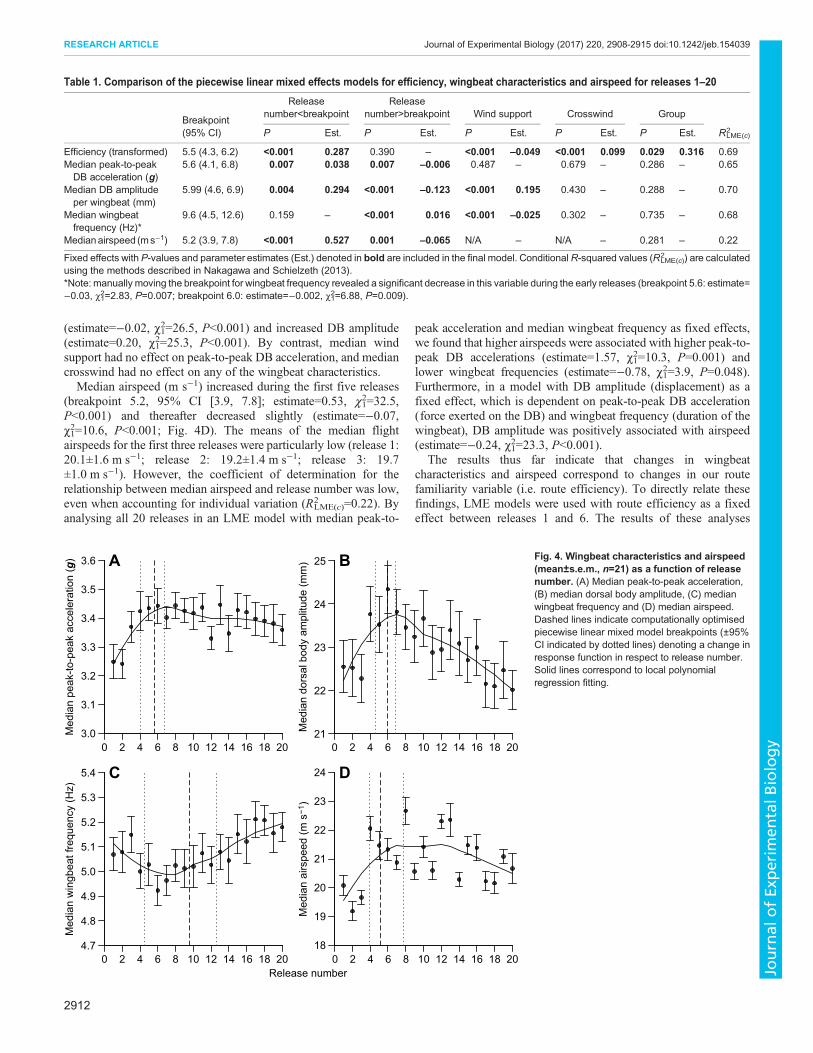
Table 1. Comparison of the piecewise linear mixed effects models for efficiency, wingbeat characteristics and airspeed for releases 1–20
Breakpoint(95% CI)
Releasenumber<breakpoint
Releasenumber>breakpoint Wind support Crosswind Group
R2LME(c)P Est. P Est. P Est. P Est. P Est.
Efficiency (transformed) 5.5 (4.3, 6.2) <0.001 0.287 0.390 – <0.001 –0.049 <0.001 0.099 0.029 0.316 0.69Median peak-to-peakDB acceleration (g)
5.6 (4.1, 6.8) 0.007 0.038 0.007 –0.006 0.487 – 0.679 – 0.286 – 0.65
Median DB amplitudeper wingbeat (mm)
5.99 (4.6, 6.9) 0.004 0.294 <0.001 –0.123 <0.001 0.195 0.430 – 0.288 – 0.70
Median wingbeatfrequency (Hz)*
9.6 (4.5, 12.6) 0.159 – <0.001 0.016 <0.001 –0.025 0.302 – 0.735 – 0.68
Medianairspeed (ms−1) 5.2 (3.9, 7.8) <0.001 0.527 0.001 –0.065 N/A – N/A – 0.281 – 0.22
Fixed effects with P-values and parameter estimates (Est.) denoted in bold are included in the final model. Conditional R-squared values (R2LME(c)) are calculated
using the methods described in Nakagawa and Schielzeth (2013).*Note: manually moving the breakpoint for wingbeat frequency revealed a significant decrease in this variable during the early releases (breakpoint 5.6: estimate=−0.03, χ12=2.83, P=0.007; breakpoint 6.0: estimate=−0.002, χ12=6.88, P=0.009).
0 2 4 6 8 10 12 14 16 18 203.0
3.1
3.2
3.3
3.4
3.5
3.6
Med
ian
peak
-to-p
eak
acce
lera
tion
(g) A
0 2 4 6 8 10 12 14 16 18 2021
22
23
24
25
Med
ian
dors
al b
ody
ampl
itude
(mm
) B
0 2 4 6 8 10 12 14 16 18 204.7
4.8
4.9
5.0
5.1
5.2
5.3
5.4
Release number
Med
ian
win
gbea
t fre
quen
cy (H
z)
C
0 2 4 6 8 10 12 14 16 18 2018
19
20
21
22
23
24
Med
ian
airs
peed
(m s
−1)
D
Fig. 4. Wingbeat characteristics and airspeed(mean±s.e.m., n=21) as a function of releasenumber. (A) Median peak-to-peak acceleration,(B) median dorsal body amplitude, (C) medianwingbeat frequency and (D) median airspeed.Dashed lines indicate computationally optimisedpiecewise linear mixed model breakpoints (±95%CI indicated by dotted lines) denoting a change inresponse function in respect to release number.Solid lines correspond to local polynomialregression fitting.
2912
RESEARCH ARTICLE Journal of Experimental Biology (2017) 220, 2908-2915 doi:10.1242/jeb.154039
Journal
ofEx
perim
entalB
iology
corroborate these findings, with median peak-to-peak DBacceleration (estimate=−0.11, χ1
2=30.0, P<0.001), median DBamplitude per wingbeat (estimate=−0.86, χ12=20.9, P<0.001) andmedian airspeed (estimate=−0.84, χ12=20.2, P<0.001) all positivelyrelated to route efficiency (negatively related to the transformedroute efficiency; Table S1, Fig. S4). As with release number,median peak-to-peak acceleration was only influenced by routeefficiency, with no significant effect of median wind support,median crosswind or group (P>0.1). By contrast to DB acceleration,DB amplitude and airspeed, higher median wingbeat frequencieswere associated with lower route efficiencies in releases 1–6(estimate=0.06, χ1
2=8.1, P=0.004). Although there was a significantdifference between groups in route efficiency in the piecewise LMEmodel (estimate=0.318, χ1
2=4.8, P=0.029), there was no significantdifference between groups when relating wingbeat characteristicsand airspeed to route efficiency (P>0.1).We hypothesised that one potential explanation for differences in
wingbeat characteristics could be changes in wingbeat modes withnavigational experience, such as additional circling behaviour andgliding in the early releases. Analysing only data with flapfrequencies >3 Hz and tortuosity <3 deg (i.e. without gliding andcircling segments, respectively) resulted in a shift in the breakpointin wingbeat frequency from release 9.6 (95% CI [4.5, 12.6]) torelease 6.2 (95% CI [4.6, 12.5]). In addition, the wingbeatfrequencies significantly decreased prior to the breakpoint(estimate=0.02, χ12=4.6, P=0.03). However, aside from the slightchanges to median wingbeat frequency, removing circling andgliding had no other significant effect on the results other thandecreasing median wingbeat frequency and median peak-to-peakDB acceleration, and increasing median DB amplitude and medianairspeed (Fig. S5). Furthermore, it is important to note that theconfidence interval in the breakpoint for wingbeat frequencyremains approximately the same and that on visual inspection, onecould place a breakpoint in the whole flight data at around release 6,as discussed above.
DISCUSSIONWe investigated the effect of navigational experience in relation towingbeat characteristics and airspeed in homing pigeons. The resultsindicate, for the first time, that gradual increases in the birds’ routeefficiency, observed as birds become more experienced with a giventerrain, are also accompanied by changes in wingbeat characteristicsand airspeed. As the birds’ route efficiency improved during thefirst six releases, the median peak-to-peak DB acceleration, medianDB amplitude and, consequently, median airspeed also increased.By contrast, after route efficiency stabilised, the birds’ median DBacceleration and amplitude decreased, whereas median wingbeatfrequency increased. However, decreasing DB amplitude, and hencewingbeat amplitude, in favour of increasing wingbeat frequencydid not result in a higher airspeed. Taken together, our resultssuggest that birds may be modulating their flight characteristics as afunction of navigational familiarity with the area through which theyare travelling.As with previous studies (reviewed in Guilford and Biro, 2014),
route efficiency improved over consecutive releases. It increasedsignificantly over the first five releases, with a breakpoint detectedbetween releases 5 and 6. The breakpoint denotes a change in routeefficiency (dependent variable) with respect to release number(independent variable), with the position of the breakpointdetermined by where the slopes of the two segments join. Wechose the piecewise linear mixed model approach to objectivelyidentify a change of state because, as these results demonstrate,
wingbeat characteristics and airspeed continue to change long afterroute efficiency stabilises. Whilst we could manually divide the datainto segments, an automated approach enables us to objectivelyidentify changes in wingbeat characteristics and airspeed as afunction of release number and to identify whether these changescorrespond to changes in route efficiency. In this study,we identifiedthat route efficiency increases up to a breakpoint of 5.5 and thereafterstabilises. As expected, the near-site group (straight-line distance:3.85 km) flew significantly more efficient routes home in the earlystages of route learning than the far-site group (7.06 km), owing tothe proximity of the near release site to the familiar area surroundingthe pigeons’ home lofts. However, despite these differences, nosignificant difference was found between groups in wingbeatcharacteristics and speed, and route efficiency still significantlyincreased over the first five releases for both groups. These resultsreinforce the idea that birds modulate their wingbeat characteristicsin response to navigating an unfamiliar route, and that this effect isdetectable even at short distances from home.
The aforementioned changes in route efficiency did correspondto changes in wingbeat characteristics, both in terms of thepositioning of the breakpoint and when directly relating thesefactors during the first six releases. As route efficiency increased,the peak-to-peak DB acceleration and DB amplitude also increased,which indicates that the acceleration, or force, the dorsal bodyexperienced increased over the first few releases. The median peak-to-peak DB acceleration per wingbeat was especially low during thefirst few releases. Although DB acceleration did decrease again afterroute efficiency stabilised, the DB accelerations the birdsexperienced during the first few releases were still much lowerthan in the last few releases, which could suggest that the overallflapping force was lower during the first few releases.Correspondingly, the airspeeds of the first three flights were alsoparticularly low. By analysing the influence of peak-to-peak DBacceleration and wingbeat frequency on airspeed, we establishedthat higher airspeeds were associated with higher peak-to-peakaccelerations and lower wingbeat frequencies, with peak-to-peakacceleration having a slightly larger effect than wingbeat frequency.However, the amplitude of the DB displacement, which isdependent on the peak-to-peak acceleration (force exerted on theDB) and the wingbeat frequency (duration of the wingbeat), had thegreatest overall effect on airspeed. For example, a wingbeat which isboth high in force (peak-to-peak acceleration) and long in time (lowwingbeat frequency) will result in a greater displacement, and hencehigher airspeed, than one that is low in force or short in time. Itshould be noted, however, that this negative relationship betweenwingbeat frequency and airspeed is within the subtleties of activeflight parameters, and may not represent the relationship over theentire range of the pigeons’ wingbeat characteristics. Although DBamplitude is an indirect measure of wing amplitude, the twomeasures are likely to be related (Hedrick et al., 2004). Analternative explanation for the changes in wingbeat characteristicsand airspeed could be changes in flight behaviour, such as increasedcircling and/or gliding. However, removing both wingbeatfrequencies below 3 Hz and tortuous flight made no substantialdifference to the results other than shifting the breakpoint of medianwingbeat frequency, suggesting that the changes in wingbeatcharacteristics are occurring during straight-line powered flight.Flying at a slower speed from an unfamiliar location may be anadvantage as it may enable the bird to gather more local ambientinformation.
Breakpoints in the median peak-to-peak acceleration (release:5.7) and the median DB amplitude (5.99), which occur between the
2913
RESEARCH ARTICLE Journal of Experimental Biology (2017) 220, 2908-2915 doi:10.1242/jeb.154039
Journal
ofEx
perim
entalB
iology
same release number as route efficiency (5.5), along with the factthat higher peak-to-peak acceleration and DB amplitude wereassociated with higher route efficiency in releases 1–6, indicate thatDBmovements change as a function of navigational knowledge. Bycontrast, during the first six releases, higher wingbeat frequencieswere associated with lower route efficiencies. The large confidenceinterval and slightly later breakpoint in wingbeat frequency (9.6)suggest that it is likely that birds continue to learn routes home evenafter route efficiency initially plateaus. Indeed, removing circlingand gliding behaviour resulted in a breakpoint in wingbeatfrequencies being detected at release 6.2. Thus, changes inwingbeat characteristics shortly after the route efficiencybreakpoint could still be related to the acquisition of navigationalknowledge. An alternative explanation could be increases in thebirds’ physical fitness, or acclimatisation to the sensor mass or to thecapture and release procedure. However, given the substantialnumber of releases immediately prior to the start of the experiment(≥24), the daily free flights around the loft and the fact that the birdswere fitted with clay weights equal to the size and mass of thedevices 2 weeks prior to the start of the experiment, this is unlikelyto have been a factor. Furthermore, migratory species, such asbarnacle geese (Branta leucopsis) undertaking 2500 km journeys,do not increase flight behaviour prior to migratory departure(Portugal et al., 2012), suggesting exercise is not a prerequisite forextended flight.Shortly after route efficiency stabilised, changes in the birds’
flight characteristics consisted largely of increases in wingbeatfrequency as the birds’ DB acceleration and amplitude decreased.The inertial power requirement, or cost, of horizontal steady flight isproportional to the square of wingbeat amplitude but the cube ofwingbeat frequency (Greenewalt, 1962; Lilienthal, 2001), whichmeans increasing wingbeat frequency would result in a higherinertial power cost. If this higher wingbeat frequency translated intohigher airspeeds, then this strategy could be beneficial as the birdwould then reach its destination in less time (Hedenström andAlerstam, 1995). However, as already highlighted, higher wingbeatfrequencies were associated with lower airspeeds. Indeed, airspeeddid decrease significantly from release 6, although variability in thiswas high and the effect size small. Albeit increasing wingbeatfrequency would increase the inertial power costs, a higher wingbeatfrequency would also result in a higher aerodynamic efficiency byreducing the drag from the wings and body and increasing lift(Greenewalt, 1962; Lilienthal, 2001), which may be advantageousonce the total length of the journey is known. The median wingbeatfrequency increased in this study from 4.9 (release 6) to 5.2(release 18), i.e. by 5.8%. However, these wingbeat frequenciesare still considerably lower than those reported for homingpigeons participating in flight that may require a higher degreeof aerodynamic efficiency or stability, such as flock flight(∼6.6–7.0 Hz; Usherwood et al., 2011) and during ascending anddescending flight (6.1–9.6 Hz; Berg and Biewener, 2008). Thus, theincreases in wingbeat frequency exhibited in the present study aremore likely to be related to birds optimising their flight patternsbetween inertial power requirements and aerodynamic efficiency.Increasing aerodynamic efficiency, by increasing wingbeat
frequency, could help conserve energy, particularly as the resultsof this study also indicate a strong effect of the wind on routeefficiency and flight characteristics. The effect of wind on flight iswell documented, particularly in relation to the timing and distancetravelled during migration (Alerstam, 1979; Liechti and Bruderer,1998). Liechti (2006) highlighted that wind speed can easily doubleor halve the bird’s speed and thereby affect the overall cost of the
flight. Weather data used in this study (mean wind speed andbearing) were recorded 5.5 m above the pigeon lofts, 7.06 km fromthe ‘far’ release site. Therefore, the accuracy of the readingsdecreased the further away the bird was from the lofts, which couldexplain some of the variation, particularly in airspeed, found in thisstudy. Nevertheless, the results indicate that wind support, inparticular, was a consistent and significant factor contributing to thework rate, with a higher wind support (tail wind) associated with alower wingbeat frequency, which would decrease the inertial powercosts. By contrast, the birds’ peak-to-peak DB acceleration was notaffected by the wind, which suggests that in winds under 7 m s−1,birds compensate for the wind by modulating wingbeat frequencyrather than the amplitude. Indeed, the change in breakpoint in thewingbeat frequency from the whole flight data to the active straight-line data from release 9.6 to release 6.2 could also be a reflection ofthe birds utilising circling and gliding behaviour to compensate forthe effects of the wind. Furthermore, higher route efficiency wasassociated with higher wind support and lower crosswinds, whichsuggests that the birds may modify their route (and hence their routeefficiency) depending on the wind conditions.
Regardless of the underlying cause for the changes in wingbeatcharacteristics, the results of this study indicate, for the first time,that pigeons modulate their wingbeat characteristics as a function ofnavigational knowledge, which suggests that navigation and thelearning process may have physical manifestations in birds. Inparticular’ peak-to-peak DB acceleration was especially low duringthe first few releases, which was unaffected by wind characteristics,and related to a lower airspeed. Thus, measuring flightcharacteristics could provide new insights into the cognitive stateof the bird. For example, wingbeat characteristics may be used as‘signatures’ of birds’ route familiarity, which could be utilised innavigation research to identify how familiar a bird is with a givennavigational task. Furthermore, the results of this study lead us tospeculate that birds may be able to orient and learn more effectivelyat lower speeds, in which case the flight would then become a trade-off, or compromise, between optimal navigation and learning(accuracy), and vulnerability to predators and the total flight time(speed). Moreover, these results suggest that the cost of the firstflight, such as the first migration or first route out in search of a novelforaging site, may be higher than that of subsequent flights, becauseof both inefficiencies in the route, which increase the total distanceflown, and the increased flight time, owing to lower airspeeds. This,in turn, could impact on the total time available for foraging andreproduction, and other decisions, such as whether to fly with otherindividuals. For example, despite the additional energetic cost offlying in a close cluster flock (Usherwood et al., 2011), a naiveindividual may be able to conserve energy by flying withexperienced individuals to reduce the total flight time, as well asgain protection from predators. Thus, studying intra-individualmodulations of wingbeat characteristics and airspeed could providenew insights into the decision-making and navigational strategies ofbirds.
AcknowledgementsWe thank Lucy Larkman, Dave Wilson and Phil Smith for animal husbandry andtechnical support, and Graham Taylor, Theresa Burt de Perera, Lauriane Rat-Fischer, Isobel Watts, Oliver Padget, Allert Bijleveld, Simon Taylor, Indira Nagesh,Marco Klein Heerenbrink and members of the navigation, flight and behaviouralecology research groups at Oxford’s Department of Zoology for helpful discussionsand comments on earlier versions of themanuscript. Wewould also like to thank twoanonymous reviewers for their helpful comments on the manuscript.
Competing interestsThe authors declare no competing or financial interests.
2914
RESEARCH ARTICLE Journal of Experimental Biology (2017) 220, 2908-2915 doi:10.1242/jeb.154039
Journal
ofEx
perim
entalB
iology
Author contributionsConceptualization: L.A.T., S.J.P., D.B.; Methodology: L.A.T., S.J.P., D.B.;Formal analysis: L.A.T.; Investigation: L.A.T.; Resources: L.A.T., D.B.; Data curation:L.A.T.; Writing - original draft: L.A.T.; Writing - review & editing: L.A.T., S.J.P., D.B.;Visualization: L.A.T.; Supervision: S.J.P., D.B.; Project administration: L.A.T., D.B.;Funding acquisition: L.A.T., D.B.
FundingL.A.T. was funded by the Biotechnology and Biological Sciences Research Council(BBSRC) UK (grant number BB/J014427/1), D.B. by a Royal Society UniversityResearch Fellowship (grant UF110081).
Data availabilityData are available from the Dryad Digital Repository (Taylor et al., 2017): http://dx.doi.org/10.5061/dryad.37d5m
Supplementary informationSupplementary information available online athttp://jeb.biologists.org/lookup/doi/10.1242/jeb.154039.supplemental
ReferencesAlerstam, T. (1979). Wind as selective agent in bird migration. Ornis Scand.10, 76-93.
Bates, D., Machler, M., Bolker, B. and Walker, S. (2015). Fitting linear mixed-effects models using lme4. J. Stat. Softw. 67, 1-48.
Batschelet, E. (1981). Circular Statistics in Biology. London: Academic Press.Berg, A. M. and Biewener, A. A. (2008). Kinematics and power requirements ofascending and descending flight in the pigeon (Columba livia). J. Exp. Biol. 211,1120-1130.
Biro, D., Guilford, T., Dell’Omo, G. and Lipp, H.-P. (2002). How the viewing offamiliar landscapes prior to release allows pigeons to home faster: evidence fromGPS tracking. J. Exp. Biol. 205, 3833-3844.
Biro, D., Meade, J. and Guilford, T. (2004). Familiar route loyalty implies visualpilotage in the homing pigeon. Proc. Natl. Acad. Sci. USA 101, 17440-17443.
Butler, P. J., Green, J. A., Boyd, I. L. and Speakman, J. R. (2004). Measuringmetabolic rate in the field: the pros and cons of the doubly labelled water and heartrate methods. Funct. Ecol. 18, 168-183.
Flack, A., Fiedler, W., Blas, J., Pokrovsky, I., Kaatz, M., Mitropolsky, M.,Aghababyan, K., Fakriadis, I., Makrigianni, E., Jerzak, L. et al. (2016). Costs ofmigratory decisions: a comparison across eight white stork populations. Sci. Adv.2, e1500931.
Gagliardo, A. (2013). Forty years of olfactory navigation in birds. J. Exp. Biol. 216,2165-2171.
Greenewalt, C. H. (1962). Dimensional relationships for flying animals. Smithson.Misc. Collect. 144, 1-46.
Guilford, T. Biro, D. (2014). Route following and the pigeon’s familiar area map.J. Exp. Biol. 217, 169-179.
Halsey, L. G., Portugal, S. J., Smith, J. A., Murn, C. P. and Wilson, R. P. (2009).Recording raptor behavior on the wing via accelerometry. J. Field Ornithol. 80,171-177.
Hedenstrom, A. and Alerstam, T. (1995). Optimal flight speed of birds. Philos.Trans. R. Soc. B Biol. Sci. 348, 471-487.
Hedrick, T. L., Usherwood, J. R. and Biewener, A. A. (2004). Wing inertia andwhole-body acceleration: an analysis of instantaneous aerodynamic force
production in cockatiels (Nymphicus hollandicus) flying across a range ofspeeds. J. Exp. Biol. 207, 1689-1702.
Kramer, G. (1957). Experiments on bird orientation and their interpretation. Ibis 99,196-227.
Liechti, F. (2006). Birds: Blowin’ by the wind? J. Ornithol. 147, 202-211.Liechti, F. and Bruderer, B. (1998). The relevance of wind for optimal migration
theory. J. Avian Biol. 29, 561-568.Lilienthal, O. (2001). Birdflight as the Basis of Aviation [transl.]. Hummelstown, PA:
Markowski International.Meade, J., Biro, D. and Guilford, T. (2005). Homing pigeons develop local route
stereotypy. Proc. R. Soc. B Biol. Sci. 272, 17-23.Nakagawa, S. and Schielzeth, H. (2013). A general and simple method for
obtainingR2 from generalized linear mixed-effects models.Methods Ecol. Evol. 4,133-142.
Naumova, E. N., Must, A. and Laird, N. M. (2001). Tutorial in Biostatistics:evaluating the impact of ‘critical periods’ in longitudinal studies of growth usingpiecewise mixed effects models. Int. J. Epidemiol. 30, 1332-1341.
Norberg, U. M. (1990). Vertebrate Flight: Mechanics, Physiology, Morphology,Ecology and Evolution. Berlin: Springer-Verlag.
Portugal, S. J., Green, J. A., White, C. R., Guillemette, M. andButler, P. J. (2012).Wild geese do not increase flight behaviour prior to migration. Biol. Lett. 8,469-472.
Portugal, S. J., Hubel, T. Y., Fritz, J., Heese, S., Trobe, D., Voelkl, B., Hailes, S.,Wilson, A. M. andUsherwood, J. R. (2014). Upwash exploitation and downwashavoidance by flap phasing in ibis formation flight. Nature 505, 399-402.
Rayner, J. M. V. (1985). Bounding and undulating flight in birds. J. Theor. Biol.117, 47-77.
Safi, K., Kranstauber, B., Weinzierl, R., Griffin, L., Rees, E. C., Cabot, D., Cruz,S., Proan o, C., Takekawa, J. Y., Newman, S. H. et al. (2013). Flying with thewind: scale dependency of speed and direction measurements in modelling windsupport in avian flight. Mov. Ecol. 1, 4.
Schmidt-Koenig, K. (1990). The sun compass. Experientia 46, 336-342.Schmidt-Nielsen, K. (1972). Locomotion: energy cost of swimming, flying, and
running. Science 177, 222-228.Steiner, I., Burgi, C., Werffeli, S., Dell’Omo, G., Valenti, P., Troster, G., Wolfer,
D. P. and Lipp, H.-P. (2000). A GPS logger and software for analysis of homing inpigeons and small mammals. Physiol. Behav. 71, 589-596.
Taylor, L. A., Portugal, S. J. and Biro, D. (2017). Data from: Homing pigeons(Columba livia) modulatewingbeat characteristics as a function of route familiarity.Dryad Digital Repository. http://dx.doi.org/10.5061/dryad.37d5m
Tobalske, B. W. and Dial, K. P. (1996). Flight kinematics of black-billed magpiesand pigeons over a wide range of speeds. J. Exp. Biol. 199, 263-280.
Usherwood, J. R. (2009). Inertia may limit efficiency of slow flapping flight, butmayflies show a strategy for reducing the power requirements of loiter. Bioinspir.Biomim. 4, 015003.
Usherwood, J. R., Stavrou, M., Lowe, J. C., Roskilly, K. andWilson, A. M. (2011).Flying in a flock comes at a cost in pigeons. Nature 474, 494-497.
Weimerskirch, H., Martin, J., Clerquin, Y., Alexandre, P. and Jiraskova, S.(2001). Energy saving in flight formation. Nature 413, 697-698.
Wilson, R. P., White, C. R., Quintana, F., Halsey, L. G., Liebsch, N., Martin, G. R.and Butler, P. J. (2006). Moving towards acceleration for estimates of activity-specific metabolic rate in free-living animals: The case of the cormorant. J. Anim.Ecol. 75, 1081-1090.
Wiltschko, W. and Wiltschko, R. (2005). Magnetic orientation andmagnetoreception in birds and other animals. J. Comp. Physiol. A 191, 675-693.
Wiltschko, R. and Wiltschko, W. (2009). Avian navigation. Auk 126, 717-743.
2915
RESEARCH ARTICLE Journal of Experimental Biology (2017) 220, 2908-2915 doi:10.1242/jeb.154039
Journal
ofEx
perim
entalB
iology