homelessness in louisiana - squarespace census and housing inventory. ... central louisiana homeless...
TRANSCRIPT
Prepared by the Louisiana Services Network Data Consortium (LSNDC), 2013. Permission is granted to copy and distribute this document without fee, provided that the text is not modified in any way, and the document is applied for educational, non-commercial use only.
A SINGLE NIGHT COUNTS: HOMELESSNESS IN LOUISIANA
A Report on the 2013 Point-in-Time
Homeless Census and Housing Inventory

A Single Night Counts: Homelessness in Louisiana
Page 2
The Board of the Louisiana Services Network Data Consortium (LSNDC) is comprised of representation from the CoC and
HMIS agency of each region within the State of Louisiana. This group was responsible for coordinating and executing the
Homeless Census within their member parishes. The regional leaders for the 2013 Census were:
Region I and X: Martha Kegel and Emily Danielson, Unity of Greater New Orleans and Clifton Harris, VIA LINK
Region II: Randy Nichols and Corey Dyer, Capital Area Alliance For the Homeless
Region III: Brooke Guidry and Mary Russo, START Corporation, and Lyletha Howard, Gulf Coast Social Services
Region IV: Eric Gammons, Andrew Zegura, and Elizabeth Lamond, Lafayette Catholic Service Centers
Region V: Randall Hebert and Beverly McCormick, Volunteer Center Southwest Louisiana
Region VI: Kendra Gauthier and Dwanna Sandifer, Central Louisiana Homeless Coalition
Region VII: Christa Pazzaglia and Tosha Stamps, HOPE for the Homeless and Lane Richardson, Centerpoint Community Services
Region VIII: Lawana Brown and Kattina Brittan, The Wellspring
Region IX: Dee Wild, Volunteers of America Greater New Orleans and Erin Matheny, Southeastern Louisiana University
The Report was prepared by the 2013 Homeless Census Report Workgroup of the LSNDC:
Ms. Erin Matheny and Ms. Barbara Taylor, Southeastern Louisiana University
Mr. Lane Richardson, Centerpoint Community Services, and
Mr. Andrew Zegura and Ms. Elizabeth Lamond, Lafayette Catholic Service Centers
Acknowledgements
Conducting the annual statewide point-in-time Homeless Census, along with the accompanying Homeless Demographic
and Needs Survey and Housing Inventory for the Homeless, is always a major undertaking. It involves homeless service
providers, homeless coalition (Continuum of Care) leaders, and support staff who coordinate and execute a plan for
administering the Census throughout the state during the same period of time. The success of the project is due, in large
part, to the hundreds of tireless service providers and compassionate volunteers who join forces to help us better
understand the face of homelessness in Louisiana. It is with our deepest gratitude that we acknowledge their time, talent,
and resources.
We would also like to thank all of the respondents who provided the information used to develop this report. Without their willingness to have their stories represented, we would not be able to examine where we are, nor speculate where it is we need to go, in our quest to eliminate homelessness in Louisiana.

A Single Night Counts: Homelessness in Louisiana
Page 3
Table of Contents
Pages Acknowledgements…………………………………..…….2
Table of Contents………………………………….…........3
Executive Summary………………………………….…..4-5
Introduction and Overview……………………….……...6-7
Purpose……………………………………………….…7-8 What Point-in-Time Homeless Data is Not…7-8
Definition of Homeless Populations…………………….….8
Methodology…………………………………………..8-11 Planning……………………………………..8-9 Survey Instrument and Collection of Data…9-11
State and Regional Homeless Census………..……....12-26 Homeless Census Survey Findings..………12-24 Housing Inventory………………………...25-26
Relational Demographic Data………………….........27-30
Appendix A: Survey Questionnaire…………………......31
Appendix B: Glossary of Terms………………….....32-34
Appendix C: Housing Inventory by CoC Region…....35-51
Appendix D: Demographics by State, CoC Region, and Parish ………………........................................52-70
A Single Night Counts: Homelessness in Louisiana
Page 4
A Single Night Counts: Homelessness in Louisiana Executive Summary
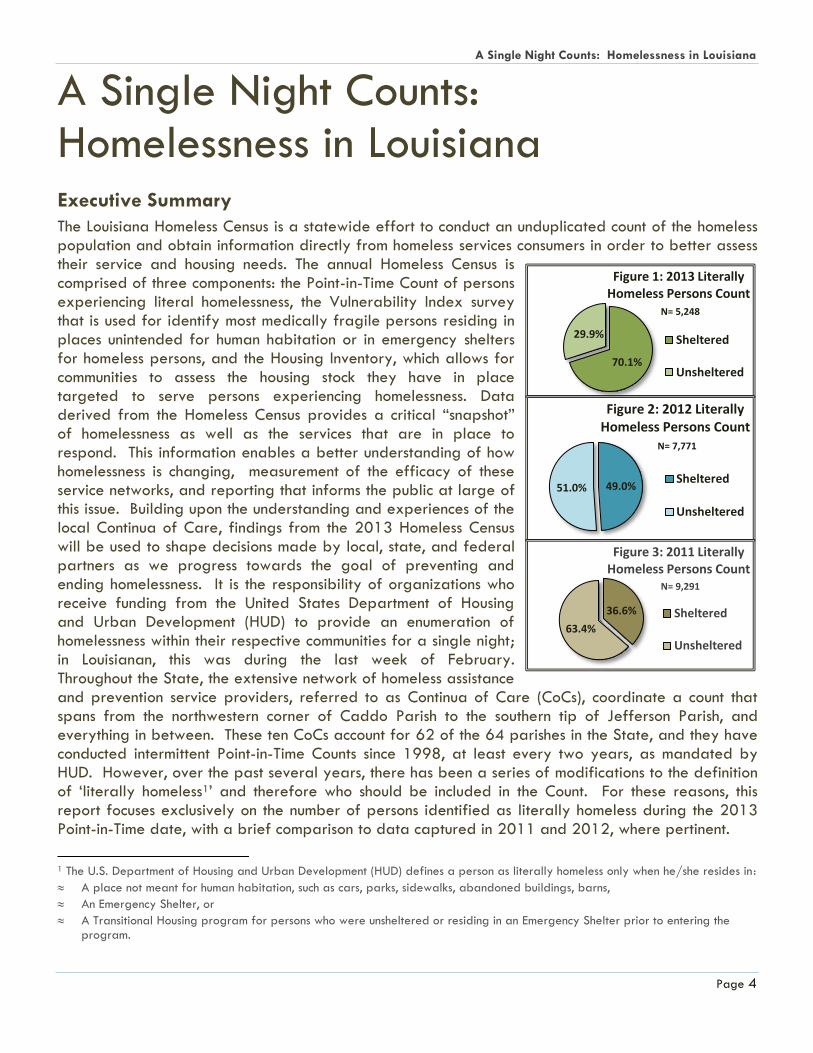
The Louisiana Homeless Census is a statewide effort to conduct an unduplicated count of the homeless population and obtain information directly from homeless services consumers in order to better assess their service and housing needs. The annual Homeless Census is comprised of three components: the Point-in-Time Count of persons experiencing literal homelessness, the Vulnerability Index survey that is used for identify most medically fragile persons residing in places unintended for human habitation or in emergency shelters for homeless persons, and the Housing Inventory, which allows for communities to assess the housing stock they have in place targeted to serve persons experiencing homelessness. Data derived from the Homeless Census provides a critical “snapshot” of homelessness as well as the services that are in place to respond. This information enables a better understanding of how homelessness is changing, measurement of the efficacy of these service networks, and reporting that informs the public at large of this issue. Building upon the understanding and experiences of the local Continua of Care, findings from the 2013 Homeless Census will be used to shape decisions made by local, state, and federal partners as we progress towards the goal of preventing and ending homelessness. It is the responsibility of organizations who receive funding from the United States Department of Housing and Urban Development (HUD) to provide an enumeration of homelessness within their respective communities for a single night; in Louisianan, this was during the last week of February. Throughout the State, the extensive network of homeless assistance and prevention service providers, referred to as Continua of Care (CoCs), coordinate a count that spans from the northwestern corner of Caddo Parish to the southern tip of Jefferson Parish, and everything in between. These ten CoCs account for 62 of the 64 parishes in the State, and they have conducted intermittent Point-in-Time Counts since 1998, at least every two years, as mandated by HUD. However, over the past several years, there has been a series of modifications to the definition of ‘literally homeless1’ and therefore who should be included in the Count. For these reasons, this report focuses exclusively on the number of persons identified as literally homeless during the 2013 Point-in-Time date, with a brief comparison to data captured in 2011 and 2012, where pertinent.
1 The U.S. Department of Housing and Urban Development (HUD) defines a person as literally homeless only when he/she resides in:
A place not meant for human habitation, such as cars, parks, sidewalks, abandoned buildings, barns,
An Emergency Shelter, or
A Transitional Housing program for persons who were unsheltered or residing in an Emergency Shelter prior to entering the program.
70.1%
29.9%
Figure 1: 2013 Literally Homeless Persons Count
N= 5,248
Sheltered
Unsheltered
49.0% 51.0%
Figure 2: 2012 Literally Homeless Persons Count
N= 7,771
Sheltered
Unsheltered
36.6%
63.4%
Figure 3: 2011 Literally Homeless Persons Count
N= 9,291
Sheltered
Unsheltered
A Single Night Counts: Homelessness in Louisiana
Page 5
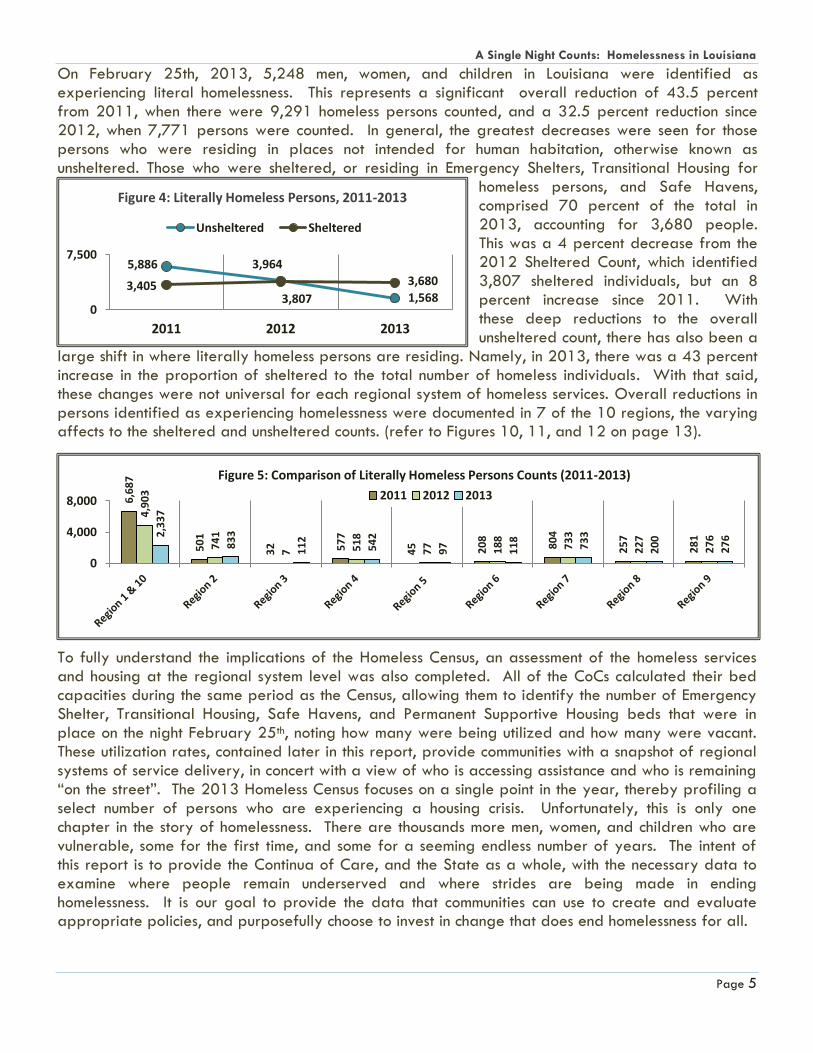
5,886 3,964
1,568 3,405
3,807
3,680
0
7,500
2011 2012 2013
Figure 4: Literally Homeless Persons, 2011-2013
Unsheltered Sheltered
6,6
87
50
1
32
57
7
45
20
8
80
4
25
7
28
1
4,9
03
74
1
7 51
8
77
18
8
73
3
22
7
27
6 2,3
37
83
3
11
2
54
2
97
11
8
73
3
20
0
27
6
0
4,000
8,000
Figure 5: Comparison of Literally Homeless Persons Counts (2011-2013)
2011 2012 2013
On February 25th, 2013, 5,248 men, women, and children in Louisiana were identified as experiencing literal homelessness. This represents a significant overall reduction of 43.5 percent from 2011, when there were 9,291 homeless persons counted, and a 32.5 percent reduction since 2012, when 7,771 persons were counted. In general, the greatest decreases were seen for those persons who were residing in places not intended for human habitation, otherwise known as unsheltered. Those who were sheltered, or residing in Emergency Shelters, Transitional Housing for
homeless persons, and Safe Havens, comprised 70 percent of the total in 2013, accounting for 3,680 people. This was a 4 percent decrease from the 2012 Sheltered Count, which identified 3,807 sheltered individuals, but an 8 percent increase since 2011. With these deep reductions to the overall unsheltered count, there has also been a
large shift in where literally homeless persons are residing. Namely, in 2013, there was a 43 percent increase in the proportion of sheltered to the total number of homeless individuals. With that said, these changes were not universal for each regional system of homeless services. Overall reductions in persons identified as experiencing homelessness were documented in 7 of the 10 regions, the varying affects to the sheltered and unsheltered counts. (refer to Figures 10, 11, and 12 on page 13).
To fully understand the implications of the Homeless Census, an assessment of the homeless services and housing at the regional system level was also completed. All of the CoCs calculated their bed capacities during the same period as the Census, allowing them to identify the number of Emergency Shelter, Transitional Housing, Safe Havens, and Permanent Supportive Housing beds that were in place on the night February 25th, noting how many were being utilized and how many were vacant. These utilization rates, contained later in this report, provide communities with a snapshot of regional systems of service delivery, in concert with a view of who is accessing assistance and who is remaining “on the street”. The 2013 Homeless Census focuses on a single point in the year, thereby profiling a select number of persons who are experiencing a housing crisis. Unfortunately, this is only one chapter in the story of homelessness. There are thousands more men, women, and children who are vulnerable, some for the first time, and some for a seeming endless number of years. The intent of this report is to provide the Continua of Care, and the State as a whole, with the necessary data to examine where people remain underserved and where strides are being made in ending homelessness. It is our goal to provide the data that communities can use to create and evaluate appropriate policies, and purposefully choose to invest in change that does end homelessness for all.
A Single Night Counts: Homelessness in Louisiana
Page 6
A Single Night Counts: Homelessness in Louisiana Introduction and Overview
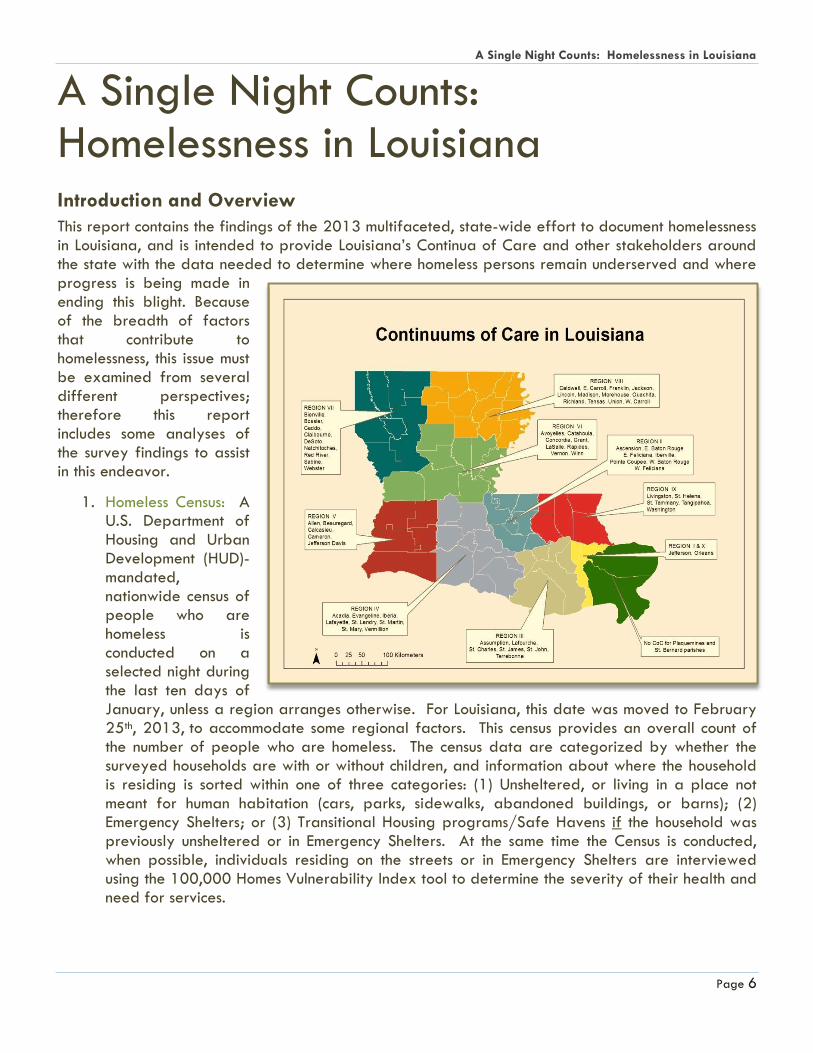
This report contains the findings of the 2013 multifaceted, state-wide effort to document homelessness in Louisiana, and is intended to provide Louisiana’s Continua of Care and other stakeholders around the state with the data needed to determine where homeless persons remain underserved and where progress is being made in ending this blight. Because of the breadth of factors that contribute to homelessness, this issue must be examined from several different perspectives; therefore this report includes some analyses of the survey findings to assist in this endeavor.
1. Homeless Census: A U.S. Department of Housing and Urban Development (HUD)-mandated, nationwide census of people who are homeless is conducted on a selected night during the last ten days of January, unless a region arranges otherwise. For Louisiana, this date was moved to February 25th, 2013, to accommodate some regional factors. This census provides an overall count of the number of people who are homeless. The census data are categorized by whether the surveyed households are with or without children, and information about where the household is residing is sorted within one of three categories: (1) Unsheltered, or living in a place not meant for human habitation (cars, parks, sidewalks, abandoned buildings, or barns); (2) Emergency Shelters; or (3) Transitional Housing programs/Safe Havens if the household was previously unsheltered or in Emergency Shelters. At the same time the Census is conducted, when possible, individuals residing on the streets or in Emergency Shelters are interviewed using the 100,000 Homes Vulnerability Index tool to determine the severity of their health and need for services.
Continua of Care Regions in Louisiana

A Single Night Counts: Homelessness in Louisiana
Page 7
2. Housing Inventory for the Homeless: At the same time as the Homeless Census, an inventory is conducted of housing options available for addressing homelessness.
3. Demographic Profiles from the U.S. Census: To provide supplemental demographic data for planning, findings from the 2010 Federal Census that share common factors with homeless demographic data are included. U.S. Census data can be found in the appendix of this report. [Appendix D]
The information provided in this report is aggregated to the state level, and where possible, at the regional level by Continua of Care (CoCs), the collaborative networks of homeless service organizations throughout the State of Louisiana.
Purpose
This report provides summary and analyses of data gathered during the 2013 Louisiana Homeless
Census with the intent of providing Continua of Care and stakeholders around the state with
information about the outcomes of efforts made to reduce, prevent and end homelessness. This data
helps answer questions about who is most likely to be homeless, where they reside, and what their
needs are. Louisiana’s nonprofit, volunteer, for-profit, religious and governmental agencies may use
this information to develop insights and effectively advance their work for the homeless men, women,
and children in Louisiana through:
Strengthened coordination among various stakeholders;
Increased public awareness of homeless issues and support for solutions;
Evidence to offer planning and funding bodies, such as foundations, corporations, municipalities, and other community stakeholders, to aid in prioritizing funds for ending homelessness;
The ability to analyze changes in the numbers and characteristics of homeless populations to determine trends and ascertain the effectiveness of services provided; and
The ability to track progress locally in response to newer Federal goals and reporting requirements.
What Point-in-Time Homeless Data is Not
While data obtained from a Point-in-Time Survey is valuable, anyone choosing to use this data must
recognize the measurement issues involved in collecting data on homeless persons. First, there are
limits in its population coverage because some groups, such as the unsheltered in largely rural areas,
are difficult to locate. Secondly, not all identified persons are willing to release information. Third,
counts may reflect those homeless persons who actually participated or received housing services
from human services organizations participating in the count. In some communities, there is a reliance
on using service requests to count individuals, so people who do not seek services at this time might
not be identified as homeless. Fourth, people who are at imminent risk of becoming homeless, such as
those who are being evicted from rental housing or temporarily living with family or friends and have
no other housing resources, are not defined as literally homeless for the purposes of this census, and
therefore are not documented in this report. Lastly, while the definitions of homeless services used for
this census are becoming more standardized in recent years, there remain some inconsistencies in
‘service-type’ labels, leading to imprecise inclusion/exclusion of eligible persons in the census. The

A Single Night Counts: Homelessness in Louisiana
Page 8
An HMIS is an electronic data collection system that stores longitudinal person-level information about persons who access the homeless services system in a Continuum of Care (CoC). HMIS is a valuable resource because of its capacity to integrate and unduplicate data from all homeless assistance and homelessness prevention programs in a CoC. Aggregate HMIS data can be used to understand the size, characteristics, and needs of the homeless population at the local, state, and national levels. ~U.S. Department of Housing and Urban Development (HUD), Homeless Management Information System (HMIS) Data Standards, Revised Notice, March 2010. Victim Service Provider Data is not included in HMIS, because victim service providers funded under HUD’s Supportive Housing, Shelter Plus Care, Section 8 Moderate Rehabilitation SRO, Emergency Solutions Grant, and Continuum of Care Programs are prohibited from disclosing any personally identifying information for purposes of HMIS.
~U.S. Department of Justice (DoJ) Violence Against Women Reauthorization Act of 2005 (Pub. L. 109-162)
(VAWA).
accuracy of data collection continues to improve as efforts to refine the counts progress. However,
this reported data demonstrates general patterns and is still applicable for planning purposes, as
long as the user acknowledges the possible biases and conservative assessments that accompany this
type of survey.
Definition of Homeless Populations There are multiple definitions of the term “homeless” used by various funding agencies; therefore it is
important to note that this report uses the definitions used by the Department of Housing and Urban
Development (HUD).2 The term “sheltered” in this report refers to persons who were living in
Emergency Shelters, including motel vouchers paid through human service organizations, Transitional
Housing programs for persons who came from the streets or Emergency Shelters, or Safe Havens on
the night of the census. The term “unsheltered” refers to persons who were sleeping outside or in some
place not appropriate for human habitation on the night of the count. Individuals and families who
are sharing housing due to economic hardship, often referred to as “doubled-up” or “couch surfing”,
and those facing evictions or repossession of their homes are not considered literally homeless, and
are therefore not included in the count. Persons who were residing in Permanent Supportive Housing
were also purposefully omitted from the count, but those beds were incorporated in the associated
inventory of housing for homeless and formally homeless persons. The term “chronic” refers to those
individuals with (or households with at least one adult who has) a disabling condition and have either
been continuously homeless for a year or more,
or have had at least four episodes of
homelessness in the past three years.
Methodology
Planning A committee comprised of CoC representatives
and Homeless Management Information
System (HMIS) administrators was formed in
2012 to plan for the statewide Homeless
Census. The night of Monday, February 25th,
was selected as the Point-in-Time, wherein
Continua of Care throughout Louisiana would
systematically identify and count the number
of men, women, and children experiencing
literal homelessness. The committee developed
the survey questions, and identified the
demographic and agency service usage data
that is needed to satisfy the various requests
for information by local and national agencies.
2 “Homeless Emergency Assistance and Rapid Transition to Housing: Defining ‘Homeless.’” Federal Register 76:233 (December 5, 2011) p. 75994. Available from: https://www.onecpd.info/resources/documents/HEARTH_HomelessDefinition_FinalRule.pdf; Accessed: 8/9/13.

A Single Night Counts: Homelessness in Louisiana
Page 9
Sheltered - residing in Emergency Shelters and
motels/apartments paid for by an agency; Transitional
Housing programs; or Safe Havens
Unsheltered - residing in places not meant for human
habitation, such as parks, abandoned buildings, et cetera.
Those living with others due to economic hardship, often called ‘doubling up’ or ‘couch surfing’ are not treated as being literally homeless.
Responsibility for performing the Census falls to the local CoC, who coordinates and supervises the
process, from the identification and recruitment of participating agencies/organizations and
volunteers for street counts, to providing training and accompanying materials, to distribution and
collection of the questionnaires, to data entry of results into the HMIS. As in 2012, the Homeless
Census Committee designed a survey instrument [Appendix A] that incorporated all desired data
elements, and developed an assessment format within the LSNDC database system that would allow
for electronic data entry and management of the survey responses. This effort allows each CoC to
be able to directly access their data, and it minimizes the number of persons who needed to be
surveyed, because many persons who were homeless on the night of the Count had already sought
services and were in the database.
Survey Instrument and Collection of Data The survey questionnaires were designed to be completed in one of two ways: (1) interviewing a known client or a person who may be homeless, or (2) having an agency representative complete the
survey on the behalf of clients residing in their Emergency Shelters or Transitional Housing programs, if they could provide the requested information. There were several driving forces behind much of the design of the data collection tool. The primary questions on the survey were derived from the HUD directive to identify the number of persons who are residing in Emergency Shelters, Transitional Housing for homeless persons, Safe Havens, or who are without shelter during the designated night of the Count. The definitions of
these types of housing programs can be found in Appendix B. Specifically, HUD requests that the counts enumerate three categories: Households without Children, Households with at least one Child, and Child Only Households, where a child is anyone seventeen years of age or younger. As well, the survey must also solicit specific sub-population data, including the number of Veterans, those fleeing domestic violence, and persons with any of a series of selected disabling conditions. The survey was designed to capture information from unaccompanied homeless individuals (adult or youth), or from multiple persons within the same household while controlling for duplicate respondents. In addition, the Committee elected to incorporate questions that allowed CoCs to assess those respondents who were residing in unsheltered conditions or Emergency Shelters using the Vulnerability Index (VI)3.
3 The Vulnerability Index is an instrumental component of the 100,000 Homes Campaign, a national movement to identify by name homeless persons in communities who are most susceptible to death should they remain without permanent housing [http://100khomes.org/]
3 100,000 Homes. (2010). Retrieved September 4, 2012, from http://100khomes.org/

A Single Night Counts: Homelessness in Louisiana
Page 10
The Vulnerability Index measures the risk of
mortality for individuals who have been homeless for at least six months and possess one or more of the following markers: 1) More than three hospitalizations or emergency room visits in a year 2) More than three emergency room visits in the previous three months 3) Aged 60 or older 4) Cirrhosis of the liver 5) End-stage renal disease 6) History of weather-related disease 7) HIV/AIDS 8) Tri-morbidity: co-occurring psychiatric, substance
abuse, and chronic medical condition Using these eight risk factors, a score on a scale of zero
to eight is assigned, with zero indicating the least and
eight the greatest risk.
The Vulnerability Index (VI) is a method of identifying who is most at risk of dying by remaining unsheltered or in Emergency Shelters on an intermittent basis, based on national research examining morbidity amongst homeless persons. For individuals who have been homeless for at least six months, one or more of the following markers place them at heightened risk of mortality: 1) More than three hospitalizations or emergency room visits in a year, 2) More than three emergency room visits in the previous three months, 3) Aged 60 or older, 4) Cirrhosis of the liver, 5) End-stage renal disease, 6) History of weather-related diseases 7) HIV/AIDS, 8) Tri-morbidity: co-occurring psychiatric, substance abuse, and chronic medical condition, 9) Living on the streets for more than six months, as well as, 10) At least one of a series of specific health conditions. Using these eight risk factors, a score on a scale of zero to eight is assigned to the respondent, with zero (0) indicating those least vulnerable to mortality and eight (8) highlighting those who have the greatest risk. Communities can use this data to prioritize who may most benefit in terms of health by being placed in permanent housing. This model is being utilized throughout the United States through the 100,000 Homes Campaign3, and increasingly, communities are harnessing this data as part of their annual Point-in-Time Counts of homeless persons. Within Louisiana, several of the Continua are using Vulnerability Index findings to help focus decision-making around limited permanent housing program funds. Since the predominant method of conducting the Census was through the participation of human service organizations, including governmental social service agencies, community action agencies, homeless shelters, domestic violence shelters, legal aid offices, churches, nonprofit organizations, and law enforcement agencies, it is important to note that there was a large variance in data collection among the CoCs. The level of variance depends on the physical composition of the region, the availability of resources, the abundance of human service providers, and so on. The metropolitan areas, notably New Orleans and Shreveport, possess a more extensive network of homeless services, providing an efficient collection of data in the short period of time used for the Census. It is also important to note that in 2013, Regions 1 & 10 used a statistically significant sampling of persons residing in abandoned buildings to derive their unsheltered count4, which reflects the exceptional situation of post-Katrina New Orleans. The more rural regions of the state often have a greater burden identifying homeless persons outside of those who are already receiving services on the chosen day, because widespread canvassing of these districts is not feasible. While the urban regions are able to identify blocks where unsheltered homeless persons are known to congregate, allowing volunteers to conduct interviews with concentrations of people, rural regions may be able to identify some areas where unsheltered homeless people are known to congregate, but many of the unsheltered homeless have difficulty traveling to those sites and remain unidentified. Ultimately, all of these efforts are not able to comprehensively reveal the true hidden homeless in any region.

A Single Night Counts: Homelessness in Louisiana
Page 11
Most of the responses from the completed surveys were entered into the statewide Homeless Management Information System (HMIS) that is administered by the Louisiana Services Network Data Consortium (LSNDC). HMIS databases are utilized by CoCs across the United States to capture and record standardized data on homeless persons. Use of an HMIS for data entry and reporting is mandated for programs receiving funding for homeless services from the Department of Housing and Urban Development (HUD), the U.S. Department of Veterans Affairs (VA) and/or the Substance Abuse and Mental Health Services Administration (SAMHSA). In Louisiana, the partnering organizations of all ten Continua utilize the LSNDC system to manage their client data. Because of this, many of those included in the Count, who were literally homeless and receiving services through one of these organizations, were therefore already recorded in the LSNDC system. Harnessing the HMIS for the Census minimized the entry of duplicate demographic information by the communities. Other persons surveyed were not already accessing services, so the interview was a first point of contact for these homeless persons who would have otherwise remained unknown to the CoC. Should these persons access homeless service networks in the future, there is now longitudinal information available that reflects their homelessness.
Figure 6 provides an alphabetical list of the parishes and their respective CoCs. The State of Louisiana is divided into ten Continua of Care, with each CoC encompassing multiple parishes. Each of the Continua of Care encompasses one or more Regions. Region 8, in the northeast corner of Louisiana is the largest, with a CoC comprised of twelve parishes, while Regions 1 and 10 contain one parish each, and are combined into one CoC. Plaquemines and St. Bernard Parishes are not part of any Continua. Appendix D provides demographic detail about the parishes that compromise each region.
Figure 6: Regional Continua of Care Composition by Parish
Parish Region (CoC) Parish Region (CoC) Parish Region (CoC)
ACADIA 4 IBERIA 4 ST. CHARLES 3
ALLEN 5 IBERVILLE 2 ST. HELENA 9
ASCENSION 2 JACKSON 8 ST. JAMES 3
ASSUMPTION 3 JEFF. DAVIS 5 ST. JOHN 3
AVOYELLES 6 JEFFERSON 10 ST. LANDRY 4
BEAUREGARD 5 LA SALLE 6 ST. MARTIN 4
BIENVILLE 7 LAFAYETTE 4 ST. MARY 4
BOSSIER 7 LAFOURCHE 3 ST. TAMMANY 9
CADDO 7 LINCOLN 8 TANGIPAHOA 9
CALCASIEU 5 LIVINGSTON 9 TENSAS 8
CALDWELL 8 MADISON 8 TERREBONNE 3
CAMERON 5 MOREHOUSE 8 UNION 8
CATAHOULA 6 NATCHITOCHES 7 VERMILLION 4
CLAIBORNE 7 ORLEANS 1 VERNON 6
CONCORDIA 6 OUACHITA 8 W. BATON ROUGE 2
DE SOTO 7 PLAQUEMINES not in CoC W. CARROLL 8
E BATON ROUGE 2 POINTE COUPEE 2 W. FELICIANA 2
E. FELICIANA 2 RAPIDES 6 WASHINGTON 9
EAST CARROLL 8 RED RIVER 7 WEBSTER 7
EVANGELINE 4 RICHLAND 8 WINN 6
FRANKLIN 8 SABINE 7 GRANT 6 ST. BERNARD not in CoC

A Single Night Counts: Homelessness in Louisiana
Page 12
State and Regional Homeless Census: Point-in-Time Survey Findings
As a starting point, 5,248 persons were identified as experiencing literal homelessness on February 25th
across Louisiana [Figure 7]. The majority, or 73 percent, of these persons were in households without children,
25 percent were in households with at least one child and adult, and almost 2 percent, were in children-only
households. These numbers reflect significant changes from 2011. The number of households without children
fell by almost 52 percent, from 7,934 to 3,843. During the three year span, households with at least one child
and adult saw a 5 percent increase, from 1,253 to 1,320, which is a 9 percent decrease from the 1,450
persons in 2012 and the count in 2013. Sadly, the number of child only households actually rose by 66
percent, from 51 to 85, between 2012 and 2013. Please note that Transitional Housing includes those
persons who were residing in Safe Havens. This was a separate reporting division in the 2012 and 2013
requirements set forth by HUD, but for the purposes of this report they are treated as a single housing type.
1,077
294
31
1,264
961
53
1,502
65 1 0
400
800
1,200
1,600
Persons in Households withoutChildren
Persons in Households with at leastOne Adult and One Child
Persons in Child Only Households
Figure 7: Counts of Literally Homeless Persons Statewide (2013) N = 5,248
In Emergency Shelter In Transitional Housing Unsheltered
1,320 3,843
1,111
243 10
1,288 1,126
18
3,871
81 23 0
1,000
2,000
3,000
4,000
Persons in Households withoutChildren
Persons in Households with at leastOne Adult and One Child
Persons in Child Only Households
Figure 8: Counts of Literally Homeless Persons Statewide (2012) N = 7,771
In Emergency Shelter In Transitional Housing Unsheltered
1,450 6,270 51
945 276
1,252 932
5,737
45 0
2,000
4,000
6,000
8,000
Persons in Households withoutChildren
Persons in Households with at leastOne Adult and One Child
Persons in Child Only Households
Figure 9: Counts of Literally Homeless Persons Statewide (2011) N = 9,291
In Emergency Shelter In Transitional Housing Unsheltered
1,253 7,934
**Persons in Child Only Households were not
counted as a separately in 2011 Count**
85

A Single Night Counts: Homelessness in Louisiana
Page 13
COMPARISON OF ANNUAL COUNTS - Figures 10, 11, and 12 exhibit the Sheltered and Unsheltered
Counts for the years 2011 through 2013 for each of the ten regions. While the aggregate data for the state
indicates a drastic reduction in the count of persons experiencing literal homelessness between 2011 and
2013 (Figures 7-9), an analysis of this same data at the regional level demonstrates that this is not a universal
trend. Unsheltered Counts were decreased in Regions 1 & 10, 2, 6, and 9 between 2011 and 2013, but for
the remaining regions saw an increase in the number of Unsheltered Persons. There was also large variance in
changes amongst counts for persons residing in Emergency Shelters and Transitional Housing programs during
the three year span. For example, Region 7 identified a 114 percent increase in the number of persons in
Emergency Shelter, but a 32.2 percent decrease in persons in Transitional Housing. For the same time period,
Region 9 counted 18.1 percent fewer people in Emergency Shelter, but 14.0 more people were residing in
Transitional Housing.
57
5
73
7 19
7
20
78
11
1
55
10
5
73
8
27
7
18
28
8
24
95
46
6
14
2
13
6
5,3
74
15
1
7 92
1 35
15
6
30
40
0
3,500
7,000
Figure 12: Counts of Literally Homeless Persons by Region (2011)
In Emergency Shelter In Transitional Housing Unsheltered
57
8
15
8
60
16
5
30
38
23
8
49
86
72
0
56
5
42
26
8
40
49
31
6
12
3
15
5
1,0
39
11
0
10
10
9
27
31
17
9
28
35
0
600
1,200
Figure 10: Counts of Literally Homeless Persons by Region (2013)
In Emergency Shelter In Transitional Housing Unsheltered
60
1
13
1
1 19
4
58
52
16
9
73
85
86
3
45
7
4 24
5
8 12
1
45
7
12
5
15
2
3,4
39
15
3
2 79
11
15
17
8
59
39
0
2,000
4,000
Figure 11: Counts of Literally Homeless Persons by Region (2012)
In Emergency Shelter In Transitional Housing Unsheltered
A Single Night Counts: Homelessness in Louisiana
Page 14
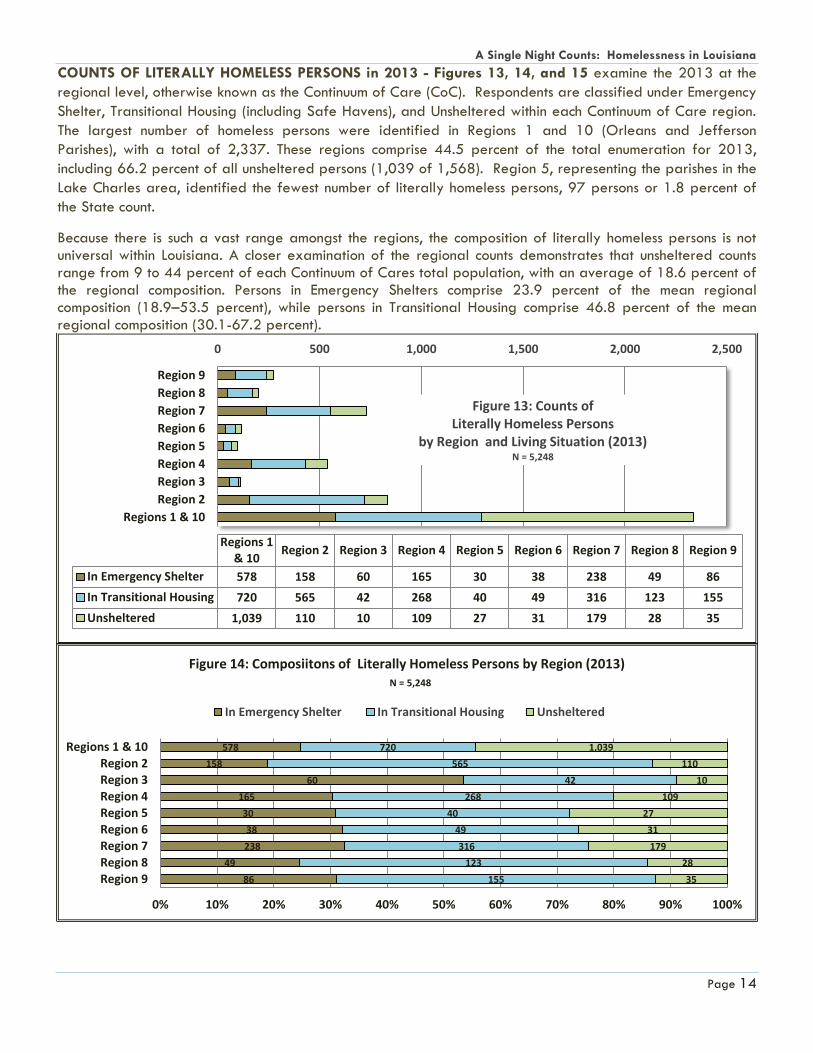
COUNTS OF LITERALLY HOMELESS PERSONS in 2013 - Figures 13, 14, and 15 examine the 2013 at the
regional level, otherwise known as the Continuum of Care (CoC). Respondents are classified under Emergency
Shelter, Transitional Housing (including Safe Havens), and Unsheltered within each Continuum of Care region.
The largest number of homeless persons were identified in Regions 1 and 10 (Orleans and Jefferson
Parishes), with a total of 2,337. These regions comprise 44.5 percent of the total enumeration for 2013,
including 66.2 percent of all unsheltered persons (1,039 of 1,568). Region 5, representing the parishes in the
Lake Charles area, identified the fewest number of literally homeless persons, 97 persons or 1.8 percent of
the State count.
Because there is such a vast range amongst the regions, the composition of literally homeless persons is not universal within Louisiana. A closer examination of the regional counts demonstrates that unsheltered counts range from 9 to 44 percent of each Continuum of Cares total population, with an average of 18.6 percent of the regional composition. Persons in Emergency Shelters comprise 23.9 percent of the mean regional composition (18.9–53.5 percent), while persons in Transitional Housing comprise 46.8 percent of the mean regional composition (30.1-67.2 percent).
0 500 1,000 1,500 2,000 2,500
Region 9
Region 8
Region 7
Region 6
Region 5
Region 4
Region 3
Region 2
Regions 1 & 10
Region 9Region 8Region 7Region 6Region 5Region 4Region 3Region 2Regions 1
& 10
In Emergency Shelter 8649238383016560158578
In Transitional Housing 155123316494026842565720
Unsheltered 35281793127109101101,039
Figure 13: Counts of Literally Homeless Persons
by Region and Living Situation (2013) N = 5,248
86
49
238
38
30
165
60
158
578
155
123
316
49
40
268
42
565
720
35
28
179
31
27
109
10
110
1,039
0% 10% 20% 30% 40% 50% 60% 70% 80% 90% 100%
Region 9Region 8Region 7Region 6Region 5Region 4Region 3Region 2
Regions 1 & 10
Figure 14: Composiitons of Literally Homeless Persons by Region (2013) N = 5,248
In Emergency Shelter In Transitional Housing Unsheltered

A Single Night Counts: Homelessness in Louisiana
Page 15
Figure 15 provides all Point-In-Time Counts, both sheltered and unsheltered, of literally homeless persons by Region within the State. The numbers of persons residing in Safe Havens are shown separately from the Transitional Housing counts in this figure. The CoC Number is an assigned designation made by the U.S. Department of Housing and Urban Development.
Figure 15: 2013 Counts of Homeless Persons by Regional Continuum of Care
Region Name CoC
Number Unsheltered
In Emergency
Shelter
In Transitional
Housing
In Safe Haven
Total Count
Region 1 & 10 - Orleans and Jefferson
LA-503
1,039 578 705 15 2,337
Persons in Households without Children 1,011 503 293 15 1,822
Persons in Households with only Children 1 3 22 26
Persons in Households with at least one Adult and one Child 27 72 390 489
Region 2 - Baton Rouge
LA-504
110 158 565 0 833
Persons in Households without Children 110 122 554 0 787
Persons in Households with only Children 0 11 1 12
Persons in Households with at least one Adult and one Child 0 25 9 34
Region 3 - Houma
LA-508
10 60 42 0 112
Persons in Households without Children 10 26 24 0 60
Persons in Households with only Children 0 0 0 0
Persons in Households with at least one Adult and one Child 0 34 18 52
Region 4 - Lafayette
LA-500
109 165 268 0 542
Persons in Households without Children 120 129 109 0 358
Persons in Households with only Children 0 0 0 0
Persons in Households with at least one Adult and one Child 0 45 139 184
Region 5 - Lake Charles
LA-501
27 30 40 0 97
Persons in Households without Children 18 37 27 0 82
Persons in Households with only Children 0 9 3 12
Persons in Households with at least one Adult and one Child
0 3 0 3
Region 6 - Alexandria
LA-507
31 38 49 0 118
Persons in Households without Children 29 38 25 0 92
Persons in Households with only Children 0 0 0 0
Persons in Households with at least one Adult and one Child 2 0 24 26
Region 7 - Shreveport
LA-502
179 238 308 8 733
Persons in Households without Children 149 170 83 8 410
Persons in Households with only Children 0 1 27 28
Persons in Households with at least one Adult and one Child 30 67 198 295
Region 8 - Monroe
LA-505
28 49 114 9 200
Persons in Households without Children 28 20 24 9 81
Persons in Households with only Children 0 7 0 7
Persons in Households with at least one Adult and one Child 0 22 90 112
Region 9 - Northshore
LA-506
35 86 155 0 276
Persons in Households without Children 29 60 62 0 151
Persons in Households with only Children 0 0 0 0
Persons in Households with at least one Adult and one Child 6 26 93 125
Total
1,568 1,402 2,245 33 5,248
Persons in Households without Children 1,504 1,105 1,201 33 3,843
Persons in Households with only Children 1 31 53 85
Persons in Households with at least one Adult and one Child
65 294 961 1,320
A Single Night Counts: Homelessness in Louisiana
Page 16
1,436 35.4%
2,612 64.4%
5 0.1%
Figure 17: Gender of Literally Homeless Persons
Female
Male
Transgender*
N = 4,053
*Transgender is defined as self-identification with, or presentation as, a gender that is different from the gender at birth.
2,490 63.0%
1,282 32.4%
131 3.3%
48 1.2%
Figure 18: Race of Literally Homeless Persons
Black or African-AmericanWhite
Two or more races
Other*
*American Indian or Alaskan Native (0.7%), Asian (0.3%), Native Hawaiian or other Pacific Islander (0.2%) N = 3,951
110 2.8%
3,782 97.2%
Figure 19: Ethnicity of Literally Homeless Persons
Hispanic/Latino
Non-Hispanic/Non-Latino
N = 3,892
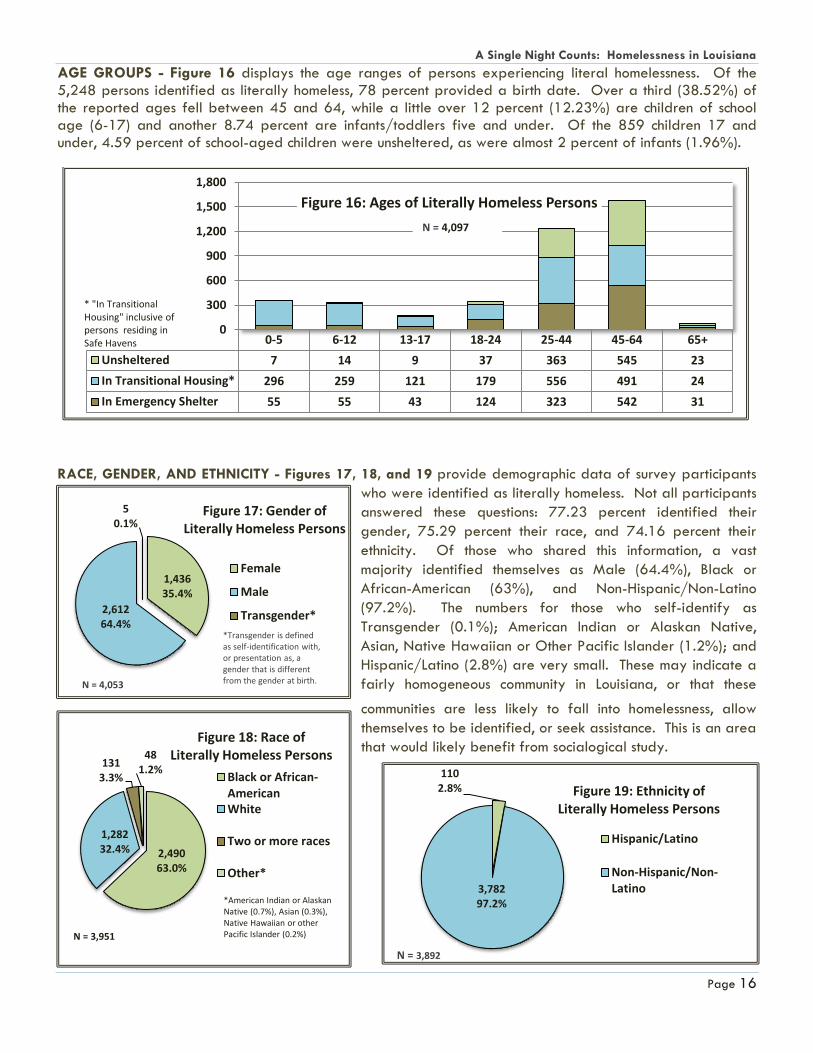
AGE GROUPS - Figure 16 displays the age ranges of persons experiencing literal homelessness. Of the 5,248 persons identified as literally homeless, 78 percent provided a birth date. Over a third (38.52%) of the reported ages fell between 45 and 64, while a little over 12 percent (12.23%) are children of school age (6-17) and another 8.74 percent are infants/toddlers five and under. Of the 859 children 17 and under, 4.59 percent of school-aged children were unsheltered, as were almost 2 percent of infants (1.96%).
RACE, GENDER, AND ETHNICITY - Figures 17, 18, and 19 provide demographic data of survey participants
who were identified as literally homeless. Not all participants
answered these questions: 77.23 percent identified their
gender, 75.29 percent their race, and 74.16 percent their
ethnicity. Of those who shared this information, a vast
majority identified themselves as Male (64.4%), Black or
African-American (63%), and Non-Hispanic/Non-Latino
(97.2%). The numbers for those who self-identify as
Transgender (0.1%); American Indian or Alaskan Native,
Asian, Native Hawaiian or Other Pacific Islander (1.2%); and
Hispanic/Latino (2.8%) are very small. These may indicate a
fairly homogeneous community in Louisiana, or that these
communities are less likely to fall into homelessness, allow
themselves to be identified, or seek assistance. This is an area
that would likely benefit from socialogical study.
0-5 6-12 13-17 18-24 25-44 45-64 65+
Unsheltered 7 14 9 37 363 545 23
In Transitional Housing* 296 259 121 179 556 491 24
In Emergency Shelter 55 55 43 124 323 542 31
0
300
600
900
1,200
1,500
1,800
Figure 16: Ages of Literally Homeless Persons
* "In Transitional Housing" inclusive of persons residing in Safe Havens
N = 4,097
A Single Night Counts: Homelessness in Louisiana
Page 17
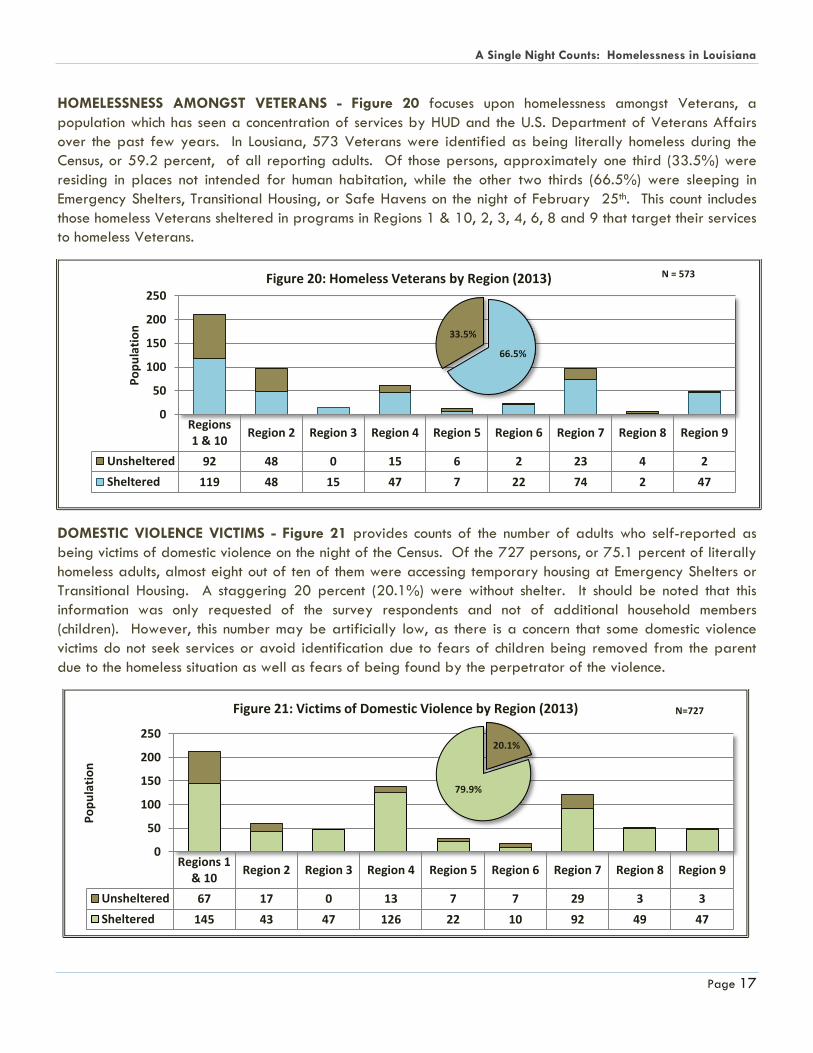
HOMELESSNESS AMONGST VETERANS - Figure 20 focuses upon homelessness amongst Veterans, a
population which has seen a concentration of services by HUD and the U.S. Department of Veterans Affairs
over the past few years. In Lousiana, 573 Veterans were identified as being literally homeless during the
Census, or 59.2 percent, of all reporting adults. Of those persons, approximately one third (33.5%) were
residing in places not intended for human habitation, while the other two thirds (66.5%) were sleeping in
Emergency Shelters, Transitional Housing, or Safe Havens on the night of February 25th. This count includes
those homeless Veterans sheltered in programs in Regions 1 & 10, 2, 3, 4, 6, 8 and 9 that target their services
to homeless Veterans.
DOMESTIC VIOLENCE VICTIMS - Figure 21 provides counts of the number of adults who self-reported as
being victims of domestic violence on the night of the Census. Of the 727 persons, or 75.1 percent of literally
homeless adults, almost eight out of ten of them were accessing temporary housing at Emergency Shelters or
Transitional Housing. A staggering 20 percent (20.1%) were without shelter. It should be noted that this
information was only requested of the survey respondents and not of additional household members
(children). However, this number may be artificially low, as there is a concern that some domestic violence
victims do not seek services or avoid identification due to fears of children being removed from the parent
due to the homeless situation as well as fears of being found by the perpetrator of the violence.
Regions1 & 10
Region 2 Region 3 Region 4 Region 5 Region 6 Region 7 Region 8 Region 9
Unsheltered 92 48 0 15 6 2 23 4 2
Sheltered 119 48 15 47 7 22 74 2 47
0
50
100
150
200
250
Po
pu
lati
on
Figure 20: Homeless Veterans by Region (2013) N = 573
Regions 1& 10
Region 2 Region 3 Region 4 Region 5 Region 6 Region 7 Region 8 Region 9
Unsheltered 67 17 0 13 7 7 29 3 3
Sheltered 145 43 47 126 22 10 92 49 47
0
50
100
150
200
250
Po
pu
lati
on
Figure 21: Victims of Domestic Violence by Region (2013) N=727
20.1%
79.9%
66.5%
33.5%

A Single Night Counts: Homelessness in Louisiana
Page 18
DISABILITIES AND HOMELESSNESS - Figures 22, 23, 24, 25, and 26 substantiate the prevalence of specific
disabling conditions amongst persons experiencing literal homelessness. Substance abuse, severe mental
illness, and HIV/AIDS are the three disabling conditions amongst homeless persons that are given a particular
priority at the national level. Overall, one third (33.3%) of all literally homeless respondents self-identified
as abusing alcohol and/or illegal drugs [Figure 23]. This sharply contrasts with 6.6 percent of persons in
Louisiana who reported a history of substance abuse during the last Federal Census. Over one in four (28%)
stated they had been diagnosed with a severe mental illness [Figure 24]; approximately 4.1 percent of the
State’s population reported a severe mental illness diagnoses. A much smaller, but important, number of
respondents reported having an HIV/AIDS diagnosis – approximately 3 percent [Figure 25]. Less than .5
percent of the total population in Louisiana reported having HIV/AIDS in the 2010 Federal Census.
In seven of the ten regions, chronic substance abuse was most frequently reported disability, followed by
severe mental illness [Figure 26]. The greatest concentration of reported substance abuse (44.3 percent) was
in Region V. The remaining three of the regions saw a larger number of literally homeless persons reporting
severe mental illness diagnoses, with Region V also showing the greatest concentration (37.1percent). There
are far fewer reported cases of HIV/AIDS diagnoses, but it is a critical national statistic for focusing housing
services that are need-specific.
888
234
17
231
43 37
229
22 47
766
155
20
185
36 17
199
30 63 102
7 2 22 0 0 6 0 7 0
200
400
600
800
1,000Figure 22: Counts of Literally Homeless Persons with
Disabling Conditions by Region
Chronic Substance Abuse Severe Mental Illness HIV/AIDS
33.3%
Total Count
Figure 23: Literally Homeless Persons Reporting Substance Abuse
N= 5,248
28.0%
Total Count
Figure 24: Literally Homeless Persons Reporting
Severe Mental Illness N= 5,248
2.8%
Total Count
Figure 25: Literally Homeless Persons Reporting
HIV/AIDS N= 5,248

A Single Night Counts: Homelessness in Louisiana
Page 19
Figure 26: Counts of Literally Homeless Persons with Disabling Conditions by Region
Region
Count of Literally
Homeless Persons
Chronic Substance
Abuse
% of Count
Severe Mental Illness
% of Count
HIV/AIDS % of
Count
Regions 1 & 10 - Orleans & Jefferson 2,337 888 38.00% 766 32.78% 102 4.36%
Region 2 - Baton Rouge 833 234 28.09% 155 18.61% 7 0.84%
Region 3 - Houma 112 17 15.18% 20 17.86% 2 1.79%
Region 4 - Lafayette 542 231 42.62% 185 34.13% 22 4.06%
Region 5 - Lake Charles 97 43 44.33% 36 37.11% 0 0.00%
Region 6 - Alexandria 118 37 31.36% 17 14.41% 0 0.00%
Region 7 - Shreveport 733 229 31.24% 199 27.15% 6 0.82%
Region 8 - Monroe 200 22 11.00% 30 15.00% 0 0.00%
Region 9 - Northshore 276 47 17.03% 63 22.83% 7 2.54%
Total 5,248 1,748 33.31% 1,471 28.03% 146 2.78%
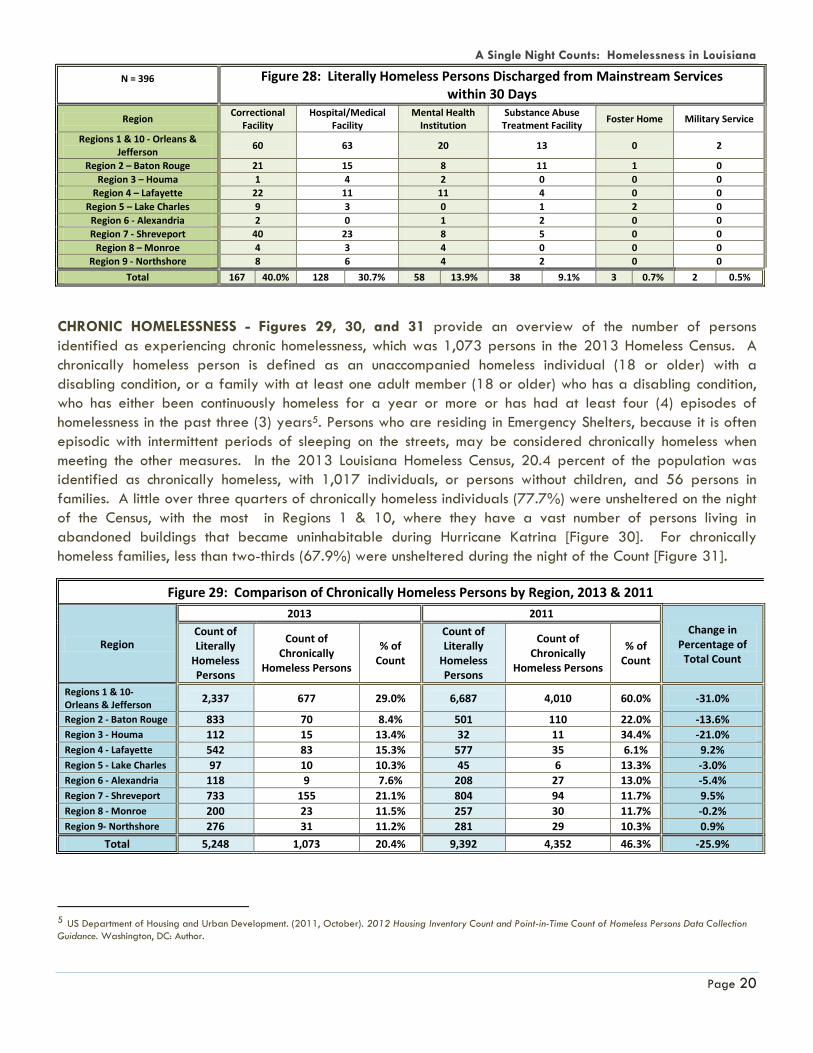
DISCHARGED INTO HOMELESSNESS - Figures 27 and 28 display responses to the question of whether the
participant was discharged from a series of institutions/facilities within 30 days prior to the night of the
Census. Of the 417 adults surveyed who affirmed that they had been released, 167 had been in correctional
facilities (40.05%), 128 were from hospital/medical facilities (30.7%), 58 were from institutions of mental
health treatment (13.91%), 38 were from treatment facilities for substance abuse treatment (9.11%), 3 were
from foster care (0.72%), and 2 from military service (0.48%). The majority, or 64 percent, of those who had
been released were unsheltered. Twenty-two percent were sleeping in Emergency Shelters, and 14 percent
were in Transitional Housing programs for homeless persons. Figure 28 describes the same data by region.
83
67
24
11
0 0
63
49
24
12
3 2
21
12 10 15
0 0 0
30
60
90
Correctional Facility Hospital/MedicalFacility
Mental HealthInstitution
Substance AbuseTreatment Facility
Foster Home Military service
Figure 27: Literally Homless Persons Discharged from Mainstream Services within 30 Days of Count
Unsheltered In Emergency Shelter In Transitional Housing
N = 396
A Single Night Counts: Homelessness in Louisiana
Page 20
N = 396
Figure 28: Literally Homeless Persons Discharged from Mainstream Services within 30 Days
Region Correctional
Facility Hospital/Medical
Facility Mental Health
Institution Substance Abuse
Treatment Facility Foster Home Military Service
Regions 1 & 10 - Orleans & Jefferson
60 63 20 13 0 2
Region 2 – Baton Rouge 21 15 8 11 1 0
Region 3 – Houma 1 4 2 0 0 0
Region 4 – Lafayette 22 11 11 4 0 0
Region 5 – Lake Charles 9 3 0 1 2 0
Region 6 - Alexandria 2 0 1 2 0 0
Region 7 - Shreveport 40 23 8 5 0 0
Region 8 – Monroe 4 3 4 0 0 0
Region 9 - Northshore 8 6 4 2 0 0
Total 167 40.0% 128 30.7% 58 13.9% 38 9.1% 3 0.7% 2 0.5%
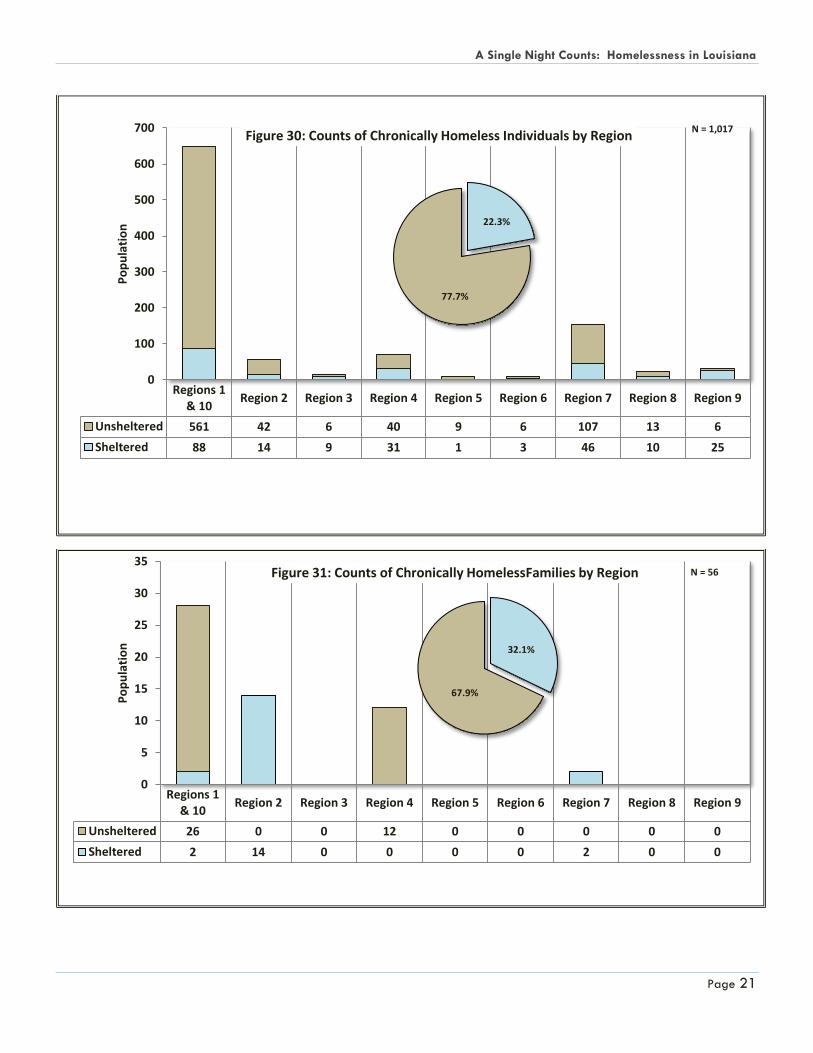
CHRONIC HOMELESSNESS - Figures 29, 30, and 31 provide an overview of the number of persons
identified as experiencing chronic homelessness, which was 1,073 persons in the 2013 Homeless Census. A
chronically homeless person is defined as an unaccompanied homeless individual (18 or older) with a
disabling condition, or a family with at least one adult member (18 or older) who has a disabling condition,
who has either been continuously homeless for a year or more or has had at least four (4) episodes of
homelessness in the past three (3) years5. Persons who are residing in Emergency Shelters, because it is often
episodic with intermittent periods of sleeping on the streets, may be considered chronically homeless when
meeting the other measures. In the 2013 Louisiana Homeless Census, 20.4 percent of the population was
identified as chronically homeless, with 1,017 individuals, or persons without children, and 56 persons in
families. A little over three quarters of chronically homeless individuals (77.7%) were unsheltered on the night
of the Census, with the most in Regions 1 & 10, where they have a vast number of persons living in
abandoned buildings that became uninhabitable during Hurricane Katrina [Figure 30]. For chronically
homeless families, less than two-thirds (67.9%) were unsheltered during the night of the Count [Figure 31].
Figure 29: Comparison of Chronically Homeless Persons by Region, 2013 & 2011
Region
2013 2011
Change in Percentage of
Total Count
Count of Literally
Homeless Persons
Count of Chronically
Homeless Persons
% of Count
Count of Literally
Homeless Persons
Count of Chronically
Homeless Persons
% of Count
Regions 1 & 10- Orleans & Jefferson
2,337 677 29.0% 6,687 4,010 60.0% -31.0%
Region 2 - Baton Rouge 833 70 8.4% 501 110 22.0% -13.6% Region 3 - Houma 112 15 13.4% 32 11 34.4% -21.0% Region 4 - Lafayette 542 83 15.3% 577 35 6.1% 9.2% Region 5 - Lake Charles 97 10 10.3% 45 6 13.3% -3.0% Region 6 - Alexandria 118 9 7.6% 208 27 13.0% -5.4% Region 7 - Shreveport 733 155 21.1% 804 94 11.7% 9.5% Region 8 - Monroe 200 23 11.5% 257 30 11.7% -0.2% Region 9- Northshore 276 31 11.2% 281 29 10.3% 0.9%
Total 5,248 1,073 20.4% 9,392 4,352 46.3% -25.9%
5 US Department of Housing and Urban Development. (2011, October). 2012 Housing Inventory Count and Point-in-Time Count of Homeless Persons Data Collection
Guidance. Washington, DC: Author.
A Single Night Counts: Homelessness in Louisiana
Page 21
Regions 1& 10
Region 2 Region 3 Region 4 Region 5 Region 6 Region 7 Region 8 Region 9
Unsheltered 561 42 6 40 9 6 107 13 6
Sheltered 88 14 9 31 1 3 46 10 25
0
100
200
300
400
500
600
700P
op
ula
tio
n
Figure 30: Counts of Chronically Homeless Individuals by Region N = 1,017
Regions 1& 10
Region 2 Region 3 Region 4 Region 5 Region 6 Region 7 Region 8 Region 9
Unsheltered 26 0 0 12 0 0 0 0 0
Sheltered 2 14 0 0 0 0 2 0 0
0
5
10
15
20
25
30
35
Po
pu
lati
on
Figure 31: Counts of Chronically HomelessFamilies by Region N = 56
22.3%
77.7%
32.1%
67.9%
A Single Night Counts: Homelessness in Louisiana
Page 22
VI Score=1 56.1%
VI Score=2 26.8%
VI Score=3 12.4%
VI Score=4 3.2%
VI Score=5 1.1%
VI Score=6 0.4%
Figure 33: Distribution of Vulnerability Index Scores
Possible scale of 0-8; No participants had a
Vulnerability Index Score of greater than 6.
N = 467
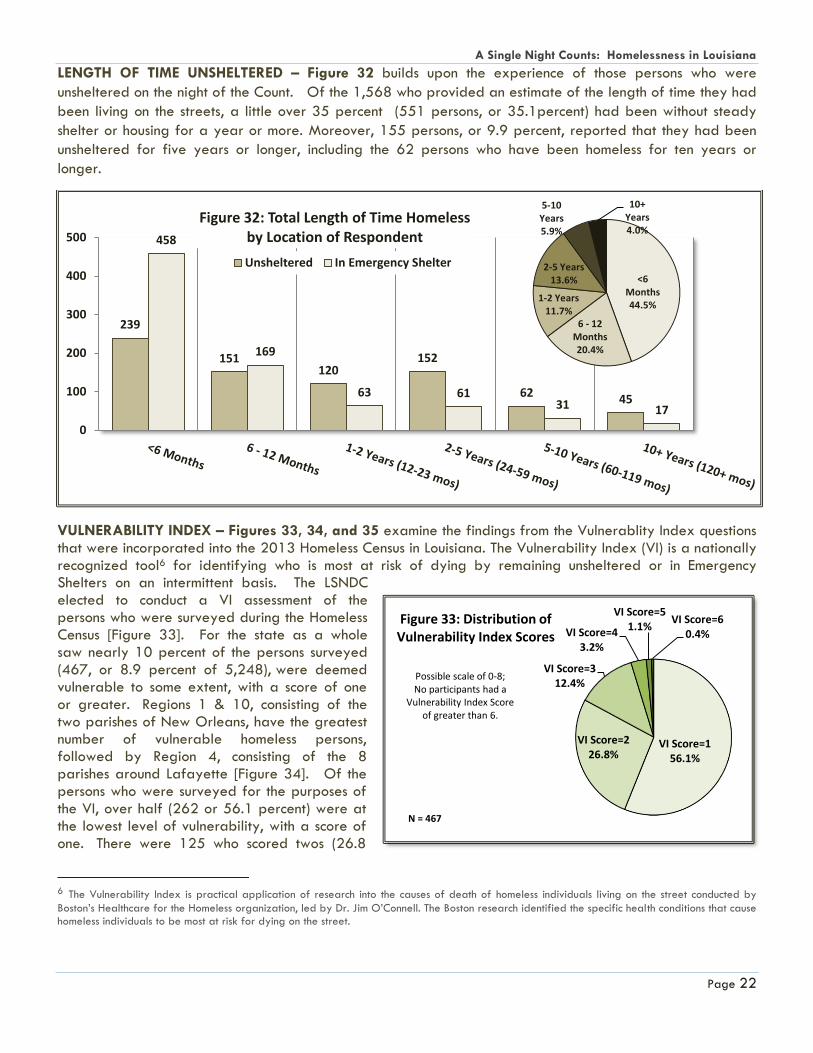
LENGTH OF TIME UNSHELTERED – Figure 32 builds upon the experience of those persons who were
unsheltered on the night of the Count. Of the 1,568 who provided an estimate of the length of time they had
been living on the streets, a little over 35 percent (551 persons, or 35.1percent) had been without steady
shelter or housing for a year or more. Moreover, 155 persons, or 9.9 percent, reported that they had been
unsheltered for five years or longer, including the 62 persons who have been homeless for ten years or
longer.
VULNERABILITY INDEX – Figures 33, 34, and 35 examine the findings from the Vulnerablity Index questions that were incorporated into the 2013 Homeless Census in Louisiana. The Vulnerability Index (VI) is a nationally recognized tool6 for identifying who is most at risk of dying by remaining unsheltered or in Emergency Shelters on an intermittent basis. The LSNDC elected to conduct a VI assessment of the persons who were surveyed during the Homeless Census [Figure 33]. For the state as a whole saw nearly 10 percent of the persons surveyed (467, or 8.9 percent of 5,248), were deemed vulnerable to some extent, with a score of one or greater. Regions 1 & 10, consisting of the two parishes of New Orleans, have the greatest number of vulnerable homeless persons, followed by Region 4, consisting of the 8 parishes around Lafayette [Figure 34]. Of the persons who were surveyed for the purposes of the VI, over half (262 or 56.1 percent) were at the lowest level of vulnerability, with a score of one. There were 125 who scored twos (26.8
6 The Vulnerability Index is practical application of research into the causes of death of homeless individuals living on the street conducted by
Boston’s Healthcare for the Homeless organization, led by Dr. Jim O’Connell. The Boston research identified the specific health conditions that cause homeless individuals to be most at risk for dying on the street.
239
151 120
152
62 45
458
169
63 61 31 17
0
100
200
300
400
500
Figure 32: Total Length of Time Homeless by Location of Respondent
Unsheltered In Emergency Shelter<6
Months 44.5%
6 - 12 Months 20.4%
1-2 Years 11.7%
2-5 Years 13.6%
5-10 Years 5.9%
10+ Years 4.0%

A Single Night Counts: Homelessness in Louisiana
Page 23
percent), 58 (12.4 percent) with scores of three, 15 (3.2 percent) with a score of four, 5 with a score of five (1.1 percent), and 2 with a score of six (0.4 percent). No one was found with a score of seven or eight. [Figure 33]. Figure 35 provides a comparison of persons surveyed and those deemed vulnerable, with a score of one or greater. Findings indicate that those persons with one or more qualifying vulnerabilities are approximately 20 percent of all persons surveyed who were residing in an emergency shelter or unsheltered.
N = 467 Figure 34: Vulnerability Scores by Continuum of Care
Region One Two Three Four Five Six Total
Region I & X - Orleans & Jefferson
120 57.4% 54 25.8% 25 12.0% 6 2.9% 3 1.4% 1 0.5% 209 44.8%
Region II - Baton Rouge 21 53.8% 10 25.6% 7 17.9% 1 2.6% 0 0.0% 0 0.0% 39 8.4%
Region III - Houma 4 57.1% 3 42.9% 0 0.0% 0 0.0% 0 0.0% 0 0.0% 7 1.5%
Region IV - Lafayette 37 56.9% 14 21.5% 12 18.5% 1 1.5% 1 1.5% 0 0.0% 65 13.9%
Region V - Lake Charles 8 61.5% 4 30.8% 1 7.7% 0 0.0% 0 0.0% 0 0.0% 13 2.8%
Region VI - Alexandria 1 33.3% 1 33.3% 1 33.3% 0 0.0% 0 0.0% 0 0.0% 3 0.6%
Region VII - Shreveport 49 50.5% 30 30.9% 11 11.3% 5 5.2% 1 1.0% 1 1.0% 97 20.8%
Region VIII - Monroe 7 58.3% 4 33.3% 0 0.0% 1 8.3% 0 0.0% 0 0.0% 12 2.6%
Region IX - Northshore 15 68.2% 5 22.7% 1 4.5% 1 4.5% 0 0.0% 0 0.0% 22 4.7%
Total 262 56.1% 125 26.8% 58 12.4% 15 3.2% 5 1.1% 2 0.4% 467 100.0%
209 39 7 124 13 3
97 12 22
995 213 26 518 51 40
297 38 100
0%
20%
40%
60%
80%
100%
Figure 35: Percentage of Literally Homeless Persons with Vulnerability Indicators
Persons with VI Score = 1+ Persons Assessed for Vulnerabilities
N = 1,283

A Single Night Counts: Homelessness in Louisiana
Page 24
405 28.0%
261 18.0%
329 22.8%
451 31.2%
Figure 36: Length of Time in Area
Less thanOne YearOne to FiveYearsMore thanFive YearsNative ofthe Area
N = 1,446
Persons without Health
Insurance 42.9%
Insured Persons 57.1%
Figure 38: Health Insurance Rates amongst
Literally Homeless Persons
N = 771
115 46 6 8
6 3 3
162 55 20 14
1 1
0%
50%
100%
Medicaid Medicare Private Insurance VA/Tricare BothMedicare/Medicaid
LaCHIP Other
Figure 39: Counts of Health Insurance amongst Literally Homeless Persons Unsheltered In Emergency Shelter
Time in Area – Figures 36 and 37 demonstrate that approximately one third of all literally homeless respondents have been in the communities in which they reside for the entirety of their lives, while one in five persons have lived in their respective communities for five years or longer. Collectively, they comprised 54.0 percent of the total number of persons. Slightly less than half of the respondents (46.0 percent) had been residing in the locations where surveyed for less than five years [Figure 36]. The prevalence of homelessness amongst persons who were native or new to the community varied. In Regions 1 & 10, 2, 5, and 7, more than 50 percent of all respondents had resided in their communities for longer than five years (51.9 – 60.7 percent). In Regions 3, 4, 6, 8, and 9, a greater percentage of persons experiencing literal homelessness had resided in their communities for five or fewer years 9 59.3 – 62.5). Figure 37 provides the counts of persons for each time designation.
Health Insurance – Figures 38 and 39 display the number of persons who reported whether he or she had
health insurance. In total, of the 771 respondents, more than half were insured (440 or 57.1 percent). The majority of those who did have health insurance (384 or 87.2 percent of insured persons) were enrolled in Medicaid, Medicare, or both public health care programs. Twenty-six persons (5.9 percent) were enrolled in a private insurance program, not including Tricare. Twenty-two persons (5.0 percent) were enrolled in Tricare or some other U.S. Department of Veterans Affairs health benefits program. Four respondents (0.9 percent) had LaCHIP for their dependent children, and 4 persons (0.9 percent) stated they
had other health insurance benefits that were not listed.
144 49 10 73 16 7 76 7 23
88 25
6 42 8
7 52 18 15 140
36 6 35
21 5
58
10 18 219 44 5 42 16 7 105
5 8
0%
25%
50%
75%
100%
Figure 37: Length of Time in Area By Region Less than One Year One to Five Years More than Five Years Native of the Area
N = 1,446
A Single Night Counts: Homelessness in Louisiana
Page 25
Emergency Shelter (ES): programs that provide a temporary place to stay for persons experiencing a housing crisis or are without permanent housing. Sheltering may take place within a facility intended for persons experiencing homelessness, or it may be provided through motel/hotel vouchers that are paid by a service organization. Stays are usually less than six months.
Rapid Re-Housing (RRH): A HUD-funded program that was designed to assist persons experiencing homelessness to be quickly re-housed and stabilized. This housing type is new to the 2013 Inventory.
Permanent Supportive Housing (PSH): programs that provide affordable, community-based housing for individuals and families who have experienced long-term or chronic homelessness and have been diagnosed with a long term disabling condition. Structures include apartments, houses, group homes or single-room occupancy housing; most offer some type of case management and housing support.
Safe Haven (SH): programs that serve chronically homeless individuals living with co-occurring mental illness and substance abuse disorders and do not require a commitment to services as a precondition for housing.
Transitional Housing (TH): programs that provide extended shelter and supportive services for homeless individuals and/or families with the goal of helping them live independently and transition into permanent housing; stays are generally longer than two weeks but typically 60 days or more and, in many cases, up to two years or more; may be configured for specialized thin the homeless population such as people with substance abuse problems, homeless mentally ill, homeless domestic violence victims, Veterans or homeless people with AIDS/HIV.
State and Regional Homeless Census: Housing Inventory In addition to enumerating the number of
persons experiencing literal homelessness, Continua of Care across the state of Louisiana also
assessed the availability of housing on the night of February 25th. Of note, the Housing Inventory also
includes Permanent Supportive Housing (PSH) program beds and Rapid Re-Housing program (RRH)
beds. Persons residing in housing provided through one of these programs are no longer literally
homeless; thusly, they were not included in any of the Homeless Census reporting. Nevertheless, the
prevalence of PSH and RRH programs are major components to ending homelessness, and an annual
accounting of this type of housing is critical to meeting the federal goal. The following series of charts
shows the number of both occupied and unoccupied beds, grouped by both housing and household
type. The housing types are Emergency Shelters, Permanent Supportive Housing, Rapid Re-Housing,
Safe Havens, and Transitional Housing. The Point-in-Time Count for each program is also listed, as
well as the utilization rate of the beds. In total, there were 9,409 beds available, of which 3,596
were for households with children, 5,789 were for households without children, and 24 were for
households with only children. The mean utilization rate for all housing categories was 84.1 percent,
wherein 7,915 of the beds were occupied on the night of the Homeless Census. In total, 114 fewer
beds were identified in 2013 than in 2012, when the utilization rate was 74.2 percent. Utilization
rates vary amongst the housing types. Emergency Shelters had the smallest percentage of occupied
beds, with 66.6 percent of them filled. The remaining housing categories had utilization rates of 87.9
percent to 91.5 percent.
It should be noted that some variance may be attributed to inconsistencies with the reporting of Point-in-time counts or the number of beds that were in place on the night of the Census. The beds may have been apportioned based on average utilization rates during the year or the beds may have been apportioned based on how they are used on the night of the Count8. Appendix C contains a listing of agencies and programs that provide the housing services along with their individual number
of beds, units, and statistics.
8 US Department of Housing and Urban Development. (2011, October). 2012 Housing Inventory Count and Point-in-Time Count of Homeless Persons Data Collection Guidance. Washington, DC: Author.

A Single Night Counts: Homelessness in Louisiana
Page 26
Figure 40: Housing Inventory for State of Louisiana - 2013
Housing/Program Type
Households with Children
Households without Children
Households with Only Children
Total Beds
# of Occupied
Beds
Utilization Rate
Overflow Beds
# of Units # of Beds # of Beds # of Beds
ES Beds and Units: Total 208 754 1,287 11 2,052 1,366 66.6% 163
Region 1 & 10 50 150 542 0 692 576 83.2% 0
Region 2 29 103 114 0 217 160 73.7% 100
Region 3 14 54 8 0 62 57 91.9% 20
Region 4 29 79 153 0 232 165 71.1% 2
Region 5 16 139 0 0 139 32 23.0% 4
Region 6 1 5 71 0 76 38 50.0% 0
Region 7 47 140 277 0 417 188 45.1% 35
Region 8 9 46 50 11 107 64 59.8% 0
Region 9 13 38 72 0 110 86 78.2% 2
PSH Beds & Units: Total 839 1,656 3,076 0 4,732 4,239 89.6% N/A
Region 1 & 10 566 935 1,735 0 2,670 2,376 89.0% N/A
Region 2 42 99 309 0 408 340 83.3% N/A
Region 3 45 170 101 0 271 270 99.6% N/A
Region 4 44 112 114 0 226 200 88.5% N/A
Region 5 34 61 48 0 109 84 77.1% N/A
Region 6 29 64 135 0 199 177 88.9% N/A
Region 7 9 28 404 0 432 406 94.0% N/A
Region 8 26 44 53 0 97 88 90.7% N/A
Region 9 44 143 177 0 320 298 93.1% N/A
RRH Beds & Units: Total 10 27 44 0 71 65 91.5% N/A
Region 8 10 27 44 0 71 65 91.5% N/A
SH Beds & Units: Total N/A N/A 32 N/A 32 28 87.5% N/A
Region 1 & 10 N/A N/A 10 N/A 10 10 100.0% N/A
Region 7 N/A N/A 10 N/A 10 9 90.0% N/A
Region 8 N/A N/A 12 N/A 12 9 75.0% N/A
TH Beds & Units: Total 382 1,159 1,350 13 2,522 2,217 87.9% N/A
Region 1 & 10 167 468 253 0 721 707 98.1% N/A
Region 2 13 30 592 0 622 563 90.5% N/A
Region 3 5 19 48 0 67 58 86.6% N/A
Region 4 53 160 151 0 311 268 86.2% N/A
Region 5 4 8 63 0 71 37 52.1% N/A
Region 6 3 32 42 0 74 49 66.2% N/A
Region 7 61 214 109 13 336 281 83.6% N/A
Region 8 40 108 12 0 120 99 82.5% N/A
Region 9 36 120 80 0 200 155 77.5% N/A
Total of All Beds & Units 1,439 3,596 5,789 24 9,409 7,915 84.1% 163

A Single Night Counts: Homelessness in Louisiana
Page 27
RELATIONAL DEMOGRAPHIC DATA BY REGION – Figures 41, 42, 43 and 44 provide relevant demographic data for each region in order to provide context for the Census results. These figures are taken from the 2010 Federal and State Census data for each CoC. This data includes: gender, race, ethnicity, age, educational attainment, household and family counts, housing data, financials, income, poverty rate, cash benefits, non-cash benefits, employment, transportation, and health. For a complete set of census data at the state, CoC, Regional and Parish levels, please see Appendix D.
Figure 41 – REGIONS 1 & 10 THROUGH 5: Gender, Race, Ethnicity, Age, Educational Attainment, Household Counts, and Housing Data
FIGURE 41 Region 1 & 10 Region 2 Region 3 Region 4 Region 5
Demographics
Population 776,381 663,255 352,405 638,768 292,619
Gender
Male 376,256 325,363 173,586 311,967 145,560
Female 400,125 337,892 178,819 326,801 147,059
Race
White alone 385,543 356,968 237,327 432,079 215,914
Black or African American alone 320,758 273,432 90,833 177,847 64,009
American Indian or Alaska Native alone 3,085 1,630 9,544 2,977 2,069
Asian alone 26,653 13,708 9,081 8,167 2,541
Native Hawaiian or other Pacific Islander 313 237 149 155 119
Some other race alone 24888 9,056 5,887 7,961 2,323
Two or more races 15,141 8,224 5965 9,582 5,617
Ethnicity
Hispanic or Latino 71,753 23,457 13,645 19425 6,982
Not Hispanic or Latino 704,628 639798 338,760 619,343 285,637
Age
Under 18 170,612 160,234 90,810 165,967 74,255
18-44 298,351 26,1769 126,678 231,107 103,486
45-64 210,791 169,351 94363 165,519 77,136
65 and over 96,627 71,901 40,554 76,175 37,742
Educational Attainment
High School Graduate or Higher * 146,545 127,526 88,437 149,053 70,374
Households
Total Number of Families * 171,393 158,596 91,195 161,715 75,470
Total Number of Households * 279,519 241,324 122,340 235,145 107,231
Housing
Total Housing Units 379,031 274,409 138,681 269,299 123,730
Occupied Housing Units 311,805 249,682 126,552 242,894 110,017
Vacant Housing Unit 67,226 24,727 12,129 26,405 13,713
Renter Occupied 135,758 86,429 29,638 73,720 30,764
Vacant Rentals 24,822 9,081 2,939 7,586 7,094

A Single Night Counts: Homelessness in Louisiana
Page 28
Figure 42 - REGIONS 6 THROUGH 9 AND STATE TOTAL: Gender, Race, Ethnicity, Age, Educational Attainment, Household Counts, and Housing Data
FIGURE 42 Region 6 Region 7 Region 8 Region 9 Total
Demographics
Population 309,761 544,249 355,761 541,234 4,474,433
Gender
Male 155,528 263,357 172,929 265,026 2,189,572
Female 154,233 280,892 182,832 276,208 2,284,861
Race
White alone 211,180 311,408 213,234 429,687 2,793,340
Black or African American alone 83,688 207,789 132,572 90,412 1,441,340
American Indian or Alaska Native alone 2,855 4,691 857 2,240 29,948
Asian alone 2,797 5,049 2,636 4,460 75,092
Native Hawaiian or other Pacific Islander 315 322 128 172 1,910
Some other race alone 2,989 5,854 2,681 6,317 67,956
Two or more races 5,937 9,136 3,653 7960 712,15
Ethnicity
Hispanic or Latino 9,600 16,520 6,785 20,017 188,184
Not Hispanic or Latino 300,161 527,729 348,976 521,217 4,286,249
Age
Under 18 78,509 133,604 88,006 140,512 1,102,509
18-44 111,887 192,793 130,291 188,875 1,645,237
45-64 78,726 142,140 89,329 147,329 1,174,684
65 and over 40,639 75,710 48,126 64,518 551,992
Educational Attainment
High School Graduate or Higher * 74,467 127,132 81,200 453,517 1,318,251
Households
Total Number of Families * 78,010 134,944 86,769 137,586 1095678
Total Number of Households * 111,404 206,240 128,535 191,420 1623,158
Housing
Total Housing Units 132,099 245,329 154169 221,844 1938,591
Occupied Housing Units 114878 215,016 135,109 201,109 1,707,062
Vacant Housing Unit 17,221 30,313 19,060 20,735 231,529
Renter Occupied 37,131 73,268 46,992 46,211 559911
Vacant Rentals 3,345 7,234 430 5,429 67,960

A Single Night Counts: Homelessness in Louisiana
Page 29
Figure 43 - REGIONS 1 & 10 THROUGH 5:
Financials, Income, Poverty Rate, Cash Benefits, Non-Cash Benefits, Employment,
Transportation, and Health
FIGURE 43 Region 1 & 10 Region 2 Region 3 Region 4 Region 5
Financials
Foreclosure 563 221 80 152 79
Median Income
Median Household Income * $42,822 $45,619 $50,253 $39,612 $45,670
Median Family Income * $52,589 $56,329 $58,907 $49,005 $64,468
Median Worker Income * $26,993 $26,919 $29,238 $25,372 $26,230
Poverty Rate
Families Below the Poverty Level * 109,016 79,104 43,908 99,886 46,266
Individuals Below Poverty Level * 145,317 114,205 55,356 125,658 35,969
Cash Benefits
SSI * 74,498 58,714 36,427 67,639 32,752
Non-Cash Benefits
Food Stamp Assist. in Past 12 Months * 47,768 34,640 22,810 42,715 23,333
Employment
Population Over 16 * 585,327 513,022 270,947 485,339 223,158
In Labor Force * 376,498 332,287 167,304 298,626 134,452
Civilian Labor Force * 374,833 331,775 166,743 298,142 133,829
Employed * 341,488 308,290 156,537 279,422 123,923
Unemployed * 33,345 23,485 10,206 18,720 9,897
Armed Forces * 1,665 512 561 484 632
Not in Labor Force * 208,829 180,735 103,643 186,713 88,706
Transportation to Work
Workers 16 Years and Over * 333,470 300,598 152,817 271,654 121,004
Car, Truck, or Van -- Drove Alone * 252,120 247,315 126,039 226,413 99,551
Car, Truck, or Van -- Carpooled * 41,812 32,894 16,266 28,724 14,533
Public Transportation (excluding taxicab) *
12,012 3,697 1,101 1,389 424
Walked * 9,813 5,758 2,194 4,539 2,022
Other Means * 8,009 3,396 4,379 4,336 2,231
Worked at Home * 9,704 7,538 2,838 6,253 2,333
Health
HIV/AIDS 6,394 4,683 632 1,484 1,015
Mental Illness 31,105 27,495 14,975 27,231 12,391
Substance Abuse 29,222 47,353 28,748 41,019 20,693
* = data obtained using the American Community Survey 5-year estimates
= Louisiana Department Health and Hospitals
^ = Realty Trac

A Single Night Counts: Homelessness in Louisiana
Page 30
Figure 44 - REGIONS 6 THROUGH 9 AND STATE TOTAL: Financials, Income, Poverty Rate, Cash Benefits, Non-Cash Benefits, Employment, Transportation, and Health
FIGURE 44 Region 6 Region 7 Region 8 Region 9 Total
Financials
Foreclosure 10 165 71 349 1690
Median Income
Median Household Income * $36,348 $36,313 $37,757 $42,457 $41,872
Median Family Income * $44,259 $46,515 $46,378 $51,145 $52,177
Median Worker Income * $22,983 $23,700 $21,608 $26,844 $25,543
Poverty Rate
Families Below the Poverty Level * 55,061 83,519 65,494 78,893 661,147
Individuals Below Poverty Level * 51,161 108,672 83,933 21,389 741,660
Cash Benefits
SSI * 35,382 61,746 38,039 54,087 459,284
Non-Cash Benefits
Food Stamp Assistance in the Past 12 Months *
19,448 31,734 19,865 29,871 272,184
Employment
Population Over 16 * 237,074 420,720 275,885 405,097 3,416,569
In Labor Force * 135,196 256,881 157,784 250,537 2,109,565
Civilian Labor Force * 128,920 252,632 157,400 249,055 2,093,329
Employed * 118,376 229,638 143,099 230,578 1,931,351
Unemployed * 10,544 22,994 14,301 18,477 161,969
Armed Forces * 6,276 4,249 384 1,482 16,245
Not in Labor Force * 101,878 163,839 118,101 154,560 1,307,004
Transportation to Work
Workers 16 Years and Over * 120,614 227,781 139,814 225,349 1,893,101
Car, Truck, or Van -- Drove Alone * 97,252 189,340 117,255 185,643 1,540,928
Car, Truck, or Van -- Carpooled * 15,114 21,259 14,130 25,063 209,795
Public Transportation (excluding taxicab) * 657 2,991 1,041 660 23,972
Walked * 3,465 4,080 2,774 2,226 36,871
Other Means * 2,268 5,339 1,724 4,636 36,318
Worked at Home * 1,858 4,772 2,890 7,121 45,307
Health
HIV/AIDS 784 1,479 964 1,066 18,501
Mental Illness 13,078 22,701 14,382 23,065 186,423
Substance Abuse 21,853 38,668 25,248 38,110 290,914
* = data obtained using the American Community Survey 5-year estimates
= Louisiana Department Health and Hospitals
^ = Realty Trac
A Single Night Counts: Homelessness in Louisiana
Page 31
Appendix A:
2013 Homeless Demographics
& Needs Survey Questionnaire

A Single Night Counts: Homelessness in Louisiana
Page 32
Appendix B:
Glossary of Terms

A Single Night Counts: Homelessness in Louisiana
Page 33
Age: Generally derived from date of birth information, and is based on the age of the person in complete years.
Armed Forces: Members of the U.S. Armed Forces (people on active duty with the United States Army, Air Force, Navy, Marine Corps, or Coast Guard).
Below poverty level: Following the Office of Management and Budget’s (OMB’s) Directive 14, the Census Bureau uses a set of money income thresholds that vary by family size and composition to detect who is poor. If the total income for a family or unrelated individual falls below the relevant poverty threshold, then the family or unrelated individual is classified as being "below the poverty level."
Chronically Homeless Family: A household with at least one adult member (persons 18 or older) who has a disabling condition (see definition below) and who has either been continuously homeless for a year or more OR has had at least four (4) episodes of homelessness in the past three (3) years. To be considered chronically homeless, persons must have been sleeping in a place not meant for human habitation (e.g., living on the streets) and/or in an Emergency Shelter/Safe Haven during that time. For purposes of the PIT, persons living in Transitional Housing at the time of the PIT count should not be included in this subpopulation category; the subpopulation count should include all members of the household.
Chronically Homeless Individual: An unaccompanied homeless adult individual (persons years or older) with a disabling condition (see definition below) who has either been continuously homeless for a year or more OR has had at least four (4) episodes of in the past three (3) years. To be considered chronically homeless, persons must have sleeping in a place not meant for human habitation (e.g., living on the streets) and/ Emergency Shelter/Safe Haven during that time. Persons under the age of 18 are not as chronically
homeless. For purposes of the PIT, persons living in Transitional Housing at the time of the PIT count should not be included in this subpopulation category.
Chronic Substance Abuse: This category on the PIT includes persons with a substance abuse problem (alcohol abuse, drug abuse, or both) that is expected to be of long-continued and indefinite duration and substantially impairs the person’s ability to live independently.
Civilian Labor Force: All of those in the labor force with the exclusion of people on active duty in the United States Armed Forces.
Continuum of Care (CoC): A regional or local planning body that coordinates housing and services funding for homeless families and individuals.
Contributory HMIS Program: A program that contributes Protected Personal Information (PPI) or other client-level data to an HMIS.
Disabling Condition: A physical, mental, or emotional impairment which is (a) expected to be of long continued and indefinite duration, (b) substantially impedes an individual’s ability to live independently, and (c) of such a nature that such ability could be improved by more suitable housing conditions; (3) a developmental disability as defined in Section 102 of the Developmental Disabilities Assistance and Bill of Rights Act; (4) the disease of acquired immunodeficiency syndrome or any conditions arising from the etiological agency for acquired immunodeficiency syndrome; or (5) a diagnosable substance abuse disorder (As defined in Section 223 of the Social Security Administration Act). Domestic Violence Survivor: Someone who has fled the willful intimidation, assault, battery, sexual assault or other abusive behavior perpetrated by a family member, household member, or intimate partner.
Educational Attainment: Refers to the highest level of education completed in terms of the highest degree or the highest level of schooling completed. Individuals who possess at least a high school diploma.
Emergency Shelter: Programs that provide a temporary place to stay for newcomers, travelers, people who are in crisis, or homeless individuals in the community. Stays are usually less than six months.
Employed: Includes all civilians 16 years old and over who were either (1) "at work" -- those who did any work at all during the reference week as paid employees, worked in their own business or profession, worked on their own farm, or worked 15 hours or more as unpaid workers on a family farm or in a family business; or (2) were "with a job but not at work" -- those who did not work during the reference week but had jobs or businesses from which they were temporarily absent due to illness, bad weather, industrial dispute, vacation, or other personal reasons.
Foreclosure: Number of homes who filed foreclosure documents.
Head of household (HOH): An individual within a family group who provides support and maintenance to one or more individuals who are related to him or her through adoption, blood, marriage, or who was residing with other persons on the night of the Homeless Census. This was self-designated for survey purposes.
Homeless Census: The annual Homeless Census is comprised of three components: the Point-in-Time Count of persons experiencing literal homelessness, the Vulnerability Index survey that is used for identify most medically fragile persons residing in places unintended for human habitation or in emergency shelters for homeless persons, and the Housing Inventory, which allows for communities to assess the housing stock they have in place targeted to serve persons experiencing homelessness.
A Single Night Counts: Homelessness in Louisiana
Page 34
Homeless Person: For the purposes of the Homeless Census, a homeless person is someone who is living on the street, in an Emergency Shelter, in Transitional Housing for homeless persons, or in a Safe Haven.
In Labor Force: The labor force includes all people classified in the civilian labor force, plus members of the U.S. Armed Forces (people on active duty with the United States Army, Air Force, Navy, Marine Corps, or Coast Guard). The Civilian Labor Force consists of people classified as employed or unemployed.
Median Income: The median income divides the income distribution into two equal groups, those with incomes above the median, and those with incomes below the median.
Not in Labor Force: Consists mainly of students, housewives, retired workers, seasonal workers interviewed in an off season who were not looking for work, institutionalized people, and people doing incidental unpaid family work.
Permanent Supportive Housing: Programs that provide affordable, community-based housing for individuals and families who have experienced long-term or chronic homelessness and have been diagnosed as having a physical or developmental disability, a severe mental illness, substance abuse problems or HIV/AIDS; structures include apartments, single-family houses, duplexes, group homes or single-room occupancy housing; most offer some type of case management and housing support.
Persons with HIV/AIDS: This subpopulation category of the PIT includes persons who have been diagnosed with AIDS and/or have tested positive for HIV.
Population: All people, male and female, child and adult, living in a geographic area.
Protected Personal Information (PPI): Information about a client: (1) whose identity is apparent from the information or can reasonably be ascertained from the information; or (2) whose identity can, taking into account any methods reasonably likely to be used, be learned by linking the information with other available information or by otherwise manipulating the information.
Race: A self-identification data item in which respondents choose the race or races with which they most closely identify.
Rapid Re-Housing (RRH): A HUD-funded program that was designed to assist persons experiencing homelessness to be quickly re-housed and stabilized. This housing type is new to the 2013 Inventory.
Severely Mentally Ill (SMI): This subpopulation category of the PIT includes persons with mental health problems that are expected to be of long-continued and indefinite duration and substantially impairs the person’s ability to live independently.
Safe Haven (SH): Programs that serve chronically homeless individuals living with co-occurring mental illness and substance abuse disorders and do not require a commitment to services as a precondition for housing.
Social Security Income (SSI): Individuals receiving Social Security Income.
Transitional Housing: programs that provide extended shelter and supportive services for homeless individuals and/or families with the goal of helping them live independently and transition into permanent housing; stays are generally longer than two weeks but typically 60 days or more and, in many cases, up to two years or more; may be configured for specialized groups within the homeless population such as people with substance abuse problems, homeless mentally ill, homeless domestic violence victims, Veterans or homeless people with AIDS/HIV.
Unaccompanied Child (under 18): This subpopulation category of the PIT includes persons under the age of 18 with a household size of one.
Unemployed: All civilians 16 years old and over are classified as unemployed if they (1) were neither "at work" nor "with a job but not at work" during the reference week, and (2) were actively looking for work during the last 4 weeks, and (3) were available to accept a job. Also included as unemployed are civilians who did not work at all during the reference week, were waiting to be called back to a job from which they had been laid off, and were available for work except for temporary illness.
Unsheltered: a phrase used to describe any location that a person may be residing that is not intended for human habitation; includes automobiles, wooded areas, sidewalks, abandoned buildings, barns, under bridges, etc.
Veteran: This subpopulation category of the PIT includes persons who have served on active duty in the Armed Forces of the United States. This does not include inactive military reserves or the National Guard unless the person was called up to active duty.
Victims of Domestic Violence: This subpopulation category of the PIT includes persons who have been victims of domestic violence
at any point in the past.
Worker: This term appears in connection with several subjects: journey-to-work items, class of worker, work status in the past 12 months, weeks worked in the past 12 months, and number of workers in family in the past 12 months. Its meaning varies and, therefore, should be determined in each case by referring to the definition of the subject in which it appears.
A Single Night Counts: Homelessness in Louisiana
Page 35
Appendix C:
Housing Inventory by
Continuum of Care (CoC) Region

A Single Night Counts: Homelessness in Louisiana
Page 36
CoC REGIONS 1 & 10
Housing Inventory for Orleans and Jefferson Parishes, Page 1 of 4
Housing/Program Type Geo
Codes
Households with Children
Households without Children # of Beds
Households with Only Children # of Beds
Total Beds
# Beds Occupied
Utilization Rate
Overflow Beds
# of Units
# of Beds
Emergency Shelter Beds and Units: Total 50 150 542 0 692 576 83.2% 0
Catholic Charities Archdiocese of New Orleans - Jefferson CARE Center 229051 14 34 2 0 36 24 66.7% 0
Covenant House - Crisis Unit/Pre-Rights of Passage 221296 10 22 26 0 48 56 116.7% 0
Metropolitan Battered Women's Program - Emergency Shelter Program 229051 3 14 1 0 15 7 46.7% 0
Ministry of Grace United Methodist Church - Hagar's House Emergency
Shelter 221296 3 12 4 0 16 8 50.0% 0
New Orleans Mission - Freeze Plan 221296 0 0 0 0 0 0 0.0% 0
New Orleans Mission - Men's Emergency Shelter Program 221296 0 0 199 0 199 168 84.4% 0
New Orleans Mission - Women's Emergency Shelter Program 221296 0 0 22 0 22 21 95.5% 0
New Orleans Women's Shelter - Women's Shelter 221296 4 16 4 0 20 16 80.0% 0
Ozanam Inn/St. Vincent de Paul Society - Freeze Plan 221296 1 4 28 0 32 35 109.4% 0
Ozanam Inn/St. Vincent de Paul Society - Ozanam Inn Shelter 221296 0 0 96 0 96 96 100.0% 0
Salvation Army - Families with Children Shelter 221296 6 21 0 0 21 8 38.1% 0
Salvation Army - Freeze Plan Beds 221296 0 0 0 0 0 0 0.0% 0
Salvation Army - Men's Created 2 Work 221296 0 0 32 0 32 29 90.6% 0
Salvation Army - Men's Emergency Shelter Program 221296 0 0 65 0 65 37 56.9% 0
Salvation Army - Seniors Program 221296 0 0 8 0 8 9 112.5% 0
Salvation Army - Special Needs Program 221296 0 0 8 0 8 8 100.0% 0
Salvation Army - Women and Children Shelter Program 221296 5 18 0 0 18 12 66.7% 0
Salvation Army - Women's Created 2 Work 221296 0 0 11 0 11 10 90.9% 0
Salvation Army - Women's Emergency Shelter Program 221296 0 0 32 0 32 28 87.5% 0
Waymaker Ministries - Waymaker Facility 229051 4 9 4 0 13 4 30.8% 0
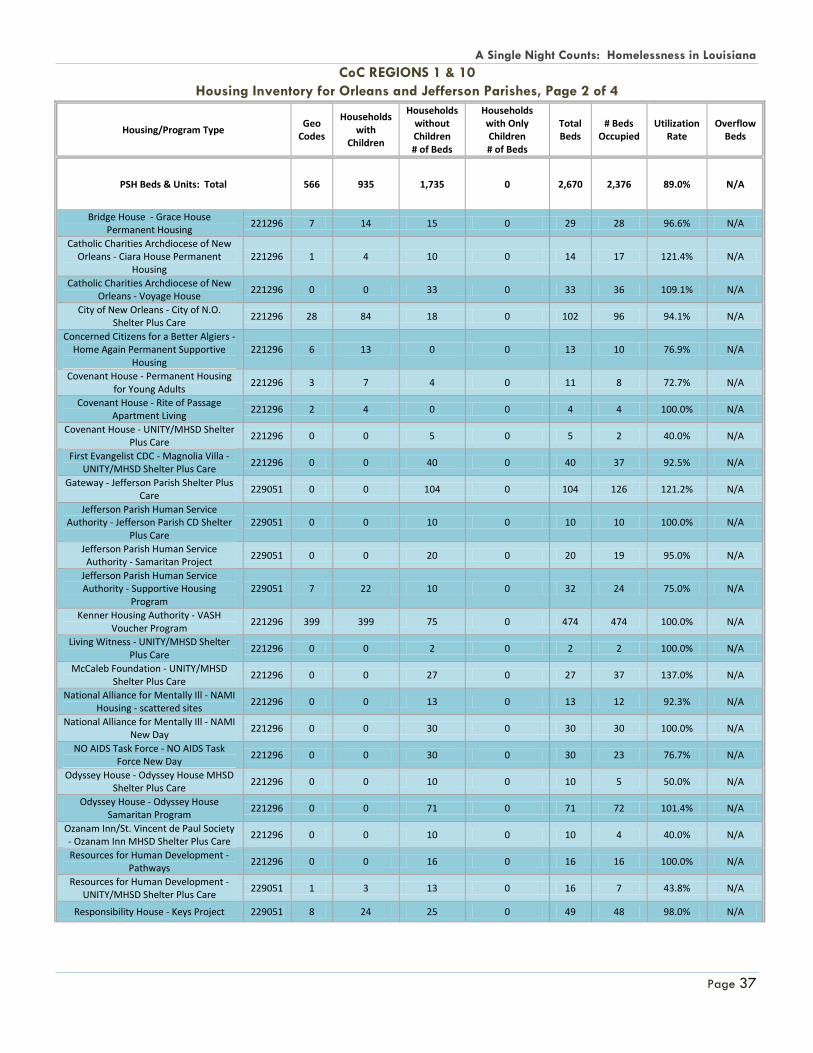
A Single Night Counts: Homelessness in Louisiana
Page 37
CoC REGIONS 1 & 10
Housing Inventory for Orleans and Jefferson Parishes, Page 2 of 4
Housing/Program Type Geo
Codes
Households with
Children
Households without Children # of Beds
Households with Only Children # of Beds
Total Beds
# Beds Occupied
Utilization Rate
Overflow Beds
PSH Beds & Units: Total 566 935 1,735 0 2,670 2,376 89.0% N/A
Bridge House - Grace House Permanent Housing
221296 7 14 15 0 29 28 96.6% N/A
Catholic Charities Archdiocese of New Orleans - Ciara House Permanent
Housing 221296 1 4 10 0 14 17 121.4% N/A
Catholic Charities Archdiocese of New Orleans - Voyage House
221296 0 0 33 0 33 36 109.1% N/A
City of New Orleans - City of N.O. Shelter Plus Care
221296 28 84 18 0 102 96 94.1% N/A
Concerned Citizens for a Better Algiers - Home Again Permanent Supportive
Housing 221296 6 13 0 0 13 10 76.9% N/A
Covenant House - Permanent Housing for Young Adults
221296 3 7 4 0 11 8 72.7% N/A
Covenant House - Rite of Passage Apartment Living
221296 2 4 0 0 4 4 100.0% N/A
Covenant House - UNITY/MHSD Shelter Plus Care
221296 0 0 5 0 5 2 40.0% N/A
First Evangelist CDC - Magnolia Villa - UNITY/MHSD Shelter Plus Care
221296 0 0 40 0 40 37 92.5% N/A
Gateway - Jefferson Parish Shelter Plus Care
229051 0 0 104 0 104 126 121.2% N/A
Jefferson Parish Human Service Authority - Jefferson Parish CD Shelter
Plus Care 229051 0 0 10 0 10 10 100.0% N/A
Jefferson Parish Human Service Authority - Samaritan Project
229051 0 0 20 0 20 19 95.0% N/A
Jefferson Parish Human Service Authority - Supportive Housing
Program 229051 7 22 10 0 32 24 75.0% N/A
Kenner Housing Authority - VASH Voucher Program
221296 399 399 75 0 474 474 100.0% N/A
Living Witness - UNITY/MHSD Shelter Plus Care
221296 0 0 2 0 2 2 100.0% N/A
McCaleb Foundation - UNITY/MHSD Shelter Plus Care
221296 0 0 27 0 27 37 137.0% N/A
National Alliance for Mentally Ill - NAMI Housing - scattered sites
221296 0 0 13 0 13 12 92.3% N/A
National Alliance for Mentally Ill - NAMI New Day
221296 0 0 30 0 30 30 100.0% N/A
NO AIDS Task Force - NO AIDS Task Force New Day
221296 0 0 30 0 30 23 76.7% N/A
Odyssey House - Odyssey House MHSD Shelter Plus Care
221296 0 0 10 0 10 5 50.0% N/A
Odyssey House - Odyssey House Samaritan Program
221296 0 0 71 0 71 72 101.4% N/A
Ozanam Inn/St. Vincent de Paul Society - Ozanam Inn MHSD Shelter Plus Care
221296 0 0 10 0 10 4 40.0% N/A
Resources for Human Development - Pathways
221296 0 0 16 0 16 16 100.0% N/A
Resources for Human Development - UNITY/MHSD Shelter Plus Care
229051 1 3 13 0 16 7 43.8% N/A
Responsibility House - Keys Project 229051 8 24 25 0 49 48 98.0% N/A

A Single Night Counts: Homelessness in Louisiana
Page 38
CoC REGIONS 1 & 10 Housing Inventory for Orleans and Jefferson Parishes, Page 3 of 4
Responsibility House - Permanent Supportive Housing #2 (3007)
229051 4 14 7 0 21 17 81.0% N/A
Responsibility House - Supportive Housing #1 (3003)
229051 0 0 5 0 5 6 120.0% N/A
Responsibility House - UNITY Supportive Housing
229051 0 0 49 0 49 48 98.0% N/A
Shelter Resources - Belle Grace 221296 0 0 7 0 7 4 57.1% N/A
Shelter Resources - Belle Reve - Belle Espirit
221296 3 8 3 0 11 4 36.4% N/A
Traveler's Aid Society of Greater New Orleans - UNITY Housing First
Permanent Supportive Housing 221296 0 0 40 0 40 37 92.5% N/A
UNITY of GNO - John's Place UNITY/MHSD Shelter Plus Care
221296 0 0 10 0 10 10 100.0% N/A
UNITY of GNO - Lasalle St. Apartments - UNITY/MHSD Shelter Plus Care
221296 8 28 0 0 28 23 82.1% N/A
UNITY of GNO - Rebuilding Communities Shelter Plus Care
221296 10 32 717 0 749 708 94.5% N/A
UNITY of GNO - Rebuilding Communities Shelter Plus Care
221296 8 26 100 0 126 126 100.0% N/A
Volunteers of America - Duvernay Place SRO
221296 0 0 70 0 70 63 90.0% N/A
Volunteers of America - Tulane Ave. SRO
221296 0 0 81 0 81 58 71.6% N/A
Volunteers of America - UNITY/MHSD Shelter Plus Care
221296 8 30 12 0 42 25 59.5% N/A
Volunteers of America - VOA PH for Disabled Homeless Persons(710)
221296 28 112 18 0 130 47 36.2% N/A
Volunteers of America - VOA PH for Homeless Persons with Disabilities
(793) 221296 35 111 25 0 136 53 39.0% N/A
SH Beds & Units: Total N/A N/A 10 N/A 10 10 100.0% N/A
Resources for Human Development - New Orleans Womanspace Safe Haven
221296 N/A N/A 5 N/A 5 5 100.0% N/A
Resources for Human Development - New Orleans Womanspace Safe Haven
for Veterans HCHV 221296 N/A N/A 5 N/A 5 5 100.0% N/A
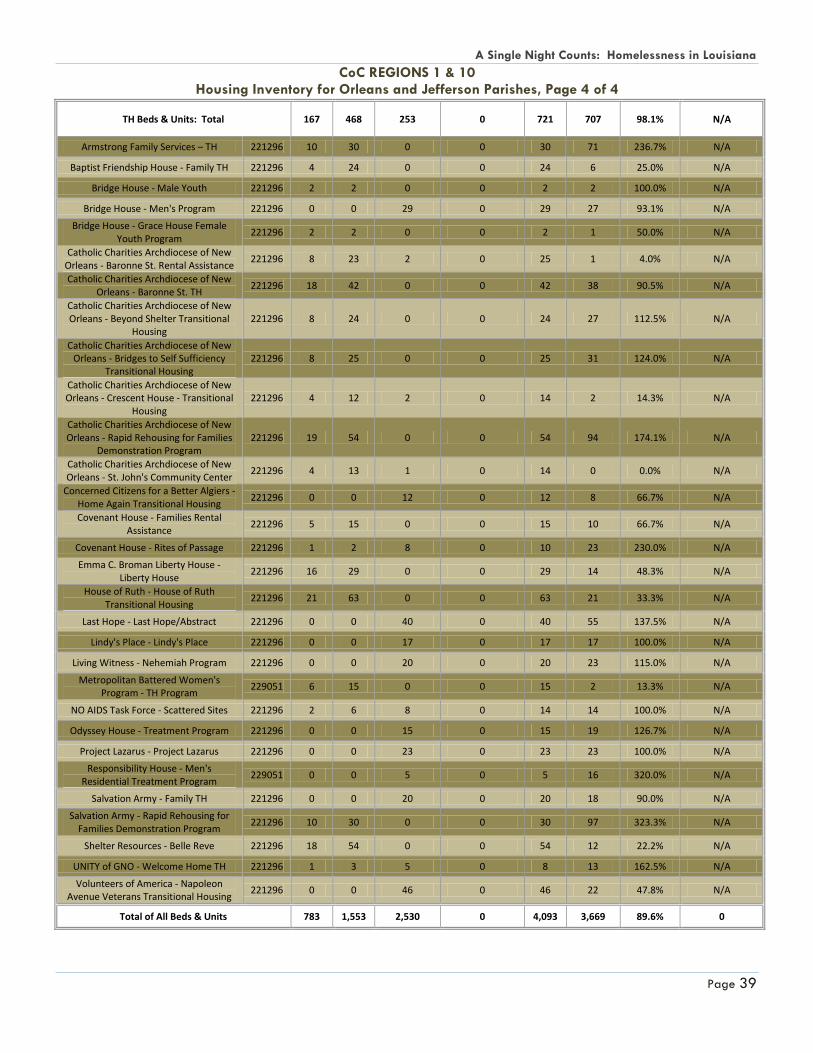
A Single Night Counts: Homelessness in Louisiana
Page 39
CoC REGIONS 1 & 10 Housing Inventory for Orleans and Jefferson Parishes, Page 4 of 4
TH Beds & Units: Total 167 468 253 0 721 707 98.1% N/A
Armstrong Family Services – TH 221296 10 30 0 0 30 71 236.7% N/A
Baptist Friendship House - Family TH 221296 4 24 0 0 24 6 25.0% N/A
Bridge House - Male Youth 221296 2 2 0 0 2 2 100.0% N/A
Bridge House - Men's Program 221296 0 0 29 0 29 27 93.1% N/A
Bridge House - Grace House Female Youth Program
221296 2 2 0 0 2 1 50.0% N/A
Catholic Charities Archdiocese of New Orleans - Baronne St. Rental Assistance
221296 8 23 2 0 25 1 4.0% N/A
Catholic Charities Archdiocese of New Orleans - Baronne St. TH
221296 18 42 0 0 42 38 90.5% N/A
Catholic Charities Archdiocese of New Orleans - Beyond Shelter Transitional
Housing 221296 8 24 0 0 24 27 112.5% N/A
Catholic Charities Archdiocese of New Orleans - Bridges to Self Sufficiency
Transitional Housing 221296 8 25 0 0 25 31 124.0% N/A
Catholic Charities Archdiocese of New Orleans - Crescent House - Transitional
Housing 221296 4 12 2 0 14 2 14.3% N/A
Catholic Charities Archdiocese of New Orleans - Rapid Rehousing for Families
Demonstration Program 221296 19 54 0 0 54 94 174.1% N/A
Catholic Charities Archdiocese of New Orleans - St. John's Community Center
221296 4 13 1 0 14 0 0.0% N/A
Concerned Citizens for a Better Algiers - Home Again Transitional Housing
221296 0 0 12 0 12 8 66.7% N/A
Covenant House - Families Rental Assistance
221296 5 15 0 0 15 10 66.7% N/A
Covenant House - Rites of Passage 221296 1 2 8 0 10 23 230.0% N/A
Emma C. Broman Liberty House - Liberty House
221296 16 29 0 0 29 14 48.3% N/A
House of Ruth - House of Ruth Transitional Housing
221296 21 63 0 0 63 21 33.3% N/A
Last Hope - Last Hope/Abstract 221296 0 0 40 0 40 55 137.5% N/A
Lindy's Place - Lindy's Place 221296 0 0 17 0 17 17 100.0% N/A
Living Witness - Nehemiah Program 221296 0 0 20 0 20 23 115.0% N/A
Metropolitan Battered Women's Program - TH Program
229051 6 15 0 0 15 2 13.3% N/A
NO AIDS Task Force - Scattered Sites 221296 2 6 8 0 14 14 100.0% N/A
Odyssey House - Treatment Program 221296 0 0 15 0 15 19 126.7% N/A
Project Lazarus - Project Lazarus 221296 0 0 23 0 23 23 100.0% N/A
Responsibility House - Men's Residential Treatment Program
229051 0 0 5 0 5 16 320.0% N/A
Salvation Army - Family TH 221296 0 0 20 0 20 18 90.0% N/A
Salvation Army - Rapid Rehousing for Families Demonstration Program
221296 10 30 0 0 30 97 323.3% N/A
Shelter Resources - Belle Reve 221296 18 54 0 0 54 12 22.2% N/A
UNITY of GNO - Welcome Home TH 221296 1 3 5 0 8 13 162.5% N/A
Volunteers of America - Napoleon Avenue Veterans Transitional Housing
221296 0 0 46 0 46 22 47.8% N/A
Total of All Beds & Units 783 1,553 2,530 0 4,093 3,669 89.6% 0
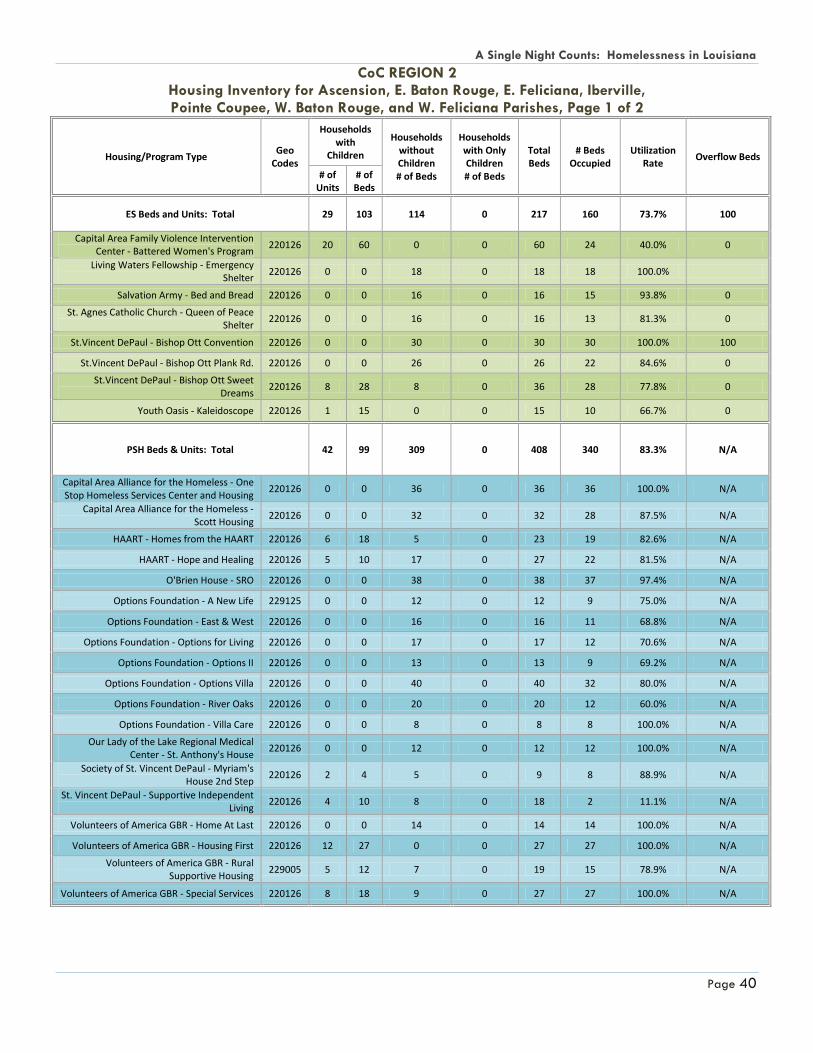
A Single Night Counts: Homelessness in Louisiana
Page 40
CoC REGION 2 Housing Inventory for Ascension, E. Baton Rouge, E. Feliciana, Iberville, Pointe Coupee, W. Baton Rouge, and W. Feliciana Parishes, Page 1 of 2
Housing/Program Type Geo
Codes
Households with
Children
Households without Children # of Beds
Households with Only Children # of Beds
Total Beds
# Beds Occupied
Utilization Rate
Overflow Beds
# of Units
# of Beds
ES Beds and Units: Total 29 103 114 0 217 160 73.7% 100
Capital Area Family Violence Intervention Center - Battered Women's Program
220126 20 60 0 0 60 24 40.0% 0
Living Waters Fellowship - Emergency Shelter
220126 0 0 18 0 18 18 100.0%
Salvation Army - Bed and Bread 220126 0 0 16 0 16 15 93.8% 0
St. Agnes Catholic Church - Queen of Peace Shelter
220126 0 0 16 0 16 13 81.3% 0
St.Vincent DePaul - Bishop Ott Convention 220126 0 0 30 0 30 30 100.0% 100
St.Vincent DePaul - Bishop Ott Plank Rd. 220126 0 0 26 0 26 22 84.6% 0
St.Vincent DePaul - Bishop Ott Sweet Dreams
220126 8 28 8 0 36 28 77.8% 0
Youth Oasis - Kaleidoscope 220126 1 15 0 0 15 10 66.7% 0
PSH Beds & Units: Total 42 99 309 0 408 340 83.3% N/A
Capital Area Alliance for the Homeless - One Stop Homeless Services Center and Housing
220126 0 0 36 0 36 36 100.0% N/A
Capital Area Alliance for the Homeless - Scott Housing
220126 0 0 32 0 32 28 87.5% N/A
HAART - Homes from the HAART 220126 6 18 5 0 23 19 82.6% N/A
HAART - Hope and Healing 220126 5 10 17 0 27 22 81.5% N/A
O'Brien House - SRO 220126 0 0 38 0 38 37 97.4% N/A
Options Foundation - A New Life 229125 0 0 12 0 12 9 75.0% N/A
Options Foundation - East & West 220126 0 0 16 0 16 11 68.8% N/A
Options Foundation - Options for Living 220126 0 0 17 0 17 12 70.6% N/A
Options Foundation - Options II 220126 0 0 13 0 13 9 69.2% N/A
Options Foundation - Options Villa 220126 0 0 40 0 40 32 80.0% N/A
Options Foundation - River Oaks 220126 0 0 20 0 20 12 60.0% N/A
Options Foundation - Villa Care 220126 0 0 8 0 8 8 100.0% N/A
Our Lady of the Lake Regional Medical Center - St. Anthony's House
220126 0 0 12 0 12 12 100.0% N/A
Society of St. Vincent DePaul - Myriam's House 2nd Step
220126 2 4 5 0 9 8 88.9% N/A
St. Vincent DePaul - Supportive Independent Living
220126 4 10 8 0 18 2 11.1% N/A
Volunteers of America GBR - Home At Last 220126 0 0 14 0 14 14 100.0% N/A
Volunteers of America GBR - Housing First 220126 12 27 0 0 27 27 100.0% N/A
Volunteers of America GBR - Rural Supportive Housing
229005 5 12 7 0 19 15 78.9% N/A
Volunteers of America GBR - Special Services 220126 8 18 9 0 27 27 100.0% N/A
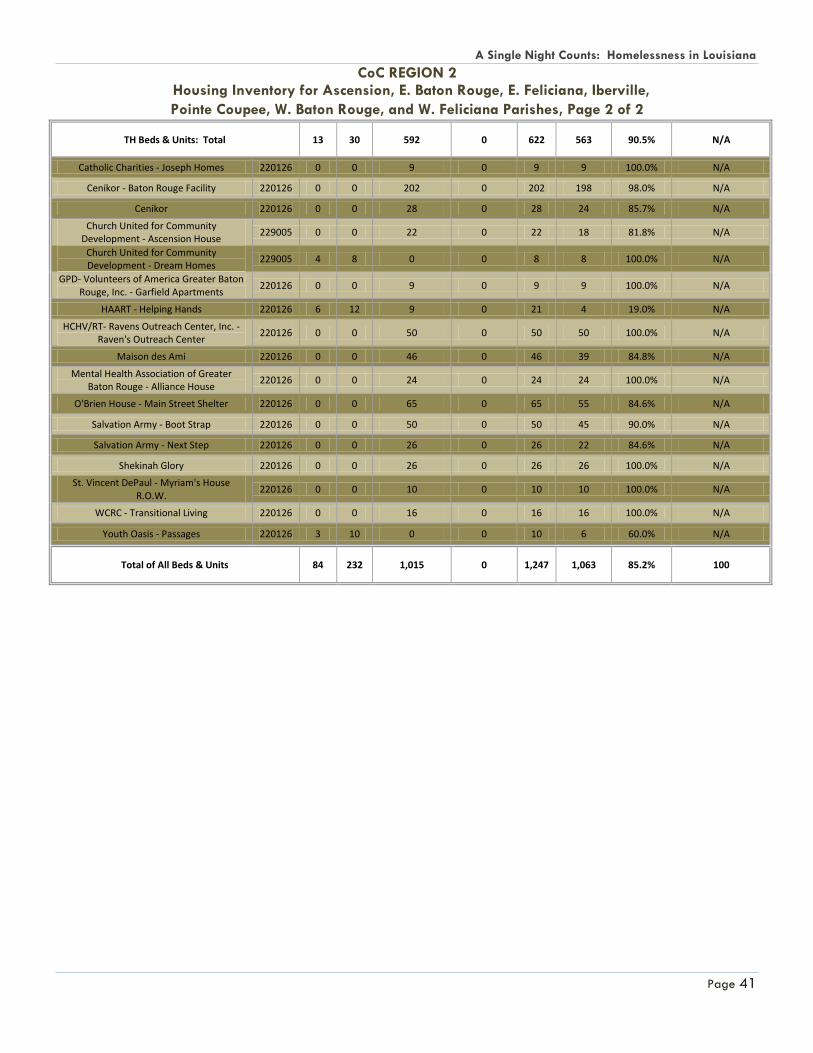
A Single Night Counts: Homelessness in Louisiana
Page 41
CoC REGION 2 Housing Inventory for Ascension, E. Baton Rouge, E. Feliciana, Iberville,
Pointe Coupee, W. Baton Rouge, and W. Feliciana Parishes, Page 2 of 2
TH Beds & Units: Total 13 30 592 0 622 563 90.5% N/A
Catholic Charities - Joseph Homes 220126 0 0 9 0 9 9 100.0% N/A
Cenikor - Baton Rouge Facility 220126 0 0 202 0 202 198 98.0% N/A
Cenikor 220126 0 0 28 0 28 24 85.7% N/A
Church United for Community Development - Ascension House
229005 0 0 22 0 22 18 81.8% N/A
Church United for Community Development - Dream Homes
229005 4 8 0 0 8 8 100.0% N/A
GPD- Volunteers of America Greater Baton Rouge, Inc. - Garfield Apartments
220126 0 0 9 0 9 9 100.0% N/A
HAART - Helping Hands 220126 6 12 9 0 21 4 19.0% N/A
HCHV/RT- Ravens Outreach Center, Inc. - Raven's Outreach Center
220126 0 0 50 0 50 50 100.0% N/A
Maison des Ami 220126 0 0 46 0 46 39 84.8% N/A
Mental Health Association of Greater Baton Rouge - Alliance House
220126 0 0 24 0 24 24 100.0% N/A
O'Brien House - Main Street Shelter 220126 0 0 65 0 65 55 84.6% N/A
Salvation Army - Boot Strap 220126 0 0 50 0 50 45 90.0% N/A
Salvation Army - Next Step 220126 0 0 26 0 26 22 84.6% N/A
Shekinah Glory 220126 0 0 26 0 26 26 100.0% N/A
St. Vincent DePaul - Myriam's House R.O.W.
220126 0 0 10 0 10 10 100.0% N/A
WCRC - Transitional Living 220126 0 0 16 0 16 16 100.0% N/A
Youth Oasis - Passages 220126 3 10 0 0 10 6 60.0% N/A
Total of All Beds & Units 84 232 1,015 0 1,247 1,063 85.2% 100

A Single Night Counts: Homelessness in Louisiana
Page 42
CoC REGION 3 Housing Inventory for Assumption, Lafourche, St. Charles, St. James, St. John and Terrebonne Parishes Page 1 of 1
Housing/Program Type Geo
Codes
Households with
Children
Households without Children # of Beds
Households with Only Children # of Beds
Total Beds
# Beds Occupied
Utilization Rate
Overflow Beds
# of Units
# of Beds
ES Beds and Units: Total 14 54 8 0 62 57 91.9% 20
BunkHouse Inn - Emergency Shelter 220828 0 0 4 0 4 5 125.0% 20
Gulf Coast Social Services - Moving Upward Street Outreach
220828 1 4 2 0 6 4 66.7% 0
Terrebonne Parish Consolidated Government - Beautiful Beginnings
220828 8 26 0 0 26 22 84.6% 0
The Haven 220828 5 24 2 0 26 26 100.0% 0
PSH Beds & Units: Total 45 170 101 0 271 270 99.6% N/A
Options for Independence - Visions I 220828 0 0 10 0 10 10 100.0% N/A
START Corporation - Fresh Start 220828 18 67 6 0 73 73 100.0% N/A
START Corporation - Safe Start 220828 9 36 3 0 39 39 100.0% N/A
START Corporation - Shelter+Care 220828 8 21 35 0 56 56 100.0% N/A
START Corporation - Starting Over 220828 0 0 26 0 26 25 96.2% N/A
START Corporation - Starting Point 220828 9 43 6 0 49 49 100.0% N/A
START Corporation- Visions II 220828 1 3 15 0 18 18 100.0% N/A
TH Beds & Units: Total 5 19 48 0 67 58 86.6% N/A
BunkHouse Inn - Bunkhouse TH/SRO 220828 0 0 20 0 20 18 90.0% N/A
Exchange House 220828 0 0 5 0 5 2 40.0% N/A
Gulf Coast Social Services - Moving Upward 220828 5 19 3 0 22 22 100.0% N/A
START Corporation - New Start for Veterans 220828 0 0 12 0 12 11 91.7% N/A
START Corporation - Transitional Living Center
220828 0 0 8 0 8 5 62.5% N/A
Total of All Beds & Units 64 243 157 0 400 385 96.3% 20
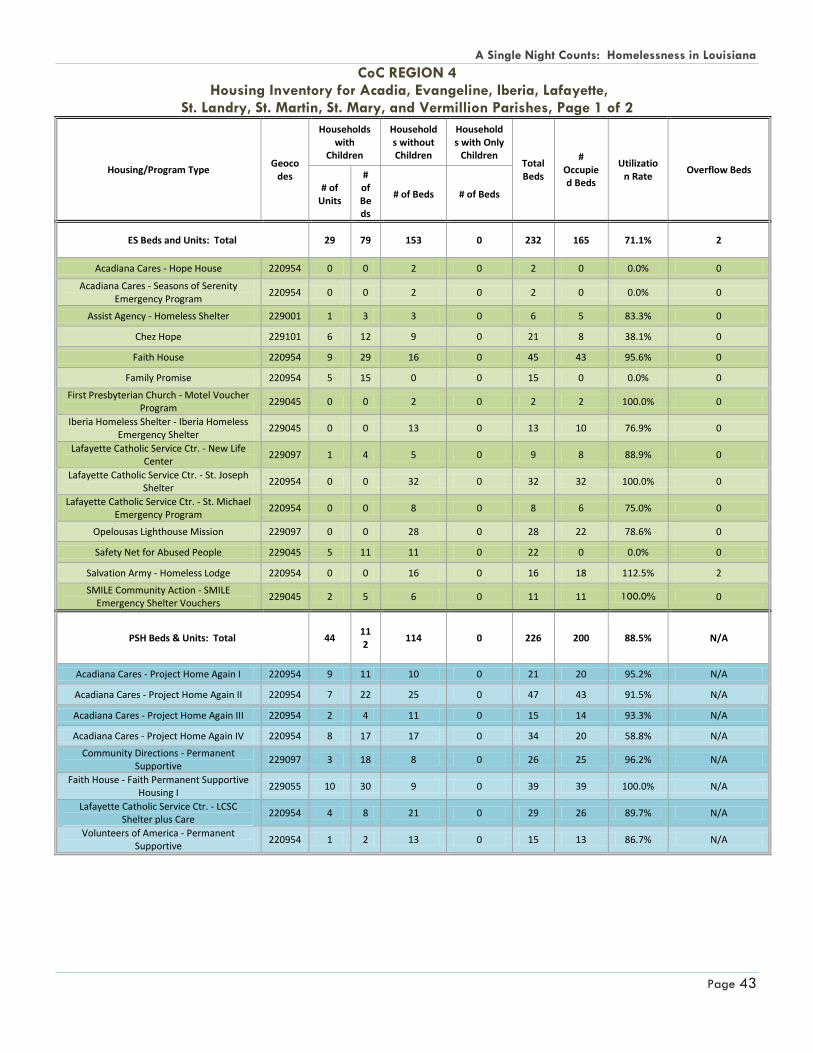
A Single Night Counts: Homelessness in Louisiana
Page 43
CoC REGION 4 Housing Inventory for Acadia, Evangeline, Iberia, Lafayette,
St. Landry, St. Martin, St. Mary, and Vermillion Parishes, Page 1 of 2
Housing/Program Type Geoco
des
Households with
Children
Households without Children
Households with Only
Children Total Beds
# Occupied Beds
Utilization Rate
Overflow Beds
# of Units
# of Beds
# of Beds # of Beds
ES Beds and Units: Total 29 79 153 0 232 165 71.1% 2
Acadiana Cares - Hope House 220954 0 0 2 0 2 0 0.0% 0
Acadiana Cares - Seasons of Serenity Emergency Program
220954 0 0 2 0 2 0 0.0% 0
Assist Agency - Homeless Shelter 229001 1 3 3 0 6 5 83.3% 0
Chez Hope 229101 6 12 9 0 21 8 38.1% 0
Faith House 220954 9 29 16 0 45 43 95.6% 0
Family Promise 220954 5 15 0 0 15 0 0.0% 0
First Presbyterian Church - Motel Voucher Program
229045 0 0 2 0 2 2 100.0% 0
Iberia Homeless Shelter - Iberia Homeless Emergency Shelter
229045 0 0 13 0 13 10 76.9% 0
Lafayette Catholic Service Ctr. - New Life Center
229097 1 4 5 0 9 8 88.9% 0
Lafayette Catholic Service Ctr. - St. Joseph Shelter
220954 0 0 32 0 32 32 100.0% 0
Lafayette Catholic Service Ctr. - St. Michael Emergency Program
220954 0 0 8 0 8 6 75.0% 0
Opelousas Lighthouse Mission 229097 0 0 28 0 28 22 78.6% 0
Safety Net for Abused People 229045 5 11 11 0 22 0 0.0% 0
Salvation Army - Homeless Lodge 220954 0 0 16 0 16 18 112.5% 2
SMILE Community Action - SMILE Emergency Shelter Vouchers
229045 2 5 6 0 11 11 100.0% 0
PSH Beds & Units: Total 44 112
114 0 226 200 88.5% N/A
Acadiana Cares - Project Home Again I 220954 9 11 10 0 21 20 95.2% N/A
Acadiana Cares - Project Home Again II 220954 7 22 25 0 47 43 91.5% N/A
Acadiana Cares - Project Home Again III 220954 2 4 11 0 15 14 93.3% N/A
Acadiana Cares - Project Home Again IV 220954 8 17 17 0 34 20 58.8% N/A
Community Directions - Permanent Supportive
229097 3 18 8 0 26 25 96.2% N/A
Faith House - Faith Permanent Supportive Housing I
229055 10 30 9 0 39 39 100.0% N/A
Lafayette Catholic Service Ctr. - LCSC Shelter plus Care
220954 4 8 21 0 29 26 89.7% N/A
Volunteers of America - Permanent Supportive
220954 1 2 13 0 15 13 86.7% N/A

A Single Night Counts: Homelessness in Louisiana
Page 44
CoC REGION 4 Housing Inventory for Acadia, Evangeline, Iberia, Lafayette,
St. Landry, St. Martin, St. Mary, and Vermillion Parishes, Page 2 of 2
TH Beds & Units: Total 53 160 151 0 311 268 86.2% N/A
Acadiana Cares - Seasons of Serenity Transitional Housing
220954 0 0 32 0 32 19 59.4% N/A
Acadiana Outreach Center - Lighthouse 220954 2 6 10 0 16 8 50.0% N/A
Community Directions - CDI Transitional Housing
229097 0 0 16 0 16 16 100.0% N/A
Faith House - Faith House Transitional 220954 5 16 1 0 17 17 100.0% N/A
Iberia Homeless Shelter - Iberia Homeless Shelter
229045 0 0 15 0 15 8 53.3% N/A
J & K Hope Center - Hope House 229001 0 0 12 0 12 12 100.0% N/A
Lafayette Catholic Service Ctr. - Bishop O'Donnel Trans.
220954 8 19 0 0 19 14 73.7% N/A
Lafayette Catholic Service Ctr. - GPD - New Life Veterans Housing
229097 2 5 4 0 9 9 100.0% N/A
Lafayette Catholic Service Ctr. - GPD - St. Michael Center for Vet
229055 0 0 12 0 12 12 100.0% N/A
Lafayette Catholic Service Ctr. - New Life Center Transitional Housing
229097 11 34 31 0 65 64 98.5% N/A
Lafayette Catholic Service Ctr. - St. Joseph Transitional
229055 0 0 6 0 6 6 100.0% N/A
SMILE Community Action - Stepping Stone I 220954 3 8 0 0 8 5 62.5% N/A
SMILE Community Action - Stepping Stone II 229045 4 19 0 0 19 19 100.0% N/A
SMILE Community Action - Stepping Stone III 220954 3 8 0 0 8 5 62.5% N/A
St. Mary Community Action - Transitional Housing
229101 15 45 0 0 45 45 100.0% N/A
Volunteers of America - Transitional Housing 220954 0 0 12 0 12 9 75.0% N/A
Total of All Beds & Units 126 351 418 0 769 633 82.3% 2

A Single Night Counts: Homelessness in Louisiana
Page 45
CoC REGION 5 Housing Inventory for Allen, Beauregard, Calcasieu, Cameron, and Jefferson Davis Parishes, Page 1 of 1
Housing/Program Type Geoco
des
Households with Children
Households without Children # of Beds
Households with Only
Children # of Beds
Total Beds # Beds
Occupied
Utilization Rate
Overflow Beds
# of Units # of Beds
ES Beds and Units: Total 16 139 0 0 139 32 23.0% 4
CADA (Communities Against Domestic Violence) - Jennings
Women's Shelter 220978 2 8 0 0 8 3 37.5% 0
Education & Treatment Council - Harbour House
220978 1 16 0 0 16 9 56.3% 0
June Jenkins Women's Shelter 229011 5 20 0 0 20 2 10.0% 1
Oasis (Calcasieu Women's Shelter) 220978 6 33 0 0 33 18 54.5% 3
Salvation Army - Center of Hope 220978 1 39 0 0 39 0 0.0% 0
The Potter's House, Inc. 220978 1 23 0 0 23 0 0.0% 0
PSH Beds & Units: Total 34 61 48 0 109 84 77.1% N/A
Calcasieu Parish Housing Department - Shelter Plus
Care/CoC 220978 8 9 10 0 19 19 100.0% N/A
Calcasieu Parish Housing Department - Shelter Plus
Care/VOA 229019 17 23 0 0 23 23 100.0% N/A
Lake Charles Housing Authority - Shelter Plus Care
220978 3 7 19 0 26 24 92.3% N/A
Sulphur Housing Authority - Shelter Plus Care
229019 6 22 19 0 41 18 43.9% N/A
TH Beds & Units: Total 4 8 63 0 71 37 52.1% N/A
Education & Treatment Council - La Maison de Grace
220978 4 8 0 0 8 6 75.0% N/A
Matthew 25:40 Corporation - Nepenthe House
220978 0 0 16 0 16 16 100.0% N/A
The City of Refuge 229019 0 0 19 0 19 14 73.7% N/A
The Lord's Place 220978 0 0 28 0 28 1 3.6% N/A
Total of All Beds & Units 54 208 111 0 319 153 48.0% 4

A Single Night Counts: Homelessness in Louisiana
Page 46
CoC REGION 6 Housing Inventory for Avoyelles, Catahoula, Concordia,
Grant, La Salle, Rapides, Vernon, and Winn Parishes, Page 1 of 1
Housing/Program Type Geo
Codes
Households with Children
Households without Children # of Beds
Households with Only Children # of Beds
Total Beds
# Beds Occupied
Utilization Rate
Overflow Beds
# of Units
# of Beds
ES Beds and Units: Total 1 5 71 0 76 38 50.0% 0
Alexandria/VA - Salvation Army/VA 229079 0 0 6 0 6 6 100.0% 0
Salvation Army - Salvation Army Shelter 229079 0 0 40 0 40 17 42.5% 0
The Pentecostals of Alexandria - Grace House
229079 0 0 16 0 16 10 62.5% 0
The Pentecostals of Alexandria - Mercy House
229079 0 0 6 0 6 5 83.3% 0
Vernon Parish Community Action Council - New Beginnings emergency Shelter
229115 1 5 3 0 8 0 0.0% 0
PSH Beds & Units: Total 29 64 135 0 199 177 88.9% N/A
Alexandria Housing Authority - VASH-AHA 229079 5 12 35 0 47 37 78.7% N/A
Cenla Chemical Dependency Council - Louisiana Intergrated Treatment Services
229079 5 16 7 0 23 19 82.6% N/A
Innercity Revitalization - Olive House PSHP 229079 0 0 20 0 20 18 90.0% N/A
Rapides Housing Authority - VASH-RHA 229079 10 20 60 0 80 80 100.0% N/A
Volunteers of America - Bonus SPH 229079 3 8 3 0 11 6 54.5% N/A
Volunteers of America - SHP for Rapides Parish
229079 3 4 7 0 11 11 100.0% N/A
Volunteers of America - SHP for Regoin VI Rural Parishes
229079 3 4 3 0 7 6 85.7% N/A
TH Beds & Units: Total 3 32 42 0 74 49 66.2% N/A
Alexandria/VA - Bridge House 229079 0 0 16 0 16 16 100.0% N/A
Hope House of Central Louisiana - Hope House Shelter
229079 2 25 5 0 30 24 80.0% N/A
Vernon Parish Community Action Council - AC Dowden Memorial Shelter
229115 1 7 15 0 22 6 27.3% N/A
Volunteers of America - Transitional Shelter 229079 0 0 6 0 6 3 50.0% N/A
Total of All Beds & Units 33 101 248 0 349 264 75.6% 0
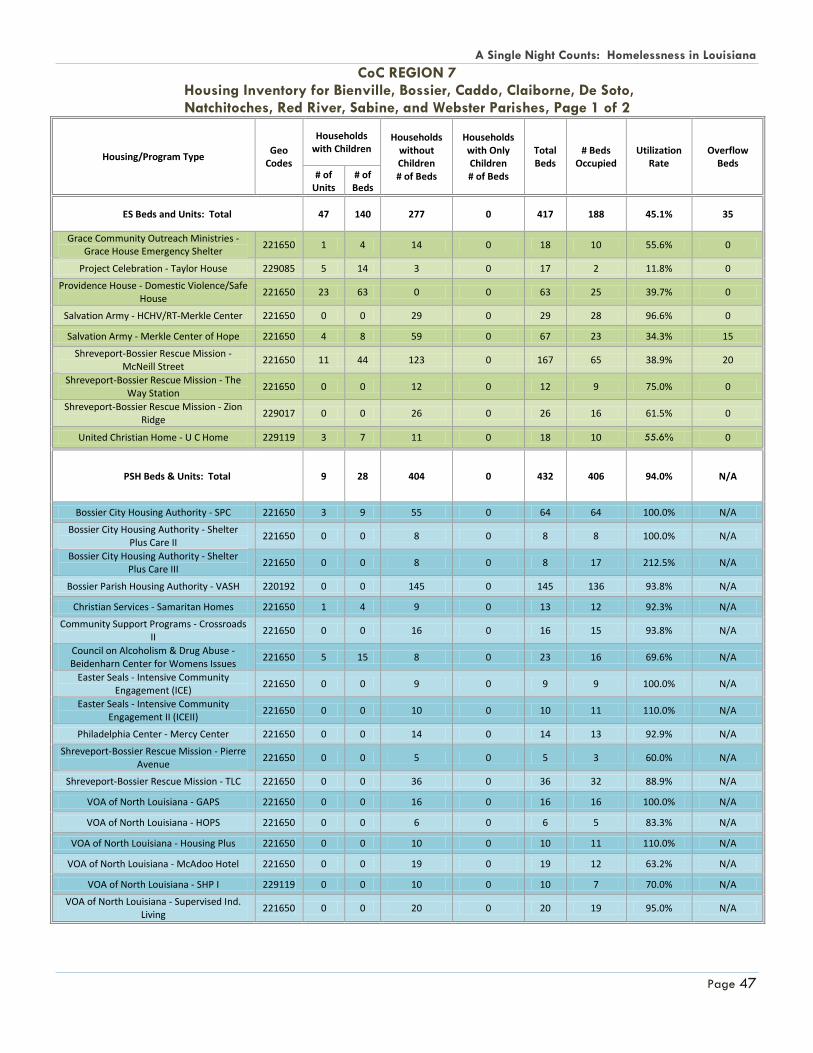
A Single Night Counts: Homelessness in Louisiana
Page 47
CoC REGION 7 Housing Inventory for Bienville, Bossier, Caddo, Claiborne, De Soto, Natchitoches, Red River, Sabine, and Webster Parishes, Page 1 of 2
Housing/Program Type Geo
Codes
Households with Children
Households without Children # of Beds
Households with Only Children # of Beds
Total Beds
# Beds Occupied
Utilization Rate
Overflow Beds
# of Units
# of Beds
ES Beds and Units: Total 47 140 277 0 417 188 45.1% 35
Grace Community Outreach Ministries - Grace House Emergency Shelter
221650 1 4 14 0 18 10 55.6% 0
Project Celebration - Taylor House 229085 5 14 3 0 17 2 11.8% 0
Providence House - Domestic Violence/Safe House
221650 23 63 0 0 63 25 39.7% 0
Salvation Army - HCHV/RT-Merkle Center 221650 0 0 29 0 29 28 96.6% 0
Salvation Army - Merkle Center of Hope 221650 4 8 59 0 67 23 34.3% 15
Shreveport-Bossier Rescue Mission - McNeill Street
221650 11 44 123 0 167 65 38.9% 20
Shreveport-Bossier Rescue Mission - The Way Station
221650 0 0 12 0 12 9 75.0% 0
Shreveport-Bossier Rescue Mission - Zion Ridge
229017 0 0 26 0 26 16 61.5% 0
United Christian Home - U C Home 229119 3 7 11 0 18 10 55.6% 0
PSH Beds & Units: Total 9 28 404 0 432 406 94.0% N/A
Bossier City Housing Authority - SPC 221650 3 9 55 0 64 64 100.0% N/A
Bossier City Housing Authority - Shelter Plus Care II
221650 0 0 8 0 8 8 100.0% N/A
Bossier City Housing Authority - Shelter Plus Care III
221650 0 0 8 0 8 17 212.5% N/A
Bossier Parish Housing Authority - VASH 220192 0 0 145 0 145 136 93.8% N/A
Christian Services - Samaritan Homes 221650 1 4 9 0 13 12 92.3% N/A
Community Support Programs - Crossroads II
221650 0 0 16 0 16 15 93.8% N/A
Council on Alcoholism & Drug Abuse - Beidenharn Center for Womens Issues
221650 5 15 8 0 23 16 69.6% N/A
Easter Seals - Intensive Community Engagement (ICE)
221650 0 0 9 0 9 9 100.0% N/A
Easter Seals - Intensive Community Engagement II (ICEII)
221650 0 0 10 0 10 11 110.0% N/A
Philadelphia Center - Mercy Center 221650 0 0 14 0 14 13 92.9% N/A
Shreveport-Bossier Rescue Mission - Pierre Avenue
221650 0 0 5 0 5 3 60.0% N/A
Shreveport-Bossier Rescue Mission - TLC 221650 0 0 36 0 36 32 88.9% N/A
VOA of North Louisiana - GAPS 221650 0 0 16 0 16 16 100.0% N/A
VOA of North Louisiana - HOPS 221650 0 0 6 0 6 5 83.3% N/A
VOA of North Louisiana - Housing Plus 221650 0 0 10 0 10 11 110.0% N/A
VOA of North Louisiana - McAdoo Hotel 221650 0 0 19 0 19 12 63.2% N/A
VOA of North Louisiana - SHP I 229119 0 0 10 0 10 7 70.0% N/A
VOA of North Louisiana - Supervised Ind. Living
221650 0 0 20 0 20 19 95.0% N/A

A Single Night Counts: Homelessness in Louisiana
Page 48
CoC REGION 7 Housing Inventory for Bienville, Bossier, Caddo, Claiborne, De Soto, Natchitoches, Red River, Sabine, and Webster Parishes, Page 2 of 2
SH Beds & Units: Total N/A N/A 10 N/A 10 9 90.0% N/A
Community Support Programs - Bridges 221650 N/A N/A 10 N/A 10 9 90.0% N/A
TH Beds & Units: Total 61 214 109 13 336 281 83.6% N/A
Christian Services - Herbert House 221650 0 0 15 0 15 4 26.7% N/A
Christian Services - Mother Stewart 221650 0 0 15 0 15 1 6.7% N/A
Community Support Programs - Project Reach
221650 0 0 9 0 9 8 88.9% N/A
Easter Seals - Mid-City Program 221650 0 0 13 0 13 12 92.3% N/A
Providence House - Project Next Step 221650 34 106 0 0 106 111 104.7% N/A
Providence House - Transitional Living 221650 27 108 0 0 108 87 80.6% N/A
The Kennedy Center - Savehavens of Shreveport
221650 0 0 0 4 4 0 0.0% N/A
VOA of North Louisiana - GPD-Veteran's Transitional Living
221650 0 0 48 0 48 47 97.9% N/A
VOA of North Louisiana - Highland Haven 221650 0 0 0 3 3 3 100.0% N/A
VOA of North Louisiana - Magnolia Place 221650 0 0 9 0 9 6 66.7% N/A
Youth Outreach Services - Jewell Outreach Transitional Living Facility
221650 0 0 0 6 6 2 33.3% N/A
Total of All Beds & Units 117 382 800 13 1,195 884 74.0% 35
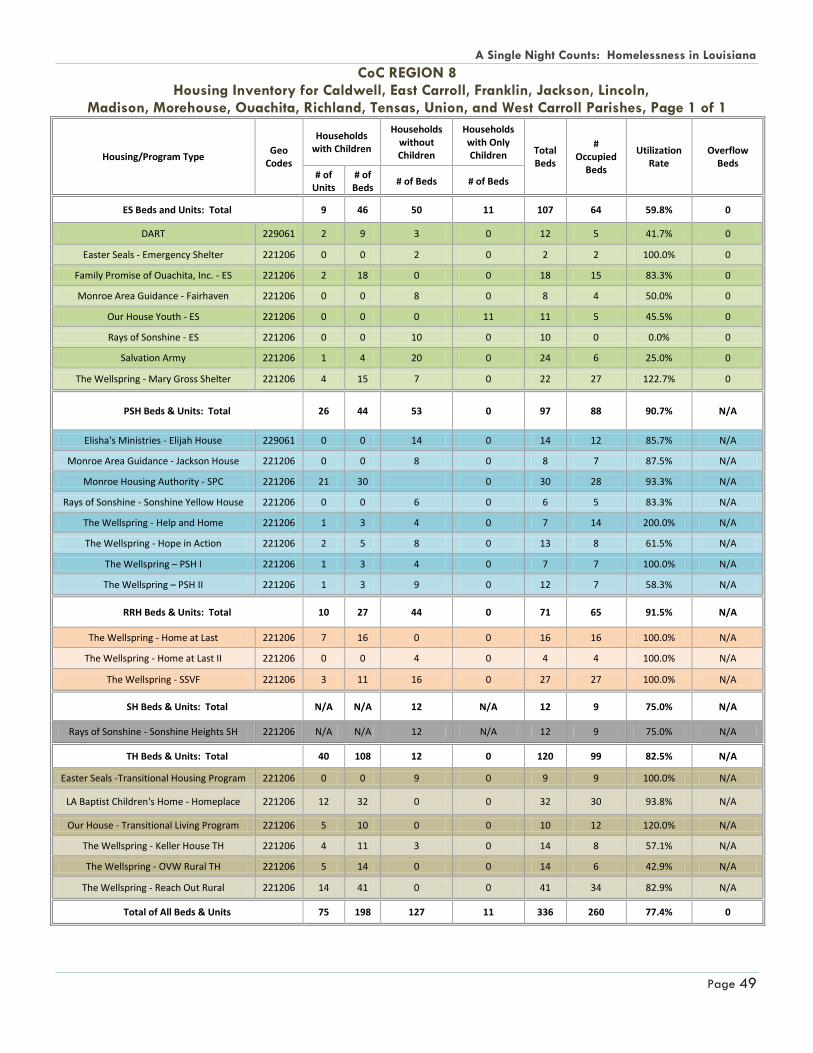
A Single Night Counts: Homelessness in Louisiana
Page 49
CoC REGION 8 Housing Inventory for Caldwell, East Carroll, Franklin, Jackson, Lincoln,
Madison, Morehouse, Ouachita, Richland, Tensas, Union, and West Carroll Parishes, Page 1 of 1
Housing/Program Type Geo
Codes
Households with Children
Households without Children
Households with Only Children Total
Beds
# Occupied
Beds
Utilization Rate
Overflow Beds
# of Units
# of Beds
# of Beds # of Beds
ES Beds and Units: Total 9 46 50 11 107 64 59.8% 0
DART 229061 2 9 3 0 12 5 41.7% 0
Easter Seals - Emergency Shelter 221206 0 0 2 0 2 2 100.0% 0
Family Promise of Ouachita, Inc. - ES 221206 2 18 0 0 18 15 83.3% 0
Monroe Area Guidance - Fairhaven 221206 0 0 8 0 8 4 50.0% 0
Our House Youth - ES 221206 0 0 0 11 11 5 45.5% 0
Rays of Sonshine - ES 221206 0 0 10 0 10 0 0.0% 0
Salvation Army 221206 1 4 20 0 24 6 25.0% 0
The Wellspring - Mary Gross Shelter 221206 4 15 7 0 22 27 122.7% 0
PSH Beds & Units: Total 26 44 53 0 97 88 90.7% N/A
Elisha's Ministries - Elijah House 229061 0 0 14 0 14 12 85.7% N/A
Monroe Area Guidance - Jackson House 221206 0 0 8 0 8 7 87.5% N/A
Monroe Housing Authority - SPC 221206 21 30 0 30 28 93.3% N/A
Rays of Sonshine - Sonshine Yellow House 221206 0 0 6 0 6 5 83.3% N/A
The Wellspring - Help and Home 221206 1 3 4 0 7 14 200.0% N/A
The Wellspring - Hope in Action 221206 2 5 8 0 13 8 61.5% N/A
The Wellspring – PSH I 221206 1 3 4 0 7 7 100.0% N/A
The Wellspring – PSH II 221206 1 3 9 0 12 7 58.3% N/A
RRH Beds & Units: Total 10 27 44 0 71 65 91.5% N/A
The Wellspring - Home at Last 221206 7 16 0 0 16 16 100.0% N/A
The Wellspring - Home at Last II 221206 0 0 4 0 4 4 100.0% N/A
The Wellspring - SSVF 221206 3 11 16 0 27 27 100.0% N/A
SH Beds & Units: Total N/A N/A 12 N/A 12 9 75.0% N/A
Rays of Sonshine - Sonshine Heights SH 221206 N/A N/A 12 N/A 12 9 75.0% N/A
TH Beds & Units: Total 40 108 12 0 120 99 82.5% N/A
Easter Seals -Transitional Housing Program 221206 0 0 9 0 9 9 100.0% N/A
LA Baptist Children's Home - Homeplace 221206 12 32 0 0 32 30 93.8% N/A
Our House - Transitional Living Program 221206 5 10 0 0 10 12 120.0% N/A
The Wellspring - Keller House TH 221206 4 11 3 0 14 8 57.1% N/A
The Wellspring - OVW Rural TH 221206 5 14 0 0 14 6 42.9% N/A
The Wellspring - Reach Out Rural 221206 14 41 0 0 41 34 82.9% N/A
Total of All Beds & Units 75 198 127 11 336 260 77.4% 0

A Single Night Counts: Homelessness in Louisiana
Page 50
CoC Region 9 Housing Inventory for Livingston, St. Helena, St. Tammany, Tangipahoa,
and Washington Parishes, Page 1 of 2
Housing/Program Type Geo
Codes
Households with Children
Households without Children
Households with Only Children Total
Beds
# Occupied
Beds
Utilization Rate
Overflow Beds
# of Units
# of Beds
# of Beds # of Beds
ES Beds and Units: Total 13 38 72 0 110 86 78.2% 2
Caring Center of Slidell - Shelter 221698 1 3 9 0 12 10 83.3% 0
Caring Center of Slidell - Motel Vouchers 221698 1 1 1 0 2 2 100.0% 0
Community Christian Concern - Motel Vouchers
221698 1 1 1 0 2 0 0.0% 0
House of Serenity - Shelter 229105 1 2 28 0 30 31 103.3% 0
Safe Harbor - Shelter 229103 3 18 2 0 20 12 60.0% 0
SAFE - Shelter 229105 2 6 0 0 6 7 116.7% 1
The Good Samaritan Ministry - Motel Vouchers
221698 1 1 1 0 2 1 50.0% 0
The Samaritan Center - Motel Vouchers 229103 1 1 1 0 2 1 50.0% 1
Timothy Trumpet of Truth - Shelter 221698 0 0 25 0 25 18 72.0% 0
Women Outreaching Women - Shelter 229063 2 5 4 0 9 4 44.4% 0
PSH Beds & Units: Total 44 143 177 0 320 298 93.1% N/A
Denham Springs PHA - VASH 229103 0 0 1 0 1 1 100.0% N/A
Slidell Housing Authority - VASH 229103 5 19 6 0 25 25 100.0% N/A
Southeast Louisiana Hospital - Hummingbird Apartments
229103 0 0 8 0 8 2 25.0% N/A
Southeast Louisiana Hospital - Hummingbird Group Home
229103 2 5 7 0 12 6 50.0% N/A
Tangipahoa Parish Section 8 - VASH 229105 0 0 10 0 10 12 120.0% N/A
Volunteers of America GNO -- 6040 229103 7 24 16 0 40 35 87.5% N/A
Volunteers of America GNO -- 6045 229103 11 33 65 0 98 94 95.9% N/A
Volunteers of America GNO -- 7000 229103 3 10 9 0 19 16 84.2% N/A
Volunteers of America GNO -- 7050 229103 3 7 12 0 19 19 100.0% N/A
Volunteers of America GNO -- 7150 229103 6 21 30 0 51 52 102.0% N/A
Volunteers of America GNO -- 7170 229103 2 6 2 0 8 8 100.0% N/A
Volunteers of America GNO -- 7190 229103 5 18 3 0 21 21 100.0% N/A
Women Outreaching Women - PSH 229063 0 0 4 0 4 4 100.0% N/A
Women Outreaching Women PSH 229063 0 0 4 0 4 3 75.0% N/A

A Single Night Counts: Homelessness in Louisiana
Page 51
CoC Region 9 Housing Inventory for Livingston, St. Helena, St. Tammany, Tangipahoa,
and Washington Parishes, Page 2 of 2
TH Beds & Units: Total 36 120 80 0 200 155 77.5% N/A
Community Christian Concern - Miramon Center
221698 0 0 12 0 12 7 58.3% N/A
Hammond Housing Authority - Successful Transitions Program
229105 14 42 0 0 42 35 83.3% N/A
Liberty Restoration CDC - Transitional Houses 229105 0 0 8 0 8 5 62.5% N/A
Quad Area CAA GPD - Quad VETS (TH Dorm) 229105 0 0 38 0 38 36 94.7% N/A
Southeast Louisiana Hospital - Wren Way Group Home
229103 0 0 12 0 12 5 41.7% N/A
SAFE - Transitional Housing for Families 229105 0 0 5 0 5 4 80.0% N/A
SAFE - Transitional Housing for Unaccompanied Women
229105 15 51 0 0 51 31 60.8% N/A
St. Tammany Parish Community Action - Transitional Housing for Families
221698 6 24 0 0 24 24 100.0% N/A
Volunteers og America GNO - Transitional Housing for HIV/AIDS
229105 1 3 5 0 8 8 100.0% N/A
Total of All Beds & Units 93 301 329 0 630 539 85.6% 2
A Single Night Counts: Homelessness in Louisiana
Page 52
Appendix D:
Demographics by State, CoC Region, and Parish

A Single Night Counts: Homelessness in Louisiana
Page 53
Regional Continua of Care Composition by Parish
Parish Region (CoC) Parish Region (CoC) Parish Region (CoC)
ACADIA 4 IBERIA 4 ST. CHARLES 3
ALLEN 5 IBERVILLE 2 ST. HELENA 9
ASCENSION 2 JACKSON 8 ST. JAMES 3
ASSUMPTION 3 JEFF. DAVIS 5 ST. JOHN 3
AVOYELLES 6 JEFFERSON 10 ST. LANDRY 4
BEAUREGARD 5 LA SALLE 6 ST. MARTIN 4
BIENVILLE 7 LAFAYETTE 4 ST. MARY 4
BOSSIER 7 LAFOURCHE 3 ST. TAMMANY 9
CADDO 7 LINCOLN 8 TANGIPAHOA 9
CALCASIEU 5 LIVINGSTON 9 TENSAS 8
CALDWELL 8 MADISON 8 TERREBONNE 3
CAMERON 5 MOREHOUSE 8 UNION 8
CATAHOULA 6 NATCHITOCHES 7 VERMILLION 4
CLAIBORNE 7 ORLEANS 1 VERNON 6
CONCORDIA 6 OUACHITA 8 W. BATON ROUGE 2
DE SOTO 7 PLAQUEMINES not in CoC W. CARROLL 8
E BATON ROUGE 2 POINTE COUPEE 2 W. FELICIANA 2
E. FELICIANA 2 RAPIDES 6 WASHINGTON 9
EAST CARROLL 8 RED RIVER 7 WEBSTER 7
EVANGELINE 4 RICHLAND 8 WINN 6
FRANKLIN 8 SABINE 7 GRANT 6 ST. BERNARD not in CoC
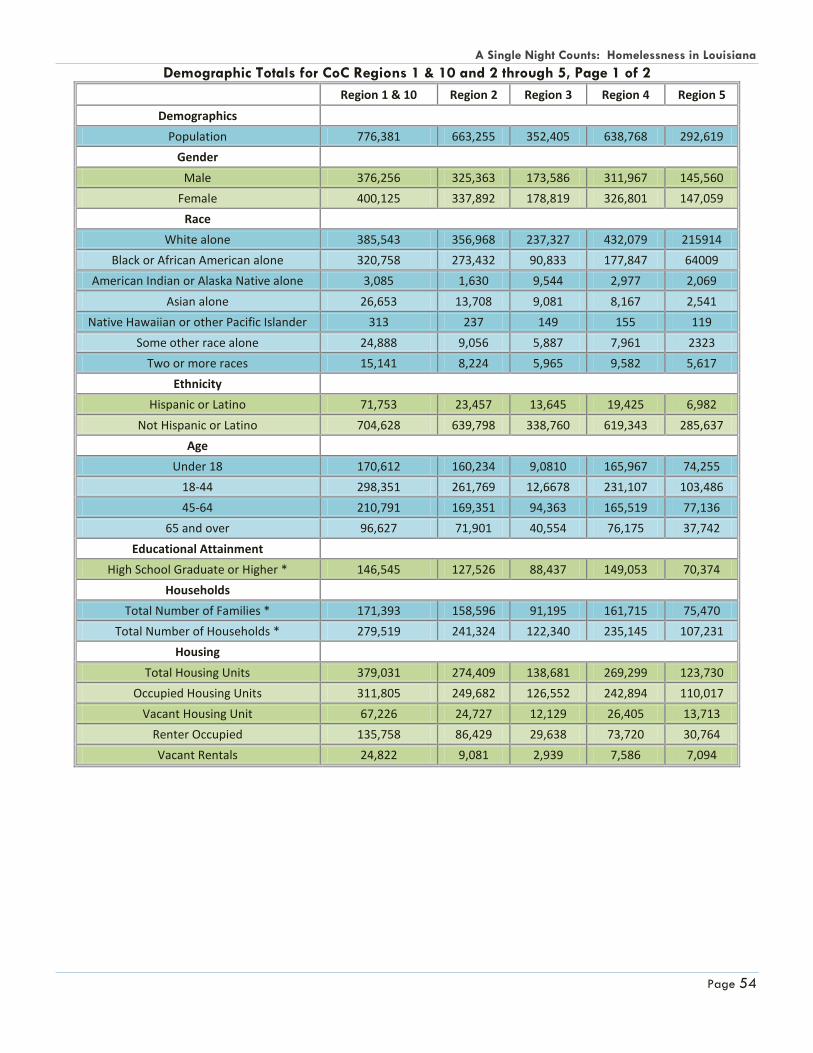
A Single Night Counts: Homelessness in Louisiana
Page 54
Demographic Totals for CoC Regions 1 & 10 and 2 through 5, Page 1 of 2
Region 1 & 10 Region 2 Region 3 Region 4 Region 5
Demographics
Population 776,381 663,255 352,405 638,768 292,619
Gender
Male 376,256 325,363 173,586 311,967 145,560
Female 400,125 337,892 178,819 326,801 147,059
Race
White alone 385,543 356,968 237,327 432,079 215914
Black or African American alone 320,758 273,432 90,833 177,847 64009
American Indian or Alaska Native alone 3,085 1,630 9,544 2,977 2,069
Asian alone 26,653 13,708 9,081 8,167 2,541
Native Hawaiian or other Pacific Islander 313 237 149 155 119
Some other race alone 24,888 9,056 5,887 7,961 2323
Two or more races 15,141 8,224 5,965 9,582 5,617
Ethnicity
Hispanic or Latino 71,753 23,457 13,645 19,425 6,982
Not Hispanic or Latino 704,628 639,798 338,760 619,343 285,637
Age
Under 18 170,612 160,234 9,0810 165,967 74,255
18-44 298,351 261,769 12,6678 231,107 103,486
45-64 210,791 169,351 94,363 165,519 77,136
65 and over 96,627 71,901 40,554 76,175 37,742
Educational Attainment
High School Graduate or Higher * 146,545 127,526 88,437 149,053 70,374
Households
Total Number of Families * 171,393 158,596 91,195 161,715 75,470
Total Number of Households * 279,519 241,324 122,340 235,145 107,231
Housing
Total Housing Units 379,031 274,409 138,681 269,299 123,730
Occupied Housing Units 311,805 249,682 126,552 242,894 110,017
Vacant Housing Unit 67,226 24,727 12,129 26,405 13,713
Renter Occupied 135,758 86,429 29,638 73,720 30,764
Vacant Rentals 24,822 9,081 2,939 7,586 7,094
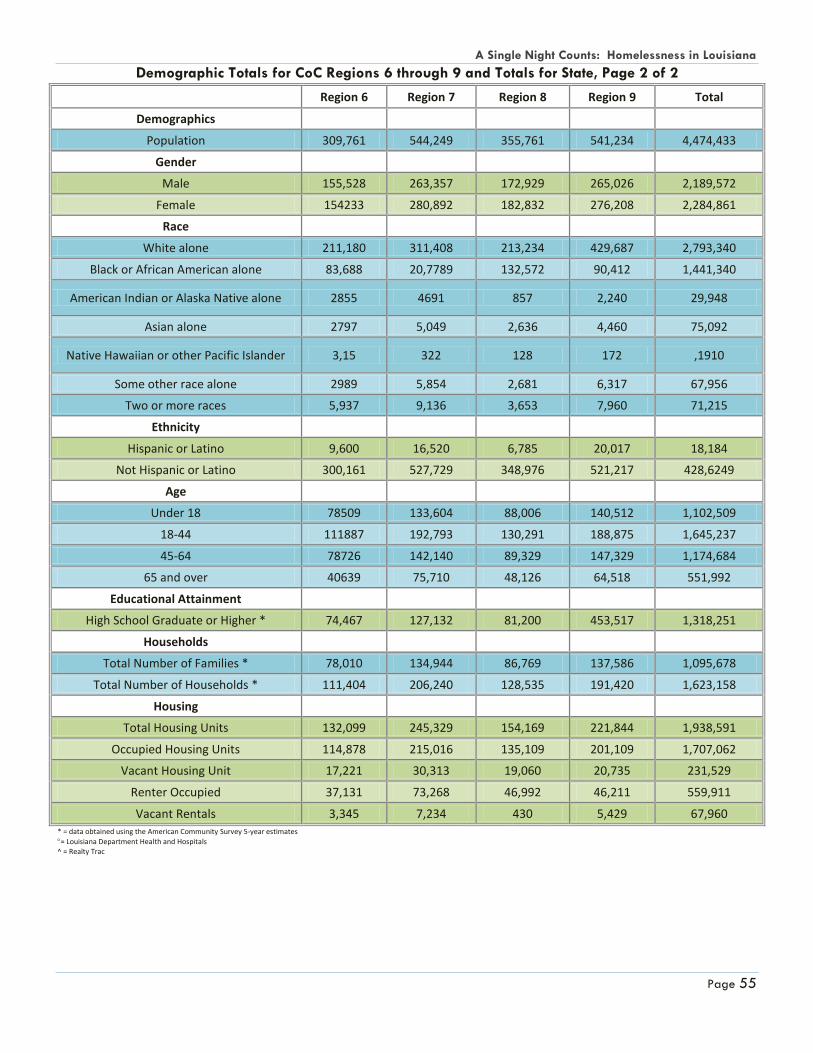
A Single Night Counts: Homelessness in Louisiana
Page 55
Demographic Totals for CoC Regions 6 through 9 and Totals for State, Page 2 of 2
Region 6 Region 7 Region 8 Region 9 Total
Demographics
Population 309,761 544,249 355,761 541,234 4,474,433
Gender
Male 155,528 263,357 172,929 265,026 2,189,572
Female 154233 280,892 182,832 276,208 2,284,861
Race
White alone 211,180 311,408 213,234 429,687 2,793,340
Black or African American alone 83,688 20,7789 132,572 90,412 1,441,340
American Indian or Alaska Native alone 2855 4691 857 2,240 29,948
Asian alone 2797 5,049 2,636 4,460 75,092
Native Hawaiian or other Pacific Islander 3,15 322 128 172 ,1910
Some other race alone 2989 5,854 2,681 6,317 67,956
Two or more races 5,937 9,136 3,653 7,960 71,215
Ethnicity
Hispanic or Latino 9,600 16,520 6,785 20,017 18,184
Not Hispanic or Latino 300,161 527,729 348,976 521,217 428,6249
Age
Under 18 78509 133,604 88,006 140,512 1,102,509
18-44 111887 192,793 130,291 188,875 1,645,237
45-64 78726 142,140 89,329 147,329 1,174,684
65 and over 40639 75,710 48,126 64,518 551,992
Educational Attainment
High School Graduate or Higher * 74,467 127,132 81,200 453,517 1,318,251
Households
Total Number of Families * 78,010 134,944 86,769 137,586 1,095,678
Total Number of Households * 111,404 206,240 128,535 191,420 1,623,158
Housing
Total Housing Units 132,099 245,329 154,169 221,844 1,938,591
Occupied Housing Units 114,878 215,016 135,109 201,109 1,707,062
Vacant Housing Unit 17,221 30,313 19,060 20,735 231,529
Renter Occupied 37,131 73,268 46,992 46,211 559,911
Vacant Rentals 3,345 7,234 430 5,429 67,960 * = data obtained using the American Community Survey 5-year estimates
= Louisiana Department Health and Hospitals
^ = Realty Trac

A Single Night Counts: Homelessness in Louisiana
Page 56
Demographic Totals for CoC Region 1 & 10 and by Parish, Page 1 of 1 Region 1 & 10 Jefferson Orleans Total
Demographics
Population 432,552 100% 343,829 100% 776,381
Gender
Male 210,008 48.6% 166,248 48.4% 376,256
Female 222,544 51.4% 177,581 51.6% 400,125
Race
White alone 272,115 62.9% 113,428 33.0% 385,543
Black or African American alone 113,887 26.3% 206,871 60.2% 320,758
American Indian or Alaska Native alone 2,038 0.5% 1,047 0.3% 3,085
Asian alone 16,683 3.9% 9,970 2.9% 26,653
Native Hawaiian or other Pacific Islander 179 0.0% 134 0.0% 313
Some other race alone 18,429 4.3% 6,459 1.9% 24,888
Two or more races 9,221 2.1% 5,920 1.7% 15,141
Ethnicity
Hispanic or Latino 53,702 12.4% 18,051 5.2% 71,753
Not Hispanic or Latino 378,850 87.6% 325,778 94.8% 704,628
Age
Under 18 97,397 22.5% 73,215 21.3% 170,612
18-44 155,567 35.9% 142,784 41.6% 298,351
45-64 120,600 27.9% 90,191 26.2% 210,791
65 and over 58,988 13.6% 37,639 10.9% 96,627
Educational Attainment
High School Graduate or Higher * 94,120 32.0% 52,425 26.9% 146,545
Households
Total Number of Families * 107,255
64,138
171,393
Total Number of Households * 162,881
116,638
279,519
Housing
Total Housing Units 189,135 100% 189,896 100% 379,031
Occupied Housing Units 169,647 89.7% 142,158 74.9% 311,805
Vacant Housing Unit 19,488 10.3% 47,738 25.1% 67,226
Renter Occupied 61,603 36.3% 74,155 52.2% 135,758
Vacant Rentals 9,550 49.0% 15,272 32.0% 24,822
Financials
Foreclosure 333 1:568 230 1:826 563
Median Income
Median Household Income * $ 48,175
$ 37,468
$ 42,822
Median Family Income * $ 59,007
$ 46,170
$ 52,589
Median Worker Income * $ 29,041
$ 24,945
$ 26,993
Poverty Rate
% of Families Below the Poverty Level * 43,688 10.1% 65,328 19.0% 109,016
% of Individuals Below Poverty Level * 61,422 14.2% 83,894 24.4% 145,317
Cash Benefits
SSI * 45,918 10.6% 28,580 8.3% 74,498
Non-Cash Benefits
Food Stamp Assistance in the Past 12 Months * 25,459 5.9% 22,309 6.5% 47,768
Employment
Population Over 16 * 345,650 100% 239,677 100% 585,327
In Labor Force * 225,819 65.3% 150,679 62.9% 376,498
Civilian Labor Force * 224,767 65.0% 150,066 62.6% 374,833
Employed * 209,432 60.6% 132,056 55.1% 341,488
Unemployed * 15,335 4.4% 18,010 7.5% 33,345
Armed Forces * 1,052 0.3% 613 0.3% 1,665
Not in Labor Force * 119,831 34.7% 88,998 37.1% 208,829
Transportation to Work
Workers 16 Years and Over * 204,617 100% 128,853 100% 333,470
Car, Truck, or Van -- Drove Alone * 164,469 80.4% 87,651 68.0% 252,120
Car, Truck, or Van -- Carpooled * 25,594 12.5% 16,218 12.6% 41,812
Public Transportation (excluding taxicab) * 2,999 1.5% 9,013 7.0% 12,012
Walked * 2,972 1.5% 6,841 5.3% 9,813
Other Means * 3,232 1.6% 4,777 3.7% 8,009
Worked at Home * 5,351 2.6% 4,353 3.4% 9,704
Health
HIV/AIDS 1,663
4,731
6,394
AIDS 909
2,535
3,444
Mental Illness 17,480
13,625
31,105
Substance Abuse
29,222 1
* = data obtained using the American Community Survey 5-year estimates
= Louisiana Department Health and Hospitals
^ = Realty Trac 1 = Includes Orleans, Plaquemines, and St. Bernard Parishes. Jefferson Parish is not Included.

A Single Night Counts: Homelessness in Louisiana
Page 57
Demographic Totals for CoC Region 2 and by Parish, Page 1 of 2 Region 2 Ascension E. Baton Rouge E. Feliciana Iberville
Demographics
Population 107,215 100% 440,171 100% 20,267 100% 33,387 100%
Gender
Male 52,947 49.4% 211,488 48.0% 10,898 53.8% 17,020 51.0%
Female 54,268 50.6% 228,683 52.0% 9,369 46.2% 16,367 49.0%
Race
White alone 78,572 73.3% 214,927 48.8% 10,783 53.2% 16,280 48.8%
Black or African American alone 23,846 22.2% 199,505 45.3% 9,108 44.9% 16,454 49.3%
American Indian or Alaska Native alone 339 0.3% 1,097 0.2% 64 0.3% 62 0.2%
Asian alone 1,018 0.9% 12,367 2.8% 52 0.3% 104 0.3%
Native Hawaiian or other Pacific Islander 81 0.1% 135 0.0% 2 0.0% 3 0.0%
Some other race alone 2,049 1.9% 6,302 1.4% 32 0.2% 216 0.6%
Two or more races 1,310 1.2% 5,838 1.3% 226 1.1% 268 0.8%
Ethnicity
Hispanic or Latino 5,024 4.7% 16,274 3.7% 208 1.0% 664 2.0%
Not Hispanic or Latino 102,191 95.3% 423,897 96.3% 20,059 99.0% 32,723 98.0%
Age
Under 18 30,755 28.7% 103,665 23.6% 4,192 20.7% 7,502 22.5%
18-44 40,285 37.6% 180,419 41.0% 6,991 34.5% 12,422 37.2%
45-64 26,681 24.9% 108,057 24.5% 6,452 31.8% 9,459 28.3%
65 and over 9,494 8.9% 48,030 10.9% 2,632 13.0% 4,004 12.0%
Educational Attainment
High School Graduate or Higher * 24,951 38.7% 71,251 26.7% 5,568 39.7% 9,382 42.0%
Households
Total Number of Families * 27,263 103,965 4,681 7,811
Total Number of Households * 35,640 166,543 6,662 11,118
Housing
Total Housing Units 40,784 100% 187,353 100% 8,014 100% 12,707 100%
Occupied Housing Units 37,790 92.7% 172,057 91.8% 7,022 87.6% 11,072 87.1%
Vacant Housing Unit 2,994 7.3% 15,296 8.2% 992 12.4% 1,635 12.9%
Renter Occupied 7,248 19.2% 69,716 40.5% 1,284 18.3% 2,739 24.7%
Vacant Rentals 814 27.2% 7421 48.5% 87 8.8% 235 14.4%
Financials
Foreclosure 70 1:583 134 1:1398 1 1:8014 6 1:3657
Median Income
Median Household Income * $ 63,716 $ 46,179 $ 35,335 $ 42,215
Median Family Income * $ 72,288 $ 60,256 $ 46,750 $ 51,321
Median Worker Income * $ 35,521 $ 25,936 $ 22,905 $ 25,804
Poverty Rate
% of Families Below the Poverty Level * 9,757 9.1% 54,581 12.4% 3,141 15.5% 4,207 12.6%
% of Individuals Below Poverty Level * 12,544 11.7% 80,991 18.4% 4,317 21.3% 5,909 17.7%
Cash Benefits
SSI * 7,505 21.1% 39,322 23.6% 2,174 32.6% 3,398 30.6%
Non-Cash Benefits
Food Stamp Assistance in the Past 12 Months * 4,623 13.0% 22,656 13.6% 1,228 18.4% 2,721 24.5%
Employment
Population Over 16 * 76,519 100% 344,036 100% 16,571 100% 26,745 100%
In Labor Force * 51,713 67.6% 230,884 67.1% 8,515 51.4% 13,796 51.6%
Civilian Labor Force * 51,623 67.5% 230,581 67.0% 8,511 51.4% 13,733 51.3%
Employed * 48,872 63.9% 213,568 62.1% 7,439 44.9% 13,000 48.6%
Unemployed * 2,751 3.6% 17,013 4.9% 1,072 6.5% 733 2.7%
Armed Forces * 90 0.1% 303 0.1% 4 0.0% 63 0.2%
Not in Labor Force * 24,806 32.4% 113,152 32.9% 8,056 48.6% 12,949 48.4%
Transportation to Work
Workers 16 Years and Over * 47,589 100% 208,271 100% 7,300 100% 12,450 100%
Car, Truck, or Van -- Drove Alone * 39,939 83.9% 170,168 81.7% 6,168 84.5% 10,376 83.3%
Car, Truck, or Van -- Carpooled * 5,563 11.7% 22,480 10.8% 679 9.3% 1,481 11.9%
Public Transportation (excluding taxicab) * 34 0.1% 3,562 1.7% 23 0.3% 33 0.3%
Walked * 309 0.6% 4,407 2.1% 48 0.7% 402 3.2%
Other Means * 370 0.8% 2,526 1.2% 140 1.9% 46 0.4%
Worked at Home * 1,374 2.9% 5,128 2.5% 242 3.3% 112 0.9%
Health
HIV/AIDS 195 3,592 161 430
AIDS 97 1,941 92 258
Mental Illness 4,756 18,079 795 1,346
Substance Abuse
* = data obtained using the American Community Survey 5-year estimates
= Louisiana Department Health and Hospitals ^ = Realty Trac

A Single Night Counts: Homelessness in Louisiana
Page 58
Demographic Totals for CoC Region 2 and by Parish, Page 2 of 2 Region 2 Pointe Coupee W. Baton Rouge W. Feliciana Total
Demographics
Population 22,802 100% 23,788 100% 15,625 100% 663,255
Gender
Male 11,061 48.5% 11,698 49.2% 10,251 65.6% 325,363
Female 11,741 51.5% 12,090 50.8% 5,374 34.4% 337,892
Race
White alone 14,010 61.4% 14,271 60.0% 8,125 52.0% 356,968
Black or African American alone 8,284 36.3% 8,972 37.7% 7,263 46.5% 273,432
American Indian or Alaska Native alone 18 0.1% 30 0.1% 20 0.1% 1,630
Asian alone 57 0.2% 79 0.3% 31 0.2% 13,708
Native Hawaiian or other Pacific Islander 0 0.0% 13 0.1% 3 0.0% 237
Some other race alone 213 0.9% 150 0.6% 94 0.6% 9,056
Two or more races 220 1.0% 273 1.1% 89 0.6% 8,224
Ethnicity
Hispanic or Latino 492 2.2% 544 2.3% 251 1.6% 23,457
Not Hispanic or Latino 22,310 97.8% 23,244 97.7% 15,374 98.4% 639,798
Age
Under 18 5,475 24.0% 5,927 24.9% 2,718 17.4% 160,234
18-44 6,912 30.3% 8,772 36.9% 5,968 38.2% 261,769
45-64 6,881 30.2% 6,472 27.2% 5,349 34.2% 169,351
65 and over 3,534 15.5% 2,617 11.0% 1,590 10.2% 71,901
Educational Attainment
High School Graduate or Higher * 6,088 39.3% 6,193 41.3% 4,093 34.8% 127,526
Households
Total Number of Families * 5,922 5,906 3,048 158,596
Total Number of Households * 8,859 8,386 4,116 241,324
Housing
Total Housing Units 11,130 100% 9,324 100% 5,097 100% 274,409
Occupied Housing Units 9,082 81.6% 8,688 93.2% 3,971 77.9% 249,682
Vacant Housing Unit 2,048 18.4% 636 6.8% 1,126 22.1% 24,727
Renter Occupied 2,150 23.7% 2,264 26.1% 1,028 25.9% 86,429
Vacant Rentals 204 10.0% 212 33.3% 108 9.6% 9081
Financials
Foreclosure 1 1:11130 9 1:1036 n/a n/a 221
Median Income
Median Household Income * $ 41,177 $ 47,298 $ 43,411 $ 45,619
Median Family Income * $ 53,394 $ 54,442 $ 55,852 $ 56,329
Median Worker Income * $ 26,987 $ 27,919 $ 23,358 $ 26,919
Poverty Rate
% of Families Below the Poverty Level * 2,759 12.1% 2,831 11.9% 1,828 11.7% 79,104
% of Individuals Below Poverty Level * 4,606 20.2% 3,806 16.0% 2,031 13.0% 114,205
Cash Benefits
SSI * 3,008 34.0% 2,218 26.4% 1,089 26.5% 58,714
Non-Cash Benefits
Food Stamp Assistance in the Past 12 Months * 1,471 16.6% 1,379 16.4% 562 13.7% 34,640
Employment
Population Over 16 * 17,904 100% 18,014 100% 13,233 100% 513,022
In Labor Force * 10,557 59.0% 11,970 66.4% 4,852 36.7% 332,287
Civilian Labor Force * 10,505 58.7% 11,970 66.4% 4,852 36.7% 331,775
Employed * 9,847 55.0% 11,047 61.3% 4,517 34.1% 308,290
Unemployed * 658 3.7% 923 5.1% 335 2.5% 23,485
Armed Forces * 52 0.3% 0 0.0% 0 0.0% 512
Not in Labor Force * 7,347 41.0% 6,044 33.6% 8,381 63.3% 180,735
Transportation to Work
Workers 16 Years and Over * 9,716 100% 10,835 100% 4,437 100% 300,598
Car, Truck, or Van -- Drove Alone * 7,915 81.5% 8,837 81.6% 3,912 88.2% 247,315
Car, Truck, or Van -- Carpooled * 1,130 11.6% 1,238 11.4% 323 7.3% 32,894
Public Transportation (excluding taxicab) * 5 0.1% 15 0.1% 25 0.6% 3,697
Walked * 145 1.5% 374 3.5% 73 1.6% 5,758
Other Means * 137 1.4% 169 1.6% 8 0.2% 3,396
Worked at Home * 384 4.0% 202 1.9% 96 2.2% 7,538
Health
HIV/AIDS 55 101 149 4,683
AIDS 35 61 94 2,578
Mental Illness 943 996 580 27,495
Substance Abuse 47,353
* = data obtained using the American Community Survey 5-year estimates
= Louisiana Department Health and Hospitals ^ = Realty Trac

A Single Night Counts: Homelessness in Louisiana
Page 59
Demographic Totals for CoC Region 3 and by Parish, Page 1 of 1 Region 3 Assumption Lafourche St. Charles St. James St. John Terrebonne Total
Demographics
Population 23,421 100% 96,318 100% 52,780 100% 22,102 100% 45,924 100% 111,860 100% 352,405
Gender
Male 11,456 48.9% 47,324 49.1% 26,085 49.4% 10,812 48.9% 22,341 48.6% 55,568 49.7% 173,586
Female 11,965 51.1% 48,994 50.9% 26,695 50.6% 11,290 51.1% 23,583 51.4% 56,292 50.3% 178,819
Race
White alone 15,635 66.8% 76,445 79.4% 36,540 69.2% 10,615 48.0% 19,501 42.5% 78,591 70.3% 237,327
Black or African American alone 7,141 30.5% 12,746 13.2% 14,051 26.6% 11,180 50.6% 24,576 53.5% 21,139 18.9% 90,833
American Indian or Alaska Native alone 133 0.6% 2,703 2.8% 172 0.3% 45 0.2% 144 0.3% 6,347 5.7% 9,544
Asian alone 58 0.2% 7,090 7.4% 440 0.8% 31 0.1% 322 0.7% 1,140 1.0% 9,081
Native Hawaiian or other Pacific Islander 12 0.1% 33 0.0% 21 0.0% 3 0.0% 22 0.0% 58 0.1% 149
Some other race alone 233 1.0% 1,951 2.0% 709 1.3% 84 0.4% 698 1.5% 2,212 2.0% 5,887
Two or more races 209 0.9% 1,731 1.8% 847 1.6% 144 0.7% 661 1.4% 2,373 2.1% 5,965
Ethnicity
Hispanic or Latino 498 2.1% 3,647 3.8% 2,648 5.0% 256 1.2% 2,175 4.7% 4,421 4.0% 13,645
Not Hispanic or Latino 22,923 97.9% 92,671 96.2% 50,132 95.0% 21,846 98.8% 43,749 95.3% 107,439 96.0% 338,760
Age
Under 18 5,756 24.6% 23,666 24.6% 14,208 26.9% 5,701 25.8% 12,356 26.9% 29,123 26.0% 90,810
18-44 7,898 33.7% 35,403 36.8% 18,497 35.1% 7,383 33.4% 16,316 35.5% 41,181 36.8% 126,678
45-64 6,622 28.3% 25,218 26.2% 14,840 28.1% 6,177 27.9% 12,516 27.3% 28,990 25.9% 94,363
65 and over 3,145 13.4% 12,031 12.5% 5,235 9.9% 2,841 12.9% 4,736 10.3% 12,566 11.2% 40,554
Educational Attainment
High School Graduate or Higher * 6,683 43.3% 24,056 39.0% 12,439 36.9% 6,857 48.2% 10,879 37.4% 27,523 39.0% 88,437
Households
Total Number of Families * 6,124
24,974
14,718
5,921
11,759
27,699
91,195
Total Number of Households * 8,467
34,108
18,460
7,455
15,772
38,078
122,340
Housing
Total Housing Units 10,351 100.0% 38,582 100% 19,896 100% 8,455 100% 17,510 100% 43,887 100% 138,681
Occupied Housing Units 8,736 84.4% 35,486 92.0% 18,557 93.3% 7,717 91.3% 15,965 91.2% 40,091 91.4% 126,552
Vacant Housing Unit 1,615 15.6% 3,096 8.0% 1,339 6.7% 738 8.7% 1,545 8.8% 3,796 8.6% 12,129
Renter Occupied 1,610 18.4% 8,575 24.2% 3,753 20.2% 1,246 16.1% 3,328 20.8% 11,126 27.8% 29,638
Vacant Rentals 74 4.6% 810 26.2% 437 32.6% 155 21.0% 464 30.1% 999 26.3% 2,939
Financials
Foreclosure n/a n/a 33 1:1169 27 1:737 n/a n/a 5 1:3502 15 1:2926 80
Median Income
Median Household Income * $ 45,235
$ 47,492
$ 60,961
$ 51,725
$ 47,666
$ 48,437
$ 50,253
Median Family Income * $ 51,657
$ 56,301
$ 66,971
$ 59,379
$ 57,742
$ 57,189
$ 58,207
Median Worker Income * $ 28,194
$ 29,600
$ 33,847
$ 29,520
$ 26,163
$ 28,105
$ 29,238
Poverty Rate
% of Families Below the Poverty Level * 2,904 12.4% 11,366 11.8% 5,806 11.0% 2,498 11.3% 5,786 12.6% 15,549 13.9% 43,908
% of Individuals Below Poverty Level * 4,146 17.7% 15,026 15.6% 6,598 12.5% 3,006 13.6% 7,118 15.5% 19,464 17.4% 55,356
Cash Benefits
SSI * 3,073 36.3% 10,527 30.9% 4,452 24.1% 2,433 32.6% 4,192 26.6% 11,750 30.9% 36,427
Non-Cash Benefits
Food Stamp Assistance in the Past 12 Months * 1,679 19.8% 6,418 18.8% 2,435 13.2% 1,329 17.8% 2,724 17.3% 8,225 21.6% 22,810
Employment
Population Over 16 * 18,429 100% 74,559 100% 39,891 100% 17,018 100% 35,519 100% 85,531 100% 270,947
In Labor Force * 10,061 54.6% 44,788 60.1% 26,710 67.0% 10,293 60.5% 23,066 64.9% 52,386 61.2% 167,304
Civilian Labor Force * 10,061 54.6% 44,628 59.9% 26,601 66.7% 10,285 60.4% 22,987 64.7% 52,181 61.0% 166,743
Employed * 9,292 50.4% 42,698 57.3% 24,824 62.2% 9,637 56.6% 20,915 58.9% 49,171 57.5% 156,537
Unemployed * 769 4.2% 1,930 2.6% 1,777 4.5% 648 3.8% 2,072 5.8% 3,010 3.5% 10,206
Armed Forces * 0 0.0% 160 0.2% 109 0.3% 8 0.0% 79 0.2% 205 0.2% 561
Not in Labor Force * 8,368 45.4% 29,771 39.9% 13,181 33.0% 6,725 39.5% 12,453 35.1% 33,145 38.8% 103,643
Transportation to Work
Workers 16 Years and Over * 8,980 100% 41,747 100% 24,308 100% 9,321 100% 20,134 100% 48,327 100% 152,817
Car, Truck, or Van -- Drove Alone * 7,168 79.8% 32,964 79.0% 21,274 87.5% 7,785 83.5% 17,098 84.9% 39,750 82.3% 126,039
Car, Truck, or Van -- Carpooled * 1,321 14.7% 5,355 12.8% 2,085 8.6% 1,029 11.0% 1,921 9.5% 4,555 9.4% 16,266
Public Transportation(excluding taxicab)* 95 1.1% 228 0.5% 110 0.5% 128 1.4% 106 0.5% 434 0.9% 1,101
Walked * 91 1.0% 560 1.3% 231 1.0% 162 1.7% 370 1.8% 780 1.6% 2,194
Other Means * 191 2.1% 1,530 3.7% 282 1.2% 121 1.3% 388 1.9% 1,867 3.9% 4,379
Worked at Home * 114 1.3% 1,110 2.7% 326 1.3% 96 1.0% 251 1.2% 941 1.9% 2,838
Health
HIV/AIDS 27
116
100
57
139
193
632
AIDS 15
73
51
33
74
113
359
Mental Illness 977
4,019
2,282
940
1,985
4,772
14,975
Substance Abuse
28,748 1
* = data obtained using the American Community Survey 5-year estimates
1 = Includes St. Mary Parish
= Louisiana Department Health and Hospitals
^ = Realty Trac
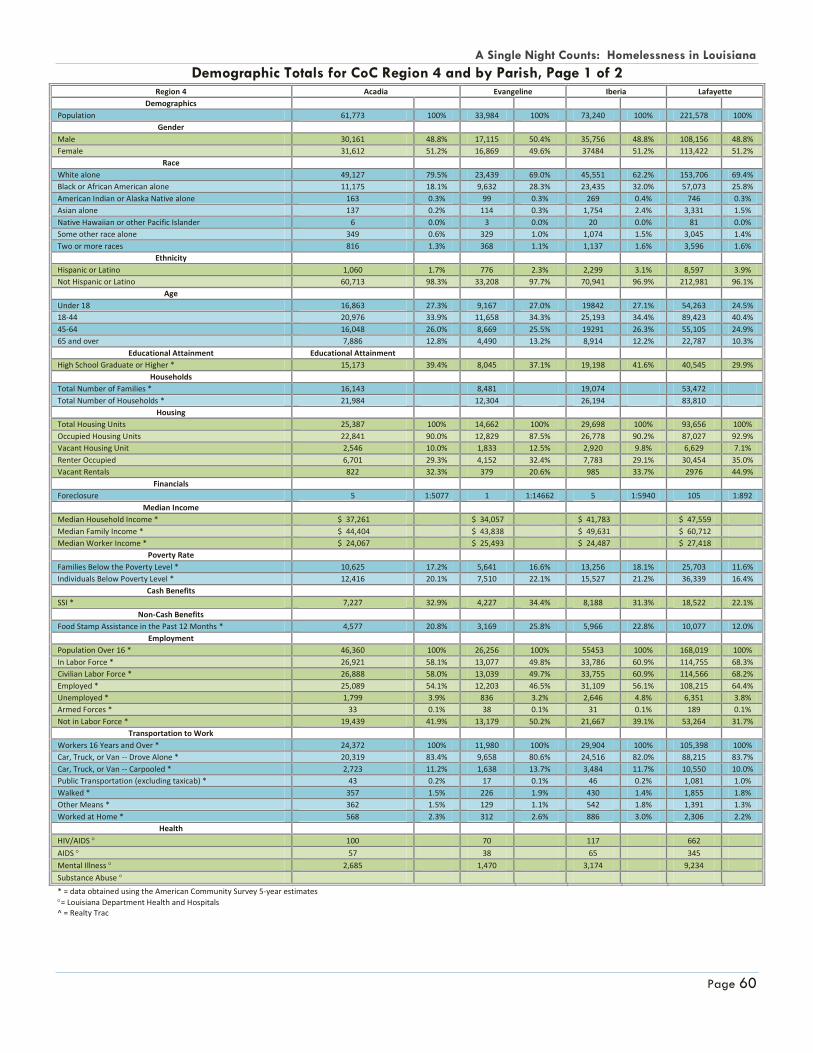
A Single Night Counts: Homelessness in Louisiana
Page 60
Demographic Totals for CoC Region 4 and by Parish, Page 1 of 2 Region 4 Acadia Evangeline Iberia Lafayette
Demographics
Population 61,773 100% 33,984 100% 73,240 100% 221,578 100%
Gender
Male 30,161 48.8% 17,115 50.4% 35,756 48.8% 108,156 48.8%
Female 31,612 51.2% 16,869 49.6% 37484 51.2% 113,422 51.2%
Race
White alone 49,127 79.5% 23,439 69.0% 45,551 62.2% 153,706 69.4%
Black or African American alone 11,175 18.1% 9,632 28.3% 23,435 32.0% 57,073 25.8%
American Indian or Alaska Native alone 163 0.3% 99 0.3% 269 0.4% 746 0.3%
Asian alone 137 0.2% 114 0.3% 1,754 2.4% 3,331 1.5%
Native Hawaiian or other Pacific Islander 6 0.0% 3 0.0% 20 0.0% 81 0.0%
Some other race alone 349 0.6% 329 1.0% 1,074 1.5% 3,045 1.4%
Two or more races 816 1.3% 368 1.1% 1,137 1.6% 3,596 1.6%
Ethnicity
Hispanic or Latino 1,060 1.7% 776 2.3% 2,299 3.1% 8,597 3.9%
Not Hispanic or Latino 60,713 98.3% 33,208 97.7% 70,941 96.9% 212,981 96.1%
Age
Under 18 16,863 27.3% 9,167 27.0% 19842 27.1% 54,263 24.5%
18-44 20,976 33.9% 11,658 34.3% 25,193 34.4% 89,423 40.4%
45-64 16,048 26.0% 8,669 25.5% 19291 26.3% 55,105 24.9%
65 and over 7,886 12.8% 4,490 13.2% 8,914 12.2% 22,787 10.3%
Educational Attainment Educational Attainment
High School Graduate or Higher * 15,173 39.4% 8,045 37.1% 19,198 41.6% 40,545 29.9%
Households
Total Number of Families * 16,143 8,481 19,074 53,472
Total Number of Households * 21,984 12,304 26,194 83,810
Housing
Total Housing Units 25,387 100% 14,662 100% 29,698 100% 93,656 100%
Occupied Housing Units 22,841 90.0% 12,829 87.5% 26,778 90.2% 87,027 92.9%
Vacant Housing Unit 2,546 10.0% 1,833 12.5% 2,920 9.8% 6,629 7.1%
Renter Occupied 6,701 29.3% 4,152 32.4% 7,783 29.1% 30,454 35.0%
Vacant Rentals 822 32.3% 379 20.6% 985 33.7% 2976 44.9%
Financials
Foreclosure 5 1:5077 1 1:14662 5 1:5940 105 1:892
Median Income
Median Household Income * $ 37,261 $ 34,057 $ 41,783 $ 47,559
Median Family Income * $ 44,404 $ 43,838 $ 49,631 $ 60,712
Median Worker Income * $ 24,067 $ 25,493 $ 24,487 $ 27,418
Poverty Rate
Families Below the Poverty Level * 10,625 17.2% 5,641 16.6% 13,256 18.1% 25,703 11.6%
Individuals Below Poverty Level * 12,416 20.1% 7,510 22.1% 15,527 21.2% 36,339 16.4%
Cash Benefits
SSI * 7,227 32.9% 4,227 34.4% 8,188 31.3% 18,522 22.1%
Non-Cash Benefits
Food Stamp Assistance in the Past 12 Months * 4,577 20.8% 3,169 25.8% 5,966 22.8% 10,077 12.0%
Employment
Population Over 16 * 46,360 100% 26,256 100% 55453 100% 168,019 100%
In Labor Force * 26,921 58.1% 13,077 49.8% 33,786 60.9% 114,755 68.3%
Civilian Labor Force * 26,888 58.0% 13,039 49.7% 33,755 60.9% 114,566 68.2%
Employed * 25,089 54.1% 12,203 46.5% 31,109 56.1% 108,215 64.4%
Unemployed * 1,799 3.9% 836 3.2% 2,646 4.8% 6,351 3.8%
Armed Forces * 33 0.1% 38 0.1% 31 0.1% 189 0.1%
Not in Labor Force * 19,439 41.9% 13,179 50.2% 21,667 39.1% 53,264 31.7%
Transportation to Work
Workers 16 Years and Over * 24,372 100% 11,980 100% 29,904 100% 105,398 100%
Car, Truck, or Van -- Drove Alone * 20,319 83.4% 9,658 80.6% 24,516 82.0% 88,215 83.7%
Car, Truck, or Van -- Carpooled * 2,723 11.2% 1,638 13.7% 3,484 11.7% 10,550 10.0%
Public Transportation (excluding taxicab) * 43 0.2% 17 0.1% 46 0.2% 1,081 1.0%
Walked * 357 1.5% 226 1.9% 430 1.4% 1,855 1.8%
Other Means * 362 1.5% 129 1.1% 542 1.8% 1,391 1.3%
Worked at Home * 568 2.3% 312 2.6% 886 3.0% 2,306 2.2%
Health
HIV/AIDS 100 70 117 662
AIDS 57 38 65 345
Mental Illness 2,685 1,470 3,174 9,234
Substance Abuse
* = data obtained using the American Community Survey 5-year estimates
= Louisiana Department Health and Hospitals ^ = Realty Trac

A Single Night Counts: Homelessness in Louisiana
Page 61
Demographic Totals for CoC Region 4 and by Parish, Page 2 of 2 Region 4 St. Landry St. Martin St. Mary Vermillion Total
Demographics
Population 83,384 100% 52,160 100% 54,650 100% 57,999 100% 638,768
Gender
Male 39,876 47.8% 25,697 49.3% 26,992 49.4% 28,214 48.6% 311,967
Female 43,508 52.2% 26,463 50.7% 27,658 50.6% 29,785 51.4% 326,801
Race
White alone 46,615 55.9% 34,313 65.8% 32,406 59.3% 46,922 81% 432,079
Black or African American alone 34,442 41.3% 16,039 30.7% 17,765 32.5% 8,286 14.3% 177,847
American Indian or Alaska Native alone 275 0.3% 222 0.4% 994 1.8% 209 0.4% 2,977
Asian alone 326 0.4% 397 0.8% 948 1.7% 1,160 2.0% 8,167
Native Hawaiian or other Pacific Islander 8 0.0% 3 0.0% 29 0.1% 5 0.0% 155
Some other race alone 662 0.8% 466 0.9% 1,433 2.6% 603 1.0% 7,961
Two or more races 1,056 1.3% 720 1.4% 1,075 2.0% 814 1.4% 9,582
Ethnicity
Hispanic or Latino 1,321 1.6% 1,071 2.1% 2,920 5.3% 1,381 2.4% 19,425
Not Hispanic or Latino 82,063 98.4% 51,089 97.9% 51,730 94.7% 56,618 97.6% 619,343
Age
Under 18 22,680 27.2% 13,771 26.4% 13,904 25.4% 15,477 26.7% 165,967
18-44 27,109 32.5% 18,239 35.0% 18,688 34.2% 19,821 34.2% 231,107
45-64 22,143 26.6% 14,064 27.0% 15,006 27.5% 15,193 26.2% 165,519
65 and over 11,452 13.7% 6,086 11.7% 7052 12.9% 7,508.00 12.9% 76,175
Educational Attainment
High School Graduate or Higher * 21,754 40.6% 14,151 42.7% 13,240 37.7% 16,947 46.0% 149,053
Households
Total Number of Families * 20,902 13,504 14,273 15,866 161,715
Total Number of Households * 30,082 18,931 20,054 21,786 235,145
Housing
Total Housing Units 35,692 100% 21,941 100% 23,028 100% 25,235 100% 269,299
Occupied Housing Units 31,857 89.3% 19,216 87.6% 20,457 88.8% 21,889 86.7% 242,894
Vacant Housing Unit 3,835 10.7% 2,725 12.4% 2,571 11.2% 3,346 13.3% 26,405
Renter Occupied 9,363 29.4% 3,914 20.4% 6,103 29.8% 5,250 24.0% 73,720
Vacant Rentals 808 21.1% 456 17% 665 25.9% 495 14.8% 7,586
Financials
Foreclosure 11 1:3245 6 1:3657 6 1:3838 13 1:1941 152
Median Income
Median Household Income * $ 31,813 $ 41,302 $ 40,431 $ 42,693 $ 39,612
Median Family Income * $ 41,610 $ 51,761 $ 46,628 $ 53,452 $ 49,005
Median Worker Income * $ 25,391 $ 25,407 $ 24,515 $ 26,198 $ 25,372
Poverty Rate
Families Below the Poverty Level * 19,845 23.8% 7,094 13.6% 9,892 18.1% 7,830 13.5% 99,886
Individuals Below Poverty Level * 23,598 28.3% 8,815 16.9% 11,477 21.0% 9,976 17.2% 125,658
Cash Benefits
SSI * 10,354 34.4% 5,645 29.8% 6,504 32.4% 6,972 32.0% 67,639
Non-Cash Benefits
Food Stamp Assistance in the Past 12 Months * 6,509 21.6% 3,237 17.1% 5,251 26.2% 3,929 18.0% 42,715
Employment
Population Over 16 * 63,951 100% 39,611 100% 42,013 100% 43,676 100% 485,339
In Labor Force * 34,260 53.6% 24,131 60.9% 25,876 61.6% 25,820 59.1% 298,626
Civilian Labor Force * 34,245 53.5% 24,055 60.7% 25,788 61.4% 25,806 59.1% 298,142
Employed * 31,998 50.0% 22,304 56.3% 24,046 57.2% 24,458 56.0% 279,422
Unemployed * 2,247 3.5% 1,751 4.4% 1,742 4.1% 1,348 3.1% 18,720
Armed Forces * 15 0.0% 76 0.2% 88 0.2% 14 0.0% 484
Not in Labor Force * 29,691 46.4% 15,480 39.1% 16,137 38.4% 17,856 40.9% 186,713
Transportation to Work
Workers 16 Years and Over * 31,146 100% 21,803 100% 23,506 100% 23,545 100% 271,654
Car, Truck, or Van -- Drove Alone * 26,258 84.3% 19,043 87.3% 18,445 78.5% 19,959 84.8% 226,413
Car, Truck, or Van -- Carpooled * 3,029 9.7% 1,800 8.3% 3,351 14.3% 2,149 9.1% 28,724
Public Transportation (excluding taxicab) * 0 0.0% 46 0.2% 73 0.3% 83 0.4% 1,389
Walked * 498 1.6% 318 1.5% 535 2.3% 320 1.4% 4,539
Other Means * 586 1.9% 240 1.1% 698 3.0% 388 1.6% 4,336
Worked at Home * 775 2.5% 356 1.6% 404 1.7% 646 2.7% 6,253
Health
HIV/AIDS 263 105 79 88 1,484
AIDS 152 61 50 54 822
Mental Illness 3,620 2,238 2,311 2,499 27,231
Substance Abuse 41,019 1
* = data obtained using the American Community Survey 5-year estimates = Louisiana Department Health and Hospitals
^ = Realty Trac

A Single Night Counts: Homelessness in Louisiana
Page 62
Demographic Totals for CoC Region 5 and by Parish, Page 1 of 1 Region 5 Allen Beauregard Calcasieu Cameron Jefferson Davis Total
Demographics
Population 25,764 100% 35,654 100% 192,768 100% 6,839 100% 31,594 100% 292,619
Gender
Male 14,490 56.2% 18,170 51.0% 94,038 48.8% 3,395 49.6% 15,467 49.0% 145,560
Female 11,274 43.8% 17,484 49.0% 98,730 51.2% 3,444 50.4% 16127 51.0% 147,059
Race
White alone 18,435 71.6% 29,321 82.2% 136,514 70.8% 6,546 95.7% 25,125 79.5% 215,941
Black or African American alone 5,985 23.2% 4,655 13.1% 47,782 24.8% 119 1.7% 5,468 17.3% 64,009
American Indian or Alaska Native alone 622 2.4% 356 1.0% 898 0.5% 36 0.5% 157 0.5% 2,069
Asian alone 176 0.7% 224 0.6% 2,073 1.1% 6 0.1% 62 0.2% 2,541
Native Hawaiian or other Pacific Islander 6 0.0% 17 0.0% 93 0.0% 0 0.0% 3 0.0% 119
Some other race alone 126 0.5% 220 0.6% 1,728 0.9% 58 0.8% 191 0.6% 2,323
Two or more races 414 1.6% 861 2.4% 3,680 1.9% 74 1.1% 588 1.9% 5,617
Ethnicity
Hispanic or Latino 342 1.3% 1,003 2.8% 4,945 2.6% 154 2.3% 538 1.7% 6,982
Not Hispanic or Latino 25,422 98.7% 34,651 97.2% 187,823 97.4% 6,685 97.7% 31,056 98.3% 285,637
Age
Under 18 5,894 22.9% 9,295 26.1% 49,012 25.4% 1,656 24.2% 8,398 26.6% 74,255
18-44 9,840 38.2% 12,488 35.0% 68,676 35.6% 2,235 32.6% 10,247 32.5% 103,486
45-64 6,702 26.0% 9,249 25.9% 50,754 26.3% 2,067 30.2% 8,364 26.5% 77,136
65 and over 3,328 12.9% 4,622.00 13.0% 24,326 12.6% 881 12.9% 4,585 14.5% 37,742
Educational Attainment
High School Graduate or Higher * 7,080 40.3% 9,667 42.4% 42,814 35.2% 2,305 46.9% 8,508 42.1% 70,374
Households
Total Number of Families * 6,012 9,583 49,405 2,078 8,392 75,470
Total Number of Households * 8,388 12,787 71,607 2,663 11,786 107,231
Housing
Total Housing Units 9,733 100% 15,040 100% 82,058 100% 3,593 100% 13,306 100% 123,730
Occupied Housing Units 8,516 87.5% 13,159 87.5% 73,996 90.2% 2,575 71.7% 11,771 88.5% 110,017
Vacant Housing Unit 1,217 12.5% 1,881 12.5% 8,062 9.8% 1,018 28.3% 1,535 11.5% 13,713
Renter Occupied 2,225 26.1% 2,857 21.7% 22,463 30.4% 315 12.2% 2,904 24.7% 30,764
Vacant Rentals 282 23.2% 263 13.9% 3147 39.0% 66 6.5% 336 21.8% 4,094
Financials
Foreclosure 2 1:4867 1 1:15040 71 1:1156 n/a n/a 5 1:2661 79
Median Income
Median Household Income * $ 36,926 $ 45,202 $ 43,758 $ 59,555 $ 42,907 $ 45,670
Median Family Income * $ 55,804 $ 63,183 $ 70,516 $ 72,390 $ 60,449 $ 64,468
Median Worker Income * $ 22,162 $ 27,967 $ 25,802 $ 27,349 $ 27,872 $ 26,230
Poverty Rate
% of Families Below the Poverty Level * 4,483 17.4% 4,706 13.2% 31,228 16.2% 793 11.6% 5,055 16.0% 46,266
% of Individuals Below Poverty Level * 4,174 16.2% 3,565 10.0% 23,518 12.2% 732 10.7% 3,981 12.6% 35,969
Cash Benefits
SSI * 2,685 32.0% 3,864 30.2% 21,040 29.4% 978 36.7% 4,185 35.5% 32,752
Non-Cash Benefits
Food Stamp Assistance in the Past 12 Months * 2,110 25.2% 2,498 19.5% 16,072 22.4% 389 14.6% 2,264 19.2% 23,333
Employment
Population Over 16 * 20,676 100% 26,681 100% 146,236 100% 5,710 100% 23,855 100% 223,158
In Labor Force * 9,536 46.1% 15,627 58.6% 92,126 63.0% 3,632 63.6% 13,531 56.7% 134,452
Civilian Labor Force * 9,527 46.1% 15,123 56.7% 92,007 62.9% 3,632 63.6% 13,531 56.7% 133,820
Employed * 8,975 43.4% 13,964 52.3% 84,909 58.1% 3,561 62.4% 12,514 52.5% 123,923
Unemployed * 552 2.7% 1,159 4.3% 7,098 4.9% 71 1.2% 1,017 4.3% 9,897
Armed Forces * 9 0.0% 504 1.9% 119 0.1% 0 0.0% 0 0.0% 632
Not in Labor Force * 11,140 53.9% 11,054 41.4% 54,110 37.0% 2,078 36.4% 10,324 43.3% 88,706
Transportation to Work
Workers 16 Years and Over * 8,788 100% 14,085 100% 82,711 100% 3,428 100% 12,082 100% 121,094
Car, Truck, or Van -- Drove Alone * 7,085 80.6% 11,272 80.0% 68,617 83.0% 2,491 72.7% 10,086 83.5% 99,551
Car, Truck, or Van -- Carpooled * 1,130 12.9% 1,884 13.4% 9,579 11.6% 663 19.3% 1,277 10.6% 14,533
Public Transportation (excluding taxicab) * 10 0.1% 57 0.4% 268 0.3% 26 0.8% 63 0.5% 424
Walked * 250 2.8% 172 1.2% 1,351 1.6% 107 3.1% 142 1.2% 2,022
Other Means * 120 1.4% 328 2.3% 1,356 1.6% 78 2.3% 349 2.9% 2,231
Worked at Home * 193 2.2% 372 2.6% 1,540 1.9% 63 1.8% 165 1.4% 2,333
Health
HIV/AIDS 234 44 673 3 61 1,015
AIDS 118 29 386 2 37 572
Mental Illness 1,047 1,522 8,149 284 1,389 12,391
Substance Abuse 20,693
* = data obtained using the American Community Survey 5-year estimates
= Louisiana Department Health and Hospitals ^ = Realty Trac

A Single Night Counts: Homelessness in Louisiana
Page 63
Demographic Totals for CoC Region 6 and by Parish, Page 1 of 2 Region 6 Avoyelles Catahoula Concordia Grant
Demographics
Population 42,073 100% 10,407 100% 20,822 100% 22,309 100%
Gender
Male 21,097 50.1% 5,505 52.9% 10,474 50.3% 12,491 56.0%
Female 20,976 49.9% 4,902 47.1% 10,348 49.7% 9,818 44.0%
Race
White alone 28,188 67.0% 6,985 67.1% 11,959 57.4% 18,149 81.4%
Black or African American alone 12,398 29.5% 3,280 31.5% 8,513 40.9% 3,470 15.6%
American Indian or Alaska Native alone 503 1.2% 34 0.3% 65 0.3% 228 1.0%
Asian alone 141 0.3% 3 0.0% 49 0.2% 59 0.3%
Native Hawaiian or other Pacific Islander 3 0.0% 0 0.0% 4 0.0% 8 0.0%
Some other race alone 158 0.4% 29 0.3% 53 0.3% 43 0.2%
Two or more races 682 1.6% 76 0.7% 179 0.9% 352 1.6%
Ethnicity
Hispanic or Latino 606 1.4% 90 0.9% 209 1.0% 931 4.2%
Not Hispanic or Latino 41,467 98.6% 10,317 99.1% 20,613 99.0% 21,378 95.8%
Age
Under 18 10,283 24.4% 2,350 22.6% 5,233 25.1% 5,151 23.1%
18-44 14,546 34.6% 3,611 34.7% 6,965 33.4% 8,715 39.0%
45-64 11,169 26.5% 2,943 28.3% 5,598 26.9% 5,753 25.8%
65 and over 6,075 14.4% 1,503 14.4% 3,026 14.5% 2,690 12.1%
Educational Attainment
High School Graduate or Higher * 10,468 37.5% 2,787 39.5% 5,001 37.5% 6,213 42.6%
Households
Total Number of Families * 11,055 2,825 5036 5296
Total Number of Households * 15,767 3,794 7,570 7,407
Housing
Total Housing Units 18,042 100% 4,877 100% 9,383 100% 8,886 100%
Occupied Housing Units 15,432 85.5% 3,834 78.6% 7,613 81.1% 7,496 84.4%
Vacant Housing Unit 2,610 14.5% 1,043 21.4% 1,770 18.9% 1,390 15.6%
Renter Occupied 4,307 27.9% 797 20.8% 2,087 27.4% 1,568 20.9%
Vacant Rentals 343 13.1% 70 6.7% 156 8.8% 144 10.3%
Financials
Foreclosure 1 1:18042 n/a n/a 1 1:9383 n/a n/a
Median Income
Median Household Income * $ 31,412 $ 36,398 $ 30,062 $ 40,092
Median Family Income * $ 38,738 $ 41,283 $ 37,724 $ 46,357
Median Worker Income * $ 22,280 $ 19,710 $ 18,481 $ 25,016
Poverty Rate
% of Families Below the Poverty Level * 7,699 18.3% 2,040 19.6% 5,185 24.9% 2,900 13.0%
% of Individuals Below Poverty Level * 9,761 23.2% 2,560 24.6% 6,413 30.8% 3,592 16.1%
Cash Benefits
SSI * 5,629 35.7% 1,347 35.5% 2,748 36.3% 2,305 31.1%
Non-Cash Benefits
Food Stamp Assistance in the Past 12 Months * 4,341 27.5% 874 23.0% 1,404 18.5% 1,128 15.2%
Employment
Population Over 16 * 32,983 100% 8,310 100% 16051 100% 17,072 100%
In Labor Force * 17,100 51.8% 4,144 49.9% 8,714 54.3% 9,076 53.2%
Civilian Labor Force * 17,034 51.6% 4,144 49.9% 8,714 54.3% 9,032 52.9%
Employed * 15,432 46.8% 3,636 43.8% 7,191 44.8% 8,438 49.4%
Unemployed * 1,602 4.9% 508 6.1% 1,523 9.5% 594 3.5%
Armed Forces * 66 0.2% 0 0.0% 0 0.0% 44 0.3%
Not in Labor Force * 15,883 48.2% 4,166 50.1% 7,337 45.7% 7,996 46.8%
Transportation to Work
Workers 16 Years and Over * 15,140 100% 3,506 100% 6,971 100% 8,203 100%
Car, Truck, or Van -- Drove Alone * 11,450 75.6% 2,337 66.7% 5,668 81.3% 7,092 86.5%
Car, Truck, or Van -- Carpooled * 2,869 18.9% 811 23.1% 802 11.5% 732 8.9%
Public Transportation (excluding taxicab) * 23 0.2% 0 0.0% 16 0.2% 40 0.5%
Walked * 290 1.9% 88 2.5% 259 3.7% 74 0.9%
Other Means * 108 0.7% 112 3.2% 157 2.3% 163 2.0%
Worked at Home * 400 2.6% 158 4.5% 69 1.0% 102 1.2%
Health
HIV/AIDS 139 25 44 29
AIDS 73 15 20 16
Mental Illness 1,752 421 876 910
Substance Abuse
* = data obtained using the American Community Survey 5-year estimates
= Louisiana Department Health and Hospitals ^ = Realty Trac

A Single Night Counts: Homelessness in Louisiana
Page 64
Demographic Totals for CoC Region 6 and by Parish, Page 2 of 2 Region 6 Lasalle Rapides Vernon Winn Total
Demographics
Population 14,890 100% 131,613 100% 52,334 100% 15,313 100% 309,761
Gender
Male 7,665 51.5% 63,481 48.2% 26,784 51.2% 8,031 52.4% 155,528
Female 7,225 48.5% 68,132 51.8% 25,550 48.8% 7,282 47.6% 154,233
Race
White alone 12,689 85.2% 83,373 63.3% 39,614 75.7% 10,223 66.8% 211,180
Black or African American alone 1,769 11.9% 42,113 32.0% 7,443 14.2% 4,702 30.7% 83,688
American Indian or Alaska Native alone 152 1.0% 1,035 0.8% 738 1.4% 100 0.7% 2,855
Asian alone 28 0.2% 1,559 1.2% 919 1.8% 39 0.3% 2,797
Native Hawaiian or other Pacific Islander 2 0.0% 36 0.0% 260 0.5% 2 0.0% 315
Some other race alone 107 0.7% 1,286 1.0% 1,237 2.4% 76 0.5% 2,989
Two or more races 143 1.0% 2,211 1.7% 2,123 4.1% 171 1.1% 5,937
Ethnicity
Hispanic or Latino 331 2.2% 3,418 2.6% 3,775 7.2% 240 1.6% 9,600
Not Hispanic or Latino 14,559 97.8% 128,195 97.4% 48,559 92.8% 15,073 98.4% 300,161
Age
Under 18 3,524 23.7% 34,014 25.8% 14,512 27.7% 3,442 22.5% 78,509
18-44 5,299 35.6% 44,889 34.2% 22,496 43.0% 5,366 35.1% 111,887
45-64 3,864 26.0% 34,698 26.4% 10,397 19.9% 4,304 28.1% 78,726
65 and over 2,203 14.8% 18,012 13.7% 4,929 9.4% 2,201 14.4% 40,639
Educational Attainment
High School Graduate or Higher * 4,020 41.0% 29,787 35.1% 11,630 39.2% 4,561 42.7% 74,467
Households
Total Number of Families * 3,911 33,030 13240 3617 78,010
Total Number of Households * 5,245 48,127 18,032 5,462 111,404
Housing
Total Housing Units 6,560 100% 55,684 100% 21,433 100% 7,234 100% 132,099
Occupied Housing Units 5,468 83.4% 50,401 90.5% 19,165 89.4% 5,469 75.6% 114,878
Vacant Housing Unit 1,092 16.6% 5,283 9.5% 2,268 10.6% 1,765 24.4% 17,221
Renter Occupied 1,063 19.4% 17,369 34.5% 8,470 44.2% 1,470 26.9% 37,131
Vacant Rentals 93 8.6% 1695 32.1% 626 27.6% 218 12.3% 3,345
Financials
Foreclosure n/a n/a 7 1:7955 n/a n/a 1 1:7234 10
Median Income
Median Household Income * $ 37,572 $ 40,658 $ 42,554 $ 32,039 $ 36,348
Median Family Income * $ 49,550 $ 51,487 $ 47,954 $ 40,975 $ 44,259
Median Worker Income * $ 26,505 $ 24,119 $ 25,372 $ 22,379 $ 22,983
Poverty Rate
% of Families Below the Poverty Level * 1,936 13.0% 23,822 18.1% 7,850 15.0% 3,629 23.7% 55,061
% of Individuals Below Poverty Level * 1,623 10.9% 18,163 13.8% 6,385 12.2% 2,664 17.4% 51,161
Cash Benefits
SSI * 2,191 41.8% 14,921 31.0% 4,307 23.9% 1,934 35.4% 35,382
Non-Cash Benefits
Food Stamp Assistance in the Past 12 Months * 611 11.6% 7,206 15.0% 2,706 15.0% 1,178 21.6% 19,448
Employment
Population Over 16 * 11,569 100% 100,796 100% 37,897 100% 12,396 100% 237,074
In Labor Force * 5,918 51.2% 59,841 59.4% 24,721 65.2% 5,682 45.8% 135,196
Civilian Labor Force * 5,904 51.0% 59,531 59.1% 18,879 49.8% 5,682 45.8% 128,920
Employed * 5,522 47.7% 55,529 55.1% 17,429 46.0% 5,199 41.9% 118,376
Unemployed * 382 3.3% 4,002 4.0% 1,450 3.8% 483 3.9% 10,544
Armed Forces * 14 0.1% 310 0.3% 5,842 15.4% 0 0.0% 6,276
Not in Labor Force * 5,651 48.8% 40,955 40.6% 13,176 34.8% 6,714 54.2% 101,878
Transportation to Work
Workers 16 Years and Over * 5,264 100% 53,921 100% 22,541 100% 5,068 100% 120,614
Car, Truck, or Van -- Drove Alone * 4,447 84.5% 44,550 82.6% 17,459 77.5% 4,249 83.8% 97,252
Car, Truck, or Van -- Carpooled * 476 9.0% 5,803 10.8% 2,990 13.3% 631 12.5% 15,114
Public Transportation (excluding taxicab) * 2 0.0% 515 1.0% 53 0.2% 8 0.2% 657
Walked * 50 0.9% 1,494 2.8% 1,159 5.1% 51 1.0% 3,465
Other Means * 191 3.6% 887 1.6% 544 2.4% 106 2.1% 2,268
Worked at Home * 98 1.9% 672 1.2% 336 1.5% 23 0.5% 1,858
Health
HIV/AIDS 18 417 58 54 784
AIDS 10 203 28 30 395
Mental Illness 613 5,599 2,289 618 13,078
Substance Abuse 21,853
* = data obtained using the American Community Survey 5-year estimates
= Louisiana Department Health and Hospitals ^ = Realty Trac

A Single Night Counts: Homelessness in Louisiana
Page 65
Demographic Totals for CoC Region 7 and by Parish, Page 1 of 2 Region 7 Bienville Bossier Caddo Claiborne
Demographics
Population 14,353 100% 116,979 100% 254,969 100% 17,195 100%
Gender
Male 6,921 48.2% 57,511 49.2% 121,191 47.5% 9,611 55.9%
Female 7,432 51.8% 59,468 50.8% 133,778 52.5% 7,584 44.1%
Race
White alone 7,935 55.3% 84,430 72.2% 124,942 49.0% 8,167 47.5%
Black or African American alone 6,076 42.3% 24,461 20.9% 120,264 47.2% 8,733 50.8%
American Indian or Alaska Native alone 50 0.3% 641 0.5% 1,092 0.4% 63 0.4%
Asian alone 34 0.2% 1,927 1.6% 2,683 1.1% 41 0.2%
Native Hawaiian or other Pacific Islander 0 0.0% 163 0.1% 126 0.0% 1 0.0%
Some other race alone 82 0.6% 2,805 2.4% 2,104 0.8% 46 0.3%
Two or more races 176 1.2% 2,552 2.2% 3,758 1.5% 144 0.8%
Ethnicity
Hispanic or Latino 207 1.4% 7,026 6.0% 6,129 2.4% 171 1.0%
Not Hispanic or Latino 14,146 98.6% 109,953 94.0% 248,840 97.6% 17,024 99.0%
Age
Under 18 3,341 23.3% 30,034 25.7% 62,654 24.6% 3,380 19.7%
18-44 4,408 30.7% 44,064 37.6% 90,807 35.7% 6,271 36.5%
45-64 3,953 27.5% 28,855 24.7% 66,865 26.2% 4,790 27.9%
65 and over 2,651 18.5% 14,026 12.0% 34,643 13.6% 2,754 16.0%
Educational Attainment
High School Graduate or Higher * 4,177 42.7% 24,636 33.8% 57,373 34.9% 4,774 40%
Households
Total Number of Families * 3,838 29,211 61,035 3,945
Total Number of Households * 5,689 43,186 97,293 5,890
Housing
Total Housing Units 7,718 100% 49,351 100% 112,028 100% 7,761 100%
Occupied Housing Units 5,838 75.6% 45,215 91.6% 102,139 91.2% 6,017 77.5%
Vacant Housing Unit 1,880 24.4% 4,136 8.4% 9,889 8.8% 1,744 22.5%
Renter Occupied 1,477 25.3% 15,002 33.2% 38,941 38.1% 1,538 25.6%
Vacant Rentals 252 13.4% 1378 34.3% 3391 34.3% 186 10.7%
Financials
Foreclosure n/a n/a 21 1:2350 132 1:849 n/a n/a
Median Income
Median Household Income * $ 31,870 $ 51,020 $ 37,181 $ 32,292
Median Family Income * $ 40,396 $ 62,700 $ 49,189 $ 40,705
Median Worker Income * $ 23,225 $ 28,697 $ 24,384 $ 21,046
Poverty Rate
% of Families Below the Poverty Level * 2,985 20.8% 12,166 10.4% 39,010 15.3% 3,714 21.6%
% of Individuals Below Poverty Level * 3,818 26.6% 15,675 13.4% 52,014 20.4% 4,608 26.8%
Cash Benefits
SSI * 2,018 35.5% 10,790 25.0% 28,607 29.4% 1,981 33.6%
Non-Cash Benefits
Food Stamp Assistance in the Past 12 Months * 1,111 19.5% 4,703 10.9% 14,278 14.7% 1,224 20.8%
Employment
Population Over 16 * 11,600 100% 87,618 100% 197,481 100% 14,080 100%
In Labor Force * 5,731 49.4% 59,947 68.4% 121,126 61.3% 7,718 54.8%
Civilian Labor Force * 5,704 49.2% 56,800 64.8% 120,146 60.8% 7,718 54.8%
Employed * 5,277 45.5% 52,655 60.1% 108,929 55.2% 6,549 46.5%
Unemployed * 427 3.7% 4,145 4.7% 11,217 5.7% 1,169 8.3%
Armed Forces * 27 0.2% 3,147 3.6% 980 0.5% 0 0.0%
Not in Labor Force * 5,869 50.6% 27,671 31.6% 76,355 38.7% 6,362 45.2%
Transportation to Work
Workers 16 Years and Over * 5,066 100% 54,898 100% 106,958 100% 6,345 100%
Car, Truck, or Van -- Drove Alone * 4,102 81.0% 47,104 85.8% 88,384 82.6% 5,304 83.6%
Car, Truck, or Van -- Carpooled * 636 12.6% 3,902 7.1% 9,967 9.3% 564 8.9%
Public Transportation (excluding taxicab) * 19 0.4% 151 0.3% 2,605 2.4% 4 0.1%
Walked * 77 1.5% 1,003 1.8% 2,031 1.9% 101 1.6%
Other Means * 70 1.4% 1,595 2.9% 2,071 1.9% 207 3.3%
Worked at Home * 162 3.2% 1,143 2.1% 1,900 1.8% 165 2.6%
Health
HIV/AIDS 29 163 967 61
AIDS 15 84 501 35
Mental Illness 587 4,964 10,639 663
Substance Abuse
* = data obtained using the American Community Survey 5-year estimates
= Louisiana Department Health and Hospitals ^ = Realty Trac

A Single Night Counts: Homelessness in Louisiana
Page 66
Demographic Totals for CoC Region 7 and by Parish, Page 2 of 2 Region 7 De Soto Natchitoches Red River Sabine Webster Total
Demographics
Population 26,656 100% 39,566 100% 9,091 100% 24,233 100% 41,207 100% 544,249
Gender
Male 12,862 48.3% 18,861 47.7% 4,350 47.8% 12,009 49.6% 20,041 48.6% 263,357
Female 13,794 51.7% 20,705 52.3% 4,741 52.2% 12,224 50.4% 21,166 51.4% 280,892
Race
White alone 15,456 58.0% 21,494 54.3% 5,360 59.0% 17,155 70.8% 26,469 64.2% 311,408
Black or African American alone 10,449 39.2% 16,362 41.4% 3,595 39.5% 4,026 16.6% 13,823 33.5% 207,789
American Indian or Alaska Native alone 204 0.8% 376 1.0% 33 0.4% 2,082 8.6% 150 0.4% 4,691
Asian alone 42 0.2% 134 0.3% 12 0.1% 56 0.2% 120 0.3% 5,049
Native Hawaiian or other Pacific Islander 11 0.0% 11 0.0% 2 0.0% 0 0.0% 8 0.0% 322
Some other race alone 186 0.7% 344 0.9% 31 0.3% 100 0.4% 156 0.4% 5,854
Two or more races 308 1.2% 845 2.1% 58 0.6% 814 3.4% 481 1.2% 9,136
Ethnicity
Hispanic or Latino 661 2.5% 735 1.9% 101 1.1% 820 3.4% 670 1.6% 16,520
Not Hispanic or Latino 25,995 97.5% 38,831 98.1% 8,990 98.9% 23,413 96.6% 40,537 98.4% 527,729
Age
Under 18 6,650 24.9% 9,600 24.3% 2,313 25.4% 5,922 24.4% 9,710 23.6% 133,604
18-44 8,452 31.8% 15,166 38.4% 2,926 32.2% 7,474 30.9% 13,227 32.1% 192795
45-64 7,706 28.9% 9,471 23.9% 2,466 27.1% 6,658 27.5% 11,376 27.6% 142,140
65 and over 3,848 14.4% 5,329 13.5% 1,386 15.2% 4,179 17.2% 6,894 16.7% 75,710
Educational Attainment
High School Graduate or Higher * 7246 41.4% 8,343 35.8% 2,309 38.9% 7,316 45.4% 10,958 39.5% 127,132
Households
Total Number of Families * 6,949 9,574 2,379 6,540 11,473 134,944
Total Number of Households * 10,121 14,847 3,203 9,446 16,565 206,240
Housing
Total Housing Units 12,290 100% 18,587 100% 4,128 100% 14,130 100% 19,336 100% 245,329
Occupied Housing Units 10,562 85.9% 15,614 84.0% 3,472 84.1% 9,622 68.1% 16,537 85.5% 215,016
Vacant Housing Unit 1,728 14.1% 2,973 16.0% 656 15.9% 4,508 31.9% 2,799 14.5% 30,313
Renter Occupied 2,598 24.6% 5,986 38.3% 815 23.5% 2,078 21.6% 4,833 29.2% 73,268
Vacant Rentals 227 13.1% 741 24.9% 221 33.7% 259 5.7% 579 20.7% 7234
Financials
Foreclosure n/a n/a 9 1:2065 n/a n/a 2 1:7065 1 1:19336 165
Median Income
Median Household Income * $ 38,007 $ 30,326 $ 34,723 $ 35,395 $ 35,999 $ 36,313
Median Family Income * $ 49,792 $ 42,149 $ 43,058 $ 45,913 $ 44,737 $ 46,515
Median Worker Income * $ 24,518 $ 20,159 $ 23,003 $ 24,947 $ 23,317 $ 23,700
% of Families Below the Poverty Level * 4,265 16.0% 8,625 21.8% 1,764 19.4% 3,902 16.1% 7,088 17.2% 83,519
% of Individuals Below Poverty Level * 5,411 20.3% 11,316 28.6% 1,955 21.5% 5,016 20.7% 8,860 21.5% 108,672
Cash Benefits
SSI * 3,461 34.2% 4,562 30.7% 1,155 36.1% 3,600 38.1% 5,572 33.6% 61,746
Non-Cash Benefits
Food Stamp Assistance in the Past 12 Months * 1513 14.9% 3,548 23.9% 539 16.8% 1,876 19.9% 2,942 17.8% 31,734
Employment
Population Over 16 * 20,634 100% 30,681 100% 7,096 100% 18,854 100% 32,676 100% 420,720
In Labor Force * 12,512 60.6% 17,605 57.4% 3,883 54.7% 9,940 52.7% 18,419 56.4% 256,881
Civilian Labor Force * 12,487 60.5% 17,554 57.2% 3,883 54.7% 9,930 52.7% 18,410 56.3% 252,632
Employed * 11,248 54.5% 15,722 51.2% 3,496 49.3% 9,147 48.5% 16,615 50.8% 229,638
Unemployed * 1,239 6.0% 1,832 6.0% 387 5.5% 783 4.2% 1,795 5.5% 22,994
Armed Forces * 25 0.1% 51 0.2% 0 0.0% 10 0.1% 9 0.0% 4249
Not in Labor Force * 8,122 39.4% 13,076 42.6% 3,213 45.3% 8,914 47.3% 14,257 43.6% 163,839
Transportation to Work
Workers 16 Years and Over * 11,007 100% 15,290 100% 3,367 100% 8,868 100% 15,982 100% 227,781
Car, Truck, or Van -- Drove Alone * 9,198 83.6% 12,129 79.3% 2,775 82.4% 6,875 77.5% 13,469 84.3% 189,340
Car, Truck, or Van -- Carpooled * 1,327 12.1% 2,100 13.7% 396 11.8% 1,208 13.6% 1,159 7.3% 21,259
Public Transportation (excluding taxicab) * 74 0.7% 65 0.4% 35 1.0% 25 0.3% 13 0.1% 2,991
Walked * 87 0.8% 357 2.3% 30 0.9% 148 1.7% 246 1.5% 4,080
Other Means * 84 0.8% 239 1.6% 68 2.0% 243 2.7% 762 4.8% 5,339
Worked at Home * 237 2.2% 400 2.6% 63 1.9% 369 4.2% 333 2.1% 4,772
Health
HIV/AIDS 56 115 9 21 58 1,479
AIDS 33 59 7 16 25 775
Mental Illness 1,119 1,643 384 1,009 1,693 22,701
Substance Abuse 38,668
* = data obtained using the American Community Survey 5-year estimates
= Louisiana Department Health and Hospitals ^ = Realty Trac

A Single Night Counts: Homelessness in Louisiana
Page 67
Demographic Totals for CoC Region 8 and by Parish, Page 1 of 3 Region 8 Caldwell East Carroll Franklin Jackson
Demographics
Population 10132 1 7759 1 20767 1 16274 1
Gender
Male 5188 1 4154 1 10072 0 8273 1
Female 4944 0 3605 0 10695 1 8001 0
Race
White alone 8213 1 2245 0 13930 1 11084 1
Black or African American alone 1746 0 5356 1 6537 0 4853 0
American Indian or Alaska Native alone 22 0 19 0 37 0 35 0
Asian alone 25 0 44 0 42 0 28 0
Native Hawaiian or other Pacific Islander 0 0 0 0 6 0 2 0
Some other race alone 36 0 37 0 53 0 79 0
Two or more races 90 0 58 0 162 0 193 0
Ethnicity
Hispanic or Latino 222 0 127 0 196 0 209 0
Not Hispanic or Latino 9910 1 7632 1 20571 1 16065 1
Age
Under 18 2374 0 1993 0 5317 0 3704 0
18-44 3404 0 2882 0 6561 0 5521 0
45-64 2850 0 1913 0 5501 0 4332 0
65 and over 1504 0 971 0 3388 0 2717 0
Educational Attainment
High School Graduate or Higher * 2878 0 1902 0 5195 0 4498 0
Households
Total Number of Families * 2382 1663 5484 4252
Total Number of Households * 3651 2426 7844 5967
Housing
Total Housing Units 4994 1 2904 1 9034 1 7680 1
Occupied Housing Units 3905 1 2552 1 7904 1 6261 1
Vacant Housing Unit 1089 0 352 0 1130 0 1419 0
Renter Occupied 880 0 941 0 2096 0 1670 0
Vacant Rentals 151 0 68 0 231 0 129 0
Financials
Foreclosure n/a n/a n/a n/a 1 1:9034 n/a n/a
Median Income
Median Household Income * $37,423 $24,038 $32,311 $40,674
Median Family Income * $46,144 $26,230 $39,783 $50,052
Median Worker Income * $24,781 $15,462 $19,244 $24,187
Poverty Rate
% of Families Below the Poverty Level * 1,641 16.2% 2,514 32.4% 4,859 23.4% 1,969 12.1%
% of Individuals Below Poverty Level * 2,219 21.9% 3,166 40.8% 6,085 29.3% 2,539 15.6%
Cash Benefits
SSI * 1188 0 837 0 2695 0 2116 0
Non-Cash Benefits
Food Stamp Assistance in the Past 12 Months * 540 0 592 0 1970 0 807 0
Employment
Population Over 16 * 8056 1 6022 1 15974 1 12771 1
In Labor Force * 4213 1 2434 0 8649 1 7269 1
Civilian Labor Force * 4213 1 2422 0 8649 1 7222 1
Employed * 3859 0 2088 0 7529 0 6640 1
Unemployed * 354 0 334 0 1120 0 582 0
Armed Forces * 0 0 12 0 0 0 47 0
Not in Labor Force * 3843 0 3588 1 7325 0 5502 0
Transportation to Work
Workers 16 Years and Over * 3680 1 2041 1 7313 1 6527 1
Car, Truck, or Van -- Drove Alone * 3078 1 1649 1 5433 1 5480 1
Car, Truck, or Van -- Carpooled * 398 0 320 0 1309 0 699 0
Public Transportation (excluding taxicab) * 0 0 0 0 0 0 2 0
Walked * 93 0 20 0 245 0 49 0
Other Means * 65 0 17 0 120 0 192 0
Worked at Home * 46 0 35 0 206 0 105 0
Health
HIV/AIDS 18 30 29 38
AIDS 10 18 10 24
Mental Illness 415 329 380 660
Substance Abuse
* = data obtained using the American Community Survey 5-year estimates
= Louisiana Department Health and Hospitals ^ = Realty Trac

A Single Night Counts: Homelessness in Louisiana
Page 68
Demographic Totals for CoC Region 8 and by Parish, Page 2 of 3 Region 8 Lincoln Madison Morehouse Ouachita Richland
Demographics
Population 46,735 100% 12,093 100% 27,979 100% 153,720 100% 20,725 100%
Gender
Male 22,820 48.8% 5,986 49.5% 13,397 47.9% 73,530 47.8% 9,984 48.2%
Female 23,915 51.2% 6,107 50.5% 14,582 52.1% 80,190 52.2% 10,741 51.8%
Race
White alone 25,775 55.2% 4,498 37.2% 14,345 51% 92,884 60% 12,879 62.1%
Black or African American alone 18,925 40.5% 7,381 61.0% 13,133 46.9% 56,216 36.6% 7,454 36.0%
American Indian or Alaska Native alone 123 0.3% 24 0.2% 36 0.1% 381 0.2% 64 0.3%
Asian alone 790 1.7% 27 0.2% 102 0.4% 1,455 0.9% 55 0.3%
Native Hawaiian or other Pacific Islander 34 0.1% 0 0.0% 14 0.1% 51 0.0% 4 0.0%
Some other race alone 585 1.3% 52 0.4% 75 0.3% 993 0.6% 79 0.4%
Two or more races 503 1.1% 111 0.9% 274 1.0% 1,740 1.1% 190 0.9%
Ethnicity
Hispanic or Latino 1,189 2.5% 188 1.6% 255 0.9% 2,760 1.8% 332 1.6%
Not Hispanic or Latino 45,546 97.5% 11,905 98.4% 27,724 99.1% 150,960 98.2% 20,393 98.4%
Age
Under 18 9,605 20.6% 3,022 25.0% 6,918 24.7% 40,373 26.3% 5,285 25.5%
18-44 22,168 47.5% 4,544 37.6% 9,009 32.2% 56,947 37.0% 6,903 33.3%
45-64 9,658 20.7% 3,093 25.6% 7,742 27.7% 37,480 24.4% 5,553 26.8%
65 and over 5,286 11.3% 1,434 11.9% 4,310 15.4% 18,920 12.3% 2,984 14.4%
Educational Attainment
High School Graduate or Higher * 6,667 26.6% 3,490 44.3% 7,885 41.8% 32,090 33.7% 5,188 38.1%
Households
Total Number of Families * 9,843 2,523 7,076 37,691 5,355
Total Number of Households * 16,248 3,973 10,282 56,192 7,417
Housing
Total Housing Units 19,479 100% 4,804 100% 12,423 100% 64,481 100% 8,621 100%
Occupied Housing Units 17,599 90.3% 4,025 83.8% 10,853 87.4% 58,691 91.0% 7,551 87.6%
Vacant Housing Unit 1,880 9.7% 779 16.2% 1,570 12.6% 5,790 9.0% 1,070 12.4%
Renter Occupied 7,664 43.5% 1,554 38.6% 3,412 31.4% 22,767 38.8% 2,214 29.3%
Vacant Rentals 523 27.8% 183 23.5% 255 16.2% 2169 37.4% 153 14.3%
Financials
Foreclosure 1 1:19479 n/a n/a 1 1: 12423 65 1: 992 n/a n/a
Median Income
Median Household Income * $ 35,247 $ 26,441 $ 31,781 $ 39,823 $ 48,171
Median Family Income * $ 48,407 $ 38,788 $ 39,822 $ 50,003 $ 54,419
Median Worker Income * $ 16,602 $ 21,089 $ 21,847 $ 25,504 $ 23,139
Poverty Rate
% of Families Below the Poverty Level * 8,646 18.5% 3,035 25.1% 6,099 21.8% 26,440 17.2% 3,192 15.4%
% of Individuals Below Poverty Level * 12,338 26.4% 4,063 33.6% 7,666 27.4% 32,281 21.0% 4,207 20.3%
Cash Benefits
SSI * 3,885 23.9% 1,175 29.6% 3,498 34.0% 15,034 26.8% 2,428 32.7%
Non-Cash Benefits
Food Stamp Assistance in the Past 12 Months * 2,633 16.2% 641 16.1% 2,076 20.2% 7,413 13.2% 1,192 16.1%
Employment
Population Over 16 * 37,400 100% 9,456 100% 22,102 100% 116,767 100% 15,973 100%
In Labor Force * 21,809 58.3% 4,381 46.3% 11,350 51.4% 72,129 61.8% 9,112 57.0%
Civilian Labor Force * 21,656 57.9% 4,381 46.3% 11,341 51.3% 71,991 61.7% 9,091 56.9%
Employed * 19,002 50.8% 3,784 40.0% 10,071 45.6% 66,956 57.3% 7,875 49.3%
Unemployed * 2,654 7.1% 597 6.3% 1,270 5.7% 5,035 4.3% 1,216 7.6%
Armed Forces * 153 0.4% 0 0.0% 9 0.0% 138 0.1% 21 0.1%
Not in Labor Force * 15,591 41.7% 5,075 53.7% 10,752 48.6% 44,638 38.2% 6,861 43.0%
Transportation to Work
Workers 16 Years and Over * 18,452 100% 3,746 100% 9,804 100% 65,613 100% 7,692 100%
Car, Truck, or Van -- Drove Alone * 14,406 78.1% 3,049 81.4% 8,417 85.9% 56,536 86.2% 6,382 83.0%
Car, Truck, or Van -- Carpooled * 2,411 13.1% 347 9.3% 878 9.0% 5,553 8.5% 978 12.7%
Public Transportation (excluding taxicab) * 14 0.1% 5 0.1% 36 0.4% 921 1.4% 0 0.0%
Walked * 762 4.1% 105 2.8% 213 2.2% 975 1.5% 112 1.5%
Other Means * 366 2.0% 123 3.3% 155 1.6% 422 0.6% 84 1.1%
Worked at Home * 493 2.7% 117 3.1% 105 1.1% 1,206 1.8% 136 1.8%
Health
HIV/AIDS 70 42 67 554 42
AIDS 35 23 35 292 24
Mental Illness 1,830 508 1,170 6,581 877
Substance Abuse
* = data obtained using the American Community Survey 5-year estimates
= Louisiana Department Health and Hospitals ^ = Realty Trac

A Single Night Counts: Homelessness in Louisiana
Page 69
Demographic Totals for CoC Region 8 and by Parish, Page 3 of 3 Region 8 Tensas Union West Carroll Total
Demographics
Population 5,252 100% 22,721 100% 11,604 100% 355,761
Gender
Male 2,493 47.5% 11,214 49.4% 5,818 50.1% 172,929
Female 2,759 52.5% 11,507 50.6% 5,786 49.9% 182,832
Race
White alone 2,202 41.9% 15,682 69.0% 9,497 81.8% 213,234
Black or African American alone 2,967 56.5% 6,182 27.2% 1,822 15.7% 132,572
American Indian or Alaska Native alone 6 0.1% 58 0.3% 52 0.4% 857
Asian alone 9 0.2% 32 0.1% 27 0.2% 2,636
Native Hawaiian or other Pacific Islander 0 0.0% 17 0.1% 0 0.0% 128
Some other race alone 26 0.5% 572 2.5% 94 0.8% 2,681
Two or more races 42 0.8% 178 0.8% 112 1.0% 3,653
Ethnicity
Hispanic or Latino 65 1.2% 943 4.2% 299 2.6% 6,785
Not Hispanic or Latino 5,187 98.8% 21,778 95.8% 11,305 97.4% 348,976
Age
Under 18 1,329 25.3% 5,228 23.0% 2,858 24.6% 88,006
18-44 1,423 27.1% 7,229 31.8% 3,700 31.9% 130,291
45-64 1,592 30.3% 6,514 28.7% 3,092 26.6% 89,320
65 and over 908 17.3% 3,750 16.5% 1,954 16.8% 48,126
Educational Attainment
High School Graduate or Higher * 1,488 40.3% 6,792 44.1% 3,127 40.8% 81,200
Households
Total Number of Families * 1,560 6,126 2,814 86,769
Total Number of Households * 2,165 8,309 4,061 128,535
Housing
Total Housing Units 3,357 100% 11,346 100% 5,046 100% 154,169
Occupied Housing Units 2,172 64.7% 9,144 80.6% 4,452 88.2% 135,109
Vacant Housing Unit 1,185 35.3% 2,202 19.4% 594 11.8% 19,060
Renter Occupied 711 32.7% 2,007 21.9% 1,076 24.2% 46,992
Vacant Rentals 69 5.8% 277 12.6% 114 19.2% 4322
Financials
Foreclosure n/a n/a 2 1: 5673 1 1:5046 71
Median Income
Median Household Income * $ 39,876 $ 51,335 $ 45,964 $ 37,757
Median Family Income * $ 46,991 $ 61,063 $ 54,835 $ 46,378
Median Worker Income * $ 19,197 $ 26,321 $ 21,922 $ 21,608
Poverty Rate
% of Families Below the Poverty Level * 1,376 26.2% 3,726 16.4% 1,996 17.2% 65,494
% of Individuals Below Poverty Level * 1,702 32.4% 4,999 22.0% 2,669 23.0% 83,933
Cash Benefits
SSI * 782 36.1% 2,922 35.2% 1,479 36.4% 38,039
Non-Cash Benefits
Food Stamp Assistance in the Past 12 Months * 427 19.7% 1,047 12.6% 527 13.0% 19,865
Employment
Population Over 16 * 4,244 100% 17,995 100% 9,125 100% 275,885
In Labor Force * 2,116 49.9% 9,894 55.0% 4,428 48.5% 157,784
Civilian Labor Force * 2,116 49.9% 9,890 55.0% 4,428 48.5% 157,400
Employed * 1,954 46.0% 9,292 51.6% 4,049 44.4% 143,099
Unemployed * 162 3.8% 598 3.3% 379 4.2% 14,301
Armed Forces * 0 0.0% 4 0.0% 0 0.0% 384
Not in Labor Force * 2,128 50.1% 8,101 45.0% 4,697 51.5% 118,101
Transportation to Work
Workers 16 Years and Over * 1,926 100% 9,127 100% 3,893 100% 139,814
Car, Truck, or Van -- Drove Alone * 1,624 84.3% 7,762 85.0% 3,439 88.3% 117,255
Car, Truck, or Van -- Carpooled * 203 10.5% 781 8.6% 253 6.5% 14,130
Public Transportation (excluding taxicab) * 0 0.0% 35 0.4% 28 0.7% 1041
Walked * 37 1.9% 139 1.5% 24 0.6% 2774
Other Means * 24 1.2% 126 1.4% 30 0.8% 1724
Worked at Home * 38 2.0% 284 3.1% 119 3.1% 2,890
Health
HIV/AIDS 35 28 11 964
AIDS 16 38 5 530
Mental Illness 222 925 485 14,382
Substance Abuse 25,248
* = data obtained using the American Community Survey 5-year estimates
= Louisiana Department Health and Hospitals ^ = Realty Trac

A Single Night Counts: Homelessness in Louisiana
Page 70
Demographic Totals for CoC Region 9 and by Parish, Page 1 of 1 Region 9 Livingston St. Helena St. Tammany Tangipahoa Washington Total
Demographics
Population Total 128,026 100% 11,203 100% 233,740 100% 121,097 100% 47,168 100% 541,234
Gender
Male 63,372 50% 5,521 49% 113,973 49% 58,800 49% 23,360 50% 265,026
Female 64,654 50.5% 5,682 50.7% 119,767 51.2% 62,297 51.4% 23,808 50.5% 276,208
Race
White alone 117,601 91.9% 5,034 44.9% 195,364 83.6% 80,206 66.2% 31,482 66.7% 429,687
Black or African American alone 6,505 5.1% 5,974 53.3% 26,654 11.4% 36,654 30.3% 14625 31.0% 90,412
American Indian or Alaska Native alone 526 0.4% 38 0.3% 1,160 0.5% 383 0.3% 133 0.3% 2,240
Asian alone 628 0.0 9 0.1% 2,972 1.3% 741 0.6% 110 0.2% 4,460
Native Hawaiian or other Pacific Islander 26 0.0% 4 0.0% 93 0.0% 46 0.0% 3 0.0% 172
Some other race alone 1,273 1.0% 53 0.5% 3,259 1.4% 1,431 1.2% 296 0.6% 6,312
Two or more races 1,467 1.1% 91 0.8% 4,247 1.8% 1,636 1.4% 519 1.1% 7,960
Ethnicity
Hispanic or Latino 3,801 3.0% 99 0.9% 10,970 4.7% 4,260 3.5% 887 1.9% 20,017
Not Hispanic or Latino 124,225 97.0% 11,104 99.1% 222,770 95.3% 116,837 96.5% 46,281 98.1% 521,217
Age
Under 18 35,330 27.6% 2,763 24.7% 60,136 25.7% 30,420 25.1% 11,863 25.2% 140,512
18-44 48,138 37.6% 3,584 32.0% 75,575 32.3% 46,311 38.3% 15,267 32.3% 188,875
45-64 31,887 24.9% 3,276 29.2% 68,401 29.3% 30,563 25.2% 13,202 28.0% 147,329
65 and over 12,671 9.9% 1,580 14.1% 29,628 12.7% 13,803 11.4% 6,836 14.5% 64,518
Educational Attainment
High school graduate or higher * 106,902 83.5% 8,581 76.6% 205,691 88.0% 95,788 79.1% 36,555 77.5% 453,517
Households
Total Number of Families * 32,052 2,782 61,398 29,412 11,942 137,586
Total Number of Households * 42,962 4,072 84,536 42,558 17,292 191,420
Housing
Total Housing Units 50,170 100.0% 5,150 100.0% 95,412 100.0% 50,073 100.0% 21,039 100.0% 221,844
Occupied Housing Units 46,007 91.7% 4,333 84.1% 87,521 91.7% 45,135 90.1% 18,113 86.1% 201,109
Vacant Housing Unit 4,163 8.3% 817 15.9% 7,891 8.3% 4,938 9.9% 2,926 13.9% 20,735
Renter Occupied 9,289 20.2% 759 17.5% 17,923 20.5% 13,591 30.1% 4,649 25.7% 46,211
Vacant Rentals 1,059 25.5% 80 9.8% 2,192 27.8% 1,610 32.6% 488 16.7% 5,429
Financials
Foreclosure ^ 75 1:669 n/a n/a 217 1:440 56 I:894 1 I:21,039 349
Median Incomes
Median Household Income * $ 54,708 $ 27,393 $ 60,866 $ 38,957 $ 30,363 $ 42,457
Median Family Income * $ 61,227 $ 34,199 $ 72,226 $ 50,438 $ 37,633 $ 51,145
Median Worker Income * $ 32,096 $ 22,657 $ 32,731 $ 25,059 $ 21,677 $ 26,844
Poverty Level
% of individuals below poverty level. * 14,595 11.4% 2,588 23.1% 21,972 9.4% 27,427 22.5% 12,311 26.1% 78,893
% of households below the poverty level * 3,609 8.4% 680 16.7% 6,002 7.1% 7,277 17.1% 3,821 22.1% 21,389
Cash Benefits
SSI * 10,429 24.3% 1,655 4.1% 23,318 27.6% 12,542 29.5% 6,143 13.0% 54,087
Non Cash Benefits
Food stamp assistance in the past 12 months * 5,408 12.6% 930 22.8% 10,634 12.6% 8,044 18.9% 4,855 28.1% 29,871
Employment
Population over 16 * 92,078 100.0% 8,683 100.0% 176,859 100.0% 91,490 100.0% 35,987 100.0% 405,097
In labor force * 59,813 65.0% 4,891 56.3% 111,741 63.2% 55,395 60.5% 18,697 52.0% 250,537
Civilian labor force * 59,642 64.8% 4,891 56.3% 110,796 62.6% 55,125 60.3% 18,601 51.7% 249,055
Employed * 56,549 61.4% 4,229 48.7% 104,432 59.0% 49,286 53.9% 16,082 44.7% 230,578
Unemployed * 3,093 3.4% 662 7.6% 6,364 3.6% 5,839 6.4% 2,519 7.0% 18,477
Armed Forces * 171 0.2% 0 0.0% 945 0.5% 270 0.3% 96 0.3% 1482
Not in Labor Force * 32,265 35.0% 3,792 43.7% 65,118 36.8% 36,095 39.5% 17,290 48.0% 154,560
Transportation to Work
Workers 16 years and over * 55,313 100.0% 4,152 100.0% 101,972 100.0% 48,026 100.0% 15,886 100.0% 225,349
Car, truck, or van -- drove alone * 47,183 85.3% 3,515 84.7% 84,212 82.6% 38,534 80.2% 12,199 76.8% 185,643
Car, truck, or van -- carpooled * 5,452 9.9% 366 8.8% 10,705 10.5% 6,279 13.1% 2,261 14.2% 25,063
Public transportation (excluding taxicab) * 169 0.3% 0 0 130 0.1% 260 0.5% 101 0.6% 660
Walked * 217 0.3% 59 1.4% 1,065 1.0% 578 1.2% 307 1.9% 2,226
Other means * 598 1.1% 25 0.6% 2,277 2.2% 1,133 2.4% 603 3.8% 4,636
Worked at home * 1,694 3.1% 187 4.5% 3,583 3.5% 1,242 2.6% 415 2.6% 7,121
Health
HIV/AIDS ° 165 16 370 338 177 1,066
AIDS ° 91 10 209 180 93 583
Mental Illness ° 5,590 468 9,926 5,095 1,986 23,065
Substance abuse ° 38,110
* = data obtained using the American Community Survey 5-year estimates
= Louisiana Department Health and Hospitals ^ = Realty Trac

A Single Night Counts: Homelessness in Louisiana
Page 71
A Single Night Counts: Homelessness in Louisiana
This report was prepared by
Louisiana Services Network Data Consortium (LSNDC)
762 Austin Place
Shreveport, LA 71101