“home meal replacement means total meal solutions,...
TRANSCRIPT
“Home Meal replacement means total meal solutions, the kind of wholesome, nutritiousfood people would cook for themselves – if only they had the time.”
-Restaurant Business, August 1, 1997-
This business plan is intended solely for informational purposes to assist you in determining if you wish to proceed with a due diligence investigation of thisproject. The information contained herein is believed to be reliable, but the management team makes no representations or warranties with respect to thisinformation. The financial projections that are prate of this plan represent estimates based on extensive research and on assumptions considered reasonable, butare not guaranteed. The contents of this plan are confidential and are not to be reproduced without written consent.
TABLE OF CONTENTS
EXECUTIVE SUMMARY…………………………… 2
COMPANY OVERVIEW……………………………. 3
PRODUCT AND SERVICE DESCRIPTION………….. 4
MANAGEMENT……………………………………. 5
MARKETING AND SALES PLAN…………………... 7
DEVELOPMENT PLAN…………………………….. 14
OPERATIONS PLAN……………………………….. 19
FINANCIAL STATEMENTS………………………… 23
APPENDICES………………………………………. 43

EXECUTIVE SUMMARY
EXECUTIVE SUMMARY1
Sweet Basil will be a new entrant into the Home Meal Replacementindustry. We will specialize in preparing hand-made, fresh Italiantake-home meals including: entrees, pastas, sauces, breads, soupsand salads. Our store will focus on providing high quality items thatrequire minimal cooking time. We will be located in The MeadowsShopping Center in Boulder, Colorado. We anticipate opening inJune 1998.
Boulder is an excellent location because of its attractivedemographics. Sweet Basil will be targeting three main segments:DINKS (double-income no kids), harried families, and collegestudents. These groups account for 63% of Boulder’s population andall have a need for convenient, nutritious, high quality meals theycan enjoy in their homes.
In order to promote our business, we will undertake active marketingprograms prior to opening. This strategy will be implementedthrough newspaper advertisements, coupon and flyer distribution, aswell as free samples to local businesses and college students. Onceopen, we will gain customer support through word-of-mouth. Inaddition, we will invest in the community through involvement withlocal schools and charities.
Sweet Basil will compete with other Home Meal Replacementspecialty stores, supermarkets, restaurants, and fast food chains,primarily based on quality and timeliness. We will ensure quality bypreparing each item on a daily basis with the highest qualityingredients. The location and the lay-out of our store will providecustomers with convenient and quick service. Furthermore, due toour low costs in overhead and ingredients, we will be able to be pricecompetitive.
Sweet Basil will be established as a Sub Chapter S-Corporation.This will allow for limited liability on behalf of the owners. It willalso give Sweet Basil a tax break because the company will be taxedas a partnership rather than a corporation.
The management team believes that the Sweet Basil conceptprovides an outstanding opportunity. Due to high industry growthand our personal commitments to the business, there is potential forsuccess. All funds required to develop Sweet Basil will be raisedfrom the four owners. We anticipate that pre-opening expenses willbe roughly $50,000. We will also contribute an additional $20,000as a cash cushion for early losses or unexpected expenses, for a totalinvestment of $70,000.
COMPANY OVERVIEW
COMPANY OVERVIEW2
Sweet Basil will be incorporated in the State of Colorado as a SubChapter S-Corporation. Our store will focus on providing highquality food and convenience for our customers. We will not be arestaurant, but rather a store that focuses on take-out meals only. Wewill accomplish this by entering into the Home Meal Replacementindustry.
Sweet Basil will be run by four owner-managers who each have anequal stake in the business. Financially, our mission will be to createa business which will be sustainable and provide steady growth formany years to come. The four owner-managers will each be paid aweekly base salary of $500, and the two assistant managers will eachearn $300 per week. The two assistants each have a profit-sharingstake in the business, each receiving 5% of Operating Earnings every
month. The four owner-managers will each receive 22.5% of NetIncome, leaving 10% to be reinvested in the business every month.
Expansion plans for Sweet Basil include entering into the deliveryand catering services, and opening up a second location. Cateringand delivery are two areas that can be entered into easily by SweetBasil. Both of these additional services will increase sales andprofitability. Delivery will provide customers with addedconvenience, while catering will provide an opportunity to expandour customer base. The possibility of opening a second locationexists, but this is at least four years down the road. Sweet Basilwants to first solidify its position in the Boulder market beforeventuring into new markets. To insure continuity the samemanagement team will head the expansion to the second location.
PRODUCT AND SERVICE DESCRIPTION
PRODUCT AND SERVICE DESCRIPTION3
Sweet Basil will specialize in preparing hand-made, fresh Italiantake-home meals including: entrees, pastas, sauces, breads, soups,and salads (See Appendix A for menu). All food will be preparedon-site on a daily basis. Quality will be ensured through freshingredients and a one or two day shelf life. Quality will also beemphasized by the superior level of service by Sweet Basil’s staff.
Sweet Basil will be a small, walk-in and take-out service for theharried customer who does not have time to prepare meals at home.Our store will have fresh foods prepared daily and arranged innumerous display cases. The customer can buy packaged food totake home, or he or she can customize an order to be packaged andtaken home. The packaging will come in two forms: plasticcontainers used for items that will not be cooked within their
container, and disposal aluminum baking trays for items that will becooked within their container. The items that are packaged inaluminum trays will be the entrées and appetizers, while all otheritems will be served in different sized plastic containers.
Sweet Basil will be laid out so that the customer will have ease ofentry and exit; we plan to have the customer in and out in less thanfive minutes. Sweet Basil will be a replacement for the home meal,and it will be more than the customer expects. Sweet Basil will belocated in the Meadows Shopping Center, which will provide thecustomer with ease and accessibility. This added convenience willbring repeat customers, and they will be the base of our business.Our staff will be trained in every area to create meals and serve thecustomers in the best way possible.
MANAGEMENT
MANAGEMENT4
The management team will share all of the main duties, such ascooking, cleaning, accounting, marketing, and customer relations.Since each manager will invest $17,500, each will have equalownership in the corporation and equal voting rights. However, if acontroversial issue arises, Sweet Basil’s CEO, David Wein, willhave the swing vote. Compensation will also be equal for themanagement team. Each manager earns $500 per week as a basesalary, and receives a 22.5% dividend. The above conditions haveall been included in the Sweet Basil partnership agreement.
Managers (See Appendix B for resumes)
CEO- David Wein is a candidate for a Bachelor of Science inBusiness Administration with an emphasis in Information Systems atthe University of Colorado at Boulder in December, 1998. Davidhas experience as a project leader and systems developer. He hasbeen an avid amateur chef since early childhood.
CFO- Jillian Doman is a candidate for a Bachelor of Science inBusiness Administration with an emphasis in Entrepreneurship at the
University of Colorado at Boulder in December, 1997. Jillian hasworked in the food service industry for over two years. She hasexperience in many areas of the restaurant business, including: officemanager, server, bartender, hostess, expediter, and prep cook.
COO- Lindsay Strodl is a candidate for a Bachelor of Science inBusiness Administration with an emphasis in Entrepreneurship at theUniversity of Colorado at Boulder in December, 1997. Lindsay hasexperience in planning and administration as her current positionrequires this.
Vice President of Marketing- Amber Long is a candidate for aBachelor of Science in Business Administration with a double-majorin Marketing and Entrepreneurship at the University of Colorado atBoulder in May, 1998. Amber has two years experience as asupervisor in the food service industry. She has also performedmultiple marketing and accounting functions for a local publishingcompany.

MARKETING AND SALES PLAN

MARKETING AND SALES
MARKETING AND SALES7
Home Meal Replacement Industry
Due to the changing needs of consumers, the foodservice industry isseeing a new convenience-driven trend known as Home MealReplacement (HMR). This trend has emerged because consumersare demanding "...complete homestyle meal solutions that are quick,varied, wholesome, convenient, preparation-free, and cost effectiveenough to eat everyday" (Food Channel, 1997). In other words, theHMR industry has found a new way to provide home-style mealsthat people would cook for themselves if only they had the time,skill, or motivation.
Industry Outlook
The National Restaurant Association (NRA) predicts that HMR maybecome an $80-100 billion industry by the end of 1997 (Meatami,1997). Clinton Associates, a consulting firm, believes that HMR hasthe potential to become the third largest segment in the food serviceindustry, following the quick-service and the full-service segments.Ron Paul, president of the Chicago-based consulting firm Technomicsays, "There's no question HMR is the fastest growing component ofthe food industry today, and this will continue to take share awayfrom both supermarket grocery sales and traditional on-premiserestaurant business" (Casper, 1997). As consumer trends of timepoverty, lack of cooking skills, and the demand for convenient,quick, quality meal solutions continue to accelerate, the HMRcategory will explode.
Consumer Trends Driving Growth
Industry analysts have identified the increase in time poverty, a termused to describe the lack of time or energy to cook home meals, as akey factor in the growth of HMR. "People used to say they didn'thave time to cook, so they'd go to a restaurant. Now, they say theydon’t have time to eat in a restaurant" (Food Channel, 1997). Therise of dual incomes in families has also created an opportunity forthis industry. Focus groups have found that parents desire thenostalgic dinner table conversation they remember from theirchildhood, but they do not have time to prepare the necessary qualityand nutritious meals (Casper, 1997). Now, however, HMR givesfamilies the opportunity to enjoy good homestyle meals in thecomfort of their own home.
Sweet Basil’s Position
Sweet Basil will be a new entrant into the HMR industry. SweetBasil will specialize in preparing hand-made, fresh Italian meals,including: entrees, pastas, sauces, breads, soups, and salads. SweetBasil's store will focus on providing high quality items that requireminimal cooking time. Quality will be ensured through freshingredients, a well trained staff, and a one or two day shelf life.Customers will be able to customize meals from numerous displaycases, or have the option of choosing already prepared packagedmeals. If desired, customers can make special requests by callingahead to modify an item we already offer.
MARKETING AND SALES8
Boulder Population by Age
26.40%
36.90%
13.70%
7.90%
18 - 24 25 - 44 45 - 64 65+
Boulder Population by Category
23.30%
19.50%18.10%
39.10%
Families Off-Campus Students DINKS Other
Target Market
Sweet Basil's Market
The following are Sweet Basil’s target markets. These segmentshave a common characteristic: the need for convenient, nutritious,high quality meals that they can enjoy in their homes.
• DINK (double-income no kids) households in which both peoplehave the disposable incomes to eat out.
• Families in which parents want nutritious meals for their kids,but don't have time to cook.
• Single, young people (particularly Generation X and collegestudents) who have grown up on fast food and don't know howor want to cook, nor want to eat out every day.
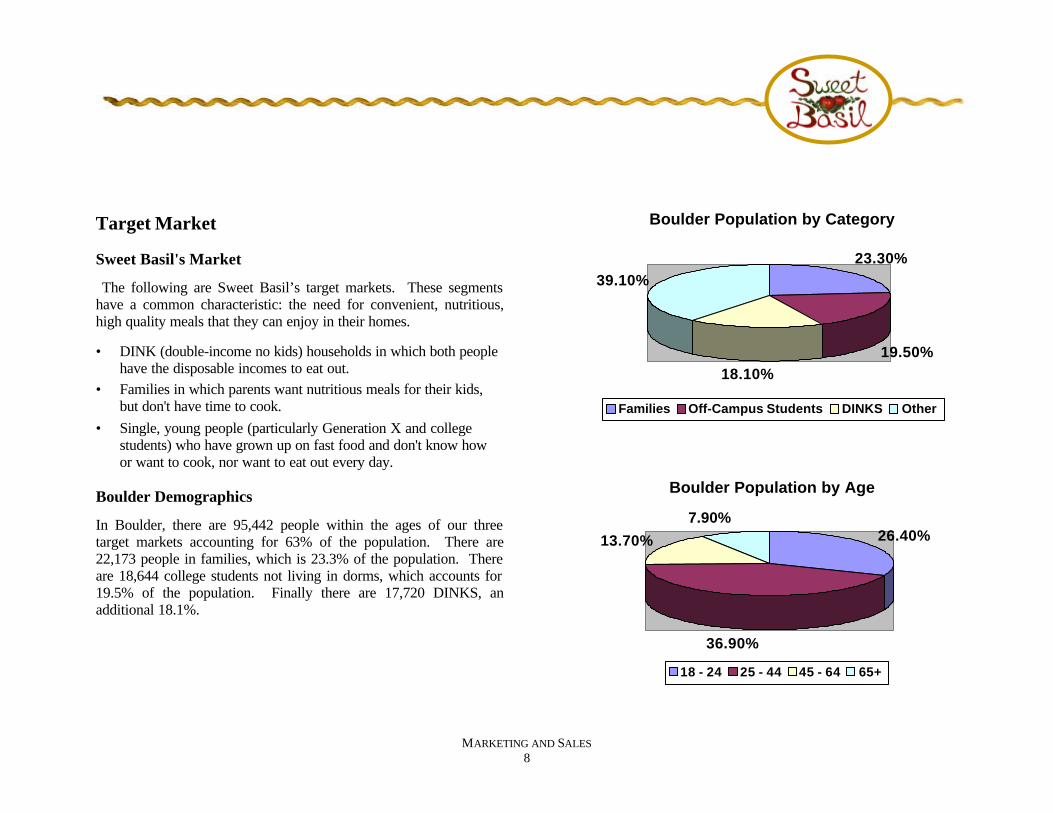
Boulder Demographics
In Boulder, there are 95,442 people within the ages of our threetarget markets accounting for 63% of the population. There are22,173 people in families, which is 23.3% of the population. Thereare 18,644 college students not living in dorms, which accounts for19.5% of the population. Finally there are 17,720 DINKS, anadditional 18.1%.
MARKETING AND SALES9
Competition
Currently, there are many players in the HMR. The basic segmentsinclude:
• Specialty stores• Supermarkets• Convenience stores• Restaurants• Fast Food Restaurants
Sweet Basil’s Competition
Supermarkets
Sweet Basil's main competition will come from major supermarketsin Boulder. Consumers are used to shopping at grocery stores, andsince 94% of them offer ready-to-cook entrees, supermarkets alreadyhave their potential HMR customers in their store. The majorsupermarkets in Boulder include:
• Safeway: Meadows Shopping Center; 28th and Arapahoe• King Sooper's: 30th and Arapahoe; Broadway and Table Mesa• Albertson's: 30th and Iris• Alfalfa’s: Broadway and Arapahoe• Wild Oats: Broadway and Baseline; 19th and Pearl• Leever's: 30th and Walnut
Although supermarkets are major competitors, Sweet Basil still hasan advantage as a specialty store. Supermarket HMR sales onlyaccount for $8.5 billion of the total industry sales (approximately10%), while specialty stores (particularly Boston Market), accountfor almost 50% of the total industry sales (Restaurant Business).Also, supermarkets do not provide the high quality meals SweetBasil will, nor do they have quick service since there are usually longlines at the check-outs.
Specialty Stores
In Boulder, there is only one Italian specialty store serving HMRmeals, The Pasta Market. Sweet Basil has an advantage for thefollowing reasons:
• The Pasta Market’s menu is limited in comparison with SweetBasil’s. For example, they do not serve a variety of pre-packaged dinners such as Chicken Marsala or Beef Manicotti.
• The Pasta Market is not in a convenient location. Their store islocated in North Boulder on a side street with limited exposureto the majority of traffic.
• Sweet Basil is focusing on the strength of HMR, quick take-outservice, while The Pasta Market has a sit-down section.
Restaurants
In Boulder, there are hundreds of restaurants where take-out isavailable, and as consumer trends for convenience and time-deprivation grow, more restaurants may adopt a take-out service.However, because Sweet Basil is focusing exclusively on take-out,we will have a competitive advantage in this area. This advantage is
MARKETING AND SALES10
due to the fact that Sweet Basil emphasizes quick service throughprepackaged meals, store layout, and a convenient location.
Fast Food Restaurants
Although these quick service restaurants focus on take-out and stressconvenience, they do not serve high quality nor nutritious meals.Also, they are not usually "family style" meals like consumers aredemanding. As a result, they are not major competition for SweetBasil.
Competitive Advantages
Building and maintaining competitive advantages is essential to thesuccess of Sweet Basil. In order to do this, we will compete on thebasis of convenience as well as high quality food and service.According to the Food Channel (1997), "the convenience factor iscrucial for the success of an HMR host, and basic to the nature ofwhat HMR is supposed to offer." Sweet Basil's convenience will beemphasized in the layout of the store. By offering multiple registers,full-service and self-service display cases, we will ensure thatcustomers complete their shopping in less than five minutes. Parkingand location will be another factor of convenience for the customer.Sweet Basil's anticipated location in the Meadows Shopping Centeris a highly accessible area with ample parking spaces.
Sweet Basil defines the quality of our food as homestyle meals madefrom the freshest available ingredients. A Just-In-Time system willbe implemented to ensure freshness of meats, poultry, vegetables,and dairy. Also, our products will have short shelf-lives of only oneor two days. We will provide high quality service by having a welleducated and trained staff so that we may offer advice and make
suggestions to customers. The staff will be able to answer anyquestions the customers may have about recipes or cookinginstructions.
Risks
The success of Sweet Basil is dependent on our ability to overcomeseveral risks:
• Low barriers to entry into the HMR industry• Loyalty of customers at existing restaurants and supermarkets
that offer take-out in Boulder• Suppliers not delivering products on time• Lack of flexibility of customization
Ways To Combat Risks
Sweet Basil will combat these potential risks in the following ways:
• Differentiate ourselves through our menu, the quality of our foodand service, our atmosphere, and our convenient location.
• Gain name recognition so consumers will identify Sweet Basil asan HMR provider rather than a restaurant.
• Maintain contracts with our suppliers and develop strongrelationships to ensure proper delivery.
• Offer the chance to call ahead to customize orders.
Promotion and Advertising
Sweet Basil will promote and advertise its concept and productsthrough a plethora of mediums (See financials for costs).
MARKETING AND SALES11
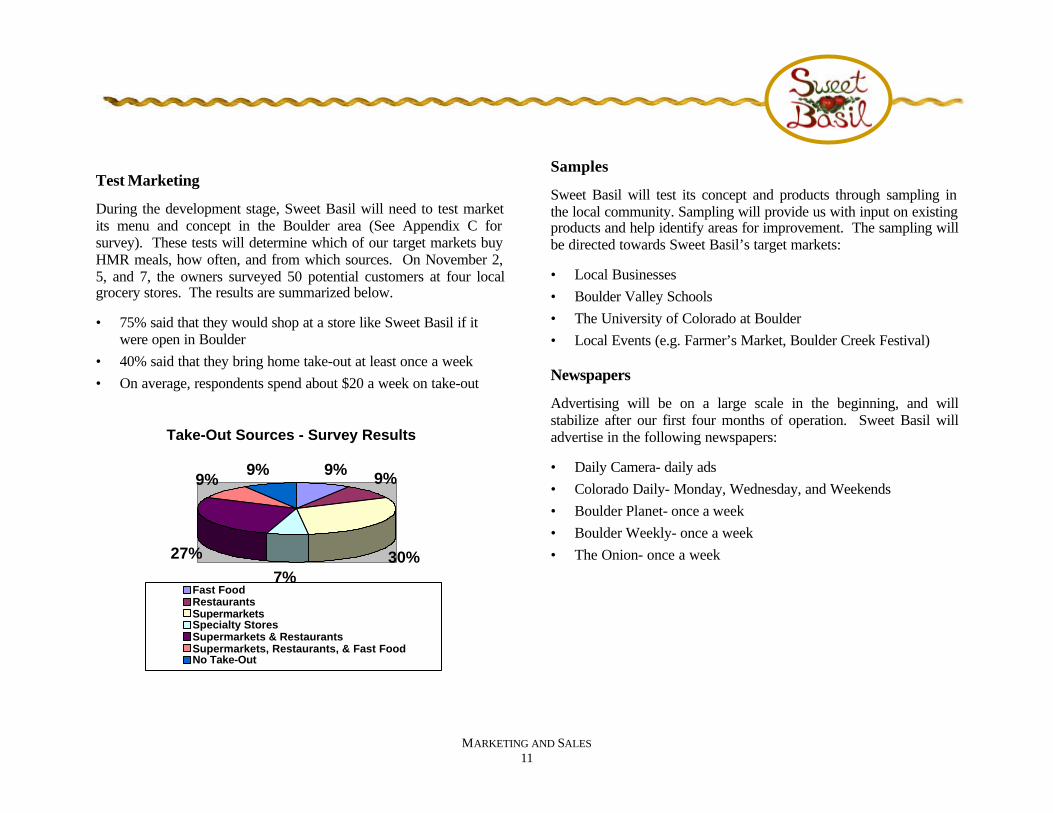
Test Marketing
During the development stage, Sweet Basil will need to test marketits menu and concept in the Boulder area (See Appendix C forsurvey). These tests will determine which of our target markets buyHMR meals, how often, and from which sources. On November 2,5, and 7, the owners surveyed 50 potential customers at four localgrocery stores. The results are summarized below.
• 75% said that they would shop at a store like Sweet Basil if itwere open in Boulder
• 40% said that they bring home take-out at least once a week• On average, respondents spend about $20 a week on take-out
Samples
Sweet Basil will test its concept and products through sampling inthe local community. Sampling will provide us with input on existingproducts and help identify areas for improvement. The sampling willbe directed towards Sweet Basil’s target markets:
• Local Businesses• Boulder Valley Schools• The University of Colorado at Boulder• Local Events (e.g. Farmer’s Market, Boulder Creek Festival)
Newspapers
Advertising will be on a large scale in the beginning, and willstabilize after our first four months of operation. Sweet Basil willadvertise in the following newspapers:
• Daily Camera- daily ads• Colorado Daily- Monday, Wednesday, and Weekends• Boulder Planet- once a week• Boulder Weekly- once a week• The Onion- once a week
Take-Out Sources - Survey Results
9% 9%
30%7%
27%
9%9%
Fast FoodRestaurantsSupermarketsSpecialty StoresSupermarkets & RestaurantsSupermarkets, Restaurants, & Fast FoodNo Take-Out
MARKETING AND SALES12
Donations
Sweet Basil desires to develop a strong relationship with the localcommunity. In order to do so, we will make donations on a regularbasis to the following:
• The Boulder Shelter for the Homeless• Boulder Community Food Share• Boulder Valley Public Schools• Youth Organizations (e.g. Boy Scouts of America)
Flyers
Sweet Basil will distribute numerous flyers monthly around theBoulder community. The primary locations for distribution are:
• Meadows Shopping Center• Office Buildings• The University of Colorado Campus• “The Hill”

DEVELOPMENT PLAN
DEVELOPMENT
DEVELOPMENT14
Overview
Sweet Basil will require five months of development prior toopening. Sweet Basil will be locating in Boulder, Colorado in theMeadows Shopping Center at Foothills and Baseline. This is anideal location because there is ample parking, and it is at the cornerof two major streets. Also, Blockbuster Video, Safeway, 1st Bank,and other businesses are located there, which creates high foot trafficnear our store.
Schedule
The following phases break our development into five distinct parts:Current Development, Preparation, Finalizing, Opening and Growth,and Expansion.
Phase One: Current Development (1 month)
• Secure location and lease• Obtain Boulder demographics• Survey potential customers• Develop marketing plan• Identify costs to open• Hire attorney and architect• Menu development• File Articles of Incorporation
Phase Two: Preparation (3 months)
• Store remodeling and renovation• Identify and purchase equipment• Implement marketing plan• Identify and contract with suppliers
Phase Three: Finalizing (1 month)
• Obtain permits and licenses• Finalize menu design• Install and test equipment• Building inspection• Private opening• Public opening
Phase Four: Opening and Growth
• Build customer base• Track and understand customer buying habits• Establish Sweet Basil as the HMR alternative
Phase Five: Expansion
• Delivery• Catering• Second location
DEVELOPMENT15
Critical Costs of Development
The numerous costs that are incurred during development areoutlined in the following sections.
Facility and Lease
The following costs are associated with obtaining a lease in theMeadows Shopping Center. These costs are based on a 2,187 squarefoot area that will fit our store, kitchen, and office. Sweet Basil willbe 100 x 22 feet (See Appendix D for store layout). This is a triplenet lease with an annual $17 per square foot base rent and acommon area cost of $4.09 per square foot.
Lease $3,844Gas and Utilities $388Telephone (3 lines)
-one time installation cost $210-long distance $30-monthly charge $170
Total Facility/Lease Costs $4,642
Permits and Licenses
These costs are incurred only once at the inception of Sweet Basil.
Boulder City Sales Tax License $25County Sales Tax License $16Food Service Fee $100Health Department Fee $75Total Permits/Licenses Costs $216
Menu Development
Developing Sweet Basil’s menu will be a critical milestone fornumerous reasons. The founders will need to spend large amounts oftime perfecting recipes, testing packaging, and sampling each itemourselves and with potential customers. This process will helpdetermine which items are on the final menu. The costs for this areour time, food supplies, printing menus and creating internalsignage.
Total Menu Preparation Costs $2,000
Remodeling and Renovation
Due to the fact that our site was previously occupied by a foodservice establishment, our costs will be small. The management teamwill remodel the store with the help of one of the founder’s brother,Jason Strodl, an architect.
Architect Fee $100Renovation Supplies $3,000Total Renovation Costs $4,100

DEVELOPMENT16
Equipment
In order to open and operate our business, we will purchaseequipment and supplies (See Appendix E for a detailed list).
Kitchen Equipment $6,800Office Equipment $10,400Front-of-House Equipment $10,000Total Equipment Costs $27,200
Attorney Services
We will hire an attorney for the purpose for incorporation and legaladvice. We will hire David Spurlock, a family friend of themanagement team.
Attorney Fee $100Incorporation Fee $100Other $100Total Attorney Costs $300
Insurance
Sweet Basil will be insured by State Farm Insurance Company,based on their “General Fast Food Insurance Plan.” The total cost is$1825 annually. The plan includes the following coverages:
General Contents $100,000Inventory $10,000Liability $1,000,000On Premise Cash $4,000Off Premise Cash $2,000Sign Coverage $3,000Temperature Change $5,000Deductible $1,000
Marketing
Pre-opening marketing will take many forms. The following outlinesthe costs associated with each marketing activity (See Marketing andSales Plan and marketing costs for more details).
Newspaper Advertisements $1,339Samples $600Flyers $96Pre-Opening Party $500Total Marketing Costs $2,535
Total Development Costs (January – May 1998)
Facility and Lease $9,074Permits and Licenses $216Menu Development $2,000Remolding and Renovation $3,100Equipment $27,200Attorney Services $300Insurance $1,825Marketing $2,535Total Development Costs $46,250
Expansion
Three possible areas of expansion exist for Sweet Basil depending ondemand.
Delivery
Delivery increases the convenience of Sweet Basil’s products to itscustomers. Also, delivery generates profits from those customers
DEVELOPMENT17
who do not have transportation or who are too busy to drive to SweetBasil. On days with inclement weather, delivery provides an addedbenefit to customers. We plan on hiring two delivery drivers inJanuary 1999 and two in January 2000.
Catering
Based on the experiences of other business catering increases profitmargins. Sweet Basil could cater to local businesses andhomeowners who are currently in our customer base. Also, cateringcould bring new customers like the university, (including fraternities
and sororities) and others who plan major events (weddingcoordinators and conference planners).
Second Location
Sweet Basil could open a second store outside the Boulder area. Thisother location will expand our customer base and increase overallbusiness profits. Our original management team will develop thissecond location as we did the first. This continuity will ensure thesame quality level.

OPERATIONS PLAN

OPERATIONS
OPERATIONS19
The Sweet Basil Experience
From the moment a customer walks into Sweet Basil, it will beobvious that we are a different kind of establishment. The store isfilled with the aroma of freshly sautéing vegetables, sauces, andhomemade soup, the kind of smell that makes you hungry even ifyou have just eaten. Customers are welcome to browse, looking atthe various sauces, soups, and pastas that are on our shelves and inour refrigerators. The walls are lined with story boards whichexplain to the customer the menu, where their food came from, andwhat Sweet Basil is about. They may also try several of the sampleswe have prepared. Once they decide on a sauce, dish, or completedinner, which we will be happy to help them with, we will assistthem with a speedy check out process and provide them with anyinstruction they may need or want in preparing their food. Allcustomers are welcomed and encouraged to fill out a comment andsuggestion card if their time permits.
Behind the Scenes
In the first year of operation, Sweet Basil will have a staff of six;however, only four will work in the store at a time. The nature ofour business requires almost no waste of time or resources. As eacharea of operations is defined, efficiency and effectiveness arestressed without sacrificing the ultimate goals of Sweet Basil. Thefollowing sections outline the main areas of operations.
Purchasing & Raw Materials Inventory
Although we will be producing almost all of our finished goods in-house, we still need suppliers for our ingredients and packaging. Ouringredients break down into four basic categories: meats and poultry,
vegetables, dairy, and non-perishables. The frequency of deliveries,quantities purchased, and shelf-lives will vary greatly from productto product. However, we plan on implementing a Just-In-Timesystem for the majority of our inventory.
• Meats and Poultry Four times per week• Vegetables Four times per week• Dairy Three times per week• Non-perishables Once per month (or as needed)• Packaging Twice per month (or as needed)
Cooking
Most of the time involved in cooking is doing the prep work. Sincemany of our dishes will require the same prep work, we will take anassembly line approach in our food preparation. For example,Manicotti and Stuffed Shells are identical in recipe, except for thetype of pasta used. The filling for both can be made at one time. Allof the pastas will come from the same base, which is flour and egg,so large portions of that can be made at once and then broken intosmall amounts for individual types of pasta. Items such as FriedChicken Breast, Chicken Parmesan, and Eggplant Parmesan all usethe same mixture for the batters. Making large portions of thesemixtures will reduce the time involved in making any single one ofthem.
In the morning before we open, the majority of the prep work will bedone. The morning is a good time to chop vegetables and do someof the cooking for the coming day of business. The owners will alsospend time after we close to do additional prep work, such as makingbatter or dough for pasta.
OPERATIONS20
Finished Food Inventory
Since Sweet Basil will focus on freshness and quality, we will haveto have short shelf-lives on our products. Reducing shelf-lives willresult in an increase because of our JIT system. The maximum shelflife for entrees, pastas, breads, and salads will be one day. Saucesand soups that are jarred will remain on the shelf for two days. Anyfood left after its shelf-life will be donated to charity. This willideally be a very small amount, but waste will be a major problemuntil we can more closely predict our customers’ buying habits.
Personnel
In the first year of operation, Sweet Basil will have a staff of sixpeople, including the four owner-managers. The two additionalemployees will be Assistant Managers who both have a profit-sharing stake in the business; each receiving 5% of OperatingIncome. This structure is important because of Sweet Basil’sdedication to high quality service. It will give each AssistantManager an incentive to contribute to the prosperity of the business.
In order to provide the highest quality service, Sweet Basil will needto have four employees in the store at all times. Each one of theowner-managers will be equally trained to perform any task that isrequired at Sweet Basil. These duties include: cooking, cleaning,operations management, and customer relations. The two AssistantManagers will be trained to handle mostly cooking, cleaning, andcustomers, but they will also possess some knowledge of operationsmanagement. Sweet Basil intends to hire two cashiers and twodelivery drivers in the second year, and more employees ifnecessary. As the staff grows, it will be necessary to develop aformal training program which will be designed by the four owner-managers.
Point-of-Sale System
In order to aid our efficiency, Sweet Basil will use a completelyintegrated point-of-sale (POS) system.
Software
The software component will be custom designed during our earlydevelopment phases by the principals, and will assist us in thefollowing ways.
• Maintain information regarding our suppliers, including theirperformance
• Track all sales at the registers, including items purchased, price,method of payment, and which items were purchased together
• Track inventory and alert us to any problems• Print purchase orders when necessary• Track cost of goods sold• Pinpoint busy times and customer buying habits: this will aid in
knowing how much of which items to produce, and is critical inreducing waste
• Act as a time clock• Print financial reports
OPERATIONS21
Hardware
The hardware component of the system consists of the followingitems:
• Two check-out systems, each consisting of: a terminal, a display,a cash draw, a credit card reader and barcode scanner, and areceipt printer
• A system in the kitchen to track production• A server in the office which is connected to the check-out and
kitchen systems

FINANCIALS
SUMMARY OF FINANCIALS
SUMMARY OF FINANCIALS23
Capital Requirements:
The owners of Sweet Basil have each committed to invest $17,500for a total investment of $70,000. This initial investment will coverthe pre-opening expenses of $49,340, and allow for a cash cushionfor early losses or unexpected expenses.
Key Financial Assumptions:
• Assets are expensed when purchased• Sales double by August 1998• Sales grow 7% September to December 1998• Sales grow 10% quarterly for 1999 and 2000• Sales grow 10% annually for 2001 and 2002• COGS is 34.4% of sales• Profit-sharing is 10% of Operating Income• Dividends are 90% of Net Income
Financial Statements:
• Pre-Opening Expenses• Monthly Expenses• Expected Sales Month One• Year One Marketing Costs (1998)• Year One Income Statement (1998)• Five Year Income Statement (1998-2002)• Year One Balance Sheet (1998)• Five Year Balance Sheet (1998-2002)• Year One Cash Flow Statement (1998)• Five Year Cash Flow Statement (1998-2002)• Monthly Breakeven Analysis
Financial Charts:
• Year One Income Statement (1998)• Five Year Income Statement (1998-2002)• Year One Cash Flow Statement (1998)• Five Year Cash Flow Statement (1998-2002)• Year One Profit-Sharing and Dividend Payouts (1998)• Five Year Profit-Sharing and Dividend Payouts (1998-2002)• Monthly Breakeven Analysis
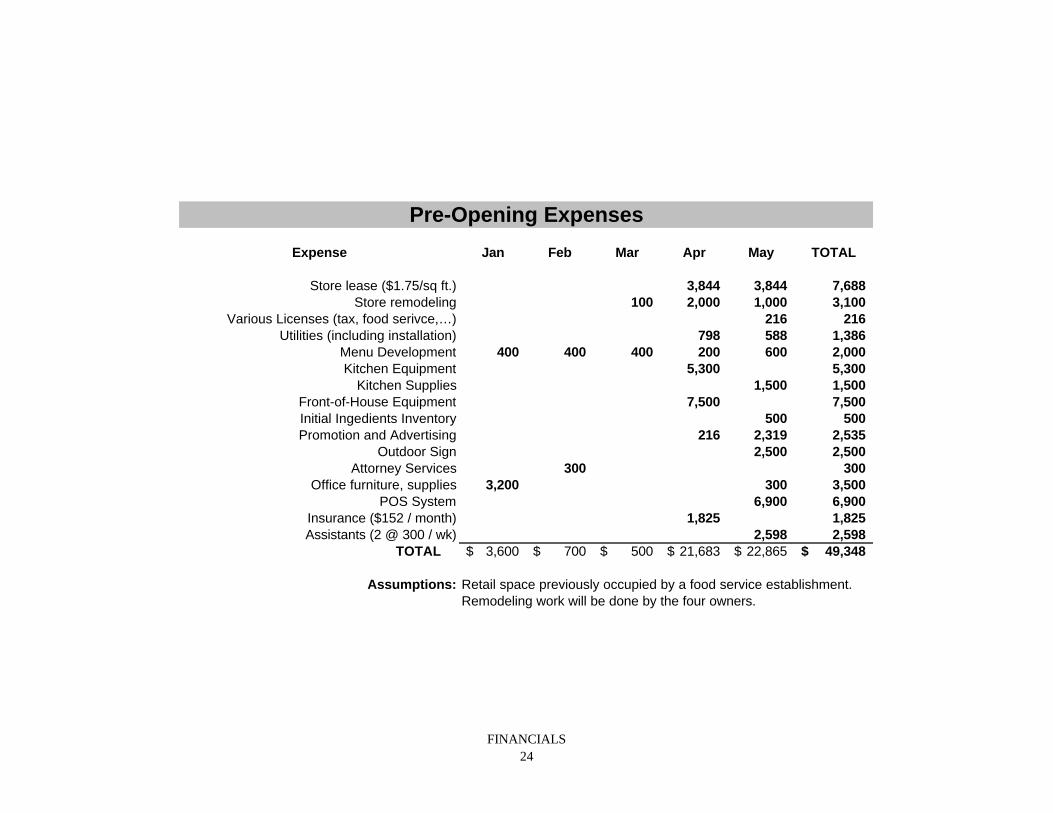
Pre-Opening Expenses
Expense Jan Feb Mar Apr May TOTAL
Store lease ($1.75/sq ft.) 3,844 3,844 7,688 Store remodeling 100 2,000 1,000 3,100
Various Licenses (tax, food serivce,…) 216 216 Utilities (including installation) 798 588 1,386
Menu Development 400 400 400 200 600 2,000 Kitchen Equipment 5,300 5,300
Kitchen Supplies 1,500 1,500 Front-of-House Equipment 7,500 7,500 Initial Ingedients Inventory 500 500 Promotion and Advertising 216 2,319 2,535
Outdoor Sign 2,500 2,500 Attorney Services 300 300
Office furniture, supplies 3,200 300 3,500 POS System 6,900 6,900
Insurance ($152 / month) 1,825 1,825 Assistants (2 @ 300 / wk) 2,598 2,598
TOTAL 3,600$ 700$ 500$ 21,683$ 22,865$ 49,348$
Assumptions: Retail space previously occupied by a food service establishment.Remodeling work will be done by the four owners.
FINANCIALS24
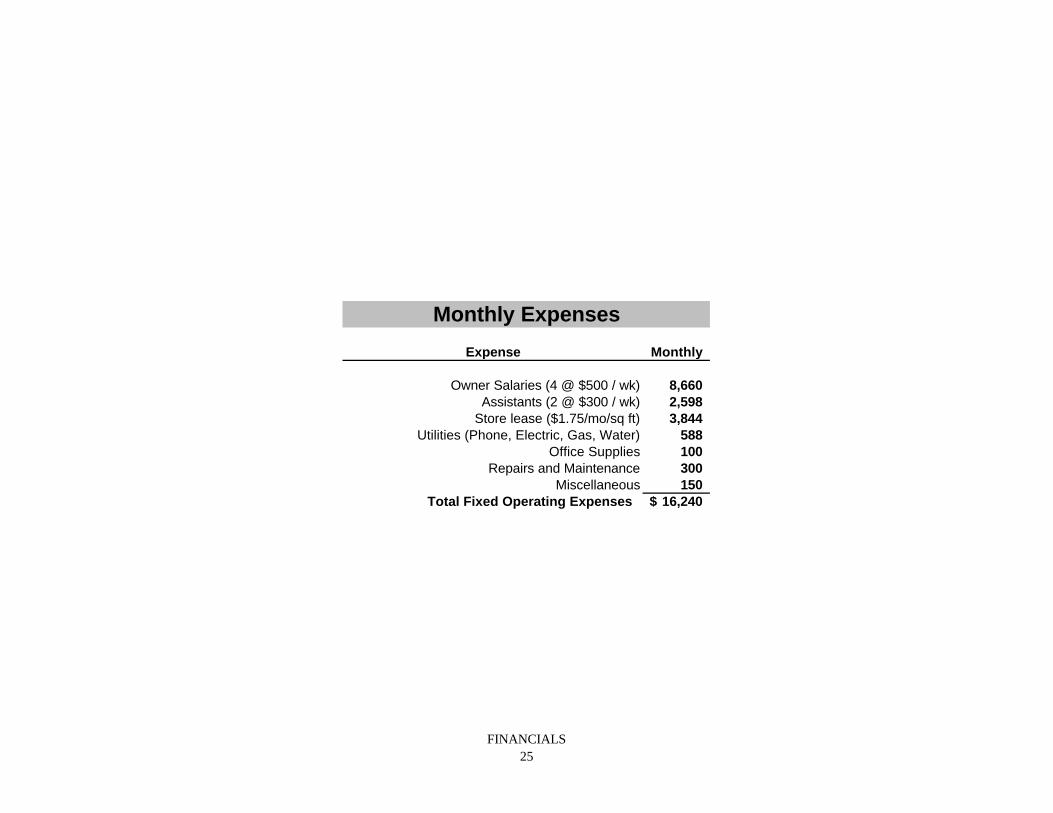
Monthly Expenses
Expense Monthly
Owner Salaries (4 @ $500 / wk) 8,660 Assistants (2 @ $300 / wk) 2,598
Store lease ($1.75/mo/sq ft) 3,844 Utilities (Phone, Electric, Gas, Water) 588
Office Supplies 100 Repairs and Maintenance 300
Miscellaneous 150 Total Fixed Operating Expenses 16,240$
FINANCIALS25

Month One Sales Projection (June 1998)
Quantity Quantity Price Cost Margin Monthly Monthly GrossItem (weekly) (monthly) (per unit) packaging ingredients (% of sales) per unit revenue COGS profit
Fresh Pasta (lbs) 80 346 2.75 0.10 0.20 10.91 2.45 953 104 849Fresh Sauces (quarts) 60 260 4.00 0.30 1.00 32.50 2.70 1,039 338 701
Soup (quarts) 30 130 6.00 0.30 1.25 25.83 4.45 779 201 578Pasta Salads (lbs) 45 195 3.50 0.10 0.50 17.14 2.90 682 117 565
Regular Salads (lbs) 60 260 3.00 0.30 0.50 26.67 2.20 779 208 572Appetizers (avg per serving) 180 779 3.00 0.40 0.75 38.33 1.85 2,338 896 1,442
Entrees (avg per serving) 320 1386 5.00 0.40 1.65 41.00 2.95 6,928 2,840 4,088Drinks (avg) 150 650 1.00 0.00 0.25 25.00 0.75 650 162 487
Total 14,148 4,867 9,281
Assumptions: $12 average ticket price40 customers per day
Cost per unit for
FINANCIALS26
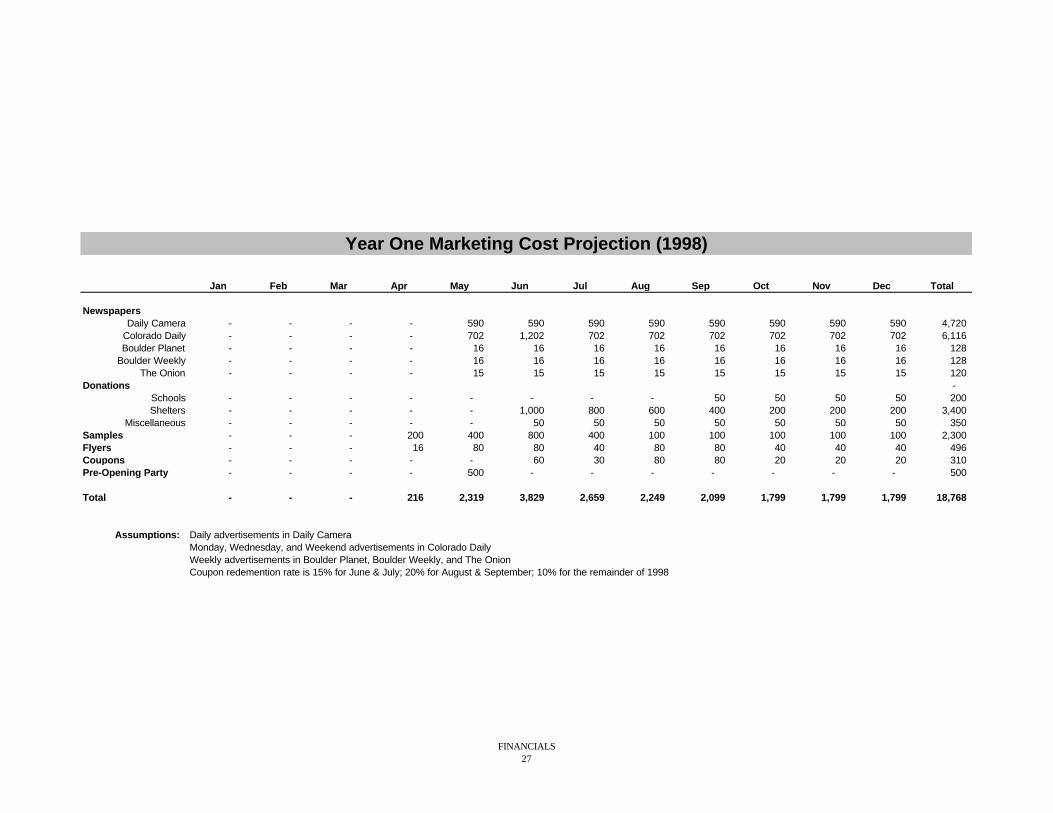
Year One Marketing Cost Projection (1998)
Jan Feb Mar Apr May Jun Jul Aug Sep Oct Nov Dec Total
NewspapersDaily Camera - - - - 590 590 590 590 590 590 590 590 4,720
Colorado Daily - - - - 702 1,202 702 702 702 702 702 702 6,116 Boulder Planet - - - - 16 16 16 16 16 16 16 16 128
Boulder Weekly - - - - 16 16 16 16 16 16 16 16 128 The Onion - - - - 15 15 15 15 15 15 15 15 120
Donations - Schools - - - - - - - - 50 50 50 50 200 Shelters - - - - - 1,000 800 600 400 200 200 200 3,400
Miscellaneous - - - - - 50 50 50 50 50 50 50 350 Samples - - - 200 400 800 400 100 100 100 100 100 2,300 Flyers - - - 16 80 80 40 80 80 40 40 40 496 Coupons - - - - - 60 30 80 80 20 20 20 310 Pre-Opening Party - - - - 500 - - - - - - - 500
Total - - - 216 2,319 3,829 2,659 2,249 2,099 1,799 1,799 1,799 18,768
Assumptions: Daily advertisements in Daily CameraMonday, Wednesday, and Weekend advertisements in Colorado DailyWeekly advertisements in Boulder Planet, Boulder Weekly, and The OnionCoupon redemention rate is 15% for June & July; 20% for August & September; 10% for the remainder of 1998
FINANCIALS27
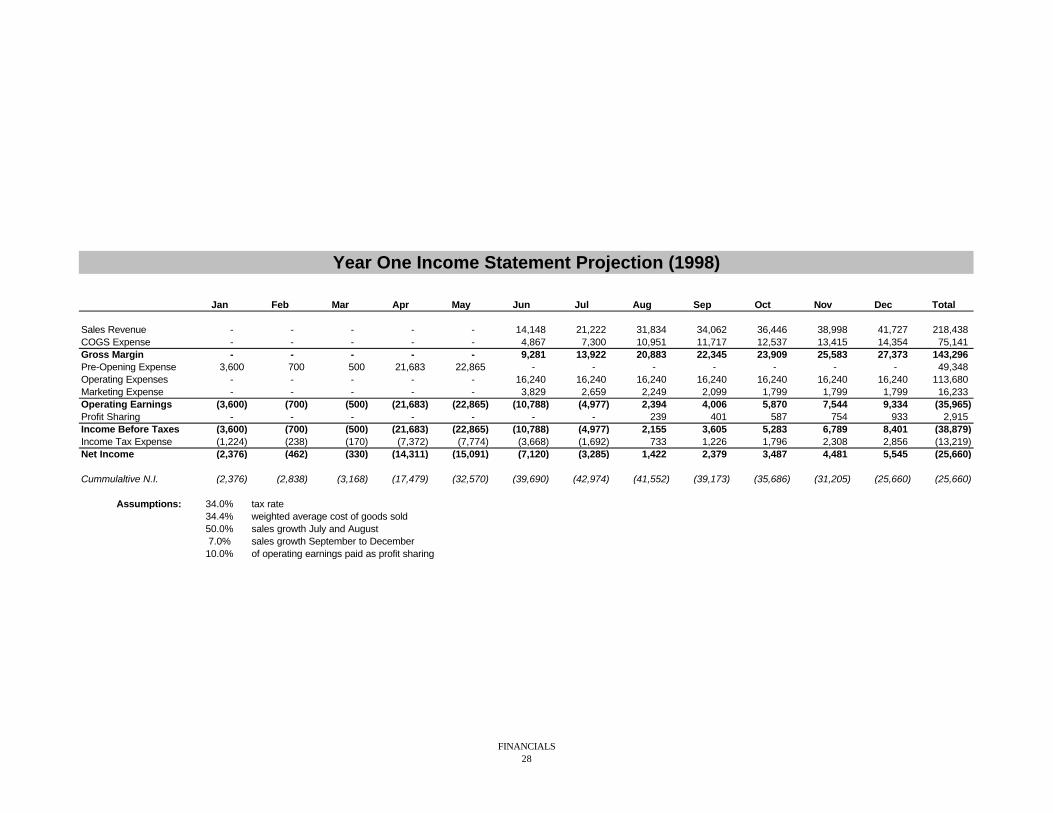
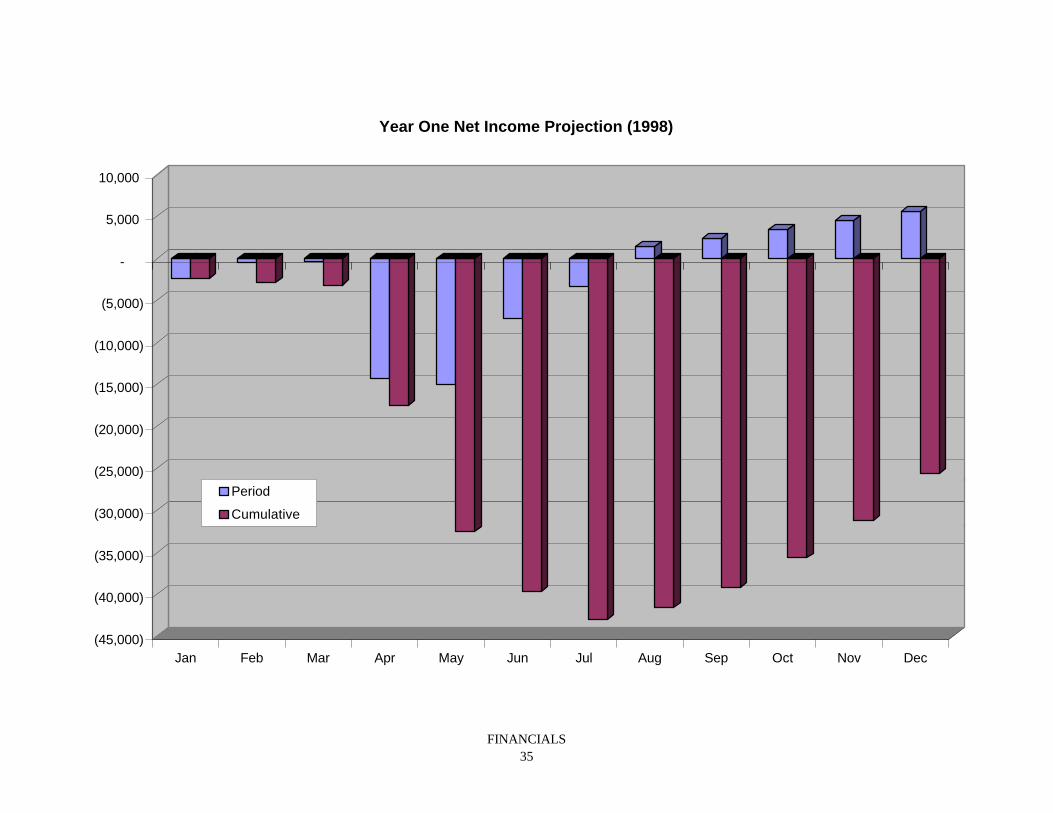
Year One Income Statement Projection (1998)
Jan Feb Mar Apr May Jun Jul Aug Sep Oct Nov Dec Total
Sales Revenue - - - - - 14,148 21,222 31,834 34,062 36,446 38,998 41,727 218,438 COGS Expense - - - - - 4,867 7,300 10,951 11,717 12,537 13,415 14,354 75,141 Gross Margin - - - - - 9,281 13,922 20,883 22,345 23,909 25,583 27,373 143,296 Pre-Opening Expense 3,600 700 500 21,683 22,865 - - - - - - - 49,348 Operating Expenses - - - - - 16,240 16,240 16,240 16,240 16,240 16,240 16,240 113,680 Marketing Expense - - - - - 3,829 2,659 2,249 2,099 1,799 1,799 1,799 16,233 Operating Earnings (3,600) (700) (500) (21,683) (22,865) (10,788) (4,977) 2,394 4,006 5,870 7,544 9,334 (35,965) Profit Sharing - - - - - - - 239 401 587 754 933 2,915 Income Before Taxes (3,600) (700) (500) (21,683) (22,865) (10,788) (4,977) 2,155 3,605 5,283 6,789 8,401 (38,879) Income Tax Expense (1,224) (238) (170) (7,372) (7,774) (3,668) (1,692) 733 1,226 1,796 2,308 2,856 (13,219) Net Income (2,376) (462) (330) (14,311) (15,091) (7,120) (3,285) 1,422 2,379 3,487 4,481 5,545 (25,660)
Cummulaltive N.I. (2,376) (2,838) (3,168) (17,479) (32,570) (39,690) (42,974) (41,552) (39,173) (35,686) (31,205) (25,660) (25,660)
Assumptions: 34.0% tax rate34.4% weighted average cost of goods sold50.0% sales growth July and August7.0% sales growth September to December
10.0% of operating earnings paid as profit sharing
FINANCIALS28
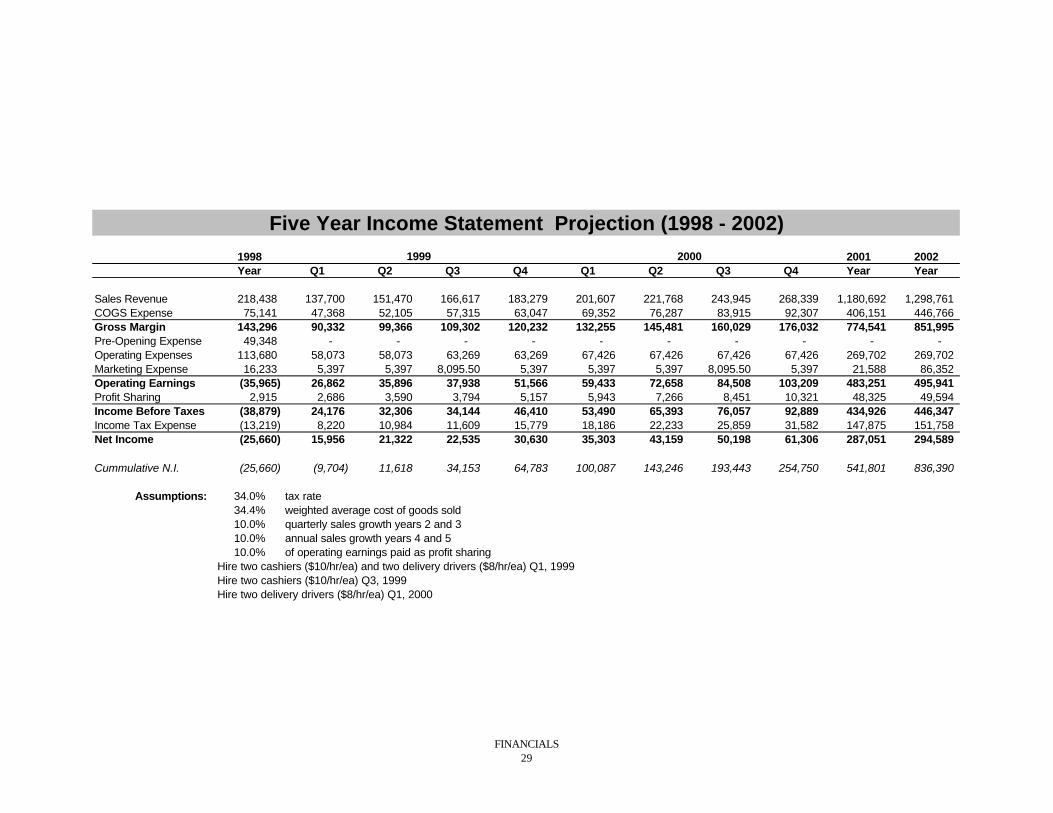
1998 2001 2002Year Q1 Q2 Q3 Q4 Q1 Q2 Q3 Q4 Year Year
Sales Revenue 218,438 137,700 151,470 166,617 183,279 201,607 221,768 243,945 268,339 1,180,692 1,298,761 COGS Expense 75,141 47,368 52,105 57,315 63,047 69,352 76,287 83,915 92,307 406,151 446,766 Gross Margin 143,296 90,332 99,366 109,302 120,232 132,255 145,481 160,029 176,032 774,541 851,995 Pre-Opening Expense 49,348 - - - - - - - - - - Operating Expenses 113,680 58,073 58,073 63,269 63,269 67,426 67,426 67,426 67,426 269,702 269,702 Marketing Expense 16,233 5,397 5,397 8,095.50 5,397 5,397 5,397 8,095.50 5,397 21,588 86,352 Operating Earnings (35,965) 26,862 35,896 37,938 51,566 59,433 72,658 84,508 103,209 483,251 495,941 Profit Sharing 2,915 2,686 3,590 3,794 5,157 5,943 7,266 8,451 10,321 48,325 49,594 Income Before Taxes (38,879) 24,176 32,306 34,144 46,410 53,490 65,393 76,057 92,889 434,926 446,347 Income Tax Expense (13,219) 8,220 10,984 11,609 15,779 18,186 22,233 25,859 31,582 147,875 151,758 Net Income (25,660) 15,956 21,322 22,535 30,630 35,303 43,159 50,198 61,306 287,051 294,589
Cummulative N.I. (25,660) (9,704) 11,618 34,153 64,783 100,087 143,246 193,443 254,750 541,801 836,390
Assumptions: 34.0% tax rate34.4% weighted average cost of goods sold10.0% quarterly sales growth years 2 and 310.0% annual sales growth years 4 and 510.0% of operating earnings paid as profit sharing
Hire two cashiers ($10/hr/ea) and two delivery drivers ($8/hr/ea) Q1, 1999Hire two cashiers ($10/hr/ea) Q3, 1999Hire two delivery drivers ($8/hr/ea) Q1, 2000
Five Year Income Statement Projection (1998 - 2002)1999 2000
FINANCIALS29
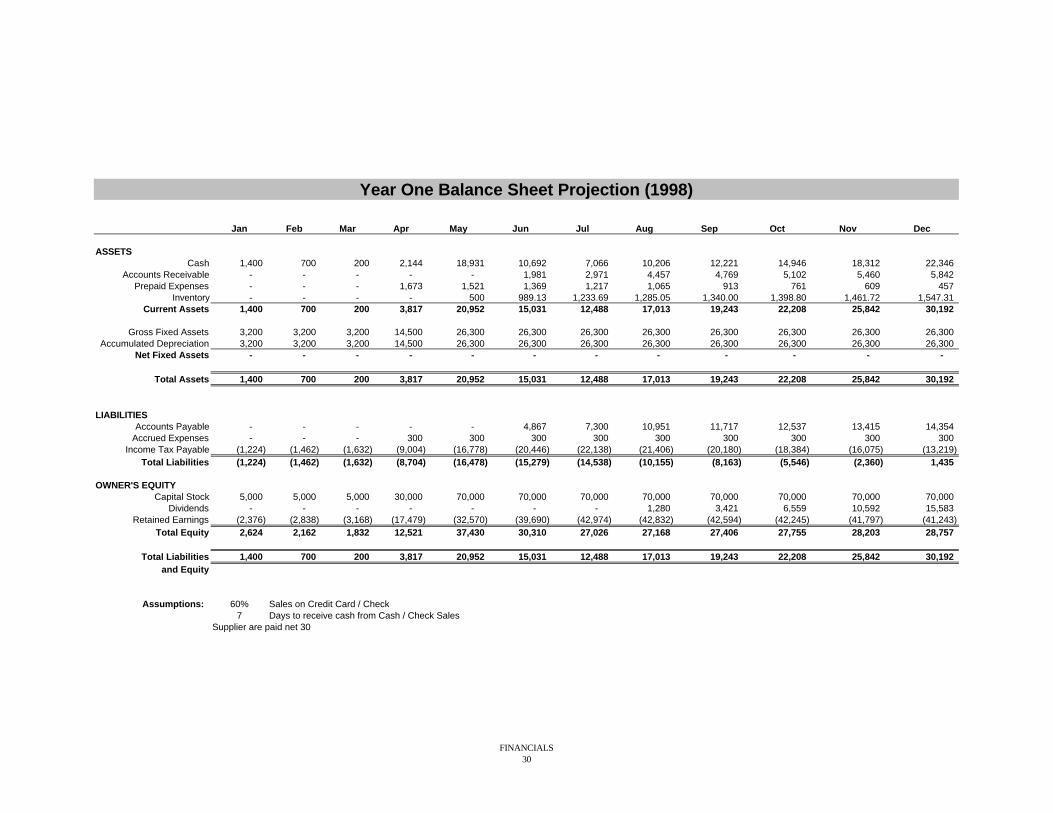
Year One Balance Sheet Projection (1998)
Jan Feb Mar Apr May Jun Jul Aug Sep Oct Nov Dec
ASSETSCash 1,400 700 200 2,144 18,931 10,692 7,066 10,206 12,221 14,946 18,312 22,346
Accounts Receivable - - - - - 1,981 2,971 4,457 4,769 5,102 5,460 5,842 Prepaid Expenses - - - 1,673 1,521 1,369 1,217 1,065 913 761 609 457
Inventory - - - - 500 989.13 1,233.69 1,285.05 1,340.00 1,398.80 1,461.72 1,547.31 Current Assets 1,400 700 200 3,817 20,952 15,031 12,488 17,013 19,243 22,208 25,842 30,192
Gross Fixed Assets 3,200 3,200 3,200 14,500 26,300 26,300 26,300 26,300 26,300 26,300 26,300 26,300 Accumulated Depreciation 3,200 3,200 3,200 14,500 26,300 26,300 26,300 26,300 26,300 26,300 26,300 26,300
Net Fixed Assets - - - - - - - - - - - -
Total Assets 1,400 700 200 3,817 20,952 15,031 12,488 17,013 19,243 22,208 25,842 30,192
LIABILITIESAccounts Payable - - - - - 4,867 7,300 10,951 11,717 12,537 13,415 14,354
Accrued Expenses - - - 300 300 300 300 300 300 300 300 300 Income Tax Payable (1,224) (1,462) (1,632) (9,004) (16,778) (20,446) (22,138) (21,406) (20,180) (18,384) (16,075) (13,219)
Total Liabilities (1,224) (1,462) (1,632) (8,704) (16,478) (15,279) (14,538) (10,155) (8,163) (5,546) (2,360) 1,435
OWNER'S EQUITYCapital Stock 5,000 5,000 5,000 30,000 70,000 70,000 70,000 70,000 70,000 70,000 70,000 70,000
Dividends - - - - - - - 1,280 3,421 6,559 10,592 15,583 Retained Earnings (2,376) (2,838) (3,168) (17,479) (32,570) (39,690) (42,974) (42,832) (42,594) (42,245) (41,797) (41,243)
Total Equity 2,624 2,162 1,832 12,521 37,430 30,310 27,026 27,168 27,406 27,755 28,203 28,757
Total Liabilities 1,400 700 200 3,817 20,952 15,031 12,488 17,013 19,243 22,208 25,842 30,192 and Equity
Assumptions: 60% Sales on Credit Card / Check7 Days to receive cash from Cash / Check Sales
Supplier are paid net 30
FINANCIALS30
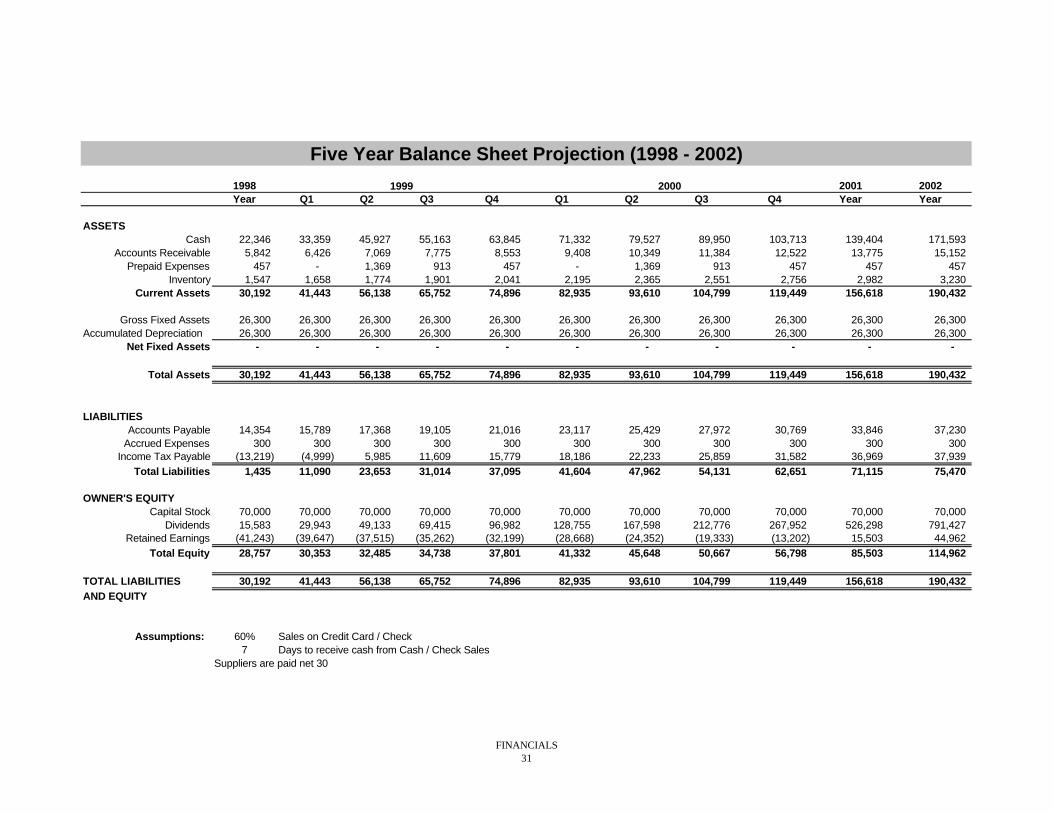
Five Year Balance Sheet Projection (1998 - 2002)
1998 2001 2002Year Q1 Q2 Q3 Q4 Q1 Q2 Q3 Q4 Year Year
ASSETSCash 22,346 33,359 45,927 55,163 63,845 71,332 79,527 89,950 103,713 139,404 171,593
Accounts Receivable 5,842 6,426 7,069 7,775 8,553 9,408 10,349 11,384 12,522 13,775 15,152 Prepaid Expenses 457 - 1,369 913 457 - 1,369 913 457 457 457
Inventory 1,547 1,658 1,774 1,901 2,041 2,195 2,365 2,551 2,756 2,982 3,230 Current Assets 30,192 41,443 56,138 65,752 74,896 82,935 93,610 104,799 119,449 156,618 190,432
Gross Fixed Assets 26,300 26,300 26,300 26,300 26,300 26,300 26,300 26,300 26,300 26,300 26,300 Accumulated Depreciation 26,300 26,300 26,300 26,300 26,300 26,300 26,300 26,300 26,300 26,300 26,300
Net Fixed Assets - - - - - - - - - - -
Total Assets 30,192 41,443 56,138 65,752 74,896 82,935 93,610 104,799 119,449 156,618 190,432
LIABILITIESAccounts Payable 14,354 15,789 17,368 19,105 21,016 23,117 25,429 27,972 30,769 33,846 37,230
Accrued Expenses 300 300 300 300 300 300 300 300 300 300 300 Income Tax Payable (13,219) (4,999) 5,985 11,609 15,779 18,186 22,233 25,859 31,582 36,969 37,939
Total Liabilities 1,435 11,090 23,653 31,014 37,095 41,604 47,962 54,131 62,651 71,115 75,470
OWNER'S EQUITYCapital Stock 70,000 70,000 70,000 70,000 70,000 70,000 70,000 70,000 70,000 70,000 70,000
Dividends 15,583 29,943 49,133 69,415 96,982 128,755 167,598 212,776 267,952 526,298 791,427 Retained Earnings (41,243) (39,647) (37,515) (35,262) (32,199) (28,668) (24,352) (19,333) (13,202) 15,503 44,962
Total Equity 28,757 30,353 32,485 34,738 37,801 41,332 45,648 50,667 56,798 85,503 114,962
TOTAL LIABILITIES 30,192 41,443 56,138 65,752 74,896 82,935 93,610 104,799 119,449 156,618 190,432 AND EQUITY
Assumptions: 60% Sales on Credit Card / Check7 Days to receive cash from Cash / Check Sales
Suppliers are paid net 30
1999 2000
FINANCIALS31

Year One Cash Flow Projection (1998)
Account Jan Feb Mar Apr May Jun Jul Aug Sep Oct Nov Dec
Cash Flows from Operating ActivitiesNet Income (2,376) (462) (330) (14,311) (15,091) (7,120) (3,285) 1,422 2,379 3,487 4,481 5,545
Changes in operating cycleAssets and Liabilities: -
Accounts receivable increase (decrease) - - - - - 1,981 990 1,486 312 334 357 382 Inventory increase (decrease) - - - - 500 489 245 51 55 59 63 86
Prepaid expense increase (decrease) - - - 1,673 (152) (152) (152) (152) (152) (152) (152) (152) Accounts payable increase (decrease) - - - - - 4,867 2,433 3,650 767 820 878 939 Accrued expenses increase (decrease) - - - 300 - - - - - - - -
Income Taxes Payable increase (decrease) (1,224) (238) (170) (7,372) (7,774) (3,668) (1,692) 733 1,226 1,796 2,308 2,856 Operating Cash-Flow Before Depreciation (3,600) (700) (500) (23,056) (23,213) (8,239) (3,626) 4,420 4,157 5,863 7,399 9,024
Depreciation expense 3,200 - - 11,300 11,800 - - - - - - - Cash Flow from Profit-Making Operations (400) (700) (500) (11,756) (11,413) (8,239) (3,626) 4,420 4,157 5,863 7,399 9,024
Cash Flows from Investing ActivitiesPurchases of PP&E 3,200 - - 11,300 11,800 - - - - - - -
Cash Flows from Financing ActivitiesCapital Stock issues 5,000 - - 25,000 40,000 - - - - - - -
Dividend Payment - - - - - - - 1,280 2,142 3,138 4,033 4,990
Increase (Decrease) in cash 1,400 (700) (500) 1,944 16,787 (8,239) (3,626) 3,140 2,015 2,724 3,366 4,034 Cummulative Cash 1,400 700 200 2,144 18,931 10,692 7,066 10,206 12,221 14,946 18,312 22,346
FINANCIALS32
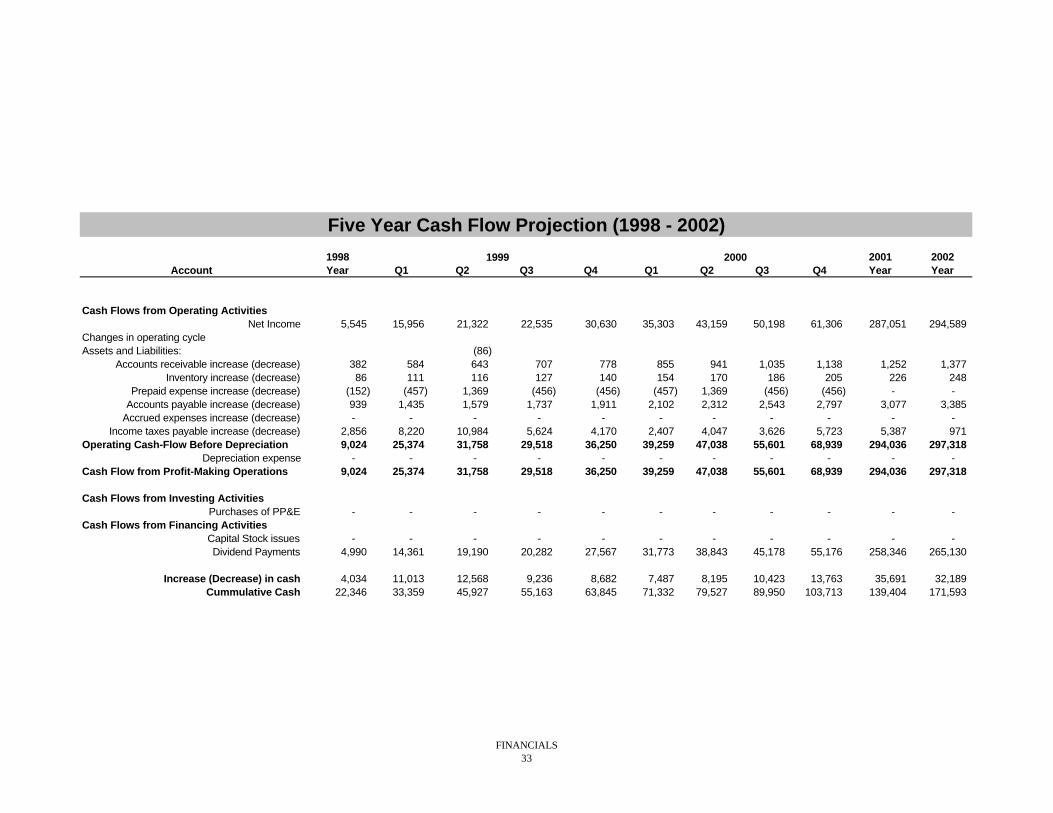
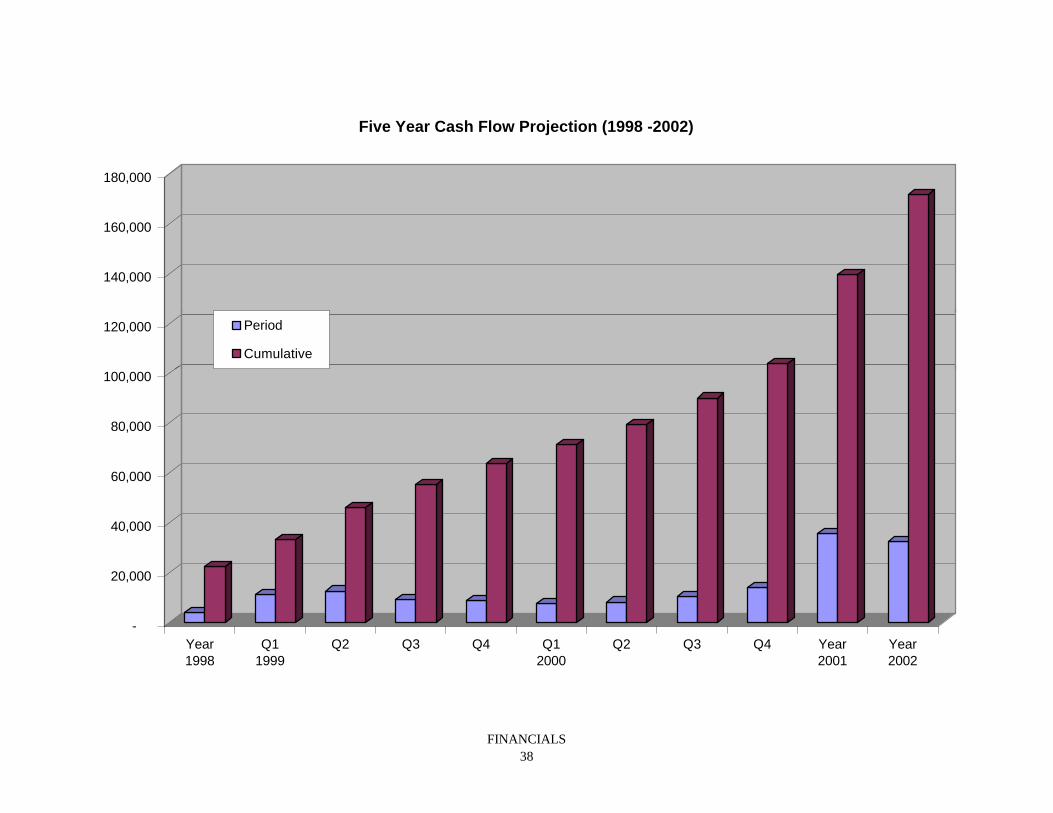
Five Year Cash Flow Projection (1998 - 2002)
1998 2001 2002Account Year Q1 Q2 Q3 Q4 Q1 Q2 Q3 Q4 Year Year
Cash Flows from Operating ActivitiesNet Income 5,545 15,956 21,322 22,535 30,630 35,303 43,159 50,198 61,306 287,051 294,589
Changes in operating cycleAssets and Liabilities: (86)
Accounts receivable increase (decrease) 382 584 643 707 778 855 941 1,035 1,138 1,252 1,377 Inventory increase (decrease) 86 111 116 127 140 154 170 186 205 226 248
Prepaid expense increase (decrease) (152) (457) 1,369 (456) (456) (457) 1,369 (456) (456) - - Accounts payable increase (decrease) 939 1,435 1,579 1,737 1,911 2,102 2,312 2,543 2,797 3,077 3,385
Accrued expenses increase (decrease) - - - - - - - - - - - Income taxes payable increase (decrease) 2,856 8,220 10,984 5,624 4,170 2,407 4,047 3,626 5,723 5,387 971
Operating Cash-Flow Before Depreciation 9,024 25,374 31,758 29,518 36,250 39,259 47,038 55,601 68,939 294,036 297,318 Depreciation expense - - - - - - - - - - -
Cash Flow from Profit-Making Operations 9,024 25,374 31,758 29,518 36,250 39,259 47,038 55,601 68,939 294,036 297,318
Cash Flows from Investing ActivitiesPurchases of PP&E - - - - - - - - - - -
Cash Flows from Financing ActivitiesCapital Stock issues - - - - - - - - - - - Dividend Payments 4,990 14,361 19,190 20,282 27,567 31,773 38,843 45,178 55,176 258,346 265,130
Increase (Decrease) in cash 4,034 11,013 12,568 9,236 8,682 7,487 8,195 10,423 13,763 35,691 32,189 Cummulative Cash 22,346 33,359 45,927 55,163 63,845 71,332 79,527 89,950 103,713 139,404 171,593
1999 2000
FINANCIALS33
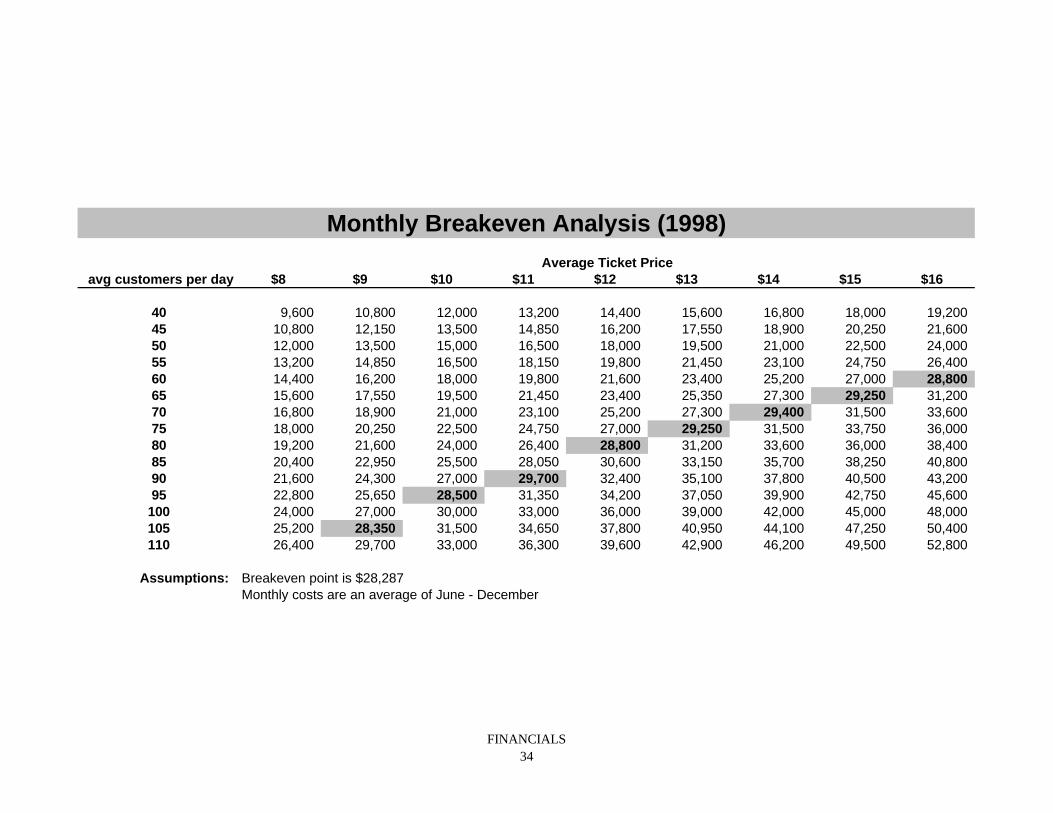
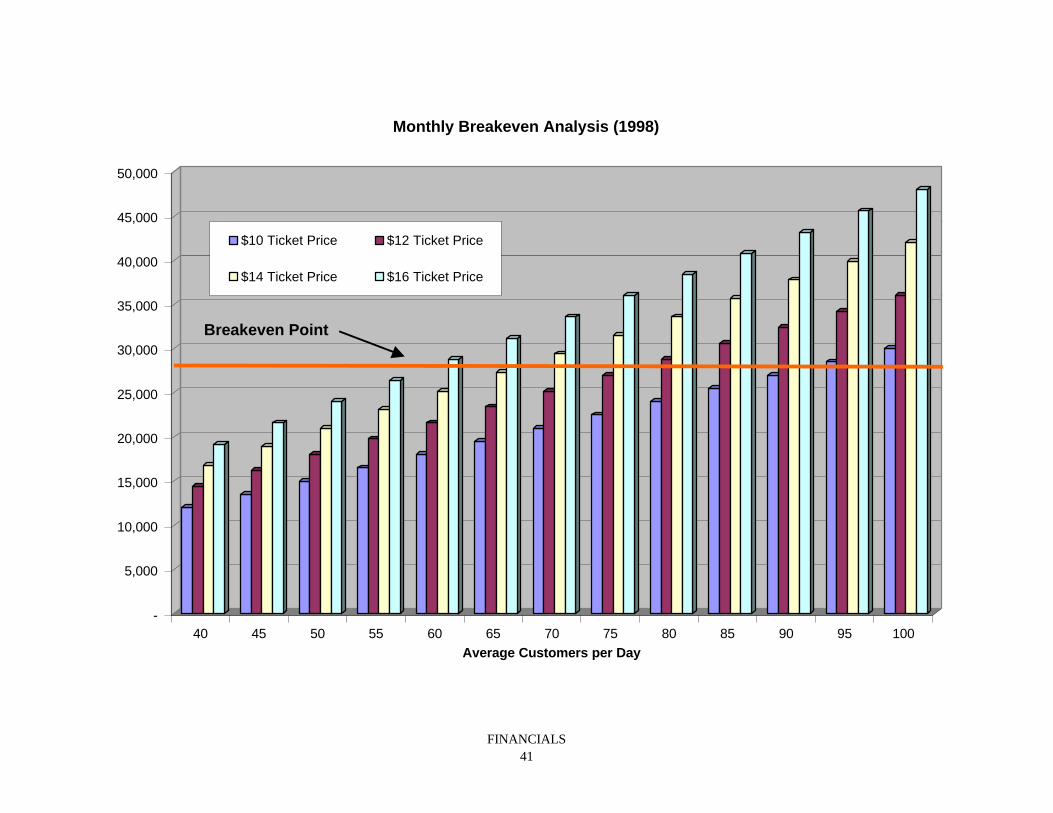
avg customers per day $8 $9 $10 $11 $12 $13 $14 $15 $16
40 9,600 10,800 12,000 13,200 14,400 15,600 16,800 18,000 19,200 45 10,800 12,150 13,500 14,850 16,200 17,550 18,900 20,250 21,600 50 12,000 13,500 15,000 16,500 18,000 19,500 21,000 22,500 24,000 55 13,200 14,850 16,500 18,150 19,800 21,450 23,100 24,750 26,400 60 14,400 16,200 18,000 19,800 21,600 23,400 25,200 27,000 28,800 65 15,600 17,550 19,500 21,450 23,400 25,350 27,300 29,250 31,200 70 16,800 18,900 21,000 23,100 25,200 27,300 29,400 31,500 33,600 75 18,000 20,250 22,500 24,750 27,000 29,250 31,500 33,750 36,000 80 19,200 21,600 24,000 26,400 28,800 31,200 33,600 36,000 38,400 85 20,400 22,950 25,500 28,050 30,600 33,150 35,700 38,250 40,800 90 21,600 24,300 27,000 29,700 32,400 35,100 37,800 40,500 43,200 95 22,800 25,650 28,500 31,350 34,200 37,050 39,900 42,750 45,600
100 24,000 27,000 30,000 33,000 36,000 39,000 42,000 45,000 48,000 105 25,200 28,350 31,500 34,650 37,800 40,950 44,100 47,250 50,400 110 26,400 29,700 33,000 36,300 39,600 42,900 46,200 49,500 52,800
Assumptions: Breakeven point is $28,287Monthly costs are an average of June - December
Monthly Breakeven Analysis (1998)
Average Ticket Price
FINANCIALS34
FINANCIALS35
(45,000)
(40,000)
(35,000)
(30,000)
(25,000)
(20,000)
(15,000)
(10,000)
(5,000)
-
5,000
10,000
Jan Feb Mar Apr May Jun Jul Aug Sep Oct Nov Dec
Year One Net Income Projection (1998)
Period
Cumulative

FINANCIALS36
(100,000)
-
100,000
200,000
300,000
400,000
500,000
600,000
700,000
800,000
900,000
Year1998
Q11999
Q2 Q3 Q4 Q12000
Q2 Q3 Q4 Year2001
Year2002
Five Year Net Income Projection (1998 - 2002)
Period
Cumulative
FINANCIALS37
(10,000)
(5,000)
-
5,000
10,000
15,000
20,000
25,000
Jan Feb Mar Apr May Jun Jul Aug Sep Oct Nov Dec
Year One Cash Flow Projection (1998)
Period
Cumulative
FINANCIALS38
-
20,000
40,000
60,000
80,000
100,000
120,000
140,000
160,000
180,000
Year1998
Q11999
Q2 Q3 Q4 Q12000
Q2 Q3 Q4 Year2001
Year2002
Five Year Cash Flow Projection (1998 -2002)
Period
Cumulative

FINANCIALS39
-
500
1,000
1,500
2,000
2,500
3,000
3,500
4,000
4,500
5,000
Jan Feb Mar Apr May Jun Jul Aug Sep Oct Nov Dec
Year One Profit Sharing and Dividend Payout Projection (1998)
Profit Sharing
Dividends
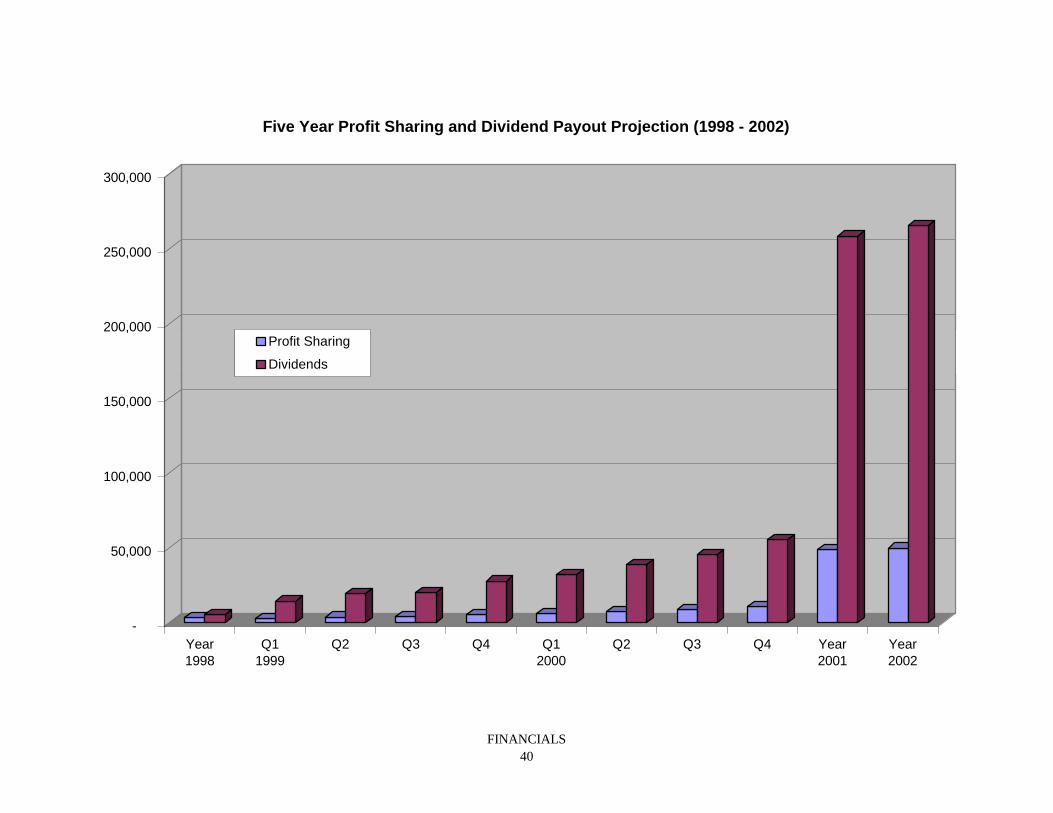
FINANCIALS40
-
50,000
100,000
150,000
200,000
250,000
300,000
Year1998
Q11999
Q2 Q3 Q4 Q12000
Q2 Q3 Q4 Year2001
Year2002
Five Year Profit Sharing and Dividend Payout Projection (1998 - 2002)
Profit Sharing
Dividends
FINANCIALS41
-
5,000
10,000
15,000
20,000
25,000
30,000
35,000
40,000
45,000
50,000
40 45 50 55 60 65 70 75 80 85 90 95 100
Average Customers per Day
Monthly Breakeven Analysis (1998)
$10 Ticket Price $12 Ticket Price
$14 Ticket Price $16 Ticket Price
Breakeven Point
APPENDICES
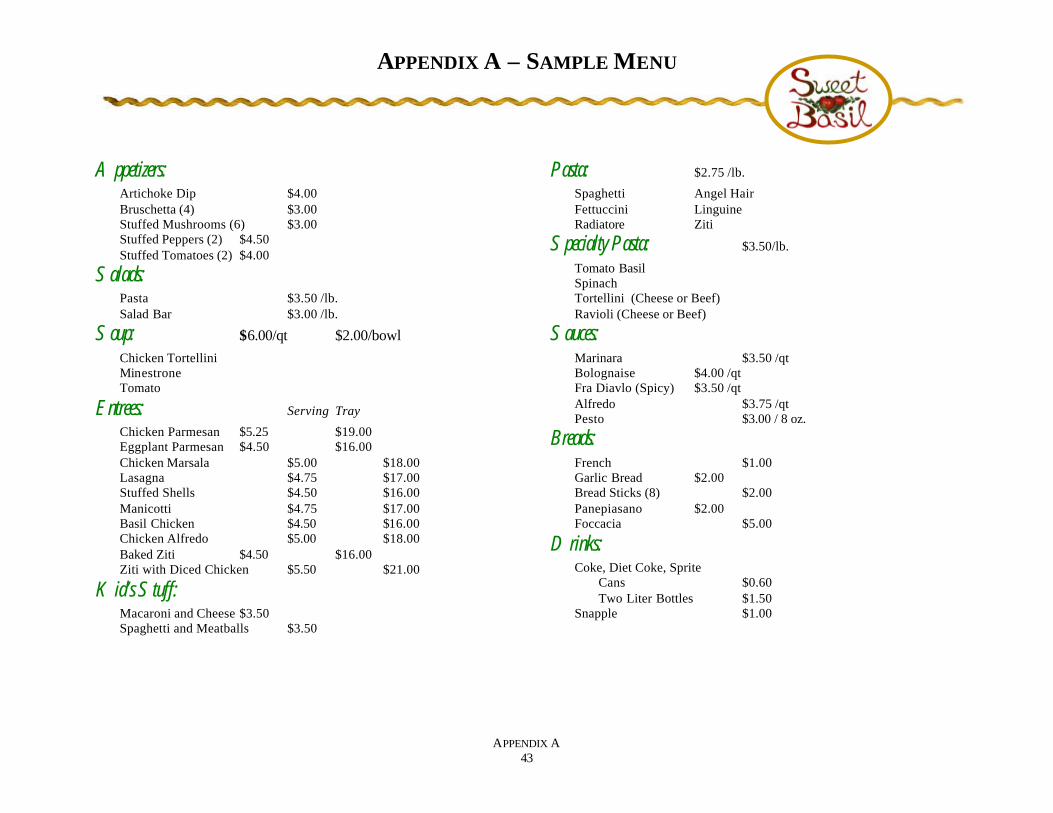
APPENDIX A – SAMPLE MENU
APPENDIX A43
Appetizers:Artichoke Dip $4.00Bruschetta (4) $3.00Stuffed Mushrooms (6) $3.00Stuffed Peppers (2) $4.50Stuffed Tomatoes (2) $4.00
Salads:Pasta $3.50 /lb.Salad Bar $3.00 /lb.
Soup: $6.00/qt $2.00/bowlChicken TortelliniMinestroneTomato
Entrees: Serving Tray
Chicken Parmesan $5.25 $19.00Eggplant Parmesan $4.50 $16.00Chicken Marsala $5.00 $18.00Lasagna $4.75 $17.00Stuffed Shells $4.50 $16.00Manicotti $4.75 $17.00Basil Chicken $4.50 $16.00Chicken Alfredo $5.00 $18.00Baked Ziti $4.50 $16.00Ziti with Diced Chicken $5.50 $21.00
Kid’s Stuff:Macaroni and Cheese $3.50Spaghetti and Meatballs $3.50
Pasta: $2.75 /lb.
Spaghetti Angel HairFettuccini LinguineRadiatore Ziti
Specialty Pasta: $3.50/lb.
Tomato BasilSpinachTortellini (Cheese or Beef)Ravioli (Cheese or Beef)
Sauces:Marinara $3.50 /qtBolognaise $4.00 /qtFra Diavlo (Spicy) $3.50 /qtAlfredo $3.75 /qtPesto $3.00 / 8 oz.
Breads:French $1.00Garlic Bread $2.00Bread Sticks (8) $2.00Panepiasano $2.00Foccacia $5.00
Drinks:Coke, Diet Coke, Sprite
Cans $0.60Two Liter Bottles $1.50
Snapple $1.00
APPENDIX B - RESUMES
APPENDIX B44
David Wein
EDUCATION: University of Colorado at BoulderCandidate for Bachelor of Science; December 1998Business Administration with an emphasis in Information SystemsOverall GPA 3.03
EXPERIENCE: Computer City, Westminster, CO 1996• Handled sales of CPU’s, Monitors, Peripherals, Software, and Accessories• Led a pre-sale equipment inspection and a post-sale customer satisfaction program• Weekly sales consistently among the top of the sales staff, ranging from $25,000 to $55,000• Occasionally performed equipment upgrades such as RAM installations
NYU Medical Center, New York, NY 1995• Designed and developed an application and database which tracked a large number of patient samples using a bar code system• Designed PowerPoint presentations which were used to solicit grants• Consulted on the purchase of computer related office equipment• Installed desktop systems and software for OB/GYN staff
Banklink, Inc., New York, NY 1995• Tested a windows based financial software package prior to release• Worked closely with product managers in finalizing the GUI aspects of the application• Led company in bugs found over the seven week test period
APPENDIX B45
Jillian Doman
EDUCATION: University of Colorado at BoulderCandidate for Bachelor of Science; December 1997Business Administration with an emphasis in EntrepreneurshipOverall GPA 3.2
EXPERIENCE: Applebee’s Grill and Bar, Boulder, CO October 1995-Present• Office Manager- duties include: doing payroll, making server and hostess schedule, analyzing daily paperwork• Trainer- duties include: training new employees in all positions I hold, updating employee files• Bartender- duties include: opening/closing the bar, making drinks, customer relations• Server- duties include: opening/closing the restaurant, customer relations• Hostess- duties include: greeting/seating customers• Expediter/Prep Cook - duties include: knowledge of how the Back-of-the-House runs
Lerner New York, Boulder, CO September 1994-December 1995• Sales Associate- duties include: providing customer service by helping each customer with any questions, problems, or purchase
decisions
Jimmy’s Sports Bar, Hong Kong, June 1994-August 1994• Server- duties include: opening/closing the restaurant, customer relations• Bartender- duties include: opening/closing the bar, making drinks, customer relations
TRAVELEXPERIENCE: Countries visited include:
• Europe- Austria, Belgium, Chezch Republic, England, France, Germany, Greece, Hungary, Italy, Netherlands,Switzerland
• Asia- Bhutan, Hong Kong, India, Nepal, Thailand, Singapore• Other- Australia, Mexico, New Zealand, Tahiti
APPENDIX B46
Lindsay Strodl
EDUCATION: University of Colorado at BoulderCandidate for Bachelor of Science; December 1997Business Administration with an emphasis in EntrepreneurshipOverall GPA 3.1
University of Colorado at BoulderCandidate for Elementary Education Teaching Certificate, December 1998Education GPA 4.0
EXPERIENCE: State Farm Insurance, Las Vegas, Nevada May 1992-August 1995• Administrative Assistant• Aided in selling insurance to customers
Boulder Valley Public Schools, Boulder, Colorado August 1995-August 1997• School aged child care assistant• Cared for 50+ children on a daily basis• Planned and facilitated activities and excursions
Collage Children’s Museum, Boulder, Colorado September 1996-December 1996• Volunteer experience• Supervised set-up and coordination of exhibits• Planned Piper Jaffray Auction Night
Campus Crusade for Christ, Boulder, Colorado September1995-PresentLeadership TeamServant TeamNight Life Coordinator• Planned several study groups• Coordinator for weekly meeting, Night Life• Planning, budgeting, personnel consultant, and other administrative duties
APPENDIX B47
Amber Long
EDUCATION: University of Colorado at BoulderCandidate for Bachelor of Science, May 1998Business Administration: Marketing with an emphasis in EntrepreneurshipOverall GPA 3.3
EXPERIENCE: Gloria Jean’s Coffee Bean, Littleton, CO October 1991-August 1994• Shift Supervisor responsible for all closing activities and basic bookkeeping• Assisted with Monthly Inventory• Prepared and served coffee, espresso drinks as well as pastries
Collegiate Calendar Company Internship, Boulder, CO Spring 1997-Present• Responsible for sales on 30 of the largest university campuses in the nation• Managed the creation and production of each individual advertisement.• Helped to create and implement a payroll and bookkeeping system.
Enterprise Rent-a-Car Internship, Littleton, CO Summer 1996• Responsible for underwriting rental contracts• Trained in direct selling techniques• Participated in direct marketing to Enterprise accounts
ACTIVITIES: Alpha Phi OmegaElected Pledge Chair Spring 1997Elected Chapter President Fall 1996Appointed Chancellor of Merit Badge University Fall 1996Elected Treasurer Spring 1996
Fundraising Co-Chair Spring 1996Elected Secretary Spring 1995Pledge Class Vice President Fall 1994• Created, monitored and implemented a $1200 semester budget• Managed three financial accounts• Aided in the writing of a grant for a community outreach Program for Suicide Prevention.• Received Explorer Leadership Award for work as Merit Badge University Chancellor
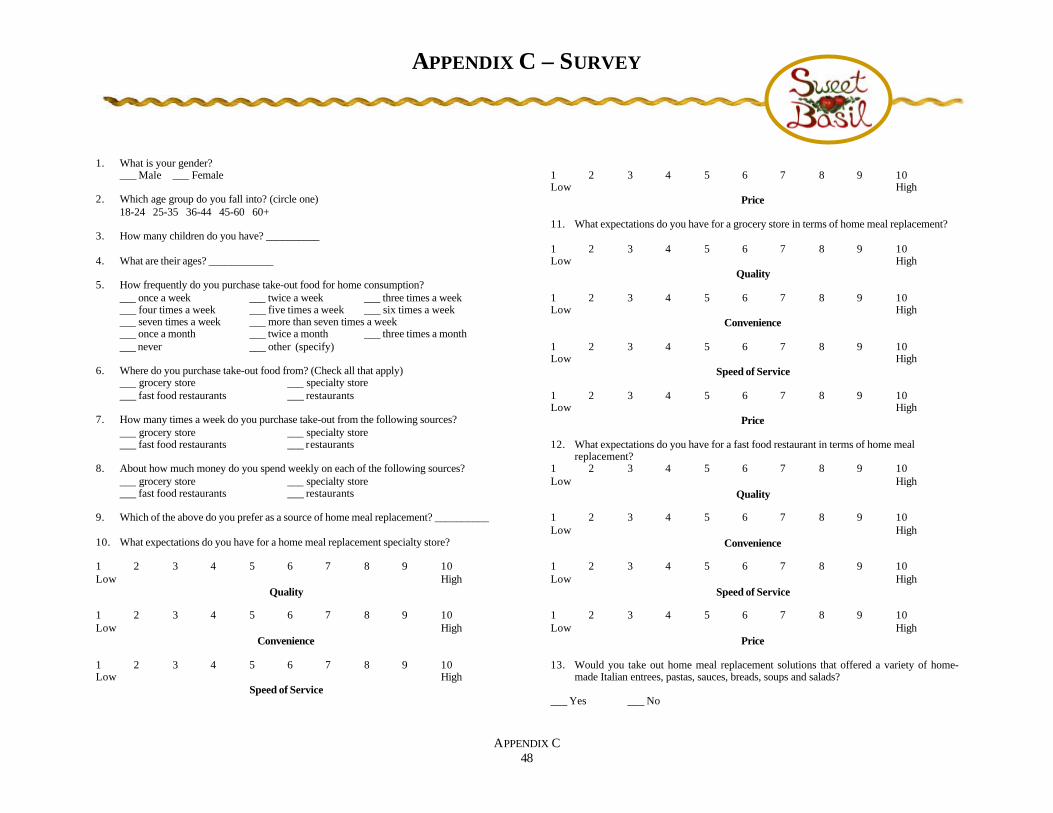
APPENDIX C – SURVEY
APPENDIX C48
1. What is your gender?___ Male ___ Female
2. Which age group do you fall into? (circle one)18-24 25-35 36-44 45-60 60+
3. How many children do you have? __________
4. What are their ages? ____________
5. How frequently do you purchase take-out food for home consumption?___ once a week ___ twice a week ___ three times a week___ four times a week ___ five times a week ___ six times a week___ seven times a week ___ more than seven times a week___ once a month ___ twice a month ___ three times a month___ never ___ other (specify)
6. Where do you purchase take-out food from? (Check all that apply)___ grocery store ___ specialty store___ fast food restaurants ___ restaurants
7. How many times a week do you purchase take-out from the following sources?___ grocery store ___ specialty store___ fast food restaurants ___ restaurants
8. About how much money do you spend weekly on each of the following sources?___ grocery store ___ specialty store___ fast food restaurants ___ restaurants
9. Which of the above do you prefer as a source of home meal replacement? __________
10. What expectations do you have for a home meal replacement specialty store?
1 2 3 4 5 6 7 8 9 10Low High
Quality
1 2 3 4 5 6 7 8 9 10Low High
Convenience
1 2 3 4 5 6 7 8 9 10Low High
Speed of Service
1 2 3 4 5 6 7 8 9 10Low High
Price
11. What expectations do you have for a grocery store in terms of home meal replacement?
1 2 3 4 5 6 7 8 9 10Low High
Quality
1 2 3 4 5 6 7 8 9 10Low High
Convenience
1 2 3 4 5 6 7 8 9 10Low High
Speed of Service
1 2 3 4 5 6 7 8 9 10Low High
Price
12. What expectations do you have for a fast food restaurant in terms of home mealreplacement?
1 2 3 4 5 6 7 8 9 10Low High
Quality
1 2 3 4 5 6 7 8 9 10Low High
Convenience
1 2 3 4 5 6 7 8 9 10Low High
Speed of Service
1 2 3 4 5 6 7 8 9 10Low High
Price
13. Would you take out home meal replacement solutions that offered a variety of home-made Italian entrees, pastas, sauces, breads, soups and salads?
___ Yes ___ No
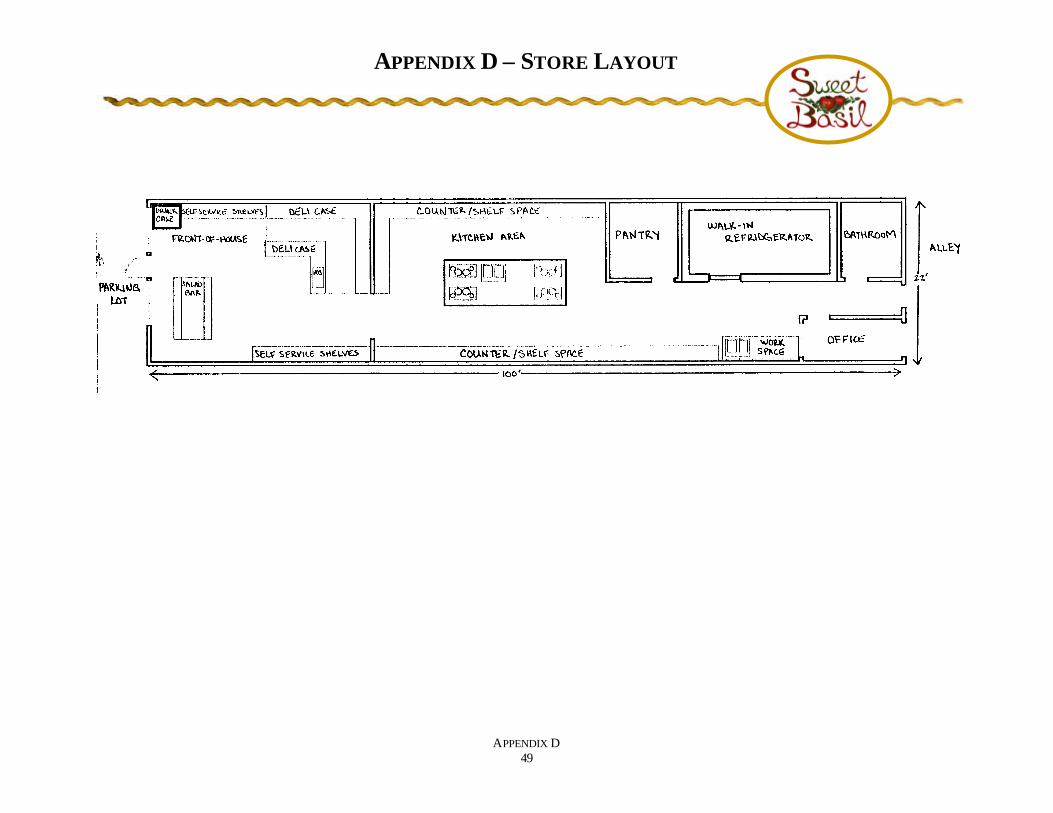
APPENDIX D – STORE LAYOUT
APPENDIX D49
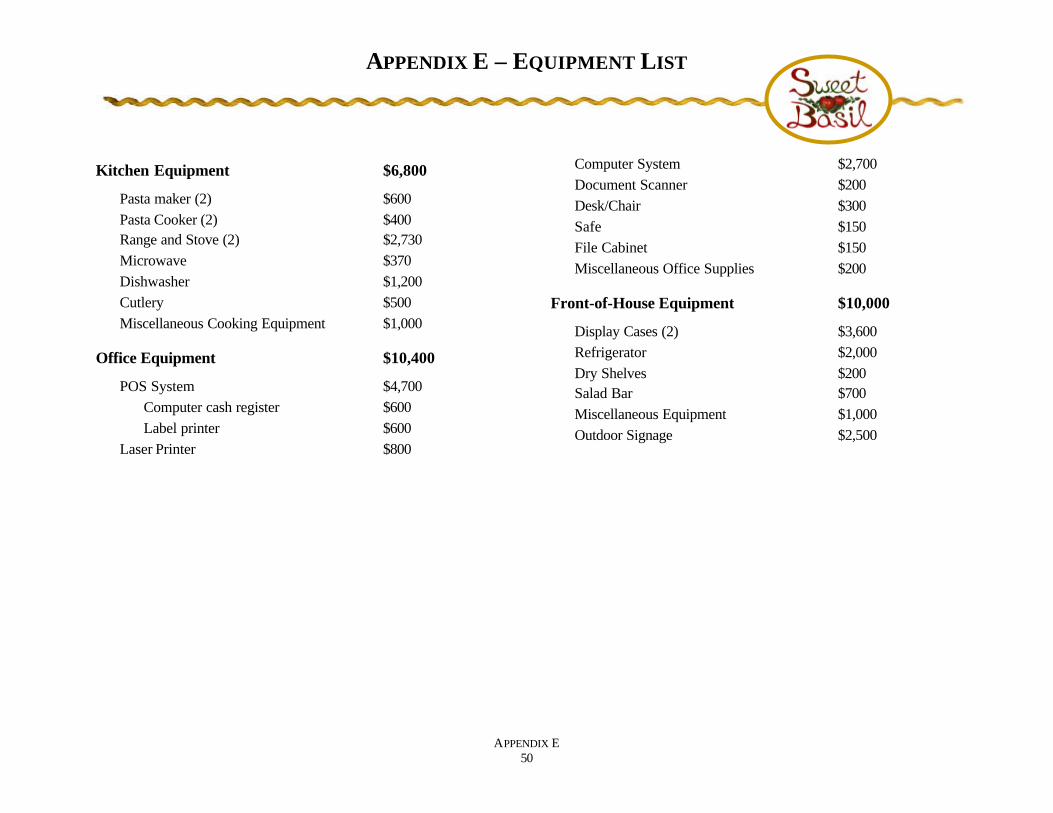
APPENDIX E – EQUIPMENT LIST
APPENDIX E50
Kitchen Equipment $6,800
Pasta maker (2) $600Pasta Cooker (2) $400Range and Stove (2) $2,730Microwave $370Dishwasher $1,200Cutlery $500Miscellaneous Cooking Equipment $1,000
Office Equipment $10,400
POS System $4,700Computer cash register $600Label printer $600
Laser Printer $800
Computer System $2,700Document Scanner $200Desk/Chair $300Safe $150File Cabinet $150Miscellaneous Office Supplies $200
Front-of-House Equipment $10,000
Display Cases (2) $3,600Refrigerator $2,000Dry Shelves $200Salad Bar $700Miscellaneous Equipment $1,000Outdoor Signage $2,500
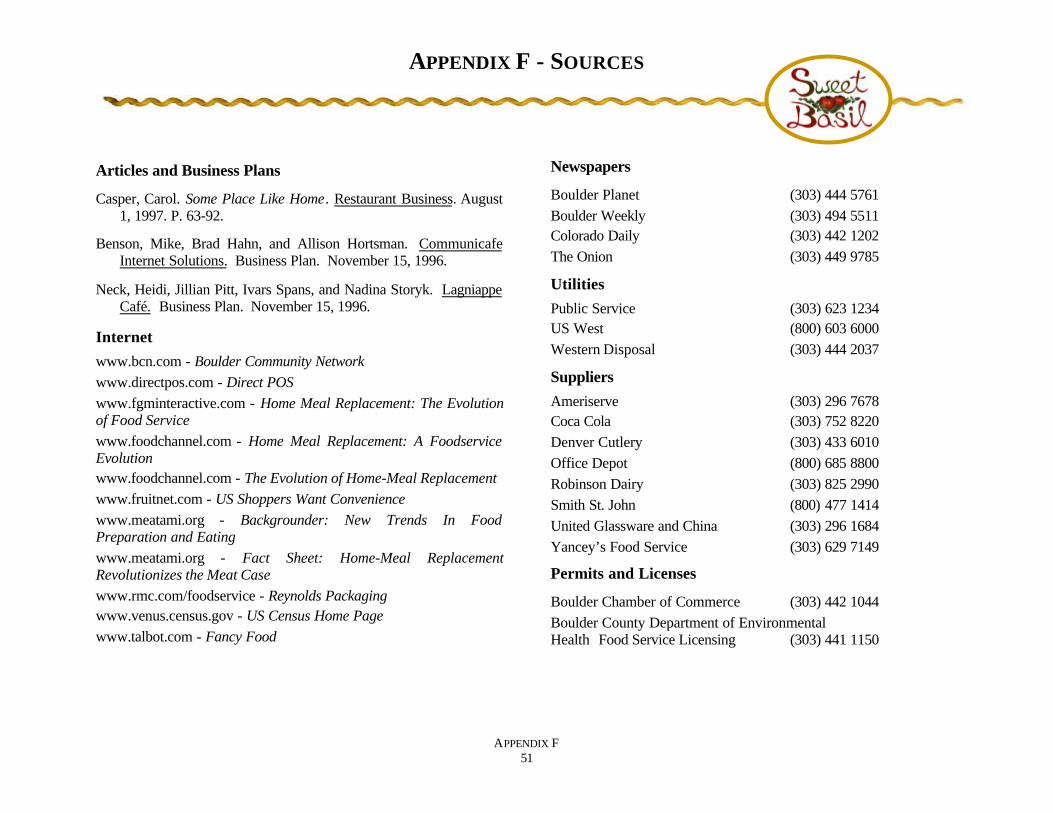
APPENDIX F - SOURCES
APPENDIX F51
Articles and Business Plans
Casper, Carol. Some Place Like Home. Restaurant Business. August1, 1997. P. 63-92.
Benson, Mike, Brad Hahn, and Allison Hortsman. CommunicafeInternet Solutions. Business Plan. November 15, 1996.
Neck, Heidi, Jillian Pitt, Ivars Spans, and Nadina Storyk. LagniappeCafé. Business Plan. November 15, 1996.
Internet
www.bcn.com - Boulder Community Networkwww.directpos.com - Direct POSwww.fgminteractive.com - Home Meal Replacement: The Evolutionof Food Servicewww.foodchannel.com - Home Meal Replacement: A FoodserviceEvolutionwww.foodchannel.com - The Evolution of Home-Meal Replacementwww.fruitnet.com - US Shoppers Want Conveniencewww.meatami.org - Backgrounder: New Trends In FoodPreparation and Eatingwww.meatami.org - Fact Sheet: Home-Meal ReplacementRevolutionizes the Meat Casewww.rmc.com/foodservice - Reynolds Packagingwww.venus.census.gov - US Census Home Pagewww.talbot.com - Fancy Food
Newspapers
Boulder Planet (303) 444 5761Boulder Weekly (303) 494 5511Colorado Daily (303) 442 1202The Onion (303) 449 9785
Utilities
Public Service (303) 623 1234US West (800) 603 6000Western Disposal (303) 444 2037
Suppliers
Ameriserve (303) 296 7678Coca Cola (303) 752 8220Denver Cutlery (303) 433 6010Office Depot (800) 685 8800Robinson Dairy (303) 825 2990Smith St. John (800) 477 1414United Glassware and China (303) 296 1684Yancey’s Food Service (303) 629 7149
Permits and Licenses
Boulder Chamber of Commerce (303) 442 1044Boulder County Department of EnvironmentalHealth Food Service Licensing (303) 441 1150

APPENDIX F52
Professionals
Moran and Associates. Las Vegas, NevadaSpurlock, David. Attorney. (702) 384 8424
Pacific Equity Partners LLC, Spectrum/RPS.Bill Flagg. Leasing Agent. (303) 449 4888
State Farm Insurance Company. Las Vegas, Nevada.Strodl, John. Agent. (702) 837 1309
Wells Pugsley and Associates. Las Vegas, Nevada.Strodl, Jason. Architect. (702) 440-4228.