home matters report - 2016 edition
DESCRIPTION
ÂTRANSCRIPT

MATTERSHOME
REPORT FROM THE FLORIDA HOUSING COALITION
2016

QUICK FACTS:
Florida has an affordable housing crisis
• 951,755 very low-income Florida households—which include hardworking families, seniors, and people with disabilities—pay more than 50% of their incomes for housing.
• Florida has the third highest homeless population of any state in the nation, with 35,900 people living in homeless shelters and on the streets. This includes 3,926 veterans and 6,539 children.
• Low-wage jobs are prevalent in Florida’s economy. In many occupations, workers do not earn enough to rent a modest apartment or buy their first home.
HOME IS WHERE WE FIND
where we
AND ESTABLISH OURSELVES WITHIN
where we RESPITE
with ourwhere we keep our
BELONGINGSSAFE
OUR COMMUNITY
FEEL CONNECT
FAMILY

TABLE OF CONTENTS
SECTION ONEIntroduction: Why Does Home Matter?. . . . . . . . . . . . . . . . . . . . . . . . . . . . . . . . . . . . . . . . . . . . . . . . . . . . . . 1The Benefits of Affordable Housing. . . . . . . . . . . . . . . . . . . . . . . . . . . . . . . . . . . . . . . . . . . . . . . . . . . . . . . . . . . . . . . . . 2
SECTION TWOBy The Numbers: Housing Cost Burden in Florida. . . . . . . . . . . . . . . . . . . . . . . . . . . . . . . . . . . . . . . . . . . 4Housing Costs for Low-Income Families. . . . . . . . . . . . . . . . . . . . . . . . . . . . . . . . . . . . . . . . . . . . . . . . . . . . . . . . . . . . . . 4Housing Cost Burden and Tenure . . . . . . . . . . . . . . . . . . . . . . . . . . . . . . . . . . . . . . . . . . . . . . . . . . . . . . . . . . . . . . . . . . . 5 Homelessness.. . . . . . . . . . . . . . . . . . . . . . . . . . . . . . . . . . . . . . . . . . . . . . . . . . . . . . . . . . . . . . . . . . . . . . . . . . . . . . . . . . . 6Low-Wage Jobs. . . . . . . . . . . . . . . . . . . . . . . . . . . . . . . . . . . . . . . . . . . . . . . . . . . . . . . . . . . . . . . . . . . . . . . . . . . . . . . . . . . 8Housing and Transportation Costs . . . . . . . . . . . . . . . . . . . . . . . . . . . . . . . . . . . . . . . . . . . . . . . . . . . . . . . . . . . . . . . . . . . 8
SECTION THREEChallenges for Renters. . . . . . . . . . . . . . . . . . . . . . . . . . . . . . . . . . . . . . . . . . . . . . . . . . . . . . . . . . . . . . . . . . . . . 10Mismatch Between Rents and Wages. . . . . . . . . . . . . . . . . . . . . . . . . . . . . . . . . . . . . . . . . . . . . . . . . . . . . . . . . . . . . . . 10Shortage of Affordable and Available Rental Units. . . . . . . . . . . . . . . . . . . . . . . . . . . . . . . . . . . . . . . . . . . . . . . . . . . 12Loss of Affordable Rental Housing. . . . . . . . . . . . . . . . . . . . . . . . . . . . . . . . . . . . . . . . . . . . . . . . . . . . . . . . . . . . . . . . . . 12Tightened Rental Market. . . . . . . . . . . . . . . . . . . . . . . . . . . . . . . . . . . . . . . . . . . . . . . . . . . . . . . . . . . . . . . . . . . . . . . . . . 12
SECTION FOURChallenges for Homebuyers. . . . . . . . . . . . . . . . . . . . . . . . . . . . . . . . . . . . . . . . . . . . . . . . . . . . . . . . . . . . . . . . 13
Housing Costs Exceed Wages for Many Occupations. . . . . . . . . . . . . . . . . . . . . . . . . . . . . . . . . . . . . . . . . . . . . . . . . 14Tight Markets for Low-Income Buyers. . . . . . . . . . . . . . . . . . . . . . . . . . . . . . . . . . . . . . . . . . . . . . . . . . . . . . . . . . . . . . . 15
SECTION FIVEThe Sadowski Housing Trust Funds:A Proven Track Record of Producing and Preserving Affordable Housing. . . . . . . . . . . . . . . . . . . 17Sadowski History and Major Programs. . . . . . . . . . . . . . . . . . . . . . . . . . . . . . . . . . . . . . . . . . . . . . . . . . . . . . . . . . . . . . 17Impact of Sadowski Trust Funds. . . . . . . . . . . . . . . . . . . . . . . . . . . . . . . . . . . . . . . . . . . . . . . . . . . . . . . . . . . . . . . . . . . 18
Conclusion . . . . . . . . . . . . . . . . . . . . . . . . . . . . . . . . . . . . . . . . . . . . . . . . . . . . . . . . . . . . . . . . . . . . . . . . . . . . . . . 22Affordable Housing is Essential for Floridians. . . . . . . . . . . . . . . . . . . . . . . . . . . . . . . . . . . . . . . . . . . . . . . . . . . . . . . . 22We Don’t Have Enough Affordable Housing in Florida. . . . . . . . . . . . . . . . . . . . . . . . . . . . . . . . . . . . . . . . . . . . . . . . 22There is a Large and Growing Gap Between Income and Housing Costs. . . . . . . . . . . . . . . . . . . . . . . . . . . . . . . . . 22The Good News. . . . . . . . . . . . . . . . . . . . . . . . . . . . . . . . . . . . . . . . . . . . . . . . . . . . . . . . . . . . . . . . . . . . . . . . . . . . . . . . 22
Endnotes. . . . . . . . . . . . . . . . . . . . . . . . . . . . . . . . . . . . . . . . . . . . . . . . . . . . . . . . . . . . . . . . . . . . . . . . . . . . . . . . . . 24

WHY DOES HOME MATTER?
The health, safety, and welfare of Floridians and the strength of Florida’s overall
economy hinges on an adequate supply of affordable housing for Florida’s working
families, elders, and people with disabilities living on fixed incomes.
AFFORDABLE HOUSING REDUCES TAXPAYER EXPENSES • Affordable, community-based housing for seniors and people with disabilities is about one-third of the
cost of institutional care.
• Chronically homeless persons often cycle through jails, hospitals, and other crisis services. Permanent supportive housing for this high-need population can reduce taxpayer costs by about $20,000 per person per year.
• Affordable housing can improve the health and educational outcomes of low-income families and children, reducing the public costs associated with illness and poor school performance.
AFFORDABLE HOUSING BOOSTS THE ECONOMY • Money spent on affordable housing construction and rehabilitation has a ripple effect on local
economies. Contractors and suppliers spend money on materials and labor, and workers spend their earnings locally.
• If the funds of the Sadowski Housing Trust Fund are fully appropriated for housing, it will create nearly 32,700 jobs and $4.6 billion in positive economic impact in just one year, while creating homes that will last far into the future.
The Florida Housing Coalition has produced this report in support of Home Matters® (www.HomeMattersAmerica.com), a national movement to make Home a reality for everyone by elevating the importance of Home’s impact on people’s health, education, personal success, public safety, and the economy. Participating in Home Matters is a coast-to-coast coalition composed of members of the general public, leaders of housing and community development organizations, as well as other organizations concerned about increasing the positive impact of Home in their communities.

A REPORT FROM THE FLORIDA HOUSING COALITION
FLHOUSING.ORG | THE FLORIDA HOUSING COALITION 1
SECTION ONE:
Introduction: Why Does Home Matter?2015 was a banner year for housing. In Florida, the State Legislature approved the highest appropriation for the Sadowski affordable housing trust funds in eight years. At the same time, news headlines in Florida and across the nation have been filled with stories of working families struggling to find affordable rentals or save for a down payment on their first home.
Everyone needs a safe, stable place to call home, but housing is a market commodity as well as a basic human need. Unfortunately, the private market by itself is unable to provide homes and apartments for many workers, elders, and people with disabilities. The price of housing reflects what people are willing to pay to live in a community, and many people are bidding high prices to live in Florida’s vibrant cities and towns. In many communities, even modest homes and apartments are priced out of reach of essential workers (including teachers and police officers), or are torn down and replaced with high-end houses, apartments, and condos. Even in communities with more moderate housing costs, many
residents may struggle to find high-quality affordable housing if they work in low-wage jobs or live on fixed incomes.
The way to correct this market failure is to provide financial incentives that make it profitable for private developers to invest in affordable housing. These incentives come from public-private partnerships among lenders, real estate professionals, community-based nonprofit organizations, and local, state, and federal government agencies. Affordable housing funders typically impose high standards for building quality and property management. Every partner and every funding source in this

HOME MATTERS 2016
THE FLORIDA HOUSING COALITION | FLHOUSING.ORG2
What Is Affordable Housing? Misconceptions about affordable
housing are widespread, with
many citizens associating it
with large, distressed public
housing projects in central cities.
However, plenty of Public Housing
Authorities across the nation, large
and small, are well-managed and
have decent units. Furthermore,
public housing is only one type
of affordable housing. In this
report, “affordable housing” refers
to privately owned housing that
receives a subsidy to bring its rent
or purchase price down to a level
affordable to a low-or moderate-
income family. Except for the
subsidy, affordable housing is
indistinguishable from non-luxury
market-rate housing—it has the
same architectural and landscaping
styles, and often has basic
amenities like energy efficient
appliances and community
gathering spaces. Substandard
housing is, by definition, not
affordable housing. The price
thresholds for housing affordability
will be discussed later in the
report. Indistinguishable from
non-luxury market-rate housing—it
has the same architectural and
landscaping styles, and often has
basic amenities like energy efficient
appliances and community
gathering spaces. Substandard
housing is, by definition, not
affordable housing. The price
thresholds for housing affordability
will be discussed
later in the report.
community effort—public, private, and nonprofit—is an essential piece of the puzzle. This report outlines the need for affordable rental and ownership housing in Florida, and highlights the importance of the Sadowski State and Local Trust Funds in meeting this need.
The Benefits of Affordable HousingEconomic BenefitsAffordable housing—like any other housing development—stimulates state and local economies. When a developer creates affordable housing through new construction or rehabilitation, the community gains jobs through direct, indirect, and induced economic impacts1 (see sidebar). Once the development is finished and occupied, the residents create demand for ongoing jobs to meet their needs. For example, each dollar of Sadowski state and local housing trust funds leverages $4 to $6 in private investment, federal tax credits, and other funding sources. If the Sadowski state and local housing trust fund monies are fully appropriated for housing in Fiscal Year 2016-17, the projected economic impact will be:
• 32,600 jobs• $4.6 billion in total economic output• $1.64 billion in labor income2
Every partner and every funding source in this community effort — public, private, and nonprofit— is an essential piece of the puzzle.
Nonprofit PartnersNonprofit Developers, Service Providers,& Foundations
Private Sector PartnersLenders, For Profit Developers, Builders, & Real Estate Professionals
Public Sector PartnersFederal, State, & Local Governments
MARKET FAILURES CAN BE CORRECTED BY PROVIDING FINANCIAL INCENTIVES THAT MAKE IT PROFITABLE FOR PRIVATE DEVELOPERS TO INVEST IN AFFORDABLE HOUSING.

A REPORT FROM THE FLORIDA HOUSING COALITION
FLHOUSING.ORG | THE FLORIDA HOUSING COALITION 3
Affordable housing is also important for employers that are trying to attract skilled workers to a region. For example, a recent survey in Sarasota County found that business leaders identified affordable housing as an ongoing need, despite their overall optimism about the region’s economy3. When local housing costs are out of reach for entry-level and mid-level employees, they must live remotely and commute to work, increasing traffic congestion. Employers may find it harder to attract skilled workers, and have more problems with employee absenteeism and turnover4.
An additional economic benefit of affordable housing comes from the foregone costs of providing social services to persons who are elderly, homeless, or have disabilities. According to an AARP report5, Medicaid-funded nursing home care in Florida for seniors and people with disabilities cost over $30,000 per person served, compared to less than $10,400 for Medicaid Home and Community-Based Services (HCBS). For persons with developmental disabilities, HCBS is less than one-third of the cost of an intermediate care facility (see Figure 1). Homeless persons with severe mental illness, meanwhile, are often heavy users of public crisis services such as jails and emergency rooms. A study in Central Florida estimates that permanent supportive housing for chronically homeless individuals saves taxpayers an estimated $20,000 per person6.
Health and Education BenefitsHousing plays a major role in our physical and mental health. For low-income individuals and families, lack of affordable housing can have a multitude of negative effects:
• Families in unaffordable housing are likely to cut back on nutritious food and health care7. • Substandard housing poses a variety of health hazards. Dust, mold, and cockroaches can
cause asthma and allergies, and peeling lead paint can reduce IQs and cause behavioral problems in children. Unsafe structural conditions, such as faulty wiring, increase the risk of fire and injury8,9.
Figure 1. Medicaid Costs for Institutional Care and Independent Living. (Source: Houser et al. 2012.)
$0
$20,000
$40,000
$60,000
$80,000
$100,000
$120,000
Elderly Disabled Developmental Disabilities
Institutional Setting Independent Living
Med
icai
d E
xpen
dit
ure
s Pe
r Pe
rso
n S
erve
d
Economic Impacts: A Note On Terminology
Activities such as housing
construction and
rehabilitation stimulate
local economies in several
ways. For affordable
housing development,
“direct” impacts occur when
developers hire workers and
purchase materials from local
suppliers. The suppliers, in
turn, purchase additional
materials and labor to fill the
developer’s order, producing
“indirect impacts”. The
workers employed, directly
and indirectly, further
stimulate the economy by
spending their wages locally
(“induced impacts”).

HOME MATTERS 2016
THE FLORIDA HOUSING COALITION | FLHOUSING.ORG4
• Many low-income families move frequently or double up with friends and relatives if they cannot find affordable housing. Frequent moves are associated with stress and depression, and overcrowding has been linked to poor health in children10,11.
• Homelessness exacerbates a person’s pre-existing health problems, and living on the streets or in shelters poses unique health risks (including tuberculosis, violence, and exposure to weather). Homelessness also makes it difficult to rest and recuperate after illnesses, find a place to store medications, and keep wounds clean and dry12.
Many of the health problems associated with a lack of affordable housing are closely connected to children’s educational performance. For example, exposure to lead paint is known to cause developmental delays in children, while asthma from exposure to dust and mold can cause children to miss school and fall behind. Frequent moves, overcrowding, and homelessness have also been linked to lower educational attainment in children13.
If a lack of affordable housing can contribute to ill health and educational problems among low-income families and children, then affordable housing is the foundation for good health and achievement in school. For example, a study in Boston found that children in subsidized housing were 19% less likely to be food insecure and 35% more likely to be in good health than children whose families were on the waiting list for subsidized housing14. Additionally, both subsidized rental housing and homeownership have been linked to better educational outcomes for children15,16.
SECTION TWO:
By The Numbers: Housing Cost Burden in FloridaHousing Costs for Low-Income FamiliesHousing is generally considered affordable if it costs no more than 30% of a household’s income. Households who pay more than this amount are considered “housing cost burdened.” This is not a perfect benchmark, since it is applied equally at all income levels. However, it is a reasonable standard for most low-income households. More conservative analyses of housing affordability focus on household who are “severely cost burdened”, or paying

A REPORT FROM THE FLORIDA HOUSING COALITION
FLHOUSING.ORG | THE FLORIDA HOUSING COALITION 5
more than 50% of their incomes for housing. See the Sidebar for a glossary of terms related to housing costs and incomes.
Data for Florida’s households is summarized in Figure 2 below. Of Florida’s 2.96 million low-income households, 1.96 million are cost burdeneda. This number represents 66% of low-income households, and a full 27% of all Florida households. Of these low-income, cost burdened households, 1.18 million are severely cost-burdened—40% of all low-income households, and 16% of all Florida households. Of all low-income households with severe cost burden, 951,755 (13% of all Florida households) are very low-income (not shown in Figure 2).
Of all low-income, cost burdened households in Florida, over 575,000 are headed by seniors (age 65 or older). For low-income households that have members with one or more disabilities, about 587,000 are cost burdened18. For household heads who are elderly or have disabilities, the availability of affordable housing in the community can make the difference between living independently and moving into a more restrictive setting, such as a nursing home. Parents who care for a child with disabilities in the family home, meanwhile, find that high housing costs compete with the higher medical costs and time off work associated with their role as caregivers19.
Housing Cost Burden and TenureFigure 3 shows a breakdown of severely cost burdened households by income bracket and tenure in Florida. Not surprisingly, the share of cost burdened households for each tenure type increases as income decreases. Severe cost burden is most prevalent among owner households with mortgages, possibly reflecting the legacy of subprime mortgage lending during the housing boom, the loss of earnings among low-income workers during the recession, or both.
a This data includes households in “regular” housing units. Individuals and households in settings such as group homes, dormitories, residential treatment centers, skilled nursing facilities, homeless shelters, military barracks, and prisons are excluded.
Figure 2. Cost Burdened Low-Income Households in Florida. (Source:: Shimberg Center for Housing Studies 201517.)
GLOSSARYArea Median Income (AMI): Median annual household income (pre-tax) for a metropolitan area, subarea of a metropolitan area, or non-metropolitan county.
Low-Income (LI): Household is at or below 80% of AMI.
Very Low-Income (VLI): Household is at or below 50% of AMI.
Extremely Low-Income (ELI): Household is at or below 30% of AMI.
Housing Costs: Includes the household’s rent or mortgage payments, utility payments, property taxes, insurance, and mobile home or condominium fees, as applicable.
Affordable Housing: Housing that costs no more than 30% of a household’s gross income.
Cost Burdened: Household pays >30% of its gross income on housing costs.
Moderately Cost Burdened: Household pays >30% but no more than 50% of its gross income on housing costs.
Severely Cost Burdened: Household pays >50% of its gross income on housing costs.
4,370,423Households59% of all HHs
1,184,776Households16% of all HHs
778,393Households11% of all HHs
994,465Households14% of all HHs
Not Low-Income
Low-Income, Severely Cost
Burdened
Low-Income, Not Cost Burdened
Low-Income, Moderately
Cost Burdened

HOME MATTERS 2016
THE FLORIDA HOUSING COALITION | FLHOUSING.ORG6
HomelessnessWhen a household’s rent or mortgage payments compete with other basic needs, such as food and healthcare, they are at risk of homelessness. In their 2015 Point-in-Time (PIT) countsb, communities across Florida identified a total of 35,900 “literally homeless” people—those staying in shelters, on the street, or in other places not meant for human habitation. As Table 2 shows, Florida’s homeless population according to the PIT counts has declined by 25% since 2007, although this drop masks a peak of 57,551 in 2010. During the same period, the United States PIT count homeless population experienced an almost uninterrupted decline, and was 13% lower in 2015 than in 2007.
Several subsets of the homeless population have decreased as well at the state and national level, as shown in Table 2. Florida has outperformed the nation in reducing homelessness among people in families and veterans, but has experienced a more modest decline in its population of chronically homeless individuals. Overall, the state and national progress in reducing literal homelessness is a testament to the success of the “Housing First” model and the (relatively) strong political support for homeless assistance programs.
bHUD requires Point-in-Time counts of “literally homeless” people to be conducted at least biennially by Continuums of Care (CoCs), or geographically defined networks of homeless service providers. Most CoCs in Florida and across the nation conduct their PIT counts on a single night in the last week of January.
Figure 3. Cost Burdened Florida Households by Tenure. (Source: Shimberg Center 2015.)
Severe cost burden is also widespread among low-income renters. In the extremely low-income (ELI) and 30.01% to 50% AMI brackets, 67% and 60% of renter households are severely cost burdened, respectively. While owners without mortgages are substantially less likely to have severe cost burden, nearly half of ELI households who own their homes free and clear are severely cost burdened.
The share of low-income households that are severely cost burdened increased only slightly in Florida between 2005 and 2014, from 38% to 40%. However, the changes are distributed unevenly among different tenure types (Table 1). The severely cost burdened share of households increased by 8 percentage points among renters in the 30.01-50% AMI bracket, and by 5 percentage points among low-income renters above 50% AMI. This is consistent with findings from other sources, which show that cost burden among renters has crept up the income ladder in recent years20,21. (Although the prevalence of cost burdens among the lowest income renters is essentially unchanged, these renters had extremely high rates of cost burden to begin with.) The slight decrease of severe cost burden among owners with mortgages might reflect the fact that some owners have refinanced at lower interest rates, while others who were over-leveraged lost their homes to foreclosure.
0%
20%
40%
60%
80%
100%
30% of AMI or Lower 31% to 50% AMI 51% to 80% AMI
Owners without Mortgages Renters Owners with Mortgages
Pe
rce
nt
of H
ou
seh
old
s Th
at A
re
Se
vere
ly C
ost
Bu
rde
ne
d
A REPORT FROM THE FLORIDA HOUSING COALITION
FLHOUSING.ORG | THE FLORIDA HOUSING COALITION 7
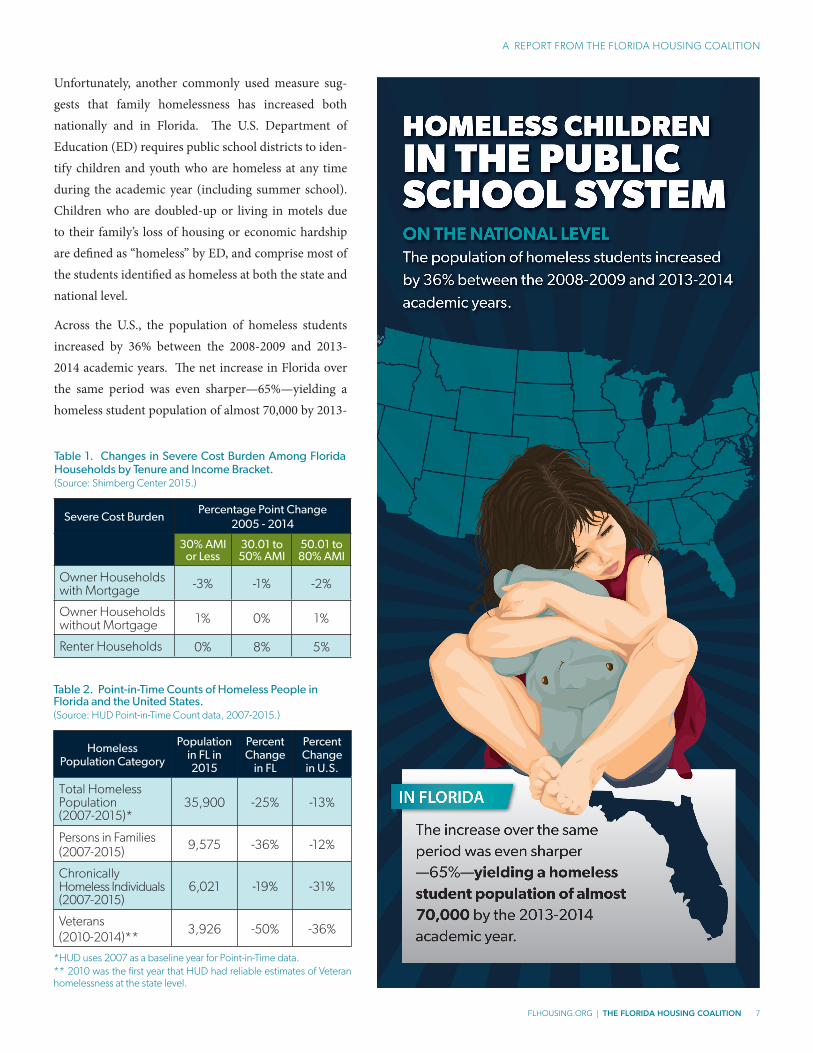
Unfortunately, another commonly used measure sug-gests that family homelessness has increased both nationally and in Florida. The U.S. Department of Education (ED) requires public school districts to iden-tify children and youth who are homeless at any time during the academic year (including summer school). Children who are doubled-up or living in motels due to their family’s loss of housing or economic hardship are defined as “homeless” by ED, and comprise most of the students identified as homeless at both the state and national level.
Across the U.S., the population of homeless students increased by 36% between the 2008-2009 and 2013-2014 academic years. The net increase in Florida over the same period was even sharper—65%—yielding a homeless student population of almost 70,000 by 2013-
Table 2. Point-in-Time Counts of Homeless People in Florida and the United States.(Source: HUD Point-in-Time Count data, 2007-2015.)
Homeless Population Category
Population in FL in 2015
Percent Change
in FL
Percent Change in U.S.
Total Homeless Population (2007-2015)*
35,900 -25% -13%
Persons in Families (2007-2015) 9,575 -36% -12%
Chronically Homeless Individuals (2007-2015)
6,021 -19% -31%
Veterans (2010-2014)**
3,926 -50% -36%
*HUD uses 2007 as a baseline year for Point-in-Time data.** 2010 was the first year that HUD had reliable estimates of Veteran homelessness at the state level.
Table 1. Changes in Severe Cost Burden Among Florida Households by Tenure and Income Bracket. (Source: Shimberg Center 2015.)
Severe Cost BurdenPercentage Point Change
2005 - 2014
30% AMI or Less
30.01 to 50% AMI
50.01 to 80% AMI
Owner Households with Mortgage -3% -1% -2%
Owner Households without Mortgage 1% 0% 1%
Renter Households 0% 8% 5%
HOME MATTERS 2016
THE FLORIDA HOUSING COALITION | FLHOUSING.ORG8
1422. Fortunately, the state’s homeless student population decreased by 4% from 2012-13 to 2013-14. However, the number of homeless students may begin to climb again if the gap between incomes and rental housing costs continues to widen (see Section 3).
Low-Wage JobsLow-wage jobs, many of them low-skilled, are prevalent in Florida’s economy. According to the United Way of Florida’s 2014 report on Asset Limited, Income Constrained, Employed (ALICE) households, the “survival wage” for a household with two adults, one infant, and one preschooler is $24.59 per hour (adjusted to 2015 dollars), or $12.30 per hour for each adultc. The household Survival Wage is just enough for a bare-bones budget with no cushion for emergencies. Unfortunately, many of Florida’s common occupations do not even pay enough for a family to survive, let alone thrive. As the ALICE Report shows, government assistance and private charity is not enough to fill the gap for these families23.
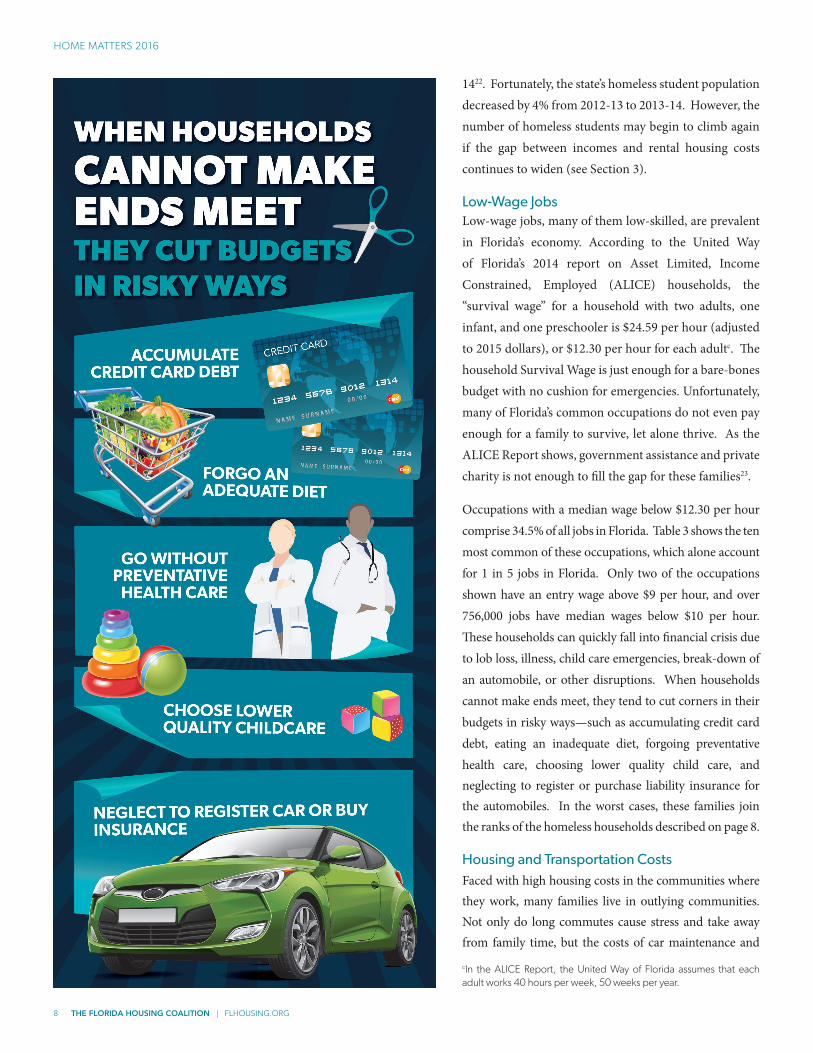
Occupations with a median wage below $12.30 per hour comprise 34.5% of all jobs in Florida. Table 3 shows the ten most common of these occupations, which alone account for 1 in 5 jobs in Florida. Only two of the occupations shown have an entry wage above $9 per hour, and over 756,000 jobs have median wages below $10 per hour. These households can quickly fall into financial crisis due to lob loss, illness, child care emergencies, break-down of an automobile, or other disruptions. When households cannot make ends meet, they tend to cut corners in their budgets in risky ways—such as accumulating credit card debt, eating an inadequate diet, forgoing preventative health care, choosing lower quality child care, and neglecting to register or purchase liability insurance for the automobiles. In the worst cases, these families join the ranks of the homeless households described on page 8.
Housing and Transportation CostsFaced with high housing costs in the communities where they work, many families live in outlying communities. Not only do long commutes cause stress and take away from family time, but the costs of car maintenance and
cIn the ALICE Report, the United Way of Florida assumes that each adult works 40 hours per week, 50 weeks per year.

A REPORT FROM THE FLORIDA HOUSING COALITION
FLHOUSING.ORG | THE FLORIDA HOUSING COALITION 9
fuel can cancel out the housing cost savings. Many of Florida’s metro areas are sprawling and heavily car-dependent, minimizing the opportunities for workers to save money by using public transit.
To capture the trade off between housing and transportation costs that many families face, the Center for Neighborhood Technology (CNT) calculates a “Housing + Transportation Affordability Index” for communities across the nation. Just as 30% is the maximum share of income that a family can affordably devote to housing, CNT has determined that 45% is the maximum affordable share of household income that can be spent on combined housing and transportation costs.
As Figure 4 shows, transportation costs magnify the already high burden of housing costs for low-income households in Florida’s metro areasd. For the “average” low-income household, housing costs range from 38% in the Pensacola metro to 51% in the Miami metro. However, when transportation costs are taken into account, the difference in cost burden between the Pensacola and Miami metro areas is smaller. The average low-income household in the Pensacola metro pays 70% of its income for housing and transportation, while the average low-income household in the Miami metro pays 78%.
In fact, when transportation costs are taken into account, the cost of living in some Florida communities rivals that of notoriously expensive
Table 3. Florida's Most Common Occupations with a Median Hourly Wage Under $12.30(Source: Florida Department of Economic Opportunity 201524.)
Occupation Employees Median Wage
Entry Wage
Retail Salespersons 331,060 $10.27 $8.91
Combined Food Prep/Serving Workers
223,240 $9.10 $8.83
Cashiers 217,060 $9.31 $8.90
Waiters and Waitresses
203,060 $9.19 $8.83
Laborers and Freight/Stock/Material Movers*
128,830 $11.31 $8.95
Stock Clerks and Order Fillers
118,720 $11.03 $8.98
Janitors and Cleaners**
112,740 $9.88 $8.83
Restaurant Cooks 91,740 $11.53 $9.44
Nursing Assistants 86,280 $11.54 $ 9.94
Security Guards 81,260 $10.57 $ 8.84
Total All Occupations
7,665,250 $15.36 $9.67
*Except Technical & Scientific Products. **Except Maids & Housekeepers
0%
10%
20%
30%
40%
50%
60%
70%
80%
Pensacola-Ferry Pass-Brent
Jacksonville Cape Coral-Ft. Myers
Tampa-St. Petersburg-
Clearwater
Orlando-Kissimmee-
Sanford
North Point-Sarasota-
Bradenton
Perc
ent o
f In
com
e fo
r th
e A
vera
ge
Ho
use
ho
ld a
t 80
% A
MI
Miami-Ft. Lauderdale
West Palm Beach
Housing Costs Transportation Costs
32% 30% 30% 30% 31% 28% 27%
38% 39% 44% 44% 44% 45% 51%
Figure 4. Housing and Transportation Costs for the Average Low-Income Household. (Source: Center for Neighborhood Technology [CNT] H+T Affordability Index25.)
d These percentages, unlike Census data, are not based on a "universe" of actual households, but are the result of a mathematical modeling exercise using a hypothetical "average" household at 80% AMI (not at or below 80% AMI). For convenience, the term “average low-income household” is used in the text. The model uses actual regional data on incomes, household composition, workers, housing and transportation costs, and other variables to construct profiles of "average" households and determine their average housing and transportation costs.

HOME MATTERS 2016
THE FLORIDA HOUSING COALITION | FLHOUSING.ORG10
e NLIHC assumes a renter earning the “housing wage” works 40 hours per week, 52 weeks per year.
*Except Maids and Housekeepers **Except Legal, Medical, and Executive Secretaries
$0
$5
$10
$15
$20Pensacola-Ferry Pass-Brent Tampa-St. Petersburg-Clearwater Miami-Miami Beach-Kendall
Combined Food Pre
p/
Serving W
orkers
Waite
rs & W
aitress
es
Janitors
& Cleaners*
Office Clerk
s
Secretarie
s/
Admin. A
ssts.
**
Cashiers
Security G
uards
Nursing A
ssist
ants
Custom
er Serv
ice
Represe
ntatives
Bookkeeping/
Accounting/Auditin
gClerk
s
Wage to
Afford
1-BR
Fair Market R
ent
Med
ian
Ho
url
y W
age
cities like New York and San Francisco. According to a 2012 CNT report on combined housing and transportation costs in major metro areas, Miami and Tampa ranked first and third, respectively, for the nation’s most expensive metros26.
SECTION THREE:
Challenges for RentersMore than three-quarters of Florida’s low-income renter households are cost burdened, and nearly half of low-income renters are severely cost burdened27. As Section 2 demonstrated, severe cost burden is especially widespread among very low-income renter households (those with incomes ≤50% AMI). Moreover, the share of low-income renters that are severely cost burdened has increased since 2005 (see Table 1 on page 7).
Section 2 discussed the key impact of low wages on rates of housing cost burden among low- and moderate-income Floridians, as well as the trade offs between housing and transportation costs. This
section goes into further detail about specific factors that drive high housing cost burdens among low-income renters.
Mismatch Between Rents and WagesAs Table 3 shows, jobs with low wages and low to medium skill levels are prevalent in Florida. To determine the wages needed to afford rental housing in different regions, the National Low Income Housing Coalition (NLIHC) calculates the “housing wage”—the minimum hourly wagee needed to afford housing at Fair Market Rent (FMR). A metro area’s FMR, calculated annually by HUD, is usually equal to the 40th percentile of combined rent and utility costs for all units with a given number of bedrooms—somewhat less expensive than a median-priced unit.
Figure 5 compares median wages for common occupationsf to the “housing wage” for the 1-bedroom FMR in the Pensacola and Tampa metropolitan areas and the Miami-Miami Beach-Kendall
f All occupations in Figure 5 except Security Guards are among the top 25 occupations by number of people employed in each metro area or division shown.
Figure 5. Comparison of Median Wages for Common Occupations and 1-Bedroom Fair Market Rents. (Source: DEO 2015, National Low Income Housing Coalition [NLIHC] 2015a28)

A REPORT FROM THE FLORIDA HOUSING COALITION
FLHOUSING.ORG | THE FLORIDA HOUSING COALITION 11
metropolitan division. In the Pensacola metro, the 1-bedroom FMR of $698 is affordable or nearly affordable for only 3 of the 10 occupations shown: office clerks ($0.54 per hour short), secretaries, and bookkeeping, accounting, and auditing clerks. Despite having a lower 1-bedroom “housing wage” than the Tampa metro, the Pensacola metro is not substantially more affordable, since its wages for certain occupations are lower.
The Miami metropolitan division’s 1-bedroom housing wage is $17.44, more than $2.50 higher than the Tampa metro’s 1-bedroom housing wage. For most of the occupations in Figure 5, however, the Miami area’s wages are comparable to or even lower than those in Tampa or Pensacola. Even bookkeeping, accounting, and auditing clerks barely earn enough to pay $907 per month, the FMR for a 1-bedroom apartment in the Miami area.
For an individual or family who relies on the earnings from one of the occupations in Figure 5, one alternative is to find an apartment with a monthly rent below the FMR. However, some of these units may be substandard or located in unsafe neighborhoods. Additionally, larger households would find a 1-bedroom apartment uncomfortable, especially if they have teenagers of opposite genders. As Section 1 discussed, crowded living conditions can be harmful for children.
Overall, Figure 5 suggests that the relationship between Fair Market Rents and wages is weak. For the lowest-paid occupations—including food preparation and serving workers, cashiers, and janitors—there is virtually no difference in median wages in the Pensacola, Tampa, and Miami areas. For the occupations with slightly higher wages, employers in the Miami area do not pay their workers enough of a premium to readily afford the area’s high housing costs. Employers who provide services that are essentially local, such as restaurants and janitorial services, may be able to raise their wages (or charge customers more for food and drink, resulting in higher tips). However, many employers compete in national markets, so they have a limited ability to pay higher wages than employers in lower-cost regions29. These employers depend in part on state and local governments to ensure an adequate affordable housing supply in their regions.

HOME MATTERS 2016
THE FLORIDA HOUSING COALITION | FLHOUSING.ORG12
Shortage of Affordable and Available Rental UnitsFlorida’s communities do have rental units, both subsidized and unsubsidized, that are affordable to low-income households. However, there are not enough of these units to go around, especially in higher-priced metro areas. Not only is the overall supply of affordable rentals limited, but some of these rentals are already occupied by higher-income households. In other words, low-income renters find themselves in a game of musical chairs for a limited number of affordable units.
This shortage of affordable and available units is illustrated in the infographic on the preceding page. For low-income households overall, only 84 rental units are affordable and available for every renter household. The shortage is most acute for extremely low-income households (≤30% AMI), with only about one affordable and available unit for every four ELI renter households30.
Loss of Affordable Rental HousingThe limited supply of affordable rental housing for low-income families is continually shrinking. Owners of rental units subsidized by federal, state, and/or local funding must keep rents affordable for tenants in certain income brackets for a set period of time, usually 15 to 50 years. The units may be lost from the affordable housing stock if the affordability period expires, the owner prepays the mortgage to end the affordability period early, the property is foreclosed, or the subsidy is removed due to poor property management.
Between 1993 and 2012, Florida lost at least 51,000 units of privately owned, subsidized rental units from the affordable housing stock31. The Shimberg Center for Housing Studies at the University of Florida has estimated that a further 43,200 units have a medium to high risk of being lost by 2020, based on the age of the developments, the source of their subsidies, and the dates when the subsidies will expire. These 43,200 units represent almost 20% of Florida’s private, subsidized affordable housing stock32.
Tightened Rental MarketOn a national level, the rental market recovered much more quickly than the homebuyer’s market. After peaking in 2009, rental vacancies have declined to levels

A REPORT FROM THE FLORIDA HOUSING COALITION
FLHOUSING.ORG | THE FLORIDA HOUSING COALITION 13
$600
$800
$1,000
$1,200
2005 2006 2007 2008 2009 2010 2011 2012 2013 2014
Affordable Rent at Median Renter Income Median Gross Rent
Gro
ss R
ent (
20
14 D
olla
rs)
not seen since the early 2000s. The nominal value of contract rents (excluding utilities), as measured by the Consumer Price Index, began to rise in 2010 and outpaced inflation by 2012. This tightening of the national rental market has been attributed to former homeowners entering the rental market after foreclosures, as well as to young families delaying first-time homeownership33,34.
In Florida, the real value of median gross rent declined during the recession, and was barely higher in 2014 than in 2005. However, median gross rent has consistently been higher than the rent that is affordable at Florida’s median renter income. Additionally, the gap between median rents and what the average renter can afford to pay has grown from $82 in 2005 to $154 in 2014 (Figure 6). Meanwhile, the state’s overall rental vacancy rate has dropped from a peak of 13.2% in 2009 to 8.7% in 2014, slightly higher than its 2006 level35. Vacancy rates in professionally managed apartments in major metro areas are even lower—around 5%36.
Moreover, some regions in Florida have seen rapid rent increases for vacant units in the past year. Axiometrics, Inc., which tracks data for professionally managed market-rate apartments, found that five major metro areas or divisions in Florida—Orlando, West Palm Beach, Fort Lauderdale, Tampa, and Jacksonville—ranked among the top 25 major metro areas nationwide for annual rent increases in the third quarter of 2015. For example, average rents increased by 6% in the Jacksonville metro and by 7.6% in the Orlando metro, compared to a national average increase of 5.2%37. The Palm Bay area and several southwest Florida markets have also seen steep rent increases38.
Additionally, Florida’s costly rental market made headlines when Make Room, a national campaign to draw attention to America’s rental crisis, reported that Florida has a higher share of severely cost burdened renters than any other state. Nationwide, about 1 in 4 renters pay more than 50% of their incomes for housing, but in Florida the share of severely cost burdened renters is about 3 in 1039. This finding is especially remarkable since Florida does not have the nation’s highest rental costs. Even the Miami, Fort Lauderdale, and West Palm Beach markets have lower rents than notoriously expensive metros such as San Francisco, New York, and Boston40,41.
In most Florida metros, a monthly mortgage payment on an average-priced 3-bedroom home is less costly than the Fair Market Rent for a 3-bedroom apartment, assuming a 10% down payment and conventional underwriting standards42. However, high rents make it difficult for low-income households to save up for a down payment43. Other challenges and opportunities for low-income homebuyers will be discussed in the next section.
SECTION FOUR:
Challenges for HomebuyersHome sale prices vary widely across Florida. One key indicator of home affordability is the National Association of Home Builders’ “Housing Opportunity Index” (HOI), which equals the percentage of homes for sale in a community that are affordable for a family with the area median income, assuming a 10% down payment and standard underwriting criteria. In a HOI analysis
Figure 6. Comparison of Median Gross Rent with Affordable Rent at Median Renter Income in Florida. (Source: Shimberg Center 2015.)

HOME MATTERS 2016
THE FLORIDA HOUSING COALITION | FLHOUSING.ORG14
needed to afford a median-priced home in the Pensacola and Tampa metro areas and the Miami metropolitan divisiong. In the Pensacola metro, of the eight featured occupations, only two—elementary school teachers and registered nurses—have a median income over $47,865, the minimum needed to buy a home at the median price of $147,000. In the Tampa metro, only police and sheriff ’s patrol officers and registered nurses can afford a median-priced home, although firefighters are only about $2,800 per year short of the minimum income needed.
Firefighters and police and sheriff ’s patrol officers in the Miami
metropolitan division are paid enough to afford a median-
priced home, but every other profession in Figure 7—including
registered nurses—falls short in the Miami area. Notably,
essential service workers do not always earn higher wages in
markets with higher housing costs. For example, dental assistants
earn nearly $7,700 less on average in the Miami area than in the
Pensacola area, while elementary school teachers earn $4,000
less in the Tampa metro than in the Pensacola metro. Even for
gThe assumptions for calculating “housing wages” for median-priced homes were as follows: 1) 30-year fixed rate mortgage at 4% interest, 2) FHA-insured with a 3.5% down payment, 3) Front-end ratio of 31%, back-end ratio of 41%, 4) All other household debt service is 18% of annual income, 5) Assessed value is 85% of the purchase price, 6) Homestead exemption is $50,000, 7) Mill levy is $18.84, and 8) Property insurance is 1% of the purchase price annually. Additionally, we assume that the homebuyer works 40 hours per week, 52 weeks per year.
of 223 metro areas nationwide in the 3rd quarter of 2015, Florida metros ranged from 46th most affordable (Gainesville) to 22nd least affordable (Miami)44. However, to paint a fuller picture of home affordability, we need to consider the supply of homes for sale that are affordable to low-income households. One must also bear in mind that lower-cost homes for sale may be farther from employment centers, necessitating higher transportation costs as discussed in Section 2.
Florida’s homeownership rate has declined steadily from a peak of 71% in 2007 to 64% in 201445. Families losing their homes to foreclosure account for some of this decrease, but the factors discussed below prevent many low- and moderate-income families from buying their first homes.
Housing Costs Exceed Wages for Many OccupationsEven in metro areas with relatively low home sale prices, homeownership can be out of reach for many workers that provide essential services, including paramedics, firefighters, and nurses. For Figure 7, we calculated the minimum annual income
0
$20,000
$40,000
$60,000
$80,000
$100,000
EMTs
and Paramedics
Police/Fire
/
Ambulance D
ispatchers
Dental Ass
istants
Fire Fig
hters
LPNs a
nd LVNs
Elementary
School Teachers
(Excluding Special E
ducation)
Police and Sherri
f’s
Patrol O
fficers
Registere
d Nurse
s
Income N
eeded to A
fford
a Median-P
riced H
ome
Pensacola-Ferry Pass-Brent Miami-Miami Beach-KendallTampa-St.Petersburg-Clearwater
Figure 7. Median Income of Selected Occupations Compared to the Income Needed to Afford a Median-Priced Home (2015 Q3). (Source: DEO 2015, National Association of Home Builders 2015.)

A REPORT FROM THE FLORIDA HOUSING COALITION
FLHOUSING.ORG | THE FLORIDA HOUSING COALITION 15
occupations that have higher median incomes in the Miami area than in the other two metros—police, fire, and ambulance dispatchers, and licensed practical and vocational nurses—the extra pay is not enough to buy a median-priced home.
Tight Markets for Low-Income BuyersFlorida’s home market is steadily improving—the rate of foreclosure filings is dropping46, prices are appreciating47, sale volume is increasing in several metro areas48, and the share of “zombie homes” (those in the foreclosure process that have been abandoned by the owners) is declining49. In Florida and across the nation, the share of homebuyers paying cash is declining. However, many Florida metros still have the highest share of cash sales in the nation, since wealthy retirees and small investors are active in the state’s housing market50,51,52. Additionally, many small investors are taking advantage of new financing opportunities to buy homes53. The prevalence of cash buyers and home sales to non-owner-occupants reduces the inventory of modest homes available to low-income and first-time homebuyers in Florida.
Figure 8 (next page) shows how the prevalence of home sales to non-owner-occupants constrains the supply for low-income potential homebuyers in Florida. Homes that receive a homestead exemption within one year of sale are assumed to be owner-occupied, and the median price for these homes was $197,614 in 2013. Homes that do not receive a homestead exemption within one year of sale are assumed to be owned for purposes other than a primary residence, and the median sale price for these homes was only $150,525 in 2013—much lower than for homes sold to owner-occupants. Moreover, homes sold to non-owner-occupants comprised nearly 60% of all homes sold in 2013. In other words, non-owner-occupants slashed the supply of homes for sale by more than half, disproportionately removing lower-cost homes from the market. (Of course, some of these lower-cost homes may have had substantial repair needs.)
Only about 70,000 homes were sold below the median price to owner-occupants in 2013—potentially within reach of low-income and first-time homebuyers. However, these sales were dwarfed by the number of

HOME MATTERS 2016
THE FLORIDA HOUSING COALITION | FLHOUSING.ORG16
Figure 8. Numbers of Low-Income Potential Homebuyers and Home Sales in 2013 (2014 dollars). (Source:Shimberg Center 2015.)
*Home sales are classified by whether or not they received a homestead exemption within one year of sale.
h Assuming all homes sold below the median price were affordable to these households, there would have been about 165,000 homes available.
moderately low-income (50.01% to 80% AMI) renter households in 2013. For every owner-occupied home sold below the median sale price in 2013, there were two non-cost-burdened, moderately low-income renters. When all moderately low-income renters are considered, the shortage of homes for sale is even more acute—about seven low-income potential homebuyers for every home sold below the median price to an owner-occupant.
Figure 8 also shows that an increase in the share of home sales to owner-occupants would probably not be enough to expand homeownership opportunities to all low-income potential homebuyers. If all homes sold in 2013 had been purchased by owner-occupants, the gap between demand and supply of homes for moderately low-income, non-cost-burdened renters would have been narrowerh. However, there would not have been enough homes for sale to provide a housing alternative to all the cost burdened renters in this income bracket.
In addition to home prices and supply, an important consideration for low-income homebuyers is the availability of mortgage credit. In 2014, there was widespread concern that lenders and federal regulators had over corrected for the excesses of the housing bubble, enacting lending standards that were too stringent for
homebuyers with low incomes and less-than-stellar credit. In late 2014 and early 2015, the federal government took several steps to expand mortgage credit to low-income homebuyers. These included reducing premiums for Federal Housing Administration (FHA) mortgage insurance, and allowing Fannie Mae and Freddie Mac to purchase and bundle mortgages with down payments as low as 3%. These efforts appear to have borne fruit across the nation, with mortgage credit loosening54,55, and the volume of FHA-backed loans increasing56. Some observers suggest that traditional homebuyers (as opposed to cash buyers and investors) are trickling back into Florida markets as well57,58.
As Florida’s home market continues to rebound, the inventory of modest homes available to low-income homebuyers may increase. However, as housing prices continue to rise, many of these homes will be pushed out of reach of low-income households. The shortage of affordable homes for sale highlights the need for financial tools for low-income homebuyers—including down payment assistance and subsidies to lower the purchase price—as well as an increase in the affordable rental supply. The next section describes the keystone role of Florida’s Sadowski housing trust funds in expanding the supply of affordable rental and ownership housing.
0
100,000
200,000
300,000
400,000
500,000
600,000
Renter Households between 50.01% to 80% AMI in 2013
Single-Family and Condo Sales in 2013*
190,307
69,980
103,503
270,299
143,052
Severely Cost Burdened
Moderately Cost Burdened
Not Cost Burdened
No Homestead Exemption
Above Median Price, with Homestead Exemption
Below Median Price with Homestead Exemption
69,980

A REPORT FROM THE FLORIDA HOUSING COALITION
FLHOUSING.ORG | THE FLORIDA HOUSING COALITION 17
These dedicated funding sources allow thousands of low- and moderate-income families to rent, buy, and renovate affordable homes each year, while leveraging substantial public and private funds and boosting Florida’s economy.
Sadowski History and Major ProgramsMore than 20 years ago, a diverse coalition of Florida’s affordable housing advocates, business and industry groups, and faith-based organizations recognized the need for a dedicated state revenue source for affordable housing. In 1992, the state legislature passed the William E. Sadowski Affordable Housing Act, named after a Department of Community Affairs secretary who had recently died in a plane crash. The Sadowski Act raised the state documentary stamp tax on deeds by ten cents per $100 of the property’s valuei, and directed the new funds to two trust funds, one for local governments and one for the state.
The Local Housing Trust Fund supports the State Housing Initiatives Partnership (SHIP) program, which primarily funds the production and preservation of affordable ownership housing for low- and moderate-income households. The Florida Housing Finance Corporation uses a population-based formula to distribute SHIP funds to all 67 counties and
SECTION FIVE:
The Sadowski Housing Trust Funds: A Proven Track Record of Producing and Preserving Affordable HousingAs this report has demonstrated, hundreds of thousands of low-income Floridians struggle with high housing costs. Many factors affect the supply of affordable housing, including low wages for common occupations, high market prices for homes and apartments in decent condition, and limited federal funding for housing programs59. Moreover, the situation is getting worse for low-income renters, as the gap grows between median rents and what renters can afford to pay. Meanwhile, many low- and moderate-income potential homebuyers, including essential service workers, are shut out of the homebuyer market by high sale prices relative to wages, competition from investors and vacation home buyers, and limited inventory.
It is very challenging for Florida’s policymakers and community advocates to directly influence these factors in the near term, but we do have control over a simple and powerful tool at the state level: the Sadowski State and Local Housing Trust Funds.
iIn 1995, the State Legislature shifted another ten cents of documentary stamp tax revenue from general revenue to the Sadowski trust funds.
ADMINISTRATIONNo more than 10% may be used on administration
Each SHIP Dollar is Required to Meet the Following Criteria:
LOW AND VERY LOW INCOME HOUSEHOLD ASSISTANCEAt least 60% must be used to assist low-income households. Of this amount, at least half (30% of the total) must be used to assist very low-income households.
CONSTRUCTIONAt least 75% must be spent on construction (including new construction & rehabilitation)
HOMEOWNERSHIP ACTIVITIESAt least 65% must be spent on homeownership activities

HOME MATTERS 2016
THE FLORIDA HOUSING COALITION | FLHOUSING.ORG18
Table 4. Estimated Economic Impacts of Fully Funding Sadowski Housing Trust Funds in Fiscal Year 2016-17.(Source: Sadowski Coalition 2015.)
Type of Impact SHIP SAIL Total
Projected Trust Fund Revenue in FY 15/16 ($ million) $226.56 $97.40 $323.96
Total economic activity generated ($ million) $3,470.49 $1,133.82 $4,604.32
Total jobs created 24,625 8,056 32,682
Total income/earnings generated ($ million) $1,229.74 $411.16 $1,640.91
J The Low Income Housing Tax Credit, or LIHTC, is an item of the Internal Revenue Code. The U.S. Treasury Department issues tax credits to states, which in turn award them to affordable housing developers. The developers sell them to equity investors to raise money for development of affordable rental housing.
to cities that receive Community Development Block Grant (CDBG) funds. SHIP is most commonly used to support home construction, rehabilitation to make homes safe and/or handicapped accessible, and down payment assistance. It gives local governments plenty of flexibility to meet local needs and preferences, as long as a few basic requirements are met. These requirements, found in Florida Statute 420, include:
• At least 65% must be spent on homeownership activities.• At least 75% must be spent on construction (including
new construction and rehabilitation.)• At least 60% must be used to assist low-income
households. Of this amount, at least half (30% of the total) must be used to assist very low-income households.
• No more than 10% may be used on administration
Because all communities that receive SHIP funds use the full 10% allowed for administration, rental housing activities are limited to 25% of their annual SHIP allocations. Several SHIP communities use a portion of their rental funds to support Rapid Re-Housing programs for homeless families, helping them pay security and utility deposits. For the 2015-2016 fiscal year, the State Legislature has allowed local governments to provide further support for Rapid Re-Housing programs with SHIP funds, by providing formerly homeless families with temporary rental subsidies while they search for employment and obtain supportive services.
The State Housing Trust Fund supports several activities, including administration of the Sadowski funds by Florida Housing. The main Sadowski-funded state program is the State Apartment Incentive Loan (SAIL) program. SAIL provides funding on a competitive basis for the construction and rehabilitation of affordable multifamily rental housing. SAIL usually serves as “gap financing” for developments with other funding sources, such as the Low Income Housing Tax Creditj.
Impact of Sadowski Trust FundsIn Fiscal Year 2016-17, a projected $323.96 million in documentary stamp tax revenues will be available for appropriation to the Sadowski trust funds. This funding level is over 10 times the amount of annual funding ($25 million) that Florida is projected to receive from the National Housing Trust Fund60. If the State Legislature appropriates the full amount to the Sadowski trust funds, the economic impact will be massive, as shown in Table 4. Every Sadowski dollar will leverage more than $4 from other public and private sources. When the direct, indirect, and induced impacts of Sadowski-funded developments are taken into account, the total economic impact will be $4.6 billion. Additionally, these developments will create nearly 32,700 jobs and generate $1.64 billion in labor income.
In addition, Sadowski funds give low- and moderate-income families a hand up that can be extended to their children and grandchildren. For example, the SHIP allocations from fiscal years 2006-07 to 2012-13 had a profound impact on Florida communities, even though the program’s funding was swept into general revenue by the State Legislature for much of that period. A total of 35,864 households were assisted, of which:
• 558 were homeless households• 1,147 households had a member with developmental
disabilities• 8,668 were households headed by an elderly person (age
62 and up)61
From fiscal years 2009-10 to 2011-12, when SHIP communities were feeling the worst effects of the Local Housing Trust Fund being swept, an average of 1,812 units were assisted per year62. (Much of this activity was made possible by SHIP funds carried

A REPORT FROM THE FLORIDA HOUSING COALITION
FLHOUSING.ORG | THE FLORIDA HOUSING COALITION 19
over from previous years and by program income.) However, when Local Housing Trust Fund monies are fully appropriated for housing and available to SHIP communities, 8,000 to 10,000 units can be assisted each year63,64. Clearly, full SHIP funding would allow local communities to significantly scale up their efforts to provide housing for key populations, including those who are homeless or have developmental disabilities.
SAIL has also been a lifeline for many low-income individuals and families. At the end of 2014, the Florida Housing Finance Corporation’s portfolio of developments with outstanding SAIL loans had a total of 64,600 units65. Of these units:
• 1,070 were in developments targeting homeless households• 8,926 were in developments targeting elderly households
These numbers significantly underestimate SAIL’s impact because, like the Local Housing Trust Fund, the State Housing Trust Fund had most of its funds swept into general revenue
between the 2008-09 and 2013-14 fiscal years. Additionally, these numbers do not include developments that have already paid off their SAIL loans. At a time when thousands of privately owned, subsidized rentals are being lost from the affordable housing stock each year, SAIL is an engine for constructing and rehabilitating housing for elders, people experiencing homelessness, and other vulnerable populations.
In short, if we fully appropriate the State and Local Housing Trust
Fund monies for housing, our investment will have huge payoffs.
Thousands of low- and moderate-income Floridians will move
into affordable homes or renovate existing homes, which they will
use as a platform to improve their lives. At the same time, the
affordable housing development leveraged by Sadowski programs
will generate tens of thousands of jobs and billions of dollars
of economic output and labor income annually. The Sadowski
housing programs are truly a win-win.
• Associated Industries of Florida• Coalition of Affordable Housing
Providers• Florida Apartment Assoc.• Florida Bankers Association• Florida Chamber of Commerce
• American Planning Assoc., Fla. Ch.• Florida Association of Counties• Florida Association of Local
Housing Finance Authorities• Florida League of Cities• Florida Redevelopment Assoc.• Florida Regional Councils Assoc.
GOVERNMENT/PLANNING
ORGANIZATIONS
SADOWSKI HOUSING COALITION MEMBERS
• AARP of Florida• Florida Association of Housing
and Redevelopment Officials• Florida Coalition for the
Homeless• Florida Housing Coalition• Florida Legal Services
ADVOCATES FOR THE ELDERLY/ VETS/ HOMELESS/
SPECIAL NEEDSBUSINESS/
INDUSTRY GROUPS
• Florida Green Building Coalition• Florida Home Builders
Association• Florida Manufactured Housing
Association• Florida Realtors• Florida Retail Federation
• Florida Catholic Conference• Florida Impact• Habitat for Humanity of Florida
FAITH BASED ORGANIZATIONS
• Florida Supportive Housing Coalition
• Florida Veterans Foundation• Florida Weatherization Network• LeadingAge Florida• The Arc of Florida• United Way of Florida
ADVOCATES FOR THE ELDERLY/ VETS/ HOMELESS/
SPECIAL NEEDSBUSINESS/
INDUSTRY GROUPS

HOME MATTERS 2016
THE FLORIDA HOUSING COALITION | FLHOUSING.ORG20
GENERATESRESULTS
INVESTSLOCALLYFUE
LS
ECONO
MIC
DEVELO
PMENT
GEN
ERATE
SRE
SULTS
CREATES 32,682 JOBS
CREATESJOBS
FUELS ECONOMIC DEVELOPMENTThe appropriation would result in a positive economic impact of $4.6 billion.
BIL
LIO
N$
INVESTS LOCALLY
$8.05/HR
HRS/WEEK52 WKS/YEAR
97 HRS/WEEK
52 WKS/YEAR
40 HRS/WEEK
52 WKS/YEAR
40
SHIP program flexibility allows local housing programs to meet
their community’s individual needs and revise strategies in
accordance with changes in the local market, provided they
continue to meet statutory criteria.
The Florida Legislature can create nearly 32,700 jobs and over $4.6 billion in positive
economic impact for Florida if it appropriates the housing trust fund monies
for housing.
SHIP and SAIL have proven track records for performance, transparency, and
accountability. Floridians need affordable housing. Using the housing trust fund
monies solely for housing is the right thing to do- for Floridian’s in need;
for the benefit of all Florida taxpayers; and for the
growth of Florida’s economy.
From construction workers to retailers; an investment in housing creates jobs for Floridians. Housing dollars will put Florida’s out-of-work housing industry back to work repairing homes and improving the real estate
market. SHIP funds can be used for rehabilitation/renovation of existing empty housing stock to ready it for families to move in.
UPLIFTS
FLORID
IANS
$$19.47/HR
SHIP has been successfully operating statewide, from large urban areas to small
rural communities for more than 20 years 4.6
$323,960,000*IS AVAILABLE FOR APPROPRIATION FROM THE SADOWSKI HOUSING TRUST FUNDS IN FY 2016-2017
HOW ARE FLORIDA'S SADOWSKI HOUSING PROGRAMS FUNDED?The doc stamp tax on all real estate transactions was increased in 1992. The additional money generated is dedicated to the state and local housing trust funds. 70% is directed to local governments (all 67 counties) and Florida’s entitlement cities to fund the SHIP program. 30% is used by the Florida Housing Finance Corporation for programs such as SAIL.
THE FLORIDA LEGISLATURE CAN CREATE NEARLY 32,700 JOBS AND OVER $4.6 BILLION IN POSITIVE ECONOMIC IMPACT FOR FLORIDA IF IT APPROPRIATES THE HOUSING TRUST FUND MONIES FOR HOUSING.
*Based upon documentary stamp projection plus projected balance in housing trust funds as of July 2015.
The State Housing Initiatives Partnership Program (SHIP) is a nationally-acclaimed model for effectively and efficiently meeting housing needs at the community level. SHIP provides sustainable homeownership for Florida’s workforce, helps prevent homelessness, and provides emergency repairs and disaster recovery for Florida’s most vulnerable residents, including the frail elderly, persons with disabilities and veterans. The State Apartment Incentive Loan Program (SAIL) produces apartments for Florida’s workforce, rehabilitates existing apartments in dire need of repair, as well as apartments that house Florida’s most vulnerable populations, including the frail elderly and persons with disabilities who might otherwise need to live in an institutional setting.
Using Florida’s housing funds solely for housing creates a positive economic impact for Florida by fueling economic development, creating jobs, investing in our local communities, and contributing to the well-being of Florida’s families, veter-ans, elderly, persons with disabilities, persons experiencing homelessness and deserving Floridians in need across the state. For more information, please visit SadowskiCoalition.com.
2 BRAPARTMENT
In Florida, the Fair Market Rent (FMR) for a 2-bedroom apartment is $1,012. In order to afford this, a household must earn at least $40,488 annually ($19.47/hour). For that same 2-bedroom apartment, a minimum wage Floridian earning $8.05/hour must work 97 hours/week year round or the household must include 2.4 minimum wage earners working year round.

A REPORT FROM THE FLORIDA HOUSING COALITION
FLHOUSING.ORG | THE FLORIDA HOUSING COALITION 21
GENERATESRESULTS
INVESTSLOCALLYFUE
LS
ECONO
MIC
DEVELO
PMENT
GEN
ERATE
SRE
SULTS
CREATES 32,682 JOBS
CREATESJOBS
FUELS ECONOMIC DEVELOPMENTThe appropriation would result in a positive economic impact of $4.6 billion.
BIL
LIO
N$
INVESTS LOCALLY
$8.05/HR
HRS/WEEK52 WKS/YEAR
97 HRS/WEEK
52 WKS/YEAR
40 HRS/WEEK
52 WKS/YEAR
40
SHIP program flexibility allows local housing programs to meet
their community’s individual needs and revise strategies in
accordance with changes in the local market, provided they
continue to meet statutory criteria.
The Florida Legislature can create nearly 32,700 jobs and over $4.6 billion in positive
economic impact for Florida if it appropriates the housing trust fund monies
for housing.
SHIP and SAIL have proven track records for performance, transparency, and
accountability. Floridians need affordable housing. Using the housing trust fund
monies solely for housing is the right thing to do- for Floridian’s in need;
for the benefit of all Florida taxpayers; and for the
growth of Florida’s economy.
From construction workers to retailers; an investment in housing creates jobs for Floridians. Housing dollars will put Florida’s out-of-work housing industry back to work repairing homes and improving the real estate
market. SHIP funds can be used for rehabilitation/renovation of existing empty housing stock to ready it for families to move in.
UPLIFTS
FLORID
IANS
$$19.47/HR
SHIP has been successfully operating statewide, from large urban areas to small
rural communities for more than 20 years 4.6
$323,960,000*IS AVAILABLE FOR APPROPRIATION FROM THE SADOWSKI HOUSING TRUST FUNDS IN FY 2016-2017
HOW ARE FLORIDA'S SADOWSKI HOUSING PROGRAMS FUNDED?The doc stamp tax on all real estate transactions was increased in 1992. The additional money generated is dedicated to the state and local housing trust funds. 70% is directed to local governments (all 67 counties) and Florida’s entitlement cities to fund the SHIP program. 30% is used by the Florida Housing Finance Corporation for programs such as SAIL.
THE FLORIDA LEGISLATURE CAN CREATE NEARLY 32,700 JOBS AND OVER $4.6 BILLION IN POSITIVE ECONOMIC IMPACT FOR FLORIDA IF IT APPROPRIATES THE HOUSING TRUST FUND MONIES FOR HOUSING.
*Based upon documentary stamp projection plus projected balance in housing trust funds as of July 2015.
The State Housing Initiatives Partnership Program (SHIP) is a nationally-acclaimed model for effectively and efficiently meeting housing needs at the community level. SHIP provides sustainable homeownership for Florida’s workforce, helps prevent homelessness, and provides emergency repairs and disaster recovery for Florida’s most vulnerable residents, including the frail elderly, persons with disabilities and veterans. The State Apartment Incentive Loan Program (SAIL) produces apartments for Florida’s workforce, rehabilitates existing apartments in dire need of repair, as well as apartments that house Florida’s most vulnerable populations, including the frail elderly and persons with disabilities who might otherwise need to live in an institutional setting.
Using Florida’s housing funds solely for housing creates a positive economic impact for Florida by fueling economic development, creating jobs, investing in our local communities, and contributing to the well-being of Florida’s families, veter-ans, elderly, persons with disabilities, persons experiencing homelessness and deserving Floridians in need across the state. For more information, please visit SadowskiCoalition.com.
2 BRAPARTMENT
In Florida, the Fair Market Rent (FMR) for a 2-bedroom apartment is $1,012. In order to afford this, a household must earn at least $40,488 annually ($19.47/hour). For that same 2-bedroom apartment, a minimum wage Floridian earning $8.05/hour must work 97 hours/week year round or the household must include 2.4 minimum wage earners working year round.

HOME MATTERS 2016
THE FLORIDA HOUSING COALITION | FLHOUSING.ORG22
ConclusionAffordable Housing Is Essential for Floridians:Having a healthy, affordable place to call home is the foundation of our lives and the basis of strong local economies. Affordable housing allows low- and moderate-income working families to live near their places of employment, and enables our elderly and disabled family members on fixed incomes to be integrated in their communities.
• Affordable housing construction and rehabilitation stimulates local economies by creating jobs and generating business for contractors and suppliers.
• Affordable housing improves a family’s physical and mental health, and helps children excel in school.
• For the elderly and people with disabilities, affordable community-based housing is one-third of the cost of institutional care.
• For people who are chronically homeless, affordable housing breaks the costly cycle through hospitals, jails, and other taxpayer-funded crisis systems, saving about $20,000 per person per year.
We Don’t Have Enough Affordable Housing in Florida:• 1.96 million low-income Florida households are paying
more than 30% of their incomes for housing, the maximum amount considered affordable by experts.
• Of these 1.96 million low-income “cost burdened” households, over 575,000 households are headed by seniors, and about 587,000 households have a member with disabilities.
• Over 951,700 very low-income Floridians are severely cost burdened, meaning that they pay more than 50% of their incomes for housing.
• Florida’s “Point-in-Time” homeless population has experienced a 25% net decrease since 2007. The number of K-12 students who experience homelessness or housing instability showed a 65% net increase from the 2008-09 to 2013-14 academic years, but has decreased slightly since the 2012-13 academic year. Continued progress on reducing homelessness depends on a steady supply of affordable rental housing.
• “Drive till you qualify” is not a solution to high housing costs, since transportation costs largely consume the housing cost savings. For the average low-income
household in one of Florida’s major metro areas, combined housing and transportation costs can easily consume over 70% of income.
There is a Large and Growing Gap Between Income and Housing Costs:
• For a young family of four to meet its basic needs, the parents must earn a combined wage of $24.59 per hour, or about $12.30 per parent. Unfortunately, 34% of Florida’s jobs are in occupations with median wages below $12.30 per hour.
• Rents are out of reach for low-income workers in many Florida communities. In the Pensacola metro area, for example, a nursing assistant cannot afford a moderately priced one-bedroom apartment.
• Florida has only one affordable and available rental unit for every four extremely low-income renters (those with incomes at or below 30% of the area median).
• Over 43,000 units are at risk of being permanently lost from the privately owned affordable housing stock by 2020.
• The median renter income in Florida is too low to afford median rents, and the gap between rents and renter incomes is wider now than it was at the height of the housing boom.
• Median-priced homes in Florida are out of reach for many workers with medium- and high-skilled jobs. For example, firefighters in the Pensacola metro area cannot afford to buy a median-priced home.
• Florida has a shortage of moderately priced homes available for low-income homebuyers, partly due to competition from investors and second-home buyers. In 2013, there were about seven low-income potential homebuyers for every home sold to an owner-occupant at or below the median sale price.
The Good NewsAlthough the affordable housing need in Florida is daunting, our state has a nationally acclaimed program based on a dedicated revenue source with a proven track record for performance, transparency, and accountability: the State and Local Housing Trust Funds created by the William E. Sadowski Affordable Housing Act. The largest State Housing Trust Fund program is the State Apartment Incentive Loan (SAIL) program, while the Local Housing Trust Fund supports State Housing Initiatives Partnership (SHIP) programs in every county and all of Florida’s larger cities.

A REPORT FROM THE FLORIDA HOUSING COALITION
FLHOUSING.ORG | THE FLORIDA HOUSING COALITION 23
HOME MATTERS FOR FLORIDA’S FAMILIES
HOME MATTERS FOR FLORIDA’S ELDERLY
HOME MATTERS FOR FLORIDA’S SPECIAL NEEDS
POPULATIONS
HOME MATTERS FOR FLORIDA’S YOUTH AGING OUT
OF FOSTER CARE
HOME MATTERS FOR FLORIDA’S ECONOMY
HOME MATTERS FOR FLORIDA’S VETERANS
Since 1992, SHIP and SAIL have helped hundreds of thousands of low- and moderate-income families move into affordable homes or renovate their current homes. SHIP and SAIL are Florida’s most important home-grown tools for providing housing for our most
vulnerable populations, including:
• Elderly households• People with developmental disabilities• Homeless individuals and families
As we have seen, affordable community-based housing for these
populations saves taxpayer dollars as well as improving their
quality of life.
The Sadowski programs are also a powerful engine of economic development in Florida. If the State Legislature appropriates all State and Local Housing Trust Fund monies for housing in 2016—estimated at $323.96 million—the resulting affordable housing
development will generate:• $4.6 billion in economic output• Nearly 32,700 jobs• $1.64 billion in labor income
We cannot end Florida’s affordable housing shortage overnight, and it is difficult for us to control factors such as the wages for common occupations and funding cuts to federal housing pro-grams. However, the Sadowski Housing Trust Funds are a home-grown, highly successful affordable housing program, and they are fully within our control. With strong public-private partner-ships leveraged by consistent state funding, we can help thou-sands of families move into decent, safe, affordable housing every year, boosting our state and local economies in the process. Fully appropriating Sadowski Housing Trust Fund monies for housing is one of the best policy decisions we can make at this critical moment, when Florida’s families and the overall economy are still climbing toward recovery from the Great Recession.

HOME MATTERS 2016
THE FLORIDA HOUSING COALITION | FLHOUSING.ORG24
1 Wardrip, K., Williams, L., and Hague, S. 2011. The Role of Affordable Housing in Creating Jobs and Stimulating Local Economic Development: A Review of the Literature. Washington, DC: Center for Housing Policy. http://www2.nhc.org/media/files/Housing-and-Economic-Development-Report-2011.pdf. Retrieved 11/24/15.
2 Sadowski Coalition. 2015. Estimate based on July 2015 revenue projections from the Florida Revenue Estimating Conference, 2013 IMPLAN Sector multipliers, and affordable housing industry profiles configured by Dr. Alan Hodges (Extension Scientist, University of Florida). An exception is the Total Development Cost multiplier for SAIL, which was adjusted by the Florida Housing Finance Corporation to be configured for an economically viable tax-exempt bond/SAIL structure expected in 2015.
3 Economic Development Corporation of Sarasota County. 2015. Sarasota County Business Competitiveness: Survey Results. https://assets.documentcloud.org/documents/2394452/final-business-competitiveness-survey-report.pdf. Retrieved 11/16/15.
4 Wardrip et al. 2011.
5 Houser, A., Fox-Grage, W., and Ujvari, K. 2012. Across the States: Profiles of Long-Term Services and Supports. Washington, D.C.: AARP. http://www.aarp.org/content/dam/aarp/research/public_policy_institute/ltc/2012/across-the-states-2012-full-report-AARP-ppi-ltc.pdf. Retrieved 11/24/15.
6 Shinn, G.A. 2014. The Cost of Long-Term Homelessness in Central Florida. Orlando, FL: Central Florida Commission on Homelessness. http://shnny.org/uploads/Florida-Homelessness-Report-2014.pdf. Retrieved 11/24/15.
7 Maqbool, N., Vivieros, J., and Ault, M. 2015. The Impacts of Affordable Housing on Health: A Research Summary. Washington, DC: Center for Housing Policy. http://media.wix.com/ugd/19cfbe_d31c27e13a99486e984e2b6fa3002067.pdf. Retrieved 11/24/15.
8 Ibid.
9 Newman, S.J. 2008. Does Housing Matter for Poor Families? A Critical Summary of Research and Issues Still to be Resolved. Journal of Policy Analysis and Management 27 (4): 895-925.
10 Maqbool et al. 2015.
11 Newman 2008.
12 National Health Care for the Homeless Council. 2011. Homelessness & Health: What’s the Connection? http://www.nhchc.org/wp-content/uploads/2011/09/Hln_health_factsheet_Jan10.pdf. Retrieved 11/24/15.
13 Brennan, M., Reed, P., and Sturtevant, L.A. 2014. The Impacts of Affordable Housing in Education: A Research Summary. Washington, DC: Center for Housing Policy. http://media.wix.com/ugd/19cfbe_c1919d4c2bdf40929852291a57e5246f.pdf. Retrieved 11/24/15.
14 Children’s HealthWatch and Medical-Legal Partnership Boston. 2009. Rx for Hunger: Affordable Housing. http://www.childrenshealthwatch.org/publication/rx-for-hunger-affordable-housing/. Retrieved 11/24/15.
15 Newman 2008.
16 Newman, S.J. and Harkness, J. 1999. The Long-Term Effects of Housing Assistance on Self-Sufficiency: Final Report. Washington, DC: U.S. Department of Housing and Urban Development [HUD]. http://www.huduser.org/portal//Publications/pdf/longterm.pdf. Retrieved 11/24/15.
17 Shimberg Center for Housing Studies. 2015. [Custom tabulations of 2014 and 2005 1-year Public Use Microdata Sample (PUMS) data from the U.S. Census Bureau] Gainesville, FL: University of Florida. Available on request.
18 Ibid.
19 Caregiver Action Network. 2015. Caregiver Statistics. http://caregiveraction.org/resources/caregiver-statistics. Retrieved 11/24/15.
20 Joint Center for Housing Studies of Harvard University [JCHS]. 2015. The State of the Nation’s Housing 2015. http://www.jchs.harvard.edu/research/state_nations_housing. Retrieved 11/18/15.
21 JCHS. 2013. America’s Rental Housing: Evolving Markets and Needs. http://www.jchs.harvard.edu/sites/jchs.harvard.edu/files/jchs_americas_rental_housing_2013_1_0.pdf. Retrieved 11/24/15.
22 Data on student homelessness was obtained from the following sources provided by the National Center for Homeless Education (http://center.serve.org/nche/) :
• Federal data summary for 2011-12 to 2013-14: http://center.serve.org/nche/downloads/data-comp-1112-1314.pdf. Retrieved 11/24/15.• Federal data summary for 2008-09 to 2010-11: http://center.serve.org/nche/downloads/data_comp_0909-1011.pdf. Retrieved 11/24/15.
Endnotes

A REPORT FROM THE FLORIDA HOUSING COALITION
FLHOUSING.ORG | THE FLORIDA HOUSING COALITION 25
23 United Way of Florida. 2014. ALICE (Assed Limited, Income Constrained, Employed): Study of Financial Hardship. http://www.uwof.org/sites/uwof.org/files/14UW%20ALICE%20Report_FL_Lowres_12.17.14.pdf. Retrieved 11/24/15.
24 Florida Department of Economic Opportunity [DEO]. 2015. [2015 statewide Occupational Employment Statistics and Wages (OES) data] http://www.floridajobs.org/labor-market-information/data-center/statistical-programs/occupational-employment-statistics-and-wages. Retrieved 11/24/15.
25 Center for Neighborhood Technology [CNT]. 2015. [Housing + Transportation Index data]. http://htaindex.cnt.org/map/. Retrieved 11/24/15.
26 CNT. 2012. Losing Ground: The Struggle of Moderate-Income Households to Afford the Rising Costs of Housing and Transportation. http://www.cnt.org/sites/default/files/publications/CNT_LosingGround.pdf. Retrieved 11/24/15.
27 Shimberg Center 2015.
28 National Low Income Housing Coalition [NLIHC]. 2015a. [Out of Reach data for Florida.] http://nlihc.org/oor. Retrieved 11/24/15.
29 Bandell, B. 2015, June 5. “Companies need affordable workers, but workers need affordable rent.” South Florida Business Journal [online article]. http://www.bizjournals.com/southflorida/print-edition/2015/06/05/the-workforce-needs-affordable-housing.html. Retrieved 11/24/15.
30 NLIHC. 2015b. Affordable Housing is Nowhere to be Found for Millions. http://nlihc.org/sites/default/files/Housing-Spotlight_Volume-5_Issue-1.pdf. Retrieved 11/24/15.
31 Shimberg Center for Housing Studies. 2014. [Lost Properties Inventory data for Florida] http://flhousingdata.shimberg.ufl.edu/a/lpi. Retrieved 1/12/15.
32 Shimberg Center. 2013. 2013 Rental Market Study: Public and Assisted Housing. http://www.shimberg.ufl.edu/publications/RMS_supply_w_cov.pdf. Retrieved 11/24/15.
33 JCHS 2013.
34 JCHS 2015.
35 Shimberg Center 2015.
36 McCleskey, S. 2015, October 16. “Apartment data finds Herculean strength.” Axiometrics, Inc. [blog]. http://www.axiometrics.com/blog/apartment-data-finds-herculean-strength. Retrieved 11/19/15.
37 McCleskey, S. 2015, October 2. “Apartment market sets 9-year high with 5.2% rent growth in 3Q.” Axiometrics, Inc. [blog]. http://www.axiometrics.com/blog/apartment-market-sets-9-year-high-with-5.2-rent-growth-in-3q. Retrieved 11/19/15.
38 McCleskey, S. 2015, October 16.
39 Make Room. 2015, September 29. “Florida has highest share of renter households paying unaffordable rent.” http://www.makeroomusa.org/news/florida-has-highest-number-of-renter-households-paying-unaffordable-rent/. Retrieved 11/19/15.
40 NLIHC. 2015a. [Out of Reach data for states] http://nlihc.org/oor. Retrieved 11/19/15.
41 HUD. 2015. [Revised Fair Market Rents for 2015] https://www.huduser.gov/portal/datasets/fmr.html. Retrieved 11/19/15.
42 Blomquist, D. 2015, July 31. “How the buy-or-rent balance is shifting.” RealtyTrac. http://www.realtytrac.com/news/home-prices-and-sales/how-the-buy-or-rent-balance-is-shifting/. Retrieved 11/19/15.
43 Gudell, S. 2015, August 12. “At 2015 midpoint, buying remains a better bargain than renting.” http://www.zillow.com/research/q2-2015-rent-mortgage-affordability-10268/. Retrieved 11/19/15.
44 National Association of Home Builders [NAHB]. 2015. [NAHB/Wells Fargo Housing Opportunity Index (HOI) data for 2015 Q3.] http://www.nahb.org/en/research/housing-economics/housing-indexes/housing-opportunity-index.aspx. Retrieved 11/19/15.
45 Shimberg Center 2015.
46 Hielscher, J. 2015, November 12. “Foreclosure filings fall in region.” Sarasota Herald-Tribune [online article]. http://www.heraldtribune.com/article/20151112/ARTICLE/151119894/2107/BUSINESS?p=1&tc=pg. Retrieved 11/20/15.
47 Ostrowski, J. 2015, November 3. “Map: How Florida stacks up when it comes to home price appreciation.” Palm Beach Post [online article]. http://www.mypalmbeachpost.com/news/business/map-how-florida-stacks-when-it-comes-home-price-ap/npFXd/. Retrieved 11/20/15.
48 RealtyTrac. 2015, September 23. “54 percent of U.S. metros on pace to reach eight-year high in home sales in 2015 based on sales through August.” http://www.realtytrac.com/news/home-prices-and-sales/realtytrac-u-s-home-sales-report-august-2015/. Retrieved 11/20/15.

HOME MATTERS 2016
THE FLORIDA HOUSING COALITION | FLHOUSING.ORG26
49 Florida Realtors®. 2015, June 11. “Florida: Dramatic improvement in zombie foreclosures.” http://www.floridarealtors.org/NewsAndEvents/article.cfm?id=324377. Retrieved 11/20/15.
50 Florida Realtors®. 2015, October 27. “Cash sales down—but some Florida cities don’t notice.” http://www.floridarealtors.org/NewsAndEvents/article.cfm?id=329671. Retrieved 11/20/15.
51 Fuller, C. 2015, August 26. “Looking to buy a home with cash? Head east, young man.” Zillow. http://www.zillow.com/research/cash-purchase-markets-q1-2015-10392/. Retrieved 11/20/15.
52 Taylor, S. 2015, May 1. “Tampa Bay among nation’s leaders in all-cash home sales.” Tampa Bay Times [online article]. http://www.tampabay.com/news/business/realestate/tampa-bay-among-nations-leaders-in-all-cash-homes-sales/2227884. Retrieved 11/20/15.
53 RealtyTrac. 2015, April 30. “Share of homes sold to owner-occupants drops to new low in first quarter.” http://www.realtytrac.com/news/realtytrac-reports/q1-2015-cash-investor-distressed-sales-report/. Retrieved 11/20/15.
54 Swanson, B. 2015, November 5. “MBA: Mortgage credit continues to loosen.” HousingWire. http://www.housingwire.com/articles/35544-mba-mortgage-credit-continues-to-loosen. Retrieved 11/20/15.
55 Lane, B. 2015, November 2. “Fed survey shows some banks are making it easier to get a mortgage.” HousingWire. http://www.housingwire.com/articles/35508-fed-survey-shows-some-banks-are-making-it-easier-to-get-a-mortgage. Retrieved 11/20/15.
56 Florida Realtors®. 2015, November 17. “FHA loans back on solid ground.” http://www.floridarealtors.org/NewsAndEvents/article.cfm?id=330583. Retrieved 11/20/15.
57 Garrison, T. 2015, July 2. “RealtyTrac: All-cash sales at lowest since late 2009.” HousingWire. http://www.housingwire.com/articles/34366-realtytrac-all-cash-sales-at-lowest-since-late-2009. Retrieved 11/20/15.
58 Taylor, S. 2015, May 1.
59 Hoag, C. 2015, January 13. “Low-Income Housing Funds are Drying Up All Over America.” TakePart [online magazine]. http://www.takepart.com/article/2015/01/13/low-income-housing. Retrieved 11/24/15.
60 Florida Housing Coalition. 2014, December 17. State and Local Housing Trust Funds in the 2015 Legislative Session. http://www.flhousing.org/wp-content/uploads/2012/04/SHIP-Advocacy-Webinar-2014-12-17-v5JR-edits.pdf. Retrieved 11/24/15.
61 Florida Housing Finance Corporation. [Data provided on request in 2015 for FY 2012-13, in 2014 for FY 2011-12, and in 2013 for FY 2006-07 to FY 20010-11]
62 Ibid.
63 Florida Housing Finance Corporation. 2014. Strategic Plan [adopted 9/19/14]. http://www.floridahousing.org/FH-ImageWebDocs/Aboutus/StrategicPlan/2014StrategicPlanningProcess/2014%20Adopted%20Strategic%20Plan%20-%20September%2019-2014.pdf. Retrieved 11/24/15. See p. 12: 185,000 homeownership and rental units have been assisted by SHIP since the program’s inception in 1992. 185,000 divided by 22 years (1992 to 2014) equals 8,409 units assisted per year. Since this time period includes years when most SHIP funds were swept, 8,409 units annually is a conservative estimate.
64 See Endnote 61. According to the data provided on request from the Florida Housing Finance Corporation, the number of SHIP-assisted households statewide averaged 9,538 between the 2006-07 and 2008-09 fiscal years, and was 10,664 in FY 2008-09.
65 FHFC. 2015. 2014 Annual Report. http://www.floridahousing.org/FH-ImageWebDocs/Newsroom/Publications/AnnualReports/annual_report_2014_7_21_15.pdf. Retrieved 11/23/15.


The Florida Housing Coalition, Inc., is a nonprofit, statewide
membership organization which brings together housing
advocates and resources so that all Floridians have a quality
affordable home and suitable living environment.
FOR MORE INFORMATION,CONTACT:
The Florida Housing Coalition
1367 E. Lafayette St., Ste. C
Tallahassee, FL, 32301
(850) 878-4219
FLHousing.org
The Florida Housing Coalition appreciates PNC for funding the Home Matters report.
Affordable Housing is an Integral Part of Community Revitalization and Economic Development