holistic resource management for sustainable and reliable ......1 holistic resource management for...
TRANSCRIPT
1
Holistic Resource Management for Sustainable and Reliable
Cloud Computing: An Innovative Solution to Global Challenge
Sukhpal Singh Gill1,2, Peter Garraghan1, Vlado Stankovski3, Giuliano Casale4, Ruppa K. Thulasiram5, Soumya K.
Ghosh6, Kotagiri Ramamohanarao2 and Rajkumar Buyya2
1School of Computing and Communications, Lancaster University, UK
2Cloud Computing and Distributed Systems (CLOUDS) Laboratory,
School of Computing and Information Systems, The University of Melbourne, Australia 3Faculty of Civil and Geodetic Engineering, University of Ljubljana, Ljubljana, Slovenia
4Department of Computing, Imperial College London, London, UK 5Department of Computer Science, University of Manitoba, Canada
6Department of Computer Science and Engineering, Indian Institute of Technology, Kharagpur, India
[email protected], [email protected], [email protected], [email protected], [email protected], [email protected], [email protected], [email protected]
Abstract
Minimizing the energy consumption of servers within cloud computing systems is of upmost importance to cloud
providers towards reducing operational costs and enhancing service sustainability by consolidating services onto fewer
active servers. Moreover, providers must also provision high levels of availability and reliability, hence cloud services
are frequently replicated across servers that subsequently increases server energy consumption and resource overhead.
These two objectives can present a potential conflict within cloud resource management decision making that must
balance between service consolidation and replication to minimize energy consumption whilst maximizing server
availability and reliability, respectively. In this paper, we propose a cuckoo optimization-based energy-reliability
aware resource scheduling technique (CRUZE) for holistic management of cloud computing resources including
servers, networks, storage, and cooling systems. CRUZE clusters and executes heterogeneous workloads on
provisioned cloud resources and enhances the energy-efficiency and reduces the carbon footprint in datacenters
without adversely affecting cloud service reliability. We evaluate the effectiveness of CRUZE against existing state-
of-the-art solutions using the CloudSim toolkit. Results indicate that our proposed technique is capable of reducing
energy consumption by 20.1% whilst improving reliability and CPU utilization by 17.1% and 15.7% respectively
without affecting other Quality of Service parameters.
Keywords: Cloud Computing, Energy Consumption, Sustainability, Reliability, Holistic Management, Cloud
Datacenters
1. Introduction
Commercial cloud providers such as Microsoft, Google, and Amazon heavily depend on datacenters to support the
ever-increasing demand for computational requirements of their services. Such demand has subsequently increased
operational costs of running large infrastructures, as well as producing substantial carbon emissions that negatively
impact the environmental sustainability of cloud services [1]. Existing efforts to tackle this problem primarily focus
on minimizing the energy consumption of servers via service consolidation to reduce the number of active servers and
increase datacenter resource utilization [1] [2] [3]. However, such approaches typically do not consider other core
datacenter components, including the network, storage, and cooling systems, which constitute significant amount
(32% approximately) of total Cloud DataCentres (CDC) power consumption [41]. Server consolidation unaware of
the cooling system may increase the number of hot spots in the datacenter which subsequently increases the
requirement of cooling capacity and reduces cooling efficiency [43]. Hotspot mitigation is performed via load
balancing. However, load balancing can widely spread communicating Virtual Machines (VMs) across multiple hosts
without considering their pairwise network traffic, increasing network cost and energy consumption [50]. Thus, to
create cloud platforms that are energy efficient, a resource management approach capable of managing all these
resources (network, storage, servers, memory and cooling components) in a holistic manner is required [2].
While energy efficiency is critical, cloud providers must also provide highly available and reliable cloud services [2].
However, with the growing adoption of cloud, CDCs are rapidly expanding in terms of scale and system complexity,
which has subsequently increased the frequency and diversity of failures [42]. These failures range across Service
Level Agreement (SLA) violation, data corruption, loss/premature execution termination, degrading cloud service
2
performance and availability [3]. In order to address this problem, one of the most common practices is to replicate
cloud services frequently to minimize the risk of simultaneous failure [46]. However, replicas require additional
resource usage from servers within the CDC leading to extra resource usage which increases their respective power
consumption [42]. It has been reported that a huge quantity of base-load energy is consumed even when actual cloud
resource usage is very low or even idle [4] [5]. This results in a potential conflict in resource management decision
making within the CDC to balance between energy consumption and reliability [57] [58]. In order to minimize server
power usage, it would be preferable to consolidate servers and power down idle machines [59]. On the other hand, in
order to maximize cloud service availability and reliability, replicas across additional machines are required [44].
Therefore, a holistic resource management is not only required for managing all aforementioned components, but
must also consider replication and coordination of services to enable reliable delivery of cloud services in a cost-
efficient manner.
Heuristic methods such as evolutionary algorithm are a suitable candidate to tackle the complexity of this problem. Li
et al. [6] suggested that scheduling algorithms equipped with a Cuckoo Optimization (CO) algorithm can be used in
this regard because CO algorithm performs better than Particle Swarm Optimization (PSO) and Ant Colony
Optimization (ACO) in terms of accuracy, speed and convergence [29] for solving batch process and job scheduling
problems [28] [29].The main motivation of this research work is to extend a conceptual model proposed in [2] [44] to
develop a Cuckoo optimization based efficient Resource UtiliZation techniquE called CRUZE for holistic
management of all resources (servers, network, storage, cooling systems) to improve the energy efficiency and reduce
carbon footprint while minimizing service failure within hardware, service, and software to maintain required cloud
service reliability. Our approach clusters the workloads based on their Quality of Service (QoS) parameters for
provisioning of cloud resources and schedules the provisioned resources for workload execution using a Cuckoo
optimization-based scheduling algorithm.
The rest of the article is structured as follows. Section 2 presents the related work of existing holistic resource
management approaches. Section 3 presents the system model and design model of CRUZE. Section 4 proposes the
resource provisioning and scheduling strategy. Section 5 describes the experimental setup and presents the results and
analysis. Section 6 summarizes the paper and offers future research directions.
2. Related Work
Holistic management of cloud resources is a challenging task due to dynamic requirements of cloud users [53]. The
majority of existing works study the energy management of servers alone without omitting other components, which
consume substantial energy [9] [55]. This section describes the existing resource management techniques and their
comparison with our proposed approach.
2.1 Energy-aware Cloud Resource Scheduling
Li et al. [6] proposed an Energy-Aware Resource Scheduling (EARS) technique to execute workloads within virtual
cloud environments. EARS technique models the power and failure profiles for CDC and implements them using
event-based cloud simulator, and is an effective in reducing energy cost of cloud data center and improving task
completion rate, however only considers homogeneous workloads. Similarly, Li et al. [8] proposed a VM Scheduling
(VMS) technique to reduce energy consumption of servers and identifies the effect of energy consumption on SLA
violation rate to improve user satisfaction. Balis et al. [7] proposed a Holistic Approach (HA) for management of IT
infrastructure to reduce execution cost and energy consumption. Perez et al. [10] proposed a Holistic Workload Scaling
(HWS) technique to enable scaling of resources vertically as well as horizontally simultaneously and aids to reduce
latency using multi-scaling approach without considering energy consumption of cloud resources. Luo et al. [11]
formulates energy consumption as a task-core assignment and scheduling problem and proposed a Holistic Energy
Optimization Framework (HEOF) to reduce thermal effect as well as cooling cost simultaneously and HEOF
framework focuses on powerful computation capability. Liu et al. [12] proposed a Server-based Cloud-enabled
Architecture (SCA) to improve the energy-efficiency of different hardware components such as memory, storage and
processors. Furthermore, the performance of SCA is evaluated using a case study of video tracking application and
experimental results show that SCA performs better in terms of memory utilization. Guzek et al. [13] proposed a
Holistic Model for Resource Management (HMRM) in virtualization based cloud datacenter to reduce the energy
consumption of different resources such as memory, storage and networking. Ferrer et al. [14] proposed a Holistic
Approach for Cloud Service Provisioning (HACSP) to meet predicted and unforeseen changes in resource
requirements dynamically and optimizes energy cost. Feller et al. [15] proposed a Holistic approach for Energy
3
Management (HEM) technique for effective management of virtual cloud resources using dynamic web workloads
and saves the substantial amount of energy. Dinkar et al. [60] proposed Energy Efficient Data Center Management
(EEDCM) technique under availability constraints and outlines the importance of availability and designs a hill
climbing algorithm to prevent failure zone. The experimental result shows that EEDCM technique reduces the energy
consumption by the datacenter, but the trade-off between energy consumption and other important QoS parameters
such as reliability, cost and execution time are omitted.
2.2 Reliability-aware Cloud Resource Scheduling
Zhou et al. [16] presented a Cloud Service Reliability Enhancement (CSRE) approach to utilization of network and
storage resources. This approach stores the state of VM using service checkpointing, which is in executing state.
Further, node failure predicator is designed to optimize the use of network resources. Li et al. [17] developed a
convergent dispersal based multi-cloud storage (CDStore) solution to offer reliable, secure and cost-efficient cloud
service. The proposed solution offers deterministic-based deduplication approach to save network bandwidth and
storage space. Moreover, CDStore uses two-stage deduplication to protect the system from malicious attacks.
Azimzadeh et al. [18] proposed a Multi-Objective Resource Scheduling (MORS) approach to increase the reliability
of cloud service and optimize the execution time. Further, authors identify a trade-off between reliability and execution
time for efficient execution of HPC (High Performance Computing) workloads. Poola et al. [19] proposed an Adaptive
and Just-In-Time (AJIT) scheduling approach using spot and on-demand instances to provide fault management
mechanism. This approach uses resource consolidation to optimize execution time and cost and experimental results
indicates that AJIT is efficient for execution of deadline-oriented workloads. Qu et al. [20] proposed a Heterogeneous
Spot Instances-based Auto-scaling (HSIA) approach to execute web applications in a reliable manager. Further, HSIA
approach designed a fault tolerant system to improve the availability and reduce the execution cost and response time
of cloud service. Liu et al. [21] proposed a replication-based state management (E-Storm) approach actively maintains
multiple state backups on different VMs during the execution of real-world and synthetic streaming applications. The
performance of E-Storm is evaluated against checkpointing method and experimental results indicates that E-Storm
achieves effective results in terms of latency and throughput. Abdulhamid et al. [22] proposed a Dynamic Clustering
League Championship Approach (DCLCA) to minimize fault reduction in task failure during resource scheduling for
workload execution. Liang et al. [61] proposed a Resource Optimization method for Cloud Data Center (ROCDC),
which designs a conceptual model to optimize the performance parameters reliability and energy while scheduling
resources. However, this approach was not validated via simulation or experimentation.
2.3 Cuckoo Optimization based Energy-aware Cloud Resource Scheduling
Shahdi-Pashaki et al. [23] proposed a Group Technology-based model and Cuckoo Optimization (GTCO) algorithm
to allocate resources for effective mapping of VMs to cloud workloads. GTCO reduces energy cost during execution
of VMs and performs better than round robin based resource scheduling. Sundarrajan and Vasudevan [24] proposed
a Cuckoo Optimization based Task Scheduling (COTC) algorithm to schedule the tasks in cloud processing and
improves the energy utilization for the execution of homogeneous workloads. Abbasi and Mohri [25] proposed a
Cuckoo Optimization based Resource Management (CORM) mechanism for task scheduling, which improves load
balancing to reduce energy cost. CORM improves energy-efficiency during execution of cloud resources and performs
better than round robin based resource scheduling. Navimipour and Milani [26] proposed a Cuckoo Search Algorithm
based Task Scheduling (CSATS) technique for effective utilization of cloud resources. Authors just measured the
fitness value (execution time) of CSATS with different values of probability to find the cloud resource for execution
of workloads. Madni et al. [27] proposed a Cuckoo Search Meta-Heuristic (CSMH) algorithm, which optimizes
energy consumption of cloud workloads. The performance of COTC [24] and CSMH [27] have been evaluated using
CloudSim [30] and both reduces energy cost of servers without focusing on other components of the cloud datacenter.
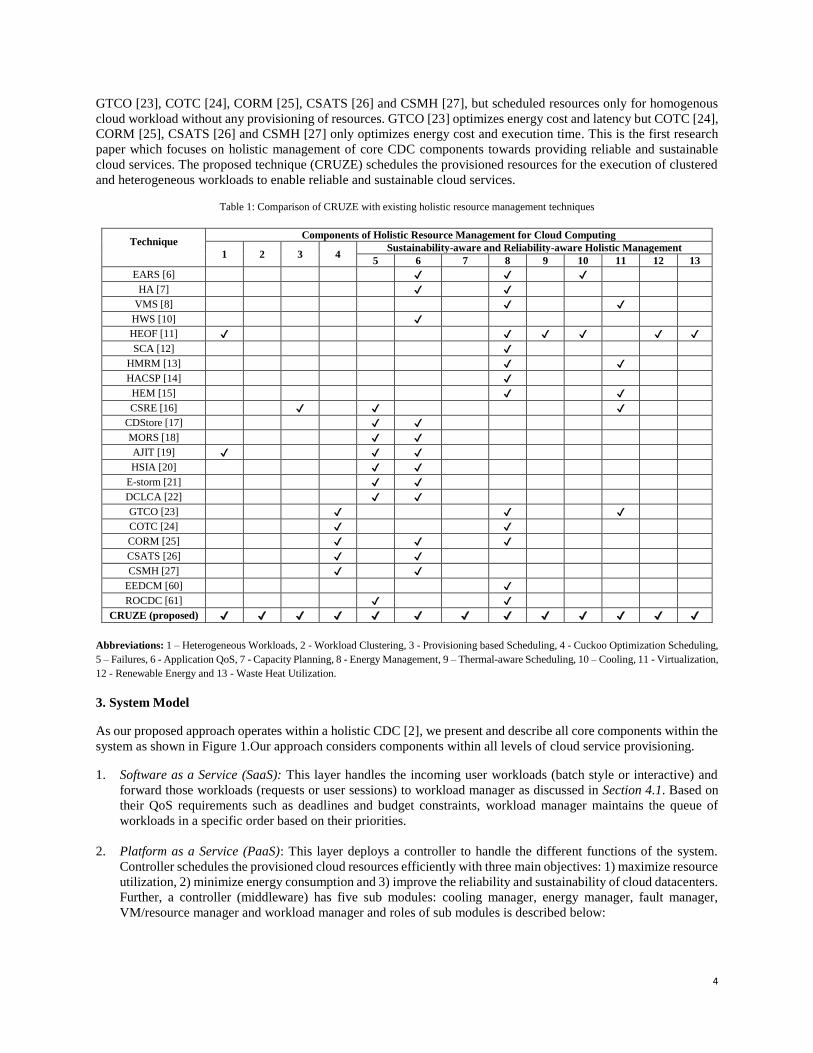
2.4 Comparison of CRUZE with Existing Resource Scheduling Techniques
Table 1 compares our proposed technique (CRUZE) with existing resource scheduling approaches discussed above.
We identified that existing approaches for holistic resource management only consider one or two components
simultaneously. The majority of existing work schedule resources for the execution of homogeneous workloads while
others like EARS [6], HEOF [11] and AJIT [19] schedule resources for the execution of heterogeneous workloads as
well. None of the existing works considers clustering of workloads for resource provisioning. Provisioning based
resource scheduling is only considered in CSRE [16]. Cuckoo Optimization (CO) based scheduling is performed in
4
GTCO [23], COTC [24], CORM [25], CSATS [26] and CSMH [27], but scheduled resources only for homogenous
cloud workload without any provisioning of resources. GTCO [23] optimizes energy cost and latency but COTC [24],
CORM [25], CSATS [26] and CSMH [27] only optimizes energy cost and execution time. This is the first research
paper which focuses on holistic management of core CDC components towards providing reliable and sustainable
cloud services. The proposed technique (CRUZE) schedules the provisioned resources for the execution of clustered
and heterogeneous workloads to enable reliable and sustainable cloud services.
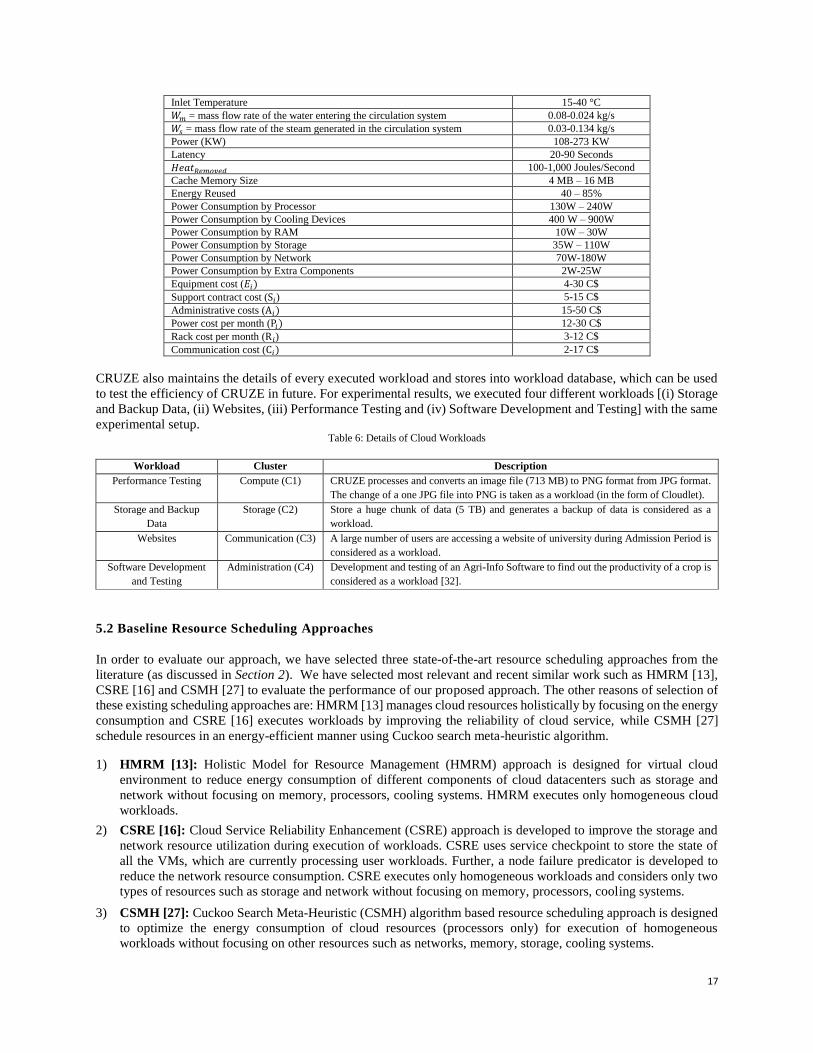
Table 1: Comparison of CRUZE with existing holistic resource management techniques
Technique
Components of Holistic Resource Management for Cloud Computing
1 2 3 4 Sustainability-aware and Reliability-aware Holistic Management
5 6 7 8 9 10 11 12 13
EARS [6] ✔ ✔ ✔
HA [7] ✔ ✔
VMS [8] ✔ ✔
HWS [10] ✔
HEOF [11] ✔ ✔ ✔ ✔ ✔ ✔
SCA [12] ✔
HMRM [13] ✔ ✔
HACSP [14] ✔
HEM [15] ✔ ✔
CSRE [16] ✔ ✔ ✔
CDStore [17] ✔ ✔
MORS [18] ✔ ✔
AJIT [19] ✔ ✔ ✔
HSIA [20] ✔ ✔
E-storm [21] ✔ ✔
DCLCA [22] ✔ ✔
GTCO [23] ✔ ✔ ✔
COTC [24] ✔ ✔
CORM [25] ✔ ✔ ✔
CSATS [26] ✔ ✔
CSMH [27] ✔ ✔
EEDCM [60] ✔
ROCDC [61] ✔ ✔
CRUZE (proposed) ✔ ✔ ✔ ✔ ✔ ✔ ✔ ✔ ✔ ✔ ✔ ✔ ✔
Abbreviations: 1 – Heterogeneous Workloads, 2 - Workload Clustering, 3 - Provisioning based Scheduling, 4 - Cuckoo Optimization Scheduling,
5 – Failures, 6 - Application QoS, 7 - Capacity Planning, 8 - Energy Management, 9 – Thermal-aware Scheduling, 10 – Cooling, 11 - Virtualization,
12 - Renewable Energy and 13 - Waste Heat Utilization.
3. System Model
As our proposed approach operates within a holistic CDC [2], we present and describe all core components within the
system as shown in Figure 1.Our approach considers components within all levels of cloud service provisioning.
1. Software as a Service (SaaS): This layer handles the incoming user workloads (batch style or interactive) and
forward those workloads (requests or user sessions) to workload manager as discussed in Section 4.1. Based on
their QoS requirements such as deadlines and budget constraints, workload manager maintains the queue of
workloads in a specific order based on their priorities.
2. Platform as a Service (PaaS): This layer deploys a controller to handle the different functions of the system.
Controller schedules the provisioned cloud resources efficiently with three main objectives: 1) maximize resource
utilization, 2) minimize energy consumption and 3) improve the reliability and sustainability of cloud datacenters.
Further, a controller (middleware) has five sub modules: cooling manager, energy manager, fault manager,
VM/resource manager and workload manager and roles of sub modules is described below:
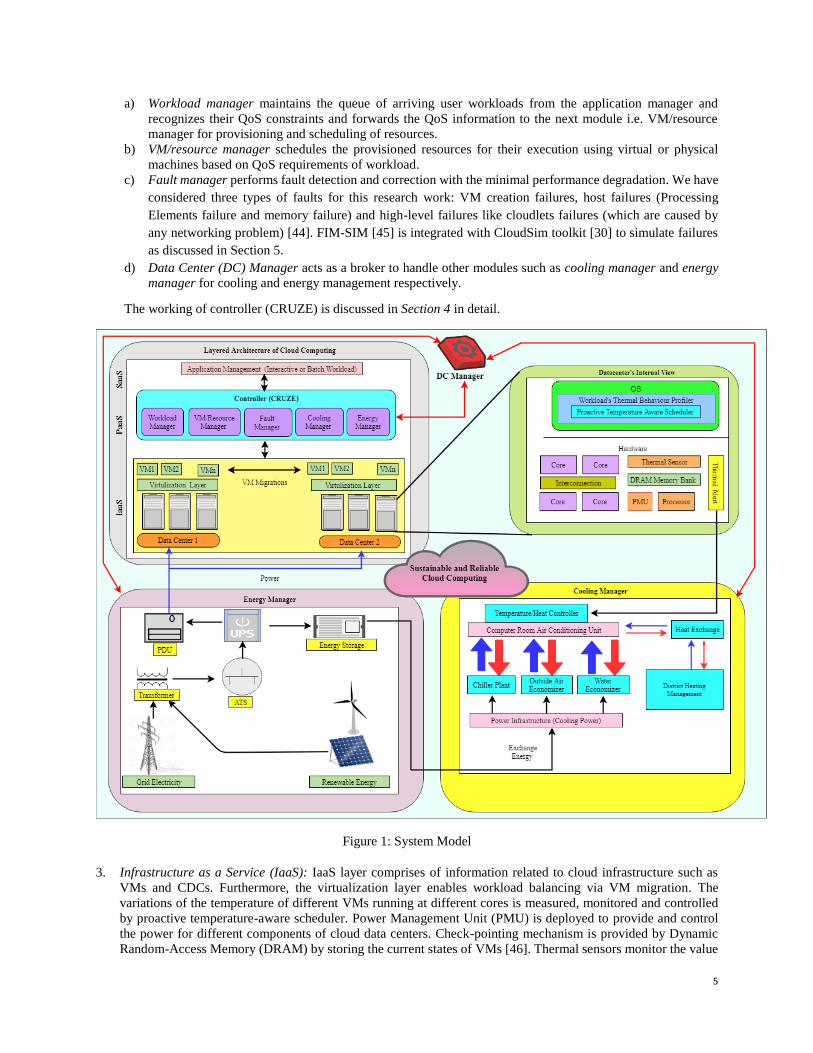
5
a) Workload manager maintains the queue of arriving user workloads from the application manager and
recognizes their QoS constraints and forwards the QoS information to the next module i.e. VM/resource
manager for provisioning and scheduling of resources.
b) VM/resource manager schedules the provisioned resources for their execution using virtual or physical
machines based on QoS requirements of workload.
c) Fault manager performs fault detection and correction with the minimal performance degradation. We have
considered three types of faults for this research work: VM creation failures, host failures (Processing
Elements failure and memory failure) and high-level failures like cloudlets failures (which are caused by
any networking problem) [44]. FIM-SIM [45] is integrated with CloudSim toolkit [30] to simulate failures
as discussed in Section 5.
d) Data Center (DC) Manager acts as a broker to handle other modules such as cooling manager and energy
manager for cooling and energy management respectively.
The working of controller (CRUZE) is discussed in Section 4 in detail.
Figure 1: System Model
3. Infrastructure as a Service (IaaS): IaaS layer comprises of information related to cloud infrastructure such as
VMs and CDCs. Furthermore, the virtualization layer enables workload balancing via VM migration. The
variations of the temperature of different VMs running at different cores is measured, monitored and controlled
by proactive temperature-aware scheduler. Power Management Unit (PMU) is deployed to provide and control
the power for different components of cloud data centers. Check-pointing mechanism is provided by Dynamic
Random-Access Memory (DRAM) by storing the current states of VMs [46]. Thermal sensors monitor the value
6
of temperature and forward to the Thermal profiling and monitoring module to analyze the temperature variations
of cloud datacenters. When system generates thermal alert then heat controller takes a required action to control
the temperature if it is higher than its threshold value and maintains the performance of datacenter. Uninterruptible
Power Supply (UPS) is deployed to continue the power in case of power failure from main sources. For cooling
management, the district heating management uses water economizer, outside air economizer and chiller plant to
control the temperature of CDC. Energy manager manages the energy produced from renewable and non-
renewable sources. Sustainable CDCs focuses more on renewable energy sources (solar and wind) [2] [52]. To
provide reliable services, CDC can prefer grid energy for the execution of deadline-aware workloads. Automatic
Transfer Switch (ATS) manages the electricity producing from renewable as well as non-renewable sources.
Moreover, Power Distribution Unit (PDU) transfers the energy to all the devices of cloud datacenters and cooling
components.
3.1. Design Models
We have used following design models for holistic management of cloud resources:
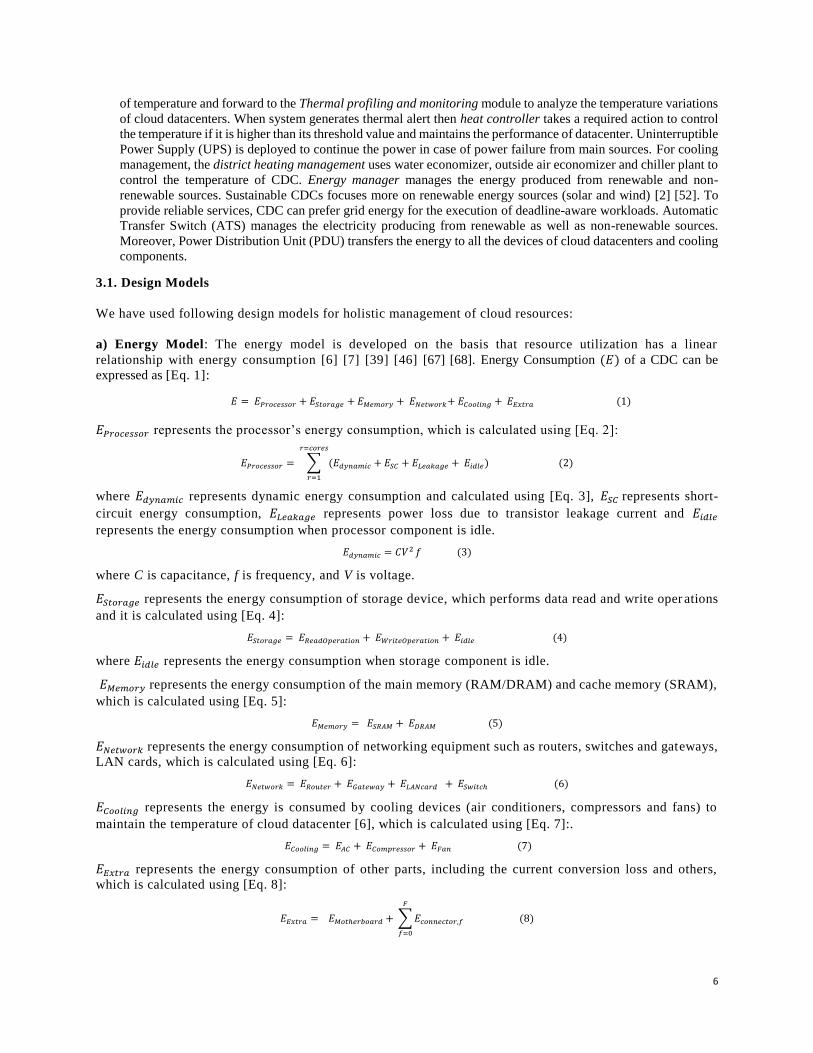
a) Energy Model: The energy model is developed on the basis that resource utilization has a linear
relationship with energy consumption [6] [7] [39] [46] [67] [68]. Energy Consumption (𝐸) of a CDC can be
expressed as [Eq. 1]:
𝐸 = 𝐸𝑃𝑟𝑜𝑐𝑒𝑠𝑠𝑜𝑟 + 𝐸𝑆𝑡𝑜𝑟𝑎𝑔𝑒 + 𝐸𝑀𝑒𝑚𝑜𝑟𝑦 + 𝐸𝑁𝑒𝑡𝑤𝑜𝑟𝑘+ 𝐸𝐶𝑜𝑜𝑙𝑖𝑛𝑔 + 𝐸𝐸𝑥𝑡𝑟𝑎 (1)
𝐸𝑃𝑟𝑜𝑐𝑒𝑠𝑠𝑜𝑟 represents the processor’s energy consumption, which is calculated using [Eq. 2]:
𝐸𝑃𝑟𝑜𝑐𝑒𝑠𝑠𝑜𝑟 = ∑ (𝐸𝑑𝑦𝑛𝑎𝑚𝑖𝑐 + 𝐸𝑆𝐶 + 𝐸𝐿𝑒𝑎𝑘𝑎𝑔𝑒 + 𝐸𝑖𝑑𝑙𝑒)
𝑟=𝑐𝑜𝑟𝑒𝑠
𝑟=1
(2)
where 𝐸𝑑𝑦𝑛𝑎𝑚𝑖𝑐 represents dynamic energy consumption and calculated using [Eq. 3], 𝐸𝑆𝐶 represents short-
circuit energy consumption, 𝐸𝐿𝑒𝑎𝑘𝑎𝑔𝑒 represents power loss due to transistor leakage current and 𝐸𝑖𝑑𝑙𝑒
represents the energy consumption when processor component is idle.
𝐸𝑑𝑦𝑛𝑎𝑚𝑖𝑐 = 𝐶𝑉2 𝑓 (3)
where C is capacitance, f is frequency, and V is voltage.
𝐸𝑆𝑡𝑜𝑟𝑎𝑔𝑒 represents the energy consumption of storage device, which performs data read and write oper ations
and it is calculated using [Eq. 4]:
𝐸𝑆𝑡𝑜𝑟𝑎𝑔𝑒 = 𝐸𝑅𝑒𝑎𝑑𝑂𝑝𝑒𝑟𝑎𝑡𝑖𝑜𝑛 + 𝐸𝑊𝑟𝑖𝑡𝑒𝑂𝑝𝑒𝑟𝑎𝑡𝑖𝑜𝑛 + 𝐸𝑖𝑑𝑙𝑒 (4)
where 𝐸𝑖𝑑𝑙𝑒 represents the energy consumption when storage component is idle.
𝐸𝑀𝑒𝑚𝑜𝑟𝑦 represents the energy consumption of the main memory (RAM/DRAM) and cache memory (SRAM),
which is calculated using [Eq. 5]:
𝐸𝑀𝑒𝑚𝑜𝑟𝑦 = 𝐸𝑆𝑅𝐴𝑀 + 𝐸𝐷𝑅𝐴𝑀 (5)
𝐸𝑁𝑒𝑡𝑤𝑜𝑟𝑘 represents the energy consumption of networking equipment such as routers, switches and gateways,
LAN cards, which is calculated using [Eq. 6]:
𝐸𝑁𝑒𝑡𝑤𝑜𝑟𝑘 = 𝐸𝑅𝑜𝑢𝑡𝑒𝑟 + 𝐸𝐺𝑎𝑡𝑒𝑤𝑎𝑦 + 𝐸𝐿𝐴𝑁𝑐𝑎𝑟𝑑 + 𝐸𝑆𝑤𝑖𝑡𝑐ℎ (6)
𝐸𝐶𝑜𝑜𝑙𝑖𝑛𝑔 represents the energy is consumed by cooling devices (air conditioners, compressors and fans) to
maintain the temperature of cloud datacenter [6], which is calculated using [Eq. 7]:.
𝐸𝐶𝑜𝑜𝑙𝑖𝑛𝑔 = 𝐸𝐴𝐶 + 𝐸𝐶𝑜𝑚𝑝𝑟𝑒𝑠𝑠𝑜𝑟 + 𝐸𝐹𝑎𝑛 (7)
𝐸𝐸𝑥𝑡𝑟𝑎 represents the energy consumption of other parts, including the current conversion loss and others,
which is calculated using [Eq. 8]:
𝐸𝐸𝑥𝑡𝑟𝑎 = 𝐸𝑀𝑜𝑡ℎ𝑒𝑟𝑏𝑜𝑎𝑟𝑑 + ∑ 𝐸𝑐𝑜𝑛𝑛𝑒𝑐𝑡𝑜𝑟,𝑓
𝐹
𝑓=0
(8)
7
where 𝐸𝑀𝑜𝑡ℎ𝑒𝑟𝑏𝑜𝑎𝑟𝑑 is energy consumed by motherboard (s) and ∑ 𝐸𝑐𝑜𝑛𝑛𝑒𝑐𝑡𝑜𝑟,𝑓𝐹
𝑓=0 is energy consumed by a
connector (port) running at the frequency f.
For a resource 𝑟𝑘 at given time 𝑡, the resource utilization 𝑅𝐸𝑆𝑈𝑡,𝑘 is defined as [Eq. 9]:
𝑅𝐸𝑆𝑈𝑡,𝑘 = ∑ 𝑟𝑢𝑡,𝑘,𝑖
𝑚
𝑖=1
(9)
where m is the number of cloud workloads running at time t, 𝑟𝑢𝑡,𝑘,𝑖 is the resource (VMs) usage of workload 𝑤𝑖 on
resource 𝑟𝑘 at given time 𝑡. The actual energy consumption (𝐸𝑐𝑜𝑛𝑠𝑢𝑚𝑝𝑡𝑖𝑜𝑛) is 𝐸𝐶𝑂𝑁𝑡,𝑘 of a resource 𝑟𝑘 at given time t
is defined as [Eq. 10]: 𝐸𝑐𝑜𝑛𝑠𝑢𝑚𝑝𝑡𝑖𝑜𝑛 = 𝐸𝐶𝑂𝑁𝑡,𝑘 = (𝐸𝑚𝑎𝑥 − 𝐸𝑚𝑖𝑛) × 𝑅𝐸𝑆𝑈𝑡,𝑘 + 𝐸𝑚𝑖𝑛 (10)
where 𝐸𝑚𝑎𝑥 is the energy consumption at the peak load (or 100% utilization) and 𝐸𝑚𝑖𝑛 is the minimum
consumption of energy in the idle/active mode (or as low as 1% utilization), which can be calculated using
[Eq. 1] through profiling.
b) Reliability Model: Reliability of cloud services is the ability to provision correct service [44] [46], and is calculated
as [Eq. 11]:
𝑅𝑠𝑒𝑟𝑣𝑖𝑐𝑒 = 𝑒−λt (11)
where t is time for the resource to deal with its request for any workload execution and λ is the failure rate of the
resource at the given time, which is calculated using [Eq. 13].
The list of available SLAs = <𝑚1,𝑚2……………..𝑚𝑛 >, where n is the total number of SLAs.
𝐹𝑎𝑖𝑙𝑢𝑟𝑒 (𝑚) = {1, 𝑚 𝑖𝑠 𝑛𝑜𝑡 𝑣𝑖𝑜𝑙𝑎𝑡𝑒𝑑
0, 𝑚 𝑖𝑠 𝑣𝑖𝑜𝑙𝑎𝑡𝑒𝑑, (12)
Failure rate (λ) is computed as a ratio of the summation of all the SLA violated to the total number of SLAs [46].
λ = ∑ (Failure (𝑚𝑖)
𝑛) (13)
𝑛
𝑖=1
c) Capacity Planning Model: The capacity model is defined in terms of memory utilization, disk utilization
and network utilization at given time 𝑡 [33]. The formula for calculating memory utilization (𝑀𝑈𝑡𝑖𝑙𝑖𝑧𝑎𝑡𝑖𝑜𝑛) in
percentage is as follows [Eq. 14]:
𝑀𝑈𝑡𝑖𝑙𝑖𝑧𝑎𝑡𝑖𝑜𝑛 = Total Physical Memory − (Memory Free + Memory Buffers + Cache Memory)
Total Physical Memory × 100 (14)
The formula for calculating disk utilization (𝐷𝑈𝑡𝑖𝑙𝑖𝑧𝑎𝑡𝑖𝑜𝑛) in percentage is as follows [Eq. 16]:
𝐷𝑈𝑠𝑎𝑔𝑒 = 𝑇𝑜𝑡𝑎𝑙 𝑈𝑠𝑒𝑑
𝑇𝑜𝑡𝑎𝑙 𝐻𝐷 𝑠𝑖𝑧𝑒 × 100 (15)
𝐷𝑈𝑡𝑖𝑙𝑖𝑧𝑎𝑡𝑖𝑜𝑛 = 𝑆𝑡𝑜𝑟𝑎𝑔𝑒 𝐴𝑙𝑙𝑜𝑐𝑎𝑡𝑖𝑜𝑛 𝑈𝑛𝑖𝑡𝑠 × 𝑆𝑡𝑜𝑟𝑎𝑔𝑒 𝑈𝑠𝑒𝑑
𝑆𝑡𝑜𝑟𝑎𝑔𝑒𝐴𝑙𝑙𝑜𝑐𝑎𝑡𝑖𝑜𝑛𝑈𝑛𝑖𝑡𝑠 × 𝑆𝑡𝑜𝑟𝑎𝑔𝑒 𝑆𝑖𝑧𝑒 × 100 (16)
The formula for calculating network utilization (𝑁𝑈𝑡𝑖𝑙𝑖𝑧𝑎𝑡𝑖𝑜𝑛) in percentage is as follows [Eq. 17]:
𝑁𝑈𝑡𝑖𝑙𝑖𝑧𝑎𝑡𝑖𝑜𝑛 = 𝑑𝑎𝑡𝑎 𝑏𝑖𝑡𝑠
𝑏𝑎𝑛𝑑𝑤𝑖𝑑𝑡ℎ × 𝑖𝑛𝑡𝑒𝑟𝑣𝑎𝑙 × 100 (17)
d) Temperature Model: We used Computer Room Air Conditioning (CRAC) model and RC (where R and C
are thermal resistance (k/w) and heat capacity (j/k) of the host respectively) thermal model [34] [64] [65] [66]
to design temperature model for calculation of datacenter temperature (𝐷𝑎𝑡𝑎𝑐𝑒𝑛𝑡𝑒𝑟𝑇𝑒𝑚𝑝). The following
formula is used to calculate the temperature of datacenter [Eq. 18].
8
𝐷𝑎𝑡𝑎𝑐𝑒𝑛𝑡𝑒𝑟𝑇𝑒𝑚𝑝 = 𝑇𝑒𝑚𝑝𝑖𝑛𝑙𝑒𝑡 + ∑ (𝑇𝑒𝑚𝑝𝐶𝑃𝑈𝑖
𝑛) + 𝑇initial ×𝑒−RC (18)
𝑛
𝑖=1
where CRAC model is used to calculate inlet temperature (𝑇𝑒𝑚𝑝𝑖𝑛𝑙𝑒𝑡) and RC model is used to calculate CPU
temperature (𝑇𝑒𝑚𝑝𝐶𝑃𝑈). 𝑇initial is the initial temperature of the CPU. 1 ≤ i ≤ n, n is the number of CPUs.
e) Renewable Energy Model: A renewable energy model [35] is used in terms of Energy Reuse Effectiveness
(ERE) and [Eq. 19] is used to calculate its value.
ERE = 𝐸−𝐸𝑛𝑒𝑟𝑔𝑦𝑅𝑒𝑢𝑠𝑒𝑑
𝐸 (19)
The value of 𝐸 is calculated using [Eq. 1]. 𝐸𝑛𝑒𝑟𝑔𝑦𝑅𝑒𝑢𝑠𝑒𝑑 is amount of energy reused by different IT equipment.
f) Waste Heat Utilization Model: The district heating management based waste heat utilization model [36]
is used in terms of recirculation ratio (𝑅𝑅) and it is defined as the following [Eq. 20]:
𝑅𝑅 = 𝑊𝑚
𝑊𝑠
(20)
where 𝑊𝑚 = mass flow rate of the water entering the circulation system, kilograms per second (kg/s) and 𝑊𝑠
= mass flow rate of the steam generated in the circulation system, kg/s. Resource manager utilizes the waste
heat to generate renewable energy to reduce electricity costs and carbon emissions, which further improves
the sustainability of CDC in an efficient manner.
g) Cooling Management Model: A Water based Cooling Management Model [38] is used in terms of
Datacenter Cooling System (DCS) Efficiency or cooling effectiveness and it is defined as the following [Eq.
21]:
DCS Efficiency = 𝛼 𝐻𝑒𝑎𝑡𝑅𝑒𝑚𝑜𝑣𝑒𝑑 (𝑡)
𝐸𝑁𝐶𝑁𝐶𝑜𝑜𝑙𝑖𝑛𝑔 (21)
𝛼 = 𝑇𝑒𝑚𝑝ExhaustingAir − 𝑇𝑒𝑚𝑝OutsideAir (22)
𝐻𝑒𝑎𝑡𝑅𝑒𝑚𝑜𝑣𝑒𝑑 (𝑡) is calculated as the heat absorbed by the heat pump per unit time t and 𝐸𝑁𝐶𝑁𝐶𝑜𝑜𝑙𝑖𝑛𝑔 is work done
by the cooling devices (compressor, air conditioner and fan) of the heat pump to transfer the thermal energy. Where
𝛼 is weight to prioritize components of the DCS Efficiency and it is the temperature difference between outside air
temperature and the temperature of the (hot) exhausting air of CRAC model [34] as specified in [Eq. 22]. Outside air
temperature is the temperature of data center room [64] [65] [66]. The exhausting air is exhausted from server rack,
which contains server fans, air conditioners and compressors for smooth functioning of CDC [38]. Different from the
outside air cooling, the chiller cooling effectiveness does not change much with temperature and the variation over
different IT load is much smaller than that under outside air cooling.
4 Resource Provisioning and Scheduling
It is very challenging to schedule provisioned resources for workload execution and maintain reliability and
sustainability of cloud service simultaneously [6] [52]. Cloud resource scheduling is a tedious task due to the problem
of finding the best match of resource-workload pair based on the user QoS requirements [31] [39] [46]. The problem
can be expressed as: mapping a set of independent cloud workloads {𝑤1,𝑤2,𝑤3, . . . ,𝑤𝑚} to a set of heterogeneous
and dynamic resources {𝑟1,𝑟2,𝑟3, . . . ,𝑟𝑛} has been taken. For continuous problem, R = {𝑟𝑘 | 1 ≤ k ≤ n} is the collection
of resources and n is the total number of resources. W = {𝑤𝑖|1 ≤ i ≤ m} is the collection of cloud workloads and m is
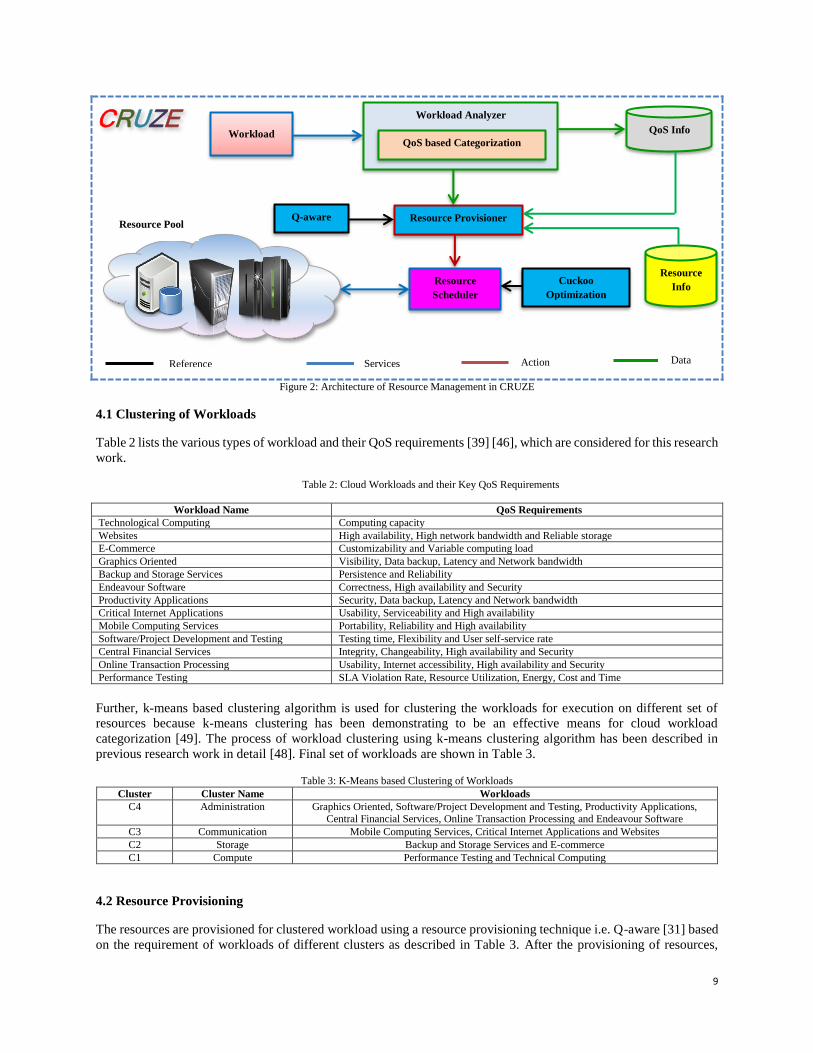
the total number of cloud workloads. Figure 2 shows the resource provisioning and scheduling mechanism for
execution of user workloads, which determines the most suited resources for a given workload. CRUZE operates by
performing the following steps: 1) analyzes workload characteristics with respective QoS requirements, 2) categorizes
workload based on their common QoS requirements, 3) provisions cloud resources for categorized workloads and 4)
schedule the provisioned resources for workload execution.
9
Figure 2: Architecture of Resource Management in CRUZE
4.1 Clustering of Workloads
Table 2 lists the various types of workload and their QoS requirements [39] [46], which are considered for this research
work.
Table 2: Cloud Workloads and their Key QoS Requirements
Workload Name QoS Requirements
Technological Computing Computing capacity
Websites High availability, High network bandwidth and Reliable storage
E-Commerce Customizability and Variable computing load
Graphics Oriented Visibility, Data backup, Latency and Network bandwidth
Backup and Storage Services Persistence and Reliability
Endeavour Software Correctness, High availability and Security
Productivity Applications Security, Data backup, Latency and Network bandwidth
Critical Internet Applications Usability, Serviceability and High availability
Mobile Computing Services Portability, Reliability and High availability Software/Project Development and Testing Testing time, Flexibility and User self-service rate
Central Financial Services Integrity, Changeability, High availability and Security
Online Transaction Processing Usability, Internet accessibility, High availability and Security
Performance Testing SLA Violation Rate, Resource Utilization, Energy, Cost and Time
Further, k-means based clustering algorithm is used for clustering the workloads for execution on different set of
resources because k-means clustering has been demonstrating to be an effective means for cloud workload
categorization [49]. The process of workload clustering using k-means clustering algorithm has been described in
previous research work in detail [48]. Final set of workloads are shown in Table 3.
Table 3: K-Means based Clustering of Workloads
Cluster Cluster Name Workloads
C4 Administration Graphics Oriented, Software/Project Development and Testing, Productivity Applications,
Central Financial Services, Online Transaction Processing and Endeavour Software
C3 Communication Mobile Computing Services, Critical Internet Applications and Websites
C2 Storage Backup and Storage Services and E-commerce
C1 Compute Performance Testing and Technical Computing
4.2 Resource Provisioning
The resources are provisioned for clustered workload using a resource provisioning technique i.e. Q-aware [31] based
on the requirement of workloads of different clusters as described in Table 3. After the provisioning of resources,
CRUZE
Resource Provisioner
Resource
Info Resource
Scheduler
Reference
Action
Cuckoo
Optimization
Based
Workload
Workload Analyzer
QoS Info
QoS based Categorization
Q-aware Resource Pool
Services Data
10
workloads are submitted to resource scheduler. Then, the resource scheduler will ask to submit the workload for
resources provisioned. After this, the resource scheduler returns results to the corresponding cloud user, which
contains the resource information [31].
4.3 Cuckoo Optimization based Resource Scheduling Algorithm
Our proposed scheduling algorithm attempts to minimize overall cloud energy consumption whilst maximizing system
reliability. Attaining these two objectives together is typically considered a trade-off; consolidating VMs onto fewer
active servers minimizes system energy consumption, server failure can affect multiple VMs and reduce system
reliability. In contrast, increasing the number of VM replicas maximizes system reliability, however also incurs
additional energy costs due to greater computation requirements and active servers. To overcome this impact, a trade-
off between energy consumption and reliability is required to provide cost-efficient cloud services. Specifically, whilst
Dynamic Voltage and Frequency Scaling (DVFS) based energy management techniques can reduce energy
consumption, response time and service delay are increased due to the switching of resources between high scaling
and low scaling modes. Furthermore, reliability of the system component is also affected by excessive turning on/off
servers. Power modulation decreases the reliability of server components such as storage devices, memory etc.
Therefore, there is a need of new energy-aware resource management techniques to reduce power consumption whilst
incurring minimal impact upon cloud service reliability [5].
Cuckoo Optimization (CO) algorithm is a based resource scheduling technique is designed for execution of user
workload considering both energy consumption and reliability. The goal of an objective function is to minimize system
energy consumption and maximize server reliability simultaneously for finishing all n workloads. We define fitness
function (𝐹) in terms of energy consumption and reliability as specified in [Eq. 23].
𝐹 = 𝜃 𝐸𝑐𝑜𝑛𝑠𝑢𝑚𝑝𝑡𝑖𝑜𝑛 + 𝛿 𝑅𝑠𝑒𝑟𝑣𝑖𝑐𝑒 (23)
where 0 ≤ θ < 1 and 0 ≤ δ < 1 are weights to prioritize components of the fitness function. Energy consumption
(𝐸𝑐𝑜𝑛𝑠𝑢𝑚𝑝𝑡𝑖𝑜𝑛) and Reliability (𝑅𝑠𝑒𝑟𝑣𝑖𝑐𝑒) is calculated using [Eq. 10] and [Eq. 11] respectively. This objective function
successfully captures the compromise among QoS parameters as specified in [Eq. 23]. Cuckoo Optimization (CO)
algorithm is motivated by the life of the cuckoo bird [28] as it adapts the features of a cuckoo and process of laying
eggs. CO algorithm has both local and global search abilities and the performance of the CO algorithm has been
demonstrated to be more effective in comparison to PSO and ACO in terms of accuracy, speed and convergence [51]
for solving optimization problems such as batch process scheduling and job scheduling [28] [29]. The mapping and
execution of the workloads on suitable cloud resources is recognized to be an NP-complete problem and there is a
need for novel algorithm for resource scheduling with maximum reliability and sustainability of cloud services [6].
We have selected CO algorithm for scheduling of provisioned resources due to following reasons: a) capability to
schedule resources for workload execution automatically, b) relatively straight forward integration with traditional
optimization techniques, and c) easy modification in a dynamic cloud environment. Resource Utilization is a ratio of
execution time of a workload executed by a particular resource to total uptime of that resource and it is specified in
[Eq. 24]. The total uptime of resource is the amount of time that a resource from a resource set is available for execution
of workloads.
𝑅𝑈 = ∑ (𝑒𝑥𝑒𝑐𝑢𝑡𝑖𝑜𝑛 𝑡𝑖𝑚𝑒 𝑜𝑓 𝑎 𝑤𝑜𝑟𝑘𝑙𝑜𝑎𝑑 𝑒𝑥𝑒𝑐𝑢𝑡𝑒𝑑 𝑜𝑛 𝑖𝑡ℎ 𝑟𝑒𝑠𝑜𝑢𝑟𝑐𝑒
𝑡𝑜𝑡𝑎𝑙 𝑢𝑝𝑡𝑖𝑚𝑒 𝑜𝑓 𝑖𝑡ℎ 𝑟𝑒𝑠𝑜𝑢𝑟𝑐𝑒)
𝑛
𝑖=1
(24)
where n is the no. of resources. A resource set consist of number of instances. [Eq. 25] shows 𝑖𝑡ℎ 𝑟𝑒𝑠𝑜𝑢𝑟𝑐𝑒 ( R𝑖)
contains instances (I):
R𝑖 = [𝐼𝑖1, 𝐼𝑖2, … … … . . 𝐼𝑖𝑋 ], where 𝐼𝑖1, 𝐼𝑖2, … … … . . 𝐼𝑖𝑋 are instances of 𝑖𝑡ℎ 𝑟𝑒𝑠𝑜𝑢𝑟𝑐𝑒 and x ≤ 50. (25)
The value of resource utilization depends on the number of instances of that resource are using to execute the workload.
Resource utilization for 𝑖𝑡ℎ 𝑟𝑒𝑠𝑜𝑢𝑟𝑐𝑒 (R𝑖) is shown in [Eq. 26].
𝑅𝑈𝑖 = ∑ (𝐸𝑥𝑒𝑐𝑢𝑡𝑖𝑜𝑛 𝑇𝑖𝑚𝑒 𝑜𝑓 𝑊𝑜𝑟𝑘𝑙𝑜𝑎𝑑 𝑜𝑛 𝑎𝑡ℎ 𝑟𝑒𝑠𝑜𝑢𝑟𝑐𝑒)
𝑥
𝑎=1
∑ (𝑡𝑜𝑡𝑎𝑙 𝑢𝑝𝑡𝑖𝑚𝑒 𝑜𝑓 𝑎𝑡ℎ 𝑟𝑒𝑠𝑜𝑢𝑟𝑐𝑒)𝑥
𝑎=1
(26)
11
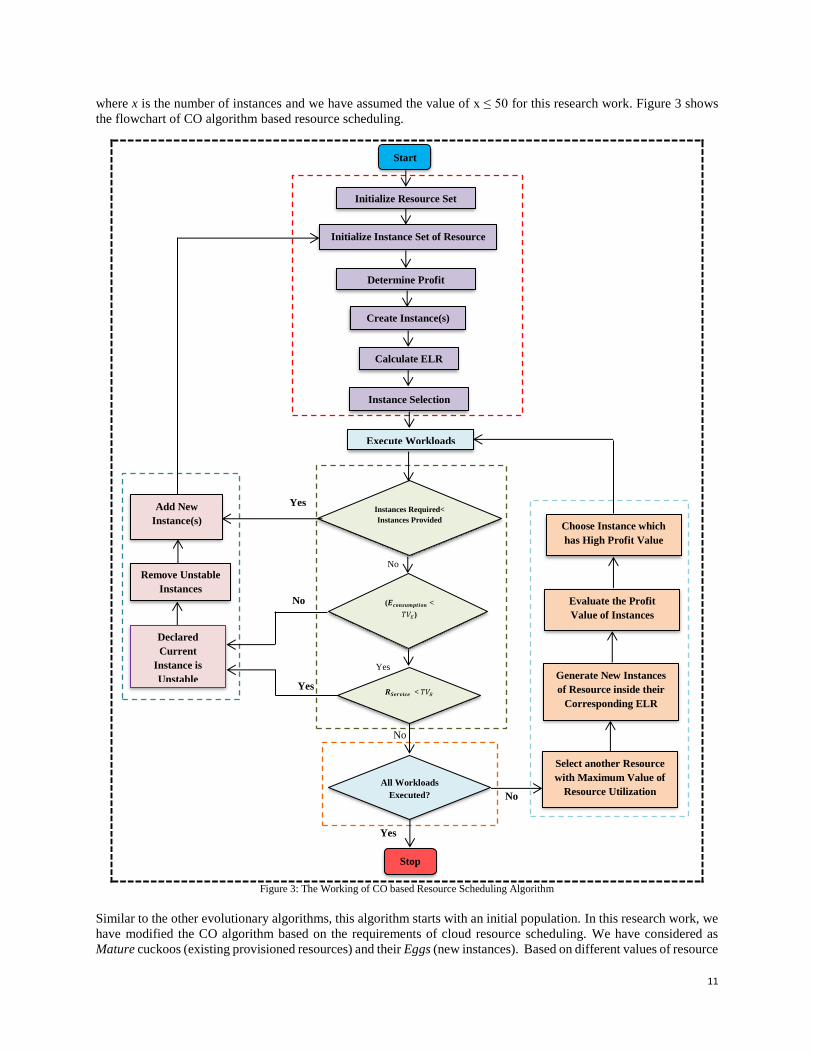
where x is the number of instances and we have assumed the value of x ≤ 50 for this research work. Figure 3 shows
the flowchart of CO algorithm based resource scheduling.
Yes
No
No
Yes
Yes
No
No
Yes
Figure 3: The Working of CO based Resource Scheduling Algorithm
Similar to the other evolutionary algorithms, this algorithm starts with an initial population. In this research work, we
have modified the CO algorithm based on the requirements of cloud resource scheduling. We have considered as
Mature cuckoos (existing provisioned resources) and their Eggs (new instances). Based on different values of resource
Start
Stop
No
Yes
Add New
Instance(s)
Initialize Resource Set
Initialize Instance Set of Resource
Create Instance(s)
Declared
Current
Instance is
Unstable
All Workloads
Executed?
Execute Workloads
Select another Resource
with Maximum Value of
Resource Utilization
Instances Required<
Instances Provided
Generate New Instances
of Resource inside their
Corresponding ELR
Evaluate the Profit
Value of Instances
Remove Unstable
Instances
(𝑬𝒄𝒐𝒏𝒔𝒖𝒎𝒑𝒕𝒊𝒐𝒏 <
𝑇𝑉𝐸)
𝑹𝑺𝒆𝒓𝒗𝒊𝒄𝒆 < 𝑇𝑉𝑅
Choose Instance which
has High Profit Value
Determine Profit
Calculate ELR
Instance Selection
12
utilization (𝑅𝑈), initial population is considered as a resource set and different resources are sorted in decreasing order
( 𝑅𝑈1≥ 𝑅𝑈2
≥ ⋯ ≥ 𝑅𝑈𝑛). There are new instances of those resources to be added to a specific resource for future
execution of workloads and these instances will become part of resource after producing required performance
(Econsumpton < 𝑇𝑉𝐸 && RService > 𝑇𝑉𝑅), where 𝑇𝑉𝐸 is a threshold value for energy and 𝑇𝑉𝑅 is a threshold value
for reliability (which are decided based on the historic data of past execution of workloads [31] [46]). The more
number of instances are adding to a resource pool, the more profit is gained (in terms of resource utilization).
Therefore, the improvement in resource utilization will be the definition that CO algorithm intends to optimize.
The main objective of CO the algorithm in this research work is to increase utilization of resources by selecting best
resource based on their fitness value. Cuckoo search finds the most suitable resource to create more instances in order
to maximize their resource utilization. After new instances performing as required, they come together to make new
resources. Each instance has its resource to execute workloads. The best instance among all the instances will be the
destination for the workloads for their execution. Then they move toward this best resource. They will inhabit near
the best resource. Considering the number of instances each resource has and the resource’s distance to the goal point
(best resource), some range of resource (in terms of Egg Laying Radius (ELR)) is dedicated to it, and is calculated
using [Eq. 33]. There is no obvious metric on the space of resource sets, as opposed to n-dimensional space. The next
step is that a resource begins to create instances in a stochastic manner inside the resource range, defined by the value
of ELR. This process lasts until the best resource with extreme value of profit (in terms of resource utilization) is
obtained and most of the instances of resource are gathered around the same position.
The following are important functions of CO based resource scheduling algorithm:
a) Initialize Resource Set: Cuckoo Habitat as a resource set ( 𝑅𝑒𝑠𝑜𝑢𝑟𝑐𝑒𝑆𝑒𝑡) is considered in CO based resource
scheduling algorithm. The resource set is an array of 1× 𝑞𝑣𝑎𝑟 in 𝑞𝑣𝑎𝑟-dimensional optimization problem, the
resource set is demonstrated as follows [Eq. 26]. Resource set contains different number of resources.
𝑅𝑒𝑠𝑜𝑢𝑟𝑐𝑒𝑆𝑒𝑡 = [𝑅1, 𝑅2, … … … . . 𝑅 𝑞𝑣𝑎𝑟
], where 𝑅1, 𝑅2, … … … . . 𝑅 𝑞𝑣𝑎𝑟 are resources (27)
b) Initialize Instance Set of Resource: Furthermore, every resource contains instances (I) as shown in [Eq. 28].
R 𝑞𝑣𝑎𝑟= [𝐼 𝑞𝑣𝑎𝑟1, 𝐼 𝑞𝑣𝑎𝑟2, … … … . . 𝐼 𝑞𝑣𝑎𝑟𝑋 ], where 𝐼 𝑞𝑣𝑎𝑟1, 𝐼 𝑞𝑣𝑎𝑟2, … … … . . 𝐼 𝑞𝑣𝑎𝑟𝑋 are instances and x ≤ 50. (28)
where x is the number of instances and we have assumed the value of x ≤ 50 for this research work. 𝐼 𝑞𝑣𝑎𝑟𝑖 ∈ {0,
1}, where 1 ≤ i ≤ 50. The value 1 state that the particular instance is initialized and 0 represent the elimination of
that instance from the final set.
c) Determine Profit: The profit of a resource set is obtained by evaluation of profit function at a resource set
(𝑅1, 𝑅2, … … … . . 𝑅𝑚). So, profit function is shown in [Eq. 29]:
Profit = 𝑅𝑈 ( 𝑅𝑒𝑠𝑜𝑢𝑟𝑐𝑒𝑆𝑒𝑡) = 𝑅𝑈 (𝑅1, 𝑅2, … … … . . 𝑅 𝑞𝑣𝑎𝑟) (29)
Profit = 𝑅𝑈(( 𝐼11, 𝐼12, … … … . . 𝐼1𝑋), (𝐼21, 𝐼22, … … … . . 𝐼2𝑋),……………. (𝐼 𝑞𝑣𝑎𝑟1, 𝐼 𝑞𝑣𝑎𝑟2, … … … . . 𝐼 𝑞𝑣𝑎𝑟𝑋)) (30)
Maximize the profit in terms of cost (− 𝑐𝑡) for cost optimization of resource scheduling. To apply the CO
algorithm to solve the minimization problems, it is sufficient to multiply the minus sign by cost function. A
negative sign means that an improvement in the respective resource utilization results in a reduced cost. If the
resource utilization reduces, then it results in an increased cost (because negative times negative results in a
positive). The magnitude of the change is given by the value of the cost. The sign gives the direction of the change.
Profit = −𝐶𝑜𝑠𝑡 (𝑅𝑒𝑠𝑜𝑢𝑟𝑐𝑒𝑆𝑒𝑡) = − 𝑐𝑡(𝑅1, 𝑅2, … … … . . 𝑅 𝑞𝑣𝑎𝑟) (31)
Profit = − 𝑐𝑡(( 𝐼11, 𝐼12, … … … . . 𝐼1𝑋), (𝐼21, 𝐼22, … … … . . 𝐼2𝑋),……………. (𝐼 𝑞𝑣𝑎𝑟1, 𝐼 𝑞𝑣𝑎𝑟2, … … … . . 𝐼 𝑞𝑣𝑎𝑟𝑋)) (32)
To begin the optimization algorithm, a candidate 𝑅𝑒𝑠𝑜𝑢𝑟𝑐𝑒𝑠𝑒𝑡 matrix of size 𝑞𝑝𝑜𝑝 × 𝑞𝑣𝑎𝑟 is created, where
𝑞𝑝𝑜𝑝 is the value of an initial population considered in a resource set. Then some randomly produced number of
instances is supposed for each of these initial resource sets.
13
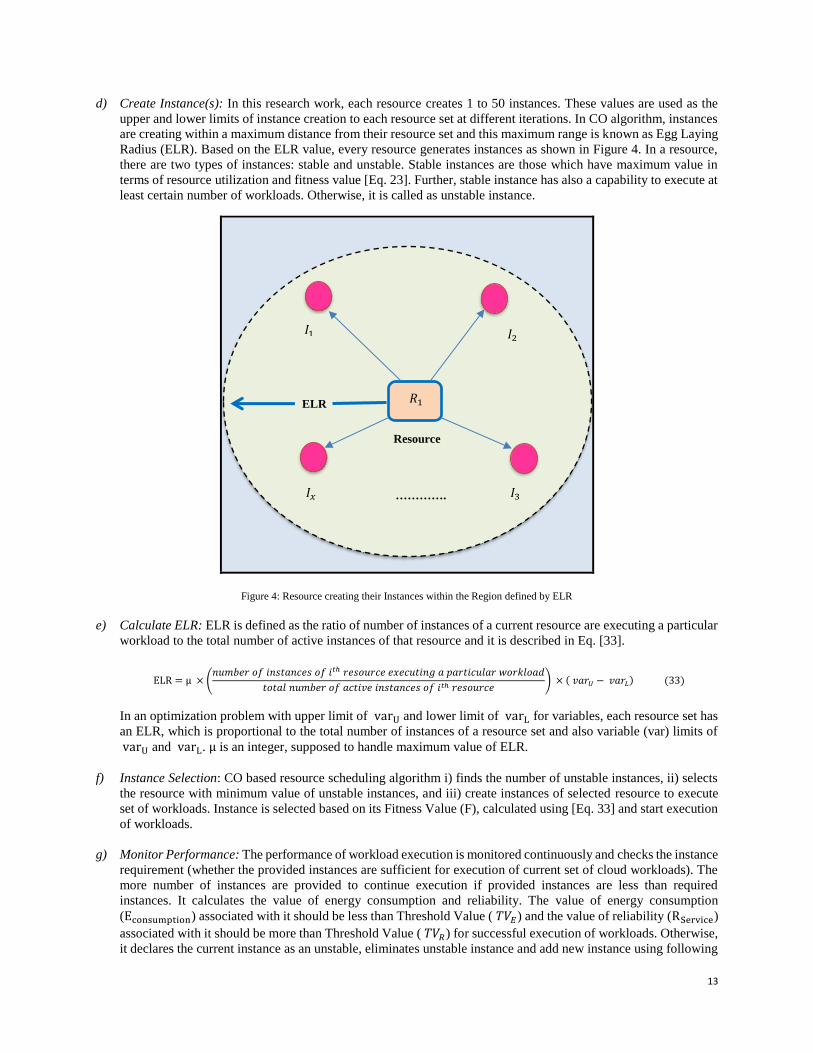
d) Create Instance(s): In this research work, each resource creates 1 to 50 instances. These values are used as the
upper and lower limits of instance creation to each resource set at different iterations. In CO algorithm, instances
are creating within a maximum distance from their resource set and this maximum range is known as Egg Laying
Radius (ELR). Based on the ELR value, every resource generates instances as shown in Figure 4. In a resource,
there are two types of instances: stable and unstable. Stable instances are those which have maximum value in
terms of resource utilization and fitness value [Eq. 23]. Further, stable instance has also a capability to execute at
least certain number of workloads. Otherwise, it is called as unstable instance.
Figure 4: Resource creating their Instances within the Region defined by ELR
e) Calculate ELR: ELR is defined as the ratio of number of instances of a current resource are executing a particular
workload to the total number of active instances of that resource and it is described in Eq. [33].
ELR = µ × (𝑛𝑢𝑚𝑏𝑒𝑟 𝑜𝑓 𝑖𝑛𝑠𝑡𝑎𝑛𝑐𝑒𝑠 𝑜𝑓 𝑖𝑡ℎ 𝑟𝑒𝑠𝑜𝑢𝑟𝑐𝑒 𝑒𝑥𝑒𝑐𝑢𝑡𝑖𝑛𝑔 𝑎 𝑝𝑎𝑟𝑡𝑖𝑐𝑢𝑙𝑎𝑟 𝑤𝑜𝑟𝑘𝑙𝑜𝑎𝑑
𝑡𝑜𝑡𝑎𝑙 𝑛𝑢𝑚𝑏𝑒𝑟 𝑜𝑓 𝑎𝑐𝑡𝑖𝑣𝑒 𝑖𝑛𝑠𝑡𝑎𝑛𝑐𝑒𝑠 𝑜𝑓 𝑖𝑡ℎ 𝑟𝑒𝑠𝑜𝑢𝑟𝑐𝑒) × ( 𝑣𝑎𝑟𝑈 − 𝑣𝑎𝑟𝐿) (33)
In an optimization problem with upper limit of varU and lower limit of varL for variables, each resource set has
an ELR, which is proportional to the total number of instances of a resource set and also variable (var) limits of
varU and varL. µ is an integer, supposed to handle maximum value of ELR.
f) Instance Selection: CO based resource scheduling algorithm i) finds the number of unstable instances, ii) selects
the resource with minimum value of unstable instances, and iii) create instances of selected resource to execute
set of workloads. Instance is selected based on its Fitness Value (F), calculated using [Eq. 33] and start execution
of workloads.
g) Monitor Performance: The performance of workload execution is monitored continuously and checks the instance
requirement (whether the provided instances are sufficient for execution of current set of cloud workloads). The
more number of instances are provided to continue execution if provided instances are less than required
instances. It calculates the value of energy consumption and reliability. The value of energy consumption
(Econsumption) associated with it should be less than Threshold Value ( 𝑇𝑉𝐸) and the value of reliability (RService)
associated with it should be more than Threshold Value ( 𝑇𝑉𝑅) for successful execution of workloads. Otherwise,
it declares the current instance as an unstable, eliminates unstable instance and add new instance using following
𝑅1
𝐼1
Resource
𝐼2
𝐼3
𝐼𝑥
ELR
………….
14
steps: a) select another resource with maximum value of resource utilization, b) generate new instances of
resource inside their corresponding ELR, c) evaluate the profit value of instances and d) choose instance which
has higher profit value. The performance is monitored continuously until all the workloads are not executed.
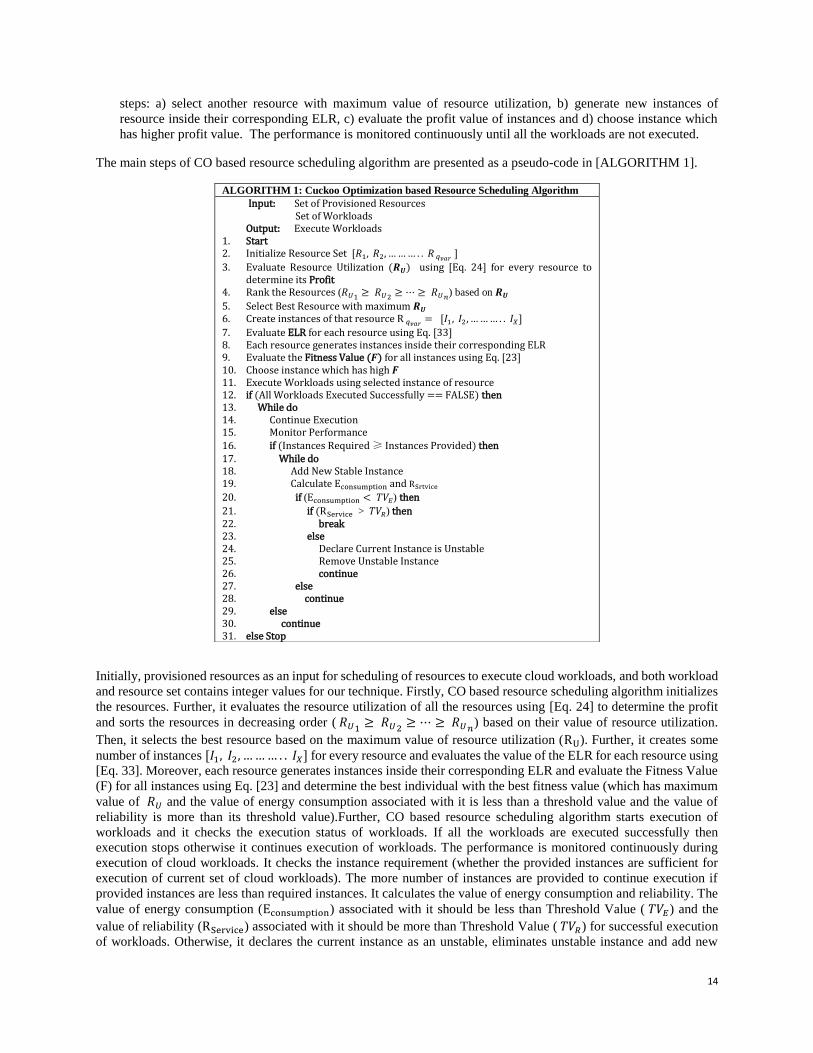
The main steps of CO based resource scheduling algorithm are presented as a pseudo-code in [ALGORITHM 1].
Initially, provisioned resources as an input for scheduling of resources to execute cloud workloads, and both workload
and resource set contains integer values for our technique. Firstly, CO based resource scheduling algorithm initializes
the resources. Further, it evaluates the resource utilization of all the resources using [Eq. 24] to determine the profit
and sorts the resources in decreasing order ( 𝑅𝑈1≥ 𝑅𝑈2
≥ ⋯ ≥ 𝑅𝑈𝑛) based on their value of resource utilization.
Then, it selects the best resource based on the maximum value of resource utilization (RU). Further, it creates some
number of instances [𝐼1, 𝐼2, … … … . . 𝐼𝑋] for every resource and evaluates the value of the ELR for each resource using
[Eq. 33]. Moreover, each resource generates instances inside their corresponding ELR and evaluate the Fitness Value
(F) for all instances using Eq. [23] and determine the best individual with the best fitness value (which has maximum
value of 𝑅𝑈 and the value of energy consumption associated with it is less than a threshold value and the value of
reliability is more than its threshold value).Further, CO based resource scheduling algorithm starts execution of
workloads and it checks the execution status of workloads. If all the workloads are executed successfully then
execution stops otherwise it continues execution of workloads. The performance is monitored continuously during
execution of cloud workloads. It checks the instance requirement (whether the provided instances are sufficient for
execution of current set of cloud workloads). The more number of instances are provided to continue execution if
provided instances are less than required instances. It calculates the value of energy consumption and reliability. The
value of energy consumption (Econsumption) associated with it should be less than Threshold Value ( 𝑇𝑉𝐸) and the
value of reliability (RService) associated with it should be more than Threshold Value ( 𝑇𝑉𝑅) for successful execution
of workloads. Otherwise, it declares the current instance as an unstable, eliminates unstable instance and add new
ALGORITHM 1: Cuckoo Optimization based Resource Scheduling Algorithm
Input: Set of Provisioned Resources Set of Workloads Output: Execute Workloads
1. Start 2. Initialize Resource Set [𝑅1, 𝑅2, … … … . . 𝑅 𝑞𝑣𝑎𝑟
]
3. Evaluate Resource Utilization (𝑹𝑼) using [Eq. 24] for every resource to determine its Profit
4. Rank the Resources (𝑅𝑈1≥ 𝑅𝑈2
≥ ⋯ ≥ 𝑅𝑈𝑛) based on 𝑹𝑼
5. Select Best Resource with maximum 𝑹𝑼 6. Create instances of that resource R 𝑞𝑣𝑎𝑟
= [𝐼1, 𝐼2, … … … . . 𝐼𝑋]
7. Evaluate ELR for each resource using Eq. [33] 8. Each resource generates instances inside their corresponding ELR 9. Evaluate the Fitness Value (𝑭) for all instances using Eq. [23] 10. Choose instance which has high 𝑭 11. Execute Workloads using selected instance of resource 12. if (All Workloads Executed Successfully == FALSE) then 13. While do 14. Continue Execution 15. Monitor Performance 16. if (Instances Required ≥ Instances Provided) then 17. While do 18. Add New Stable Instance 19. Calculate Econsumption and RSrtvice
20. if (Econsumption < 𝑇𝑉𝐸) then
21. if (RService > 𝑇𝑉𝑅) then 22. break 23. else 24. Declare Current Instance is Unstable 25. Remove Unstable Instance 26. continue 27. else 28. continue 29. else 30. continue 31. else Stop
15
instance using following steps: 1) select another resource with maximum value of resource utilization, 2) generate
new instances of resource inside their corresponding ELR, 3) evaluate the profit value of instances and 4) choose
instance which has higher profit value. The performance is monitored continuously until all the workloads are not
executed.
5. Performance Evaluation
We modelled and simulated a cloud environment using CloudSim [30], a prominent cloud computing simulation
framework. Figure 5 shows the interaction of different entities for simulation. Table 4 presents the resource
configuration of the simulation as we used in our previous research work [39] [46]. We used three Physical Machines
(PMs) with different number of virtual nodes (6, 4 and 2) and virtual nodes are further divided into instances called
Execution Components (ECs).
Software as a Service Platform as a Service Infrastructure as a Service
Figure 5: Interaction of various Entities in the Simulated Cloud Environment
Every EC contains their own cost of execution and it is measured with unit (C$/EC time unit (Sec)). EC measures cost
per time unit in Cloud dollars (C$).
Table 4: Configuration Details
Resource_Id Configuration Specifications Core Operating
System
Number of
Virtual Nodes
Number
of ECs
Price
(C$/EC
time unit)
R1 Intel Core 2 Duo - 2.4 GHz
6 GB RAM and 320 GB HDD
2 Windows 6 (1 GB and 50 GB)
18 2
R2 Intel Core i5-
2310- 2.9GHz
4 GB RAM and
160 GB HDD
2 Linux 4 (1 GB and
40 GB)
12 3
R3 Intel XEON E 52407-2.2 GHz
2 GB RAM and 160 GB HDD
2 Linux 2 (1 GB and 60GB)
6 4
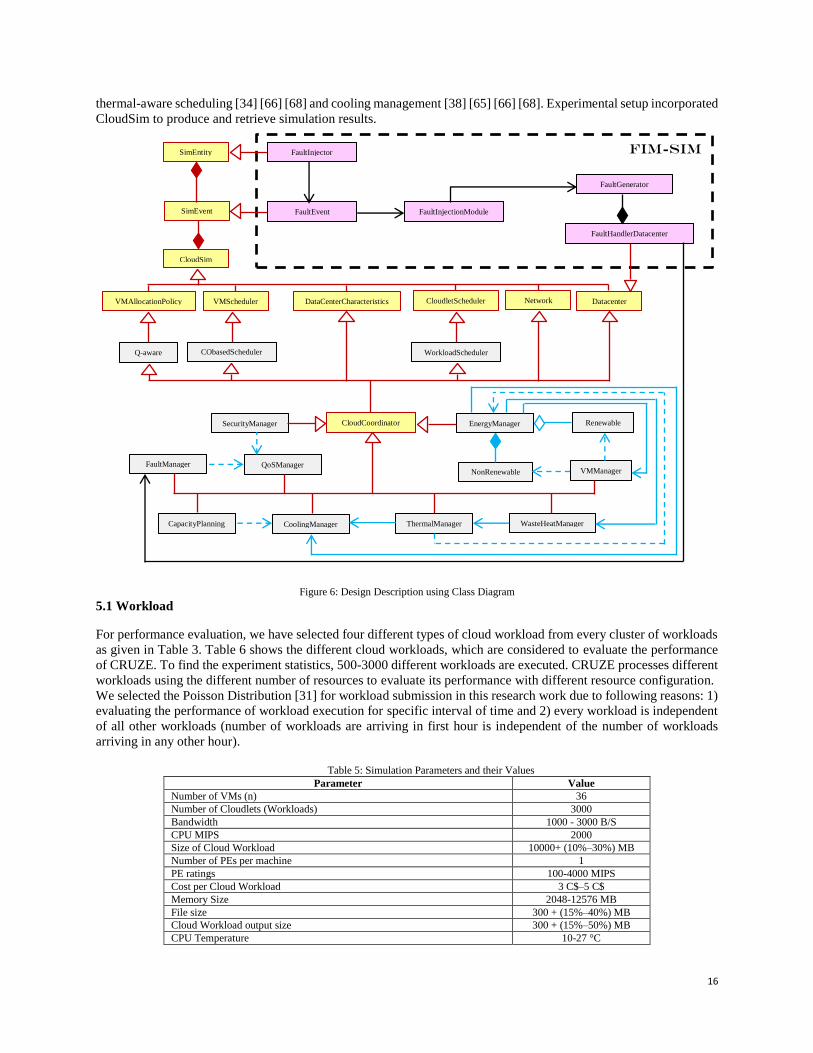
We have integrated temperature and cooling management model [34], renewable energy model [35], waste heat
management model [36], security manager [47] and Fault Injection Module (FIM-SIM) [45] to the CloudSim toolkit
for simulation as shown in Figure 6. We have integrated FIM-SIM [45] for fault management in CloudSim toolkit to
simulate failures (VM creation failures and host failures) as discussed in Case-1 of Section 5.3. The detailed
description about experimental setup is given in previous research work [39] [46].
For the execution of workloads in our experiments, we have chosen varied computational settings on top of
heterogeneous resources. The variety comes in the number of cores at the CPU-level, the page levels of the main
memory, switches at the network level and disk space at the storage level [30] [69] [70]. Cores is the number of
Processing Element’s (PE) required by the Cloudlet. Table 5 shows the simulation parameters utilized in the various
experiments undertaken by this research work, also as identified from the existing empirical studies and literature such
as fault management [6] [39] [46], application’s QoS [39] [44] [47] [46] [67], capacity planning [33] [65], energy
management [6] [7] [44] [67], waste heat utilization [36] [65], renewable energy [35] [38], virtualization [6] [7] [67],
Resource
Information
Resource Provisioner
Workload Resource
Matchmaker
CO-based Resource
Scheduler
Workload
Analyzer
Resource
Provider
Workload
Clustering
Cloud Resource Pool
Workload
Information Q-aware
16
thermal-aware scheduling [34] [66] [68] and cooling management [38] [65] [66] [68]. Experimental setup incorporated
CloudSim to produce and retrieve simulation results.
Figure 6: Design Description using Class Diagram
5.1 Workload
For performance evaluation, we have selected four different types of cloud workload from every cluster of workloads
as given in Table 3. Table 6 shows the different cloud workloads, which are considered to evaluate the performance
of CRUZE. To find the experiment statistics, 500-3000 different workloads are executed. CRUZE processes different
workloads using the different number of resources to evaluate its performance with different resource configuration.
We selected the Poisson Distribution [31] for workload submission in this research work due to following reasons: 1)
evaluating the performance of workload execution for specific interval of time and 2) every workload is independent
of all other workloads (number of workloads are arriving in first hour is independent of the number of workloads
arriving in any other hour).
Table 5: Simulation Parameters and their Values
Parameter Value
Number of VMs (n) 36
Number of Cloudlets (Workloads) 3000
Bandwidth 1000 - 3000 B/S
CPU MIPS 2000
Size of Cloud Workload 10000+ (10%–30%) MB
Number of PEs per machine 1
PE ratings 100-4000 MIPS
Cost per Cloud Workload 3 C$–5 C$
Memory Size 2048-12576 MB
File size 300 + (15%–40%) MB
Cloud Workload output size 300 + (15%–50%) MB
CPU Temperature 10-27 °C
EnergyManager
CloudSim
VMAllocationPolicy VMScheduler DataCenterCharacteristics CloudletScheduler
Q-aware CObasedScheduler WorkloadScheduler
Datacenter Network
CloudCoordinator
QoSManager
SecurityManager
FaultManager
CapacityPlanning ThermalManager
NonRenewable
Renewable
WasteHeatManager CoolingManager
VMManager
SimEvent
SimEntity FIM-SIM
FaultInjector
FaultEvent
FaultGenerator
FaultHandlerDatacenter
FaultInjectionModule
17
Inlet Temperature 15-40 °C
𝑊𝑚 = mass flow rate of the water entering the circulation system 0.08-0.024 kg/s
𝑊𝑠 = mass flow rate of the steam generated in the circulation system 0.03-0.134 kg/s
Power (KW) 108-273 KW
Latency 20-90 Seconds
𝐻𝑒𝑎𝑡𝑅𝑒𝑚𝑜𝑣𝑒𝑑 100-1,000 Joules/Second
Cache Memory Size 4 MB – 16 MB
Energy Reused 40 – 85%
Power Consumption by Processor 130W – 240W
Power Consumption by Cooling Devices 400 W – 900W
Power Consumption by RAM 10W – 30W
Power Consumption by Storage 35W – 110W
Power Consumption by Network 70W-180W
Power Consumption by Extra Components 2W-25W
Equipment cost (𝐸𝑖) 4-30 C$
Support contract cost (S𝑖) 5-15 C$
Administrative costs (A𝑖) 15-50 C$
Power cost per month (P𝑖) 12-30 C$
Rack cost per month (R𝑖) 3-12 C$
Communication cost (C𝑖) 2-17 C$
CRUZE also maintains the details of every executed workload and stores into workload database, which can be used
to test the efficiency of CRUZE in future. For experimental results, we executed four different workloads [(i) Storage
and Backup Data, (ii) Websites, (iii) Performance Testing and (iv) Software Development and Testing] with the same
experimental setup. Table 6: Details of Cloud Workloads
Workload Cluster Description
Performance Testing Compute (C1) CRUZE processes and converts an image file (713 MB) to PNG format from JPG format. The change of a one JPG file into PNG is taken as a workload (in the form of Cloudlet).
Storage and Backup
Data
Storage (C2) Store a huge chunk of data (5 TB) and generates a backup of data is considered as a
workload.
Websites Communication (C3) A large number of users are accessing a website of university during Admission Period is
considered as a workload.
Software Development
and Testing
Administration (C4) Development and testing of an Agri-Info Software to find out the productivity of a crop is
considered as a workload [32].
5.2 Baseline Resource Scheduling Approaches
In order to evaluate our approach, we have selected three state-of-the-art resource scheduling approaches from the
literature (as discussed in Section 2). We have selected most relevant and recent similar work such as HMRM [13],
CSRE [16] and CSMH [27] to evaluate the performance of our proposed approach. The other reasons of selection of
these existing scheduling approaches are: HMRM [13] manages cloud resources holistically by focusing on the energy
consumption and CSRE [16] executes workloads by improving the reliability of cloud service, while CSMH [27]
schedule resources in an energy-efficient manner using Cuckoo search meta-heuristic algorithm.
1) HMRM [13]: Holistic Model for Resource Management (HMRM) approach is designed for virtual cloud
environment to reduce energy consumption of different components of cloud datacenters such as storage and
network without focusing on memory, processors, cooling systems. HMRM executes only homogeneous cloud
workloads.
2) CSRE [16]: Cloud Service Reliability Enhancement (CSRE) approach is developed to improve the storage and
network resource utilization during execution of workloads. CSRE uses service checkpoint to store the state of
all the VMs, which are currently processing user workloads. Further, a node failure predicator is developed to
reduce the network resource consumption. CSRE executes only homogeneous workloads and considers only two
types of resources such as storage and network without focusing on memory, processors, cooling systems.
3) CSMH [27]: Cuckoo Search Meta-Heuristic (CSMH) algorithm based resource scheduling approach is designed
to optimize the energy consumption of cloud resources (processors only) for execution of homogeneous
workloads without focusing on other resources such as networks, memory, storage, cooling systems.
18
Our proposed approach (CRUZE) focuses on holistic management of all resources (including servers, networks,
memory, storage, cooling systems) to provide reliable as well as sustainable cloud services simultaneously, which
schedules the provisioned resources using evolutionary algorithm (Cuckoo Optimization) for the execution of
clustered and heterogeneous workloads within their specified deadline, budget and other important QoS parameters.
5.3 Experimental Results
All the experiments utilized four different workloads described in Table 6. The various parameters are used to evaluate
the performance of proposed approach for holistic resource management, which comprises of different categories such
as fault management, application’s QoS, capacity planning, energy management, waste heat utilization, renewable
energy, virtualization, thermal-aware scheduling and cooling management. The temporal evaluations are conducted
in a time period of 12 hours with 3000 workloads submitted. The performance of CRUZE is evaluated using following
different test cases:
Case 1 - Fault Management: We have evaluated the performance of CRUZE in terms of reliability and fault detection
rate for fault tolerance and used [Eq. 11] to measure the value of reliability. Fault detection rate is defined as the ratio
of number of faults/failures (hardware, software, network) detected to the total number of faults/failures in the system
[46]. Fault Detection Rate (FDR) is calculated using [Eq. 34].
FDR =Number of Faults Detected
Total number of Faults (34)
Faults can be a network, software or hardware, which is detected based on the violation of SLA. The Software
faults/failures can be occurred due to following reasons: 1) lesser storage space, 2) resource unavailability, 3)
deadlocks and 4) unhandled exceptions. The reasons of hardware faults/failures can be problems in hardware parts
such as hard disk, primary memory and processor. Network error can be breakage of network, scalability or physical
damage.
FIM-SIM: We have integrated Fault Injection Module (FIM-SIM) [45] [46] to inject faults automatically to test the
reliability of CRUZE as shown in Figure 6. FIM-SIM is working based on event-driven models and injects faults into
the CloudSim [30] using different statistical distributions at runtime. A Weibull Distribution is used in order to model
failures characteristics when injecting faults [46]. We injected three types of faults: VM creation failures, host failures
(Processing Elements failure and memory failure) and high-level failures like cloudlets failures (which are caused by
any networking problem that CloudSim [30] cannot handle). The entities in CloudSim [30] communicate through
messages. Since host and VM are static entities, each change in their state should be realized by the datacenter. The
broker, based on the simulation configuration (number of cloudlets and their specification) will request the VM
creation, cloudlet scheduling and it will wait to be informed by the datacenter when the cloudlets completion is
realized. We have simulated VM creation failures, host failures (hardware failure) and cloudlets failures (network
failure) by creating fault injector thread, which sends the failure event based on the following command:
sendNow(dataCenter.getId(), FaultEventTags.HOST_FAILURE, host); and it generates the events based on statistical
distribution using Weibull Distribution [46]. The Fault Tolerance Module is extending the CloudSim core functions
(see Figure 6) with three entities (FaultInjector, FaultEvent and FaultHandlerDatacenter) as described in Table 7.
Table 7: Entitles of FIM-SIM and their functionalities
FaultInjector FaultEvent FaultHandlerDatacenter
Extends the SimEntity class
starts at simulation startup along with
the other entities from the system
Responsible for inserting fault events at
random moments of time
The random generation of moments of
time is based on a statistical distribution
(We used Weibull Distribution [46] for this research work.)
Extends the SimEvent class
Describes a fault event: source,
destination, time and type; – tag type:
HOST FAILURE, CLOUDLET
FAILURE, CREATE VM FAILURE
Created in the Fault Injection Module.
extends the Datacenter class
processes fault events sent by the
FaultGenerator
It updates the cloudlet execution/status
according to the fault event type
handles VM migration; – since host and
VM are static entities, all its state
modification should be processed by the datacenter.
19
CRUZE uses the concept of Carburizer [37] [46] to perform process of hardware hardening, which reduces the
frequency of faults/failures. CRUZE replaces the new driver (harden driver) with original in case of fault and update
the database regarding new faults to avoid future faults, which improves the fault detection rate in CRUZE as
compared to HMRM, CSRE and CSMH. Figure 7 (a) shows the variation of fault detection rate for CRUZE, HMRM,
CSRE and CSMH. Fault detection rate is decreasing as number of workloads increases for CRUZE, HMRM, CSRE
and CSMH, but CRUZE performs better than HMRM, CSRE and CSMH. The average value of fault detection rate in
CRUZE is 19.99%, 21.14% and 22.45% more than HMRM, CSRE and CSMH respectively. Dynamic Random-Access
Memory (DRAM) provides the Check-pointing mechanism to store the current states of VMs in case of failure [46].
Figure 7 (b) shows the variation of reliability for CRUZE, HMRM, CSRE and CSMH with different number of
workloads (500-3000). The average value of reliability in CRUZE is 19.07%, 19.75% and 20.98% more than HMRM,
CSRE and CSMH respectively.
Case 2 - Application QoS: We have considered three performance parameters for application’s QoS: execution cost,
time and security [37]. Execution cost is defined as the total money that can be spent in one hour to execute the
application successfully and execution cost is measured in Cloud Dollars (C$) [2]. We have used following formula
to calculate Execution Cost (C) [Eq. 35]. 𝐶 = 𝐸𝑡 × 𝑃𝑟𝑖𝑐𝑒 (35)
where “price” of a resource is calculated using Table 4 and the value of 𝐸𝑡 is calculated using [Eq. 36]. Figure 7 (c)
shows the comparison of CRUZE, HMRM, CSRE and CSMH in terms of execution cost and cost is increasing with
increase in number of workloads for CRUZE, HMRM, CSRE and CSMH, but CRUZE consumes less cost as
compared to HMRM, CSRE and CSMH. The average value of cost in CRUZE is 14.41%, 14.91% and 15.46% less
than HMRM, CSRE and CSMH respectively.
In resource scheduler, CRUZE considers the impact of other workloads on current workload during execution.
CRUZE schedules provisioned resources using Q-aware [37], which clusters the workloads and execute within
their specified deadline and budget. Execution time is the amount of time required to execute application
successfully and execution time is measured in Seconds [2]. [Eq. 36] is used to calculate Execution Time (𝐸𝑡).
𝐸𝑡 = ∑ (𝑊𝐶𝑖 − 𝑊𝑆𝑖
𝑚)
𝑚
𝑖=1
+ 𝛥𝑡𝑖 (36)
Where 𝑊𝐶𝑖 is workload completion time and 𝑊𝑆𝑖 is workload submission time, 𝛥𝑡𝑖 is time to restart the node
and m is the number of workloads. Figure 7 (d) shows the variation of an execution time with different number
of workloads and time is increasing with increase in number of workloads for both CRUZE, HMRM, CSRE
and CSMH. The average value of execution time in CRUZE is 9.96%, 10.35% and 12.11% less than HMRM,
CSRE and CSMH respectively because CRUZE tracks the resource states automatically for effective
decisions. Security is an ability of the computing system to protect the system from malicious at tacks and
measured in terms of Intrusion Detection Rate (IDR) [47]. IDR is described in [Eq. 37], which is the ratio of
total number of true positives to the total number of intrusions.
𝐼𝐷𝑅 =𝑇𝑜𝑡𝑎𝑙 𝑁𝑢𝑚𝑏𝑒𝑟 𝑜𝑓 𝑇𝑟𝑢𝑒 𝑃𝑜𝑠𝑖𝑡𝑖𝑣𝑒𝑠
𝑇𝑜𝑡𝑎𝑙 𝑁𝑢𝑚𝑏𝑒𝑟 𝑜𝑓 𝐼𝑛𝑡𝑟𝑢𝑠𝑖𝑜𝑛𝑠 (37)
IDR considers the number of detected and blocked attacks. CRUZE deploys security agents on different
computing systems, which trace unknown attacks (using an anomaly-based detector) and known attacks (using
a signature-based detector). It captures new anomalies based on existing data stored in the central database
(SNORT DB). CRUZE captures and detects anomalies using the Intrusion Detection System and labels it as
anomalous or normal traffic data by comparing its signatures with the signatures of known attacks [47]. A
State Vector Machine-based security agent detects the new anomalies and stores the information into the
database to maintain a log about attacks. CRUZE protects from security attacks: DDoS (HTTP Flood and
Zero-Day Attack), Probing (NMAP and Ports sweep), U2R (Buffer Overflow and Rootkits), R2L (IMAP,
Guess password and SPY) and DoS (Teardrop, SYN Flood, LAND and Smurf) as discussed in previous
research work [47]. Figure 7 (e) shows the comparison of CRUZE, HMRM, CSRE and CSMH in terms of
intrusion detection rate with different number of workloads. The value of intrusion detection rate is increasing
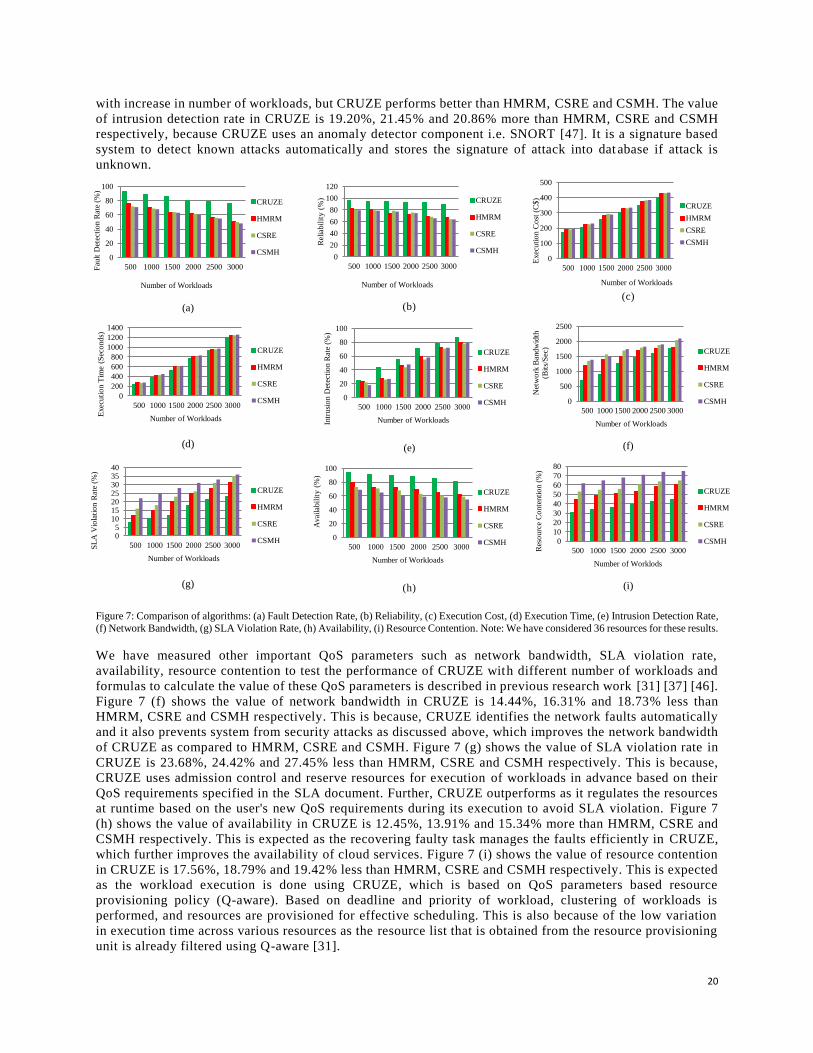
20
with increase in number of workloads, but CRUZE performs better than HMRM, CSRE and CSMH. The value
of intrusion detection rate in CRUZE is 19.20%, 21.45% and 20.86% more than HMRM, CSRE and CSMH
respectively, because CRUZE uses an anomaly detector component i.e. SNORT [47]. It is a signature based
system to detect known attacks automatically and stores the signature of attack into dat abase if attack is
unknown.
(a)
(b)
(c)
(d)
(e)
(f)
(g)
(h)
(i)
Figure 7: Comparison of algorithms: (a) Fault Detection Rate, (b) Reliability, (c) Execution Cost, (d) Execution Time, (e) Intrusion Detection Rate,
(f) Network Bandwidth, (g) SLA Violation Rate, (h) Availability, (i) Resource Contention. Note: We have considered 36 resources for these results.
We have measured other important QoS parameters such as network bandwidth, SLA violation rate,
availability, resource contention to test the performance of CRUZE with different number of workloads and
formulas to calculate the value of these QoS parameters is described in previous research work [31] [37] [46].
Figure 7 (f) shows the value of network bandwidth in CRUZE is 14.44%, 16.31% and 18.73% less than
HMRM, CSRE and CSMH respectively. This is because, CRUZE identifies the network faults automatically
and it also prevents system from security attacks as discussed above, which improves the network bandwidth
of CRUZE as compared to HMRM, CSRE and CSMH. Figure 7 (g) shows the value of SLA violation rate in
CRUZE is 23.68%, 24.42% and 27.45% less than HMRM, CSRE and CSMH respectively. This is because,
CRUZE uses admission control and reserve resources for execution of workloads in advance based on their
QoS requirements specified in the SLA document. Further, CRUZE outperforms as it regulates the resources
at runtime based on the user's new QoS requirements during its execution to avoid SLA violation. Figure 7
(h) shows the value of availability in CRUZE is 12.45%, 13.91% and 15.34% more than HMRM, CSRE and
CSMH respectively. This is expected as the recovering faulty task manages the faults efficiently in CRUZE,
which further improves the availability of cloud services. Figure 7 (i) shows the value of resource contention
in CRUZE is 17.56%, 18.79% and 19.42% less than HMRM, CSRE and CSMH respectively. This is expected
as the workload execution is done using CRUZE, which is based on QoS parameters based resource
provisioning policy (Q-aware). Based on deadline and priority of workload, clustering of workloads is
performed, and resources are provisioned for effective scheduling. This is also because of the low variation
in execution time across various resources as the resource list that is obtained from the resource provisioning
unit is already filtered using Q-aware [31].
0
20
40
60
80
100
500 1000 1500 2000 2500 3000Fau
lt D
etec
tio
n R
ate
(%)
Number of Workloads
CRUZE
HMRM
CSRE
CSMH0
20
40
60
80
100
120
500 1000 1500 2000 2500 3000
Rel
iabil
ity (
%)
Number of Workloads
CRUZE
HMRM
CSRE
CSMH0
100
200
300
400
500
500 1000 1500 2000 2500 3000
Exec
uti
on C
ost
(C
$)
Number of Workloads
CRUZE
HMRM
CSRE
CSMH
0
200
400
600
800
1000
1200
1400
500 1000 1500 2000 2500 3000
Exec
uti
on T
ime
(Sec
onds)
Number of Workloads
CRUZE
HMRM
CSRE
CSMH 0
20
40
60
80
100
500 1000 1500 2000 2500 3000
Intr
usi
on D
etec
tio
n R
ate
(%)
Number of Workloads
CRUZE
HMRM
CSRE
CSMH 0
500
1000
1500
2000
2500
500 1000 1500 2000 2500 3000
Net
wo
rk B
andw
idth
(Bit
s/S
ec)
Number of Workloads
CRUZE
HMRM
CSRE
CSMH
05
10152025303540
500 1000 1500 2000 2500 3000SL
A V
iola
tio
n R
ate
(%)
Number of Workloads
CRUZE
HMRM
CSRE
CSMH 0
20
40
60
80
100
500 1000 1500 2000 2500 3000
Avai
labil
ity (
%)
Number of Workloads
CRUZE
HMRM
CSRE
CSMH 0
10
20
30
40
50
60
70
80
500 1000 1500 2000 2500 3000Res
ourc
e C
onte
nti
on (
%)
Number of Worklods
CRUZE
HMRM
CSRE
CSMH
21
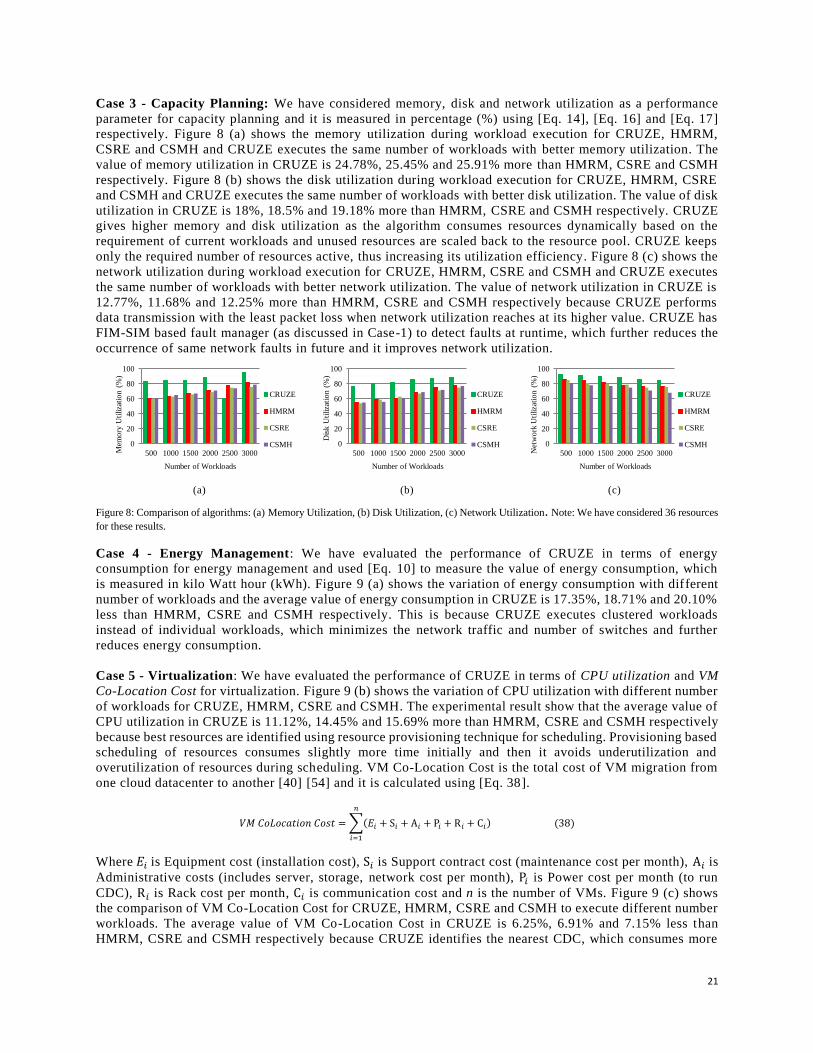
Case 3 - Capacity Planning: We have considered memory, disk and network utilization as a performance
parameter for capacity planning and it is measured in percentage (%) using [Eq. 14], [Eq. 16] and [Eq. 17]
respectively. Figure 8 (a) shows the memory utilization during workload execution for CRUZE, HMRM,
CSRE and CSMH and CRUZE executes the same number of workloads with better memory utilization. The
value of memory utilization in CRUZE is 24.78%, 25.45% and 25.91% more than HMRM, CSRE and CSMH
respectively. Figure 8 (b) shows the disk utilization during workload execution for CRUZE, HMRM, CSRE
and CSMH and CRUZE executes the same number of workloads with better disk utilization. The value of disk
utilization in CRUZE is 18%, 18.5% and 19.18% more than HMRM, CSRE and CSMH respectively. CRUZE
gives higher memory and disk utilization as the algorithm consumes resources dynamically based on the
requirement of current workloads and unused resources are scaled back to the resource pool. CRUZE keeps
only the required number of resources active, thus increasing its utilization efficiency. Figure 8 (c) shows the
network utilization during workload execution for CRUZE, HMRM, CSRE and CSMH and CRUZE executes
the same number of workloads with better network utilization. The value of network utilization in CRUZE is
12.77%, 11.68% and 12.25% more than HMRM, CSRE and CSMH respectively because CRUZE performs
data transmission with the least packet loss when network utilization reaches at its higher value. CRUZE has
FIM-SIM based fault manager (as discussed in Case-1) to detect faults at runtime, which further reduces the
occurrence of same network faults in future and it improves network utilization.
(a)
(b)
(c)
Figure 8: Comparison of algorithms: (a) Memory Utilization, (b) Disk Utilization, (c) Network Utilization. Note: We have considered 36 resources
for these results.
Case 4 - Energy Management: We have evaluated the performance of CRUZE in terms of energy
consumption for energy management and used [Eq. 10] to measure the value of energy consumption, which
is measured in kilo Watt hour (kWh). Figure 9 (a) shows the variation of energy consumption with different
number of workloads and the average value of energy consumption in CRUZE is 17.35%, 18.71% and 20.10%
less than HMRM, CSRE and CSMH respectively. This is because CRUZE executes clustered workloads
instead of individual workloads, which minimizes the network traffic and number of switches and further
reduces energy consumption.
Case 5 - Virtualization: We have evaluated the performance of CRUZE in terms of CPU utilization and VM
Co-Location Cost for virtualization. Figure 9 (b) shows the variation of CPU utilization with different number
of workloads for CRUZE, HMRM, CSRE and CSMH. The experimental result show that the average value of
CPU utilization in CRUZE is 11.12%, 14.45% and 15.69% more than HMRM, CSRE and CSMH respectively
because best resources are identified using resource provisioning technique for scheduling. Provisioning based
scheduling of resources consumes slightly more time initially and then it avoids underutilization and
overutilization of resources during scheduling. VM Co-Location Cost is the total cost of VM migration from
one cloud datacenter to another [40] [54] and it is calculated using [Eq. 38].
𝑉𝑀 𝐶𝑜𝐿𝑜𝑐𝑎𝑡𝑖𝑜𝑛 𝐶𝑜𝑠𝑡 = ∑(𝐸𝑖 + S𝑖 + A𝑖 + P𝑖 + R𝑖 + C𝑖) (38)
𝑛
𝑖=1
Where 𝐸𝑖 is Equipment cost (installation cost), S𝑖 is Support contract cost (maintenance cost per month), A𝑖 is
Administrative costs (includes server, storage, network cost per month), P𝑖 is Power cost per month (to run
CDC), R𝑖 is Rack cost per month, C𝑖 is communication cost and n is the number of VMs. Figure 9 (c) shows
the comparison of VM Co-Location Cost for CRUZE, HMRM, CSRE and CSMH to execute different number
workloads. The average value of VM Co-Location Cost in CRUZE is 6.25%, 6.91% and 7.15% less than
HMRM, CSRE and CSMH respectively because CRUZE identifies the nearest CDC, which consumes more
0
20
40
60
80
100
500 1000 1500 2000 2500 3000Mem
ory
Uti
liza
tio
n (
%)
Number of Workloads
CRUZE
HMRM
CSRE
CSMH 0
20
40
60
80
100
500 1000 1500 2000 2500 3000
Dis
k U
tiliza
tio
n (
%)
Number of Workloads
CRUZE
HMRM
CSRE
CSMH 0
20
40
60
80
100
500 1000 1500 2000 2500 3000Net
wo
rk U
tilizat
ion (
%)
Number of Workloads
CRUZE
HMRM
CSRE
CSMH
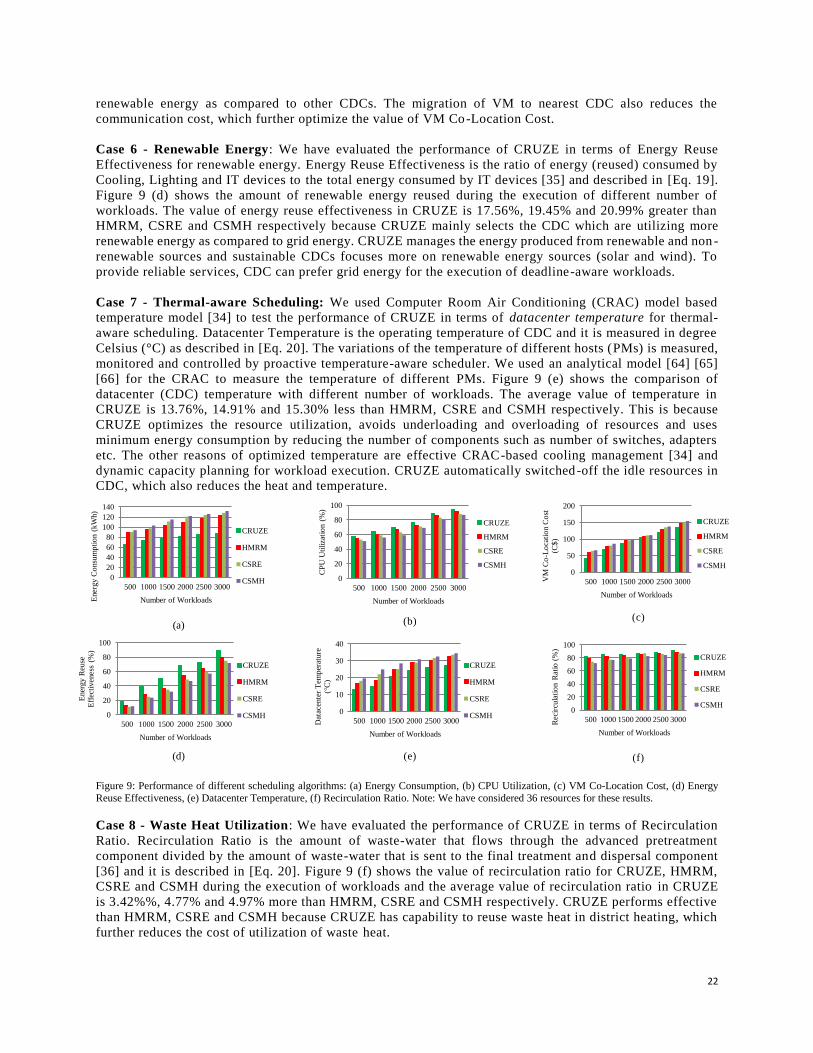
22
renewable energy as compared to other CDCs. The migration of VM to nearest CDC also reduces the
communication cost, which further optimize the value of VM Co-Location Cost.
Case 6 - Renewable Energy: We have evaluated the performance of CRUZE in terms of Energy Reuse
Effectiveness for renewable energy. Energy Reuse Effectiveness is the ratio of energy (reused) consumed by
Cooling, Lighting and IT devices to the total energy consumed by IT devices [35] and described in [Eq. 19].
Figure 9 (d) shows the amount of renewable energy reused during the execution of different number of
workloads. The value of energy reuse effectiveness in CRUZE is 17.56%, 19.45% and 20.99% greater than
HMRM, CSRE and CSMH respectively because CRUZE mainly selects the CDC which are utilizing more
renewable energy as compared to grid energy. CRUZE manages the energy produced from renewable and non -
renewable sources and sustainable CDCs focuses more on renewable energy sources (solar and wind). To
provide reliable services, CDC can prefer grid energy for the execution of deadline-aware workloads.
Case 7 - Thermal-aware Scheduling: We used Computer Room Air Conditioning (CRAC) model based
temperature model [34] to test the performance of CRUZE in terms of datacenter temperature for thermal-
aware scheduling. Datacenter Temperature is the operating temperature of CDC and it is measured in degree
Celsius (°C) as described in [Eq. 20]. The variations of the temperature of different hosts (PMs) is measured,
monitored and controlled by proactive temperature-aware scheduler. We used an analytical model [64] [65]
[66] for the CRAC to measure the temperature of different PMs. Figure 9 (e) shows the comparison of
datacenter (CDC) temperature with different number of workloads. The average value of temperature in
CRUZE is 13.76%, 14.91% and 15.30% less than HMRM, CSRE and CSMH respectively. This is because
CRUZE optimizes the resource utilization, avoids underloading and overloading of resources and uses
minimum energy consumption by reducing the number of components such as number of switches, adapters
etc. The other reasons of optimized temperature are effective CRAC-based cooling management [34] and
dynamic capacity planning for workload execution. CRUZE automatically switched-off the idle resources in
CDC, which also reduces the heat and temperature.
(a)
(b)
(c)
(d)
(e)
(f)
Figure 9: Performance of different scheduling algorithms: (a) Energy Consumption, (b) CPU Utilization, (c) VM Co-Location Cost, (d) Energy
Reuse Effectiveness, (e) Datacenter Temperature, (f) Recirculation Ratio. Note: We have considered 36 resources for these results.
Case 8 - Waste Heat Utilization: We have evaluated the performance of CRUZE in terms of Recirculation
Ratio. Recirculation Ratio is the amount of waste-water that flows through the advanced pretreatment
component divided by the amount of waste-water that is sent to the final treatment and dispersal component
[36] and it is described in [Eq. 20]. Figure 9 (f) shows the value of recirculation ratio for CRUZE, HMRM,
CSRE and CSMH during the execution of workloads and the average value of recirculation ratio in CRUZE
is 3.42%%, 4.77% and 4.97% more than HMRM, CSRE and CSMH respectively. CRUZE performs effective
than HMRM, CSRE and CSMH because CRUZE has capability to reuse waste heat in district heating, which
further reduces the cost of utilization of waste heat.
0
20
40
60
80
100
120
140
500 1000 1500 2000 2500 3000
Ener
gy C
onsu
mpti
on (
kW
h)
Number of Workloads
CRUZE
HMRM
CSRE
CSMH 0
20
40
60
80
100
500 1000 1500 2000 2500 3000
CP
U U
tiliza
tio
n (
%)
Number of Workloads
CRUZE
HMRM
CSRE
CSMH0
50
100
150
200
500 1000 1500 2000 2500 3000VM
Co
-Lo
cati
on C
ost
(C$)
Number of Workloads
CRUZE
HMRM
CSRE
CSMH
0
20
40
60
80
100
500 1000 1500 2000 2500 3000
Ener
gy R
euse
Eff
ecti
veness
(%
)
Number of Workloads
CRUZE
HMRM
CSRE
CSMH0
10
20
30
40
500 1000 1500 2000 2500 3000Dat
acen
ter
Tem
per
ature
(°C
)
Number of Workloads
CRUZE
HMRM
CSRE
CSMH0
20
40
60
80
100
500 1000 1500 2000 2500 3000Rec
ircu
lati
on R
atio
(%
)
Number of Workloads
CRUZE
HMRM
CSRE
CSMH
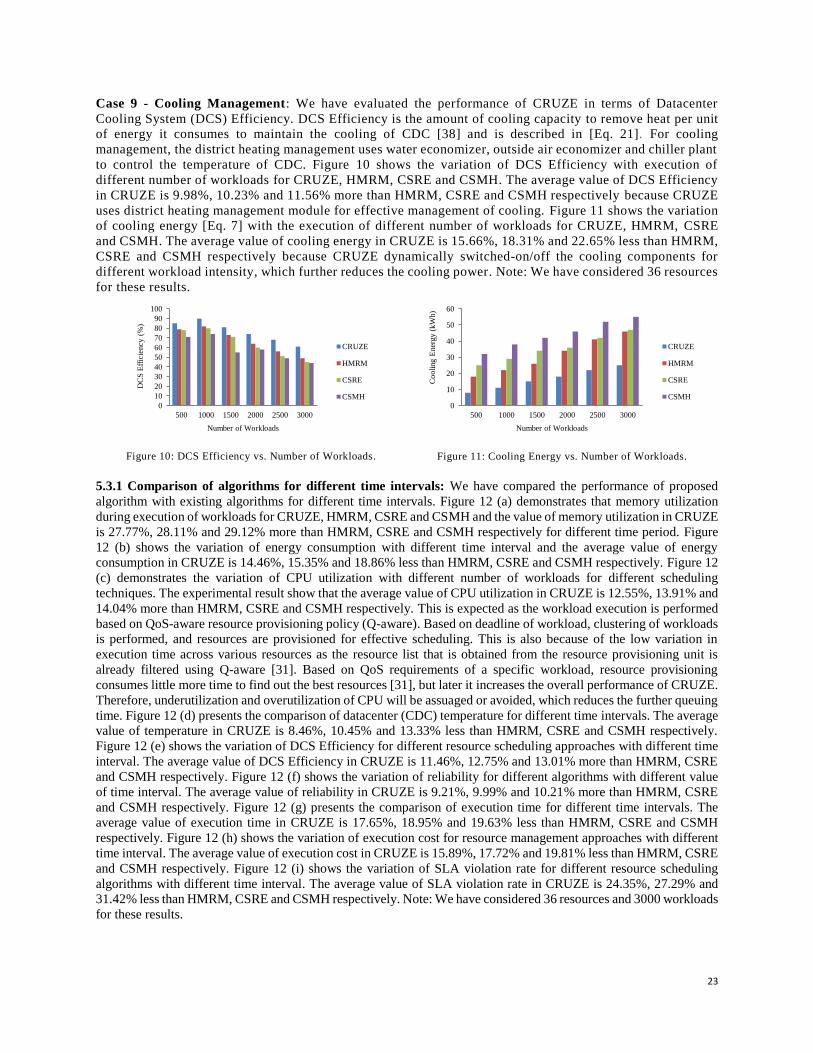
23
Case 9 - Cooling Management: We have evaluated the performance of CRUZE in terms of Datacenter
Cooling System (DCS) Efficiency. DCS Efficiency is the amount of cooling capacity to remove heat per unit
of energy it consumes to maintain the cooling of CDC [38] and is described in [Eq. 21]. For cooling
management, the district heating management uses water economizer, outside air economizer and chiller plant
to control the temperature of CDC. Figure 10 shows the variation of DCS Efficiency with execution of
different number of workloads for CRUZE, HMRM, CSRE and CSMH. The average value of DCS Efficiency
in CRUZE is 9.98%, 10.23% and 11.56% more than HMRM, CSRE and CSMH respectively because CRUZE
uses district heating management module for effective management of cooling. Figure 11 shows the variation
of cooling energy [Eq. 7] with the execution of different number of workloads for CRUZE, HMRM, CSRE
and CSMH. The average value of cooling energy in CRUZE is 15.66%, 18.31% and 22.65% less than HMRM,
CSRE and CSMH respectively because CRUZE dynamically switched-on/off the cooling components for
different workload intensity, which further reduces the cooling power. Note: We have considered 36 resources
for these results.
Figure 10: DCS Efficiency vs. Number of Workloads.
Figure 11: Cooling Energy vs. Number of Workloads.
5.3.1 Comparison of algorithms for different time intervals: We have compared the performance of proposed
algorithm with existing algorithms for different time intervals. Figure 12 (a) demonstrates that memory utilization
during execution of workloads for CRUZE, HMRM, CSRE and CSMH and the value of memory utilization in CRUZE
is 27.77%, 28.11% and 29.12% more than HMRM, CSRE and CSMH respectively for different time period. Figure
12 (b) shows the variation of energy consumption with different time interval and the average value of energy
consumption in CRUZE is 14.46%, 15.35% and 18.86% less than HMRM, CSRE and CSMH respectively. Figure 12
(c) demonstrates the variation of CPU utilization with different number of workloads for different scheduling
techniques. The experimental result show that the average value of CPU utilization in CRUZE is 12.55%, 13.91% and
14.04% more than HMRM, CSRE and CSMH respectively. This is expected as the workload execution is performed
based on QoS-aware resource provisioning policy (Q-aware). Based on deadline of workload, clustering of workloads
is performed, and resources are provisioned for effective scheduling. This is also because of the low variation in
execution time across various resources as the resource list that is obtained from the resource provisioning unit is
already filtered using Q-aware [31]. Based on QoS requirements of a specific workload, resource provisioning
consumes little more time to find out the best resources [31], but later it increases the overall performance of CRUZE.
Therefore, underutilization and overutilization of CPU will be assuaged or avoided, which reduces the further queuing
time. Figure 12 (d) presents the comparison of datacenter (CDC) temperature for different time intervals. The average
value of temperature in CRUZE is 8.46%, 10.45% and 13.33% less than HMRM, CSRE and CSMH respectively.
Figure 12 (e) shows the variation of DCS Efficiency for different resource scheduling approaches with different time
interval. The average value of DCS Efficiency in CRUZE is 11.46%, 12.75% and 13.01% more than HMRM, CSRE
and CSMH respectively. Figure 12 (f) shows the variation of reliability for different algorithms with different value
of time interval. The average value of reliability in CRUZE is 9.21%, 9.99% and 10.21% more than HMRM, CSRE
and CSMH respectively. Figure 12 (g) presents the comparison of execution time for different time intervals. The
average value of execution time in CRUZE is 17.65%, 18.95% and 19.63% less than HMRM, CSRE and CSMH
respectively. Figure 12 (h) shows the variation of execution cost for resource management approaches with different
time interval. The average value of execution cost in CRUZE is 15.89%, 17.72% and 19.81% less than HMRM, CSRE
and CSMH respectively. Figure 12 (i) shows the variation of SLA violation rate for different resource scheduling
algorithms with different time interval. The average value of SLA violation rate in CRUZE is 24.35%, 27.29% and
31.42% less than HMRM, CSRE and CSMH respectively. Note: We have considered 36 resources and 3000 workloads
for these results.
0
10
20
30
40
50
60
70
80
90
100
500 1000 1500 2000 2500 3000
DC
S E
ffic
iency (
%)
Number of Workloads
CRUZE
HMRM
CSRE
CSMH0
10
20
30
40
50
60
500 1000 1500 2000 2500 3000
Co
oling E
ner
gy (
kW
h)
Number of Workloads
CRUZE
HMRM
CSRE
CSMH
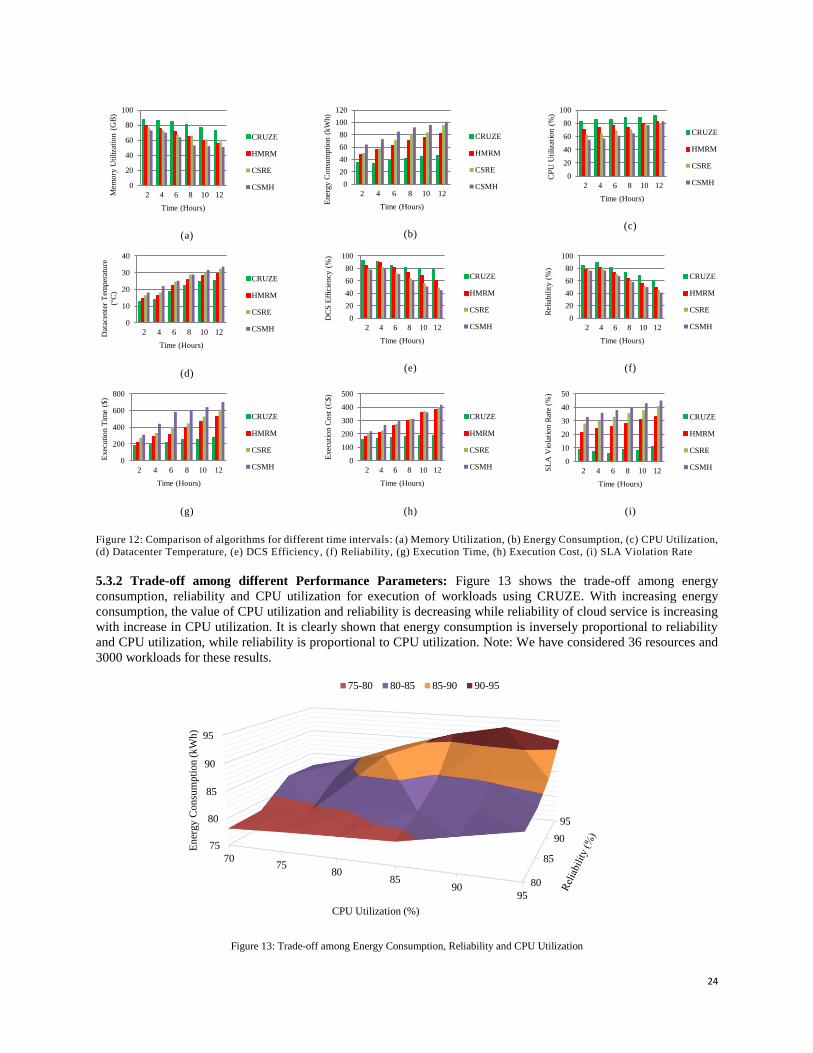
24
(a)
(b)
(c)
(d)
(e)
(f)
(g)
(h)
(i)
Figure 12: Comparison of algorithms for different time intervals: (a) Memory Utilization, (b) Energy Consumption, (c) CPU Utilization,
(d) Datacenter Temperature, (e) DCS Efficiency, (f) Reliability, (g) Execution Time, (h) Execution Cost, (i) SLA Violation Rate
5.3.2 Trade-off among different Performance Parameters: Figure 13 shows the trade-off among energy
consumption, reliability and CPU utilization for execution of workloads using CRUZE. With increasing energy
consumption, the value of CPU utilization and reliability is decreasing while reliability of cloud service is increasing
with increase in CPU utilization. It is clearly shown that energy consumption is inversely proportional to reliability
and CPU utilization, while reliability is proportional to CPU utilization. Note: We have considered 36 resources and
3000 workloads for these results.
Figure 13: Trade-off among Energy Consumption, Reliability and CPU Utilization
0
20
40
60
80
100
2 4 6 8 10 12Mem
ory
Uti
liza
tio
n (
GB
)
Time (Hours)
CRUZE
HMRM
CSRE
CSMH 0
20
40
60
80
100
120
2 4 6 8 10 12
Ener
gy C
onsu
mpti
on (
kW
h)
Time (Hours)
CRUZE
HMRM
CSRE
CSMH
0
20
40
60
80
100
2 4 6 8 10 12
CP
U U
tiliza
tio
n (
%)
Time (Hours)
CRUZE
HMRM
CSRE
CSMH
0
10
20
30
40
2 4 6 8 10 12Dat
acen
ter
Tem
per
ature
(°C
)
Time (Hours)
CRUZE
HMRM
CSRE
CSMH
0
20
40
60
80
100
2 4 6 8 10 12D
CS
Eff
icie
ncy (
%)
Time (Hours)
CRUZE
HMRM
CSRE
CSMH0
20
40
60
80
100
2 4 6 8 10 12
Rel
iabil
ity (
%)
Time (Hours)
CRUZE
HMRM
CSRE
CSMH
0
200
400
600
800
2 4 6 8 10 12
Exec
uti
on T
ime
($)
Time (Hours)
CRUZE
HMRM
CSRE
CSMH0
100
200
300
400
500
2 4 6 8 10 12
Exec
uti
on C
ost
(C
$)
Time (Hours)
CRUZE
HMRM
CSRE
CSMH0
10
20
30
40
50
2 4 6 8 10 12SL
A V
iola
tio
n R
ate
(%)
Time (Hours)
CRUZE
HMRM
CSRE
CSMH
80
85
90
95
75
80
85
90
95
7075
8085
9095
En
ergy C
on
sum
pti
on
(k
Wh
)
CPU Utilization (%)
75-80 80-85 85-90 90-95
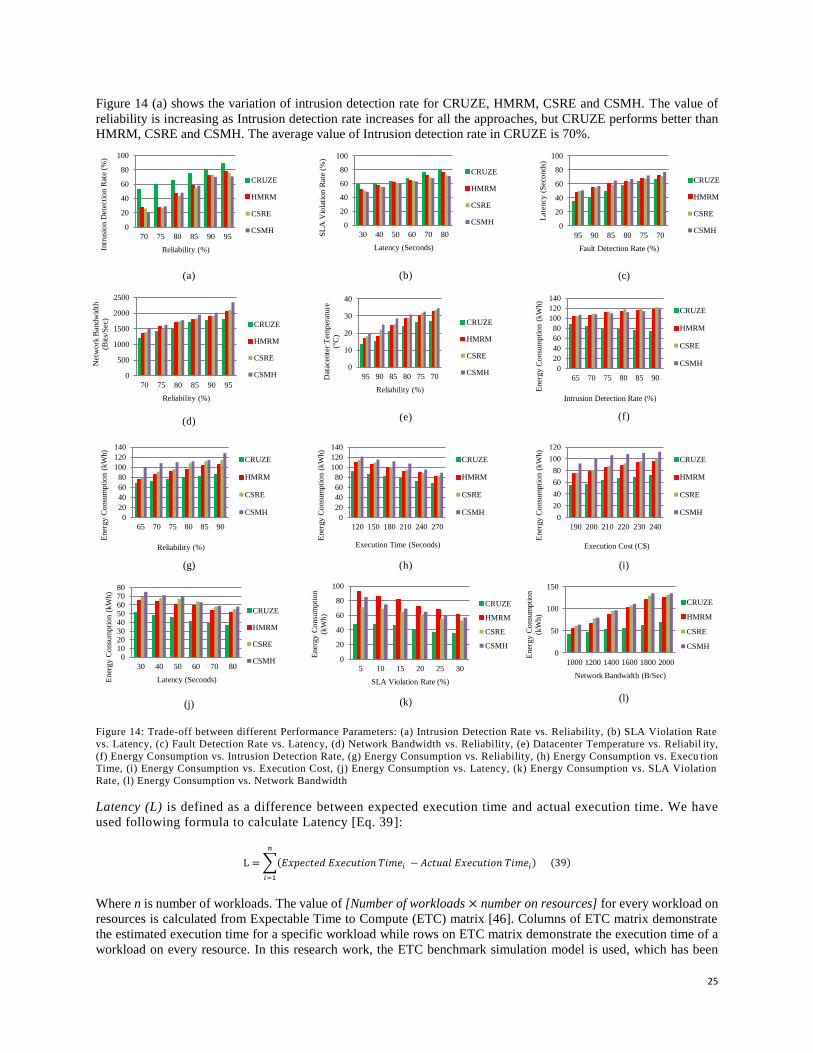
25
Figure 14 (a) shows the variation of intrusion detection rate for CRUZE, HMRM, CSRE and CSMH. The value of
reliability is increasing as Intrusion detection rate increases for all the approaches, but CRUZE performs better than
HMRM, CSRE and CSMH. The average value of Intrusion detection rate in CRUZE is 70%.
(a)
(b)
(c)
(d)
(e)
(f)
(g)
(h)
(i)
(j)
(k)
(l)
Figure 14: Trade-off between different Performance Parameters: (a) Intrusion Detection Rate vs. Reliability, (b) SLA Violation Rate
vs. Latency, (c) Fault Detection Rate vs. Latency, (d) Network Bandwidth vs. Reliability, (e) Datacenter Temperature vs. Reliabil ity,
(f) Energy Consumption vs. Intrusion Detection Rate, (g) Energy Consumption vs. Reliability, (h) Energy Consumption vs. Execu tion Time, (i) Energy Consumption vs. Execution Cost, (j) Energy Consumption vs. Latency, (k) Energy Consumption vs. SLA Violation
Rate, (l) Energy Consumption vs. Network Bandwidth
Latency (L) is defined as a difference between expected execution time and actual execution time. We have
used following formula to calculate Latency [Eq. 39]:
L = ∑(𝐸𝑥𝑝𝑒𝑐𝑡𝑒𝑑 𝐸𝑥𝑒𝑐𝑢𝑡𝑖𝑜𝑛 𝑇𝑖𝑚𝑒𝑖 − 𝐴𝑐𝑡𝑢𝑎𝑙 𝐸𝑥𝑒𝑐𝑢𝑡𝑖𝑜𝑛 𝑇𝑖𝑚𝑒𝑖) (39)
𝑛
𝑖=1
Where n is number of workloads. The value of [Number of workloads × number on resources] for every workload on
resources is calculated from Expectable Time to Compute (ETC) matrix [46]. Columns of ETC matrix demonstrate
the estimated execution time for a specific workload while rows on ETC matrix demonstrate the execution time of a
workload on every resource. In this research work, the ETC benchmark simulation model is used, which has been
0
20
40
60
80
100
70 75 80 85 90 95
Intr
usi
on D
etec
tio
n R
ate
(%)
Reliability (%)
CRUZE
HMRM
CSRE
CSMH0
20
40
60
80
100
30 40 50 60 70 80SL
A V
iola
tio
n R
ate
(%)
Latency (Seconds)
CRUZE
HMRM
CSRE
CSMH0
20
40
60
80
100
95 90 85 80 75 70
Lat
ency
(S
eco
nds)
Fault Detection Rate (%)
CRUZE
HMRM
CSRE
CSMH
0
500
1000
1500
2000
2500
70 75 80 85 90 95
Net
wo
rk B
and
wid
th
(Bit
s/S
ec)
Reliability (%)
CRUZE
HMRM
CSRE
CSMH0
10
20
30
40
95 90 85 80 75 70Dat
acen
ter
Tem
per
ature
(°C
)
Reliability (%)
CRUZE
HMRM
CSRE
CSMH0
20
40
60
80
100
120
140
65 70 75 80 85 90
Ener
gy C
onsu
mpti
on (
kW
h)
Intrusion Detection Rate (%)
CRUZE
HMRM
CSRE
CSMH
0
20
40
60
80
100
120
140
65 70 75 80 85 90
Ener
gy C
onsu
mpti
on (
kW
h)
Reliability (%)
CRUZE
HMRM
CSRE
CSMH0
20
40
60
80
100
120
140
120 150 180 210 240 270
Ener
gy C
onsu
mpti
on (
kW
h)
Execution Time (Seconds)
CRUZE
HMRM
CSRE
CSMH0
20
40
60
80
100
120
190 200 210 220 230 240
Ener
gy C
onsu
mpti
on (
kW
h)
Execution Cost (C$)
CRUZE
HMRM
CSRE
CSMH
01020304050607080
30 40 50 60 70 80
Ener
gy C
onsu
mpti
on (
kW
h)
Latency (Seconds)
CRUZE
HMRM
CSRE
CSMH 0
20
40
60
80
100
5 10 15 20 25 30
Ener
gy C
onsu
mpti
on
(kW
h)
SLA Violation Rate (%)
CRUZE
HMRM
CSRE
CSMH0
50
100
150
1000 1200 1400 1600 1800 2000
Ener
gy C
onsu
mpti
on
(kW
h)
Network Bandwidth (B/Sec)
CRUZE
HMRM
CSRE
CSMH
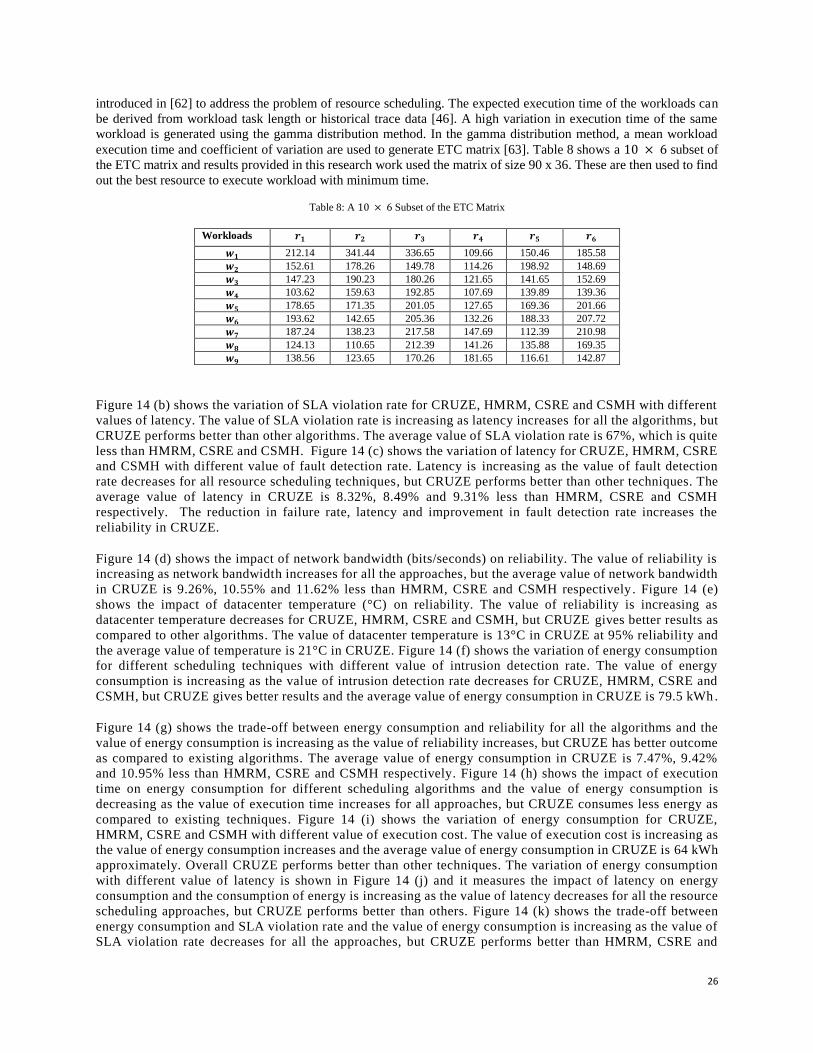
26
introduced in [62] to address the problem of resource scheduling. The expected execution time of the workloads can
be derived from workload task length or historical trace data [46]. A high variation in execution time of the same
workload is generated using the gamma distribution method. In the gamma distribution method, a mean workload
execution time and coefficient of variation are used to generate ETC matrix [63]. Table 8 shows a 10 × 6 subset of
the ETC matrix and results provided in this research work used the matrix of size 90 x 36. These are then used to find
out the best resource to execute workload with minimum time.
Table 8: A 10 × 6 Subset of the ETC Matrix
Workloads 𝒓𝟏 𝒓𝟐 𝒓𝟑 𝒓𝟒 𝒓𝟓 𝒓𝟔
𝒘𝟏 212.14 341.44 336.65 109.66 150.46 185.58
𝒘𝟐 152.61 178.26 149.78 114.26 198.92 148.69
𝒘𝟑 147.23 190.23 180.26 121.65 141.65 152.69
𝒘𝟒 103.62 159.63 192.85 107.69 139.89 139.36
𝒘𝟓 178.65 171.35 201.05 127.65 169.36 201.66
𝒘𝟔 193.62 142.65 205.36 132.26 188.33 207.72
𝒘𝟕 187.24 138.23 217.58 147.69 112.39 210.98
𝒘𝟖 124.13 110.65 212.39 141.26 135.88 169.35
𝒘𝟗 138.56 123.65 170.26 181.65 116.61 142.87
Figure 14 (b) shows the variation of SLA violation rate for CRUZE, HMRM, CSRE and CSMH with different
values of latency. The value of SLA violation rate is increasing as latency increases for all the algorithms, but
CRUZE performs better than other algorithms. The average value of SLA violation rate is 67%, which is quite
less than HMRM, CSRE and CSMH. Figure 14 (c) shows the variation of latency for CRUZE, HMRM, CSRE
and CSMH with different value of fault detection rate. Latency is increasing as the value of fault detection
rate decreases for all resource scheduling techniques, but CRUZE performs better than other techniques. The
average value of latency in CRUZE is 8.32%, 8.49% and 9.31% less than HMRM, CSRE and CSMH
respectively. The reduction in failure rate, latency and improvement in fault detection rate increases the
reliability in CRUZE.
Figure 14 (d) shows the impact of network bandwidth (bits/seconds) on reliability. The value of reliability is
increasing as network bandwidth increases for all the approaches, but the average value of network bandwidth
in CRUZE is 9.26%, 10.55% and 11.62% less than HMRM, CSRE and CSMH respectively . Figure 14 (e)
shows the impact of datacenter temperature (°C) on reliability. The value of reliability is increasing as
datacenter temperature decreases for CRUZE, HMRM, CSRE and CSMH, but CRUZE gives better results as
compared to other algorithms. The value of datacenter temperature is 13°C in CRUZE at 95% reliability and
the average value of temperature is 21°C in CRUZE. Figure 14 (f) shows the variation of energy consumption
for different scheduling techniques with different value of intrusion detection rate. The value of energy
consumption is increasing as the value of intrusion detection rate decreases for CRUZE, HMRM, CSRE and
CSMH, but CRUZE gives better results and the average value of energy consumption in CRUZE is 79.5 kWh .
Figure 14 (g) shows the trade-off between energy consumption and reliability for all the algorithms and the
value of energy consumption is increasing as the value of reliability increases, but CRUZE has better outcome
as compared to existing algorithms. The average value of energy consumption in CRUZE is 7.47%, 9.42%
and 10.95% less than HMRM, CSRE and CSMH respectively. Figure 14 (h) shows the impact of execution
time on energy consumption for different scheduling algorithms and the value of energy consumption is
decreasing as the value of execution time increases for all approaches, but CRUZE consumes less energy as
compared to existing techniques. Figure 14 (i) shows the variation of energy consumption for CRUZE,
HMRM, CSRE and CSMH with different value of execution cost. The value of execution cost is increasing as
the value of energy consumption increases and the average value of energy consumption in CRUZE is 64 kWh
approximately. Overall CRUZE performs better than other techniques. The variation of energy consumption
with different value of latency is shown in Figure 14 (j) and it measures the impact of latency on energy
consumption and the consumption of energy is increasing as the value of latency decreases for all the resource
scheduling approaches, but CRUZE performs better than others. Figure 14 (k) shows the trade-off between
energy consumption and SLA violation rate and the value of energy consumption is increasing as the value of
SLA violation rate decreases for all the approaches, but CRUZE performs better than HMRM, CSRE and
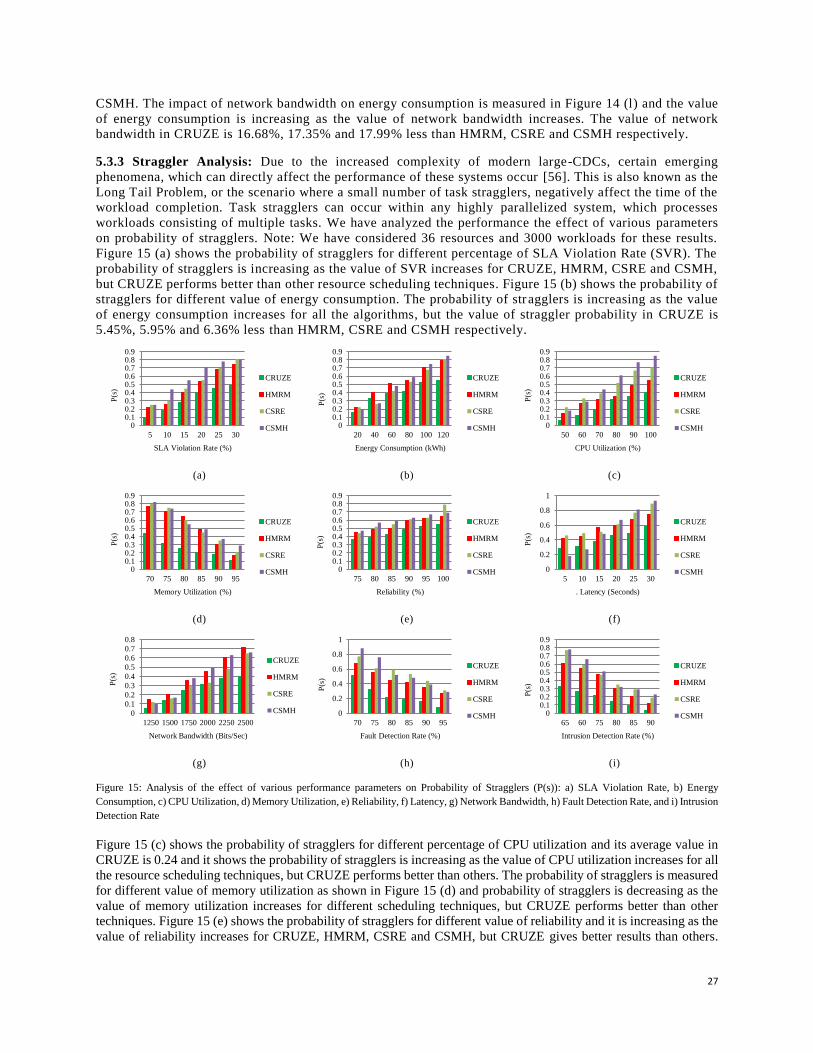
27
CSMH. The impact of network bandwidth on energy consumption is measured in Figure 14 (l) and the value
of energy consumption is increasing as the value of network bandwidth increases. The value of network
bandwidth in CRUZE is 16.68%, 17.35% and 17.99% less than HMRM, CSRE and CSMH respectively.
5.3.3 Straggler Analysis: Due to the increased complexity of modern large-CDCs, certain emerging
phenomena, which can directly affect the performance of these systems occur [56]. This is also known as the
Long Tail Problem, or the scenario where a small number of task stragglers, negatively affect the time of the
workload completion. Task stragglers can occur within any highly parallelized system, which processes
workloads consisting of multiple tasks. We have analyzed the performance the effect of various parameters
on probability of stragglers. Note: We have considered 36 resources and 3000 workloads for these results.
Figure 15 (a) shows the probability of stragglers for different percentage of SLA Violation Rate (SVR). The
probability of stragglers is increasing as the value of SVR increases for CRUZE, HMRM, CSRE and CSMH,
but CRUZE performs better than other resource scheduling techniques. Figure 15 (b) shows the probability of
stragglers for different value of energy consumption. The probability of str agglers is increasing as the value
of energy consumption increases for all the algorithms, but the value of straggler probability in CRUZE is
5.45%, 5.95% and 6.36% less than HMRM, CSRE and CSMH respectively.
(a)
(b)
(c)
(d)
(e)
(f)
(g)
(h)
(i)
Figure 15: Analysis of the effect of various performance parameters on Probability of Stragglers (P(s)): a) SLA Violation Rate, b) Energy
Consumption, c) CPU Utilization, d) Memory Utilization, e) Reliability, f) Latency, g) Network Bandwidth, h) Fault Detection Rate, and i) Intrusion
Detection Rate
Figure 15 (c) shows the probability of stragglers for different percentage of CPU utilization and its average value in
CRUZE is 0.24 and it shows the probability of stragglers is increasing as the value of CPU utilization increases for all
the resource scheduling techniques, but CRUZE performs better than others. The probability of stragglers is measured
for different value of memory utilization as shown in Figure 15 (d) and probability of stragglers is decreasing as the
value of memory utilization increases for different scheduling techniques, but CRUZE performs better than other
techniques. Figure 15 (e) shows the probability of stragglers for different value of reliability and it is increasing as the
value of reliability increases for CRUZE, HMRM, CSRE and CSMH, but CRUZE gives better results than others.
00.10.20.30.40.50.60.70.80.9
5 10 15 20 25 30
P(s
)
SLA Violation Rate (%)
CRUZE
HMRM
CSRE
CSMH 00.10.20.30.40.50.60.70.80.9
20 40 60 80 100 120
P(s
)
Energy Consumption (kWh)
CRUZE
HMRM
CSRE
CSMH 00.10.20.30.40.50.60.70.80.9
50 60 70 80 90 100
P(s
)
CPU Utilization (%)
CRUZE
HMRM
CSRE
CSMH
00.10.20.30.40.50.60.70.80.9
70 75 80 85 90 95
P(s
)
Memory Utilization (%)
CRUZE
HMRM
CSRE
CSMH 00.10.20.30.40.50.60.70.80.9
75 80 85 90 95 100
P(s
)
Reliability (%)
CRUZE
HMRM
CSRE
CSMH 0
0.2
0.4
0.6
0.8
1
5 10 15 20 25 30
P(s
)
. Latency (Seconds)
CRUZE
HMRM
CSRE
CSMH
0
0.1
0.2
0.3
0.4
0.5
0.6
0.7
0.8
1250 1500 1750 2000 2250 2500
P(s
)
Network Bandwidth (Bits/Sec)
CRUZE
HMRM
CSRE
CSMH 0
0.2
0.4
0.6
0.8
1
70 75 80 85 90 95
P(s
)
Fault Detection Rate (%)
CRUZE
HMRM
CSRE
CSMH 00.10.20.30.40.50.60.70.80.9
65 60 75 80 85 90
P(s
)
Intrusion Detection Rate (%)
CRUZE
HMRM
CSRE
CSMH
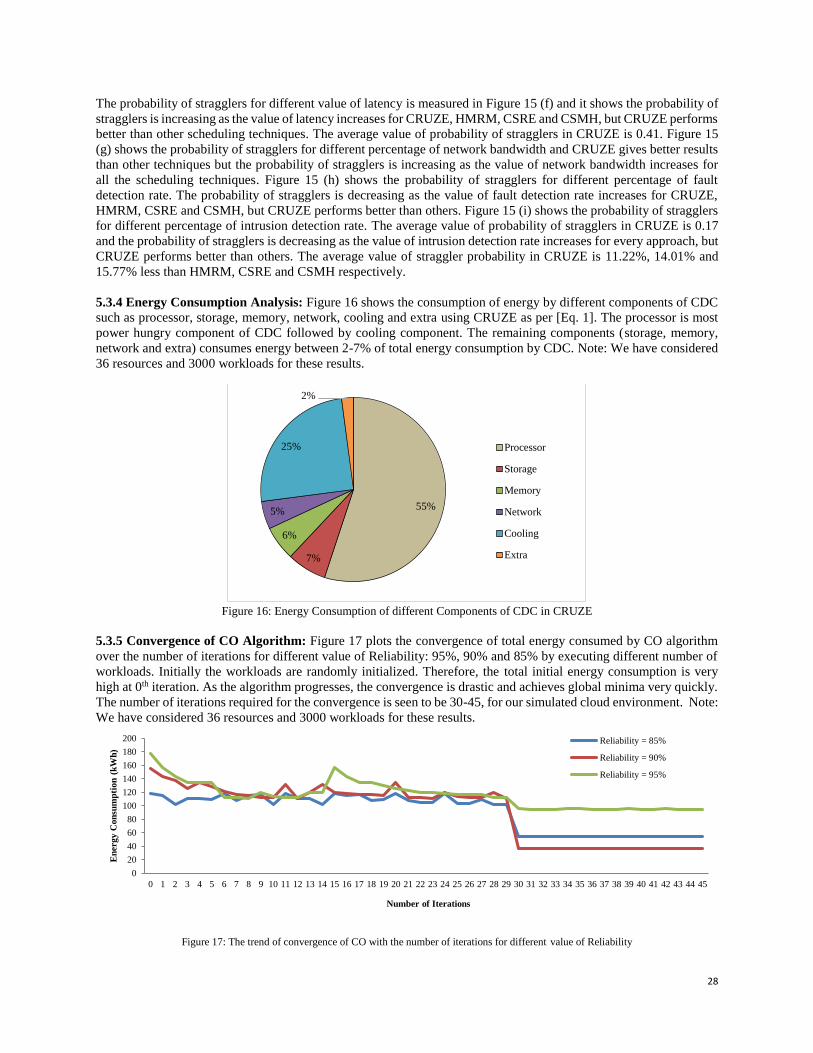
28
The probability of stragglers for different value of latency is measured in Figure 15 (f) and it shows the probability of
stragglers is increasing as the value of latency increases for CRUZE, HMRM, CSRE and CSMH, but CRUZE performs
better than other scheduling techniques. The average value of probability of stragglers in CRUZE is 0.41. Figure 15
(g) shows the probability of stragglers for different percentage of network bandwidth and CRUZE gives better results
than other techniques but the probability of stragglers is increasing as the value of network bandwidth increases for
all the scheduling techniques. Figure 15 (h) shows the probability of stragglers for different percentage of fault
detection rate. The probability of stragglers is decreasing as the value of fault detection rate increases for CRUZE,
HMRM, CSRE and CSMH, but CRUZE performs better than others. Figure 15 (i) shows the probability of stragglers
for different percentage of intrusion detection rate. The average value of probability of stragglers in CRUZE is 0.17
and the probability of stragglers is decreasing as the value of intrusion detection rate increases for every approach, but
CRUZE performs better than others. The average value of straggler probability in CRUZE is 11.22%, 14.01% and
15.77% less than HMRM, CSRE and CSMH respectively.
5.3.4 Energy Consumption Analysis: Figure 16 shows the consumption of energy by different components of CDC
such as processor, storage, memory, network, cooling and extra using CRUZE as per [Eq. 1]. The processor is most
power hungry component of CDC followed by cooling component. The remaining components (storage, memory,
network and extra) consumes energy between 2-7% of total energy consumption by CDC. Note: We have considered
36 resources and 3000 workloads for these results.
Figure 16: Energy Consumption of different Components of CDC in CRUZE
5.3.5 Convergence of CO Algorithm: Figure 17 plots the convergence of total energy consumed by CO algorithm
over the number of iterations for different value of Reliability: 95%, 90% and 85% by executing different number of
workloads. Initially the workloads are randomly initialized. Therefore, the total initial energy consumption is very
high at 0th iteration. As the algorithm progresses, the convergence is drastic and achieves global minima very quickly.
The number of iterations required for the convergence is seen to be 30-45, for our simulated cloud environment. Note:
We have considered 36 resources and 3000 workloads for these results.
Figure 17: The trend of convergence of CO with the number of iterations for different value of Reliability
55%
7%
6%
5%
25%
2%
Processor
Storage
Memory
Network
Cooling
Extra
0
20
40
60
80
100
120
140
160
180
200
0 1 2 3 4 5 6 7 8 9 10 11 12 13 14 15 16 17 18 19 20 21 22 23 24 25 26 27 28 29 30 31 32 33 34 35 36 37 38 39 40 41 42 43 44 45
En
ergy C
on
sum
pti
on
(k
Wh
)
Number of Iterations
Reliability = 85%
Reliability = 90%
Reliability = 95%
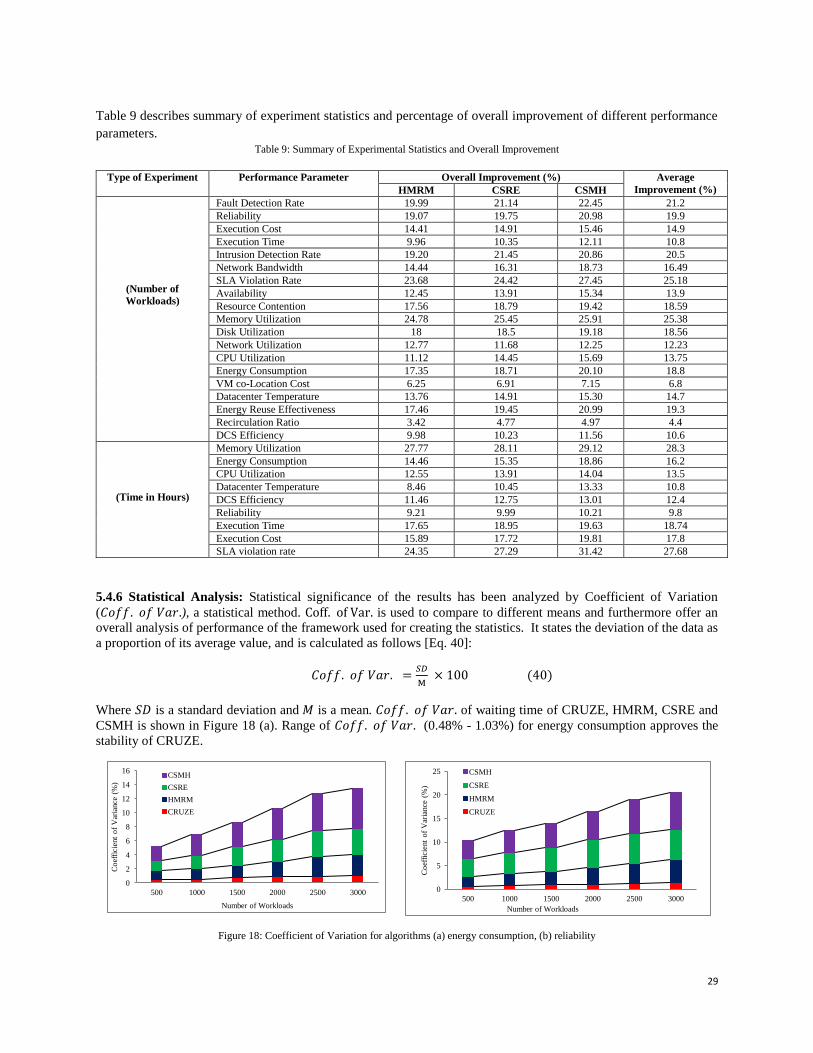
29
Table 9 describes summary of experiment statistics and percentage of overall improvement of different performance
parameters.
Table 9: Summary of Experimental Statistics and Overall Improvement
Type of Experiment Performance Parameter Overall Improvement (%) Average
Improvement (%) HMRM CSRE CSMH
(Number of
Workloads)
Fault Detection Rate 19.99 21.14 22.45 21.2
Reliability 19.07 19.75 20.98 19.9
Execution Cost 14.41 14.91 15.46 14.9
Execution Time 9.96 10.35 12.11 10.8
Intrusion Detection Rate 19.20 21.45 20.86 20.5
Network Bandwidth 14.44 16.31 18.73 16.49
SLA Violation Rate 23.68 24.42 27.45 25.18
Availability 12.45 13.91 15.34 13.9
Resource Contention 17.56 18.79 19.42 18.59
Memory Utilization 24.78 25.45 25.91 25.38
Disk Utilization 18 18.5 19.18 18.56
Network Utilization 12.77 11.68 12.25 12.23
CPU Utilization 11.12 14.45 15.69 13.75
Energy Consumption 17.35 18.71 20.10 18.8
VM co-Location Cost 6.25 6.91 7.15 6.8
Datacenter Temperature 13.76 14.91 15.30 14.7
Energy Reuse Effectiveness 17.46 19.45 20.99 19.3
Recirculation Ratio 3.42 4.77 4.97 4.4
DCS Efficiency 9.98 10.23 11.56 10.6
(Time in Hours)
Memory Utilization 27.77 28.11 29.12 28.3
Energy Consumption 14.46 15.35 18.86 16.2
CPU Utilization 12.55 13.91 14.04 13.5
Datacenter Temperature 8.46 10.45 13.33 10.8
DCS Efficiency 11.46 12.75 13.01 12.4
Reliability 9.21 9.99 10.21 9.8
Execution Time 17.65 18.95 19.63 18.74
Execution Cost 15.89 17.72 19.81 17.8
SLA violation rate 24.35 27.29 31.42 27.68
5.4.6 Statistical Analysis: Statistical significance of the results has been analyzed by Coefficient of Variation
(𝐶𝑜𝑓𝑓. 𝑜𝑓 𝑉𝑎𝑟.), a statistical method. Coff. of Var. is used to compare to different means and furthermore offer an
overall analysis of performance of the framework used for creating the statistics. It states the deviation of the data as
a proportion of its average value, and is calculated as follows [Eq. 40]:
𝐶𝑜𝑓𝑓. 𝑜𝑓 𝑉𝑎𝑟. =𝑆𝐷
M × 100 (40)
Where 𝑆𝐷 is a standard deviation and 𝑀 is a mean. 𝐶𝑜𝑓𝑓. 𝑜𝑓 𝑉𝑎𝑟. of waiting time of CRUZE, HMRM, CSRE and
CSMH is shown in Figure 18 (a). Range of 𝐶𝑜𝑓𝑓. 𝑜𝑓 𝑉𝑎𝑟. (0.48% - 1.03%) for energy consumption approves the
stability of CRUZE.
Figure 18: Coefficient of Variation for algorithms (a) energy consumption, (b) reliability
0
2
4
6
8
10
12
14
16
500 1000 1500 2000 2500 3000
Co
effi
cie
nt
of
Var
iance
(%
)
Number of Workloads
CSMH
CSRE
HMRM
CRUZE
0
5
10
15
20
25
500 1000 1500 2000 2500 3000
Co
effi
cie
nt
of
Var
iance
(%
)
Number of Workloads
CSMH
CSRE
HMRM
CRUZE
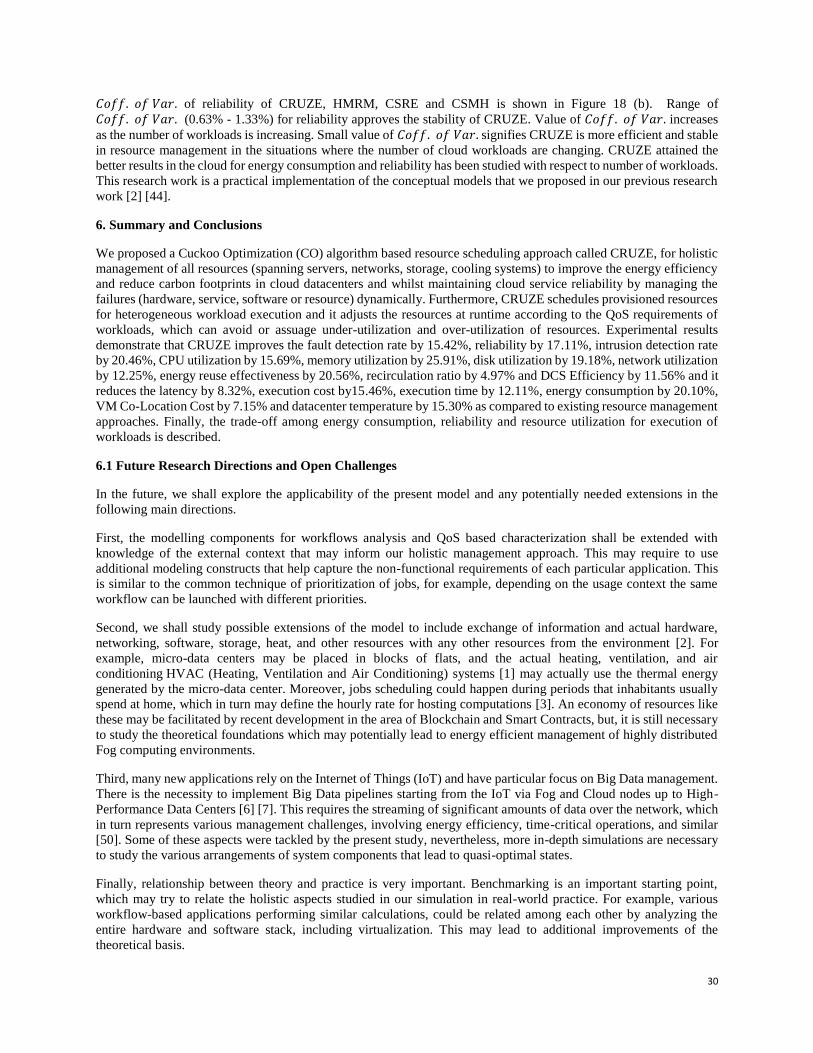
30
𝐶𝑜𝑓𝑓. 𝑜𝑓 𝑉𝑎𝑟. of reliability of CRUZE, HMRM, CSRE and CSMH is shown in Figure 18 (b). Range of
𝐶𝑜𝑓𝑓. 𝑜𝑓 𝑉𝑎𝑟. (0.63% - 1.33%) for reliability approves the stability of CRUZE. Value of 𝐶𝑜𝑓𝑓. 𝑜𝑓 𝑉𝑎𝑟. increases
as the number of workloads is increasing. Small value of 𝐶𝑜𝑓𝑓. 𝑜𝑓 𝑉𝑎𝑟. signifies CRUZE is more efficient and stable
in resource management in the situations where the number of cloud workloads are changing. CRUZE attained the
better results in the cloud for energy consumption and reliability has been studied with respect to number of workloads.
This research work is a practical implementation of the conceptual models that we proposed in our previous research
work [2] [44].
6. Summary and Conclusions
We proposed a Cuckoo Optimization (CO) algorithm based resource scheduling approach called CRUZE, for holistic
management of all resources (spanning servers, networks, storage, cooling systems) to improve the energy efficiency
and reduce carbon footprints in cloud datacenters and whilst maintaining cloud service reliability by managing the
failures (hardware, service, software or resource) dynamically. Furthermore, CRUZE schedules provisioned resources
for heterogeneous workload execution and it adjusts the resources at runtime according to the QoS requirements of
workloads, which can avoid or assuage under-utilization and over-utilization of resources. Experimental results
demonstrate that CRUZE improves the fault detection rate by 15.42%, reliability by 17.11%, intrusion detection rate
by 20.46%, CPU utilization by 15.69%, memory utilization by 25.91%, disk utilization by 19.18%, network utilization
by 12.25%, energy reuse effectiveness by 20.56%, recirculation ratio by 4.97% and DCS Efficiency by 11.56% and it
reduces the latency by 8.32%, execution cost by15.46%, execution time by 12.11%, energy consumption by 20.10%,
VM Co-Location Cost by 7.15% and datacenter temperature by 15.30% as compared to existing resource management
approaches. Finally, the trade-off among energy consumption, reliability and resource utilization for execution of
workloads is described.
6.1 Future Research Directions and Open Challenges
In the future, we shall explore the applicability of the present model and any potentially needed extensions in the
following main directions.
First, the modelling components for workflows analysis and QoS based characterization shall be extended with
knowledge of the external context that may inform our holistic management approach. This may require to use
additional modeling constructs that help capture the non-functional requirements of each particular application. This
is similar to the common technique of prioritization of jobs, for example, depending on the usage context the same
workflow can be launched with different priorities.
Second, we shall study possible extensions of the model to include exchange of information and actual hardware,
networking, software, storage, heat, and other resources with any other resources from the environment [2]. For
example, micro-data centers may be placed in blocks of flats, and the actual heating, ventilation, and air
conditioning HVAC (Heating, Ventilation and Air Conditioning) systems [1] may actually use the thermal energy
generated by the micro-data center. Moreover, jobs scheduling could happen during periods that inhabitants usually
spend at home, which in turn may define the hourly rate for hosting computations [3]. An economy of resources like
these may be facilitated by recent development in the area of Blockchain and Smart Contracts, but, it is still necessary
to study the theoretical foundations which may potentially lead to energy efficient management of highly distributed
Fog computing environments.
Third, many new applications rely on the Internet of Things (IoT) and have particular focus on Big Data management.
There is the necessity to implement Big Data pipelines starting from the IoT via Fog and Cloud nodes up to High-
Performance Data Centers [6] [7]. This requires the streaming of significant amounts of data over the network, which
in turn represents various management challenges, involving energy efficiency, time-critical operations, and similar
[50]. Some of these aspects were tackled by the present study, nevertheless, more in-depth simulations are necessary
to study the various arrangements of system components that lead to quasi-optimal states.
Finally, relationship between theory and practice is very important. Benchmarking is an important starting point,
which may try to relate the holistic aspects studied in our simulation in real-world practice. For example, various
workflow-based applications performing similar calculations, could be related among each other by analyzing the
entire hardware and software stack, including virtualization. This may lead to additional improvements of the
theoretical basis.
31
Acknowledgements
This research work is supported by the Engineering and Physical Sciences Research Council (EPSRC) - (EP/P031617/1),
Melbourne-Chindia Cloud Computing (MC3) Research Network and Australian Research Council (DP160102414). We would like
to thank the editor, area editor and anonymous reviewers for their valuable comments and suggestions to help and improve our
research paper. We would like to thank Dr. Yogesh Simmhan (IISc Bangalore, India), Dr. Adel Nadjaran Toosi (Monash University,
Australia), Mr. Shreshth Tuli (IIT Delhi, India), Mr. Amanpreet Singh (Thapar Institute of Engineering and Technology, India),
Mr. Manmeet Singh (Scientist at Indian Institute of Tropical Meteorology, India) and Mr. Damian Borowiec (Lancaster University,
UK) for their valuable comments, useful suggestions and discussion to improve the quality of the paper.
References
[1] Rajkumar Buyya and Sukhpal Singh Gill. "Sustainable Cloud Computing: Foundations and Future Directions." Business Technology &
Digital Transformation Strategies, Cutter Consortium, Vol. 21, no. 6, Pages 1-10, 2018. [2] Sukhpal Singh Gill and Rajkumar Buyya. "A Taxonomy and Future Directions for Sustainable Cloud Computing: 360 Degree View, ACM
Computing Surveys, Vol 51, No. 5, Article No. 104, Pages: 1-33, 2019
[3] Toni Mastelic, Ariel Oleksiak, Holger Claussen, Ivona Brandic, Jean-Marc Pierson, and Athanasios V. Vasilakos. "Cloud computing: Survey on energy efficiency." ACM Computing Surveys, vol. 47, no. 2 (2015): 33.
[4] Junaid Shuja, Abdullah Gani, Shahaboddin Shamshirband, Raja Wasim Ahmad, and Kashif Bilal. "Sustainable cloud datacenters: a survey of
enabling techniques and technologies." Renewable and Sustainable Energy Reviews 62 (2016): 195-214. [5] Yogesh Sharma, Bahman Javadi, Weisheng Si, and Daniel Sun. “Reliability and energy efficiency in cloud computing systems: Survey and
taxonomy.” Journal of Network and Computer Applications, vol. 74, pp. 66-85, 2016.
[6] Li, Xiang, Xiaohong Jiang, Peter Garraghan, and Zhaohui Wu. "Holistic energy and failure aware workload scheduling in Cloud datacenters." Future Generation Computer Systems 78 (2018): 887-900.
[7] Balis, Bartosz, Robert Brzoza-Woch, Marian Bubak, Marek Kasztelnik, Bartosz Kwolek, Piotr Nawrocki, Piotr Nowakowski, Tomasz Szydlo,
and Krzysztof Zielinski. "Holistic approach to management of IT infrastructure for environmental monitoring and decision support systems with urgent computing capabilities." Future Generation Computer Systems 79 (2018): 128-143.
[8] Li, Xiang, Peter Garraghan, Xiaohong Jiang, Zhaohui Wu, and Jie Xu. "Holistic virtual machine scheduling in cloud datacenters towards
minimizing total energy." IEEE Transactions on Parallel and Distributed Systems (2017). [9] Natu, Maitreya, Ratan K. Ghosh, Rudrapatna K. Shyamsundar, and Rajiv Ranjan. "Holistic performance monitoring of hybrid clouds:
Complexities and future directions." IEEE Cloud Computing 3, no. 1 (2016): 72-81.
[10] Pérez, Juan F., Lydia Y. Chen, Massimo Villari, and Rajiv Ranjan. "Holistic Workload Scaling: A New Approach to Compute Acceleration in the Cloud." IEEE Cloud Computing 5, no. 1 (2018): 20-30.
[11] Luo, Changqing, Laurence T. Yang, Pan Li, Xia Xie, and Han-Chieh Chao. "A holistic energy optimization framework for cloud-assisted
mobile computing." IEEE Wireless Communications 22, no. 3 (2015): 118-123. [12] Liu, Bingwei, Yu Chen, Erik Blasch, Khanh Pham, Dan Shen, and Genshe Chen. "A holistic cloud-enabled robotics system for real-time
video tracking application." In Future Information Technology, pp. 455-468. Springer, Berlin, Heidelberg, 2014.
[13] Guzek, Mateusz, Dzmitry Kliazovich, and Pascal Bouvry. "A holistic model for resource representation in virtualized cloud computing data
centers." In Cloud Computing Technology and Science (CloudCom), 2013 IEEE 5th International Conference on, vol. 1, pp. 590-598. IEEE,
2013. [14] Ferrer, Ana Juan, Francisco HernáNdez, Johan Tordsson, Erik Elmroth, Ahmed Ali-Eldin, Csilla Zsigri, RaüL Sirvent et al. "OPTIMIS: A
holistic approach to cloud service provisioning." Future Generation Computer Systems 28, no. 1 (2012): 66-77.
[15] Feller, Eugen, Cyril Rohr, David Margery, and Christine Morin. "Energy management in IaaS clouds: a holistic approach." In Cloud Computing (CLOUD), 2012 IEEE 5th International Conference on, pp. 204-212. IEEE, 2012.
[16] Ao Zhou, Shangguang Wang, Zibin Zheng, Ching-Hsien Hsu, Michael R. Lyu and Fangchun Yang. "On cloud service reliability enhancement
with optimal resource usage." IEEE Transactions on Cloud Computing 4, no. 4, 452-466, 2016. [17] Mingqiang Li, Chuan Qin, Jingwei Li and Patrick PC Lee. "CDStore: Toward reliable, secure, and cost-efficient cloud storage via convergent
dispersal." IEEE Internet Computing 20, no. 3, 45-53, 2016.
[18] Fatemeh Azimzadeh and Fatemeh Biabani. "Multi-objective job scheduling algorithm in cloud computing based on reliability and time." In Web Research (ICWR), 2017 3th International Conference on, pp. 96-101. IEEE, 2017.
[19] Deepak Poola, Kotagiri Ramamohanarao, and Rajkumar Buyya, Enhancing Reliability of Workflow Execution Using Task Replication and
Spot Instances, ACM Transactions on Autonomous and Adaptive Systems (TAAS), Volume 10, Number 4, Article No. 30, Pages: 1-21, ISSN:1556-4665, ACM Press, New York, USA, February 2016.
[20] Chenhao Qu, Rodrigo N. Calheiros and Rajkumar Buyya, A Reliable and Cost-Efficient Auto-Scaling System for Web Applications Using
Heterogeneous Spot Instances, Journal of Network and Computer Applications (JNCA), Volume 65, Pages: 167-180, ISSN: 1084-8045, Elsevier, Amsterdam, The Netherlands, April 2016.
[21] Xunyun Liu, Aaron Harwood, Shanika Karunasekera, Benjamin Rubinstein and Rajkumar Buyya, E-Storm: Replication-based State
Management in Distributed Stream Processing Systems, Proceedings of the 46th International Conference on Parallel Processing (ICPP 2017, IEEE CS Press, USA), Bristol, UK, August 14-17, 2017.
[22] Latiff, Muhammad Shafie Abd, Syed Hamid Hussain Madni, and Mohammed Abdullahi. "Fault tolerance aware scheduling technique for
cloud computing environment using dynamic clustering algorithm." Neural Computing and Applications 29, no. 1 (2018): 279-293. [23] S. Shahdi-Pashaki, Ehsan Teymourian, Vahid Kayvanfar, GH M. Komaki and A. Sajadi. "Group technology-based model and cuckoo
optimization algorithm for resource allocation in cloud computing." IFAC-PapersOnLine 48, no. 3 (2015): 1140-1145.
[24] R. Sundarrajan, and V. Vasudevan. "An Optimization Algorithm for Task Scheduling in Cloud Computing Based on Multi-Purpose Cuckoo Seek Algorithm." In International Conference on Theoretical Computer Science and Discrete Mathematics, pp. 415-424. Springer, Cham,
2016.
[25] Mohammad Javad Abbasi and Mehrdad Mohri "Scheduling Tasks in the Cloud Computing Environment with the Effect of Cuckoo Optimization Algorithm", SSRG International Journal of Computer Science and Engineering (SSRG - IJCSE), V3 (8), 1-9 August 2016
32
[26] Nima Jafari Navimipour and Farnaz Sharifi Milani. "Task scheduling in the cloud computing based on the cuckoo search algorithm."
International Journal of Modeling and Optimization 5, no. 1 (2015): 44.
[27] Syed Hamid Hussain Madni, Muhammad Shafie Abd Latiff and Shafi Muhammad Abdulhamid. "Optimal Resource Scheduling for IaaS
Cloud Computing using Cuckoo Search Algorithm." Sains Humanika 9, no. 1-3 (2017).
[28] Ramin Rajabioun, “Cuckoo optimization algorithm”, Applied Soft Computing 11(8) (2011): 5508-5518.
[29] Xin-She Yang. "Swarm intelligence based algorithms: a critical analysis." Evolutionary intelligence 7, no. 1 (2014): 17-28.
[30] Rodrigo N. Calheiros, Rajiv Ranjan, Anton Beloglazov, César AF De Rose and Rajkumar Buyya. "CloudSim: a toolkit for modeling and
simulation of cloud computing environments and evaluation of resource provisioning algorithms." Software: Practice and experience 41, no. 1 (2011): 23-50.
[31] Singh, Sukhpal, and Inderveer Chana. "Q-aware: Quality of service based cloud resource provisioning." Computers & Electrical Engineering
47 (2015): 138-160. [32] Gill, Sukhpal Singh, Inderveer Chana, and Rajkumar Buyya. "IoT Based Agriculture as a Cloud and Big Data Service: The Beginning of
Digital India." Journal of Organizational and End User Computing (JOEUC) 29, no. 4 (2017): 1-23.
[33] Kouki, Yousri, and Thomas Ledoux. "Sla-driven capacity planning for cloud applications." In Cloud Computing Technology and Science (CloudCom), 2012 IEEE 4th International Conference on, pp. 135-140. IEEE, 2012.
[34] Moore, Justin D., Jeffrey S. Chase, Parthasarathy Ranganathan, and Ratnesh K. Sharma. "Making Scheduling" Cool": Temperature-Aware
Workload Placement in Data Centers." In USENIX annual technical conference, General Track, pp. 61-75. 2005.
[35] Tschudi, B. I. L. L., O. T. T. O. Vangeet, J. Cooley, and D. Azevedo. "ERE: A metric for measuring the benefit of reuse energy from a data
center." White Paper 29 (2010).
[36] Karellas, Sotirios, and Konstantinos Braimakis. "Energy–exergy analysis and economic investigation of a cogeneration and trigeneration
ORC–VCC hybrid system utilizing biomass fuel and solar power." Energy conversion and management 107 (2016): 103-113.
[37] Gill, Sukhpal Singh, Inderveer Chana, Maninder Singh, and Rajkumar Buyya. "CHOPPER: an intelligent QoS-aware autonomic resource
management approach for cloud computing." Cluster Computing (2017): 1-39. [38] Liu, Zhenhua, Yuan Chen, Cullen Bash, Adam Wierman, Daniel Gmach, Zhikui Wang, Manish Marwah, and Chris Hyser. "Renewable and
cooling aware workload management for sustainable data centers." In ACM SIGMETRICS Performance Evaluation Review, vol. 40, no. 1,
pp. 175-186. ACM, 2012. [39] Gill, Sukhpal Singh, and Rajkumar Buyya. "Resource Provisioning Based Scheduling Framework for Execution of Heterogeneous and
Clustered Workloads in Clouds: from Fundamental to Autonomic Offering." Journal of Grid Computing (2018): 1-33.
[40] Oxley, Mark A., Eric Jonardi, Sudeep Pasricha, Anthony A. Maciejewski, Howard Jay Siegel, Patrick J. Burns, and Gregory A. Koenig. "Rate-based thermal, power, and co-location aware resource management for heterogeneous data centers." Journal of Parallel and Distributed
Computing 112 (2018): 126-139.
[41] L.A. Barroso, J.Clidaras, U. Hoelze, The Datacenter as a Computer: An Introduction to the Design of Warehouse-Scale Machines, Synthesis Lectures on Computer Architecture, July 2013.
[42] P.Garraghan. I. Solis Moreno, P. Townend, J. Xu, An Analysis of Failure-related Energy Waste in a Large-scale Cloud Environment, IEEE
Transactions on Emerging Topics in Computing, pp. 166-180, 2014. [43] Li, Xiang, Xiaohong Jiang, and Yanzhang He. "Virtual Machine Scheduling Considering Both Computing and Cooling Energy." In High
Performance Computing and Communications, 2014 IEEE 6th Intl Symp on Cyberspace Safety and Security, 2014 IEEE 11th Intl Conf on
Embedded Software and Syst (HPCC, CSS, ICESS), 2014 IEEE Intl Conf on, pp. 244-247. IEEE, 2014. [44] Sukhpal Singh Gill and Rajkumar Buyya, "Failure Management for Reliable Cloud Computing: A Taxonomy, Model and Future Directions",
Computing in Science and Engineering, IEEE, 2018. DOI: 10.1109/MCSE.2018.2873866
[45] Nita, Mihaela-Catalina, Florin Pop, Mariana Mocanu, and Valentin Cristea. "FIM-SIM: Fault injection module for CloudSim based on statistical distributions."Journal of telecommunications and information technology 4 (2014): 14.
[46] Sukhpal Singh Gill, Inderveer Chana, Maninder Singh and Rajkumar Buyya, RADAR: Self-Configuring and Self-Healing in Resource
Management for Enhancing Quality of Cloud Services, Concurrency and Computation: Practice and Experience (CCPE), Volume 31, No. 1, Pages: 1-29, 2019
[47] Gill, Sukhpal Singh, and Rajkumar Buyya. "SECURE: Self-Protection Approach in Cloud Resource Management." IEEE Cloud Computing
5, no. 1 (2018): 60-72. [48] Singh, Sukhpal, and Inderveer Chana. "QRSF: QoS-aware resource scheduling framework in cloud computing." The Journal of
Supercomputing 71, no. 1 (2015): 241-292.
[49] Moreno, Ismael Solis, Peter Garraghan, Paul Townend, and Jie Xu. "Analysis, modeling and simulation of workload patterns in a large-scale utility cloud." IEEE Transactions on Cloud Computing 2, no. 2 (2014): 208-221.
[50] Kaur, Amanpreet, V. P. Singh, and Sukhpal Singh Gill. "The Future of Cloud Computing: Opportunities, Challenges and Research Trends."
In 2nd International Conference on I-SMAC (IoT in Social, Mobile, Analytics and Cloud), pp. 213-219. IEEE, 2018.
[51] Deb, Kalyanmoy. "Constrained Multi-objective Evolutionary Algorithm." In Evolutionary and Swarm Intelligence Algorithms, pp. 85-118.
Springer, Cham, 2019. [52] Guitart, Jordi. "Toward sustainable data centers: a comprehensive energy management strategy." Computing 99, no. 6 (2017): 597-615.
[53] Singh, Sukhpal, and Inderveer Chana. "A survey on resource scheduling in cloud computing: Issues and challenges." Journal of grid
computing 14, no. 2 (2016): 217-264.
[54] Youn, Chan-Hyun, Min Chen, and Patrizio Dazzi. Cloud Broker and Cloudlet for Workflow Scheduling. Springer Singapore, 2017.
[55] Gill, Sukhpal Singh, Peter Garraghan, and Rajkumar Buyya. "ROUTER: Fog Enabled Cloud based Intelligent Resource Management
Approach for Smart Home IoT Devices."" Journal of Parallel and Distributed Computing 154 (2019): 125-138.
[56] Garraghan, Peter, Xue Ouyang, Renyu Yang, David McKee, and Jie Xu. "Straggler root-cause and impact analysis for massive-scale
virtualized cloud datacenters." IEEE Transactions on Services Computing (2016).
[57] Chang, Che-Wei, Chun-Yi Liu, and Chuan-Yue Yang. "Energy-efficient heterogeneous resource management for wireless monitoring systems." Journal of Systems and Software 131 (2017): 168-180.
[58] Taherizadeh, Salman, Andrew C. Jones, Ian Taylor, Zhiming Zhao, and Vlado Stankovski. "Monitoring self-adaptive applications within edge
computing frameworks: A state-of-the-art review." Journal of Systems and Software 136 (2018): 19-38.
[59] Singh, Sukhpal, and Inderveer Chana. "Consistency verification and quality assurance (CVQA) traceability framework for SaaS." In 2013
3rd IEEE International Advance Computing Conference (IACC), pp. 1-6. IEEE, 2013..
33
[60] D. Sitaram, H. L. Phalachandra, G. S, S. H V and S. TP, "Energy efficient data center management under availability constraints," 2015
Annual IEEE Systems Conference (SysCon) Proceedings, Vancouver, BC, 2015, pp. 377-381.
[61] L. Luo, H. Li, X. Qiu and Y. Tang, "A Resource Optimization Algorithm of Cloud Data Center Based on Correlated Model of Reliability,
Performance and Energy," 2016 IEEE International Conference on Software Quality, Reliability and Security Companion (QRS-C), Vienna, 2016, pp. 416-417.
[62] Tracy D. Braun, Howard Jay Siegel, Noah Beck, Ladislau L. Bölöni, Muthucumaru Maheswaran, Albert I. Reuther, James P. Robertson et
al. "A comparison of eleven static heuristics for mapping a class of independent tasks onto heterogeneous distributed computing systems." Journal of Parallel and Distributed computing 61, no. 6 (2001): 810-837.
[63] Shoukat Ali, Howard Jay Siegel, Muthucumaru Maheswaran, Debra Hensgen and Sahra Ali. "Representing task and machine heterogeneities
for heterogeneous computing systems." Tamkang J Sci Eng, 3, no. 3 (2000): 195-207. [64] Zhang S, Chatha K S. Approximation Algorithm for the Temperature Aware Scheduling Problem. Proceedings of International Conference
on Computer-Aided Design. 2007:281–288.
[65] Tang Qinghui, Gupta Sandeep Kumar S, Varsamopoulos Georgios. Energy-efficient thermal-aware task scheduling for homogeneous highperformance computing data centers: A cyber-physical approach. IEEE Transactions on Parallel and Distributed Systems.
2008;19(11):1458–1472
[66] Lazic, Nevena, Craig Boutilier, Tyler Lu, Eehern Wong, Binz Roy, M. K. Ryu, and Greg Imwalle. "Data center cooling using model-predictive control." In Advances in Neural Information Processing Systems, pp. 3814-3823. 2018.
[67] Singh, Sukhpal, and Inderveer Chana. "EARTH: Energy-aware autonomic resource scheduling in cloud computing." Journal of Intelligent &
Fuzzy Systems 30, no. 3 (2016): 1581-1600. [68] Möbius, Christoph, Waltenegus Dargie, and Alexander Schill. "Power consumption estimation models for processors, virtual machines, and
servers." IEEE Transactions on Parallel and Distributed Systems 25, no. 6 (2014): 1600-1614.
[69] Grozev, Nikolay, and Rajkumar Buyya. "Performance modelling and simulation of three-tier applications in cloud and multi-cloud environments." The Computer Journal 58, no. 1 (2013): 1-22.
[70] Lebre, Adrien, Arnaud Legrand, Frédéric Suter, and Pierre Veyre. "Adding storage simulation capacities to the simgrid toolkit: Concepts,
models, and api." In 2015 15th IEEE/ACM International Symposium on Cluster, Cloud and Grid Computing, pp. 251-260. IEEE, 2015.
Author’s Biography
Dr. Sukhpal Singh Gill is currently working as a Research Associate at School of Computing and Communications, Lancaster University,
UK. Dr. Gill was a Postdoctoral Research Fellow at Cloud Computing and Distributed Systems (CLOUDS) Laboratory, School of Computing and Information Systems, The University of Melbourne, Australia. He was a recipient of several awards, including the
Distinguished Reviewer Award from Software: Practice and Experience (Wiley), 2018, and served as the PC member for venues such as
UCC, SE-CLOUD, ICCCN, ICDICT and SCES. His one review paper has been nominated and selected for the ACM 21st annual Best of Computing Notable Books and Articles as one of the notable items published in computing - 2016. He has published more than 45 papers
as a first author. Dr. Gill also worked in Computer Science and Engineering Department of Thapar Institute of Engineering and Technology
(TIET), Patiala, India, as a Lecturer. He obtained the Degree of Master of Engineering in Software Engineering (Gold Medalist), as well as a Doctoral Degree specialization in Autonomic Cloud Computing from TIET. He was a DST (Department of Science & Technology)
Inspire Fellow during Doctorate and worked as a SRF-Professional on DST Project, Government of India. His research interests include
Cloud Computing, Software Engineering, Internet of Things, Big Data and Fog Computing. For further information on Dr. Gill, please visit: www.ssgill.in
Dr. Peter Garraghan is a Lecturer (Assistant Professor) in the School of Computing & Communications, Lancaster University. He received his PhD in Computer Science from the University of Leeds, UK. He has industrial experience building large-scale systems and
his research interests include distributed systems, Cloud datacenters, dependability, and energy-efficient computing, where he has
published over 35+ refereed papers.
Dr. Vlado Stankovski a Professor (at College) in Computer and Information Science and Informatics in Commerce at University of Ljubljana. Vlado Stankovski was awarded his Eng.Comp.Sc., M.Sc. and Ph.D. degrees in computer science from the University of
Ljubljana in 1995, 2000 and 2009, respectively. He began his career in 1995 as consultant and later as project manager with the Fujitsu-
ICL Corporation in Prague. From 1998-2002 he worked as researcher at the University Medical Centre in Ljubljana. From 2003 on, he is with the Department of Construction Informatics at the University of Ljubljana. He lectures in undergraduate computer science subjects.
Vlado Stankovski’s research interests are in semantic and distributed-computing technologis. He has been the technical manager of the
FP6 DataMiningGrid project and financial manager of the FP6 InteliGrid project. He also participates in Slovene national grid-related projects, such as: GridForum.si, AgentGrid and SiGNet. His past experience is in applications of machine learning techniques to
engineering and medical problems.

34
Dr. Giuliano Casale received the Ph.D. degree in computer engineering from Politecnico di Milano, Italy, in 2006. He joined the
Department of Computing, Imperial College London, U.K., in 2010, where he is currently a Senior Lecturer in modeling and simulation.
He was a Scientist with SAP Research, U.K. and as a Consultant in the capacity planning industry. He teaches and does research in
performance engineering, cloud computing, and Big data, topics on which he has published over 120 refereed papers. He has served on the technical program committee of over 80 conferences and workshops and as the co-chair for conferences in the area of performance
engineering such as ACM SIGMETRICS/Performance. He is a member of the IFIP WG 7.3 group on Computer Performance Analysis
and since 2015 he has been serving in the ACM SIGMETRICS Board of Directors. He was a recipient of several awards, including the Best Paper Award at ACM SIGMETRICS 2017, and served as the Program Chair for venues such as ACM SIGMETRICS/Performance,
MASCOTS, ICAC, ICPE, and QEST.
Dr. Ruppa K. Thulasiram (Tulsi) (M’00–SM’09) received the Ph.D. degree from the Indian Institute of Science, Bangalore, India. He is a Professor and the Director of the Computational Finance Laboratory, Department of Computer Science, University of Manitoba,
Winnipeg, MB, Canada. He spent years with Concordia University, Montreal, QC, Canada; Georgia Institute of Technology, Atlanta, GA,
USA; and the University of Delaware, Newark, DE, USA, as a Postdoctoral Researcher, Research Staff, and Research Faculty before taking up a position with the University of Manitoba. He has graduated many students with M.Sc. and Ph.D. degrees. He has developed a
curriculum for the cross-disciplinary computational finance course at the University of Manitoba for both graduate and senior
undergraduate levels. He has authored or co-authored many papers in the areas of high-temperature physics, gas dynamics, combustion, computational finance, and grid/cloud computing. His current research interest includes grid/cloud computing, computational finance,
cloud resources management, computational intelligence, ad hoc networks, and scientific computing. His research has been funded by the
Natural Sciences and Engineering Research Council (NSERC) of Canada.Dr. Thulasiram has been an Associate Editor for the IEEE Transactions on Cloud Computing, and International Journal of Aerospace Innovations (MultiSceince Publishing). He is a member of the
Editorial Board of many journals including the International Journal of Computational Science and Engineering. He has been a guest
editor of many journals such as Parallel Computing, Concurrency and Computation Practice and Experience, the International Journal of Parallel, Embedded and Distributed Systems, and the Journal of Supercomputing for special issues. He was the recipient of many Best
Paper Awards.
Dr. Soumya K. Ghosh is a Professor in the Department of Computer Science and Engineering, Indian Institute of Technology, Kharagpur
(IIT Kharagpur), India. Soumya K. Ghosh (M’05) received the M. Tech. and Ph.D. degrees from the Department of Computer Science
and Engineering, IIT Kharagpur, Kharagpur, India, in 1996 and 2002, respectively. He was with the Indian Space Research Organization, Bengaluru, India. He has authored or coauthored more than 200 research papers in reputed journals and conference proceedings. His
current research interests include spatial data science, spatial web services, and cloud computing.
Dr. Ramamohanarao (Rao) Kotagiri received his PhD from Monash University. He was awarded the Alexander von Humboldt Fellowship in 1983. He has been at the University Melbourne since 1980 and was appointed as a professor in computer science in 1989.
Rao held several senior positions including Head of Computer Science and Software Engineering, Head of the School of Electrical
Engineering and Computer Science at the University of Melbourne and Research Director for the Cooperative Research Center for Intelligent Decision Systems. He served or serving on the Editorial Boards of the Computer Journal, Universal Computer Science, IEEE
TKDE, VLDB Journal and International Journal on Data Privacy. Rao is a Fellow of the Institute of Engineers Australia, a Fellow of
Australian Academy Technological Sciences and Engineering and a Fellow of Australian Academy of Science.
Dr. Rajkumar Buyya is a Redmond Barry Distinguished Professor and Director of the Cloud Computing and Distributed Systems
(CLOUDS) Laboratory at the University of Melbourne, Australia. He is also serving as the founding CEO of Manjrasoft, a spin-off company of the University, commercializing its innovations in Cloud Computing. He served as a Future Fellow of the Australian Research
Council during 2012-2016. He has authored over 625 publications and seven text books including “Mastering Cloud Computing"
published by McGraw Hill, China Machine Press, and Morgan Kaufmann for Indian, Chinese and international markets respectively. He also edited several books including "Cloud Computing: Principles and Paradigms" (Wiley Press, USA, Feb 2011). He is one of the highly
cited authors in computer science and software engineering worldwide (h-index=124+, g-index=281, 80000+ citations). Microsoft
Academic Search Index ranked Dr. Buyya as #1 author in the world (2005-2016) for both field rating and citations evaluations in the area of Distributed and Parallel Computing. "A Scientometric Analysis of Cloud Computing Literature" by German scientists ranked Dr. Buyya
as the World's Top-Cited (#1) Author and the World's Most-Productive (#1) Author in Cloud Computing. Recently, Dr. Buyya is
recognized as a "Web of Science Highly Cited Researcher" in both 2016 and 2017 by Thomson Reuters, a Fellow of IEEE, and Scopus Researcher of the Year 2017 with Excellence in Innovative Research Award by Elsevier for his outstanding contributions to Cloud
computing. He served as the founding Editor-in-Chief of the IEEE Transactions on Cloud Computing. He is currently serving as Editor-
in-Chief of Journal of Software: Practice and Experience, which was established over 45 years ago. For further information on Dr. Buyya,
please visit his cyberhome: www.buyya.com