history of marine debris
DESCRIPTION
History of Marine Debris. Defining Marine Debris. Human-made items that are discarded both intentionally and unintentionally and eventually enter ocean Includes both biodegradable items (paper, wood, food, or metal) and non-biodegradable items (glass, plastic) - PowerPoint PPT PresentationTRANSCRIPT
History of Marine Debris
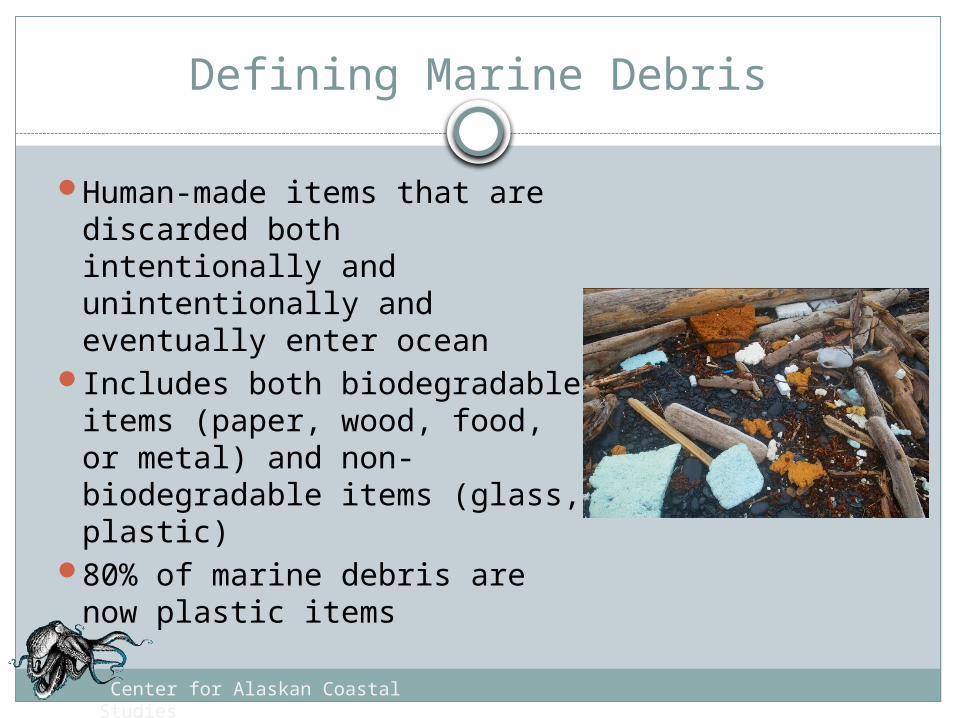
Defining Marine Debris
Human-made items that are discarded both intentionally and unintentionally and eventually enter ocean
Includes both biodegradable items (paper, wood, food, or metal) and non-biodegradable items (glass, plastic)
80% of marine debris are now plastic items
Center for Alaskan Coastal Studies
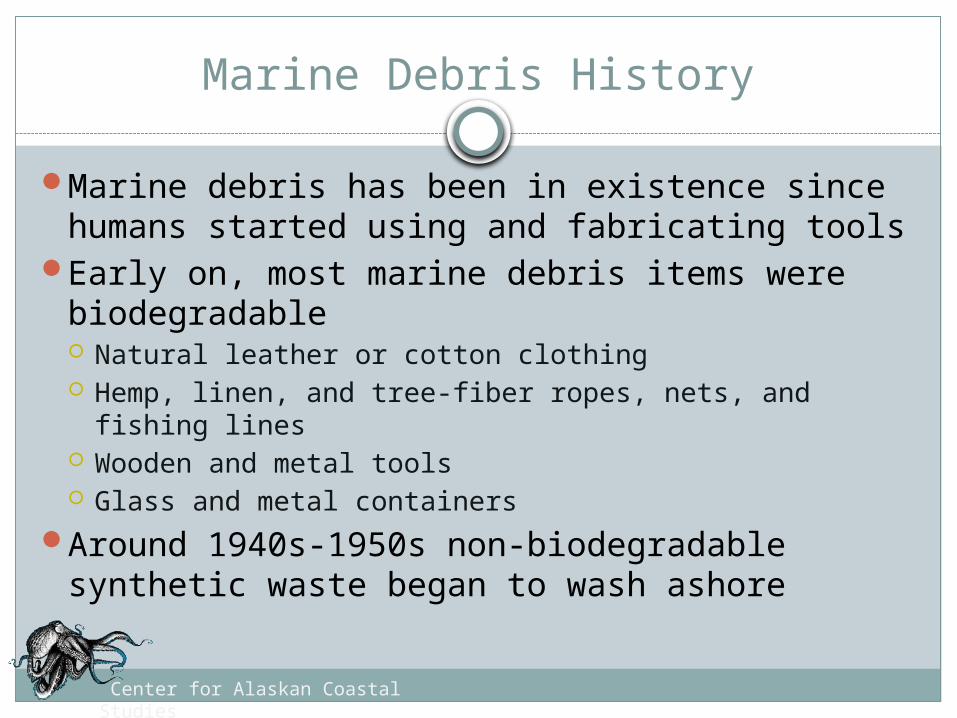
Marine Debris History
Marine debris has been in existence since humans started using and fabricating tools
Early on, most marine debris items were biodegradable Natural leather or cotton clothing Hemp, linen, and tree-fiber ropes, nets, and fishing
lines Wooden and metal tools Glass and metal containers
Around 1940s-1950s non-biodegradable synthetic waste began to wash ashore
Center for Alaskan Coastal Studies
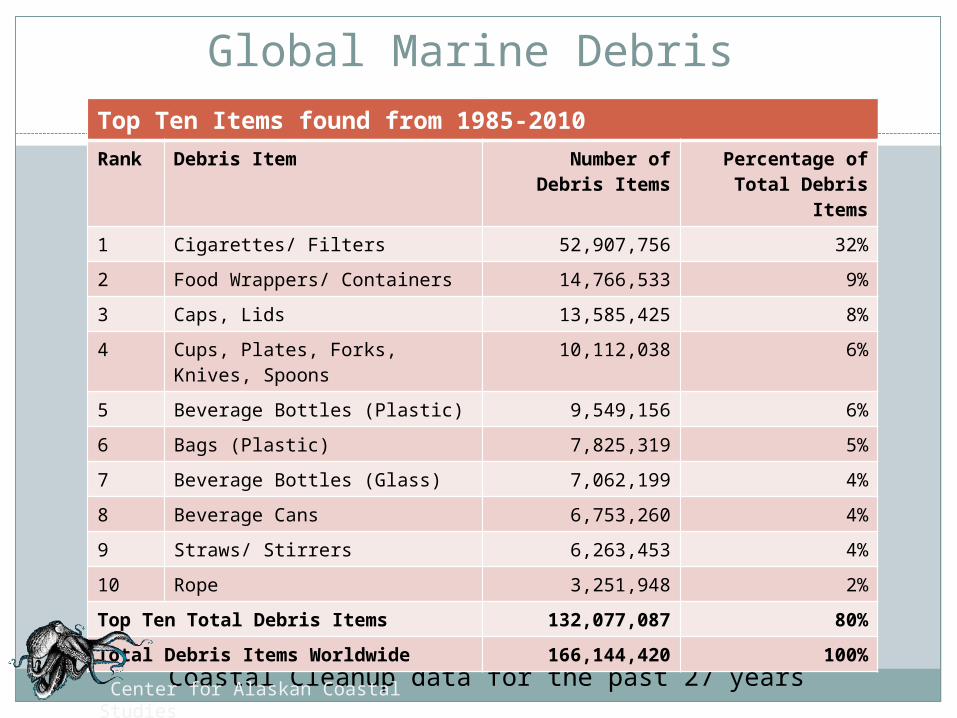
Global Marine Debris
The Ocean Conservancy has collected International Coastal Cleanup data for the past 27 years
Top Ten Items found from 1985-2010Rank Debris Item Number of
Debris ItemsPercentage of
Total Debris Items
1 Cigarettes/ Filters 52,907,756 32%
2 Food Wrappers/ Containers 14,766,533 9%
3 Caps, Lids 13,585,425 8%
4 Cups, Plates, Forks, Knives, Spoons
10,112,038 6%
5 Beverage Bottles (Plastic) 9,549,156 6%
6 Bags (Plastic) 7,825,319 5%
7 Beverage Bottles (Glass) 7,062,199 4%
8 Beverage Cans 6,753,260 4%
9 Straws/ Stirrers 6,263,453 4%
10 Rope 3,251,948 2%
Top Ten Total Debris Items 132,077,087 80%
Total Debris Items Worldwide 166,144,420 100%
Center for Alaskan Coastal Studies
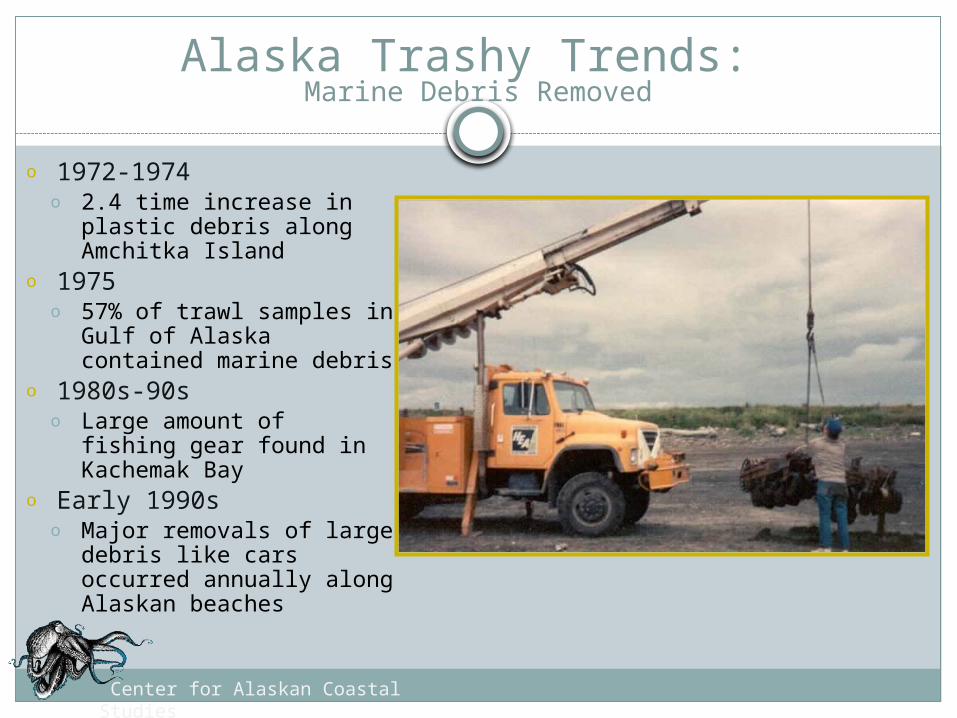
Alaska Trashy Trends: Marine Debris Removed
o 1972-1974o 2.4 time increase in
plastic debris along Amchitka Island
o 1975o 57% of trawl samples in
Gulf of Alaska contained marine debris
o 1980s-90so Large amount of
fishing gear found in Kachemak Bay
o Early 1990so Major removals of large
debris like cars occurred annually along Alaskan beaches
Center for Alaskan Coastal Studies
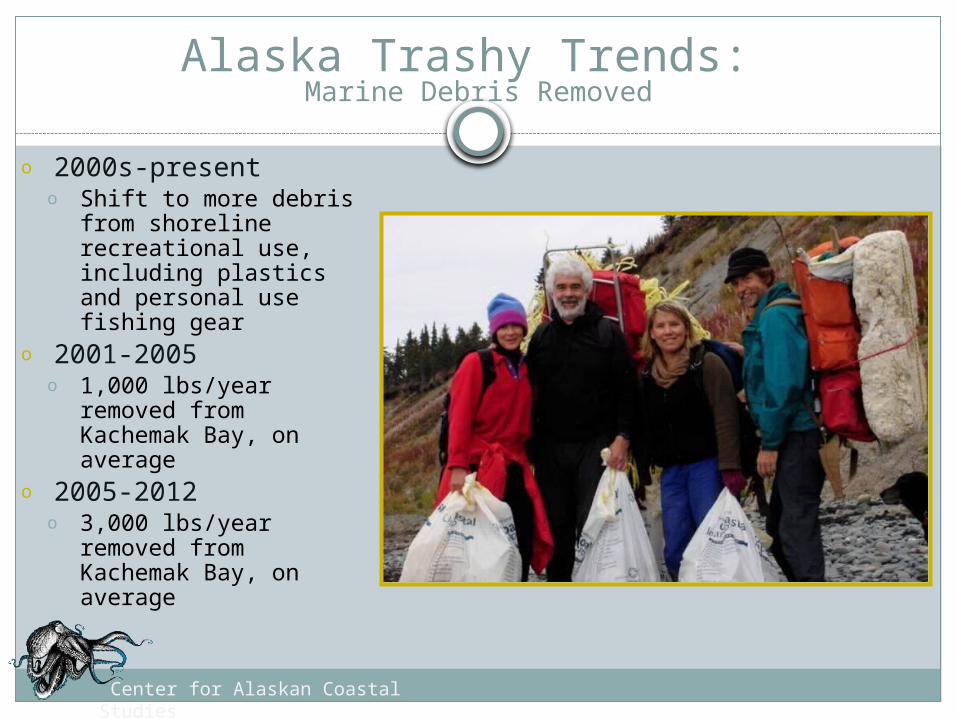
Alaska Trashy Trends: Marine Debris Removed
o 2000s-presento Shift to more debris
from shoreline recreational use, including plastics and personal use fishing gear
o 2001-2005o 1,000 lbs/year
removed from Kachemak Bay, on average
o 2005-2012o 3,000 lbs/year
removed from Kachemak Bay, on average
Center for Alaskan Coastal Studies
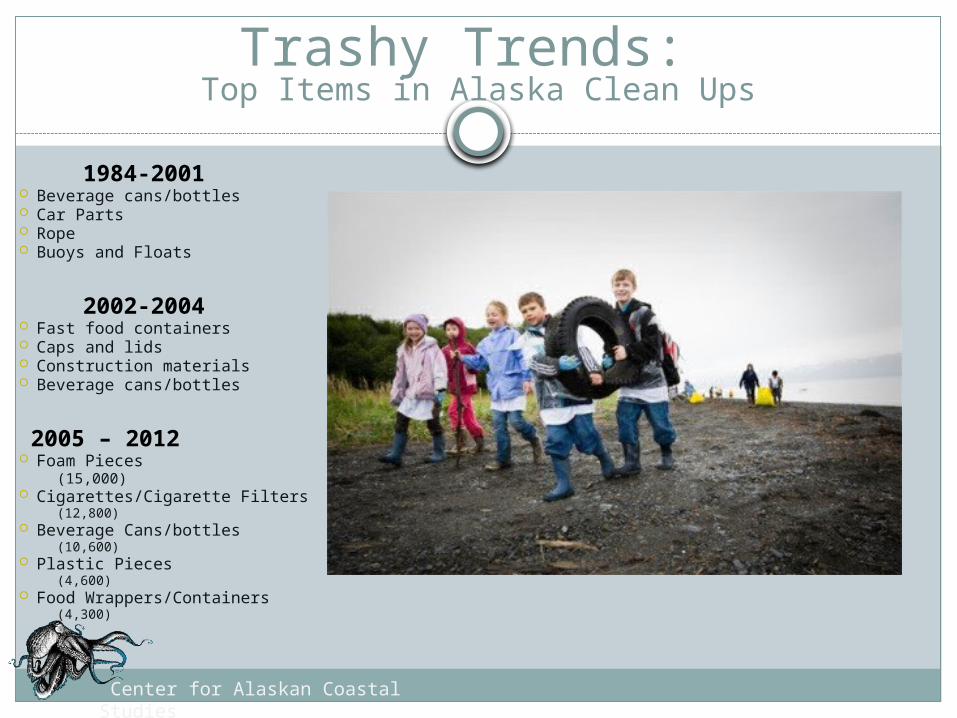
Trashy Trends: Top Items in Alaska Clean Ups
1984-2001 Beverage cans/bottles Car Parts Rope Buoys and Floats
2002-2004 Fast food containers Caps and lids Construction materials Beverage cans/bottles
2005 – 2012 Foam Pieces
(15,000) Cigarettes/Cigarette Filters
(12,800) Beverage Cans/bottles
(10,600) Plastic Pieces
(4,600) Food Wrappers/Containers
(4,300)
Center for Alaskan Coastal Studies
Marine Debris Sources
Land Based Activities and Personal Use Daily use items by individuals – toothbrush, food wrapper Household items – soap dispensers, dishes, appliances Recreational Use Items – beverage bottles, food wrappers, sandals
Marine Use: Industrial and Recreational Buoys, Boat parts, Nets, Ropes, Strapping Bands, Gloves, Coolers
Container Spills Nurdles – small plastic pellets aka mermaid tears Large shipments of plastic products
Natural Disasters Large scale: Tohoku Earthquake & Tsunami (Japan), Haiyan
Typhoon (Philippines) Small scale: Local Winter Storms
Center for Alaskan Coastal Studies
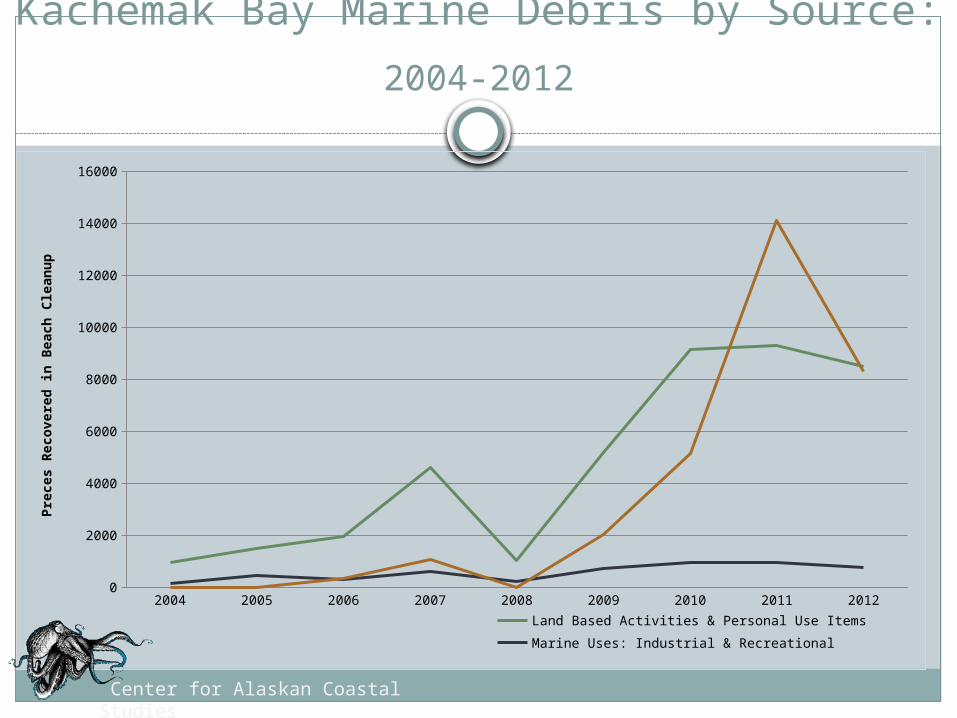
2004 2005 2006 2007 2008 2009 2010 2011 20120
2000
4000
6000
8000
10000
12000
14000
16000
Land Based Activities & Personal Use ItemsMarine Uses: Industrial & RecreationalPolyurethane Foam Pieces (Likely from Natural Disasters)
Pre
ces
Recovere
d i
n B
each C
leanup
Kachemak Bay Marine Debris by Source: 2004-2012
Center for Alaskan Coastal Studies
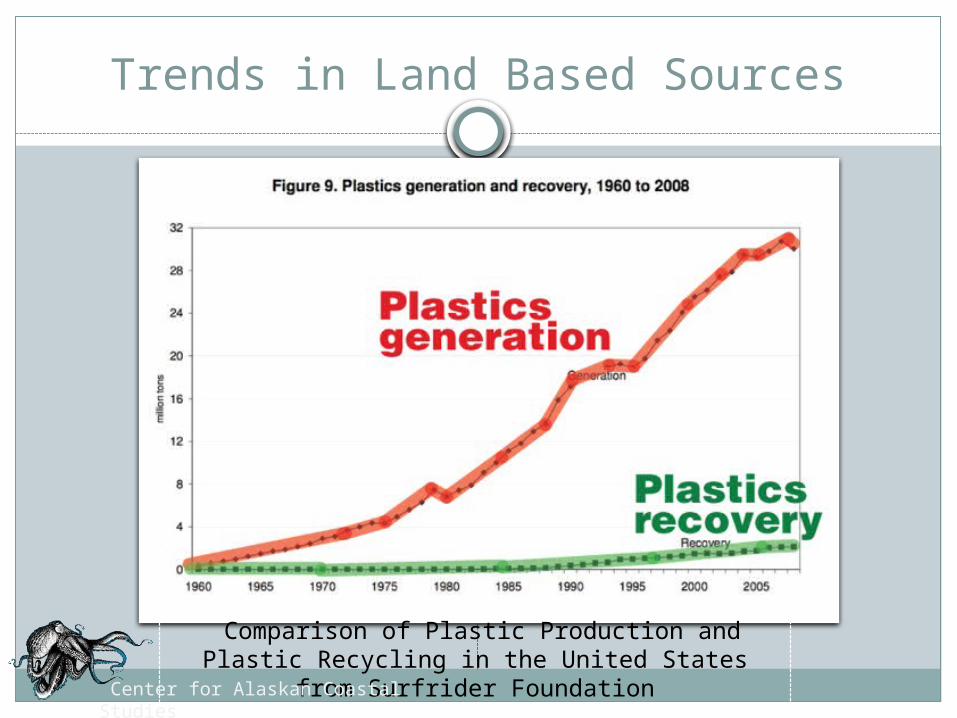
Trends in Land Based Sources
Comparison of Plastic Production and Plastic Recycling in the United States from Surfrider
Foundation Center for Alaskan Coastal Studies
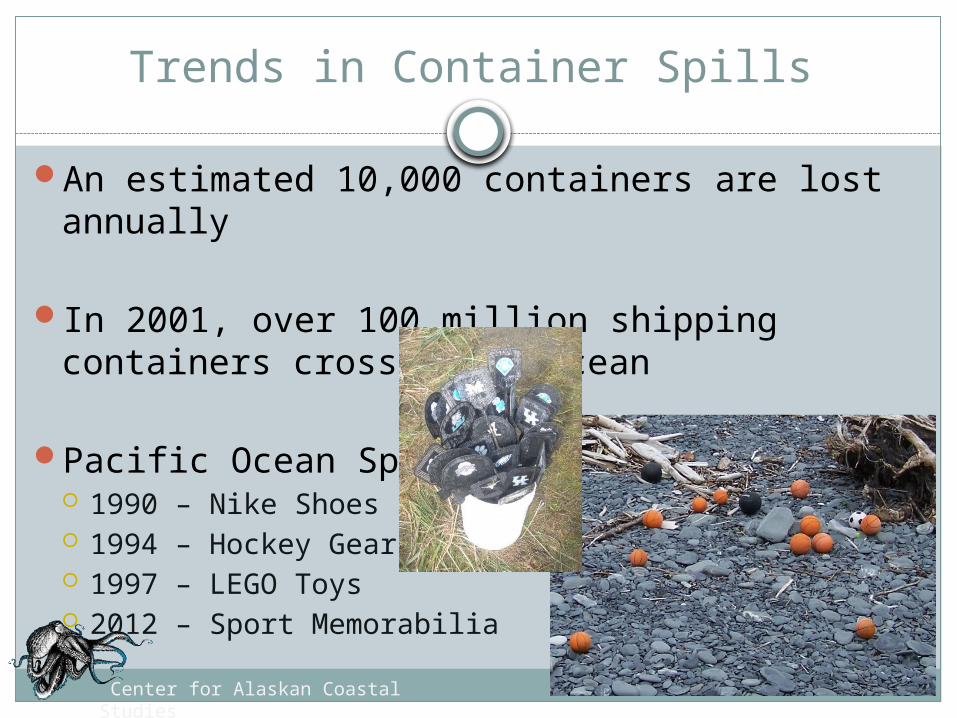
Trends in Container Spills
An estimated 10,000 containers are lost annually
In 2001, over 100 million shipping containers crossed the ocean
Pacific Ocean Spills 1990 – Nike Shoes 1994 – Hockey Gear 1997 – LEGO Toys 2012 – Sport Memorabilia
Center for Alaskan Coastal Studies
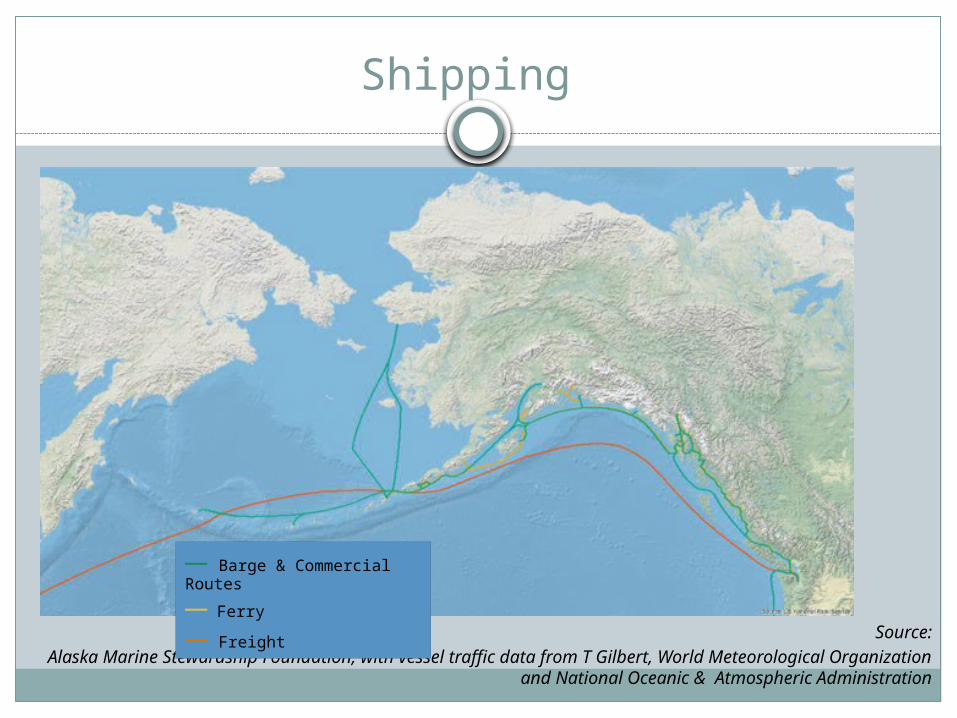
Shipping
Source:Alaska Marine Stewardship Foundation, with vessel traffic data from T Gilbert, World
Meteorological Organization and National Oceanic & Atmospheric Administration
__ Barge & Commercial
Routes__
Ferry__
Freight
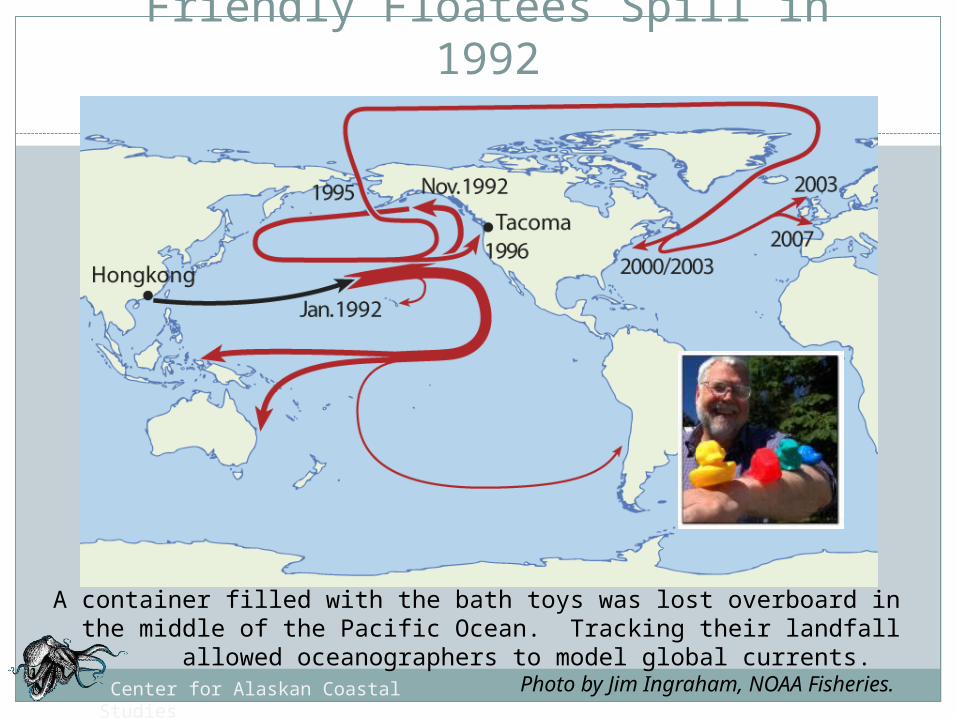
Friendly Floatees Spill in 1992
Center for Alaskan Coastal Studies
A container filled with the bath toys was lost overboard in the middle of the Pacific Ocean. Tracking their landfall allowed oceanographers to
model global currents. Photo by Jim Ingraham, NOAA Fisheries.
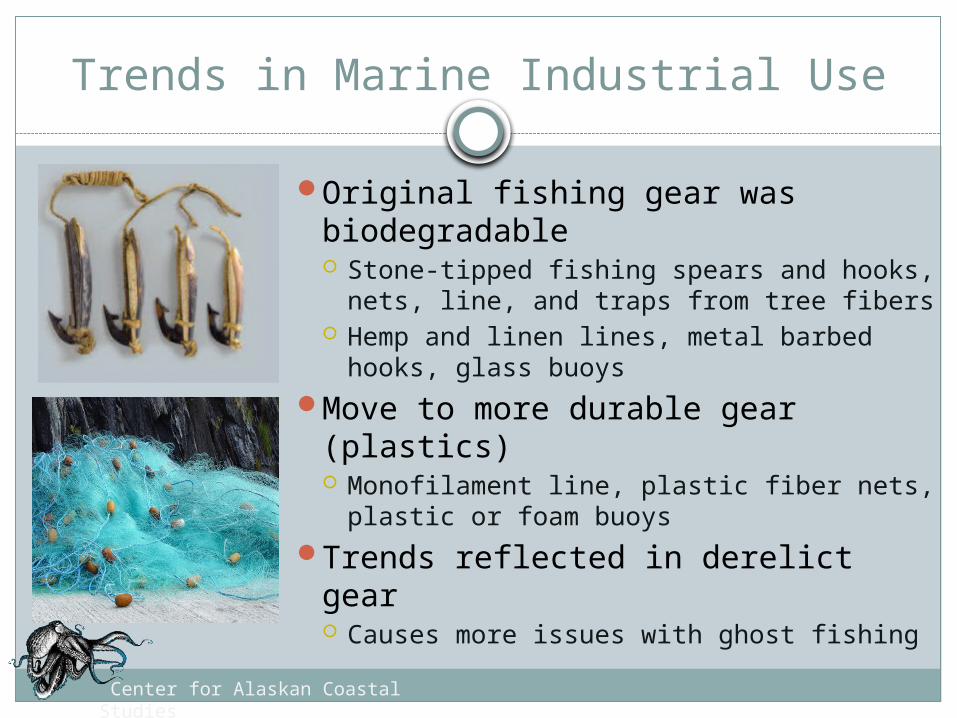
Trends in Marine Industrial Use
Original fishing gear was biodegradable Stone-tipped fishing spears and hooks,
nets, line, and traps from tree fibers Hemp and linen lines, metal barbed
hooks, glass buoys Move to more durable gear
(plastics) Monofilament line, plastic fiber nets,
plastic or foam buoysTrends reflected in derelict gear
Causes more issues with ghost fishing Center for Alaskan Coastal Studies
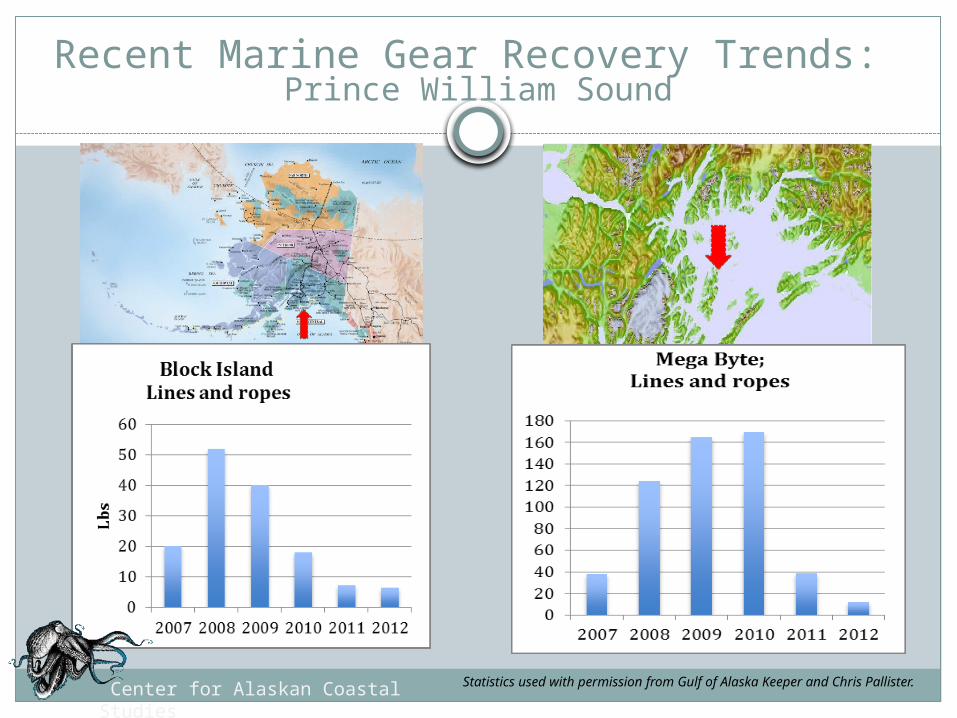
Recent Marine Gear Recovery Trends: Prince William Sound
Statistics used with permission from Gulf of Alaska Keeper and Chris Pallister. Center for Alaskan Coastal Studies
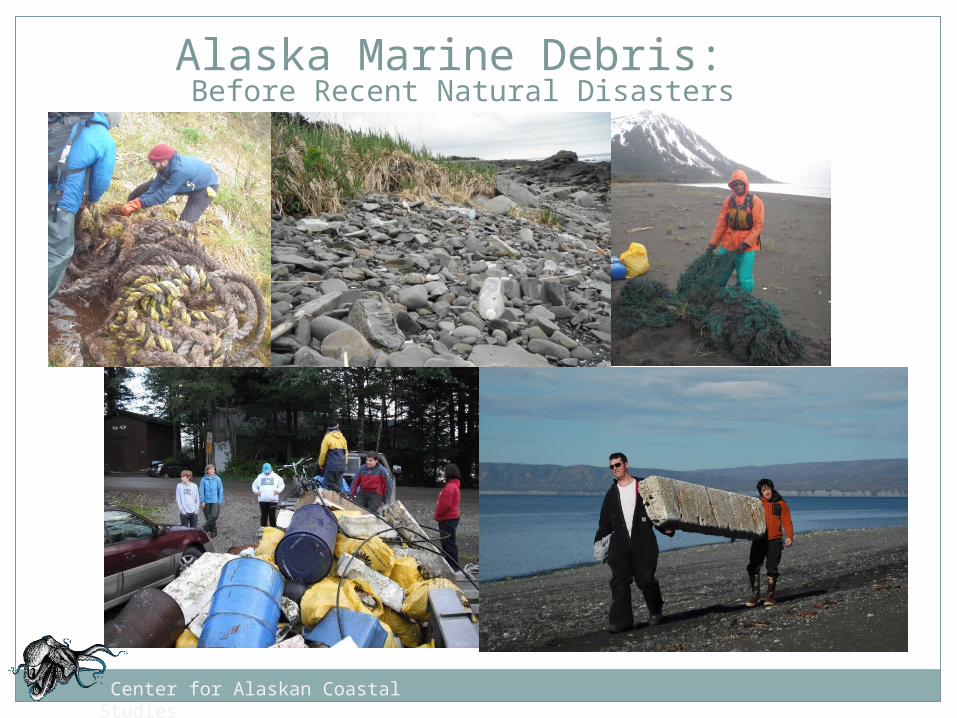
Alaska Marine Debris: Before Recent Natural Disasters
Center for Alaskan Coastal Studies
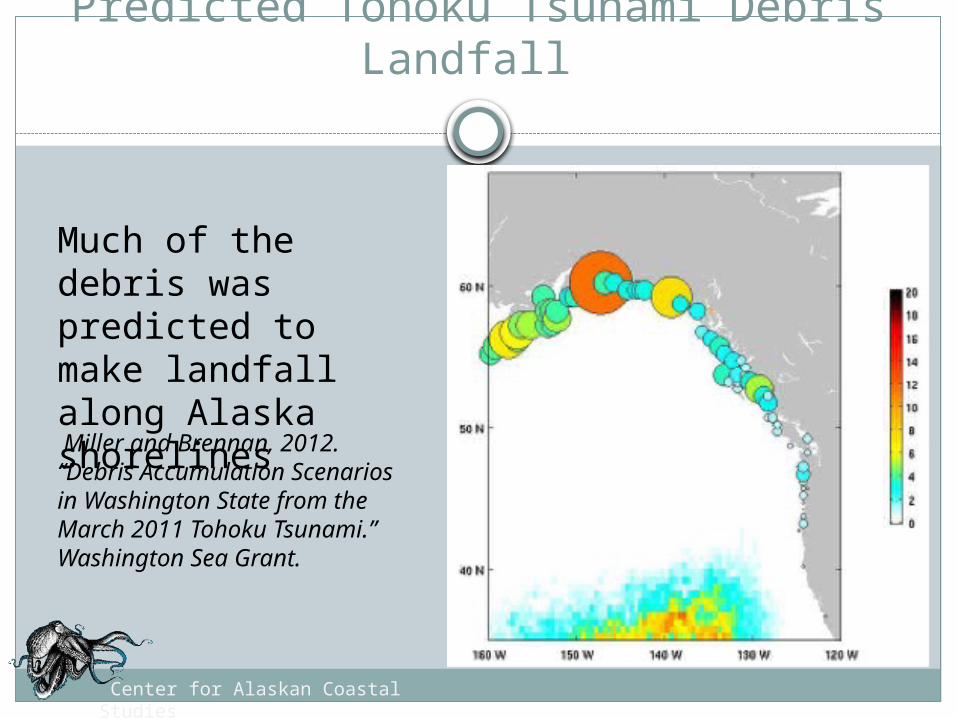
Predicted Tohoku Tsunami Debris Landfall
Miller and Brennan, 2012. “Debris Accumulation Scenarios in Washington State from the March 2011 Tohoku Tsunami.” Washington Sea Grant.
Center for Alaskan Coastal Studies
Much of the debris was predicted to make landfall along Alaska shorelines
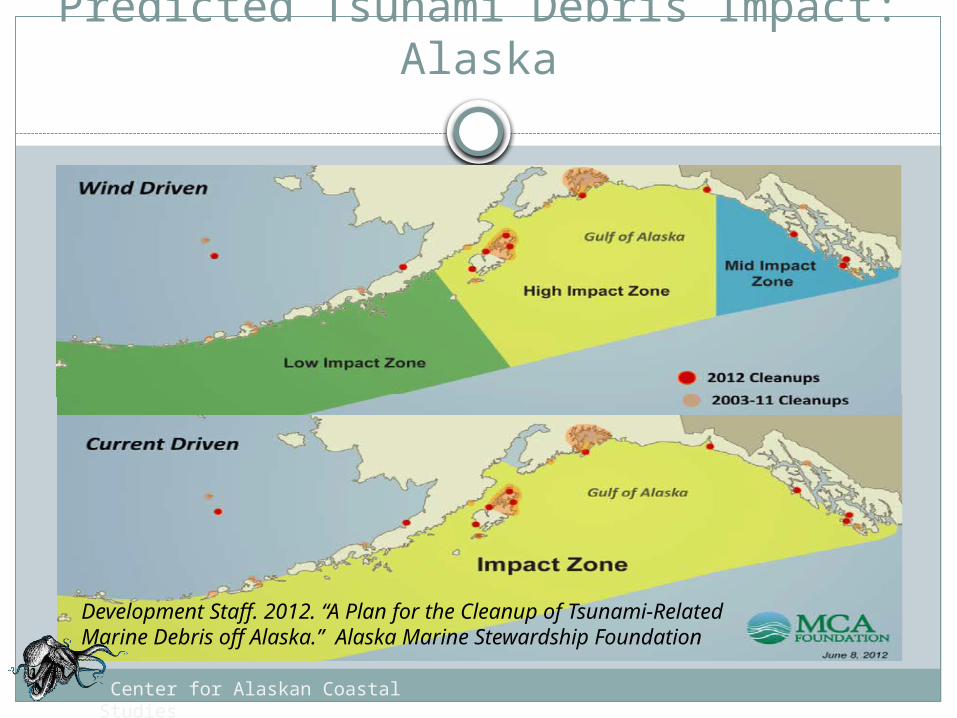
Development Staff. 2012. “A Plan for the Cleanup of Tsunami-Related Marine Debris off Alaska.” Alaska Marine Stewardship Foundation
Predicted Tsunami Debris Impact: Alaska
Center for Alaskan Coastal Studies
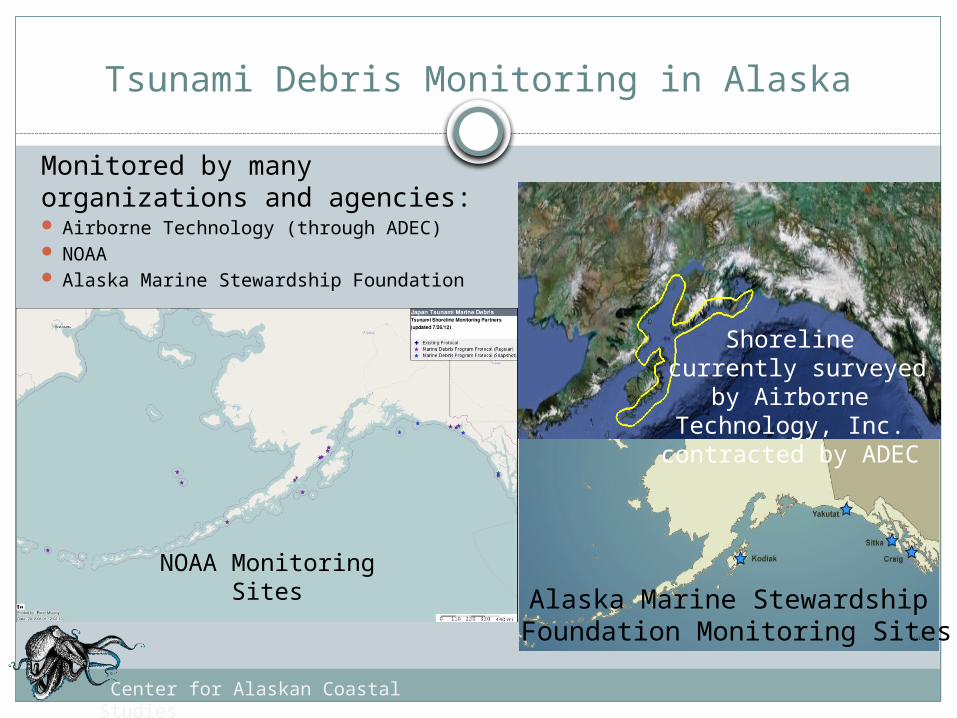
Tsunami Debris Monitoring in Alaska
Monitored by many organizations and agencies: Airborne Technology (through ADEC) NOAA Alaska Marine Stewardship Foundation
Shoreline currently surveyed
by Airborne Technology, Inc.
contracted by ADEC
Alaska Marine Stewardship Foundation Monitoring Sites
NOAA Monitoring Sites
Center for Alaskan Coastal Studies
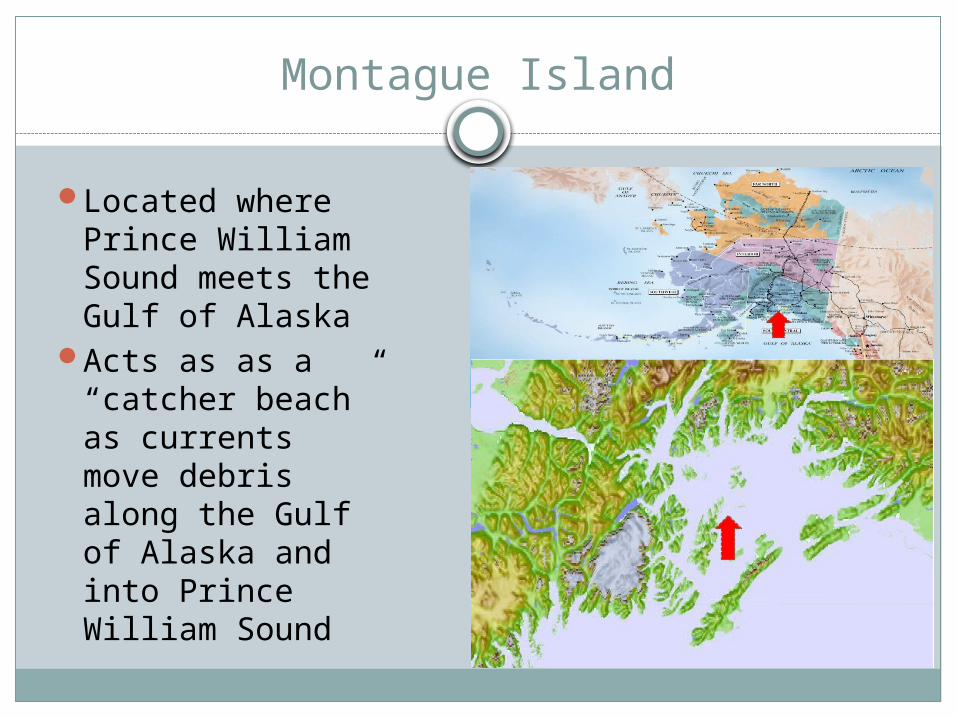
Montague Island
Located where Prince William Sound meets the Gulf of Alaska
Acts as as a “catcher beach” as currents move debris along the Gulf of Alaska and into Prince William Sound
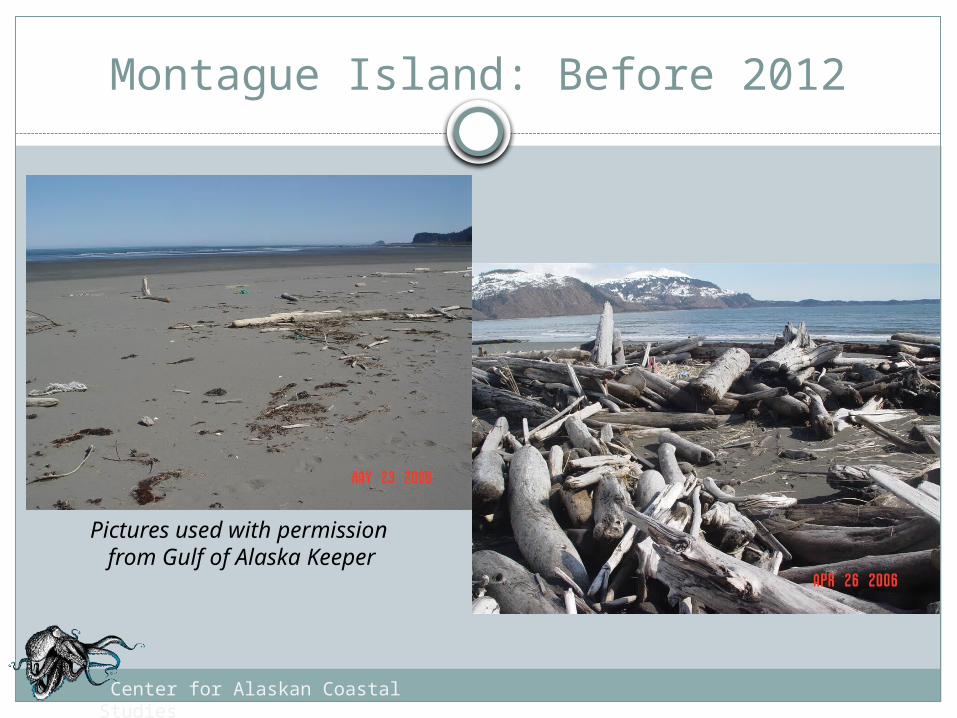
Montague Island: Before 2012
Pictures used with permission from Gulf of Alaska Keeper
Center for Alaskan Coastal Studies
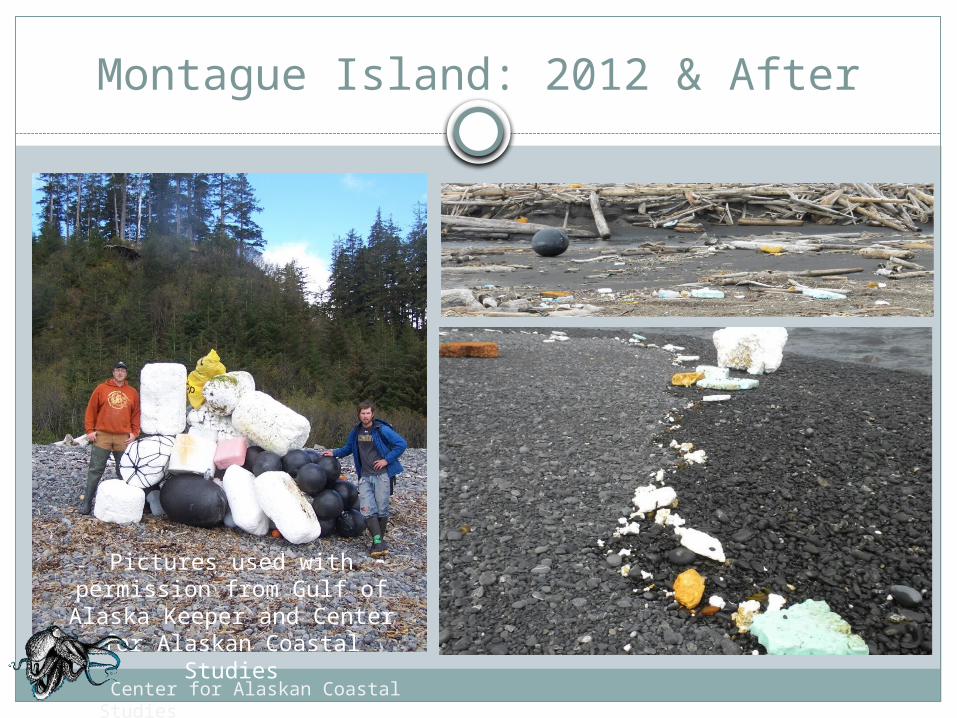
Montague Island: 2012 & After
Pictures used with permission from Gulf of Alaska Keeper and
Center for Alaskan Coastal Studies
Center for Alaskan Coastal Studies
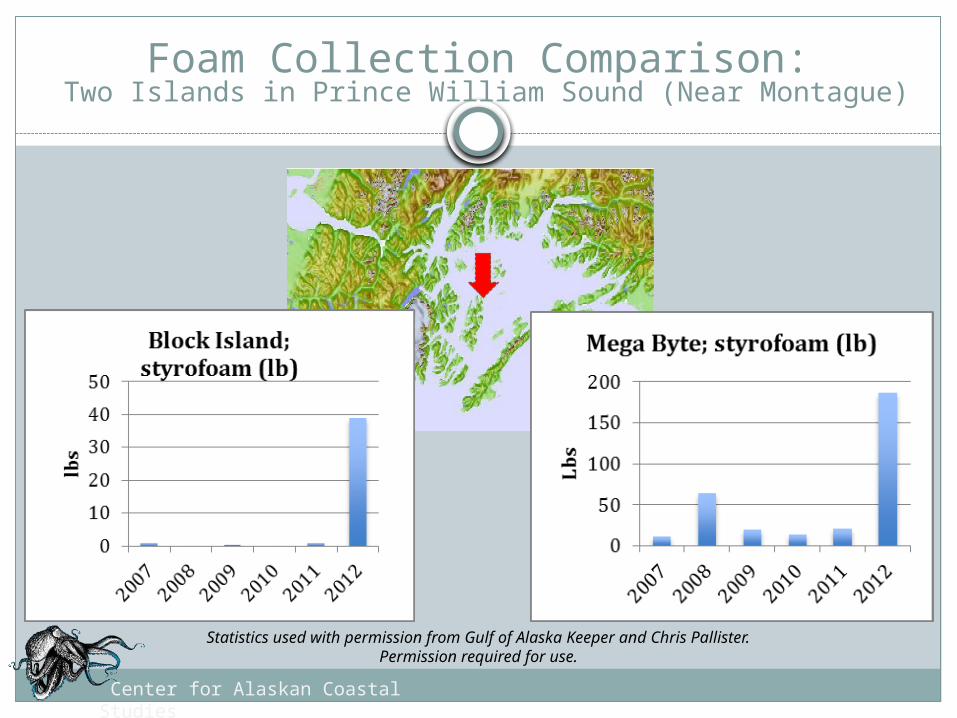
Statistics used with permission from Gulf of Alaska Keeper and Chris Pallister. Permission required for use.
Foam Collection Comparison: Two Islands in Prince William Sound (Near Montague)
Center for Alaskan Coastal Studies
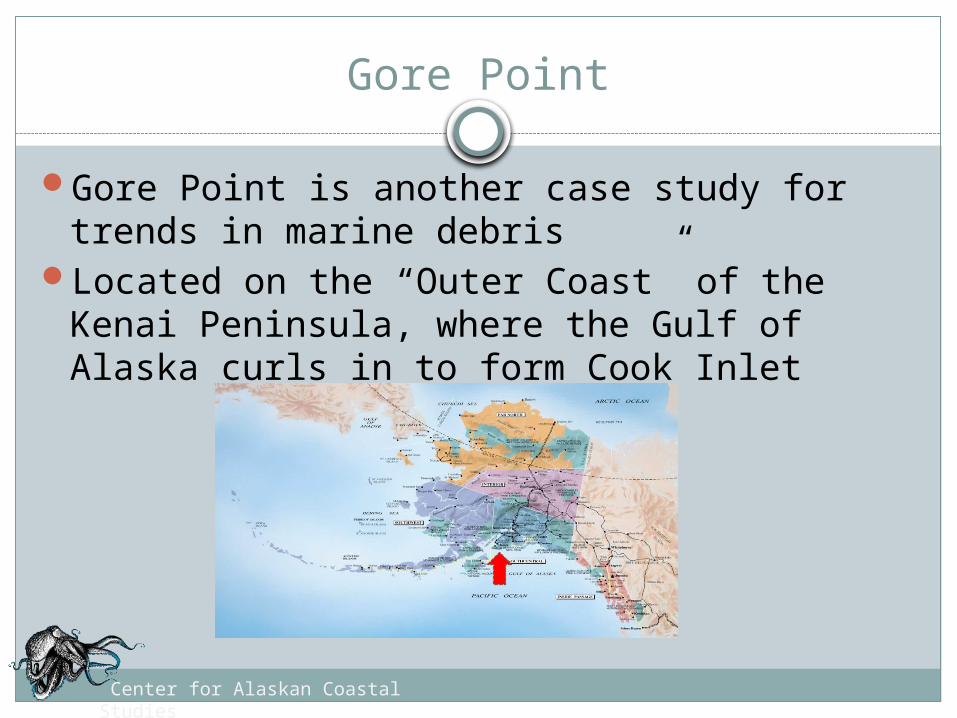
Gore Point
Gore Point is another case study for trends in marine debris
Located on the “Outer Coast” of the Kenai Peninsula, where the Gulf of Alaska curls in to form Cook Inlet
Center for Alaskan Coastal Studies
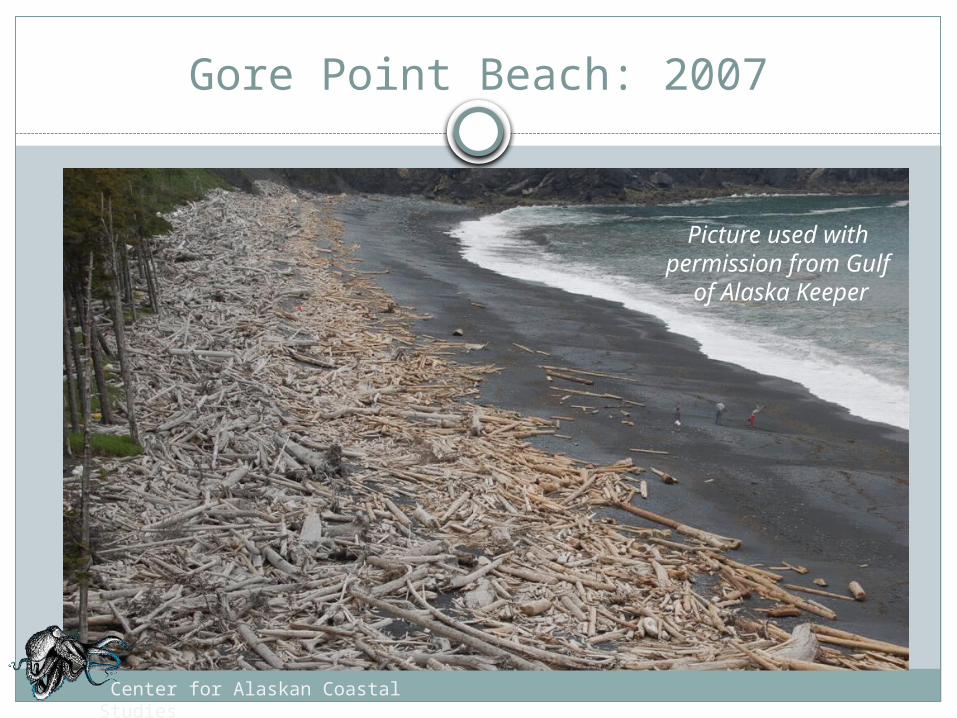
Gore Point Beach: 2007
Picture used with permission from Gulf
of Alaska Keeper
Center for Alaskan Coastal Studies
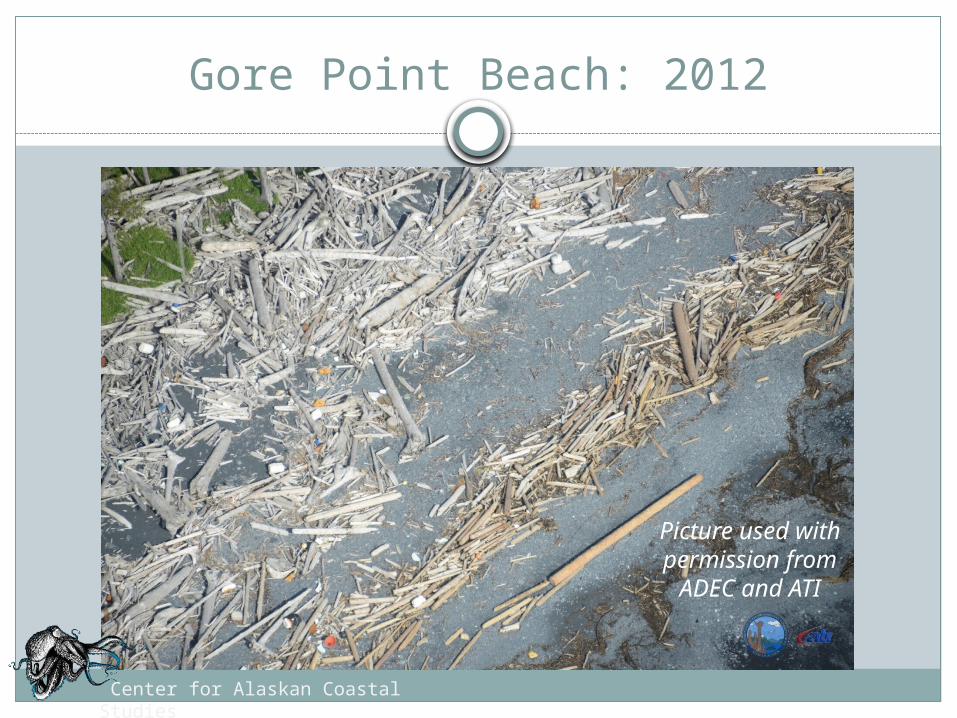
Gore Point Beach: 2012
Picture used with permission from ADEC and
ATI
Center for Alaskan Coastal Studies
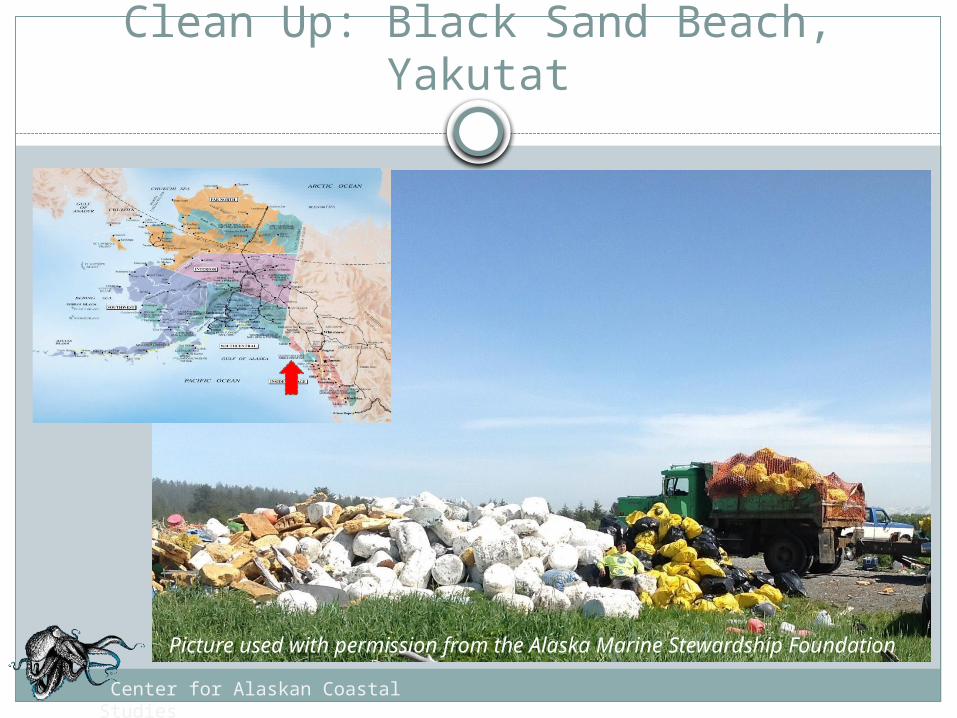
Clean Up: Black Sand Beach, Yakutat
Picture used with permission from the Alaska Marine Stewardship Foundation
Center for Alaskan Coastal Studies
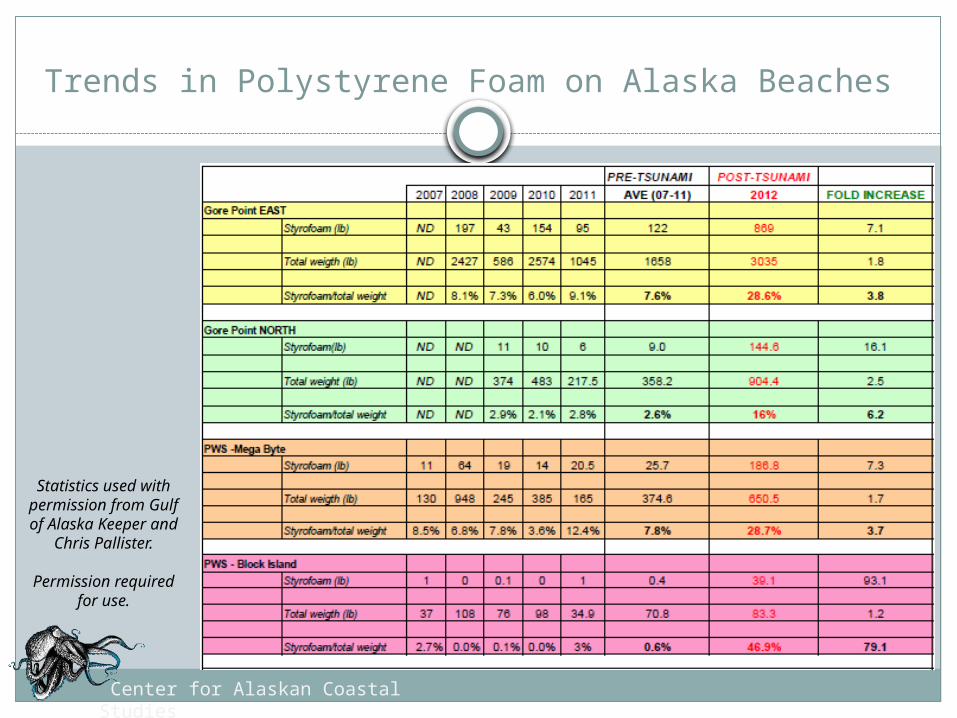
Statistics used with permission
from Gulf of Alaska Keeper and Chris
Pallister.
Permission required for use.
Trends in Polystyrene Foam on Alaska Beaches
Center for Alaskan Coastal Studies
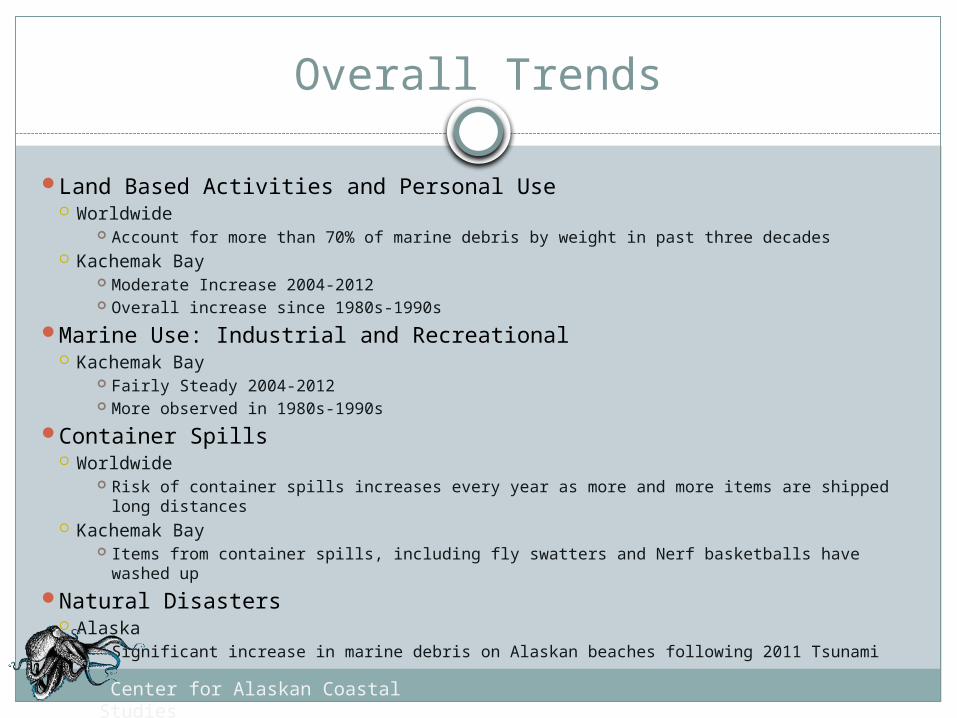
Overall Trends
Land Based Activities and Personal Use Worldwide
Account for more than 70% of marine debris by weight in past three decades Kachemak Bay
Moderate Increase 2004-2012 Overall increase since 1980s-1990s
Marine Use: Industrial and Recreational Kachemak Bay
Fairly Steady 2004-2012 More observed in 1980s-1990s
Container Spills Worldwide
Risk of container spills increases every year as more and more items are shipped long distances
Kachemak Bay Items from container spills, including fly swatters and Nerf basketballs have washed up
Natural Disasters Alaska
Significant increase in marine debris on Alaskan beaches following 2011 Tsunami
Center for Alaskan Coastal Studies
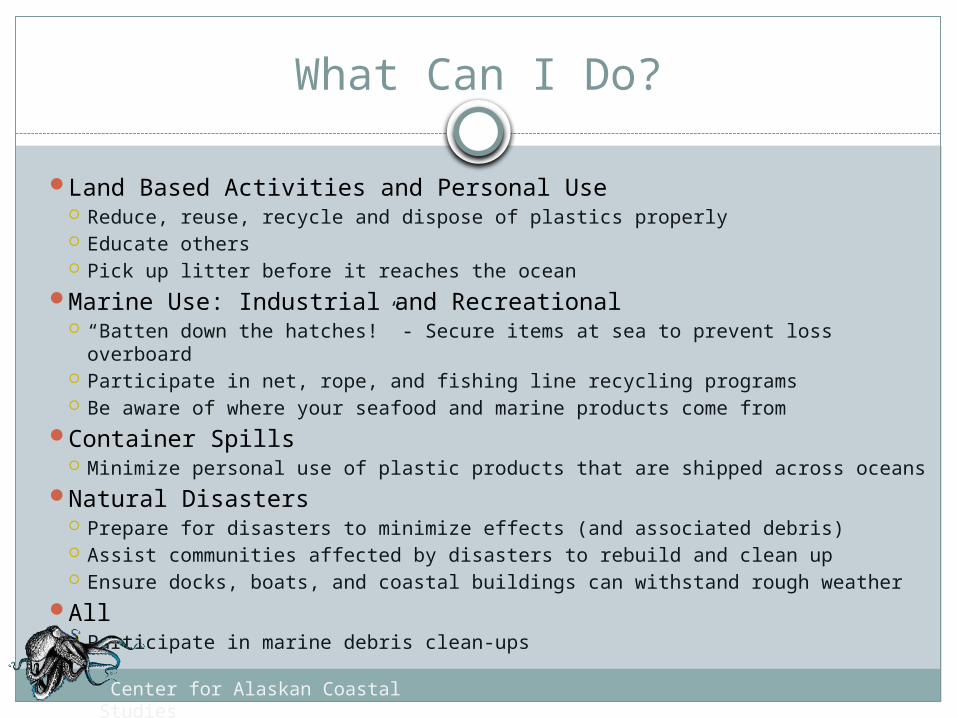
What Can I Do?
Land Based Activities and Personal Use Reduce, reuse, recycle and dispose of plastics properly Educate others Pick up litter before it reaches the ocean
Marine Use: Industrial and Recreational “Batten down the hatches!” - Secure items at sea to prevent loss overboard Participate in net, rope, and fishing line recycling programs Be aware of where your seafood and marine products come from
Container Spills Minimize personal use of plastic products that are shipped across oceans
Natural Disasters Prepare for disasters to minimize effects (and associated debris) Assist communities affected by disasters to rebuild and clean up Ensure docks, boats, and coastal buildings can withstand rough weather
All Participate in marine debris clean-ups
Center for Alaskan Coastal Studies