historical perspectives on regional income inequality in ... · historical perspectives on regional...
TRANSCRIPT

desiguALdadesnetResearch Network on InterdependentInequalities in Latin America
Working Paper Series
Working Paper No 66 2014
Historical Perspectives on Regional Income Inequality in Brazil 1872-2000
Eustaacutequio J Reis
desiguALdadesnet Working Paper Series
Published by desiguALdadesnet International Research Network on Interdependent Inequalities in Latin America
The desiguALdadesnet Working Paper Series serves to disseminate first results of ongoing research projects in order to encourage the exchange of ideas and academic debate Inclusion of a paper in the desiguALdadesnet Working Paper Series does not constitute publication and should not limit publication in any other venue Copyright remains with the authors
Copyright for this edition Eustaacutequio J Reis
Editing and Production Barbara Goumlbel Marianne Braig Laura Kemmer Paul Talcott
All working papers are available free of charge on our website wwwdesiguALdadesnet
Reis Eustaacutequio J 2014 ldquoHistorical Perspectives on Regional Income Inequality in Brazil 1872-2000rdquo desiguALdadesnet Working Paper Series 66 Berlin desiguALdadesnet International Research Network on Interdependent Inequalities in Latin America
The paper was produced by Eustaacutequio J Reis during his fellowship at desiguALdadesnet from 042013 to 052013
desiguALdadesnet International Research Network on Interdependent Inequalities in Latin America cannot be held responsible for errors or any consequences arising from the use of information contained in this Working Paper the views and opinions expressed are solely those of the author or authors and do not necessarily reflect those of desiguALdadesnet
Historical Perspectives on Regional Income Inequality in Brazil 1872-2000Eustaacutequio J Reis1
AbstractThe paper provides historical perspectives on regional economic inequalities in Brazil making use of a database on Brazilian municipalities from 1872 to 2000 A suit of maps and graphs describe the geographic forces shaping the historical development of the Brazilian economy highlighting the role of transport costs and its consequences for the spatial dynamics of income per capita and labor productivity The next section estimates econometric models of growth convergence for municipal income per capita and labor For the 20th century analyses are refined in two ways first by disaggregating the models for urban and rural activities second by enlarging the model to take account of the determinants of spatial growth convergence Empirical results endorse the preeminence of geographic factors in contrast to institutional conditions The final section summarizes the results and proposes research extensions The Appendix describes the database
Keywords 20th century Brazil | regional inequality | growth convergence | productivity | income per capita
Biographical NotesEustaacutequio J Reis is an Economist at the Instituto de Pesquisa Econocircmica Aplicada (Institute of Applied Economic Research IPEA) Rio de Janeiro where he has been Director of Macroeconomic Studies as well as the Editor of Pesquisa e Planejamento Economico for many years Other activities include coordination of Research Network on Spatial Models and Analysis (Nemesis) as well as of Ipeadata and Memoria Estatiacutestica do Brasil He is also a member of the Scientific Steering Committee of the Large Scale Scientific Experiment for the Amazon Basin (LBA) He did his undergraduate work at the Universidade Federal de Minas Gerais and graduate studies at Fundaccedilatildeo Getuacutelio Vargas in Rio de Janeiro and at the Massachusetts Institute of Technology (MIT) Cambridge USA His research interests include Economic History and Development and Environmental and Spatial Economics He has published extensively on Amazon deforestation including The Dynamics of Deforestation and Economic Growth in the Brazilian Amazon (Cambridge University Press Cambridge 2002) From April to May 2013 he was a Fellow at desiguALdadesnet in Research Dimension II Socio-political Inequalities
1 Paper presented at the Colloquium of desiguALdadesnet Freie Universitaumlt Berlin May 13 2013 The author gratefully acknowledges hospitality and financial support from desiguALdadesnet as well as the support from IPEA CNPq and FAPERJPRONEX to the Project Nemesis ndash Proc E52 1681712006 (wwwnemesisorgbr) He is also grateful for the computer assistance of Maacutercia Pimentel Ana Isabel Alvarenga and Maria do Carmo Horta
Contents
1 Introduction 1
2 Geography and History 2
3 Spatial Patterns of Growth 1872-2000 7
4 Secular Convergence of Labor Productivity and Income per Capita in Brazil 1872-2000 18
5 Sectorial Growth Convergence 1920-2000 22
6 Factors Conditioning Convergence Patterns 1920-2000 24
7 Conclusions and Extensions 36
8 Bibliography 39
9 Appendix Database 43
desiguALdadesnet Working Paper Series No 66 2014 | 1
1 Introduction
Brazil is one of the most unequal societies in contemporary world From 1970 to 2000 (period for which Census micro data are available) the Gini coefficients of income per capita distribution remained practically constant around 06 one of the highest levels recorded at the national level In the last decade inclusive growth policies made possible to bring Gini figures to something close to 05 For the future the challenges are how to deepen redistribution with less dependence on income transfer policies
In broad historical perspectives both institutional and geographic factors played fundamental roles in the generation and reproduction of Brazilian inequality in space and time Slavery has had and still has overwhelming implications for social equity Concentration of income and wealth and the low levels of education prevailing today are to a large extent her legacies Needless to say this is not an excuse for the ostensible lack of social concerns of government policies during most of the 20th century
Geographic factors were also decisive for spatial equity The continental size and the geographic heterogeneity of the country compounded with very high transport costs to create wide regional disparities in the levels of productivity and income per capita (Azzoni 2003 Azzoni 1999 Azzoni and Ferreira 1997 Barros Mendonccedila and Camargo 1995) The secular roots of regional disparities have been widely discussed in Brazilian historiography (Albuquerque and Cavalcanti 1976 Beacutertola et al 2006 Buescu 1979 Cano 1997 Cano 1998 Castro 1969 Denslow Jr 1977 Furtado 1968 Furtado 1970 Leff 1972 Leff 1973 Leff 1991) The discussion however ostensibly lacks an adequate empirical basis Statistical evidence when available is restricted to sparse data at the state or macro-regional level The sharp economic differences inside Brazilian states not to mention regions have been completely neglected
The paper provides historical perspectives on regional economic inequalities in Brazil For this purposes it analyzes the spatial patterns of Brazilian economic growth making use of a database on Brazilian municipalities from 1872 to 2000 organized by the Research Network on Spatial Models (wwwnemesisorgbr) at the Institute of Applied Economic Research (wwwipeagovbr) in Rio de Janeiro The first section presents a succinct discussion of the geographic forces shaping the historical development of the Brazilian economy highlighting the evolution of transport costs The second section uses a series of maps and graphs to describe the spatial progression of income per capita and labor productivity during the 20th century In a more rigorous fashion the third section estimates econometric models of growth convergence for municipal income per capita and labor productivity in the period 1872 to 2000 The econometric analysis
Reis - Historical Perspectives on Regional Income Inequality in Brazil 1872-2000 | 2
for the period 1920 to 2000 is refined in two ways Firstly by disaggregating the model for urban and rural activities and secondly by enlarging it to take account of the factors conditioning the patterns of spatial growth convergence in the 20th century The final section summarizes the results and proposes research extensions The Appendix describes the database
2 Geography and History
The main historical driver of the geographic patterns of economic development in Brazil was the prohibitive transport costs to hinterland imposed by the strong declivity of the coastal mountain range running parallel to the Atlantic shoreline (Ellis Jr 1951 Goulart Filho and Queiroz 2011 Silva 1949 Summerhill 2003) The slope of the Serra do Mar ndash reaching 1000 meters 100 km away from the sea combined with intense summer rainfall and the dense rainforest slowed the development of a transportation infrastructure and therefore the economic settlement of the Brazilian hinterland (see Figure 1A)
The settlement of the mining areas of the Center-South region during the 18th century was made viable by the high specific value ndash negligible transport costs ndash of precious minerals (Cano 1977) But with historical hindsight it is fair say that after the exhaustion of mines high transport costs made economic development unsustainable
Finally in the Amazon region where navigable rivers sanctioned low transport costs the wild vegetation unhealthy climate and the poor quality of soil precluded agrarian settlement up to the last quarter of the 20th century Rubber extraction however sustained a thriving economy from 1850 to 1912 when competition from Asian plantations drove down both export volumes and prices (Andersen et al 2002 Santos 1980)
The railroad investments in the end of the 19th century were crucial for the viability of agrarian settlements in the hinterland Transport costs reduced approximately 80 pushing the coffee frontier towards the southwestern regions of Satildeo Paulo (Matos 1974 Milliet 1982 Summerhill 1997)Furthermore the city of Satildeo Paulo emerged as the most important hub (the node with minimum transport cost) of the railway network thus pulling industries to exploit economies of scale and emerging as the sustainable industrial growth pole of the country in the beginning of the 20th century (see Figure 1B)
For other regions however the reduction in transport costs provided by railways had diverse consequences leading to the specialization in agriculture and to the loss of
desiguALdadesnet Working Paper Series No 66 2014 | 3
competitiveness in manufacturing and handcraft production which were previously protected by the high transport costs (Cano 1977 Martins 1983 Martins and Martins 1982 Reis and Monasterio 2010 Restitutti 2006 Stein 1957)
Starting in the 1890rsquos the concentration of industry in Satildeo Paulo was enhanced by the synergies and externalities provided by the agglomeration of technological knowledge and human capital of foreign immigrants (Cano 1998 Reis and Monasterio 2010 Versiani 1993) Conversely subsidized foreign immigration aggravated the segmentation of the Brazilian labor market reducing their effectiveness in reducing regional disparities in productivity and income Thus until the 1930rsquos internal migration to Satildeo Paulo was relatively meager despite huge regional differences in productivity and income per capita (Graham 1972 Graham and Hollanda 1971)2
In the second half of the 20th century government investment in transport infrastructure concentrated on roads which gradually replaced the railroads The road option reinforced the hegemonic position of Satildeo Paulo and preserved regional disparities Indeed the interconnection of the road network strengthened the competitiveness of industry in Satildeo Paulo by reducing logistics costs of the distribution of manufactured goods in the domestic market compared to the costs of long distance transport required for the export of primary products Additionally the costs of internal migration were reduced stimulating migration flows to large cities and ensuring a nearly unlimited supply of labor that dampened pressures for urban wage increases particularly in Sao Paulo and Rio de Janeiro (Barat 1978 Castro 2004 Galvatildeo 1999 Graham 1972 Graham and Hollanda 1971 Oliveira 1977) During the sixties the federal capital moved to Brasiacutelia and the federal government began to implement regional development policies combining investments in infrastructure fiscal and credit incentives The priority given to roads in detriment of railways was an inefficient solution for the transportation requirements of the agricultural exports from the Cerrado flatland of the Center-West and North regions of the country As consequence the growth of agricultural productivity and output in these areas were retarded Moreover the low price of land fostered a highly dispersed pattern of settlement with reduced profitability of small farms leading to limited distributive impacts and excessive environmental costs in terms of tropical deforestation (Faminow 1998 Gasques and Yokomizo 1985 Reis and Margullis 1990 Reis Igliori and Weinhold 1998 Silveira 1957)
2 The state of Rio Grande do Sul in the temperate zones of the extreme south of the country is a double exception The flatlands of the Pampas were highly productive and had low transport costs European immigration flows were significant since the mid-19th century
Reis - Historical Perspectives on Regional Income Inequality in Brazil 1872-2000 | 4
Figures 1C to 1F illustrate the expansion of the road infrastructure and its effects on the transportation costs in Brazil during the last quarter of the 20th century They show that the costs of moving one unit of cargo to Satildeo Paulo (as a proxy for the domestic market) were reduced by more than 40 from 1968 to 1995 Despite that high transportation costs still remain as one of the most critical obstacles to Brazilian competitiveness and development For the Center-West and North regions in addition to the reduction in transport costs the profitability of economic activities was enhanced by the possibilities of mechanization in the flatlands Last but not least an important factor was agricultural research of the Empresa Brasileira de Pesquisa Agropecuaacuteria (Embrapa) which adapted new cultivars ndash in particular soybeans rice and cotton ndash to the ecological conditions prevailing in the Cerrado areas (Arantes and Souza 1993 Helfand and Rezende 1998 Homma 2003)
Figures 1A to 1F Brazilian Terrain and Evolution of Transportation Infrastructure 1910-1995
Figure 1A Relief Map of Brazil
desiguALdadesnet Working Paper Series No 66 2014 | 5
Figure 1B Railroads in 1910
Figure 1C Roads in 1970
Reis - Historical Perspectives on Regional Income Inequality in Brazil 1872-2000 | 6
Figure 1D Transport Cost (R$ton) to Satildeo Paulo 1970
Figure 1E Roads and Railroads in 1997
1968 Up to 700 700 |- - 1400 1400 |- - 2800 2800 |- - 5600 Over 5600
desiguALdadesnet Working Paper Series No 66 2014 | 7
Figure 1F Transport Cost (R$ton) to Satildeo Paulo 1995
Sources for Figures 1A to 1F Silva (1949 public domain) own elaboration based on Instituto Brasileiro de Geografia e Estatiacutestica (IBGE) and Instituto de Pesquisa Econocircmica Aplicada (IPEA) for Brazilian relief map Ipeadata (2014) for transport costs
3 Spatial Patterns of Growth 1872-2000
This section uses a series of maps to illustrate the spatial patterns of Brazilian development during the 20th century The number of Brazilian municiacutepios (local government units) in Brazilian censuses increased from 642 in 1872 to 1304 in 1920 3951 in 1970 and 5507 in 2000 The changes in number and geographic boundaries of municiacutepios preclude consistent inter-temporal analysis unless municiacutepios are combined into Minimal Comparable Geographic Areas (MCA) Though municiacutepios are the units of observation MCA are the de facto geographic unit of analysis and unless otherwise specified the term municipality refers to MCA 1872-2000 which are shown in Figure A1 of the Appendix Note the North and Center-West regions where settlement and creation of municipalities took place in recent times the MCA are too few and too large thus introducing both visual and statistical distortions
The temporal benchmarks for the analysis are 1872-1919 1919-1949 1949-1980 and 1980-2000 Though primarily determined by the availability of census data they
1995 Up to 700 700 |- - 1400 1400 |- - 2800 2800 |- - 5600 Over 5600
Reis - Historical Perspectives on Regional Income Inequality in Brazil 1872-2000 | 8
provide a fairly broad characterization of the main phases of Brazilian development in the 20th century
Up to 1920 growth was mainly driven by the export of primary commodities particularly coffee and rubber From 1920 to 1950 the country completed the first stage of an import substitution industrialization process based mainly upon a light consumer goods industry From 1950 to 1980 based upon a strong urbanization process and high trade protection import substitution industrialization deepened into durable consumer basic raw material and capital goods industries By the end of this period Brazil was perhaps the most autarkic economy in the world with an import coefficient close to 5 of GDP out of which non-oil imports represented less than 3
After 1980 several negative conditions occurred at the same time the debt crisis hyperinflation and stagnation In the ensuing decades the unavoidable policies were stabilization fiscal adjustment and liberalization which are still ongoing developments Demographically the country faced the end of the urbanization process and the beginning of rapid population ageing During this period agricultural and mineral exports were crucial for growth
Given the above picture of major and fundamental economic changes it would be reasonable to assume that patterns of spatial convergence of income per capital and labor productivity were significantly different in these various development phases of the 20th century (Reis et al 2004)
Figures 2A to 2C map the geographic density of GDP in 1872 1970 and 1996 respectively They show that at least up to 1970 economic activity in Brazil was highly concentrated along the Atlantic coast In 1872 the only significant incursion of economic activity into the Brazilian highlands occurred in the mining areas of the Center-South region which had already been settled during the 18th century The maps show that during most of the 20th century the economic frontier moves in the southwest direction pushed by coffee plantations and industry It was during this period that the city of Satildeo Paulo and its surroundings emerged as the dominant industrial pole of the country After 1970 the density of economic activity turned towards the northwest due to both the change in the location of the federal capital to Brasilia and the expansion of the agricultural frontier with the cultivation of cattle rice corn and soybeans
Figures 3A to 3E show the spatial distribution of income per capita from 1872 to 2000 Since 1872 one observes wide regional disparities of income per capita levels in Brazil The Northeast in particular the semi-arid areas of the hinterland was already the
desiguALdadesnet Working Paper Series No 66 2014 | 9
poorest region of the country The richest areas were located around Rio de Janeiro which was then the capital and the largest port of the country and the cities of Rio Grande do Sul in the extreme south of the country which were then the main ports for the fertile areas of the Pampas The high income per capita levels in the Amazon region are explained by the rubber boom
In 1919 Satildeo Paulo together with Rio Grande do Sul had the highest income per capita levels both areas combined a very productive agricultural sector with emerging manufacturing activities By then the rubber economy in the Amazon had collapsed
The concentration of income per capita in Satildeo Paulo was intensified by the mid-century when the urbanization and import substitution industrialization processes reached their peaks Supplementing the industrial boom of Satildeo Paulo increased cultivation of coffee and soybeans explains the spread of high income per capita towards the southwest areas of Satildeo Paulo and Paranaacute
After 1980 with the end of the urbanization and import substitution processes the high levels of income per capita started to spread towards the agricultural frontier in the Center-West and North regions But Satildeo Paulo and Rio Grande do Sul keep their leading position while the Northeast region lags far behind the rest of the country
Figure 4A to 4E map the distribution of the labor productivity from 1872 The sequence of maps tells much the same story that Figures 4a to 4E do The main difference is perhaps the more homogeneous geographic distribution of productivity levels compared to income per capita levels after 1980 which suggests that part of the differences in income per capita are possibly explained by demographic factors related to the dependency ratio By 2000 both in terms of income per capita and labor productivity there was a clear dividing line in the country from the northwest to the southeast3
Figure 5A presents Lorenz curves for the geographic distribution of GDP in census years 1872 1919 1940 1980 and 2000 The curves display extreme levels of spatial concentration in economic activity which remains practically unchanged from 1872 to 2000 notwithstanding the process of territorial dispersion in the density of economic activity observed in Figures 2A to 2C The explanation for this puzzle lies to a large extent in the patterns of industrialization and organization processes which were highly concentrated in relatively small areas Due to its natural geographic concentration mining activities (iron ore in particular) played a subsidiary role Agricultural activities were the
3 Curiously enough this line coincides with the tropical convergence zone generated by the El-NintildeoSouthern Oscillation (ENSO) climate event
Reis - Historical Perspectives on Regional Income Inequality in Brazil 1872-2000 | 10
counteracting forces Thus a careful look at the graphs shows that concentration is slightly smaller in 1919 and 2000 in both cases after long periods of agricultural export led growth The difference however is clearly not that significant
Finally Figure 5B presents Lorenz curves for the municipal income per capita distribution for the same census years as before In per capita terms the highest levels of spatial concentration occurred in 1872 The Lorenz curve for this period practically dominates the curves for all the other years Conversely the lowest levels of spatial concentration occurred in 2000 which is practically dominated by the curves for all the other years
The secular process of spatial dispersion of income per capita from 1872 to 2000 was far from monotonic however The Lorenz curves display a strong dispersion of the spatial distribution of income per capita in the periods 1872-1919 when the economy was driven by coffee and rubber exports and in 1970-2000 when the expansion of the agricultural frontier in the Cerrado areas of the Center-West region combined with the emergence of government regional policies In contrast there is a strong concentration process from 1919 to 1970 during the heyday of the urbanization and import substitution industrialization processes It should be kept mind however that growth rates of the economy were significantly higher during this later period
Figure 2A to 2C Geographic Density of GDP (R$km2) in 1872 1970 and 1996
thousand Reacuteis km2
0 |- - 50 50 |- - 100 100 |- - 200 200 |- - 400 400 |- - 800 Above 800
desiguALdadesnet Working Paper Series No 66 2014 | 11
Source for Figures 2A to 2C IPEA Authorrsquos estimates Maps for 1970 and 1996 use MCA 1970-2000 and map 1872 uses MCA 1872-2000
R$ (2000) km2 0 |- - 3000 3000 |- - 9000 9000 |- - 27000 27000 |- - 81000 Above 81000
R$ (2000) km2 0 |- - 3000 3000 |- - 9000 9000 |- - 27000 27000 |- - 81000 Above 81000
Reis - Historical Perspectives on Regional Income Inequality in Brazil 1872-2000 | 12
Figures 3A-E and 4A-E Geographic Distribution (MAC 1872-2000) of Income per Capita (GDPPopulation) and of Labor Productivity (GDPLabor force) in 1872 1919 1949 1980 and 2000 (Units and Scale Variable)
Figure 3A Income per Capita by Municipalities 1872 (GDPPopulation)
Figure 4A Labor Productivity by Municipalities 1872 (GDPLabor Force)
thousand Reacuteis 0 |- - 20 20 |- - 40 40 |- - 80 80 |- - 160 160 |- - 320 Above 320
thousand Reacuteis 0 |- - 50 50 |- - 100 100 |- - 200 200 |- - 400 400 |- - 800 Above 800
desiguALdadesnet Working Paper Series No 66 2014 | 13
Figure 3B Income per Capita by Municipalities 1919 (GDPPopulation)
Figure 4B Labor Productivity by Municipalities 1919 (GDPLabor Force)
R$ (2000) 0 |- - 90 90 |- - 180 180 |- - 360 360 |- - 540 540 |- - 1080 Above 1080
R$ (2000) 0 |- - 0060 0060 |- - 0120 0120 |- - 0240 0240 |- - 0480 0480 |- - 0960 Above 0960
Reis - Historical Perspectives on Regional Income Inequality in Brazil 1872-2000 | 14
Figure 3C Income per Capita by Municipalities 1949 (GDPPopulation)
Figure 4C Labor Productivity by Municipalities 1949 (GDPLabor Force)
R$ (2000) 0 |- - 250 250 |- - 500 500 |- - 1000 1000 |- - 1500 1500 |- - 3000 Above 3000
Thousand R$ (2000) 0 |- - 03 03 |- - 06 06 |- - 12 12 |- - 24 24 |- - 48 Above 48
desiguALdadesnet Working Paper Series No 66 2014 | 15
Figure 3D Income per Capita by Municipalities 1980 (GDPPopulation)
Figure 4D Labor Productivity by Municipalities 1980 (GDPLabor Force)
Cr$ 0 |- - 1000 1000 |- - 2000 2000 |- - 3000 3000 |- - 4000 4000 |- - 7000 Above 7000
Thousand R$ (2000) 0 |- - 25 25 |- - 50 5 |- - 10 10 |- - 20 20 |- - 40 Above 40
Reis - Historical Perspectives on Regional Income Inequality in Brazil 1872-2000 | 16
Figure 3E Income per Capita by Municipalities 2000 (GDPPopulation)
Figure 4E Labor Productivity by Municipalities 1980 (GDPLabor Force)
Source for Figures 3A-E and 4A-E IBGE and author estimates
R$ 0 |- - 70 70 |- - 140 140 |- - 210 210 |- - 280 280 |- - 420 Above 420
Thousand R$ (2000) 0 |- - 25 25 |- - 50 5 |- - 10 10 |- - 20 20 |- - 40 Above 40
desiguALdadesnet Working Paper Series No 66 2014 | 17
Figure 5A Lorenz Curves for the Distributions of Municipal GDP according to Geographic Areas of Municipalities 1872-2000
Figure 5B Lorenz Curves for the Municipal Distributions of GDP according to Municipal Population 1872-2000
Source for Figures 5A and 5B Dataset complied by author from IBGE and own estimates
GD
P
Population
GD
P
Area
Reis - Historical Perspectives on Regional Income Inequality in Brazil 1872-2000 | 18
4 Secular Convergence of Labor Productivity and Income per Capita in Brazil 1872-2000
This section estimates econometric models of spatial convergence of income per capita and labor productivity in Brazil from 1872 to 2000 Specifications were restricted to simple models of spatial convergence
In the simple growth equations specified for each dependent variable ndash income per capita or labor productivity ndash the growth rate is a simple function of the level of the variable in the initial period The basic specification of the convergence model is thus
(1) log (yit yit-n ) 1n = α + β log (yi t-n) where yit= (Yit Popit) is GDP per capita (or GDP per labor force) in municipality i census year tYit is GDP per capita in municipality i census year tPopit is population (or labor force) in municipality i census year tβ is a estimated coefficient that measures the speed of convergence of income per capita (or labor productivity) of municipalities when the value is negative poorer municipalities grow faster and thus the municipal distribution of income per capita converges conversely when the value is positive richer municipalities grow faster and thus the municipal distribution of income per capita diverges
Estimation was made for the sample of minimum comparable areas of Brazilian municipalities in the period 1872 to 2000 (MAC 1872-2000) and separately for the main Brazilian regions as well for the sub-periods 1872-1919 1919-1949 1949-1980 and 1980-2000 for Brazil as whole The results of OLS (Ordinary Least Square) estimations are presented in Tables 1 to 4 below
Table 1 shows a quite good adjustment ndash corrected R2 equal to 043 ndash for the growth of income per capita for the period from 1872 to 2000 That is 43 of the growth of income per capita of Brazilian municipalities in the period 1872-2000 is explained solely by the level of income per capita in 1872 The estimated speed of convergence β is -00046 negative and highly significant thus implying convergence in the distribution of income per capita of Brazilian municipalities from 1872 to 2000 The value of estimates say that 1 more of income per capital in 1872 brings a reduction of 00046 in the annual average growth rates of the municipality in the period 1872-2000
desiguALdadesnet Working Paper Series No 66 2014 | 19
Table 2 presents analogous results for the productivity of labor (income per worker) of Brazilian municipalities from 1872 to 2000 in this case with R2 equal to 015 and β equal to -00037 The smallest speed of convergence for productivity suggests that the growth of the ratio populationlabor force (dependency ratio) was in some way divergent during the same period
Estimations of the model for the selected sub-periods show that in all of them there was convergence of income per capita among Brazilian municipalities The values of β were significantly negative in all sub-periods The absolute magnitude of the parameters show that the speed of convergence was significantly larger in the periods 1872-1920 and 1980-2000 when the absolute value of β is larger than 001 In the other two sub-periods the speed of convergence was smaller particularly in the period 1919-49 when the absolute value of β is approximately 00057
The interpretation suggested is that import substitution phases were associated with urban concentration and exploitation of economies of scale as well as of agglomeration thus implying relatively slow decrease in the municipal inequality of both labor productivity and income per capita On the other hand export led growth phases were characterized by intense use of land and other natural resources and the spatial dispersion of economic activities thus implying a much faster convergence of labor productivity and income per capita of municipalities It should be observed however that average growth rates were much higher in the import substitution phases
Table 1 Brazil Convergence of the Municipal Distribution (AMC 1872-2000) Income per Capita (GDPPopulation) for Selected Sub-Periods from 1872 to 2000
Dependent variable
Log(GDPPOP)
Log(GDPPOP)
Log(GDPPOP)
Log(GDPPOP)
Log(GDPPOP)
Region Brazil Brazil Brazil Brazil Brazil
Period 1872-2000 1872-1919 1919-1949 1949-1980 1980-2000
N 380 380 427 430 431
R2 corr 043 036 0038 045 001
Beta -00046 -0012 -00058 -0013 -0002
Std error -00003 -00008 -00014 -00007 -00008
Reis - Historical Perspectives on Regional Income Inequality in Brazil 1872-2000 | 20
Table 2 Brazil and regions Convergence of the municipal distribution (AMC 1872-2000) of income per capita (GDPPopulation) for main regions in the period 1872-2000
Dependentvariable
Log (GDPPOP)
Log (GDPPOP)
Log (GDPPOP)
Log (GDPPOP)
Log (GDPPOP)
Log (GDPPOP)
Region Brazil North Northeast Center-South
South Center-West
Period 1872-2000 1872-2000 1872-2000 1872-2000 1872-2000 1872-2000
N 380 14 190 134 20 18
R2 corr 043 059 073 077 083 025
Beta -00046 -0007 -0006 -0007 -0006 -0006
Std error -00003 -00015 -00003 -00003 -00006 -00021
Table 3 Brazil Convergence of the municipal distribution (MAC 1872-2000) of labor productivity (GDPLabor force) for selected sub-periods from 1872 to 2000
Dependent variable
Log(GDPLF)
Log(GDPLF)
Log(GDPLF)
Log(GDPLF)
Log(GDPLF)
Region Brazil Brazil Brazil Brazil Brazil
Period 1872-2000 1872-1919 1919-1949 1919-1980 1980-2000
N 380 380 na 427 431
R2 corr 015 020 na 009 018
Beta -00034 -0011 na -00042 -0014
Std error -00005 0001 na -00006 -00014
desiguALdadesnet Working Paper Series No 66 2014 | 21
Table 4 Brazil and regions Convergence of the municipal distribution (MAC 1872-2000) of labor productivity (GDPLabor force) for main regions in the period 1872-2000
Dependent variable
Log(GDPLF)
Log(GDPLF)
Log(GDPLF)
Log(GDPLF)
Log(GDPLF)
Log (GDPPEA)
Region Brazil North Northeast Center-South
South Center-West
Period 1872-2000 1872-2000 1872-2000 1872-2000 1872-2000 1872-2000
N 380 14 190 134 20 18
R2 corr 015 059 023 027 074 013
Beta -00034 -0007 -0004 -0005 -0008 -0005
Std error -00005 -00017 -00006 -00007 -00001 -00027
Source for Tables 1-4 Dataset compiled by author from IBGE and own estimates Note labor force in 1949 was not compiled when estimations were made
A complementary observation is that absolute values of β in all sub-periods are significantly larger than the one estimated for the 1872-2000 period as a whole Thus the processes of convergence of income per capita in the different sub-periods are not reinforcing but reversing themselves
Compared to other countries the historical process of convergence of municipal income per capita in the Brazilian economy seems quite slow Indeed estimates of β are close to -002 both in the case of personal income in the US states in the period 1950-80 and of income per capita in Japan in the period 1955-87 (Barro and Sala-i-Martin 1995) Equivalent estimates for income per capita of municipalities in Japan are -0025 for the period 1951-70 and -0003 for the period 1970-2000 Despite all the differences in variables units of observation and methods of estimation the estimates (except for Italy in recent decades) are twice the magnitude of those estimated for Brazil in the periods 1950-80 and 1980-2000
For the whole period 1872-2000 estimations were disaggregated by main regions North (NO) Northeast (NE) Center-South (CS) South (SU) and Center-West (CO) ndash to get a more detailed picture of geographic patterns of convergence of income per capita and labor productivity
Reis - Historical Perspectives on Regional Income Inequality in Brazil 1872-2000 | 22
Table 3 and 4 present the regional decomposition of the analysis of convergence of income per capita for the whole period 1872-2000 Though the samples in the case of the North and North regions are relatively small including 14 and 18 observations respectively estimates of β are negative and significant for all regions (at 8 for the Center-West however)
Comparing the magnitudes of β in Table 4 the speed of convergence was significantly higher in the South region where β is estimated to be equal to -00086 compared to -00069 in the North Region and even lower in the remaining three regions where estimated values are very similar ranging from -00053 and -00055
In all the regions however the speed of convergence was higher (β were larger) than in Brazil as a whole That implies a process of regional divergence which counteracts the processes of spatial convergence inside each region The concentration of import substitution industrialization in the Center-South region of the country and the marked regional contrasts in soil quality and agricultural development were undoubtedly major factors in the slow process of regional convergence
5 Sectorial Growth Convergence 1920-2000
In what follows the analysis of growth convergence for 1920-200 will be detailed in two ways First by the disaggregation of the analysis for urban and rural activities And second by the specification of a conditional model which uses variables like infrastructure geographical attributes institutions and human capital among other to explain the growth of municipalities from 1920 to 20004
For the period 1920-2000 the economic censuses allow the estimation of separate convergence equations for labor productivity in rural (agriculture) and urban (non-agricultural) activities The sectorial disaggregation is not performed for income per capita simply because the Census of 1920 did not collect data on rural and urban population despite collecting data on labor force (economically active population PEA) according to major economic activities
Before coming to the regression results it is interesting to observe that in the period 1920-2000 average municipal growth rates were higher for income per capita (33 pa) than for labor productivity (30 pa) thus indicating that on average the labor force grew faster than the population that is the average dependency ratio decreased
4 It was not possible to extend the analysis to1872 because to estimate income per capita for this year it was necessary to use all the conditional variables available thus unavoidably introducing problems of endogeneity
desiguALdadesnet Working Paper Series No 66 2014 | 23
Another interesting finding is that average growth of labor productivity was higher in agriculture (26 pa) than in urban activities (24 pa) To a large extent the explanation lies in the weight of the service sector and all kinds of low productivity informal activities in the growth of urban output and employment
OLS results for convergence equation are presented in Table 5 Adjusted correlation coefficients are small compared to the estimates obtained for 1872-2000The speed of convergence was negative and significant as attested by the t-statistics Convergence was faster for labor productivity than for income per capita both however were extremely low in comparison to other countries The faster convergence of labor productivity is difficult to interpret without further analysis of demographic patterns of growth (that is fertility mortality and migration rates) in rural and urban areas during this period
Table 5 Brazil Convergence of Income per Capita (GDPPopulation) and of Labor Productivity (GDPLabor Force) in Urban and Rural Activities in the Period 1872-2000
Dependent variable
Log(GDPPOP)
Log(GDPLF)
Log(GDPLFR)
Log(GDPLFU)
N 430 430 427 429
R2 Corr 007 012 018 012
LOG_GDPPOP_1920 -00030
t-value -57681
LOG_GDPLABOR FORCE_1920 -00040
t-value -77621
LOG_GDPLABOR FORCE_AGR_1920 -00051
t-value -98677
LOG_GDPLABOR FORCE_URB_1920 -00067
t-value -76907
Source Analysis of dataset compiled by author from IBGE and own estimates
Reis - Historical Perspectives on Regional Income Inequality in Brazil 1872-2000 | 24
Convergence equation for the growth of labor productivity in rural and urban activities in the 1920-2000 period show that the speed of convergence was much faster for urban activities though both still very low compared to international standards This result sounds reasonable given the relatively footloose characteristics of urban activities while agriculture depends on the availability of adequate soils and climate which are concentrated in some areas in the South and Center-West regions
Finally it is interesting to observe that both rural and urban activities show a higher speed of convergence than aggregate labor productivity in the economy thus suggesting that there were synergies and cross-correlations between the processes of growth in labor productivity in both sectors Rural and labor productivity grew faster or slower in the same areas thus characterizing patterns of growth high-high or low-low in both sectors
6 Factors Conditioning Convergence Patterns 1920-2000
To analyze the determinants of the growth pattern of the Brazilian economy in the period 1920-2000 the specifications of the growth convergence equations are enlarged to incorporate the determinants of steady state growth rates of Brazilian municiacutepios By assumption the steady state growth of the municiacutepios depend on major economic social and geographic conditions prevailing in each municipality in 1920
In the case of the growth of GDP per capita the model to be estimated becomes
(2) log (yityit-n) 1n = α + βlog (yit-n) + γXit-n where yit= Yit Popit ( or Yit Laborit) is the total urban or rural GDP per capita (per labor force) of municiacutepio i in year t Yit is total urban or rural GDP of municiacutepio i in year t Popit is total urban or rural population of municiacutepio i in year t Laborit is total urban or rural labor force of the municiacutepio i in year t Xit-n = matrix of explanatory variables including all the arguments that condition the steady-state rate of growth of Brazilian municipalities from 1920 to 2000
The variables included as conditioning or explanatory factors are listed in Table 6 The list includes major characteristics of the municipalities in terms of geography (area latitude longitude altitude temperature precipitation soil types etc) demography (population foreign population labor force) economy (GDP by sectors landownership concentration electricity generation area of farms share of coffee in cultivated area)
desiguALdadesnet Working Paper Series No 66 2014 | 25
accessibility and transport (existence and age of railway station distance to sea distance to capital potential market index) human capital and education (literacy enrollment in and number of primary schools) and a few institutional dimensions like the number of slaves in 1872 and the number of voters in 1910 Most of the variables refer to 1920 The exceptions are schools and voters which were not available for 1920 and for obvious reasons slavery and geographic conditions A detailed description of their definition and measurement is presented in the database appendix
Estimation results presented in Table 7 show that initial socio-economic conditions in 1920 explain more that 50 of the variance of the growth rates of Brazilian municipalities in the period 1920-2000 Note that the simple growth convergence equation of Table 5 explains around 15
The speed of convergence is approximately equal to 1 for both income per capita and labor productivity Thus municipalities which were 1 richer in 1920 show on average a rate of growth 001 smaller in the period 1920-2000 For urban and agricultural activities the estimates for GDP per worker are 12 approximately These values are relatively small given that we are talking about conditional growth That is comparing municipalities which had the same initial conditions Thus even in this case the speed of convergence is slow in comparison with other countries
To identify the most important growth conditioning factor we use the threshold of 5 significance level for the t-statistics In Table 6 the variables which pass the threshold criteria and therefore are considered significant growth factors are highlighted A careful look shows that population in 1920 is not significant in all the equations (marginally in the case of the growth labor productivity) but is kept as a normalizing variables for all the other variables demographic variables Some variables with a high incidence of null observations however were specified in per capita terms
The most important variable is the dummy for the existence of a railway station in 1920 Ceteris paribus that would imply an increase of 14 per annum in average growth rates from 1920-2000 This has a huge impact hardly believable but results were double checked
Reis - Historical Perspectives on Regional Income Inequality in Brazil 1872-2000 | 26
Table 6 Factors Conditioning Municipal Convergence Patterns 1920-2000
Variable label Definition
AE20_THEIL_T Theil index of landownership inequality in 1920
ANO_DUMMY_ESTACAO_FERR
Dummy for the inaugural year of railway in the municipality
ANO_DUMMY_GER_ENERGIA Dummy for the inaugural year of electricity in the municipality
DIST_CAP_UF Geodesic distance to the state capital (in km)
DSHOR Geodesic distance to the sea (in km)
DUMMY_CAPITAL Dummy for state capital
DUMMY_ESTACAO_FERR Dummy for the existence of railway station in 1872
DUMMY_GER_ENERGIA Dummy for the existence of electricity generation station in 1872
ELEITORESPC1910 Number of registered voters in 1914Population in 1920
ESCOLAS_EP_EST_PC_1910 Number of state primary schools in 1920 Population in 1920
ESCOLAS_EP_MUN_PC_1910 Number of private primary schools in 1920 Population in 1920
LAT_GRAUS Latitude of seat of municipality
LOG_AEAGP20 LOG (Area of agricultural establishments in 1920)
LOG_ALFAB1920 LOG (Literates in 1920)
LOG_AREAMUN LOG (Geographic area of MAC)
LOG_ESTR1920 LOG (Foreigners in 1920)
LOG_PEA1920 LOG (PEA1920)
LOG_PEAAGR1920 LOG (PEAAGR1920)
LOG_PEAMANUF1920 LOG (PEAMANUF1920)
LOG_PIBPC_19 LOG (PIBPC1919)
LOG_PIBPC_19_00 LOG ((PIBPC2000 PIBPC1919) (1(2000-1919)))
LOG_PIBPEA_19 LOG (PIBPEA1919)
LOG_PIBPEA_19_00 LOG ((PIBPEA2000 PIBPEA1919) (1(2000-1919)))
LOG_PM_PIB1919 LOG (PM_PIB1919)
LOG_POP1920 LOG (POP1920)
LONG_GRAUS Longitude of municipality seat
MATR_EP_EST_PC_1910 Students enrolled in public primary school 1920Population 1920
MATR_EP_MUN_PC_1910 Students enrolled in private primary school 1920Population 1920
desiguALdadesnet Working Paper Series No 66 2014 | 27
MOTORES_NUMERO Number of electrical motors in municipality 1920
MOTORES_POTENCIA Power of electrical motors in municipality 1920 (Kwh)
NUM_EMPRESAS Number of enterprises generating hydroelectricity 1920
PAC_CAF20 Crop area of coffee 1920 Area of farms 1920
PALT1 Share of municipal area with elevation 0 to 99 m
PALT3 Share of municipal area with elevation 200 to 499 m
PALT4 Share of municipal area with elevation 500 to 799 m
PALT5 Share of municipal area with elevation 800 to 1199 m
PALT6 Share of municipal area with elevation 1200 to 1799 m
PALT7 Share of municipal area with elevation 1800 to 3000 m
PERO1 Share of municipal area with moderate erosion (75 to 15 declivity)
PERO2 Share of municipal area with strong erosion (30 to 45 declivity)
PRE30DJF Average precipitation Dec-Feb 1961-90
PRE30JJA Average precipitation Jun-Aug 1961-90
PRE30MAM Average precipitation Mar-May 1961-90
PRE30SON Average precipitation Sep-Nov 1961-90
PSOLO1 Share of municipal soil in class 1
PSOLO10 Share of municipal soil in class 10
PSOLO11 Share of municipal soil in class 11
PSOLO12 Share of municipal soil in class 12
PSOLO2 Share of municipal soil in class 2
PSOLO3 Share of municipal soil in class 3
PSOLO4 Share of municipal soil in class 4
PSOLO5 Share of municipal soil in class 5
PSOLO6 Share of municipal soil in class 6
PSOLO7 Share of municipal soil in class 7
PSOLO8 Share of municipal soil in class 8
PSOLO9 Share of municipal soil in class 9
SLVRY_POP_1872 Share of slaves in total population 1872
TMP30DJF Average temperature Dec-Feb 1961-90
TMP30JJA Average temperature Jun-Aug 1961-90
TMP30MAM Average temperature Mar-May 1961-90
TMP30SON Average temperature Sep-Nov 1961-90
Reis - Historical Perspectives on Regional Income Inequality in Brazil 1872-2000 | 28
Table 7 Brazil OLS Estimation of Conditional Growth Convergence of GDP per Capita and Labor Productivity in Urban and Rural Activities 1920-2000 (pib14si)
Statistics and explanatory variables
LOG_GDPPOP20001920
LOG_GDPLF20001920
LOG_GDPLFR20001920
LOG_GDPLFU20001920
1 N 397 397 395 3972 F-value 719 690 860 6633 R2 055 054 060 0534 Adj R2 048 046 053 0455 Dependent Mean 003 003 003 0026 Root MSE 001 001 001 0017 Coeff Var 1657 1842 3207 22858 Variable9 Intercept -01880 -01546 -00650 -0098110 t-value -27283 -22951 -06184 -1444911 Pr gt |t| 00067 00223 05367 0149412 LOG_PIBPC_19 -0010413 t-value -10491814 Pr gt |t| 0000015 LOG_PIBPEA_19 -0010216 t-value -10467217 Pr gt |t| 0000018 LOG_PIBPEA_AGR_19 -0012119 t-value -14518420 Pr gt |t| 0000021 LOG_PIBPEA_URB_19 -0012422 t-value -10845223 Pr gt |t| 00000
LOG_POP1920 -00041 -00054 -00055 -00028 t-value -13512 -18475 -12113 -09613 Pr gt |t| 01775 00655 02266 03371
24 DUMMY_CAPITAL 00050 00038 00004 0003225 t-value 26211 20429 01498 1672326 Pr gt |t| 00092 00418 08810 0095427 DIST_CAP_UF 00000 00000 00000 0000028 t-value 01261 05330 35012 -0292329 Pr gt |t| 08997 05944 00005 0770230 DUMMY_ESTACAO_FERR 01484 01414 -00663 01531
desiguALdadesnet Working Paper Series No 66 2014 | 29
Statistics and explanatory variables
LOG_GDPPOP20001920
LOG_GDPLF20001920
LOG_GDPLFR20001920
LOG_GDPLFU20001920
31 t-value 25635 24984 -07484 2682032 Pr gt |t| 00108 00129 04547 0007733 ANO_DUMMY_ESTACAO_FERR -00001 -00001 00000 -0000134 t-value -25662 -25010 07755 -2694135 Pr gt |t| 00107 00129 04386 0007436 DUMMY_GER_ENERGIA 02772 02982 02539 0340237 t-value 14047 15456 08487 1746038 Pr gt |t| 01610 01231 03966 0081739 ANO_DUMMY_GER_ENERGIA -00001 -00002 -00001 -0000240 t-value -14045 -15459 -08417 -1747841 Pr gt |t| 01611 01231 04005 0081442 NUM_EMPRESAS 00011 00011 -00002 0001243 t-value 20624 20448 -02723 2186244 Pr gt |t| 00399 00416 07856 0029545 MOTORES_NUMERO -00007 -00007 -00001 -0000746 t-value -18516 -18946 -01493 -1858947 Pr gt |t| 00650 00590 08814 0063948 MOTORES_POTENCIA 00000 00000 00000 0000049 t-value 20081 21814 -12458 2188750 Pr gt |t| 00454 00298 02137 0029351 LOG_POP1920 -00041 -00054 -00055 -0002852 t-value -13512 -18475 -12113 -0961353 Pr gt |t| 01775 00655 02266 0337154 LOG_ESTR1920 00011 00009 00020 0000655 t-value 26290 23265 34160 1665256 Pr gt |t| 00090 00206 00007 0096857 LOG_ALFAB1920 00005 00001 00043 -0002358 t-value 03315 00771 18698 -1527559 Pr gt |t| 07404 09386 00624 0127660 LOG_PEAMANUF1920 -00001 00000 -00006 0000461 t-value -01340 -00603 -04930 0503462 Pr gt |t| 08935 09519 06224 0615063 LOG_PEAAGR1920 00017 00015 00116 0000464 t-value 08397 07703 34936 0186965 Pr gt |t| 04017 04416 00005 0851866 LOG_PEA1920 -00002 00017 -00138 00030
Reis - Historical Perspectives on Regional Income Inequality in Brazil 1872-2000 | 30
Statistics and explanatory variables
LOG_GDPPOP20001920
LOG_GDPLF20001920
LOG_GDPLFR20001920
LOG_GDPLFU20001920
67 t-value -00703 04981 -24563 0853868 Pr gt |t| 09440 06188 00145 0393869 LOG_AEAGP20 00010 00010 00024 0000770 t-value 17687 17760 27657 1375671 Pr gt |t| 00778 00766 00060 0169972 PAC_CAF20 -00053 -00065 00080 -0000873 t-value -06211 -07814 06178 -0093074 Pr gt |t| 05349 04351 05371 0926075 SLVRY_POP_1872 00067 00063 00004 0006476 t-value 16343 15810 00696 1591177 Pr gt |t| 01031 01148 09445 0112578 ELEITORESPC1910 -00111 -00045 -00701 0001779 t-value -04764 -01986 -20039 0075480 Pr gt |t| 06341 08427 00459 0939981 LOG_PM_PIB1919 00071 00066 -00025 0005882 t-value 35692 33935 -07406 2953183 Pr gt |t| 00004 00008 04594 0003484 AE20_THEIL_T 00003 00003 00001 0000185 t-value 04087 05182 01491 0228386 Pr gt |t| 06830 06047 08815 0819587 MATR_EP_EST_PC_1910 -01276 -01082 00181 -0077388 t-value -15949 -13828 01488 -0976589 Pr gt |t| 01117 01676 08818 0329590 MATR_EP_MUN_PC_1910 00843 00819 01579 0105791 t-value 05047 05016 06266 0643392 Pr gt |t| 06141 06163 05314 0520593 ESCOLAS_EP_EST_PC_1910 23003 19783 04872 0755094 t-value 07290 06414 01017 0241695 Pr gt |t| 04665 05217 09191 0809396 ESCOLAS_EP_MUN_PC_1910 33128 25821 -06837 -0899397 t-value 04645 03704 -00637 -0128198 Pr gt |t| 06426 07113 09493 0898199 LOG_AREAMUN 00003 00005 -00009 00002100 t-value 05187 07604 -08914 03229101 Pr gt |t| 06043 04475 03733 07470102 LAT_GRAUS -00003 -00002 -00015 00000
desiguALdadesnet Working Paper Series No 66 2014 | 31
Statistics and explanatory variables
LOG_GDPPOP20001920
LOG_GDPLF20001920
LOG_GDPLFR20001920
LOG_GDPLFU20001920
103 t-value -13391 -09964 -39801 -01052104 Pr gt |t| 01814 03197 00001 09163105 LONG_GRAUS 00001 00001 00002 00000106 t-value 02703 05982 04958 -00713107 Pr gt |t| 07871 05501 06204 09432108 DSHOR 00000 00000 00000 00000109 t-value 20176 21437 06032 08593110 Pr gt |t| 00444 00328 05468 03908111 TMP30DJF -00021 -00014 -00061 00004112 t-value -13517 -09068 -25980 02564113 Pr gt |t| 01774 03652 00098 07978114 PRE30DJF -00001 00000 00000 00000115 t-value -21889 -15315 08177 -17019116 Pr gt |t| 00293 01266 04141 00897117 TMP30MAM 00019 00011 00055 -00014118 t-value 12284 07619 23496 -08907119 Pr gt |t| 02202 04467 00194 03737120 PRE30MAM 00000 00000 00000 00000121 t-value 18216 12725 00645 01999122 Pr gt |t| 00694 02041 09486 08416123 TMP30JJA -00013 -00004 -00051 00009124 t-value -10428 -03344 -26939 07548125 Pr gt |t| 02978 07383 00074 04509126 PRE30JJA 00000 00000 00001 00000127 t-value -21740 -12450 33882 -10425128 Pr gt |t| 00304 02140 00008 02979129 TMP30SON 00010 00001 00074 -00006130 t-value 07146 00675 34985 -04359131 Pr gt |t| 04754 09462 00005 06632132 PRE30SON 00000 00000 -00001 00000133 t-value 05981 00027 -14641 09197134 Pr gt |t| 05502 09979 01441 03584135 PERO1 -00057 -00054 -00057 -00032136 t-value -14720 -14237 -09685 -08435137 Pr gt |t| 01419 01555 03335 03995138 PERO2 -00047 -00044 -00061 -00035
Reis - Historical Perspectives on Regional Income Inequality in Brazil 1872-2000 | 32
Statistics and explanatory variables
LOG_GDPPOP20001920
LOG_GDPLF20001920
LOG_GDPLFR20001920
LOG_GDPLFU20001920
139 t-value -12234 -11717 -10330 -09225140 Pr gt |t| 02220 02421 03023 03569141 PALT1 00070 00068 00056 00086142 t-value 31364 31016 16783 38945143 Pr gt |t| 00019 00021 00942 00001144 PALT3 -00019 -00028 00017 -00007145 t-value -08273 -12581 05007 -03295146 Pr gt |t| 04087 02092 06169 07420147 PALT4 00006 00003 00079 00025148 t-value 02297 01348 20563 09805149 Pr gt |t| 08185 08928 00405 03276150 PALT5 00016 00001 00005 00014151 t-value 04553 00364 00854 03910152 Pr gt |t| 06492 09710 09320 06960153 PALT6 -00074 -00052 00063 -00017154 t-value -06311 -04524 03551 -01460155 Pr gt |t| 05284 06513 07227 08840156 PALT7 -01314 -01265 01054 -01253157 t-value -09169 -09030 04877 -08881158 Pr gt |t| 03599 03671 06261 03751159 PSOLO1 01581 01435 00616 00935160 t-value 25355 23542 06540 15234161 Pr gt |t| 00117 00191 05136 01286162 PSOLO2 01598 01449 00577 00954163 t-value 25638 23786 06131 15552164 Pr gt |t| 00108 00179 05402 01208165 PSOLO3 01436 01285 00536 00802166 t-value 22623 20701 05591 12846167 Pr gt |t| 00243 00392 05764 01998168 PSOLO4 01498 01363 00565 00871169 t-value 23977 22332 05998 14172170 Pr gt |t| 00170 00262 05490 01573171 PSOLO5 01487 01346 00483 00906172 t-value 23903 22142 05144 14810173 Pr gt |t| 00174 00275 06073 01395174 PSOLO6 01559 01414 00606 00916
desiguALdadesnet Working Paper Series No 66 2014 | 33
Statistics and explanatory variables
LOG_GDPPOP20001920
LOG_GDPLF20001920
LOG_GDPLFR20001920
LOG_GDPLFU20001920
175 t-value 25000 23194 06436 14932176 Pr gt |t| 00129 00210 05203 01363177 PSOLO7 01598 01451 00590 00957178 t-value 25555 23740 06255 15557179 Pr gt |t| 00110 00182 05321 01207180 PSOLO8 01578 01432 00581 00944181 t-value 25109 23317 06121 15273182 Pr gt |t| 00125 00203 05409 01276183 PSOLO9 01606 01479 00833 00839184 t-value 24596 23179 08450 13062185 Pr gt |t| 00144 00211 03987 01924186 PSOLO10 01562 01412 00580 00916187 t-value 24996 23110 06149 14899188 Pr gt |t| 00129 00214 05390 01372189 PSOLO11 01462 01310 00550 00833190 t-value 23627 21662 05892 13682191 Pr gt |t| 00187 00310 05561 01722192 PSOLO12 -00486 -00682 03090 -01591193 t-value -01176 -01687 04948 -03904194 Pr gt |t| 09064 08661 06211 06965
Source Authoracutes estimation (regrpib09sia) The suffix p denotes percent of population or area Coefficients significant at 5 level are highlighted in grey
One possible explanation would be that railroad stations are capturing the effects of omitted variables related to transportation costs accessibility and other previous locational advantages Note however that the huge effect is restricted to urban activities growth rates of agricultural productivity were not significantly affected by the existence of a railroad in 1920 The age of the railway station also have a small but significant positive effect on the average growth rate Municipalities gaining early access to railways have had a lasting growth advantage To be a state capital was also an important factor for the secular growth rate of both income per capita and labor productivity The increase in average growth rates in the period 1920-2000 are 05 for GDP per capita and 04 for GDP per worker Surprisingly when we disaggregate the analysis for labor productivity the effect is only marginally significant in the growth for urban activities and as expected not significant for the growth of
Reis - Historical Perspectives on Regional Income Inequality in Brazil 1872-2000 | 34
agricultural productivity The distance to a state capital however had a positive effect on the growth rate of labor productivity in agriculture but none on the other dependent variables It looks like as the consequence of home markets effects or some form of access to technology since capital cities are both richer and more populated and also sources of knowledge and human capital
Other infrastructure variables with significant effects have to do with electricity generation Both the number of companies of electricity generation installed in a municipality in 1920 and their capacity of generation (in kw) in that same year had a significant positive effect on the secular growth rate of GDP per capita and per worker Each additional company brings 01 of increase in the annual average secular growth of the municipality The effect is wholly due to industry Growth rates of GDP per worker in agriculture are not affected by electricity infrastructure as we should expect given the fact most of the energy infrastructure is located in urban centers Apart from infrastructure the other important factor is the potential market of the municipality in 1920 measured by the average GDP of Brazilian municipalities weighted by the inverse of their geographic distances to the municipality in case Each percent implied 0001 more of average growth rates in 1920-2000 Thus municipalities that were close to rich markets in 1920 grew more in the 1920-2000 period Thus agglomeration effects were important and demand as well as historical accidents could have been important factors of growth
The foreign born population was also an important factor of productivity and income per capita growth Interestingly however the effect was mainly felt in the growth of agricultural productivity For the growth of urban productivity it was not significant Suggested explanations for its importance in agriculture are capital technology human capital as well as institutional innovations brought by immigrants It could as well be that migrants anticipated the agricultural prospects of the areas for where they migrated Note however that coffee as percent of agricultural establishments is not significant In addition if their long run growth prospection methods were not likely to be accurate especially if we consider that they were relatively ignorant about the country Agricultural activities also tend to show some inertial or cumulative features in that the growth of agricultural productivity was higher in the municipalities with a larger labor force in agriculture and areas with a larger share of agricultural establishments in 1920 Note however that the size of total labor force tends to decrease the growth of agricultural productivity
Geographic variables have some expected effects and other quite surprising Temperature and precipitation on income per capita and moreover soil quality
desiguALdadesnet Working Paper Series No 66 2014 | 35
are significant for per capita growth suggesting that a state dummy that should be introduced See the joint significance tests in Table 8 below
Finally the model tests the importance of some institutional conditions of the municipalities As proxies of institutional conditions were included the share of slaves in total population in 1872 Theil index for land ownership concentration in 1920 a group of variables related to education including the literacy rate of population in 1920 and four other variables describing the availability of schools as well as the attendance of schools in 1907 and finally political participation in 1914 as measured by the share of registered voters in total population
Surprisingly however all the institutional proxies selected when considered in isolation or jointly were not statistically significant (at the 5 level) for the growth of Brazilian municipalities in the 20th century The only institutional proxy significant was the share of foreign born population in 1920
To test the institutional hypothesis three groups of variables were distinguished as follows (1) Slavery in 1872 registered voters in 1910 and land ownership concentration in
1920 (2) Education condition described by literacy rate in 1920 students enrolled in public
and private schools in 1910 and the number of primary schools public and private in 1910
(3) The share of foreign born population in 1920
Reis - Historical Perspectives on Regional Income Inequality in Brazil 1872-2000 | 36
Table 8 Tests of Joint Significance for the Conditional Growth Equations of GDP per Capita and Labor Productivity 1920-2000
Growth of GDP per capita
Growth of labor productivity
All activities Agriculture Non-Agricultural activities
F-Value Pr gt F F-value Pr gt F F-value Pr gt F F-value Pr gt F
A Slave + Politic + Farm Theil Index
102 038 034 042 137 025 087 046
B Education 178 011 137 024 124 029 127 028
C A+B 151 015 123 028 096 047 113 034
D A + B+ foreign
267 001 208 003 321 000 134 022
E Temperature
056 069 044 078 684 000 071 059
F Precipitation
177 014 107 037 733 000 135 025
G Declivity 115 032 109 034 053 059 043 065
H Altitude classes
393 000 438 000 160 015 461 000
I Soil geo-morphology
230 001 231 001 067 078 173 006
Source Authoracutes estimation (regrpib09sia) Coefficients significant at 5 level are highlighted in grey
As shown in Table 8 F-tests for the joint significance of A B A+B and A+B+C were conducted with the result that at 5 confidence level A B A+B are not significant in all cases Only A+B+C is significant which is not surprising given that the share of foreign born population was already significant when considered alone But in the case of the growth of labor productivity in urban activities even A+B+C is not significant
7 Conclusions and Extensions
The basic hypothesis of this paper is the overwhelming role played by the geographic factors especially transport costs in the historical generation and reproduction of spatial inequalities in Brazil Empirical evidence is given by the analysis of the spatial patterns of growth of labor productivity and income per capita of the Brazilian municipalities from 1872 to 2000
desiguALdadesnet Working Paper Series No 66 2014 | 37
The main result of the analysis is that spatial inequalities in the density of economic activity income per capita and labor productivity remained practically unchanged ndash with negligible reductions ndash from 1872 to 2000 The maps show clearly the secular persistent northwest-southeast divide of the country
Estimations of econometric models of growth convergence provide a more rigorous test of the hypotheses The estimates reported here show first of all that the speed of convergence of both income per capita and labor productivity was very slow compared to other countries Disaggregation of the analysis by sub-periods regions and sectors show respectively that phases of export led growth were more dispersive than the import substitution phases convergence was faster inside each region and thus regional disparities reinforced spatial inequalities in the country as a whole and convergence of labor productivity was faster in urban activities than in rural activities
More notably the parameter estimates in this paper show that conditions of access to infrastructure in 1920 ndash measured by the proxy of the existence of a railway station in the municipality ndash was by far the most important factor conditioning the growth of Brazilian municipalities during the 20th century Other variables related to accessibility like the distance to the state capitals and the market potential of the municipality also played roles in the long run growth of municipalities This strong result corroborates the perception that Brazilian development strategies during the second half of 20th century had misguidedly disregarded investment in railway infrastructure which therefore remains as a crucial obstacle of steady growth
In contrast institutional factors ndash as measured by the proxy of importance of slavery (in 1872) education and human capital political participation and land ownership concentration ndash did not play a significant in long run growth of income per capita or labor productivity of Brazilian municipalities Even jointly tested their coefficients remain insignificant The only exceptional role is perhaps the institutional innovations brought with Europeans immigrants since the share of foreign born population in 1920 had a significant positive effect on the secular rates of growth both labor productivity and income per capita especially in agricultural activities
Needless to say the results are still preliminary and further extensions and scrutiny are required Obvious extensions of the analyses are to disaggregate them for each of the 10 inter-census periods as well as economic activities available to estimate in more rigorous way the interplay between factors conditioning growth of Brazilian municipalities One priority in this way is to update the analyses for 2000-2010 to
Reis - Historical Perspectives on Regional Income Inequality in Brazil 1872-2000 | 38
disentangle the role played by spatial inequalities in the recent redistributive process (Rodrigues-Silveira 2012)
In this way the tasks ahead are to complete the historical database on the conditioning factors in particular on demographic aspects related to migration and dependency ratio urban and transportation infrastructures education and human capital political participation etc ndash for the periods from 1920 and 1960 when data are still in printed format
Another line of scrutiny would be a more rigorous econometric treatment of problems like spatial correlation seemingly unrelated equations and endogenous variables in the model A couple of examples illustrate the relevance of these issues The existence of railroad station is a poor proxy for transportation infrastructure to the extent that they tend to be located in localities that had previous locational advantages and for that reason were likely to grow faster in the long run Thus they are endogenous and to that extent their importance and significance are biased A solution proposed is to use as instrumental variables on transport accessibility prior to railways An example is the distance to main seaports by mule train in 1870 which is now being gathered
Analogously slavery in 1872 gives a biased picture of the secular and persistent effects of the institution because concentration of the slave population in the booming coffee areas took place in the short period of a few decades during the mid-19th century5 To that extent the share of slaves became endogenous to the development prospects of this region One suggestion to circumvent this problem would be to use the data on black population in 1872 and in 1890 as instrumental variables The rationale is that the share of blacks (pardos and pretos livres in 1872) in the population is a better proxy for the persistent long run effects of slavery in the municipality
5 The time elapsed from 1872 to the abolition in 1888 does not pose a major problem for the analysis to the extent that several institutional changes like laws passed which gave freedom to infants born to slaves and sexagenarians the creation of emancipation funds voluntary manumission and the abolitionist movement have contributed to distort the spatial picture on the importance of the economic and social legacies of slavery
desiguALdadesnet Working Paper Series No 66 2014 | 39
8 Bibliography
Albuquerque Roberto Cavalcanti de and Cavalcanti Cloacutevis de Vasconcelos (1976) Desenvolvimento Regional no Brasil [Seacuterie Estudos para o Planejamento 16] Brasiacutelia IPEA
Andersen Lykke E Granger Clive WJ Reis Eustaacutequio J Weinhold Diana and Wunder Sven (2002) The Dynamics of Deforestation and Economic Growth in the Brazilian Amazon Cambridge Cambridge University Press
Arantes Neylson E and Souza Plinio I M (1993) Cultura da soja nos cerrados Piracicaba Associaccedilatildeo Brasileira para Pesquisa da Potassa e do Fosfato (Potafos)
Azzoni Carlos Roberto and Ferreira Dirceu A (1997) ldquoCompetitividade regional e reconcentraccedilatildeo industrial o futuro das desigualdades regionais no Brasilrdquo in Revista Econocircmica do Nordeste 28 55-85
Azzoni Carlos Roberto (2003) ldquoConcentraccedilatildeo regional e dispersatildeo das rendas per capita estaduais anaacutelise a partir de seacuteries histoacuterias estaduais de PIB 1939-1995rdquo in Estudos Econocircmicos 27 3 341-393
(1999) ldquoPersonal Income Distribution within States and Income Inequality between States in Brazil 1960 70 80 and 91rdquo in Hewings Geoffrey Sonis Michael Madden Moss and Kimura Yoshio (eds) Understanding and Interpreting Economic Structure Berlin Heidelberg New York Springer Verlag 287-296
Barat Josef (1978) A Evoluccedilatildeo dos transportes no Brasil Rio de Janeiro IBGE
Barro Robert and Sala-i-Martin Xavier (1995) Economic Growth New York Mc Graw Hill
Barros Ricardo P de Mendonccedila Rosane and Camargo Joseacute Maacutercio (1995) Pobreza no Brasil quatro questotildees baacutesicas Desigualdade e pobreza no Brasil Rio De Janeiro Ipea 15-44
Beacutertola Luis Willebald Harr Castelnovo Ana Cecilia and Reis Eustaacutequio J (2006) An Exploration of The Distribution of Income in Brazil 1839-1939 [Paper presented at the XIV International Economic History Congress 21-25 August Helsinki Finland]
Reis - Historical Perspectives on Regional Income Inequality in Brazil 1872-2000 | 40
Buescu Mircea (1979) Brasil disparidades de renda no passado subsiacutedios para o estudo dos problemas brasileiros Rio de Janeiro APEC
Cano Wilson (1977) ldquoA economia do ouro em Minas Geraisrdquo in Contexto 3 91-109
(1997) ldquoConcentraccedilatildeo e desconcentraccedilatildeo econocircmica regional no Brasil 197095rdquo in Economia e Sociedade 8 101-139
(1998) Raiacutezes da concentraccedilatildeo industrial em Satildeo Paulo [Vol 1] Campinas Unversidade Estadual de Campinas Instituto de Economia
Castro Antocircnio Barros de (1969) 7 ensaios sobre a economia Brasileira [Vol 12] Rio de Janeiro Forense
Castro Newton de (2002) Expansatildeo rodoviaacuteria e desenvolvimento agriacutecola dos cerrados Brasiacutelia IPEA
(2004) ldquoLogistic Costs and Brazilian Regional Developmentrdquo in Nucleo de Estudos e Modelos Espaciais Sistemicos (NEMESIS) Working Paper NXXL
Denslow Jr David (1977) ldquoAs origens da desigualdade regional no Brasilrdquo in Versiani Flaacutevio R and Barros Joseacute R (eds) Formaccedilatildeo Econocircmica do Brasil Satildeo Paulo Saraiva 41-62
Ellis Jr Alfredo (1951) O Cafeacute e a Paulistacircnia Satildeo Paulo Universidade de Satildeo Paulo
Faminow Merle D (1998) Cattle Deforestation and Development in the Amazon An Economic Agronomic and Environmental Perspective Oxon UK CAB International
Furtado Celso (1968) Formaccedilatildeo econocircmica do Brasil [8 Ed] Satildeo Paulo Companhia Editora Nacional
(1970) Formaccedilatildeo econocircmica da Ameacuterica Latina Rio de Janeiro Lia Editor
Galvatildeo Oliacutempio J de Arroxelas (1999) ldquoComercio interestadual por vias internas e integraccedilatildeo regional no Brasil 1943-69rdquo in Revista Brasileira de Economia 53 4 523-558
Gasques Joseacute G and Yokomizo Clando (1985) Avaliaccedilatildeo dos incentivos fiscais na Amazocircnia Brasiacutelia IPEAIPLAN
desiguALdadesnet Working Paper Series No 66 2014 | 41
Goulart Filho Alcides and Queiroz Paulo Roberto C (2011) Transportes e formaccedilatildeo econocircmica regional contribuiccedilotildees agrave histoacuteria do transporte no Brasil Dourados MS Editora UFGD
Graham Douglas H (1972) Foreign Migration and the Question of Labor Supply in the Early Economic Growth of Brazil Satildeo Paolo Universidade de Satildeo Paolo IPE
Graham Douglas H and Hollanda Sergio Buarque de (1971) Migration Regional and Urban Growth and Development in Brazil A Selective Analysis of the Historical Record 1872-1970 [Vol 1] Satildeo Paulo Instituto de Pesquisas Econocircmicas
Helfand Steven M and Rezende Gervaacutesio C (1998) Mudanccedilas na distribuiccedilatildeo espacial da produccedilatildeo de gratildeos aves e suiacutenos no Brasil O papel do Centro-Oeste Rio de Janeiro IPEA
Ipeadata (2014) Base dados sobre a economia brasileira do IPEA Rio de Janeiro IPEA at httpwwwipeadatagovbr (last access 06022014)
Homma Alfredo Kingo Oyama (2003) Histoacuteria da Agricultura na Amazocircnia da era preacute-colombiana ao terceiro milecircnio Brasiacutelia Embrapa Informaccedilatildeo Tecnoloacutegica
Leff Nathaniel H (1972) ldquoEconomic Retardation in Nineteenth-Century Brazilrdquo in The Economic History Review 25 3 489-507
(1973) ldquoTropical Trade and Development in the Nineteenth Century The Brazilian Experiencerdquo in Journal of Political Economy 81 3 678-96
(1991) Subdesenvolvimento e desenvolvimento no Brasil Rio de Janeiro Expressatildeo e Cultura
Martins Roberto Borges (1983) ldquoA industria textil domeacutestica de Minas Gerais no Seacuteculo XIXrdquo [Paper presented at the II Seminaacuterio sobre a economia mineira histoacuteria econocircmica de Minas Gerais e a economia mineira dos anos oitenta 22 a 26 de novembro de 1983 Diamantina]
Martins Roberto Borges and Martins Maria do Carmo Salazar (1982) ldquoAs exportaccedilotildees de Minas Gerais no Seacuteculo XIXrdquo [Paper presented at the Seminaacuterio sobre A Economia Mineira 15-17 de Setembro Diamantina]
Matos Odilon Nogueira de (1974) Cafeacute e ferrovias [Vol 2] Satildeo Paulo Editora Alfa-Omega
Reis - Historical Perspectives on Regional Income Inequality in Brazil 1872-2000 | 42
Milliet Seacutergio (1982) Roteiro do cafeacute e outros ensaios Satildeo Paulo Editora Hucitec
Oliveira Francisco de (1977) A economia da dependecircncia imperfeita Rio de Janeiro Graal
Reis Eustaacutequio J (2008) Income Per Capita of Brazilian Municipalities in the 1870acutes Rio de Janeiro IPEA
Reis Eustaacutequio J and Margullis Seacutergio (1990) ldquoOptions for Slowing Amazon Jungle-Clearingrdquo in Dornbusch Ruumldiger and Poterba James M (eds) Global Warming Economic Policy Responses Cambridge MA The MIT Press 335-380
Reis Eustaacutequio J Blanco Fernando Morandi Lucilene Medina Meacuterida and Abreu Marcelo (2004) O Seacuteculo XX nas Contas Nacionais Estatiacutesticas do Seacuteculo XX Rio de Janeiro IBGE
Reis Eustaacutequio J Pimentel Maacuterica Alvarenga Ana Isabel M and Santos Marai do Carmo H (2011) ldquoAacutereas miacutenimas comparaacuteveis para os periacuteodos intercensitaacuterios de 1872 a 2000rdquo [Paper presented at the I Simposio Brasileiro de Cartografia Histoacuterica Parati RJ]
Reis Eustaacutequio J Anderson Kathryn G and Speranza Juliana S (2007) ldquoThe Effects of Climate Change on the Profitability and Land Use in Brazilian Agriculture A Municipal Cross-Sectional Analysisrdquo [Paper presented at the XV Congresso Brasileiro de Agrometeorologia Aracaju SE]
Reis Eustaacutequio J Igliori Danilo and Weinhold Diana (1998) Causal Forces of Deforestation in the Brazilian Amazon Does Size Matter at httpbitly1f9KnKW (last access 20022014)
Reis Eustaacutequio J and Monasterio Leonardo Monteiro (2010) ldquoMudanccedilas na concentraccedilatildeo espacial das ocupaccedilotildees nas atividades manufatureiras do Brasil 1872-1920rdquo in Botelho Tarciacutesio R and Leeuwen Marco H D van (eds) Desigualdade social na Ameacuterica do Sul Perspectivas histoacutericas [1st ed) Belo Horizonte MG Veredas e Cenaacuterios 243-274
Reis Eustaacutequio J Tafner Paulo Pimentel Maacutercia Serra Rodrigo V Reiff Luis Oataacutevio Magalhatildees Kepler and Medina Meacuterida (2005) O PIB dos municiacutepios brasileiros metodologia e estimativas 1970-1996 Rio de Janeiro IPEA
desiguALdadesnet Working Paper Series No 66 2014 | 43
Restitutti Cristiano C (2006) ldquoAs fronteiras da proviacutencia rotas de comeacutercio inter-provincial Minas Gerais (1839-1884)rdquo [Master of Arts Dissertation presented at the Universidade Estadual Paulista]
Rodrigues-Silveira Rodrigo (2012) Gobierno local y estado de bienestar Regiacutemenes y resultados de la poliacutetica social en Brasil Salamanca Fundacioacuten Manuel Gimeacutenez Abad de Estudios Parlamentarios y del Estado Autonoacutemico
Santos Roberto (1980) Histoacuteria econocircmica da Amazocircnia Satildeo Paulo TAQ
Silva Moacir M F (1949) Geografia dos transportes no Brasil Rio de Janeiro IBGE
Silveira Peixoto (1957) A Nova Capital Goiacircnia Pongetti
Stein Stanley J (1957) Vassouras A Brazilian Coffee County 1850-1900 Cambridge Harvard University Press
Summerhill William R (1997) ldquoRailroads and the Brazilian Economy before 1914rdquo in Business and Economic History 26 2 318-322
(2003) Order against Progress Stanford CA Stanford University Press
Versiani Faacutevio Rabelo (1993) ldquoImigrantes trabalho qualificado e industrializaccedilatildeo Rio e Satildeo Paulo no iniacutecio do Seacuteculordquo in Revista de Economia Politica 13 4 77-96
9 Appendix Database
(1) Sources of data
Municipal data came both from the demographic and economic censuses The first demographic census took place in 1872 With diverse quality and frequency other demographic censuses followed in 1890 1900 and 1920 In 1940 IBGE started to conduct demographic censuses on a decennial basis The last one was undertaken in 2010 though 2000 is the final date of our analysis The economic censuses started in 1920 became decadal from 1940 to 1970 quinquennial from 1975 to 1985 when they were discontinued except for the Agricultural Census which was undertaken in 1996 and 2007
Starting in 1995 IBGE made available data at municipal level based upon representative panel of enterprises in major activities the Cadastro Central de Empresas CEMPRE which are conducted annually Three other municipal surveys undertaken by IBGE
Reis - Historical Perspectives on Regional Income Inequality in Brazil 1872-2000 | 44
since 1973 are the Pesquisa Agriacutecola Municipal (PPA) and the Pesquisa Pecuaacuteria Municipal (PPM) and Pesquisa da Extraccedilatildeo Vegetal e Silvicultura (PEVS) At the state level IBGE publishes the Pesquisa Nacional de Amostra por Domiciacutelios (PNAD) since 1973
Transport data came from various sources including Enciclopeacutedia dos municiacutepios brasileiros (IBGE 1957) Ferrovias do Brasil 1946 and 1956 (IBGE 1948 and 1958) DGE 1872 CNI 19007 Ferrovias
(2) Municiacutepios and MCA
Brazilian municiacutepio is the basic geographic unit of observation of the data The number of Brazilian municiacutepios in Brazilian censuses increased from 642 in 1872 to 1304 in 1920 3951 in 1970 and 5507 in 2000 The changes in number and geographic boundaries of municiacutepios preclude consistent intertemporal analysis unless municiacutepios are combined in Minima Comparable Geographic Areas (MCA) Thus though municiacutepios are the units of observation MCA are the de facto geographic unit of analysis (Reis et al 2011)
The number of MCA changes depending on the inter-censuses period in case Thus for the inter-censuses period 1872-2000 there are 432 MCA and for 1970-2000 the number is 3659 Table A1 compares the number of municipalities in each Census year since 1872 with the number of MCA for the respective inter-census period ending in 2000
The analyses made in this paper are based upon the Minima Comparable Areas in the period from 1972 to 2000 Thus unless otherwise specified the term municipality refers to MCA 1872-2000 Figure A1 presents the MCA 1872-2000 It is possible to see that in the North and West regions were settlement took place in recent times the MCA are too few and too large thus posing problems of statistical representativity Note also that the State of Acre is excluded from map of Brazil because in 1872 it was still part of Bolivian territory It was only in 1905 that it was incorporated to Brazilian territory
(3) GDP
In terms of data generation the major contributions of this project are the estimates of municipal GDP The project estimated municipal GDP for Census years from 1872 to 1996 (Reis et al 2005) The database is supplemented by the annual estimates of municipal GDP for major sectors of activities undertaken by IBGE since 1999
desiguALdadesnet Working Paper Series No 66 2014 | 45
Estimates of municipal income for 1872 are based upon econometric models which combine data on wages of civil servants in 1876 with the 1872 Census demographic data (Reis 2008) The models assume that wages of municipal civil servants reflected the labor productivity which was determined by the demographic conditions (distribution of population according to sex age occupation and the free or slave condition) as well as by the geographic characteristics (distance to sea altitude climate and soil attributes) of each municipality The idea is to estimate municipal labor productivity by filtering the idiosyncratic factors that affect average wages of municipal civil servants with the available information on the productive structure of the municipality Given the municipal labor productivity and labor force it is possible to estimate municipal GDP but unfortunately not to disaggregate it into rural and urban GDP
For Census years 1920 1940 1950 1960 1970 1975 1980 1985 and 1996 GDP estimates are based on Census data for major sectors of economic activity (Industry Trade Services and Agriculture) For each sector and year the estimation procedure was to calculate proxies of valued added at municipal level which were then normalized by the respective Brazilian GDP figures in the National Accounts
In the 1920 Census there are no data on industrial and services output at the municipal level and thus estimates were made by distribution of state level data on output according to employment Agriculture estimation were based upon municipal data on major crops output
After 1985 economic censuses were discontinued except for agriculture which was realized in 1996 and 2007 The discontinuation of the other economic censuses after 1985 was circumvented by the use of data from annual surveys based upon CEMPRE as well as by some methodological adaptations For that reason the comparison of municipal GDP figures for 1996 with the other Census years requires additional care
Finally from 1999 on IBGE started publishing yearly estimates of municipal GDP for the major sectors of economic activity
(4) Labor force (PEA)
The labor force or economically active population (PEA) is not consistently measured across different censuses Since 1970 the definition provided by the Demographic censuses include all the persons that were employed as well as those involuntarily unemployed defined as the persons older than 10 years of age which have searched for employment in the two months preceding the Census date of reference The
Reis - Historical Perspectives on Regional Income Inequality in Brazil 1872-2000 | 46
population out of the labor force (NPEA or non-economically active population as IBGE names it) includes voluntarily unemployed occupied with unpaid domestic services in their own homes retired persons rentiers students without jobs and persons in jail The PEA and NPEA are measured in both rural and urban households
For the Censuses from 1940 to 1960 the definition of economic active population excludes both voluntary and involuntary unemployment The labor force is then equal to employed population and thus can be disaggregated according to major sector of activities (agriculture industry trade and others services) The non-economically active population includes persons doing domestic services in their own homes retired persons rentiers students without jobs and jailed persons
In the 1920 Census the economic active population includes all persons with a declared profession The population out of the labor force includes persons without profession or with undeclared profession representing 47 of the population and persons with an ill-defined profession representing 2 of the population These categories in its turn probably include retired persons rentiers students jailed persons as well as those doing domestic services in their own households since declared domestic servants represent only 4 of women older than 15 years of age
In the 1872 Census there is no explicit definition of labor force though population was surveyed according to professions The criteria adopted in this survey however seems quite different from the other censuses since counting every person with a declared profession the labor force adds up to six million people approximately or 60 of total population This figure is extremely high when compared to the other censuses Thus the share of the population in the labor force remains between 30 and 33 in the censuses from 1920 to 1970 and thanks to increased labor force participation jumps to 36 40 and 46 respectively in the censuses of 1980 1991 and 2000
To circumvent this problem the definition of labor force adopted in the analyses is the sum of free male population between 16 and 60 years old with male and female slave population between 11 and 60 years old For the whole country this hypothesis implies a labor force equivalent of 34 of total population The differences between the two definitions are thus quite significant and the last definition is preferred because it sounds more reasonable when compared to other census years One should keep in mind however that the age classes adopted in the definition of the labor force as well as the exclusion of free women are quite arbitrary assumptions
desiguALdadesnet Working Paper Series No 66 2014 | 47
(5) Human capital
Proxies of human capital are given by simple literacy ratio of the labor force (16-60 years of age) available in the Demographic Censuses since 1872
(6) Geographic variables
Up to the 1991 Census geo-referenced information at municipal level for Brazil was scarcely available6 Thus the geographic variables available at municipal level were restricted to latitude (LAT_GMS) longitude (LONG_GMS) altitude (ALT_M) and the distance to the sea (DSHOR) of the seat of municipalities For the censuses of 1991 and 2000 it became possible to superimpose geographical attributes on the maps of municipal networks and thus by the aggregation of municipalities in minimum comparable areas (MCA) it is possible to obtain other geographic variables for all for different inter-census periods
Soil attributes were obtained from IBGEEMBRAPA geo-referenced interpretations of satellite images from recent decades (Reis et al 2007) The variables available for the analysis are the geographic area in square kilometer the proportion of the area in 7 classes of altitude in meter (PALTx) in 3 classes of soil susceptibility to erosion or declivity (in degrees) (PEROx) in 4 classes of soil agricultural quality (PPTNCx) in 13 classes of soil geo-morphological conditions (PSOLOx)
Georeferenced climate data were obtained from interpolation of historical observations from Brazilian meteorological stations constructed by the Climatic Research Unit of the University of East Anglia (CRUEA) Historical data from 1900 to 2006 include data on the average precipitation (PRE30) and temperature (TMP30) of municipalities in the different seasons of the year namely summer (December to February) autumn (March to May) winter (June to August) and spring (September to November) More precise measures given the larger number of meteorological stations are the seasonal averages for the period 1961-90 (Reis et al 2007) Since the figures are average values for a thirty years period for most of the analysis it is fair to assume that they are time invariant as other geographic variables
Finally variable dummies were used to capture the differential fixed effects of states (DUFxx where xx refer to the IBGE state code and RJ (Rio de Janeiro) is defined as default for dummies)
6 By the end of this year IBGE is expected to publish georeferenced database on municipal division in Census years since 1872 (IBGE 2011)
Reis - Historical Perspectives on Regional Income Inequality in Brazil 1872-2000 | 48
Table A1 Brazil Number of Municipalities in Census Years and of Minimal Comparable Areas (MCA) in Inter-Census periods 1872-2000
Census years
Number of municipalities
Inter-census periods
Number of MCA
1872 643 1872-2000 432
1920 1305 1920-2000 952
1940 1575 1940-2000 1275
1950 1891 1950-2000 nd
1960 2768 1960-2000 2407
1970 3974 1970-2000 3659
1980 3991 1980-2000 3692
1991 4491 1991-2000 4267
2000 5507 - Source IBGE and IPEA
Figure A1 Brazil Minimum Comparable Areas for Census years 1872 and 2000
Source Reis et al (2007)
Obs The MCA for the period 1872-2000 does not include the State of Acre because it was part of the territory of Bolivia in 1872
Working Papers published since February 2011
1 Therborn Goumlran 2011 ldquoInequalities and Latin America From the Enlightenment to the 21st Centuryrdquo
2 Reis Elisa 2011 ldquoContemporary Challenges to Equalityrdquo
3 Korzeniewicz Roberto Patricio 2011 ldquoInequality On Some of the Implications of a World-Historical Perspectiverdquo
4 Braig Marianne Costa Seacutergio und Goumlbel Barbara 2013 ldquoSoziale Ungleichheiten und globale Interdependenzen in Lateinamerika eine Zwischenbilanzrdquo
5 Aguerre Luciacutea Alicia 2011 ldquoDesigualdades racismo cultural y diferencia colonialrdquo
6 Acuntildea Ortega Viacutector Hugo 2011 ldquoDestino Manifiesto filibusterismo y representaciones de desigualdad eacutetnico-racial en las relaciones entre Estados Unidos y Centroameacutericardquo
7 Tancredi Elda 2011 ldquoAsimetriacuteas de conocimiento cientiacutefico en proyectos ambientales globales La fractura Norte-Sur en la Evaluacioacuten de Ecosistemas del Mileniordquo
8 Lorenz Stella 2011 ldquoDas Eigene und das Fremde Zirkulationen und Verflechtungen zwischen eugenischen Vorstellungen in Brasilien und Deutschland zu Beginn des 20 Jahrhundertsrdquo
9 Costa Seacutergio 2011 ldquoResearching Entangled Inequalities in Latin America The Role of Historical Social and Transregional Interdependenciesrdquo
10 Daudelin Jean and Samy Yiagadeesen 2011 ldquolsquoFlippingrsquo Kuznets Evidence from Brazilian Municipal Level Data on the Linkage between Income and Inequalityrdquo
11 Boatcă Manuela 2011 ldquoGlobal Inequalities Transnational Processes and Transregional Entanglementsrdquo
12 Rosati Germaacuten 2012 ldquoUn acercamiento a la dinaacutemica de los procesos de apropiacioacutenexpropiacioacuten Diferenciacioacuten social y territorial en una estructura agraria perifeacuterica Chaco (Argentina) 1988-2002rdquo
13 Stroumlbele-Gregor Juliana 2012 ldquoLithium in Bolivien Das staatliche Lithium-Programm Szenarien sozio-oumlkologischer Konflikte und Dimensionen sozialer Ungleichheitrdquo
14 Stroumlbele-Gregor Juliana 2012 ldquoLitio en Bolivia El plan gubernamental de produccioacuten e industrializacioacuten del litio escenarios de conflictos sociales y ecoloacutegicos y dimensiones de desigualdad socialrdquo
15 Goacutemez Pablo Sebastiaacuten 2012 ldquoCircuitos migratorios Sur-Sur y Sur-Norte en Paraguay Desigualdades interdependientes y remesasrdquo
16 Sabato Hilda 2012 ldquoPolitical Citizenship Equality and Inequalities in the Formation of the Spanish American Republicsrdquo
17 Manuel-Navarrete David 2012 ldquoEntanglements of Power and Spatial Inequalities in Tourism in the Mexican Caribbeanrdquo
18 Goacutengora-Mera Manuel Eduardo 2012 ldquoTransnational Articulations of Law and Race in Latin America A Legal Genealogy of Inequalityldquo
19 Chazarreta Adriana Silvina 2012 ldquoEl abordaje de las desigualdades en un contexto de reconversioacuten socio-productiva El caso de la insercioacuten internacional de la vitivinicultura de la Provincia de Mendoza Argentinaldquo
20 Guimaratildees Roberto P 2012 ldquoEnvironment and Socioeconomic Inequalities in Latin America Notes for a Research Agendardquo
21 Ulloa Astrid 2012 ldquoProduccioacuten de conocimientos en torno al clima Procesos histoacutericos de exclusioacutenapropiacioacuten de saberes y territorios de mujeres y pueblos indiacutegenasrdquo
22 Canessa Andrew 2012 ldquoConflict Claim and Contradiction in the New Indigenous State of Boliviardquo
23 Latorre Sara 2012 ldquoTerritorialities of Power in the Ecuadorian Coast The Politics of an Environmentally Dispossessed Grouprdquo
24 Cicalo Andreacute 2012 ldquoBrazil and its African Mirror Discussing lsquoBlackrsquo Approximations in the South Atlanticrdquo
25 Massot Emilie 2012 ldquoAutonomiacutea cultural y hegemoniacutea desarrollista en la Amazoniacutea peruana El caso de las comunidades mestizas-riberentildeas del Alto-Momoacutenrdquo
26 Wintersteen Kristin 2012 ldquoProtein from the Sea The Global Rise of Fishmeal and the Industrialization of Southeast Pacific Fisheries 1918-1973rdquo
27 Martiacutenez Franzoni Juliana and Saacutenchez-Ancochea Diego 2012 ldquoThe Double Challenge of Market and Social Incorporation Progress and Bottlenecks in Latin Americardquo
28 Matta Rauacutel 2012 ldquoEl patrimonio culinario peruano ante UNESCO Algunas reflexiones de gastro-poliacuteticardquo
29 Armijo Leslie Elliott 2012 ldquoEquality and Multilateral Financial Cooperation in the Americasrdquo
30 Lepenies Philipp 2012 ldquoHappiness and Inequality Insights into a Difficult Relationship ndash and Possible Political Implicationsrdquo
31 Saacutenchez Valeria 2012 ldquoLa equidad-igualdad en las poliacuteticas sociales latinoamericanas Las propuestas de Consejos Asesores Presidenciales chilenos (2006-2008)rdquo
32 Villa Lever Lorenza 2012 ldquoFlujos de saber en cincuenta antildeos de Libros de Texto Gratuitos de Historia Las representaciones sobre las desigualdades sociales en Meacutexicordquo
33 Jimeacutenez Juan Pablo y Loacutepez Azcuacutenaga Isabel 2012 ldquoiquestDisminucioacuten de la desigualdad en Ameacuterica Latina El rol de la poliacutetica fiscalrdquo
34 Gonzaga da Silva Elaini C 2012 ldquoLegal Strategies for Reproduction of Environmental Inequalities in Waste Trade The Brazil ndash Retreaded Tyres Caserdquo
35 Fritz Barbara and Prates Daniela 2013 ldquoThe New IMF Approach to Capital Account Management and its Blind Spots Lessons from Brazil and South Koreardquo
36 Rodrigues-Silveira Rodrigo 2013 ldquoThe Subnational Method and Social Policy Provision Socioeconomic Context Political Institutions and Spatial Inequalityrdquo
37 Bresser-Pereira Luiz Carlos 2013 ldquoState-Society Cycles and Political Pacts in a National-Dependent Society Brazilrdquo
38 Loacutepez Rivera Diana Marcela 2013 ldquoFlows of Water Flows of Capital Neoliberalization and Inequality in Medelliacutenrsquos Urban Waterscaperdquo
39 Briones Claudia 2013 ldquoConocimientos sociales conocimientos acadeacutemicos Asimetriacuteas colaboraciones autonomiacuteasrdquo
40 Dussel Peters Enrique 2013 ldquoRecent China-LAC Trade Relations Implications for Inequalityrdquo
41 Backhouse Maria Baquero Melo Jairo and Costa Seacutergio 2013 ldquoBetween Rights and Power Asymmetries Contemporary Struggles for Land in Brazil and Colombiardquo
42 Geoffray Marie Laure 2013 ldquoInternet Public Space and Contention in Cuba Bridging Asymmetries of Access to Public Space through Transnational Dynamics of Contentionrdquo
43 Roth Julia 2013 ldquoEntangled Inequalities as Intersectionalities Towards an Epistemic Sensibilizationrdquo
44 Sproll Martina 2013 ldquoPrecarization Genderization and Neotaylorist Work How Global Value Chain Restructuring Affects Banking Sector Workers in Brazilrdquo
45 Lillemets Krista 2013 ldquoGlobal Social Inequalities Review Essayrdquo
46 Tornhill Sofie 2013 ldquoIndex Politics Negotiating Competitiveness Agendas in Costa Rica and Nicaraguardquo
47 Caggiano Sergio 2013 ldquoDesigualdades divergentes Organizaciones de la sociedad civil y sindicatos ante las migraciones laboralesrdquo
48 Figurelli Fernanda 2013 ldquoMovimientos populares agrarios Asimetriacuteas disputas y entrelazamientos en la construccioacuten de lo campesinordquo
49 DrsquoAmico Victoria 2013 ldquoLa desigualdad como definicioacuten de la cuestioacuten social en las agendas trasnacionales sobre poliacuteticas sociales para Ameacuterica Latina Una lectura desde las ciencias socialesrdquo
50 Gras Carla 2013 ldquoAgronegocios en el Cono Sur Actores sociales desigualdades y entrelazamientos transregionalesrdquo
51 Lavinas Lena 2013 ldquoLatin America Anti-Poverty Schemes Instead of Social Protectionrdquo
52 Guimaratildees Antonio Seacutergio A 2013 ldquoBlack Identities in Brazil Ideologies and Rhetoricrdquo
53 Boanada Fuchs Vanessa 2013 ldquoLaw and Development Critiques from a Decolonial Perspectiverdquo
54 Araujo Kathya 2013 ldquoInteractive Inequalities and Equality in the Social Bond A Sociological Study of Equalityrdquo
55 Reis Elisa P and Silva Graziella Moraes Dias 2013 ldquoGlobal Processes and National Dilemmas The Uncertain Consequences of the Interplay of Old and New Repertoires of Social Identity and Inclusionrdquo
56 Poth Carla 2013 ldquoLa ciencia en el Estado Un anaacutelisis del andamiaje regulatorio e institucional de las biotecnologiacuteas agrarias en Argentinardquo
57 Pedroza Luicy 2013 ldquoExtensiones del derecho de voto a inmigrantes en Latinoameacuterica iquestcontribuciones a una ciudadaniacutea poliacutetica igualitaria Una agenda de investigacioacutenrdquo
58 Leal Claudia and Van Ausdal Shawn 2013 ldquoLandscapes of Freedom and Inequality Environmental Histories of the Pacific and Caribbean Coasts of Colombiardquo
59 Martiacuten Eloiacutesa 2013 ldquo(Re)produccioacuten de desigualdades y (re)produccioacuten de conocimiento La presencia latinoamericana en la publicacioacuten acadeacutemica internacional en Ciencias Socialesrdquo
60 Kerner Ina 2013 ldquoDifferences of Inequality Tracing the Socioeconomic the Cultural and the Political in Latin American Postcolonial Theoryrdquo
61 Lepenies Philipp 2013 ldquoDas Ende der Armut Zur Entstehung einer aktuellen politischen Visionrdquo
62 Vessuri Hebe Saacutenchez-Rose Isabelle Hernaacutendez-Valencia Ismael Hernaacutendez Lionel Bravo Lelys y Rodriacuteguez Iokintildee 2014 ldquoDesigualdades de conocimiento y estrategias para reducir las asimetriacuteas El trabajo de campo compartido y la negociacioacuten transdisciplinariardquo
63 Bocarejo Diana 2014 ldquoLanguages of Stateness Development Governance and Inequalityrdquo
64 Correa-Cabrera Guadalupe 2014 ldquoDesigualdades y flujos globales en la frontera noreste de Meacutexico Los efectos de la migracioacuten el comercio la extraccioacuten y venta de energeacuteticos y el crimen organizado transnacionalrdquo
65 Segura Ramiro 2014 ldquoEl espacio urbano y la (re)produccioacuten de desigualdades sociales Desacoples entre distribucioacuten del ingreso y patrones de urbanizacioacuten en ciudades latinoamericanasrdquo
66 Reis Eustaacutequio J 2014 ldquoHistorical Perspectives on Regional Income Inequality in Brazil 1872-2000rdquo
desiguALdadesnet
desiguALdadesnet is an interdisciplinary international and multi-institutional research network on social inequalities in Latin America supported by the Bundesmi-nisterium fuumlr Bildung und Forschung (BMBF German Federal Ministry of Education and Research) in the frame of its funding line on area studies The Lateinamerika-Institut (LAI Institute for Latin American Studies) of the Freie Universitaumlt Berlin and the Ibero-Amerikanisches Institut of the Stiftung Preussischer Kulturbesitz (IAI Ibero-American Institute of the Prussian Cultural Heritage Foundation Berlin) are in overall charge of the research network
The objective of desiguALdadesnet is to work towards a shift in the research on social inequalities in Latin America in order to overcome all forms of ldquomethodological nationalismrdquo Intersections of different types of social inequalities and interdependencies between global and local constellations of social inequalities are at the focus of analysis For achieving this shift researchers from different regions and disciplines as well as experts either on social inequalities andor on Latin America are working together The network character of desiguALdadesnet is explicitly set up to overcome persisting hierarchies in knowledge production in social sciences by developing more symmetrical forms of academic practices based on dialogue and mutual exchange between researchers from different regional and disciplinary contexts Further information on wwwdesiguALdadesnet
Executive Institutions of desiguALdadesnet
Contact
desiguALdadesnet Freie Universitaumlt Berlin Boltzmannstr 1 D-14195 Berlin Germany
Tel +49 30 838 53069wwwdesiguALdadesnete-mail contactodesiguALdadesnet
desiguALdadesnet Working Paper Series No 66 2014 | 57
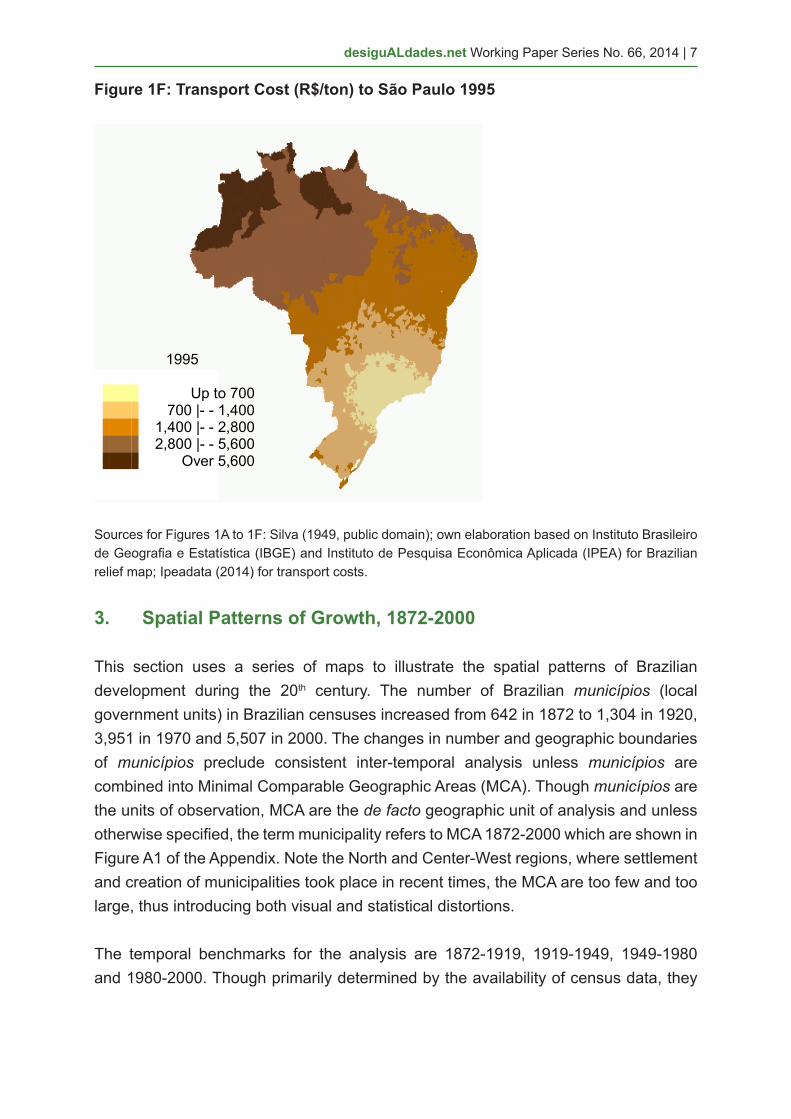
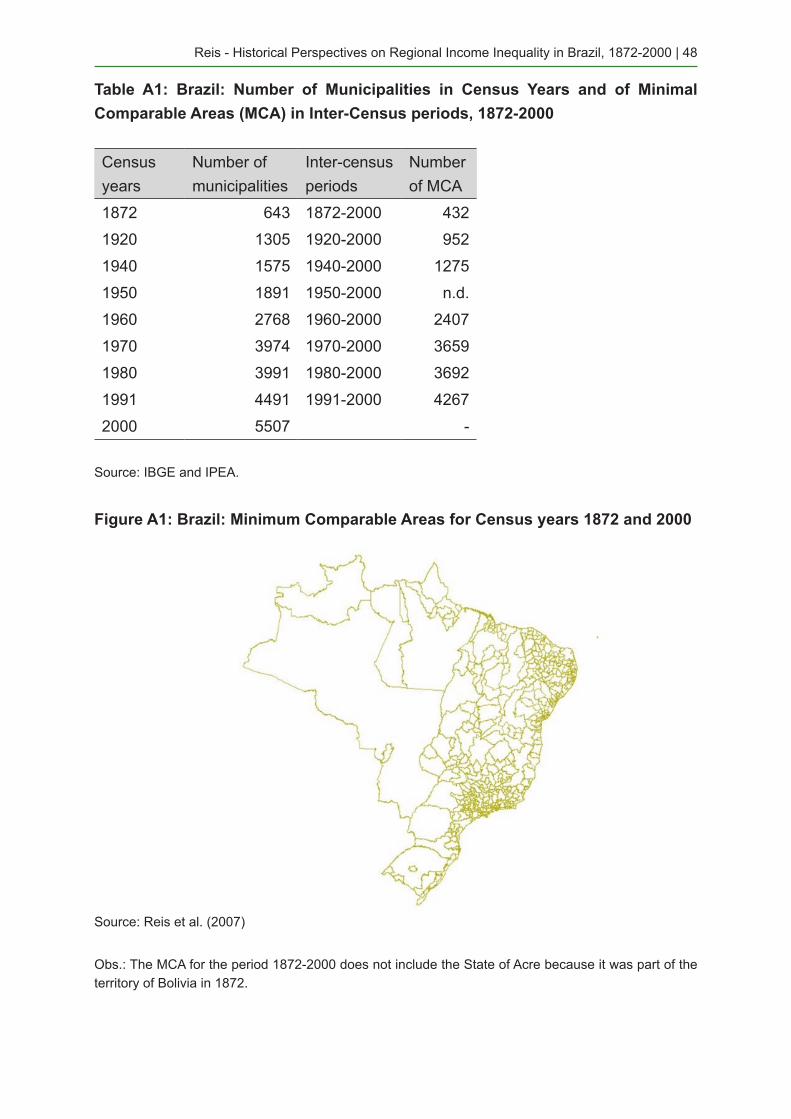

Executive Institutions of desiguALdadesnet
Contact
desiguALdadesnet Freie Universitaumlt Berlin Boltzmannstr 1 D-14195 Berlin Germany
Tel +49 30 838 53069wwwdesiguALdadesnete-mail contactodesiguALdadesnet
desiguALdadesnet Working Paper Series No 66 2014 | 57

desiguALdadesnet Working Paper Series No 66 2014 | 57