his excellency omer hassan ahmed al-bashir - kse.com.sd englis final 2013en.pdf · president of the...
TRANSCRIPT
President of the Sudan
His Excellency Omer Hassan Ahmed Al-bashir
Dr. Mohammed Khair Al-ZubairActing Chairman of the Board
The General Manager
Mr. Osman Hamad Mohamed Khair

2

ANNUAL REPORT 2013
3
Address:Khartoum- Sudan- Albaraka Tower – tenth Floor
P.O. Box: 10835 Khartoum
Fax: +249 83 782225
Website: www.kse.sd
Email: Ksestudies@ hotmail.com
Telephones:Call Box: +249 83 782450 / +249 83 776322
General Manager +249 83 782450Deputy General Manager +249 83 776322Companies and Issues +249 83 782220Studies & Information +249 83 782152Administrative Affairs +249 83 776322Legal Affairs +249 83 782450Brokers & Trading Floor Affairs +249 83 782205Inspection & Audit +249 83 766807Financial department +249 83 775738Internal Auditing +249 83 743053Central Depositary & Saving +249 83 782390IT department +249 83 775669
4
Index
1. Future Vision…………………………………………………………………………………………………. 7
2. Message……………………………………………………………………………………………………….. 7
3. KSE Objective………………………………………………………………………………………………… 8
4. The Speach of general Manager……....……………………………………………..…………… 9
5. Major Indictors of Sudan’s Economy During 2013 ……..…………………................. 10
6. Establishment and development And the most important periods for KSE ………... 11
7. Market Statistics…………………………………………………………………………………………… 13
8. Market activity by sector in 2013………………………………………………………………….. 27
9. Brokerage Companies…………………………………………………………………………………..59
ANNUAL REPORT 2013
5
Chairman of the Board:
Dr. Mohamed Khair AlzubairActing chairman of the board
Mr. Osman Hamad Mohamed Khair The General Manager
Board Members:
mis. Alsham Abdellah Abdellah
Mis. Muna Al tahir A. Alrahaman
Mr. Musaad Mohamed Ahmad
Dr. Kamal Jad Kareem
Dr. Hamid Alamin Ahmed
Mr. Khalid Seed Ahmad
Mr. Bdr Aldin Qurashi
Mr. Fadi Fagih
Mr. Mohamed Salih Hasanain
Dr. Ahmed Mansour EL-Agab
Mr. Sulaiman Mohamed Ahmed
Dr. Mohamed Yousif Ali

6
The Executive Management
Departments Managers
Inspection & Audit managerMr. Saeed Alimam Hannan
Miss. Manahil Yousif Mohamed Yousif
Studies & Information Manager
Mr. Jamal Gareeb Allah
Central Depositary & saving Manager
Administration Manager
Mr. Ahmed Ebrahim Nori
Mr. Altaib Algalee AltaibT Department Manager
Mrs. Imama Alsheikh Al A Main
Human resource Manager
Mr. Hisham El-Tayeb Mohammed
Brokers & Trading Floor Affairs Manager
Mrs. Huda Ahmed Alsid
Financial Manager
Mr. Mohamed Ibn Alhaj mohamed
Companies & Issues Manager
Mr. Talal Omer Abu HassanMarketing manager
Mrs. Mison Ali AdamInternal Auditing manager
Shariaa Advisory Board Members
Prof. Mohammed Alhassan Brema
Member
Mr. Osman Hamad Mohamed khair
Member & RaporteurDr.Mohammed Ali Yosif
Member
Dr.Ahmed Ali Abdallah
Chairman
Heads sectors
Mrs. Huda Ahmed Alsid
Head of the Administrative, Finance & services
Mr. A.Rhman A.Majeed (Nadir)Head of markets
Mr. Magdi Mohammed EL-Hassan
Head of Marketing, Research & Development
The general manager
Mr. Osman Hamad Mohamed khair
Legal Advisor
Mr. Mohamed El- Mustafa Musa
ANNUAL REPORT 2013
7
Upgrade the financial industry in the Sudan through:• Dissemination and promotion of financial literacy in
the country.• Governance the performance of Sudanese financial
markets.• Promote the economic development of the country.• Take advantage of financial investment opportunities
available locally, regionally and globally.• Build and strengthen linkages between local
institutions and Regional and international ones.• Building a fair, efficient and transparent market.
To play a key role in the financial industry through the provision of services and financial products, innovative and quality, professionalism and credibility in the coming years through a comprehensive reform in the financial, administrative, technical and legal with a view to establishing a functioning market that seeks to strengthen its role in the structure of economic development and the safety of investors and dealers in it.
Future vision
Message
8
Khartoum stock exchange act stated that the market has the following proposes:
• Regulate and control the issuance and dealing in buying and selling.
• To encourage saving and investment awareness among citizen and Sudanese economy.
• Work to expand and strengthen the private ownership of productive assets in the national economy and the transfer of public ownership of capital assets of the state to wider national groups.
• Develop and market development issue by organizing and monitoring securities issues and determine the conditions and requirements to be met in the press release on the introduction of securities for public subscription by the public.
• Strengthen the foundation for proper handling and equitable between the categories of investors and ensure equal opportunities for dealers in securities to protect small investors.
• Propose how to coordinate the financial statements, monetary and capital movement, and policy oversight for the development of sources of financing medium and long term in Sudan in order to achieve financial and economic stability in Sudan and then achieving the goals of economic development.
KSE objectives

ANNUAL REPORT 2013
9
The Speech of KSE General Manager
2013 is considered as a unique and historical year for Khartoum Stock Exchange (KSE). It is the first year of the beginning of electronic trading system. Trading rates have risen, the number of transaction is doubled and this is due to the effectiveness of the electronic trading system which carried along with it several transformations that have made radical changes in KSE’s activity as well as supporting its march towards bright and pioneering future to keep up with the regional, international and the Arabic stock exchanges. It’s also encourage KSE to think to establish new markets that were not available when KSE adopting manual trading system such as goods market, minerals market (gold), For-ex market and real estate market. Also, KSE did a cross listing with regional and Arabic stock exchanges.We live in the age of technological and scientific development, where the road to succeed in the stock markets lies in the ability to implement the electronic systems. Therefore, since the changes in the technological and economical fields are going in successive steps, the market had to upgrade its systems continuously to be able to work under the intense competition in international stock exchanges.After applying the Electronic trading system, the market has become a leading front of the investment in Sudan, as it is considered as the fundamental base for economic growth. To achieve this goal, all the preliminary stages of the implementation has been prepared for practical execution so as the electronic system becomes alternative to the traditional manual system which does not meet the requirements of the next stage. In this regard, the trading hall has been equipped in the best way and the hard-wares and soft-wares of electronic trading that were given to us by Muscat trading markethave been installed.We express our sincerest gratitude and respect for the great support they provided in training all the employees of the Khartoum stock exchange and some members from financial brokerage firms on how does electronic transactions work. The second stage of the development and renovation process, on the other hand, will include establish bank for the transactions settlement.And, the third step is to link the brokerage companies and their customers with the electronic system to be able to conduct their transactions from their premises without incurring the rigors of attendance to the KSE halls to do these transactions. In addition to the electronic trading, the management council has approved a number of the organizing guidelines of the market’s activity to be considered in the next stage. Furthermore, a draft of a new law to Khartoum Stock Exchange market has been set ,in addition there is another law for the market regulation body which will take over the supervision, control and development processes of the KSE and the other markets that are anticipated to be born after the approval of this low which is now in front of the ministers’ council to be approved and then passed through the parliament for its final approval.Finally,we assure our relentless pursuit to serious working and making every effort in order to move the market forward for the benefit of the country and the citizens.
Thank you,
Osman Hamad Muhammad Khair
General Manager

10
MAJOR INDICTORS OF SUDAN’S ECONOMY DURING 2013
Major indicator in Sudanese economy is the fast that the population reached by end of 2013, (36163.8) thousand people.
The GDP went up from SDG (243,412.9) million compared with SDG (294,630.2) million in 2013, at the rate of growth (2.89%), the contributions of the sectors to the GDP are as follows:-
The agricultural sector (33.8%) Compared with (33.1%) during 2012.
The industrial sector (16.5%) compared with (16.7) during 2012.
The services sector (6.2 %) compared with (6.3%) during 2012.
It could be while that the contributing of both the agricultural and industrial sectors went up, while there has been decrease in the of services sector during 2012.
As For the inflation rate, the average rate of inflation during 2013 reached 37.1% by the end of 2013, compared with 35.1% of average rate during 2012.
The average of exchange rate of the Sudanese pound against the euro by the end of the year stood at 5.6958 compared with an average of 4.41pound during the year 2012.
ANNUAL REPORT 2013
11
Khartoum Stock Exchange has completed by the end of the year 2012, 18 years, which witnessed the march of Khartoum Stock Exchange several stages and transitions that would accelerate progress in the market, the most recent was the market transformation to electronic trading and the following is profiles of the most important stages in the life of the market:
• The idea of establishing a stock exchange in Sudan started in 1962 whereby many formalities such as studies and communications had been started by the Ministry of Finance and Bank of Sudan jointly with IFC one of the arms of the World Bank .
• The People’s Assembly had endorsed the Stock Exchange Act of 1982 to regulate Stock Exchanges establishment in Sudan but no serious action was taken until 1992.
• In August 1992 a serious step was taken to establish a Stock Exchange in Sudan in line with economic liberalization policy called the Three Years Salvation Program (1990 - 1993).
• The Stock Exchange Board had been formed in 1992. In November of the same year the Council of Ministers amended the Stock Exchange Act of 1982, but the amended Act did not cover all the required necessary objectives to establish a Stock Exchange.
• In 1994 the Transitional National Assembly passed the Khartoum Stock Exchange Act, through which KSE acquired its independent legal status.
• The primary market activities – (Issues Market) – started on 10/10/1994.• On the 2nd of January 1995 the secondary market was completed and the market started dealing
in the shares of the first listed companies. • In 1996 the number of listed companies has increased from 34 to 40 companies.• In 1997 a remarkable increase in the market value of the listed companies went up from 31 million
U.S Dollars to 139 million U.S Dollars. The same year witnessed the establishment of the Financial Investment Bank to help in activating KSE.
• In 1999 the Parallel Market started its operation, as well as the classification of listed companies according to their adherence to conditions regulating the companies listed either in the regular market or the parallel one.
• In 2001 a number of Investment Funds (Sukuk) and Government Musharaka Certificates (Shehama) were issued and listed in KSE.
• In 2002 a great expansion of KSE relations with regional and international financial markets took place.
• In 2003 the Khartoum Index was declared, listing the KSE in the Arab Monetary Fund data base and cross listing Sudatel in Abu Dhabi Securities Market were carried out.
• In 2004 the trading volume reached the highest level since the establishment of KSE. In the same year a joint cooperation protocol was signed between KSE and Cairo - Alexandria bourses.
• In 2005 a standard increase in the trading volume to 1.21 Billion Sudanese pounds and an increase in Khartoum Index with growth ratio of 97.3%, the market value rose to 7.47 Billion Sudanese pounds. According to AMF Data base KSE came the first due to the growth of market value compared with other Arabic Markets with a ratio of 50.8%.
• In 2006 a standard increase in the trading volume to 2.06 Billion Sudanese pounds with a growth of 70%.
• In 2007 Khartoum Stock Exchange joined the African Markets Union which is going to open new horizons of co-operation with regional stock markets.
• In 2008, a remarkable increase in the volume trading and the Depository Center has been completed to contain all the listed stocks in 0the Khartoum Stock Exchange, which paved the way for the
Establishment and development And the most important periods for KSE
12
completion of the transformation to the electronic trading.• In the year 2009 market recorded KSE highest dealings since the establishment of market secondary
in an increase in trading volume to (2.2) billion, compared with (1.8) billion in the last year, a rise of 19.5% and the system begins to switch to electronic trading which will be completed by year-end 2010, God willing.
• Has also been developing an action plan for market development, this plan contains 12 important hub.
• In The beginning of 2010 was the adoption of market as an observer in the Union of Arab Stock Exchanges to enjoy full membership at the next meeting of the Union.
• In 2010 a Sudan Commodity Exchange (under way) was accepted as an observer in the African Commodity Exchange Forum (ACEF).
• It also signed contracts for the operation and installation of programs.• In 2010 has a volume greater rate since the beginning of the secondary market in 1995, ahead
of the year 2009 which amounted to lE2.2 billion compared to $2.4 billion, and the number of shares traded from 164,721,836 shares, as well as the number of contracts from the 8065 contract to 8265 contract, as has the number of instruments traded down from 7,646,614 to 5,848,016 instrument.
• In the year 2010 was the adoption of the market as an observer in the Union of Arab stock exchange to enjoy full membership at the next meeting of the federation.
• In the year 2010 was the signing of the contracts for the supply and installation of hardware and operating software and the beginning of the installation screens internal fixed and mobile
In the year 2011:-• Trading volume continued to rise over the previous year where it reached 2.6 billion pounds
compared to 2.2 billion pounds and the number of instruments, 5 million to 11 million.• The inclusion of a single company during this year (Al Jazira Sudanese Jordanian Bank).• The arrival and installation of all equipment and operation of electronic trading.• The completion of the tests of electronic trading systems and the training of all employees in the
market, brokers accredited to these systems.• The adoption of KSE to be a permanent member in the association of Arab Stock Exchanges.• The start of the trial run of a program for electronic trading.In the year 2012:-• KSE started working with the electronic trading system.• In year 2012 was opened by the Minister of Finance and National Economy of the electronic trading
system under the auspices of the President of the Republic.• Trading rates rose significantly from the previous year for the application of the electronic trading
system on a volume of 3.1 billion pounds compared with 2.6 billion pounds in the previous year, and the number of transactions jumped from 7,870 contracts in the previous year to 12,719 contracts this year.
in the year 2013:• Trading volume continued to rise over the previous year where it reached 3.9 billion pounds
compared to 2.6 billion pounds in the year 2012 as the number of contracts executed a significant increase from 12,719 in the year 2012 to 16,435 in the year 2013.
• Signing of a memorandum of understanding with the National Council for Press and Publications.• Start the second stage of electronic trading.• The inclusion of a two companies during this year (Al barka financial services and Alslam hospital
company LTD).
ANNUAL REPORT 2013
13
Market statistics

14
Activity2004
20052006
20072008
20092010
20112012
2013
Primary M
arket
Vamue of Issues
2,170,000,0001,049,466,651
4,130,000,0004,225,345,625
5,887,484,2257,498,649,587
11,578,950,16813,232,042,415
15,284,968,55515,171,000,000
Secnodary Markt
No. of Listed com
pnay48
4951
5353
5355
5659
60
No. N
utual funds listed 6
9 16
19 28
34 25
25 26
27
No. of Treaded Certificates42
4233
2128
3445
4542
45
Market Capitalization
3,689,881,596 7,473,268,351 9,312,418,797 10,305,290,987 8,131,776,590 7,589,316,950 6,391,200,061 7,062,982,659
9,634,988,64511٫188٫777٫913
No. of Shares traded
2,185,994,4881,731,670,402
7,564,875,9029,406,825,010
281,609,805164,712,836
166,548,512106,512,121
172,580,58580,857,419
No. Sukuk traded
30,790 845,830
1,433,400 2,717,193.00
4,977,907.00 4,228,900.00
1,791,114.00 7,333,445.00
5,793,5751,447,341
No. of Certificates
102,108308,083
1,472,3512,016,530
2,421,0553,417,714
4,056,9063,892,066
5,116,6236,983,324
No. (Certificates + funds) traded
132,898 1,153,913
2,905,751 4,733,723
7,398,962 7,646,614
5,848,020 11,225,511
10,910,198 8,430,665
volume traded
447,722,9271,216,833,003
2,068,054,0211,799,635,684
1,879,185,9552,246,552,029
2,422,315,0022,562,626,975
3,073,607,1673,885,405,658
No. of contracts executed
3,534 3,673
5,842 7,195
8,569 8,069
8,266 7,870
12,719 16,435
Off floor trading
No. of Shares
791,922,370 274,366,808
188,659,120 89,680,785
12,600,742 3,473,469
3,803,710 41.306.712
259,497,440 22,633,359
Market Value
9,872,30533,080,340
92,742,2924,971,638
18,449,7094,465,403
6,660147,201,836
107,928,1507,293,785,384
The Activity of priarm
y & secondary M
arkets by Sector from 2004 to 2013

ANNUAL REPORT 2013
15
• Frist : Share
The primary market witnessed the admission of 9 existing companies to increase their capital in 2013 where the numbers of shares issued reach 255,640,344 shares with total value of more than 168 million Sudanese pounds. it also approved the establishment of 4 companies through the year 2013, where the number of shares issued reach 1,315,000 shares with value of 2,710,000 Sudanese pounds.1/ the existing companies:
Table (1)
Company name Number of shares issued Share value Value of premium Total value of issued
Alshamal Islamic bank 24,995,832 1 0 24,995,832
Farmers commercial bank 93,483,922 1 0.28 119,659,420.60
Workers national bank 14,303,600 1 0 14,303,600
General insurance 2,000,000 1 0 2,000,000
Watania co-operative insurance 7,285,674 1 0 7,285,674
Assalama insurance 351,986 10 0 3,519,860
National leasing & investment 56,781 100 26 7,154,406
Al nile bank for trade &development 107,189,549 0.10 0 10,718,954.90
Expatriate company LTD for education, technology andscientific research
6,000,000 1 0 6,000,000
2/ The new company:
Table (2)
Company name Number of shares issued Share value Value of premium Total value ofissued
Mem financial transfer co.ltd 1,250,000 1 1,180,000 1,180,000
Alameer for exchange co.ltd 100,000 1 30,000 30,000
Dubai exchange co.ltd 4,000,000 10 100,000 1,000,000
Easy transfer for finance service 2,000,000 100 5,000 500,000
The Primary market
16
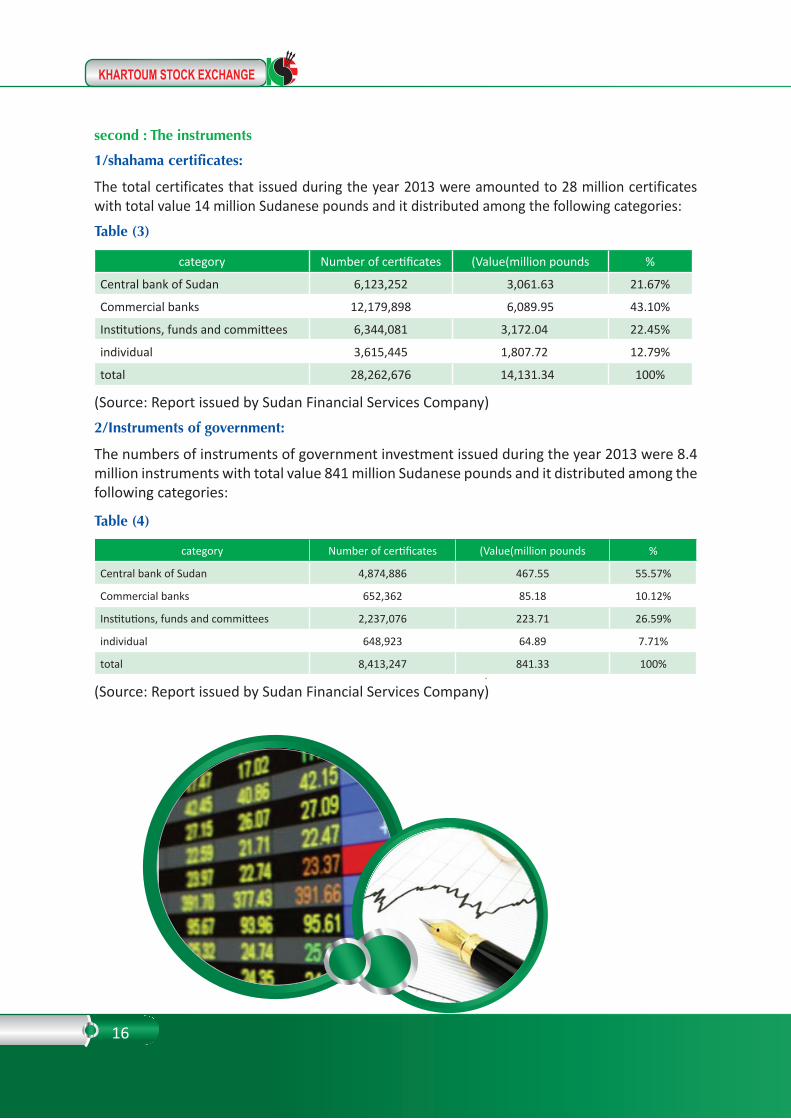
second : The instruments
1/shahama certificates:
The total certificates that issued during the year 2013 were amounted to 28 million certificates with total value 14 million Sudanese pounds and it distributed among the following categories:Table (3)
category Number of certificates (Value(million pounds %
Central bank of Sudan 6,123,252 3,061.63 21.67%
Commercial banks 12,179,898 6,089.95 43.10%
Institutions, funds and committees 6,344,081 3,172.04 22.45%
individual 3,615,445 1,807.72 12.79%
total 28,262,676 14,131.34 100%
(Source: Report issued by Sudan Financial Services Company)2/Instruments of government:
The numbers of instruments of government investment issued during the year 2013 were 8.4 million instruments with total value 841 million Sudanese pounds and it distributed among the following categories:
Table (4)
category Number of certificates (Value(million pounds %
Central bank of Sudan 4,874,886 467.55 55.57%
Commercial banks 652,362 85.18 10.12%
Institutions, funds and committees 2,237,076 223.71 26.59%
individual 648,923 64.89 7.71%
total 8,413,247 841.33 100%
(Source: Report issued by Sudan Financial Services Company)
ANNUAL REPORT 2013
17
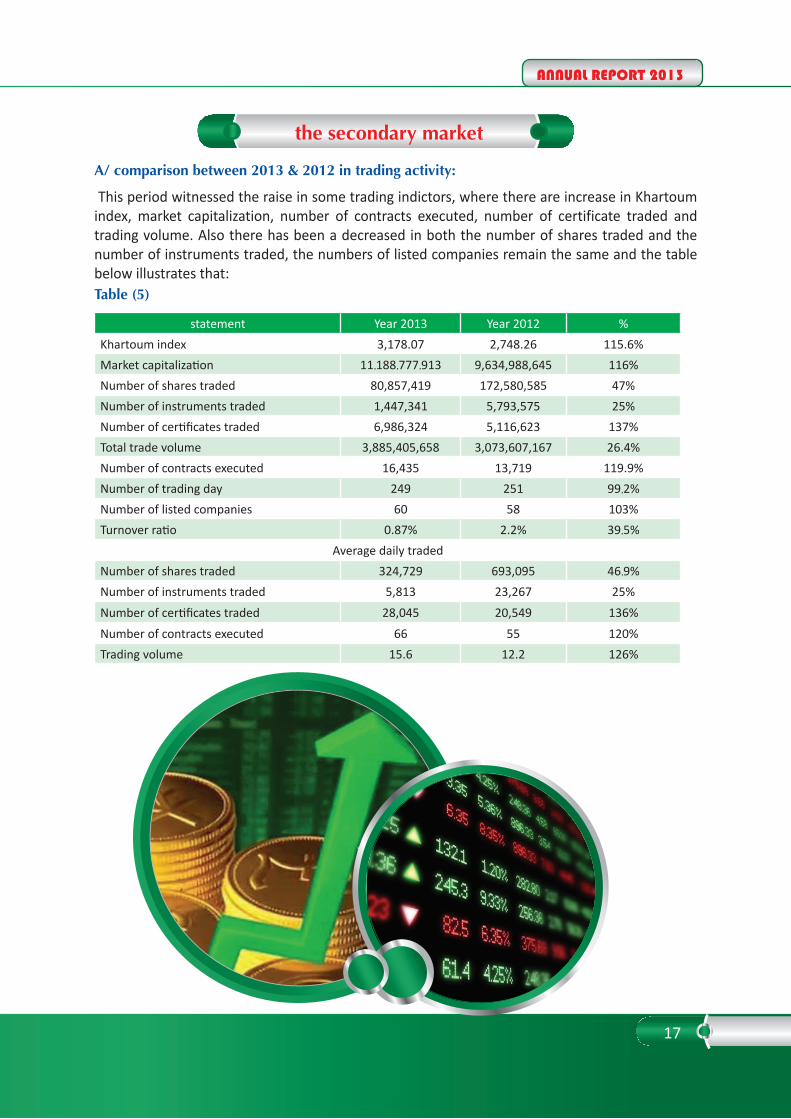
the secondary market
A/ comparison between 2013 & 2012 in trading activity:
This period witnessed the raise in some trading indictors, where there are increase in Khartoum index, market capitalization, number of contracts executed, number of certificate traded and trading volume. Also there has been a decreased in both the number of shares traded and the number of instruments traded, the numbers of listed companies remain the same and the table below illustrates that:Table (5)
%Year 2012Year 2013statement115.6%2,748.263,178.07Khartoum index116%9,634,988,64511٫188٫777٫913Market capitalization47%172,580,58580,857,419Number of shares traded25%5,793,5751,447,341Number of instruments traded
137%5,116,6236,986,324Number of certificates traded26.4%3,073,607,1673,885,405,658Total trade volume
119.9%13,71916,435Number of contracts executed99٫2%251249Number of trading day103%5860Number of listed companies39٫5%2.2%0.87%Turnover ratio
Average daily traded46٫9%693,095324,729Number of shares traded25%23,2675,813Number of instruments traded
136%20,54928,045Number of certificates traded120%5566Number of contracts executed126%12.215.6Trading volume
18
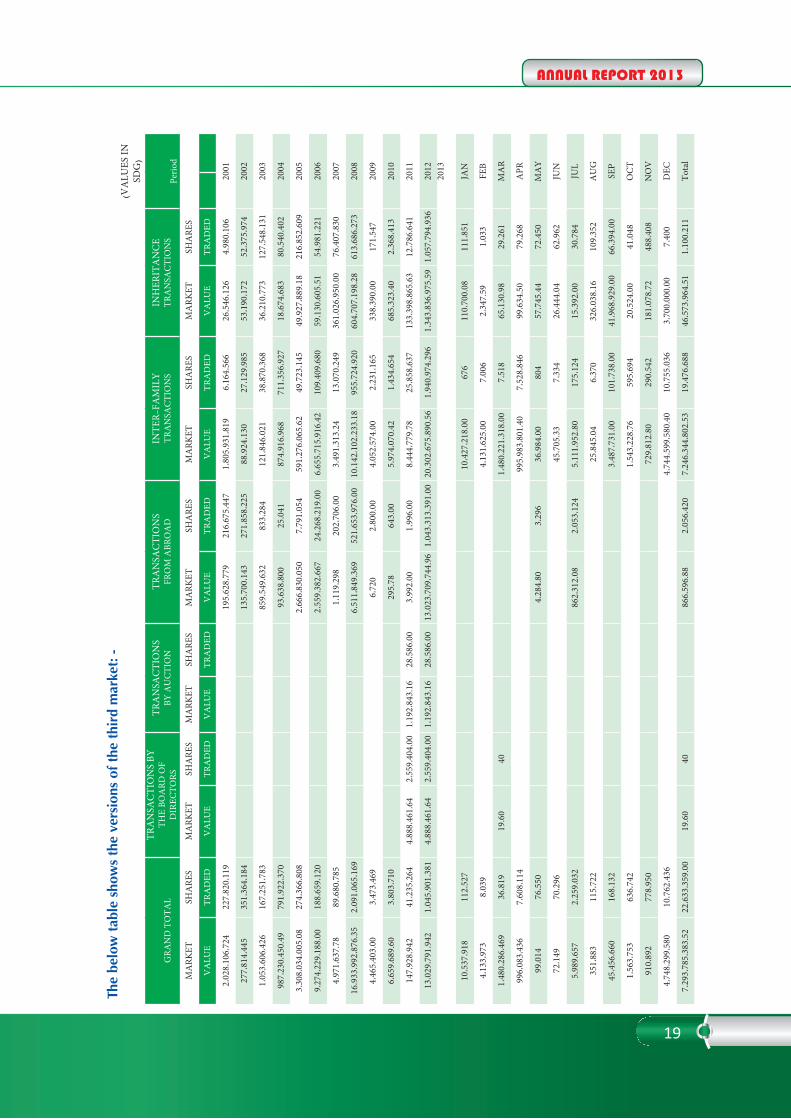
Off floor tradingThe off floor trading Includes transfers out of the Trading Hall, Family transfers of, branches and relatives to the third degree and Inheritance transfers in addition to the transfers which are outside Sudan. And transfers are made outside the hall, through the Department of Legal Affairs.
The total value of shares that have been transferred out of the room in the year 2013 was (22,633,359) shares worth a total 7.293 million pounds.
Transfers of the year 2013 included:• The amount of (46,573,964.51) pounds which represent Inheritance transfers with a
value (1,100,211) shares, • (19,476,688) shares valued at (7,246,344,802.53) pounds is a family remittances, • (2,056,420) shares valued at (866,596.88) pounds transfers from outside the Sudan, • (40) Shares valued at (19.30) pounds from Conversions Governing Council resolution.
The Third market
ANNUAL REPORT 2013
19
(
VA
LUES
INSD
G)
GRA
ND
TO
TAL
TRA
NSA
CTI
ON
S BY
TH
E BO
ARD
OF
DIR
ECTO
RS
TRA
NSA
CTI
ON
S B
Y A
UC
TIO
NTR
AN
SAC
TIO
NS
FRO
M A
BRO
AD
INTE
R-FA
MIL
Y T
RAN
SAC
TIO
NS
INH
ERIT
AN
CE
TRA
NSA
CTI
ON
S
Perio
d
MA
RKET
SHA
RES
MA
RKET
SHA
RES
MA
RKET
SHA
RES
MA
RKET
SHA
RES
MA
RKET
SHA
RES
MA
RKET
SHA
RES
VA
LUE
TRA
DED
VA
LUE
TRA
DED
VA
LUE
TRA
DED
VA
LUE
TRA
DED
VA
LUE
TRA
DED
VA
LUE
TRA
DED
2,02
8,10
6,72
422
7,82
0,11
9
19
5,62
8,77
921
6,67
5,44
71,
805,
931,
819
6,16
4,56
626
,546
,126
4,98
0,10
620
01
277,
814,
445
351,
364,
184
135,
700,
143
271,
858,
225
88,9
24,1
3027
,129
,985
53,1
90,1
7252
,375
,974
2002
1,05
3,60
6,42
616
7,25
1,78
3
85
9,54
9,63
283
3,28
412
1,84
6,02
138
,870
,368
36,2
10,7
7312
7,54
8,13
120
03
987,
230,
450.
4979
1,92
2,37
0
93
,638
,800
25,0
4187
4,91
6,96
871
1,35
6,92
718
,674
,683
80,5
40,4
0220
04
3,30
8,03
4,00
5.08
274,
366,
808
2,66
6,83
0,05
07,
791,
054
591,
276,
065.
6249
,723
,145
49,9
27,8
89.1
821
6,85
2,60
920
05
9,27
4,22
9,18
8.00
188,
659,
120
2,55
9,38
2,66
724
,268
,219
.00
6,65
5,71
5,91
6.42
109,
409,
680
59,1
30,6
05.5
154
,981
,221
2006
4,97
1,63
7.78
89,6
80,7
85
1,
119,
298
202,
706.
003,
491,
313.
2413
,070
,249
361,
026,
950.
0076
,407
,830
2007
16,9
33,9
92,8
76.3
52,
091,
065,
169
6,51
1,84
9,36
952
1,65
3,97
6.00
10,1
42,1
02,2
33.1
895
5,72
4,92
060
4,70
7,19
8.28
613,
686,
273
2008
4,46
5,40
3.00
3,47
3,46
9
6,
720
2,80
0.00
4,05
2,57
4.00
2,23
1,16
533
8,39
0.00
171,
547
2009
6,65
9,68
9.60
3,80
3,71
0
29
5.78
643.
005,
974,
070.
421,
434,
654
685,
323.
402,
368,
413
2010
147,
928,
942
41,2
35,2
644,
888,
461.
642,
559,
404.
001,
192,
843.
1628
,586
.00
3,99
2.00
1,99
6.00
8,44
4,77
9.78
25,8
58,6
3713
3,39
8,86
5.63
12,7
86,6
4120
11
13,0
29,7
91,9
421,
045,
901,
381
4,88
8,46
1,64
2,55
9,40
4.00
1,19
2,84
3.16
28,5
86.0
013
,023
,709
,744
.96
1,04
3,31
3,39
1.00
20,3
02,6
75,8
90.5
61,
940,
974,
296
1,34
3,83
6,97
5.59
1,05
7,79
4,93
620
12
2013
10,5
37,9
1811
2,52
7
10
,427
,218
.00
676
110,
700.
0811
1,85
1JA
N
4,13
3,97
38,
039
4,13
1,62
5.00
7,00
62,
347.
591,
033
FEB
1,48
0,28
6,46
936
,819
19.6
040
1,48
0,22
1,31
8.00
7,51
865
,130
.98
29,2
61M
AR
996,
083,
436
7,60
8,11
4
99
5,98
3,80
1.40
7,52
8,84
699
,634
.50
79,2
68A
PR
99,0
1476
,550
4,28
4.80
3 ,29
636
,984
.00
804
57,7
45.4
472
,450
MA
Y
72,1
4970
,296
45,7
05.3
37,
334
26,4
44.0
462
,962
JUN
5,98
9,65
72,
259,
032
862,
312.
082,
053,
124
5,11
1,95
2.80
175,
124
15,3
92.0
030
,784
JUL
351,
883
115,
722
25,8
45.0
46,
370
326,
038.
1610
9,35
2A
UG
45,4
56,6
6016
8,13
2
3,
487,
731.
0010
1,73
8.00
41,9
68,9
29.0
066
,394
.00
SEP
1,56
3,75
363
6,74
2
1,
543,
228.
7659
5,69
420
,524
.00
41,0
48O
CT
910,
892
778,
950
729,
812.
8029
0,54
218
1,07
8.72
488,
408
NO
V
4,74
8,29
9,58
010
,762
,436
4,74
4,59
9,58
0.40
10,7
55,0
363,
700,
000.
007,
400
DEC
7,
293,
785,
383.
52 22
,633
,359
.00
19
.60
40
86
6,59
6.88
2,05
6,42
07,
246,
344,
802.
5319
,476
,688
46,5
73,9
64.5
11,
100,
211
Tota
l
The
belo
w t
able
sho
ws
the
vers
ions
of t
he t
hird
mar
ket:
-
20
First: ABU DABAI MARKET - The Sudan Telecommunication Co. (SUDATEL) was listed in Abu Dhabai in 2003. - The total market shares transferred from KSE to Abu Dhabai market (15,554,821) shares
were transferred in 24 transfer requests. - The total market shares transferred from market Abu Dhabai to KSE (47,759) shares were
transferred in 5 transfer request. -The total shares deposited till 31/12/2013 as follows:-
%Number of Shares depositedName of exchange
71.37%802,888,592KSE
28.63%322,014,547ABu DHABAI Securities Market
Second: DUBAI FINANCIAL MARKET - AL Salam Bank was listed in 2008. - The total market shares transformed from KSE to DFM (83,868) shares were transferred in 5
transfer requests - The total market shares transformed from DFM to KSE in the year 2013 (0) shares. - The total shares deposited till 31/12/2013 as follows:-
%Number of Shares depositedName of exchange
31.76%36,686,573KSE
68.24%78,813,427DFM
Activity OF CROSS LISTED COMPANY’S TRANSFERS

ANNUAL REPORT 2013
21
Market capitalization (or market value) of the Companies is the number of outstanding shares multiplied by their market value at the end of the specified period of time. The market value of companies listed in Khartoum Stock Exchange SDG (11.188) billion pounds by the end of 2013, compared to (9.63) billion in 2012.
The market values of the share of companies listed in the secondary market for the year 2013 are classified in parts as:
Sectors name Market value ) %
banks 7,124,851,067 64%
insurance 194,206,937 2%
commercial 343,775,377 3%
industrial 151,667,489 1%
agricultural 223,200,974 2%
Communication & media 2,875,663,344 26%
Financial services 108,986,682 1%
Investment & development 166,449,042 1%
total 11,188,777,913 100%
Market Capitalization
banks
insurance
commercial
industrial
agricultural
Communication & media
Financial services
Investment & development
A chart Showing the Capitalization Market for Companies listed in 2013 Sectoral
22
Market Capitalization
31/12/2013 values in Sudanese POUND
COMPANYS NAME TOTAL ASSETS SHARE HOLDERSEQUITY PAID CAPITAL CAPITALIZATION CLOSING
PRICE NOMINAL
VALUE OUTSTANDING
SHARES to the Total
EXPORT DEVELOPMENT BANK 389,982,601 51,215,147 60,000,000 54,000,000 0.09 0.10 600,000,000 0.48
TADAMON ISLAMIC BANK 1,025,474,160 138,957,070 101,632,425 144,318,044 1.42 1.00 101,632,425 1.29
SUDANESE FRENCH BANK 1,087,073,074 90,640,714 110,116,677 285,368,596 4.15 1.50 68,763,517 2.55
SAUDISUDANESE BANK 469,776,860 19,011,760 82,370,771 658,966,168 0.40 0.05 1,647,415,421 5.89
SUDANESE ISLAMIC BANK 486,429,627 70,410,939 100,236,893 123,368,484 0.16 0.13 771,053,023 1.10
AL SHAMAL ISLAMIC BANK 544,183,041 16,278,788 125,000,000 96,250,000 0.77 1.00 125,000,000 0.86
FAISAL ISLAMIC BANK (SUDAN) 1,030,880,074 106,179,845 350,000,000 1,995,000,000 5.70 1.00 350,000,000 17.83
FARMER>S COMMERCIAL BANK 649,907,057 73,994,399 106,572,511 165,187,392 1.55 1.00 106,572,511 1.48
ANIMAL RESOURCES BANK 535,071,040 105,377,139 156,363,918 140,727,526 0.09 0.10 1,563,639,183 1.26
FINANCIAL INVESTMENT BANK 194,779,454 95,517,037 122,100,000 122,100,000 1.00 1.00 122,100,000 1.09
ISLAMIC DEVELOPMENT CO-OPERATIVE BANK 707,396,000 57,296,000 85,149,766 51,089,860 0.06 0.10 851,497,661 0.46
BANK OF KHARTOUM 1,909,076,000 238,522,000 419,099,997 425,449,997 1.34 1.32 317,499,998 3.80
OMDURMAN NATANTIONALBANK 6,289,746,512 186,931,970 800,000,000 800,000,000 10.00 10.00 80,000,000 7.15
IVORY BANK 126,808,932 20,705,289 26,966,661 8,089,998 0.30 1.00 26,966,661 0.07
BLUE NILE MASHREG BANK 356,334,415 59,387,679 177,125,115 354,250,231 3.74 1.87 94,719,313 3.17
WORKER,S NATIONAL BANK 227,219,000 59,240,000 125,696,399 100,557,119 0.80 1.00 125,696,399 0.90
ALSLAM BANK 818,709,277 304,921,021 288,750,000 254,100,000 2.20 2.50 115,500,000 2.27
UNITED CAPITAL BANK 388,639,529 256,866,052 240,000,000 297,600,000 12.40 10.00 24,000,000 2.66
BYBLOS BANK AFRICA 456,222,435 95,292,587 105,000,000 152,700,000 10.18 7.00 15,000,000 1.36
SUDANESE EGYPTION BANK 113,460,804 135,018,357 1.19 1.00 113,460,804 1.21
ALJAZEERA SUDANESEJORDANIAN BANK 167,812,043 439,585,692 5.37 2.05 81,859,533 3.93
ALBARAKA BANK(SUDAN) 411,000,000 108,123,603 3.50 3.50 30,892,458 0.97
Sudanese National Bank 150,000,000 213,000,000 710.00 500.00 300,000 1.90
BANKING SECTOER TOTAL 17,693,709,088 2,046,745,436 4,424,453,981 7,124,851,066.72 7,333,568,907 60.81
GENERAL INSURANCE 219,473,090 21,834,128 50,000 50,000 0.01 0.01 5,000,000 0.00
WATANIA CO-OPERATIVE INSURANCE 7,233,924 1,275,203 7,291,603 17,135,267 2.35 1.00 7,291,603 0.15
THE SUDANEESE INSURANCE&RE- INS 39,022,410 1,901,699 1,500,000 1,500,000 5.00 5.00 300,000 0.01
EL NILEIN INSURANCE 4,157,915.64 2,174,124.14 6,000,000 4,500,000 0.75 1.00 6,000,000 0.04
THE BLUE NILE INSURANCE 20,545,275 6,179,586 6,000,000 3,000,000 0.50 1.00 6,000,000 0.03
THE NATIONAL RE-INSURANCE 55,230,083 6,694,330 503,050 11,821,670 2.35 0.10 5,030,498 0.11
ASSALAMA INSURANCE 15,473,212 1,111,645 5,000,000 5,000,000 10.00 10.00 500,000 0.04
JOBA INSURANCE 27,853,776 1,016,153 12,000,000 151,200,000 31.50 2.50 4,800,000 1.35
INSURANCE SECTOER TOTAL 388,989,686 42,186,868 38,344,653 194,206,937.35 34,922,101 1.74
ANNUAL REPORT 2013
23
31/12/2013 values in Sudanese POUND
THE GUM ARABIC 162,815,623 87,520,952 10,375,329 9,441,549 0.91 1.00 10,375,329 0.08
SUDAN OIL SEEDS 65,022,850 24,021,210 6,000 6,000 0.01 0.01 600,000 0.00
KARMA TRADING 5,453,978 322,076 929 929 0.01 0.01 92,903 0.00
COMMERCIAL BAKERYS 30,000 3,000 0.01 0.1 300,000 0.00
SUDANESE FREE ZONES ANDMARKETS CO. 933,563,720 782,394,380 287,000,000 243,950,000 8.50 10.00 28,700,000 2.18
TAGSEET CO. LTD 181,305,888 117,136,549 3,440,070 894,418 2.60 10.00 344,007 0.01
MZK SHOPPING 111,947,120 69,863,522 89,479,480 89,479,480 10.00 10.00 8,947,948 0.80
COMMERCIAL SECTOER TOTAL 1,460,109,179 1,081,258,689 390,331,808 343,775,376.62 49,360,187 3.07
THE NATIONAL PETROLEUM 27,145,591 17,284,380 16,473,300 14,825,970 1.80 2.00 8,236,650 0.13
NILE CEMENT CO 226,230,367 158,913,150 145,576,085 136,841,519 0.47 0.50 291,152,169 1.22
INDUSTRIAL SECTOER TOTAL 253,375,958 176,197,530 162,049,385 151,667,489.43 299,388,819 1.36
AGRICULTURAL SERVICES 4,139,710,311 2,071,926,061 1,356,620 1,356,620 10.00 10.00 135,662 0.01
SUDANESE ANIMAL RESOURSES(ANAAM) 169,568,713 130,173,303 866,090 866,090 1.00 1.00 866,090 0.01
TALA INVESTMENT CO LTD 227,731,078 227,092,197 220,978,264 220,978,264 1.00 1.00 220,978,264 1.97
AGRICULTURAL SECTOER TOTAL 4,537,010,102 2,429,191,561 223,200,974 223,200,974.00 221,980,016 1.99
THE SUDAN CINEMA 606,710 184,493 7,254 1,450,880 20.00 0.10 72,544 0.01
SUDAN TELECOM.CO. LTD.(SUDATEL) 2,596,771,852 1,755,500,826 1,721,101,803 2,868,503,004 2.55 1.53 1,124,903,139 25.64
ALRIY-ALAAM-PRESSANDPUPLISHING 246,261,079 129,420,504 4,000,000 4,120,000 1.03 1.00 4,000,000 0.04
MULTY MEDIA CO.LTD 75,918,085 24,519,894 1,050,000 1,050,000 1.00 1.00 1,050,000 0.01
PORTSUDAN FOR CINEMA&THEATRE 1,289,616 1,206,373 9,990 539,460 0.54 0.01 999,000 0.00
COMMUNICATIONS SECTOR TOTAL 2,920,847,342 1,910,832,090 1,726,169,047 2,875,663,344.45 1,131,024,683 25.70
ALHIJRA EXCHAHNGE CO.LTD 1,962,726 1,815,177 408,000 612,000 0.15 0.10 4,080,000 0.01
GLOBAL INVESTMENT HOUSE (SUDAN) 70,718,493 68,544,464 60,000,000 75,000,000 12.50 10.00 6,000,000 0.67
ALSAHAM FOR FINANCIALSERVICES 1,811,559 1,713,587 1,650,000 1,504,800 2.28 2.50 660,000 0.01
ALMOHAGER FOR FINANCIALSERVICES 13,000,361 5,937,975 6,250,000 8,125,000 0.13 0.10 62,500,000 0.07
Al_rowad for financial service 15,622,152 15,622,152 1.00 1.00 15,622,152 AL BARAKA FOR FINANCIALSERVICES 8,099,730 8,099,730 1.00 1.00 8,099,730
SERVICES SECTOR TOTAL 87,493,139 78,011,203 68,308,000 108,963,682.00 96,961,882 0.76
ISLAMIC DEVELOPMENT 117,834,000 72,951,000 14,803,827 16,566,187 0.47 0.42 35,247,206 0.15
ALMOHAGER INTERNATIONALFOR INVESTMENT 12,210,469 3,919,485 4,632,210 5,558,652 0.12 0.10 46,322,096 0.05
SUDANESE KUWAITI ROADTRANSPORT 3,163,320 2,511,897 3,750 18,750 0.15 0.03 125,000 0.00
MODREN CONSTRUCTIONS 5,783,710 3,635,803 5,761,690 5,358,372 9.30 10.00 576,169 0.05
NATIONAL LEASING &INV.CO 34,620,700 43,622,082 126.00 100.00 346,207 0.39
ALROWD REAL ESTATEDEVELOPMENT 94,860,000 95,325,000 2.05 2.04 46,500,000 0.85
OTHERS SECTOR TOTAL 138,991,499 83,018,185 154,682,176 166,449,042.04 129,116,678 1.49
GRAND TOTAL 27,480,525,992 7,847,441,563 7,187,540,023 11,188,777,912.61 9,296,323,273 97
24
Rates of daily trading
Average daily trading is the result of dividing the sum of any of the trading indicators (number of shares, trading volume, etc…..) at the end of a given period divided by the number of trading days during the period.
In the year 2013 the number of trading day was (249) day. the average daily trading volume was SDG (15.6) billion pounds, compared with SDG (12.2) billion ponds is the average daily trading for the year 2012, the average daily trading for shares traded has reached (324,729) shares a day compared with the average (693,095) shares per day during the year 2012, for the Government Musharaka Certificates (GMCs), the average daily trading during the year (28,045) instrument per day, compared with a daily average (20,549) instrument in 2012, and the sukuk of investment funds, the average daily circulation was (5,813) instrument compared with the average daily trading reached (23,267) instrument in 2012, for contracts executed during this year has a daily average of (66) contracts per day compared to (55) contract is the average daily number of contracts executed during the year 2012.
ANNUAL REPORT 2013
25
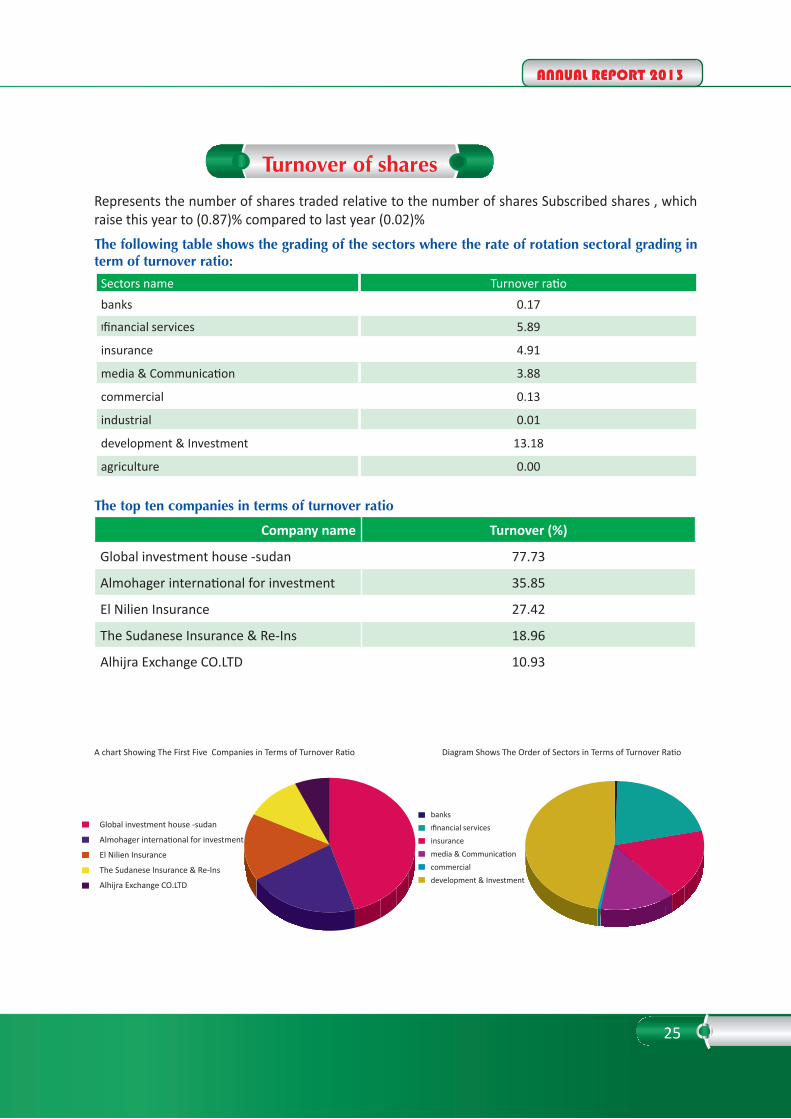
Turnover of shares
Represents the number of shares traded relative to the number of shares Subscribed shares , which raise this year to (0.87)% compared to last year (0.02)%
The following table shows the grading of the sectors where the rate of rotation sectoral grading in term of turnover ratio:
Sectors name Turnover ratio
banks 0.17
financial servicesا 5.89
insurance 4.91
media & Communication 3.88
commercial 0.13
industrial 0.01
development & Investment 13.18
agriculture 0.00
The top ten companies in terms of turnover ratio
Turnover (%)Company name
77.73Global investment house -sudan
35.85Almohager international for investment
27.42El Nilien Insurance
18.96The Sudanese Insurance & Re-Ins
10.93Alhijra Exchange CO.LTD
banksfinancial servicesاinsurancemedia & Communicationcommercialdevelopment & Investment
Global investment house -sudan
Almohager international for investment
El Nilien Insurance
The Sudanese Insurance & Re-Ins
Alhijra Exchange CO.LTD
A chart Showing The First Five Companies in Terms of Turnover Ratio Diagram Shows The Order of Sectors in Terms of Turnover Ratio
26
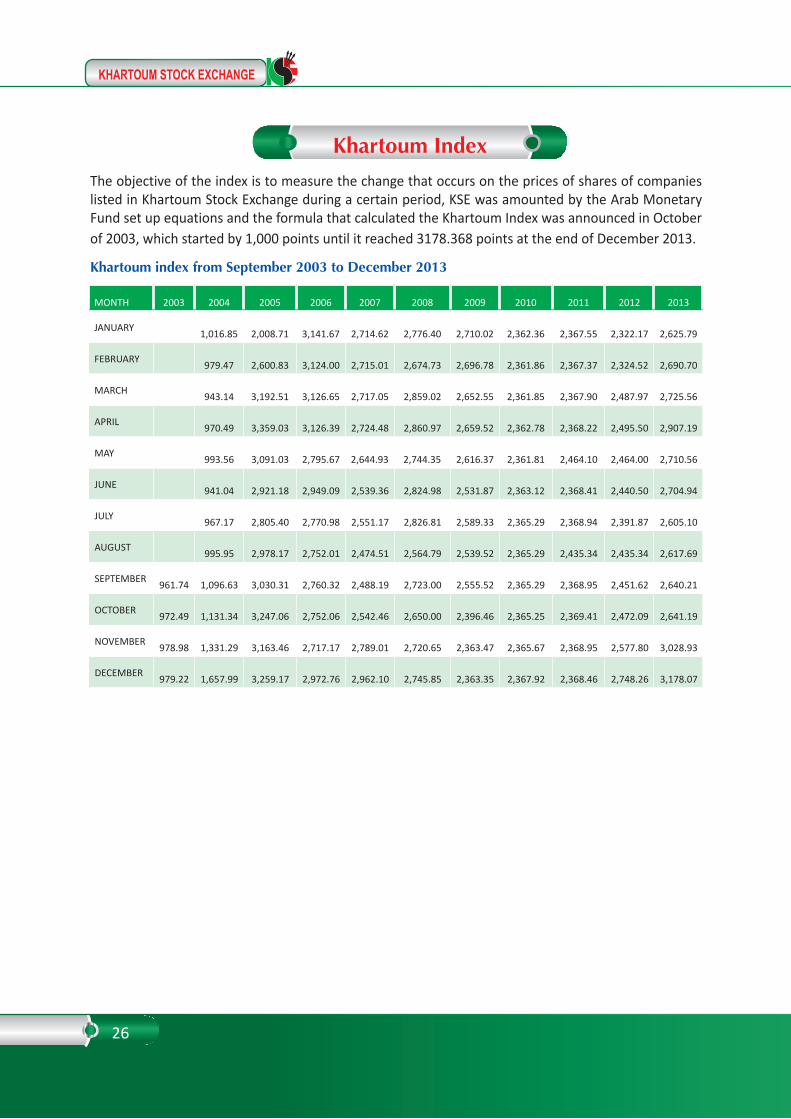
The objective of the index is to measure the change that occurs on the prices of shares of companies listed in Khartoum Stock Exchange during a certain period, KSE was amounted by the Arab Monetary Fund set up equations and the formula that calculated the Khartoum Index was announced in October of 2003, which started by 1,000 points until it reached 3178.368 points at the end of December 2013.
Khartoum index from September 2003 to December 2013
Khartoum Index
MONTH 2003 2004 2005 2006 2007 2008 2009 2010 2011 2012 2013
JANUARY
1,016.85
2,008.71
3,141.67
2,714.62
2,776.40
2,710.02
2,362.36
2,367.55 2,322.17 2,625.79
FEBRUARY
979.47
2,600.83
3,124.00
2,715.01
2,674.73
2,696.78
2,361.86
2,367.37 2,324.52 2,690.70
MARCH
943.14
3,192.51
3,126.65
2,717.05
2,859.02
2,652.55
2,361.85
2,367.90 2,487.97 2,725.56
APRIL
970.49
3,359.03
3,126.39
2,724.48
2,860.97
2,659.52
2,362.78
2,368.22 2,495.50 2,907.19
MAY
993.56
3,091.03
2,795.67
2,644.93
2,744.35
2,616.37
2,361.81
2,464.10 2,464.00 2,710.56
JUNE
941.04
2,921.18
2,949.09
2,539.36
2,824.98
2,531.87
2,363.12
2,368.41 2,440.50 2,704.94
JULY
967.17
2,805.40
2,770.98
2,551.17
2,826.81
2,589.33
2,365.29
2,368.94 2,391.87 2,605.10
AUGUST
995.95
2,978.17
2,752.01
2,474.51
2,564.79
2,539.52
2,365.29
2,435.34 2,435.34 2,617.69
SEPTEMBER 961.74
1,096.63
3,030.31
2,760.32
2,488.19
2,723.00
2,555.52
2,365.29
2,368.95 2,451.62 2,640.21
OCTOBER 972.49
1,131.34
3,247.06
2,752.06
2,542.46
2,650.00
2,396.46
2,365.25
2,369.41 2,472.09 2,641.19
NOVEMBER 978.98
1,331.29
3,163.46
2,717.17
2,789.01
2,720.65
2,363.47
2,365.67
2,368.95 2,577.80 3,028.93
DECEMBER 979.22
1,657.99
3,259.17
2,972.76
2,962.10
2,745.85
2,363.35
2,367.92
2,368.46 2,748.26 3,178.07
ANNUAL REPORT 2013
27
The sectors activity during the year 2013

28
Banking Sector
COMPANY NAME
SHARESTRADED
VOLUMETRADED
CONTRACTSEXCUTED
OPENINGPRICE
CLOSEDPRICE
SHARESTRADED TO THETOTAL
VOLUMETRADED TO THETOTAL
MARKETد
CAPITALIZATION
TURNOVER RATIO
DAYS TRADED
EXPORT DEVOLOPMENTBANK 163,239 14,691.51 1 0.09 0.09 1.30% ٫15% 54,000,000 0.03 1
TADAMON ISLAMICBANK 300,722 428,668.88 27 1.54 1.42 2.40% 4٫34٪ 144,318,044 0.30 12
SUDANESE FRENCHBANK 1,188 4,738.35 9 4.13 4.15 0.01% 0.05% 285,368,596 - 6
SAUDI SUDANESE BANK 16,368 6,811.60 4 0.4 0.4 0.13% 0.10% 658,966,168 - 3
SUDANESE ISLAMICBANK 6,165,704 986,512.64 26 0.16 0.16 49.24% 9٫98٪ 123,368,484 0.80 14
ALSHAMAL ISLAMICBANK 951,621 713,862.07 6 0.74 0.77 7.60% 7٫22% 96,250,000 0.76 5
FAISAL ISLAMIC BANK(SUDAN) 366,526 2,155,801.05 73 5.69 5.7 2.93% 21٫8٪ 1,995,000,000 0.10 48
FARMERS COMMERCIALBANK 433,734 659,205.31 25 1.43 1.55 3.46% 6٫67٪ 165,187,392 0.41 21
ANIMAL RESOURCESBANK 140,002 12,600.18 4 0.09 0.09 1.12% ٫13% 140,727,526 0.01 2
FINANCIAL INVESTMENTBANK 7,068 7,234.11 6 1 1 0.06% 0٫08 122,100,000 0.01 5
ISLAMIC DEVELOPMENTCO-OPRATIVE BANK 209,382 12,562.92 11 0.06 0.06 1.67% ٫13 51,089,860 0.02 7
BANK OF KHARTOUM 3,604,274 4,550,480.69 84 1.54 1.34 28.78% 46٫02% 425,449,997 1.14 41
OMDURMAN NATIONALBANK - - 0 10 10 0.00% 0.00% 800,000,000 -
IVORY BANK - - 0 0.3 0.3 0.00% 0.00% 8,089,998 -
JAZIRA SUDANESE JORD
1,511 7,742.33 3 5.9 5.37 0.01% 0.08% 354,250,231 - 3
BULE NILE MASHRIGBANK - - 0 3.74 3.74 0.00% 0.00% 100,557,119 -
WORKERS NATIONALBANK - - 0 0.8 0.8 0.00% 0.00% 254,100,000 0.07
ALSLAM BANK 81,818 180,030.75 4 2.3 2.2 0.65% 1٫82٪ 297,600,000 - 4
UNITED CAPITAL BANK - - 0 12.4 12.4 0.00% 0.00% 152,700,000 -
BYBLOS BANK AFRICA - - 0 10.18 10.18 0.00% 0.00% 135,018,357 0.04
SUDANESE EGYPTIONBANK 39,994 47,592.86 1 1.2 1.19 0.32% ٫49% 439,585,692 - 1
ALBARAKA BANK 38,435 100,315.35 1 3.5 3.5 0.31% 1٫04% 108,123,603 0.12 1
SUDANESE NATIONALBANK - - 0 710 710 0.00% 0.00% 213,000,000 - -
TOTAL =23 BANKS 12,521,586 9,888,851.00 285 100.00% 100% 7,124,851,067 0.17
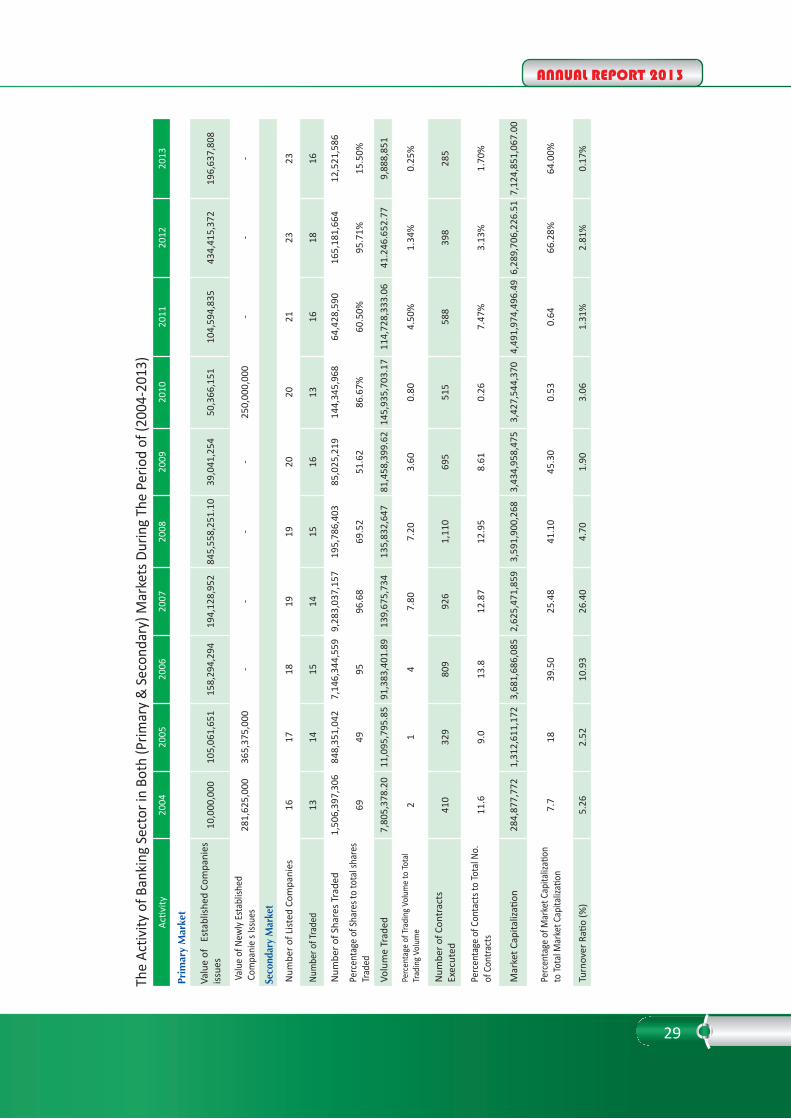
The banking sector has witnessed Trading in the shares of 16 banks out of 23 banks which constitute the sector , the number of shares traded has reached (12,521,586) shares ,with a value of trading of SDG (9,888,851) , and the number of contracts executed in the banking sector (285) contracts, the total market capitalization of the banking sector during this year was SDG (7,124,851,066.72) compared to SDG (6,289,706,226.51) last year, also the turnover ratio of banking sector this year was 0.17%.
Annual bulletin for banking Sector:
ANNUAL REPORT 2013
29
The
Activ
ity o
f Ban
king
Sec
tor i
n Bo
th (P
rimar
y &
Sec
onda
ry) M
arke
ts D
urin
g Th
e Pe
riod
of (2
004-
2013
)20
1320
1220
1120
1020
0920
0820
0720
0620
0520
04 A
ctivi
ty
Prim
ary
Mar
ket
196
,637
,808
434
,415
,372
104
,594
,835
50,
366,
151
39,
041,
254
845
,558
,251
.10
194
,128
,952
158
,294
,294
105
,061
,651
10,
000,
000
Val
ue o
f E
stab
lishe
d Co
mpa
nies
issue
s
-
- -
250
,000
,000
- -
- -
365
,375
,000
281
,625
,000
Val
ue o
f New
ly Es
tabl
ished
Com
pani
e s I
ssue
s
Seco
ndar
y M
arke
t
23
23
21
20
20
19
19
18
17
16
Num
ber o
f List
ed C
ompa
nies
16
18
16
13
16
15
14
15
14
13
Num
ber o
f Tra
ded
12,
521,
586
165
,181
,664
64,
428,
590
144
,345
,968
85,
025,
219
195
,786
,403
9,2
83,0
37,1
57 7
,146
,344
,559
848
,351
,042
1,5
06,3
97,3
06 N
umbe
r of S
hare
s Tra
ded
15.5
0%95
.71%
60.5
0%86
.67%
51.
62 6
9.52
96.
68 9
5 4
9 6
9 P
erce
ntag
e of
Shar
es to
tota
l sha
res
Trad
ed
9,88
8,85
141
.246
.652
.77
114
,728
,333
.06
145
,935
,703
.17
81,
458,
399.
62 1
35,8
32,6
47 1
39,6
75,7
34 9
1,38
3,40
1.89
11,
095,
795.
85 7
,805
,378
.20
Vol
ume
Trad
ed
0.25
%1.
34%
4.50
% 0
.80
3.6
0 7
.20
7.8
0 4
1 2
Per
cent
age
of Tr
adin
g Vol
ume
to To
tal
Trad
ing V
olum
e
285
398
588
515
695
1,1
10 9
26 8
09 3
29 4
10N
umbe
r of C
ontr
acts
Exe
cute
d
1.70
%3.
13%
7.47
% 0
.26
8.6
1 1
2.95
12.
87 1
3.8
9.0
11.
6 P
erce
ntag
e of
Con
tact
s to
Tota
l No.
of C
ontra
cts
7,1
24,8
51,0
67.0
0 6
,289
,706
,226
.51
4,4
91,9
74,4
96.4
9 3
,427
,544
,370
3,4
34,9
58,4
75 3
,591
,900
,268
2,6
25,4
71,8
59 3
,681
,686
,085
1,3
12,6
11,1
72 2
84,8
77,7
72M
arke
t Cap
italiz
ation
64.0
0%66
.28%
0.6
4 0
.53
45.
30 4
1.10
25.
48 3
9.50
18
7.7
Per
cent
age
of M
arke
t Cap
italiz
ation
to To
tal M
arke
t Cap
italiz
ation
0.17
%2.
81%
1.31
% 3
.06
1.9
0 4
.70
26.
40 1
0.93
2.5
2 5
.26
Tur
nove
r Rati
o (%
)

30
Market Capitalization of The Banking Sector During 2004 to 2013
Shares Traded of The Banking Sector During 2004 to 2013
Volume Traded of The Banking Sector During 2004 to 2013
Contracts Executed of The Banking Sector During 2004 to 2013
2004 2005 2006 2007 2008 2009 2010 2011 2012 2013
2004 2005 2006 2007 2008 2009 2010 2011 2012 2013
2004 2005 2006 2007 2008 2009 2010 2011 2012 2013
2004 2005 2006 2007 2008 2009 2010 2011 2012 2013

ANNUAL REPORT 2013
31
The Insurance sector
the Insurance sector witnessed trading of shares of 3 companies out of 8 companies that made up the sector where the number of shares traded in the insurance sector was (1,714,813) shares with a trading value of SDG (1,636,697) have been implemented in (32) contract, the total market capitalization of the insurance sector was SDG (194,206,937.35), and the turnover ratio for the insurance sector was 4.91%
COMPANYNAME
SHARESTRADED
VOLUMETRADED
CONTRACTSEXCUTED
OPENINGPRICE
CLOSEDPRICE
SHARESTRADED TO THETOTAL
VOLUMETRADED TO THETOTAL
MARKET CAPITALIZATION
TURNOVER
RATIO
DAYS TRADED
GENERALINSURANCE - - - 0.01 0.01 0.00% 0.00% 50,000 - -
TAAWUNIYINSURANCE CO. - - - 1 1 0.00% 0.00% 17,135,267 - -
THE SUDANESE INSURANCE &RE-INSURANCE
56,874 441,465.00 6 5 5 3.32% 27% 1,500,000 18.96 6
EL NILEININSURANCE 1,644,939 1,188,731.75 19 0.75 0.75 95.93% 72.6% 4,500,000 24.42 10
THE BULE NILEINSURANCE 13,000 6,500.00 7 0.5 0.5 0.76% 0.4% 3,000,000 0.22 4
THE NATIONALRE-INSURANCE - - - 2.35 2.35 0.00% 0.00% 11,821,670 - -
ALSSLAMAINSURANCE - - - 10 10 0.00% 0.00% 5,000,000 - -
JUBAINSURANCE CO. - - - 31.5 31.5 0.00% 0.00% 151,200,000 - -
TOTAL=8COMPANIES 1,714,813.00 1,636,697.00 32 100.00% 100% 194,206,937 4.91

32
The Activity of Insurance Sector In both (Prim
ary & Secondary) M
arkets During the period of (2004-2013)
Activity2004
20052006
20072008
20092010
20112012
2013
Primary M
arket
Value of Established Companie>s issues
- -
2,146,784 -
2,146,774.50 -
- 5,250,000
2,487,500 12,805,534
Value of Newly Established Com
panie>s Issues -
- -
- -
- -
- -
-
Secondary Market
Num
ber of Listed Companies
9 9
8 8
8 8
8 8
8 8
Num
ber of Traded 3
3 2
4 2
5 4
5 3
3
Num
ber of Shares Traded 7,380
2,091 1,797
8,039,661 77,964
168,890 133,891
1,396,316 94,234
1,714,813
Percentage of Shares to total shares Traded -
- -
0.09 0.03
0.100.08%
1.31%0.05%
2.12%
Volume Traded
3,709.60 5,300.60
5,912.36 1,906,365
1,846,578 139,382.50
67,735.60 35,473,425.95
86,282.00 1,636,697.00
Percentage of Trading Volume to Total Trading Volum
e -
- -
0.11 0.10
0.01 0.04
1.38%0.00%
0.04%
Number of Contracts Executed
4 11
5 9
2 18
16 22
9 32
Percentage of Contacts to Total No. of Contracts
0.1 0.3
0.1 0.13
0.02 0.22
0.190.28%
0.07%0.19%
Market Capitalization
6,959,877 6,959,877
11,807,196 26,327,786
11,441,660 15,139,905
87,234,974 151,475,000.05
151,975,600.05 194,206,937.00
Percentage of Market Capitalization to Total
Market Capitalization
0.1 -
0.13 0.26
0.13 0.20
0.54 2.14
1.58%2.00%
Turnover Ratio (%)
0.04 0.01
0.02 5.16
0.87 1.65
1.028.38%
0.53%4.91%

ANNUAL REPORT 2013
33
Market Capitalization Of The Insurance Sector During 2004 to 2013
Contracts Executed Of the Insurance Sector During 2004 to 2013
Shares Traded Of The Insurance Sector During 2004 to 2013
Volume Traded Of The Insurance Sector During 2004 to 2013
2007200620052004 2008 2009 20112010 2012 2013
2007200620052004 2008 2009 20112010 2012 2013
2007200620052004 2008 2009 20112010 2012 2013
2007200620052004 2008 2009 20112010 2012 2013
34
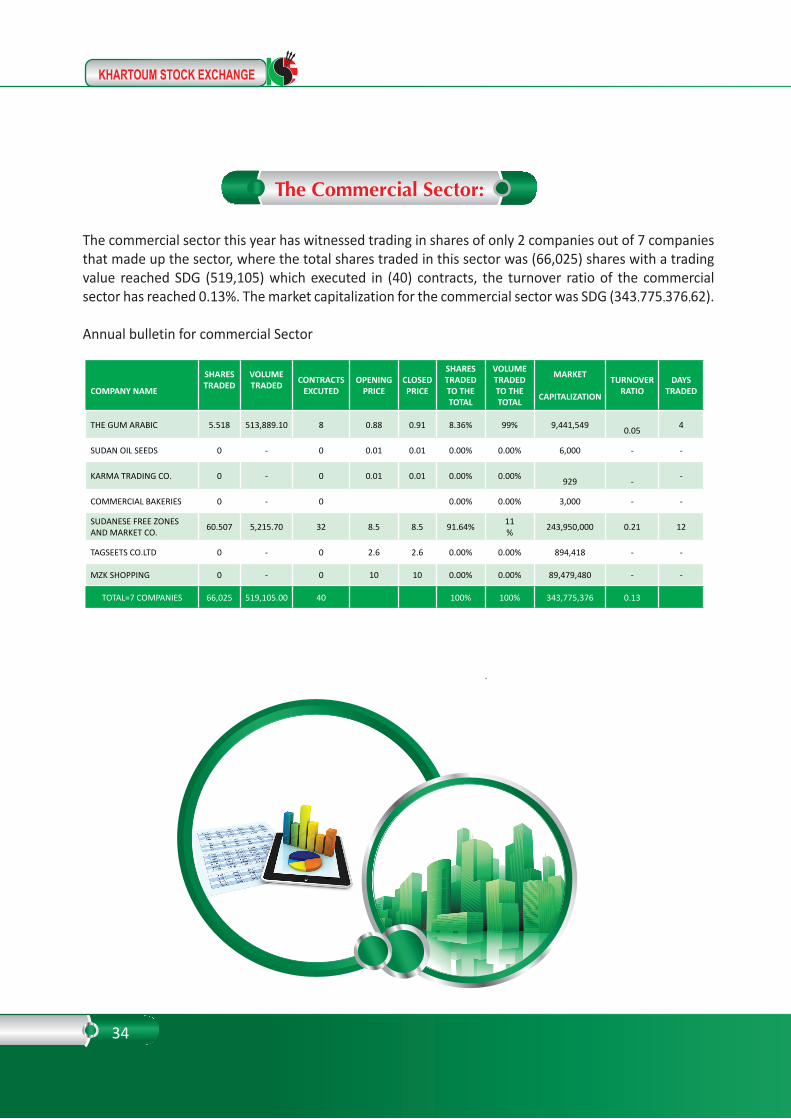
The commercial sector this year has witnessed trading in shares of only 2 companies out of 7 companies that made up the sector, where the total shares traded in this sector was (66,025) shares with a trading value reached SDG (519,105) which executed in (40) contracts, the turnover ratio of the commercial sector has reached 0.13%. The market capitalization for the commercial sector was SDG (343٫775٫376٫62).
Annual bulletin for commercial Sector
COMPANY NAME
SHARESTRADED
VOLUMETRADED
CONTRACTSEXCUTED
OPENINGPRICE
CLOSEDPRICE
SHARESTRADED TO THETOTAL
VOLUMETRADED TO THETOTAL
MARKET
CAPITALIZATION
TURNOVER RATIO
DAYS TRADED
THE GUM ARABIC 5.518 513,889.10 8 0.88 0.91 8.36% 99% 9,441,549 0.05 4
SUDAN OIL SEEDS 0 - 0 0.01 0.01 0.00% 0.00% 6,000 - -
KARMA TRADING CO. 0 - 0 0.01 0.01 0.00% 0.00% 929
- -
COMMERCIAL BAKERIES 0 - 0 0.00% 0.00% 3,000 - -
SUDANESE FREE ZONESAND MARKET CO. 60.507 5,215.70 32 8.5 8.5 91.64% 11
% 243,950,000 0.21 12
TAGSEETS CO.LTD 0 - 0 2.6 2.6 0.00% 0.00% 894,418 - -
MZK SHOPPING 0 - 0 10 10 0.00% 0.00% 89,479,480 - -
TOTAL=7 COMPANIES 66,025 519,105.00 40 100% 100% 343,775,376 0.13
The Commercial Sector:

ANNUAL REPORT 2013
35
Acti
vity
2004
2005
2006
2007
2008
2009
2010
2011
2012
2013
Prim
ary
Mar
ket
Val
ue o
f Est
ablis
hed
Com
pani
es is
sues
- -
- -
- -
- -
- -
Valu
e of N
ewly
Esta
blish
edCo
mpa
nies
Issu
es -
100
,000
,000
- -
- -
- 3
5,28
5,58
0 -
-
Sec
onda
ry M
arke
t
Num
ber o
f List
ed C
ompa
nies
7 7
8 7
7 7
7 7
7 8
Num
ber o
f Tra
ded
3 3
4 4
3 3
2 4
2 2
Num
ber o
f Sha
res
Tra
ded
650
,938
,699
848
,004
,847
316
,016
,136
22,
604,
652
908
,726
1,4
79,9
69 2
13,4
96 1
09,2
18 6
2,70
466
,025
Per
cent
age
of S
hare
s to
tota
l sha
res T
rade
d 2
9.78
49
4.1
8 0
.24
0.3
2 0
.90
0.1
30.
10%
0.04
%0.
08%
Vol
ume
Trad
ed 3
9,29
0,11
7.41
18,
309,
531.
16 2
2,31
3,40
3.86
21,
956,
561.
20 6
,189
,760
.55
15,
117,
244
501
,172
215
,954
.33
378
.964
.52
519,
105
Per
cent
age
of T
radi
ng V
olum
e to
Tota
l T
radi
ng V
olum
e 8
.8 1
.5 1
.1 1
.2 0
.30
0.7
0 0
.020
0%0%
0%
Num
ber o
f Con
trac
ts E
xecu
ted
222
429
248
76
90
28
24
23
22
40
Per
cent
age
of C
onta
cts t
o To
tal N
o. o
f Con
trac
ts 6
.3 1
1.7
4.2
1.0
6 1
.05
0.3
5 0
.29
0.29
%0.
17%
0.24
%
Mar
ket C
apita
lizati
on 9
82,0
54,6
71 3
09,4
31,9
92 7
87,4
39,3
95 7
55,5
84,0
78 3
92,1
36,8
15 4
12,9
11,8
38 3
76,4
31,8
38 3
87,9
35,9
17 3
41,9
12,1
64 3
43,7
75,3
77
Per
cent
age
of M
arke
t C
apita
lizati
on to
Tota
l M
arke
t Cap
italiz
ation
26.
6 4
8.4
6 7
.33
4.5
9 5
.40
5.7
3 5
.49
3.55
%3.
00%
Tur
nove
r Rati
o (%
) 6
.3 8
.2 3
16.
14 1
.96
3.1
9 0
.43
0.22
%0.
13%
0.13
%
The
Act
ivit
y of
Com
mer
cial
Sec
tor
in B
oth
(Pri
mar
y &
Sec
onda
ry)
Mar
kets
dur
ing
the
year
(20
04 -
201
3 )
36
2007200620052004 2008 2009 20112010 2012 2013
2007200620052004 2008 2009 20112010 2012 2013
2007200620052004 2008 2009 20112010 2012 2013
2007200620052004 2008 2009 20112010 2012 2013
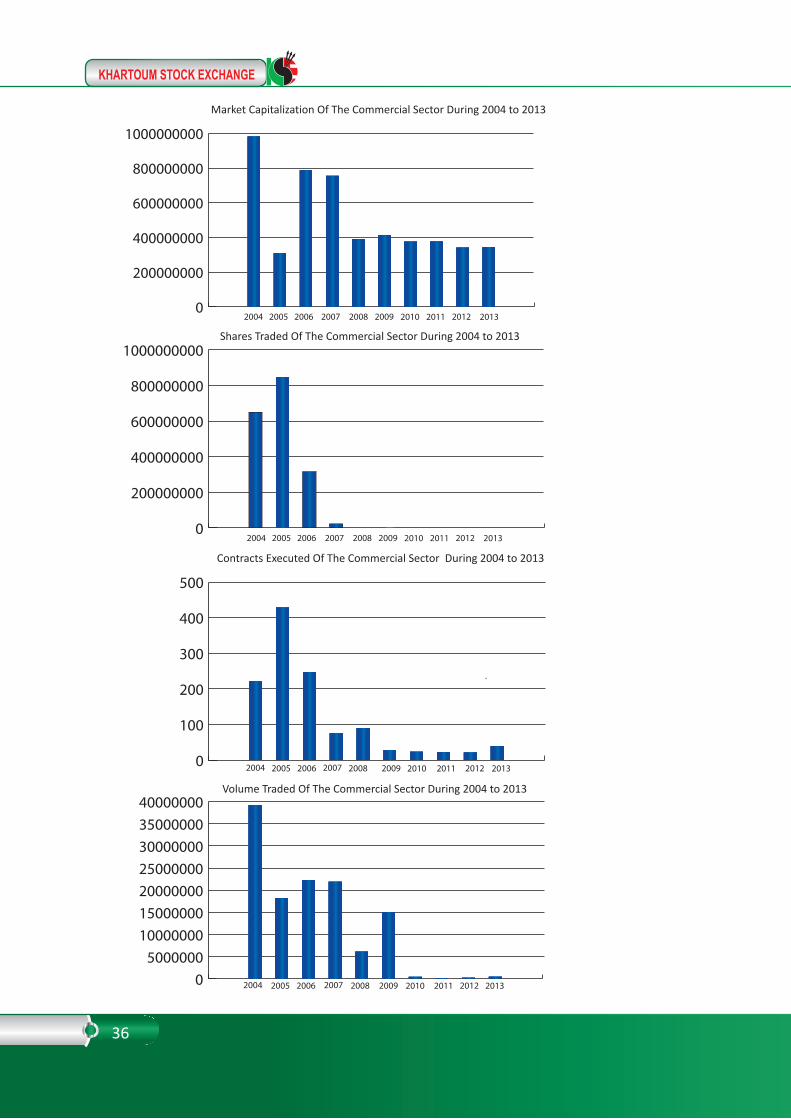
Market Capitalization Of The Commercial Sector During 2004 to 2013
Shares Traded Of The Commercial Sector During 2004 to 2013
Contracts Executed Of The Commercial Sector During 2004 to 2013
Volume Traded Of The Commercial Sector During 2004 to 2013

ANNUAL REPORT 2013
37
COMPANY NAME
SHARESTRADED
VOLUMETRADED
CONTRACTSEXCUTED
OPENINGPRICE
CLOSEDPRICE
SHARESTRADED TO THETOTAL
VOLUMETRADED TO THETOTAL
MARKET CAPITALIZATION
TURNOVER RATIO
DAYS TRADED
THE NATIONALPETROLEUM - 0 0 1.8 1.8 0.00% 0.00% 14,825,970 -- -
NILE CEMENT-RABAK 30,820 15,026.74 2 0.47 0.47 100.00% 100 % 136,841,519
0.01
2
TOTAL=2COMPANIES 30,820 15,026.74 2 100% 100% 151,667,489 0٫01
The Industrial Sector
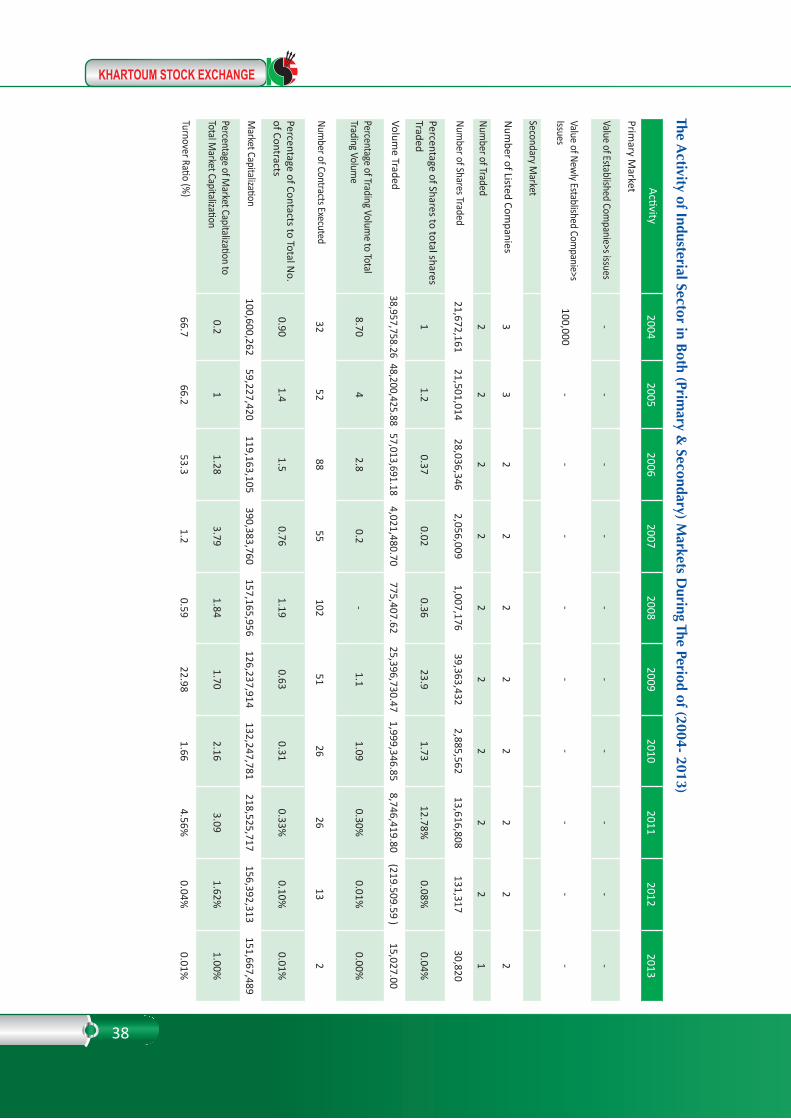
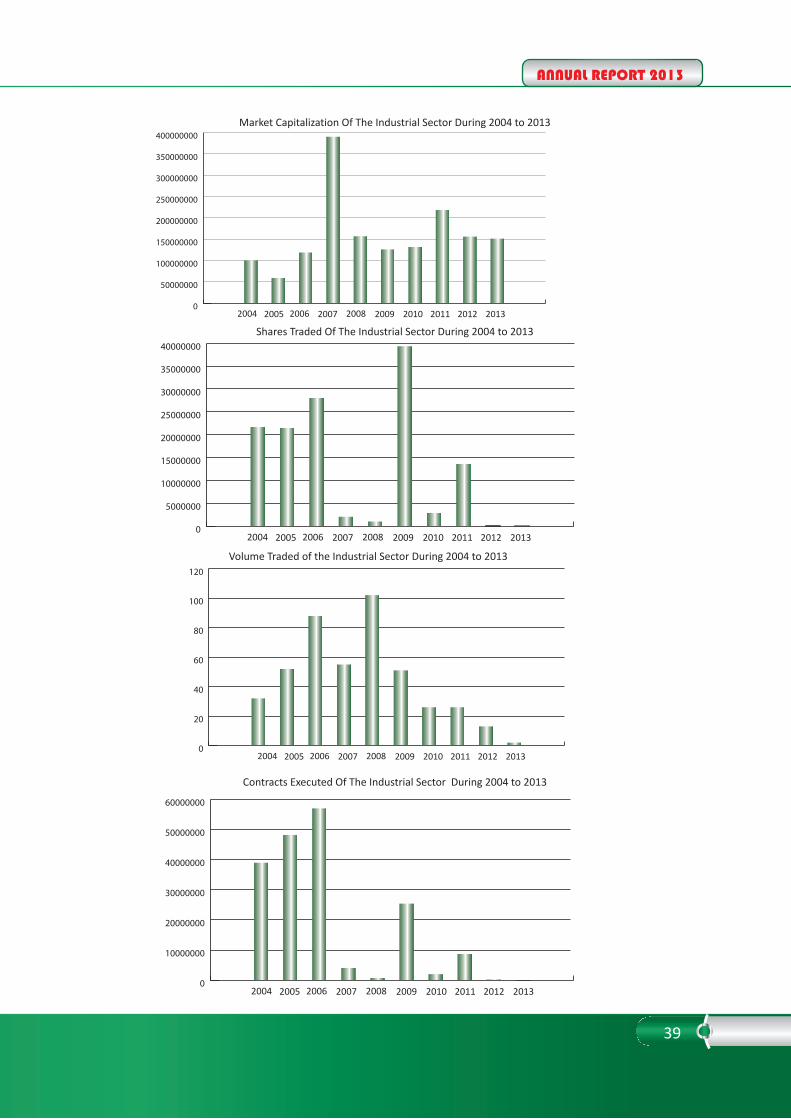
The shares traded in this sector reached (30,820) shares with the value of trading of SDG (15,027), It has been trading of shares of a single company through two transactions. The total market capitalization of the industrial sector was SDG (151,667,490) and the turnover ratio in the industrial sector was 0.01%.
38
The Activity of Industerial Sector in B
oth (Primary &
Secondary) Markets D
uring The Period of (2004- 2013)
Activity2004
20052006
20072008
20092010
20112012
2013
Primary M
arket
Value of Established Companie>s issues
- -
- -
- -
- -
- -
Value of Newly Established Com
panie>sIssues
100,000 -
- -
- -
- -
- -
Secondary Market
Num
ber of Listed Companies
3 3
2 2
2 2
2 2
2 2
Number of Traded
2 2
2 2
2 2
2 2
2 1
Number of Shares Traded
21,672,161 21,501,014
28,036,346 2,056,009
1,007,176 39,363,432
2,885,562 13,616,808
131,317 30,820
Percentage of Shares to total shares Traded
1 1.2
0.37 0.02
0.36 23.9
1.7312.78%
0.08%0.04%
Volume Traded
38,957,758.26 48,200,425.88
57,013,691.18 4,021,480.70
775,407.62 25,396,730.47
1,999,346.85 8,746,419.80
(219.509.59 ) 15,027.00
Percentage of Trading Volume to Total
Trading Volume
8.70 4
2.8 0.2
- 1.1
1.090.30%
0.01%0.00%
Number of Contracts Executed
32 52
88 55
102 51
26 26
13 2
Percentage of Contacts to Total No.
of Contracts 0.90
1.4 1.5
0.76 1.19
0.63 0.31
0.33%0.10%
0.01%
Market Capitalization
100,600,262 59,227,420
119,163,105 390,383,760
157,165,956 126,237,914
132,247,781 218,525,717
156,392,313 151,667,489
Percentage of Market Capitalization to
Total Market Capitalization
0.2 1
1.28 3.79
1.84 1.70
2.16 3.09
1.62%1.00%
Turnover Ratio (%)
66.7 66.2
53.3 1.2
0.59 22.98
1.664.56%
0.04%0.01%
ANNUAL REPORT 2013
39
Market Capitalization Of The Industrial Sector During 2004 to 2013
Shares Traded Of The Industrial Sector During 2004 to 2013
Contracts Executed Of The Industrial Sector During 2004 to 2013
2004 2005 2006 2007 2008 2009 2010 2011 2012 2013
2004 2005 2006 2007 2008 2009 2010 2011 2012 2013
2004 2005 2006 2007 2008 2009 2010 2011 2012 2013
2004 2005 2006 2007 2008 2009 2010 2011 2012 2013
Volume Traded of the Industrial Sector During 2004 to 2013
40
The Agricultural Sector
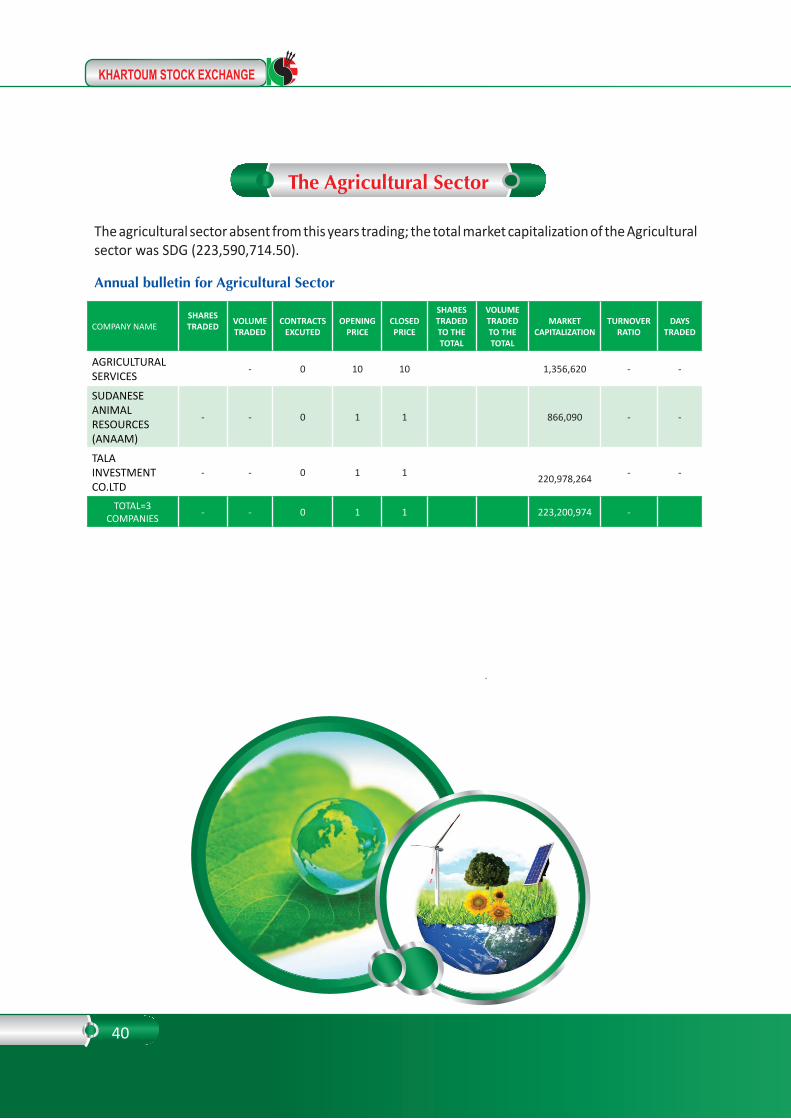
The agricultural sector absent from this years trading; the total market capitalization of the Agricultural sector was SDG (223,590,714.50).
Annual bulletin for Agricultural Sector
COMPANY NAME SHARESTRADED VOLUME
TRADEDCONTRACTS
EXCUTED OPENING
PRICE CLOSED
PRICE
SHARESTRADED TO THETOTAL
VOLUMETRADED TO THETOTAL
MARKET CAPITALIZATION
TURNOVER RATIO
DAYS TRADED
AGRICULTURALSERVICES
- 0 10 10 1,356,620 - -
SUDANESE ANIMAL RESOURCES(ANAAM)
- - 0 1 1 866,090 - -
TALA INVESTMENTCO.LTD
- - 0 1 1 220,978,264 - -
TOTAL=3COMPANIES - - 0 1 1 223,200,974 -

ANNUAL REPORT 2013
41
Act
ivit
y in
Agr
icul
trua
l sec
tor
Dur
ing
the
peri
od (
200
4-20
13)
Acti
vity
2004
2005
2006
2007
2008
2009
2010
2011
2012
2013
Prim
ary
Mar
ket
Valu
e of
Esta
blish
ed C
ompa
nie>
s iss
ues
- -
- -
- -
- -
- -
Valu
e of
New
ly E
stab
lishe
d aI
ssue
s 1
,350
,000
145
,000
85,
008,
716
- -
- -
- -
-
Seco
ndar
y Mar
ket
Num
ber o
f List
ed C
ompa
nies
2 2
2 3
3 3
3 3
3 3
Num
ber o
f Tra
ded
- -
- 1
2 -
1 1
- -
Num
ber o
f Sha
res T
rade
d -
- -
43,
500
67,
900
- 7
,050
80
- -
Per
cent
age
of Sh
ares
to to
tal s
hare
s Tra
ded
- -
- -
0.0
2 -
-0.
00%
0.00
%0.
00%
Vol
ume
Trad
ed -
- -
47,
850.
00 8
3,70
7.50
- 7
,060
.00
800
.00
- -
Per
cent
age
of T
radi
ng V
olum
e to
Tota
l T
radi
ng V
olum
e -
- -
- -
- -
0.00
%0.
00%
0.00
%
Num
ber o
f Con
trac
ts E
xecu
ted
- -
- 3
14
- 2
1 -
-
Per
cent
age
of C
onta
cts t
o To
tal N
o. o
f Con
tract
s -
- -
0.0
4 0
.16
- 0
.02
0.01
%0.
00%
0.00
%
Mar
ket C
apita
lizati
on 3
,003
,556
3,0
03,5
56 3
,017
,716
246
,103
,642
34,
149,
513
267
,482
,025
223
,286
,373
223
,286
,373
223
,286
,373
223
,200
,974
Per
cent
age
of M
arke
t Cap
italiz
ation
to To
tal
Mar
ket C
apita
lizati
on 0
.1 -
0.0
3 2
.39
0.4
0 3
.50
3.6
3 3
.16
2.32
%2.
00%
Turn
over
Rati
o (%
) -
- -
0.0
0.2
5 -
-0.
00%
0.00
%0.
00%
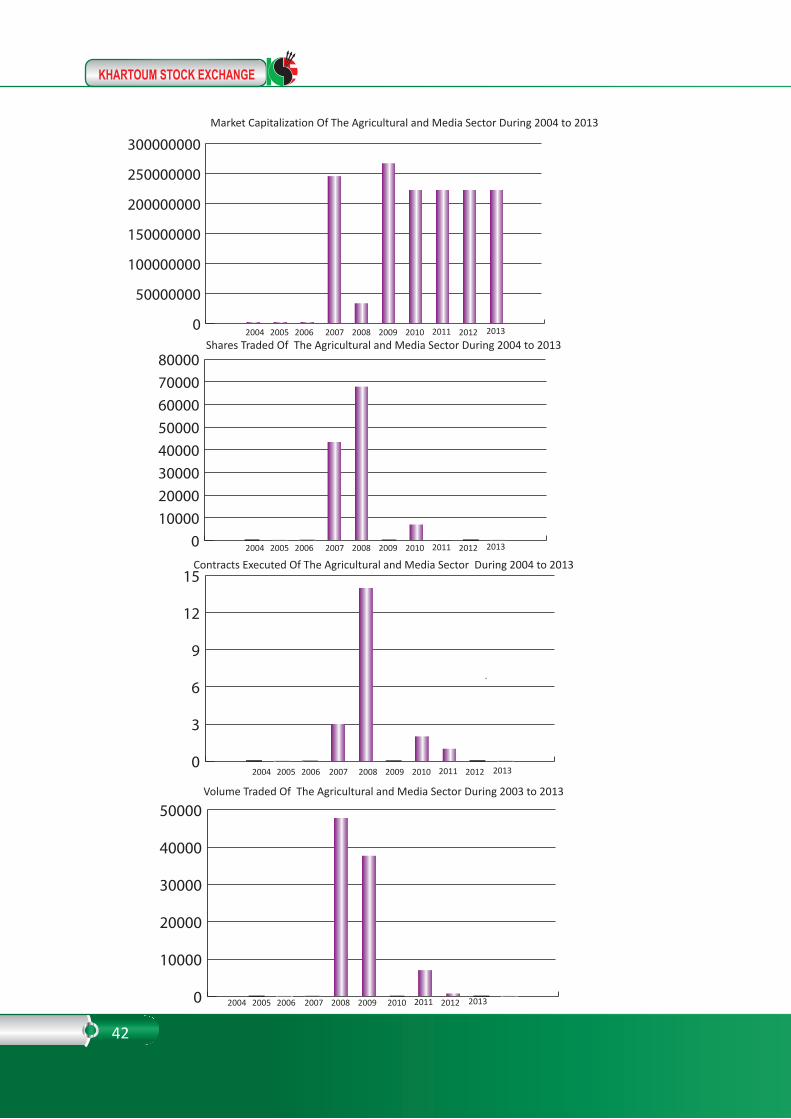
42
Market Capitalization Of The Agricultural and Media Sector During 2004 to 2013
Shares Traded Of The Agricultural and Media Sector During 2004 to 2013
Contracts Executed Of The Agricultural and Media Sector During 2004 to 2013
Volume Traded Of The Agricultural and Media Sector During 2003 to 2013
2004 2005 2006 2007 2008 2009 2010 2011 2012
2004 2005 2006 2007 2008 2009 2010 2011 2012 2013
2004
2004
2005
2005
2006
2006
2007
2007
2008
2008
2009
2009
2010
2010
2011
2011
2012
2012
2013
2013
2013

ANNUAL REPORT 2013
43
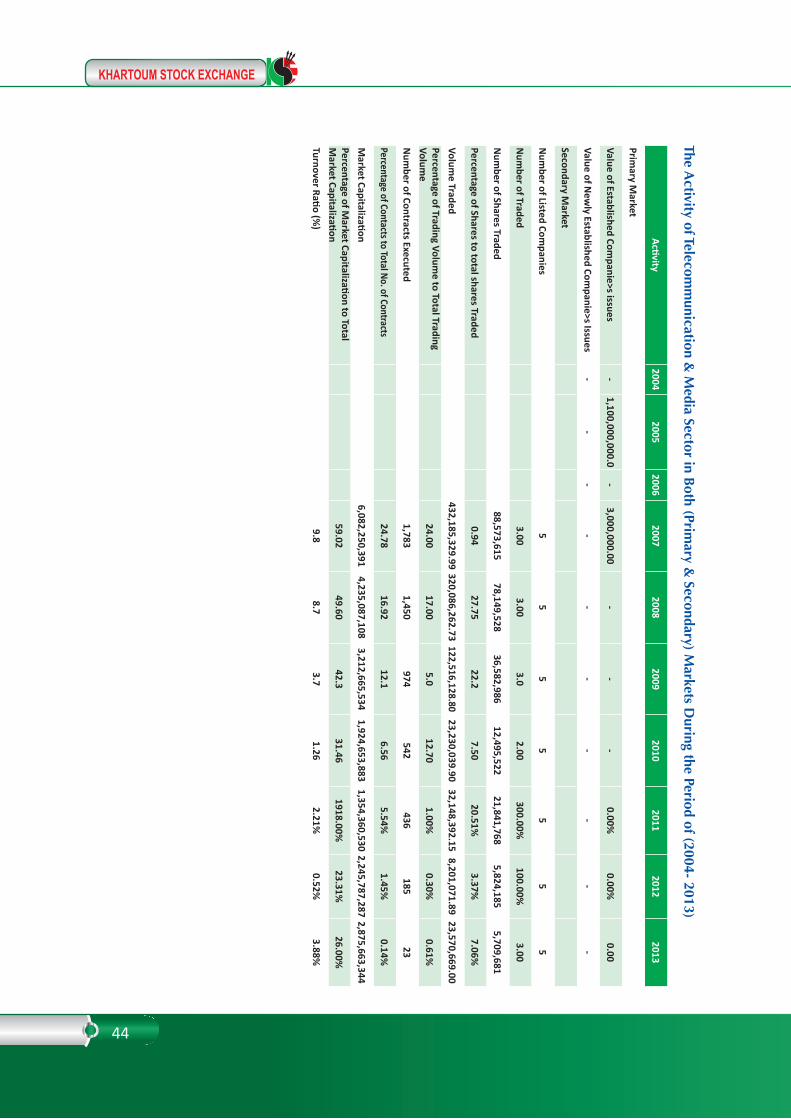
The telecommunications sector witnessed trading in the shares of two companies out of 5 companies made up the sector where the number of shares traded was (43,840,502) which represent 54% of the total shares traded with a value of SDG (95,932,255) implemented through (239) contracts , The total market capitalization of the telecommunications sector was SDG (2,875,663,344٫45), which represents the second largest sector in term of market capitalization after banking and investment sector, and the turnover ratio in this sector was 3.88%.
Telecommunications and media Sector
COMPANYNAME
SHARESTRADED
VOLUMETRADED
CONTRACTSEXCUTED
OPENINGPRICE
CLOSEDPRICE
SHARESTRADED TO THETOTAL
VOLUMETRADED TO THETOTAL
MARKET CAPITALIZATION
TURNOVER RATIO
DAYS
TRADED
THE SUDAN CINEMA 3 57.00 1 20 19 0.1% 0.00% 1,450,880 0.00 1
SUDANTELECOM .CO.LTD (SUDTEL)
43,840,499 95,932,198.25 238 2.28 2.55 99.9% 45.70% 2,868,503,004 3.90 120
ALRAY-ALAAM PRESS ANDPUBLISHING
- - - 1.03 1.03 0.00% 0.00% 4,120,000 -
-
MULTIY MEDIACO.LTD - - - 1 1 0.00% 0.00% 1,050,000
-
-
PORTSUDAN CINEMA &THEATRE
- - - 0.00% 0.00% 539,460 -
-
TOTAL=5COMPANIES 43,840,502 95,932,255.00 239 100.00% 100% 2,875,663,344 3.88
44
The Activity of Telecom
munication &
Media Sector in B
oth (Primary &
Secondary) Markets D
uring the Period of (2004- 2013)
Activity2004
20052006
20072008
20092010
20112012
2013
Primary M
arket
Value of Established Companie>s issues
- 1,100,000,000.0
- 3,000,000.00
- -
-0.00%
0.00%0.00
Value of New
ly Established Companie>s Issues
- -
- -
- -
- -
- -
Secondary Market
Num
ber of Listed Companies
5 5
5 5
5 5
5
Num
ber of Traded 3.00
3.00 3.0
2.00300.00%
100.00%3.00
Num
ber of Shares Traded 88,573,615
78,149,528 36,582,986
12,495,522 21,841,768
5,824,185 5,709,681
Percentage of Shares to total shares Traded 0.94
27.75 22.2
7.5020.51%
3.37%7.06%
Volume Traded
432,185,329.99 320,086,262.73
122,516,128.80 23,230,039.90
32,148,392.15 8,201,071.89
23,570,669.00 Percentage of Trading Volum
e to Total Trading Volum
e 24.00
17.00 5.0
12.701.00%
0.30%0.61%
Num
ber of Contracts Executed 1,783
1,450 974
542 436
185 23
Percentage of Contacts to Total No. of Contracts 24.78
16.92 12.1
6.565.54%
1.45%0.14%
Market Capitalization
6,082,250,391 4,235,087,108
3,212,665,534 1,924,653,883
1,354,360,530 2,245,787,287
2,875,663,344 Percentage of M
arket Capitalization to Total M
arket Capitalization 59.02
49.60 42.3
31.461918.00%
23.31%26.00%
Turnover Ratio (%)
9.8 8.7
3.7 1.26
2.21%0.52%
3.88%
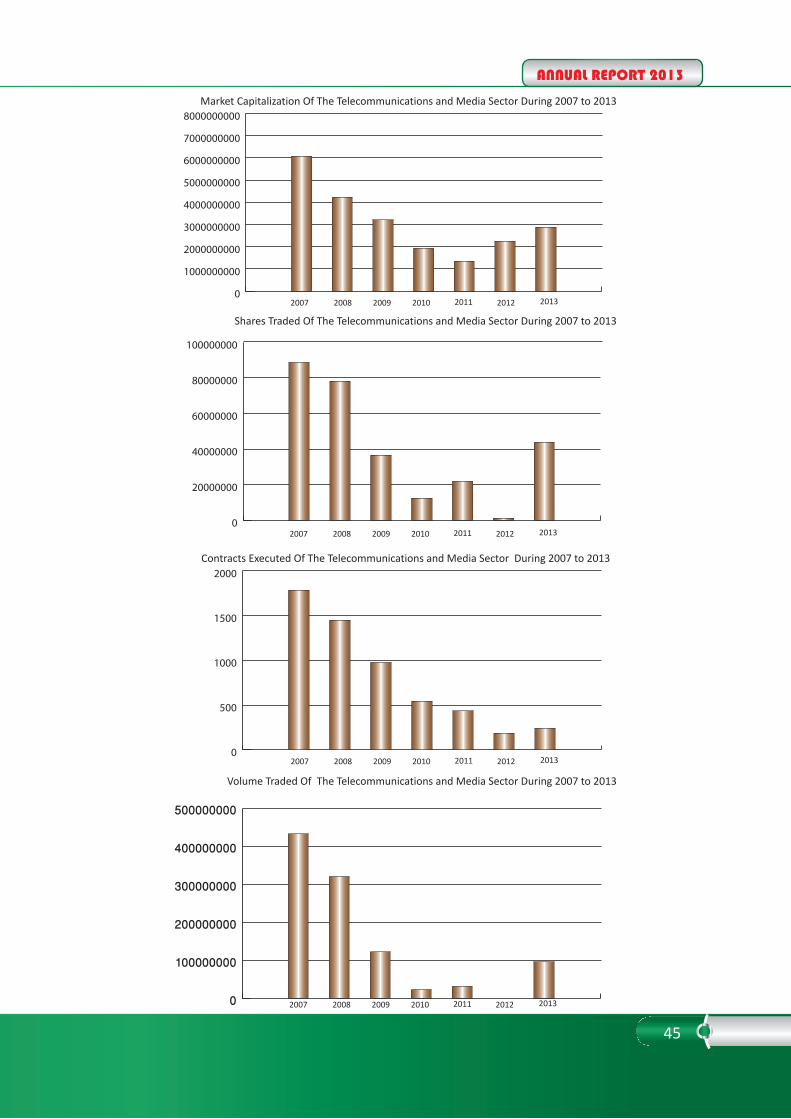
ANNUAL REPORT 2013
45
Market Capitalization Of The Telecommunications and Media Sector During 2007 to 2013
Shares Traded Of The Telecommunications and Media Sector During 2007 to 2013
Contracts Executed Of The Telecommunications and Media Sector During 2007 to 2013
Volume Traded Of The Telecommunications and Media Sector During 2007 to 2013
2007 2008 2009 2010 2011 2012 2013
2007 2008 2009 2010 2011 2012 2013
2007 2008 2009 2010 2011 2012 2013
2007 2008 2009 2010 2011 2012 2013
46
Investment and development sector
This sector has the largest proportion in term of turnover ratio, where the ratio Is reach 13.18% (due to the trading of almuhager international for investment shares).The number of shares traded in this sector was (17٫419٫862) shares with a value of SDG (2,512,166), the number of contracts executed amounted to (61) contracts where the shares of 5 companies out of 7 companies were traded. The total market capitalization of this sector was SDG (166٫449٫042٫04).
COMPANY NAME
SHARESTRADED
VOLUMETRADED
CONTRACTSEXCUTED
OPENINGPRICE
CLOSEDPRICE
SHARESTRADED TO THETOTAL
VOLUMETRADED TO THETOTAL
MARKET
CAPITALIZATION
TURNOVER RATIO
DAYS TRADED
ISLAMICDEVELOPMENT
221,714
102,030.33
11 0.47 0.47 1.31% 4.07%
16,566,187
0.63
9
NATIONALLEASING & INV.CO
458
54,822.60
1 126 126 0.01% 2.19%
43,622,082
0.13
1
ALMUHAGER INTERNATIONALFOR INVESTMENT
16,607,820
1,992,938.40
32 0.12 0.12 95.3% 79.34%
5,558,652 35.85 9
SUDANESE KUWAITI ROADTRANSPORT
-
-
- 0.15 0.15 0.00% 0.00%
18,750
- -
MODRENB CONSTRUCTIONCO.LTD
-
-
- 9.3 9.3 0.00% 0.00%
5,358,372
- -
ALROWAD FOR REAL STATEDEVELOPMENT
144,000
295,200.00
10 2.05 2.05 0.08% 8.41%
95,325,000
0.31
4
ALHIJIRA EXCHANGESCO.LTD
445٫870 67174٫25 7 1.51 0.15 2.6 2.86% - 0.11 4
TOTAL=7COMPANIES 16,973,992 2,444,991.33 54 100.00% 100% 166,449,043 13.18
Annual Bulletin for Investment and development sector
ANNUAL REPORT 2013
47
The
Act
ivit
y of
the
Inv
estm
ent
and
deve
lopm
ent
Sect
or in
Bot
h (P
rim
ary
& S
econ
dary
) M
arke
ts D
urin
g th
e Pe
riod
of (
2004
- 20
13)
Acti
vity
2004
2005
2006
2007
2008
2009
2010
2011
2012
2013
Prim
ary
Mar
ket
Valu
e of E
stabl
ished
Com
pani
e>s i
ssue
s -
- 2
,200
,000
.00
3,6
32,7
16.5
5 8
,649
,390
.00
- -
0.00
%0
1315
4406
.00
Val
ue o
f New
ly E
stab
lishe
dCo
mpa
nie>
s Is
sues
3,1
00,0
00 1
1,00
0,00
0 5
00,0
00 -
102
,000
,000
21,
275,
000
- -
31,
516,
349
-
Seco
ndar
y Mar
ket
Num
ber o
f List
ed C
ompa
nies
11
11
13
4 4
4 5
5 5
8 N
umbe
r of T
rade
d 7
5.0
5.0
0 4
.00
3.0
0 3
.0 4
.00
4.0
0 4
4.00
Num
ber o
f Sha
res
Trad
ed 6
,978
,942
12,
657,
495
74,
477,
064
474
,972
87,
314
88,
985
5,0
99,7
90 4
,903
,605
19,
898
17٫4
19٫8
62
Per
cent
age
of Sh
ares
to to
tal s
hare
s T
rade
d
0.7
0.9
8 0
.01
0.0
3 0
.1 3
.06
0.0
50
20%
Vol
ume
Trad
ed 2
45,1
96,5
34 8
97,6
97,3
47 9
77,2
69,1
03 9
6,54
0.70
36,
779.
77 2
0,13
0.44
10,
305,
349.
03 9
,394
,032
.90
39,
433.
002٫
512٫
166
Per
cent
age
of
Trad
ing
Volu
me
to
Tota
l Tr
adin
g Vol
ume
55
73.
8 4
7.30
- -
0.0
5.6
3 0
.00
00.
06%
Num
ber o
f Con
tract
s Exe
cute
d 1
,138
1,1
80 1
,775
67
46
24
40
20
11
61
Per
cent
age
of C
onta
cts t
o To
tal N
o. o
f Con
trac
ts 3
2 3
2.1
30.
40 0
.93
0.5
4 0
.3 0
.48
0.0
00
0.73
%
Mar
ket C
apita
lizati
on 2
,402
,925
,694
5,7
83,5
91,3
51 4
,757
,065
,302
64,
700,
722
24,
968,
911
24,
577,
706
121
,552
,025
121
,552
,024
122
,877
,806
166
,449
,042
Per
cent
age
of M
arke
t Cap
italiz
ation
to To
tal
Mar
ket C
apita
lizati
on 6
5 7
7.0
51.
10 0
.63
0.2
9 0
.3 1
.99
1.7
2
1.11
%
Turn
over
Rati
o (%
) 7
10
10
0.3
0.1
0.1
4.1
2
13
.18%
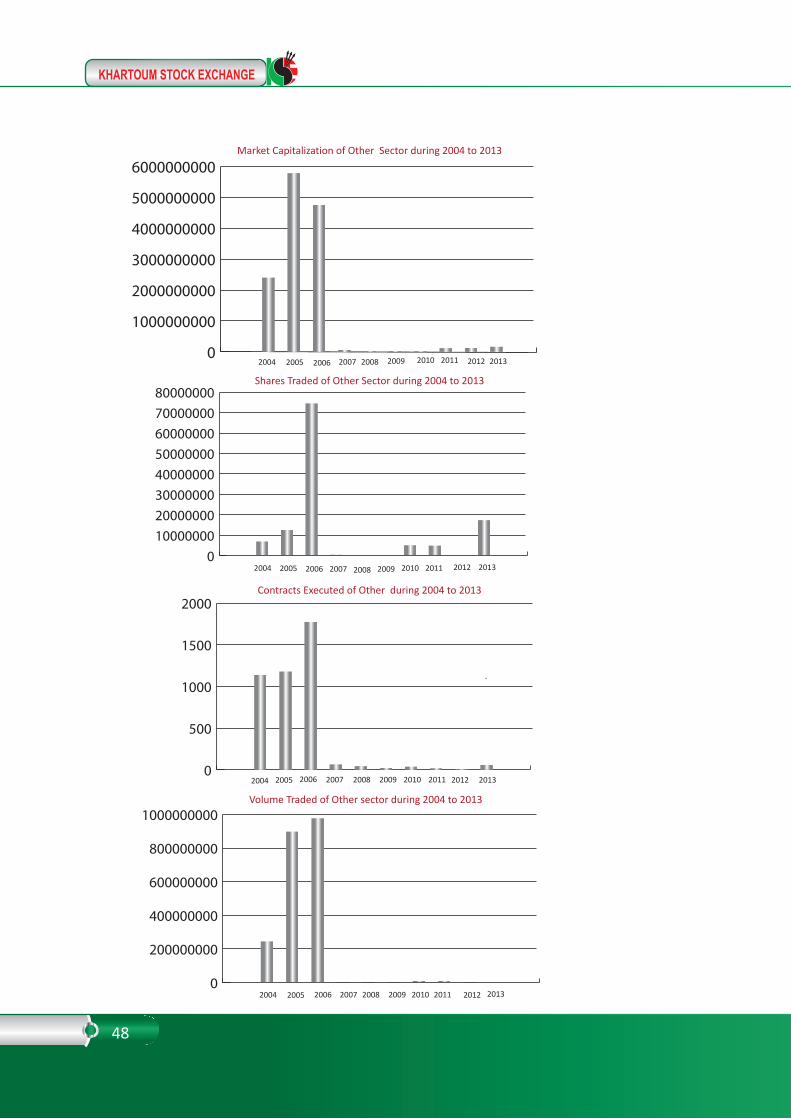
48
Shares Traded of Other Sector during 2004 to 2013
Market Capitalization of Other Sector during 2004 to 2013
Contracts Executed of Other during 2004 to 2013
Volume Traded of Other sector during 2004 to 2013
2004 2005 2006 2007 2008 2009 2010 2011 2012 2013
2004 2005 2006 2007 2008 2009 2010 2011 2012 2013
2004 2005 2006 2007 2008 2009 2010 2011 2012 2013
2004 2005 2006 2007 2008 2009 2010 2011 2012 2013
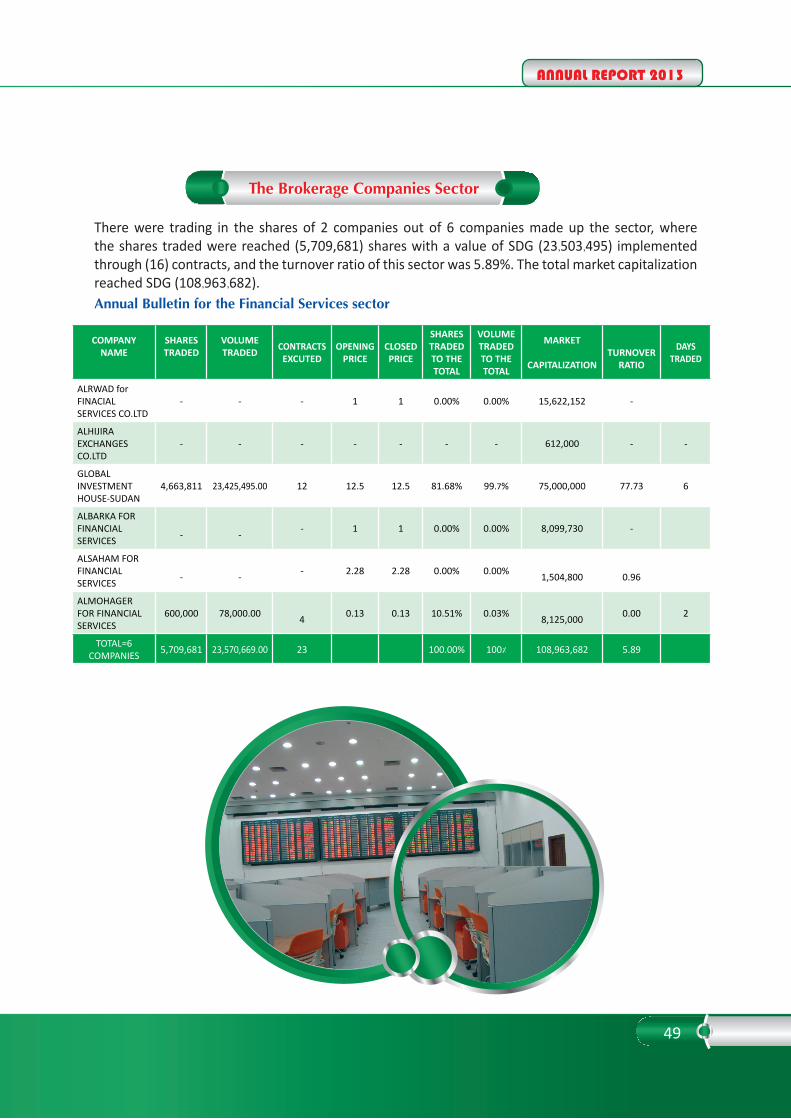
ANNUAL REPORT 2013
49
COMPANY NAME
SHARESTRADED
VOLUMETRADED
CONTRACTSEXCUTED
OPENINGPRICE
CLOSEDPRICE
SHARESTRADED TO THETOTAL
VOLUMETRADED TO THETOTAL
MARKET
CAPITALIZATION
TURNOVER
RATIO
DAYS TRADED
ALRWAD for FINACIALSERVICES CO.LTD
- - - 1 1 0.00% 0.00% 15,622,152 -
ALHIJIRA EXCHANGESCO.LTD
- - - - - - - 612,000 - -
GLOBAL INVESTMENTHOUSE-SUDAN
4,663,811 23,425,495.00 12 12.5 12.5 81.68% 99.7% 75,000,000 77.73 6
ALBARKA FOR FINANCIALSERVICES
-
- - 1 1 0.00% 0.00% 8,099,730 -
ALSAHAM FOR FINANCIALSERVICES
-
- - 2.28 2.28 0.00% 0.00%
1,504,800
0.96
ALMOHAGER FOR FINANCIALSERVICES
600,000 78,000.00 4 0.13 0.13 10.51% 0.03%
8,125,000 0.00 2
TOTAL=6COMPANIES 5,709,681 23,570,669.00 23 100.00% 100٪ 108,963,682 5.89
There were trading in the shares of 2 companies out of 6 companies made up the sector, where the shares traded were reached (5,709,681) shares with a value of SDG (23٫503٫495) implemented through (16) contracts, and the turnover ratio of this sector was 5.89%. The total market capitalization reached SDG (108٫963٫682). Annual Bulletin for the Financial Services sector
The Brokerage Companies Sector

50
The Activity of the Financial Services Sector in B
oth (Primary &
Secondary) Markets D
uring the Period of (2004- 2013)
Activity2004
20052006
20072008
20092010
20112012
2013
Primary M
arket
Value of Established Companie>s issues
- -
10,700,467.00 3,059,921.20
11,945,480.00 3,500,000.0
-0.00%
5,718,333.600.00
Value of Newly Established Com
panie>s Issues 1,075,000
10,287,500 5,461,000
600,000 1,100,000
2,500,000 -
3,012,000 25,731,000
-
Secondary Market
Num
ber of Listed Companies
5 5
5 5
5 5
6
Num
ber of Traded 4.00
5.00 4.0
5.003.00
4.003.00
Num
ber of Shares Traded 1,995,444
5,525,794 2,003,355
1,367,233 215,736
1,266,583 5,709,681
Percentage of Shares to total shares Traded 0.02
1.96 1.2
0.820.20%
0.37%6.5%
Volume Traded
801,610.60 7,630,889.46
870,267.08 931,506.85
298,842.56 632,845.00
23,503,495.00
Percentage of Trading Volume to Total
Trading Volume
- 0.40
0.0 0.51
0.01%0.02%
0.60%
Num
ber of Contracts Executed 55
58 29
22 10
1116
Percentage of Contacts to Total No. of
Contracts 0.76
0.68 0.4
0.270.13%
0.09%0.08%
Market Capitalization
114,468,750 94,604,853
95,343,553 98,248,813
113,872,001 103,050,876
108,963,682
Percentage of Market Capitalization to Total
Market Capitalization
1.10 1.11
1.3 1.51
161.00%1.28%
1.00%
Turnover Ratio (%)
2.7 6.1
2.2 1.45
0.20%1.16%
5.89%

ANNUAL REPORT 2013
51
Market Capitalization of the Financial Services sector during 2007 to 2013
Shares Traded of Financial Services sector during 2007 to 2013
Contracts Executed of the Financial Services during 2007 to 2013
Volume Traded of the Financial Services sector during 2007 to 2013
2007 2008 2009 2010 2011 2012 2013
2007 2008 2009 2010 2011 2012 2013
2007 2008 2009 2010 2011 2012 2013
2007 2008 2009 2010 2011 2012 2013
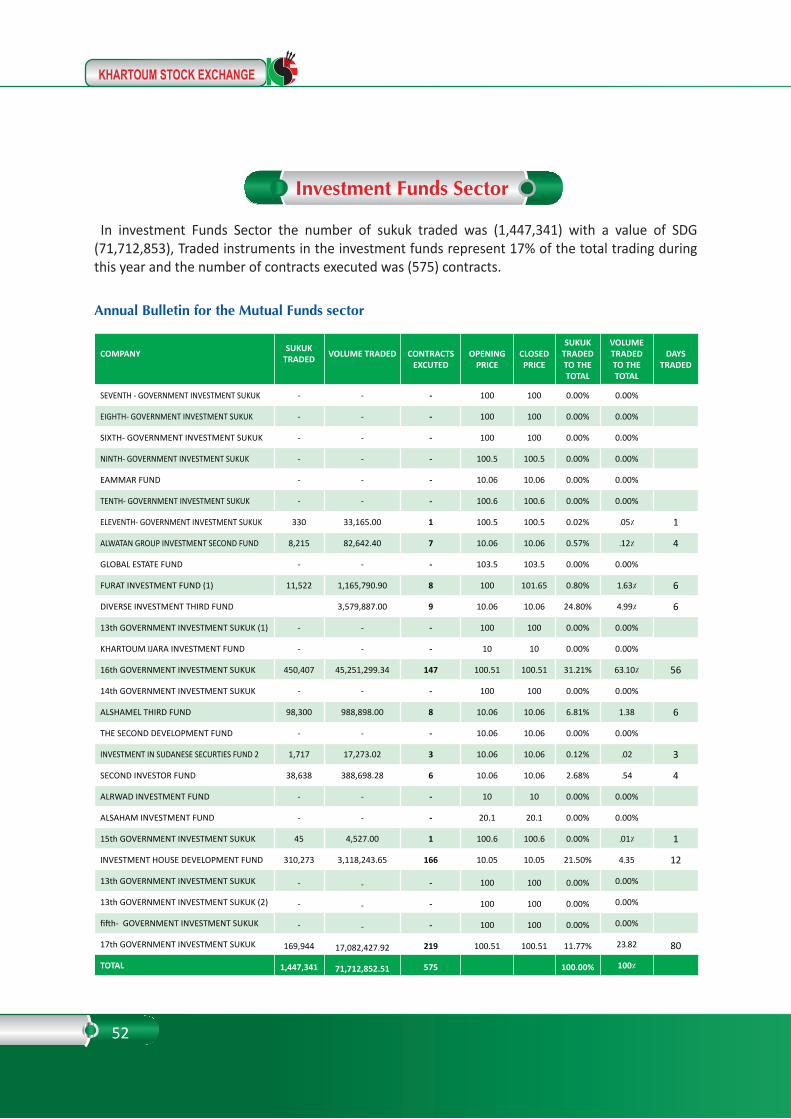
52
COMPANY
SUKUKTRADED
VOLUME TRADED
CONTRACTSEXCUTED
OPENINGPRICE
CLOSEDPRICE
SUKUK TRADED TO THETOTAL
VOLUMETRADED TO THETOTAL
DAYS TRADED
SEVENTH - GOVERNMENT INVESTMENT SUKUK - - - 100 100 0.00% 0.00%
EIGHTH- GOVERNMENT INVESTMENT SUKUK - - - 100 100 0.00% 0.00%
SIXTH- GOVERNMENT INVESTMENT SUKUK - - - 100 100 0.00% 0.00%
NINTH- GOVERNMENT INVESTMENT SUKUK - - - 100.5 100.5 0.00% 0.00%
EAMMAR FUND - - - 10.06 10.06 0.00% 0.00%
TENTH- GOVERNMENT INVESTMENT SUKUK - - - 100.6 100.6 0.00% 0.00%
ELEVENTH- GOVERNMENT INVESTMENT SUKUK 330 33,165.00 1 100.5 100.5 0.02% ٫05٪ 1
ALWATAN GROUP INVESTMENT SECOND FUND 8,215 82,642.40 7 10.06 10.06 0.57% ٫12٪ 4
GLOBAL ESTATE FUND - - - 103.5 103.5 0.00% 0.00%
FURAT INVESTMENT FUND (1) 11,522 1,165,790.90 8 100 101.65 0.80% 1٫63٪ 6
DIVERSE INVESTMENT THIRD FUND 3,579,887.00 9 10.06 10.06 24.80% 4٫99٪ 6
13th GOVERNMENT INVESTMENT SUKUK (1) - - - 100 100 0.00% 0.00%
KHARTOUM IJARA INVESTMENT FUND - - - 10 10 0.00% 0.00%
16th GOVERNMENT INVESTMENT SUKUK 450,407 45,251,299.34 147 100.51 100.51 31.21% 63٫10٪ 56
14th GOVERNMENT INVESTMENT SUKUK - - - 100 100 0.00% 0.00%
ALSHAMEL THIRD FUND 98,300 988,898.00 8 10.06 10.06 6.81% 1٫38 6
THE SECOND DEVELOPMENT FUND - - - 10.06 10.06 0.00% 0.00%
INVESTMENT IN SUDANESE SECURTIES FUND 2 1,717 17,273.02 3 10.06 10.06 0.12% ٫02 3
SECOND INVESTOR FUND 38,638 388,698.28 6 10.06 10.06 2.68% ٫54 4
ALRWAD INVESTMENT FUND - - - 10 10 0.00% 0.00%
ALSAHAM INVESTMENT FUND - - - 20.1 20.1 0.00% 0.00%
15th GOVERNMENT INVESTMENT SUKUK 45 4,527.00 1 100.6 100.6 0.00% ٫01٪ 1
INVESTMENT HOUSE DEVELOPMENT FUND 310,273 3,118,243.65 166 10.05 10.05 21.50% 4٫35 12
13th GOVERNMENT INVESTMENT SUKUK - - - 100 100 0.00% 0.00%
13th GOVERNMENT INVESTMENT SUKUK (2) - - - 100 100 0.00% 0.00%
fifth- GOVERNMENT INVESTMENT SUKUK - - - 100 100 0.00% 0.00%
17th GOVERNMENT INVESTMENT SUKUK 169,944 17,082,427.92 219 100.51 100.51 11.77% 23٫82 80
TOTAL 1,447,341 71,712,852.51 575 100.00% 100%
Investment Funds Sector
In investment Funds Sector the number of sukuk traded was (1,447,341) with a value of SDG (71,712,853), Traded instruments in the investment funds represent 17% of the total trading during this year and the number of contracts executed was (575) contracts.
Annual Bulletin for the Mutual Funds sector

ANNUAL REPORT 2013
53
The
Act
ivit
y of
the
Mut
ual F
unds
Se
ctor
in B
oth
(Pri
mar
y &
Sec
onda
ry)
Mar
kets
Dur
ing
the
Peri
od o
f (20
04-
2013
)
Acti
vity
2004
2005
2006
2007
2008
2009
2010
2011
2012
2013
Sec
onda
ry M
arke
t
Num
ber o
f Mut
ual F
unds
List
ed 6
9.0
16.
00 1
9.00
28.
00 3
4.0
34.
0025
00.0
0%23
00.0
0%27
.00
Num
ber o
f Mut
ual F
unds
Trad
ed 4
8 1
2 1
5 2
3 2
6 2
6 2
5 1
8 1
1
Num
ber o
f Suk
uk T
rade
d 3
0,79
0 8
45,8
30.0
1,4
33,4
00.0
0 2
,717
,193
.00
4,9
77,9
07.0
0 4
,228
,900
.0 1
,791
,114
.00
7333
445.
0057
9357
5.00
1,44
7,34
1
Per
cent
age
of S
ukuk
23
73
49
57
67
55
31
1 1
1.6
2
Vol
ume
Trad
ed 2
,766
,929
47,
116,
328.
8 1
20,1
66,9
84.6
0 1
30,3
46,4
35.6
2 1
23,4
67,8
56.4
4 1
64,7
76,9
62.3
81,
401,
175.
59 3
02,4
81,3
76.4
5 3
08,0
96,5
66.0
0 7
1,71
2,85
3.00
Per
cent
age
of T
radi
ng v
olum
e to
tota
l tra
ding
vol
ume
1 4
6 7
7 7
3
1
.85
Num
ber o
f Con
trac
ts e
xecu
ted
49
175
.0 3
38.0
0 4
57.0
0 4
38.0
0 3
85.0
281
.00
238.
0066
8.00
575.
00
Per
cent
age
of C
ontr
acts
to to
tal N
o. o
f con
trac
ts 1
5 6
6.3
5 5
.11
4.7
7 3
.40
0.0
3 0
.05
3.4
9

54
Shares Traded Of Mutual Funds Sector During 2004 to 2013
Contracts Executed Of Mutual Funds During 2004 to 2013
Volume Traded Of Mutual Funds Sector During 2004 to 2013
2004
2004
2004
2005
2005
2005
2006
2006
2006
2007
2007
2007
2008
2008
2008
2009
2009
2009
2010
2010
2010
2011
2011
2011
2012
2012
2012
2013
2013
2013
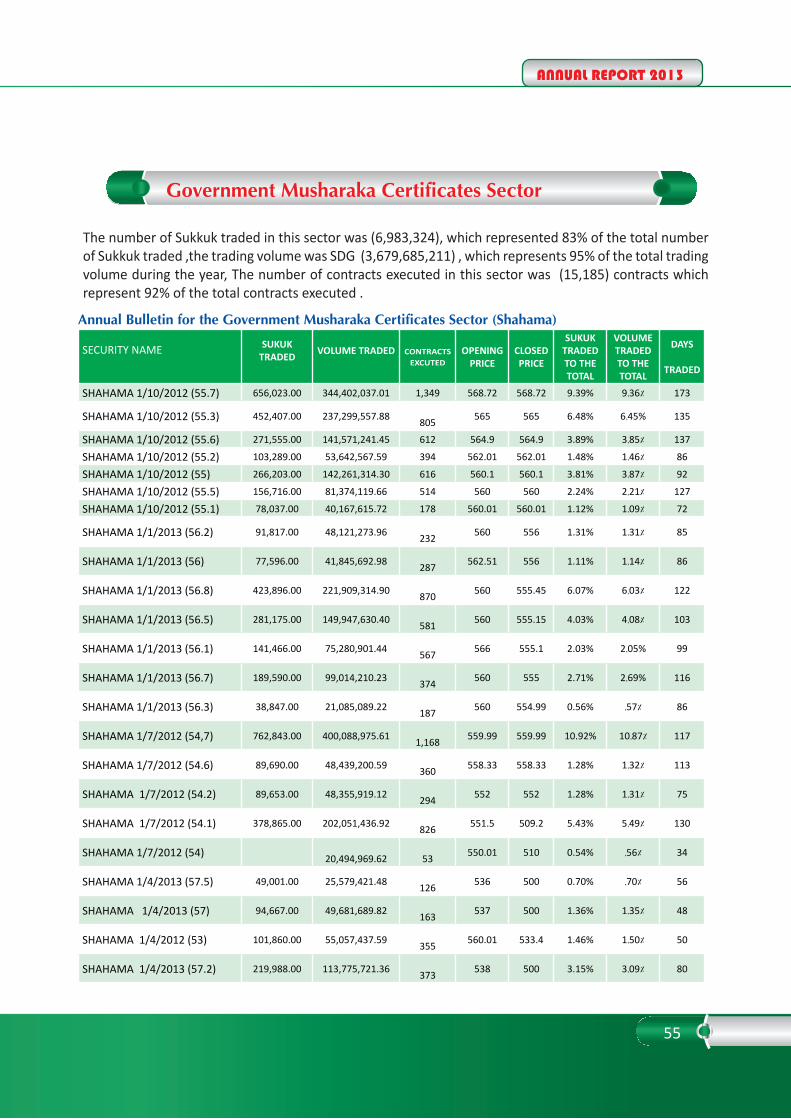
ANNUAL REPORT 2013
55
Annual Bulletin for the Government Musharaka Certificates Sector (Shahama)
SECURITY NAME
SUKUKTRADED
VOLUME TRADED
CONTRACTSEXCUTED
OPENINGPRICE
CLOSEDPRICE
SUKUK TRADED TO THETOTAL
VOLUMETRADED TO THETOTAL
DAYS
TRADED
SHAHAMA 1/10/2012 (55.7) 656,023.00 344,402,037.01 1,349 568.72 568.72 9.39% 9٫36٪ 173
SHAHAMA 1/10/2012 (55.3) 452,407.00 237,299,557.88 805 565 565 6.48% 6٫45% 135
SHAHAMA 1/10/2012 (55.6) 271,555.00 141,571,241.45 612 564.9 564.9 3.89% 3٫85٪ 137
SHAHAMA 1/10/2012 (55.2) 103,289.00 53,642,567.59 394 562.01 562.01 1.48% 1٫46٪ 86
SHAHAMA 1/10/2012 (55) 266,203.00 142,261,314.30 616 560.1 560.1 3.81% 3٫87٪ 92
SHAHAMA 1/10/2012 (55.5) 156,716.00 81,374,119.66 514 560 560 2.24% 2٫21٪ 127
SHAHAMA 1/10/2012 (55.1) 78,037.00 40,167,615.72 178 560.01 560.01 1.12% 1٫09٪ 72
SHAHAMA 1/1/2013 (56.2) 91,817.00 48,121,273.96 232 560 556 1.31% 1٫31٪ 85
SHAHAMA 1/1/2013 (56) 77,596.00 41,845,692.98 287 562.51 556 1.11% 1٫14٪ 86
SHAHAMA 1/1/2013 (56.8) 423,896.00 221,909,314.90 870 560 555.45 6.07% 6٫03٪ 122
SHAHAMA 1/1/2013 (56.5) 281,175.00 149,947,630.40 581 560 555.15 4.03% 4٫08٪ 103
SHAHAMA 1/1/2013 (56.1) 141,466.00 75,280,901.44 567 566 555.1 2.03% 2٫05% 99
SHAHAMA 1/1/2013 (56.7) 189,590.00 99,014,210.23 374 560 555 2.71% 2٫69% 116
SHAHAMA 1/1/2013 (56.3) 38,847.00 21,085,089.22 187 560 554.99 0.56% ٫57٪ 86
SHAHAMA 1/7/2012 (54,7) 762,843.00 400,088,975.61 1,168 559.99 559.99 10.92% 10٫87٪ 117
SHAHAMA 1/7/2012 (54.6) 89,690.00 48,439,200.59 360 558.33 558.33 1.28% 1٫32٪ 113
SHAHAMA 1/7/2012 (54.2) 89,653.00 48,355,919.12 294 552 552 1.28% 1٫31٪ 75
SHAHAMA 1/7/2012 (54.1) 378,865.00 202,051,436.92 826 551.5 509.2 5.43% 5٫49٪ 130
SHAHAMA 1/7/2012 (54) 20,494,969.62
53 550.01 510 0.54% ٫56٪ 34
SHAHAMA 1/4/2013 (57.5) 49,001.00 25,579,421.48 126 536 500 0.70% ٫70٪ 56
SHAHAMA 1/4/2013 (57) 94,667.00 49,681,689.82 163 537 500 1.36% 1٫35٪ 48
SHAHAMA 1/4/2012 (53) 101,860.00 55,057,437.59 355 560.01 533.4 1.46% 1٫50٪ 50
SHAHAMA 1/4/2013 (57.2) 219,988.00 113,775,721.36 373 538 500 3.15% 3٫09٪ 80
The number of Sukkuk traded in this sector was (6,983,324), which represented 83% of the total number of Sukkuk traded ,the trading volume was SDG (3,679,685,211) , which represents 95% of the total trading volume during the year, The number of contracts executed in this sector was (15,185) contracts which represent 92% of the total contracts executed .
Government Musharaka Certificates Sector
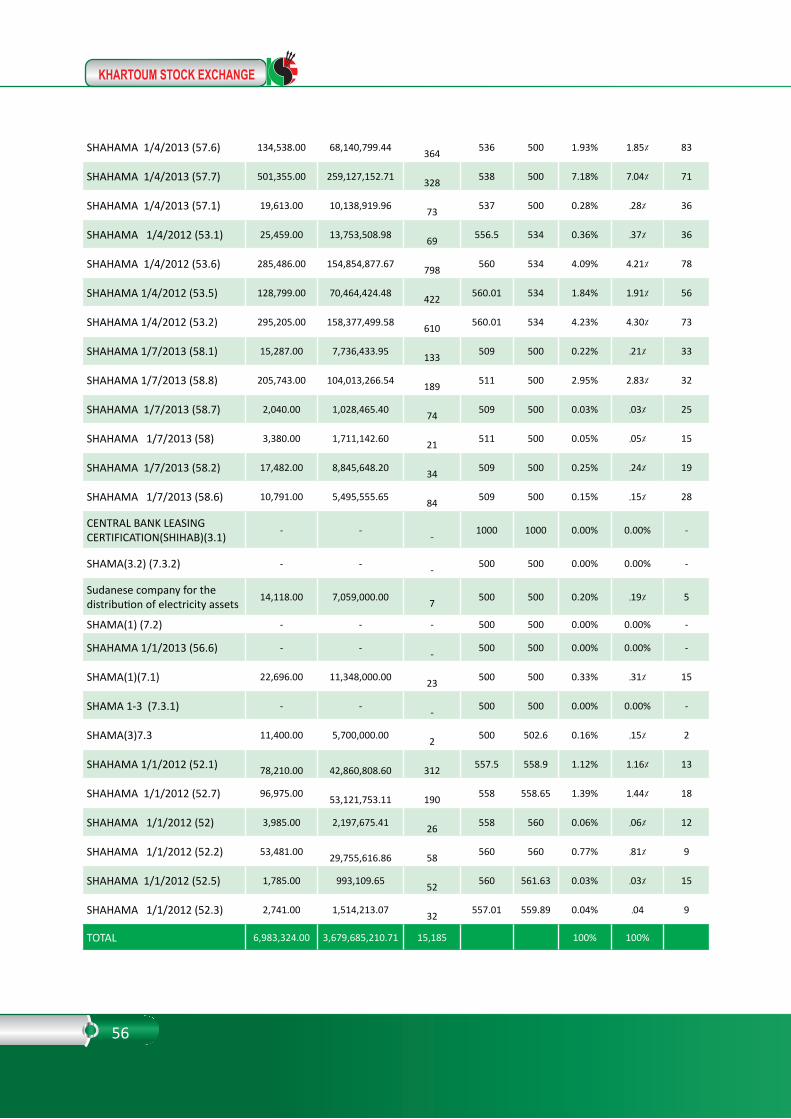
56
SHAHAMA 1/4/2013 (57.6) 134,538.00 68,140,799.44 364 536 500 1.93% 1٫85٪ 83
SHAHAMA 1/4/2013 (57.7) 501,355.00 259,127,152.71 328 538 500 7.18% 7٫04٪ 71
SHAHAMA 1/4/2013 (57.1) 19,613.00 10,138,919.96 73 537 500 0.28% ٫28٪ 36
SHAHAMA 1/4/2012 (53.1) 25,459.00 13,753,508.98 69 556.5 534 0.36% ٫37٪ 36
SHAHAMA 1/4/2012 (53.6) 285,486.00 154,854,877.67 798 560 534 4.09% 4٫21٪ 78
SHAHAMA 1/4/2012 (53.5) 128,799.00 70,464,424.48 422 560.01 534 1.84% 1٫91٪ 56
SHAHAMA 1/4/2012 (53.2) 295,205.00 158,377,499.58 610 560.01 534 4.23% 4٫30٪ 73
SHAHAMA 1/7/2013 (58.1) 15,287.00 7,736,433.95 133 509 500 0.22% ٫21٪ 33
SHAHAMA 1/7/2013 (58.8) 205,743.00 104,013,266.54 189 511 500 2.95% 2٫83٪ 32
SHAHAMA 1/7/2013 (58.7) 2,040.00 1,028,465.40 74 509 500 0.03% ٫03٪ 25
SHAHAMA 1/7/2013 (58) 3,380.00 1,711,142.60 21 511 500 0.05% ٫05٪ 15
SHAHAMA 1/7/2013 (58.2) 17,482.00 8,845,648.20 34 509 500 0.25% ٫24٪ 19
SHAHAMA 1/7/2013 (58.6) 10,791.00 5,495,555.65 84 509 500 0.15% ٫15٪ 28
CENTRAL BANK LEASINGCERTIFICATION(SHIHAB)(3.1)
- - - 1000 1000 0.00% 0.00% -
SHAMA(3.2) (7.3.2) - - - 500 500 0.00% 0.00% -
Sudanese company for thedistribution of electricity assets
14,118.00 7,059,000.00 7 500 500 0.20% ٫19٪ 5
SHAMA(1) (7.2) - - - 500 500 0.00% 0.00% -
SHAHAMA 1/1/2013 (56.6) - - - 500 500 0.00% 0.00% -
SHAMA(1)(7.1) 22,696.00 11,348,000.00 23 500 500 0.33% ٫31٪ 15
SHAMA 1-3 (7.3.1) - - - 500 500 0.00% 0.00% -
SHAMA(3)7.3 11,400.00 5,700,000.00 2 500 502.6 0.16% ٫15٪ 2
SHAHAMA 1/1/2012 (52.1) 78,210.00
42,860,808.60
312 557.5 558.9 1.12% 1٫16٪ 13
SHAHAMA 1/1/2012 (52.7) 96,975.00 53,121,753.11
190 558 558.65 1.39% 1٫44٪ 18
SHAHAMA 1/1/2012 (52) 3,985.00 2,197,675.41 26 558 560 0.06% ٫06٪ 12
SHAHAMA 1/1/2012 (52.2) 53,481.00 29,755,616.86
58 560 560 0.77% ٫81٪ 9
SHAHAMA 1/1/2012 (52.5) 1,785.00 993,109.65 52 560 561.63 0.03% ٫03٪ 15
SHAHAMA 1/1/2012 (52.3) 2,741.00 1,514,213.07 32 557.01 559.89 0.04% ٫04 9
TOTAL 6,983,324.00 3,679,685,210.71 15,185 100% 100%
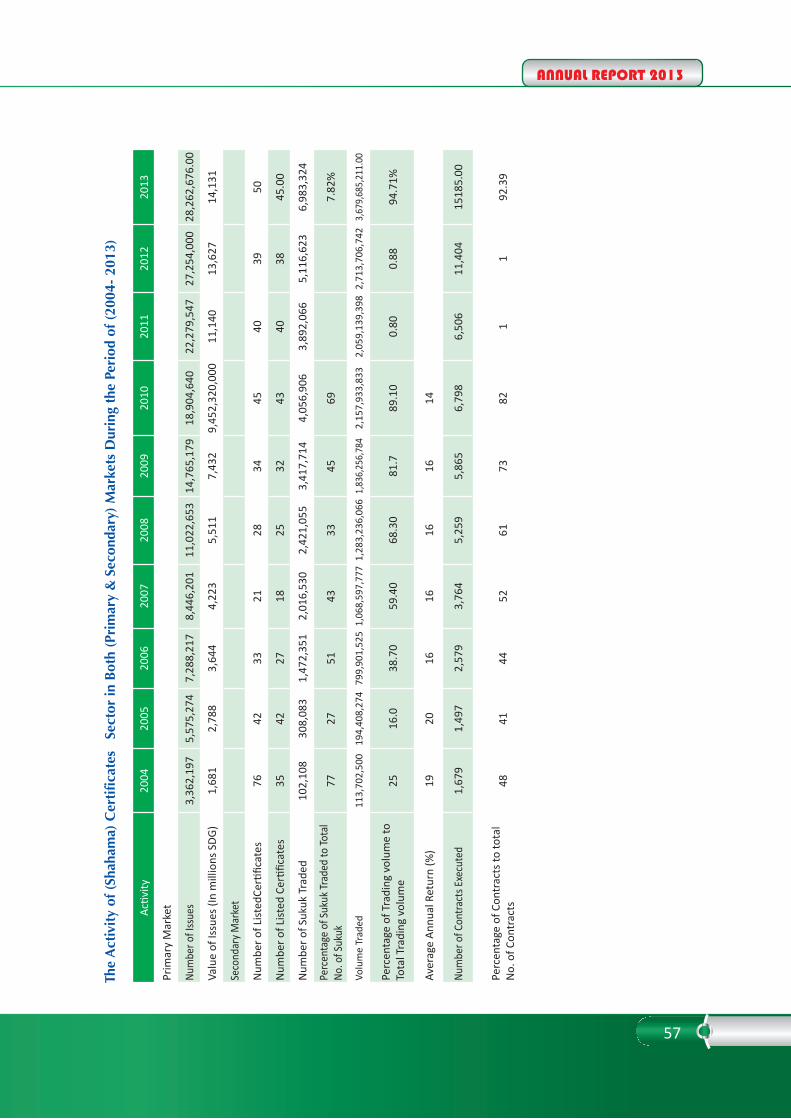
ANNUAL REPORT 2013
57
The
Act
ivit
y of
(Sh
aham
a) C
erti
ficat
es
Sect
or in
Bot
h (P
rim
ary
& S
econ
dary
) M
arke
ts D
urin
g th
e Pe
riod
of (
2004
- 20
13)
Acti
vity
2004
2005
2006
2007
2008
2009
2010
2011
2012
2013
Prim
ary
Mar
ket
Num
ber o
f Iss
ues
3,3
62,1
97 5
,575
,274
7,2
88,2
17 8
,446
,201
11,
022,
653
14,
765,
179
18,
904,
640
22,
279,
547
27,
254,
000
28,
262,
676.
00
Val
ue o
f Iss
ues (
In m
illio
ns S
DG)
1,6
81 2
,788
3,6
44 4
,223
5,5
11 7
,432
9,4
52,3
20,0
00 1
1,14
0 1
3,62
7 1
4,13
1
Seco
ndar
y Mar
ket
Num
ber o
f List
edCe
rtific
ates
76
42
33
21
28
34
45
40
39
50
Num
ber o
f List
ed C
ertifi
cate
s 3
5 4
2 2
7 1
8 2
5 3
2 4
3 4
0 3
845
.00
Num
ber o
f Suk
uk T
rade
d 1
02,1
08 3
08,0
83 1
,472
,351
2,0
16,5
30 2
,421
,055
3,4
17,7
14 4
,056
,906
3,8
92,0
66 5
,116
,623
6,9
83,3
24
Per
cent
age
of Su
kuk T
rade
d to
Tota
lNo
. of S
ukuk
77
27
51
43
33
45
69
7.82
%
Vol
ume
Trad
ed 1
13,7
02,5
00 1
94,4
08,2
74 7
99,9
01,5
25 1
,068
,597
,777
1,2
83,2
36,0
66 1
,836
,256
,784
2,1
57,9
33,8
33 2
,059
,139
,398
2,7
13,7
06,7
42 3
,679
,685
,211
.00
Per
cent
age
of T
radi
ng v
olum
e to
Tota
l Tra
ding
vol
ume
25
16.
0 3
8.70
59.
40 6
8.30
81.
7 8
9.10
0.8
0 0
.88
94.7
1%
Ave
rage
Ann
ual R
etur
n (%
) 1
9 2
0 1
6 1
6 1
6 1
6 1
4
Num
ber o
f Con
tract
s Exe
cute
d 1
,679
1,4
97 2
,579
3,7
64 5
,259
5,8
65 6
,798
6,5
06 1
1,40
415
185.
00
Per
cent
age
of C
ontr
acts
to to
tal
No.
of C
ontr
acts
48
41
44
52
61
73
82
1 1
92.
39
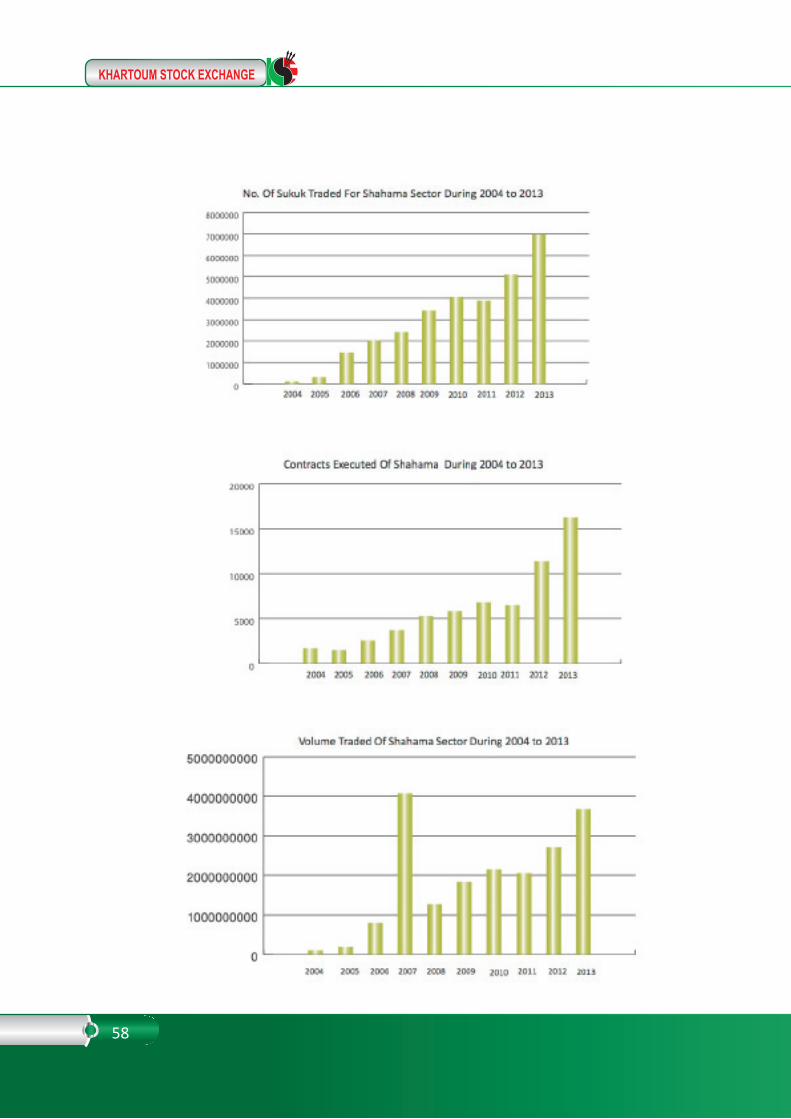
58
ANNUAL REPORT 2013
59
General conditions for the registration of brokerage companies:Khartoum Stock Exchange Board of Directors authorized at the meeting No. 6 (2005) on 12.10.2005 the general conditions for the registration of the brokerage companies are as follows:First: The Company must be either:• A public shareholding company and issuing investment funds: capital of 25 million pounds
paid for 25% (6.25 million).• A public shareholding company and does not issue investment funds: capital of 10 million
pounds paid for 25% (2.5 million pounds).• A private company and manages investment portfolios: capital million pounds paid for 25%
(250 thousand pounds.).• A private company and does not manage investment portfolios: capital of 200 thousand
pounds paid for 25% (50 thousand pounds.Second: A company must be specialized in the Agency’s work just as in the article (34) of the Code of the market, which provides:• Agency commission to buy and sell securities for clients.• Agency to purchase and sell portfolio for the benefit of the proxy.• Agency to cover versions of securities.• Work as a financial consultant and managing portfolios of others and investments in
securities.Third: The Company provides a financial guarantee in the form of bank (deposit, letter of guarantee, securities as collateral for the benefit of multi-market or (cash) as follows:• A public shareholding company and issuing investment funds: 0.5% of the paid-up capital
(31.25 thousand pounds).• A public shareholding company and does not issue investment funds: 1% of paid-up capital
(25 thousand pounds).• A private company and manages investment portfolios: 5% of the paid-up capital (12.5
thousand pounds).• A private company and does not manage investment portfolios: 10% of the paid-up capital
(5 thousand pounds).Fourth: the Company to pay annual agency fees to the market.
Brokerage Companies

60
NU
Mcom
pany name
EstabilishingDate
Capital (SDG)CO
MM
UN
ICATECLASIFICATIO
NAU
THERIZED CAPITALPAID U
PTEL.
FAXE.M
AIL
1Financial Investm
ent Bank1998
100.000.000 89.633.240
730300 83130304 83
A PUBLIC SHAREHO
LDING AN
DISSU
ING IN
VESTMEN
T FUN
DS
2 GLO
BAL HOU
SE FOR FIN
ANCIAL
INVESTM
ENT CO
LTD2004
60.000.000 60.000.000
767324 83747260 83 470038 83
amin@
global.com.sd
A PUBLIC SHAREHO
LDING AN
DISSU
ING IN
VESTMEN
T FUN
DS
3Success Dealing Co. Ltd
2001 25.000.000
2.701.78083790958
83790959 successdealing@
hotmail.com
A PUBLIC SHAREHO
LDING AN
DISSU
ING IN
VESTMEN
T FUN
DS
4'Al-M
uhajir For Financial Services2002
6.250.000 5.000.000
498549 8383 595811
almuhajirinfo@
gmail.
com A PU
BLIC SHAREHOLDIN
G COM
PANY
DOES N
OT ISSU
E INVESTM
ENT FU
NDS
5 ALSAHAM
FOR FIN
ANCIAL SERVICES
CO LTD
2005 5.000.000
1.650.000122256474
763548 83 -
A PUBLIC SHAREHO
LDING CO
MPAN
YDO
ES NO
T ISSUE IN
VESTMEN
T FUN
DS
6Al-Ruad For Financial Services
2002 25.000.000
13.018.460777222 83
777116 83 Info@
rowad.sd
A PUBLIC SHAREHO
LDING AN
DISSU
ING IN
VESTMEN
T FUN
DS
7 DAM
FINAN
CIAL INVESTM
ENT CO
LTD2005
1.000.000 1.000.000
767686 83741385 83
amgadshabo@
hotmail.com
A PRIVATE COM
PANY AN
D MAN
AGESIN
VESTMEN
T PROTFO
LIOS
8sanabel for financial service
1994 25.000.000
20.000.000798560 83
793249 83 info@
nftco.com A PRIVATE CO
MPAN
Y AND M
ANAGES
INVESTM
ENT PRO
TFOLIO
S
9 Tarw
eeg Financial Investment Co.
Ltd2001
20.000.000 20.000.000
746437 83746438 83
tarweeg@
gmail.com
A PRIVATE COM
PANY AN
D MAN
AGESIN
VESTMEN
T PROTFO
LIOS
10 International Com
pany ForM
onetary Managem
ent2002
1.000.000250
766640 83767282 83
icmm
@om
erabdlati. com
A PRIVATE COM
PANY AN
D MAN
AGESIN
VESTMEN
T PROTFO
LIOS
11Gunoser Financial Investm
ent Co.2004
20050
912919620
A PRIVATE CO
MPAN
Y AND DO
ES NO
TM
ANAGE IN
VESTMEN
T PROTFO
LIOS
12 ALFARAN
CY FOR FIN
ANCIAL
SERVICES CO LTD
2005 3.000.000
3.000.000746983 83
746984 83 info@
sfbank.net A PRIVATE CO
MPAN
Y AND M
ANAGES
INVESTM
ENT PRO
TFOLIO
S
13 HARVEST FO
R FINAN
CIALIN
VESTMEN
T2006
2.000.000 2.000.000
8374136183741363
A PRIVATE COM
PANY AN
D MAN
AGESIN
VESTMEN
T PROTFO
LIOS
14 ALFAISAL FIN
ANCIAL TRAN
SACTINS
CO LTD
2006 50.000.000
18.000.000155351100
764354 83 info@
alfaisal-st.com A PRIVATE CO
MPAN
Y AND M
ANAGES
INVESTM
ENT PRO
TFOLIO
S
15Securities Services Co. Ltd.
1995 1.000.000
1.000.000761403 83
563515 83 securitiesservice@
yahoo.com A PRIVATE CO
MPAN
Y AND M
ANAGES
INVESTM
ENT PRO
TFOLIO
S
16Elkashdeep For Securities
1994200
508831 83
155144546 elcashdeep@
yahoo. com
A PRIVATE COM
PANY AN
D DOES N
OT
MAN
AGE INVESTM
ENT PRO
TFOLIO
S
17 Craw
n for fainancial invistment
2004210
180773829 83
772041 83 dridrism
@hotm
ail. com
A PRIVATE COM
PANY AN
D DOES N
OT
MAN
AGE INVESTM
ENT PRO
TFOLIO
S
18'Al-Tadam
on For Financial Services2003
790250
771505783958 83
tadamon@
hotmail.
com A PRIVATE CO
MPAN
Y AND DO
ES NO
TM
ANAGE IN
VESTMEN
T PROTFO
LIOS
19 M
AZAIA FINAN
CIAL SERVICES COLTD
200560
20912474730
m
A PRIVATE COM
PANY AN
D MAN
AGESIN
VESTMEN
T PROTFO
LIOS
20AL Baraka For Financial Services
2004 25.000.000
5.344.798749948 83
743349 83 BFSC2010@
hotmail.
com A PRIVATE CO
MPAN
Y AND M
ANAGES
INVESTM
ENT PRO
TFOLIO
S
ANNUAL REPORT 2013
61
21 ALM
ANSO
UR FIN
ANCIAL
INVESTM
ENT SERVICES
2004500
40083742684
83742685 alm
ansourr@ sudam
mial.net
A PRIVATE COM
PANY AN
D MAN
AGESIN
VESTMEN
T PROTFO
LIOS
22Daw
G . For Financial Co.2004
1.000.00060
761422 83761900 83
dawg-financial@
gmail.com
A PRIVATE COM
PANY AN
D DOES N
OT
MAN
AGE INVESTM
ENT PRO
TFOLIO
S
23 ALM
UASHIR FOR FIN
ANCIAL
INVESTM
ENT
2005 1.000.000
1.000.000912932070
798408 83 info@
almoashir.com
A PRIVATE COM
PANY AN
D MAN
AGESIN
VESTMEN
T PROTFO
LIOS
24'Al-Am
in For Securities2002
1.000.000250
765166 83765165 83
amin7452@
yahoo. com
A PRIVATE COM
PANY AN
D MAN
AGESIN
VESTMEN
T PROTFO
LIOS
25Al-Aaraf For Securities &
Investment
1994200
5091234660
alarafstock@
yahoo. com
A PRIVATE COM
PANY AN
D DOES N
OT
MAN
AGE INVESTM
ENT PRO
TFOLIO
S
26Branto For Financial Services
2002200
60767390 83
767390 83 brantow
@hotm
ail. com
A PRIVATE COM
PANY AN
D DOES N
OT
MAN
AGE INVESTM
ENT PRO
TFOLIO
S
27Eldarhim
Financial Investment Co.
2002 1.000.000
250155140165
drhm
10@hotm
ail. com
A PRIVATE COM
PANY AN
D MAN
AGESIN
VESTMEN
T PROTFO
LIOS
28 M
ohamed Sulim
an Stock ForFinancial Services
2002 1.260.000
250740300 83
740301 83 stock@
yahoo.com A PRIVATE CO
MPAN
Y AND M
ANAGES
INVESTM
ENT PRO
TFOLIO
S
29 Green Gold For Securities
1995250
50912109673
greengold@
yahoo. com
A PRIVATE COM
PANY AN
D DOES N
OT
MAN
AGE INVESTM
ENT PRO
TFOLIO
S
30'Al-M
ustashar For Securities2002
1.000.000250
416510 83745165 83
fmaillhend@
ase-sd. com
A PRIVATE COM
PANY AN
D MAN
AGESIN
VESTMEN
T PROTFO
LIOS
31ELM
AMLKA FIN
ANCIAL SERVICES
2006200
50243130 83
255223 83 m
fs@m
amlakagroup.
com A PRIVATE CO
MPAN
Y AND DO
ES NO
TM
ANAGE IN
VESTMEN
T PROTFO
LIOS
32ELEM
ARATIA FOR TRAN
SACTION
S2006
1.000.000 1.000.000
776811 83777636 83
A PRIVATE CO
MPAN
Y AND M
ANAGES
INVESTM
ENT PRO
TFOLIO
S
33HAT FIN
ANCIG SERVICES
2005 1.260.000
303.6761092 83
761093 83 info@
hat-sd-com A PRIVATE CO
MPAN
Y AND M
ANAGES
INVESTM
ENT PRO
TFOLIO
S
34 ALTAKAM
OL FO
R FINAN
CIALSERVICES CO
LTD2007
15.000.000 15.000.000
912340364
yassirkmal@
yahoo. com
A PRIVATE COM
PANY AN
D MAN
AGESIN
VESTMEN
T PROTFO
LIOS
35N
ILE MASHREG FIN
ANCIAL SERVICES
2007 1.000.000
250764490 83
784688 83 sharaf@
bluemashreg.com
A PRIVATE COM
PANY AN
D MAN
AGESIN
VESTMEN
T PROTFO
LIOS
36U
NITED CAPITAL FO
R SECURITIES
2008 1.000.000
250247700 83
235000 83 einas@
bankmal.com
A PRIVATE COM
PANY AN
D MAN
AGESIN
VESTMEN
T PROTFO
LIOS
37 M
eduro For Financial services Co.Ltd
2009 1.000.000
250740770 83
740737 83 alitaha55@
hotmail.
com A PRIVATE CO
MPAN
Y AND M
ANAGES
INVESTM
ENT PRO
TFOLIO
S
38Hyper Deal Financial Co. Ltd
2009200
200912300013
49263 83
A PRIVATE COM
PANY AN
D DOES N
OT
MAN
AGE INVESTM
ENT PRO
TFOLIO
S
39 Darison Financial and Consultancy
Services Co. Ltd2010
1.000.000500
785932 83785937 83
darsonfin@hotm
ail. com
A PRIVATE COM
PANY AN
D MAN
AGESIN
VESTMEN
T PROTFO
LIOS
40O
sool Stock Exchange Co. Ltd2010
20050
767418 83767419 83
osool1010@gm
ail. com
A PRIVATE COM
PANY AN
D DOES N
OT
MAN
AGE INVESTM
ENT PRO
TFOLIO
S
41Casboon For Financial Service
2008200
50915778411
A PRIVATE COM
PANY AN
D DOES N
OT
MAN
AGE INVESTM
ENT PRO
TFOLIO
S
42H.H Stock Exchange Co. Ltd
1.000.000
250
A PRIVATE COM
PANY AN
D MAN
AGESIN
VESTMEN
T PROTFO
LIOS
62