hirremtm: a noninvasive, allostatic methodology for ... brainstate... · hirremtm: a noninvasive,...
TRANSCRIPT

HIRREMTM: a noninvasive, allostatic methodology forrelaxation and auto-calibration of neural oscillationsLee Gerdes1, Peter Gerdes1, Sung W. Lee1 & Charles H. Tegeler2
1Brain State Technologies LLC, Scottsdale, Arizona 85260.2Department of Neurology, Wake Forest School of Medicine, Winston-Salem, North Carolina 27157.
Keywords
Allostasis, auto-calibration, biofeedback,
electroencephalography, hemispheric
asymmetry, HIRREM, insomnia, neural
oscillation, relaxation, stochastic resonance
Correspondence
Sung W. Lee, Brain State Technologies LLC,
15150 North Hayden Road, Suite 106,
Scottsdale, AZ 85260.
Tel: (480) 588-6840; Fax: (480) 588-6826;
E-mail: [email protected]
Funding Information
Research on clinical applications of HIRREM
has been supported by unrestricted research
grants to the Department of Neurology,
Wake Forest School of Medicine, Winston-
Salem, NC, from Brain State Technologies
LLC, Scottsdale, AZ, the Susanne Marcus
Collins Foundation, Atlanta, GA, and the
Charles H. Tegeler, III and Martha Tegeler
Family Trust, Winston-Salem, NC.
Received: 5 September 2012; Revised: 28
November 2012; Accepted: 9 December
2012
doi: 10.1002/brb3.116
Abstract
Disturbances of neural oscillation patterns have been reported with many dis-
ease states. We introduce methodology for HIRREMTM (high-resolution, rela-
tional, resonance-based electroencephalic mirroring), also known as Brainwave
OptimizationTM, a noninvasive technology to facilitate relaxation and auto-
calibration of neural oscillations. HIRREM is a precision-guided technology for
allostatic therapeutics, intended to help the brain calibrate its own functional
set points to optimize fitness. HIRREM technology collects electroencephalic
data through two-channel recordings and delivers a series of audible musical
tones in near real time. Choices of tone pitch and timing are made by mathe-
matical algorithms, principally informed by the dominant frequency in succes-
sive instants of time, to permit resonance between neural oscillatory frequencies
and the musical tones. Relaxation of neural oscillations through HIRREM
appears to permit auto-calibration toward greater hemispheric symmetry and
more optimized proportionation of regional spectral power. To illustrate an
application of HIRREM, we present data from a randomized clinical trial of
HIRREM as an intervention for insomnia (n = 19). On average, there was
reduction of right-dominant temporal lobe high-frequency (23–36 Hz) EEG
asymmetry over the course of eight successive HIRREM sessions. There was a
trend for correlation between reduction of right temporal lobe dominance and
magnitude of insomnia symptom reduction. Disturbances of neural oscillation
have implications for both neuropsychiatric health and downstream peripheral
(somatic) physiology. The possibility of noninvasive optimization for neural
oscillatory set points through HIRREM suggests potentially multitudinous roles
for this technology. Research is currently ongoing to further explore its poten-
tial applications and mechanisms of action.
Introduction
This study introduces a novel, noninvasive electroenceph-
alography-based interventional technology, called high-
resolution, relational, resonance-based, electroencephalic
mirroring (HIRREMTM), or Brainwave OptimizationTM.
The purpose of HIRREM is to facilitate relaxation and
auto-calibration of neural oscillations through dynamic,
auditory resonance with electroencephalic activity
measured at high spectral resolutions. To contextualize
HIRREM as an intervention with potentially multitudi-
nous roles, in this section, we briefly review the array of
diseases associated with neural oscillatory disturbance,
share an overview of HIRREM and its development, and
adduce the model of allostasis for explaining physiological
regulation. Materials and Methods section describes pro-
cedures for provision of HIRREM. In Results section, data
are presented from a clinical trial of HIRREM for individ-
uals with insomnia, to illustrate a clinical application for
HIRREM and associated changes in neural oscillatory
symmetry.
Disturbances of neural oscillation
Oscillation is a fundamental feature of physics and
biology, and appreciation of the brain as a network of
oscillators provides a highly integrative framework for
understanding brain functionality (Buzsaki 2006). Neural
ª 2013 The Authors. Published by Wiley Periodicals, Inc. This is an open access article under the terms of the Creative
Commons Attribution License, which permits use, distribution and reproduction in any medium, provided
the original work is properly cited.
1

oscillations can be impacted by stimuli which span a
range of intensity from the subtle to the near lethal. Blast
injuries sustained in warfare can produce disturbance of
oscillatory synchrony (Sponheim et al. 2011). At the other
extreme, weak signals can alter neural oscillations through
the phenomenon of stochastic resonance (see HIRREM
and EEG artifact or noise), whereby an increase in a neu-
ral system’s noise level can, perhaps counterintuitively,
enable the detection of an otherwise subthreshold peri-
odic signal (Moss et al. 2004; McDonnell and Ward
2011).
Disturbances of synchronization of neural oscillation
have been described in association with clinical disorders
including epilepsy (Margineanu 2010), Parkinsonism
(Gale et al. 2008), schizophrenia (Uhlhaas and Singer
2010), Alzheimer’s disease (Dauwels et al. 2010), autism
(Isler et al. 2010), and insomnia (Marzano et al. 2008).
At the level of the cerebral hemispheres, oscillatory distur-
bances may manifest as imbalances of left–right EEG
symmetry. Frontal EEG asymmetry has been described as
a marker for affective style, with left and right frontal
cortex associated with approach and withdrawal tenden-
cies, respectively (Davidson et al. 1990). Other reports
have associated hemispheric oscillatory asymmetry with
posttraumatic stress disorder (Rabe et al. 2006; Engdahl
et al. 2010), insomnia (St-Jean et al., 2012), attention-
deficit disorder (Hale et al. 2010), autism (Stroganova
et al. 2007; Lazarev et al. 2010), dyslexia (Spironelli et al.
2008), and schizophrenia (Swanson et al. 2010). Whether
there could be a physiologic disturbance common to
these asymmetries has not been much considered, but the
hemispheric lateralization of management of the auto-
nomic nervous system functioning (Yoon et al. 1997;
Avnon et al. 2004; Craig 2005) – sympathetic and
parasympathetic divisions by the right and left hemi-
spheres, respectively – seems to raise the possibility
that hemispheric oscillatory asymmetry may be an indica-
tor of dysregulation of autonomic nervous system
functioning.
Given that neuronal populations oscillate over a range
of low to high frequencies, it is also possible to describe
neural oscillatory disturbances as suboptimal proportiona-
tion of spectral EEG power across those frequency ranges,
usually discerned through comparison of average ampli-
tudes of broadband EEG ranges (i.e., delta, 0.5–4 Hz;
theta, 4–8 Hz; alpha, 8–12 Hz; beta, 12–30 Hz; gamma,
>30 Hz). Attention-deficit spectrum disorders (Barry
et al. 2003), mild cognitive impairment (Babiloni et al.,
2010), dementia (Dauwels et al. 2010), and traumatic
brain injury (Moeller et al. 2011) have been associated
with relative excess power in low frequencies (i.e., delta
and/or theta) in comparison with high frequencies. Other
forms of suboptimal proportionation of spectral EEG
power have been reported with insomnia (Perlis et al.
2001; Wolynczyk-Gmaj and Szelenberger 2011), alcohol-
ism (Campanella et al. 2009), and chronic fatigue
syndrome (Decker et al. 2009).
The existence of an array of conditions which
share thematic forms of neural oscillatory disturbance –asymmetry and suboptimal proportionation of spectral
power – suggests that a positive role may exist for
technologies that may constructively impact neural
oscillations in the direction of greater symmetry and
optimized proportionation.
Definition and development of HIRREM
Through serendipity, one of the authors of this article
(L. Gerdes) found that near real time reflection of neural
oscillatory activity back to the brain through the medium
of audible sound appeared to facilitate a state of relaxa-
tion wherein the brain, itself, would tend to change its
own activity patterns toward greater hemispheric EEG
symmetry and more optimized proportionation of regio-
nal spectral EEG power. We thus described the process
facilitated as one of relaxation and auto-calibration for
neural oscillations. The methodology has been continu-
ously refined since its development in 2000–2002, and
since 2010, it has been described technically as high-reso-
lution, relational, resonance-based electroencephalic mir-
roring or HIRREM. The technology is based on provision
of auditory musical tones corresponding to dominant fre-
quencies detectable in individual spectral EEGs, to permit
resonance between neural oscillatory frequencies and
auditory tones. It requires no direct energetic input to the
brain, no cognitive guidance or education from a
clinician, nor any referencing against population norms
for the EEG.
Allostatic regulation of neural oscillationsthrough HIRREM
Because of the variety of conditions, including “somatic,”
that have been reported to benefit from HIRREM on an
anecdotal basis (see Overview section), we infer that
HIRREM facilitates self-guided and healthful reorganiza-
tion of neural oscillations at some level(s) of primary
neural process, with consequences for both neuropsychi-
atric health and downstream peripheral physiology. To
model the larger theoretical role of HIRREM, we adduce
the concept of allostasis as defined by Sterling (2004,
2012). Allostasis refers to stability (stasis) through change
(allo). Allostasis highlights the centrality of the brain as
the master control center for human physiology, whose
primary function is to serve as an instrument for optimal
predictive regulation. The concept of allostasis may be
2 ª 2013 The Authors. Published by Wiley Periodicals, Inc.
HIRREMTM: Auto-Calibration of Neural Oscillations L. Gerdes et al.

clarified through comparison with the more commonly
used biomedical concept of homeostasis.
Homeostasis as a model of physiologicalregulation through maintenance ofpredetermined and normative set points
Homeostasis refers to stability (stasis) through constancy
(homeo) and is a model of physiological regulation in
which various systems are described in terms of their
requirement to maintain various set points at constant
values. These values are deemed normative, and system-
atic deviations are generally considered disease states. The
objective of biomedicine is to identify the mechanisms
underlying regulation of set points. The guiding assump-
tion is that mechanisms are dysfunctional in states of dis-
ease and therefore are the cause of deviated set points.
Therapeutics thus consists of intervention to correct dys-
functionality of local mechanisms. The system set points
being “defended” in homeostasis are typically defined
based on prespecified level of demand, calculated on
norms derived from historical or other controlled influ-
ences. Homeostasis thus focuses on functionality (or dys-
functionality) of local mechanisms without a nuanced
appreciation for how complex environmental contexts
drive system needs or set points in the first place. The
seeds for the concept of homeostasis were developed
before the dissemination of evolutionary theory (Sterling
2012), and thus, the homeostasis model reflects an under-
standing of life itself as being fundamentally unchanging.
Allostasis as a model of brain-guided predictiveregulation through dynamic optimization ofsystem set points
Allostasis conceives the brain as the master regulator
which, when well-functioning, anticipates changing needs
in a constantly changing environment and recalibrates sys-
tem set points in accordance with present or anticipated
demands. The brain dynamically allocates and re-allocates
the body’s energetic resources in order to optimize fitness.
In the Sterling model of allostasis, activities of the present
should meet the needs of the present; they should not be
organized to meet the demands of the past or other non-
salient norms; and they must also include anticipation and
preparation for the needs of the future. In the allostasis
model, deviations of system set points may be indicative
of disease states, but local mechanisms are not viewed as
being intrinsically dysfunctional – rather they are simply
responding to a different level of demand.
Figure 1 (adapted from Sterling 2004) illustrates a sim-
plified general model for how a healthy system will adjust
its output set points to respond dynamically for the
changing levels of ambient demand (Fig. 1A). The system
set point can become stuck (Fig. 1B), for example,
because of an acutely potent demand or elevated demand
over time (e.g., a trauma or chronic stress), to produce
outputs which are calibrated for the historical level of
demand, despite the emergence of a new and lower level
of demand. Pharmacological therapy (Fig. 1C) can alter
and clamp the system set point at an output level which
appears more congruent with the present demand, but at
the expense of depriving the system of its dynamic range
(A)
(B)
(C)
(D)
Figure 1. Rhythmic output of a model system under conditions of
health and fluctuating demand (A); “stuckness” due to prolonged or
possibly acutely potent demand (B); pharmacotherapy (C); and an
idealized health intervention, associated with gradual reduction of
demand (D). Black vertical arrows denote changes in demand on the
system. Adapted from Sterling (2004).
ª 2013 The Authors. Published by Wiley Periodicals, Inc. 3
L. Gerdes et al. HIRREMTM: Auto-Calibration of Neural Oscillations
of action. An ideal intervention (Fig. 1D) would encour-
age a diseased system to relax, become “unstuck,” and
recalibrate output for the true and present (not historical)
level of demand.
Allostasis would appear to be consistent with the view
of physiology from nonlinear dynamical theory, which
considers system complexity to be a hallmark of health
(Goldberger et al. 2002). It may be that it is the loss of
complexity, rather than the loss of regularity, which is
associated with disease states. Decreased neural functional
complexity has been described in Alzheimer’s disease
(Jeong 2004), mild cognitive impairment (Cantero et al.
2009), posttraumatic stress disorder (Chae et al. 2004),
and autism (Bosl et al. 2011; Catarino et al. 2011).
Decreased EEG complexity can be observed in epileptic
seizure (Babloyantz and Destexhe 1986), and increased
variability of synchrony has been shown to be associated
with recovery from pediatric traumatic brain injury
(Nenadovic et al. 2008). Increased complexity appears to
be a normal and perhaps healthy feature of the EEG over
the course of human development from infancy to
older age (Meyer-Lindenberg 1996; Anokhin et al. 2000;
McIntosh et al. 2008; Muller and Lindenberger 2012).
Allostasis and disease
The difference between the homeostasis and allostasis
models of physiological regulation can be illustrated
through the ways they explain blood pressure management
(Sterling 2004). Homeostasis portrays blood pressure as a
set point managed by blood volume, vascular resistance
and cardiac output, and medical interventions aim to
impact mechanisms related to the management of those
variables. Allostasis portrays blood pressure as a set point
influenced proximally by vascular resistance, volume, and
cardiac output among other factors, but ultimately man-
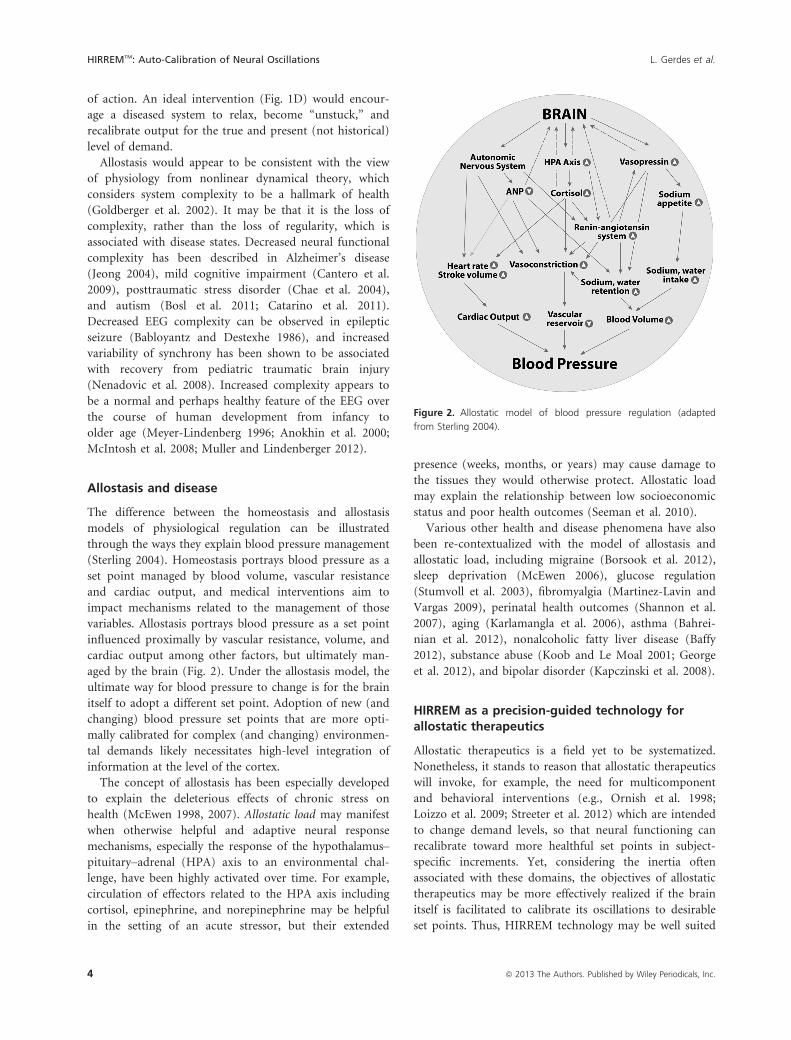
aged by the brain (Fig. 2). Under the allostasis model, the
ultimate way for blood pressure to change is for the brain
itself to adopt a different set point. Adoption of new (and
changing) blood pressure set points that are more opti-
mally calibrated for complex (and changing) environmen-
tal demands likely necessitates high-level integration of
information at the level of the cortex.
The concept of allostasis has been especially developed
to explain the deleterious effects of chronic stress on
health (McEwen 1998, 2007). Allostatic load may manifest
when otherwise helpful and adaptive neural response
mechanisms, especially the response of the hypothalamus–pituitary–adrenal (HPA) axis to an environmental chal-
lenge, have been highly activated over time. For example,
circulation of effectors related to the HPA axis including
cortisol, epinephrine, and norepinephrine may be helpful
in the setting of an acute stressor, but their extended
presence (weeks, months, or years) may cause damage to
the tissues they would otherwise protect. Allostatic load
may explain the relationship between low socioeconomic
status and poor health outcomes (Seeman et al. 2010).
Various other health and disease phenomena have also
been re-contextualized with the model of allostasis and
allostatic load, including migraine (Borsook et al. 2012),
sleep deprivation (McEwen 2006), glucose regulation
(Stumvoll et al. 2003), fibromyalgia (Martinez-Lavin and
Vargas 2009), perinatal health outcomes (Shannon et al.
2007), aging (Karlamangla et al. 2006), asthma (Bahrei-
nian et al. 2012), nonalcoholic fatty liver disease (Baffy
2012), substance abuse (Koob and Le Moal 2001; George
et al. 2012), and bipolar disorder (Kapczinski et al. 2008).
HIRREM as a precision-guided technology forallostatic therapeutics
Allostatic therapeutics is a field yet to be systematized.
Nonetheless, it stands to reason that allostatic therapeutics
will invoke, for example, the need for multicomponent
and behavioral interventions (e.g., Ornish et al. 1998;
Loizzo et al. 2009; Streeter et al. 2012) which are intended
to change demand levels, so that neural functioning can
recalibrate toward more healthful set points in subject-
specific increments. Yet, considering the inertia often
associated with these domains, the objectives of allostatic
therapeutics may be more effectively realized if the brain
itself is facilitated to calibrate its oscillations to desirable
set points. Thus, HIRREM technology may be well suited
Figure 2. Allostatic model of blood pressure regulation (adapted
from Sterling 2004).
4 ª 2013 The Authors. Published by Wiley Periodicals, Inc.
HIRREMTM: Auto-Calibration of Neural Oscillations L. Gerdes et al.

to serve as a catalyst for neural changes underpinning
healthful behavior change.
Materials and Methods
Overview of HIRREM requirements andapplication
The physical requirements for provision of HIRREM
include a standard PC-based desktop or laptop computer, a
specialized EEG amplifier and preamplifier, EEG sensors,
standard earbud headphones, a specialized software pro-
gram, and a reclining chair. EEG sensors connected to the
preamplifier (powered by a 9 V, 400 mAh rechargeable
lithium ion battery) filter 50 and 60 Hz activity so as to
reduce the contribution of environmental electromagnetic
noise. Sampling rate is 256 Hz. The amplifier is powered by
a standard Windows-based laptop computer and uses a 16-
bit A/D converter with a notch filter for rejection of signal
>50 dB at 50 or 60 Hz. Signal processing is done in a 64-
bit computer processor. Technologists are trained to iden-
tify EEG evidence of grossly recurring artifact (e.g., eye-
blinking) or sensor displacement from the scalp, but the
software does not attempt to identify artifact or other
forms of noise (see HIRREM and EEG artifact or noise).
Provision of HIRREM for an individual consists of
EEG and questionnaire-based assessment, active HIRREM
sessions (generally 60–90 min each, 3–10 sessions or
more), and software-supported data analysis by a technol-
ogist. Questionnaires capture data related to symptoms,
medical history, and objectives for undergoing the HIR-
REM procedure. Data are collected in a master database
(see below), which is used to help guide ongoing innova-
tions of HIRREM technology. Based on clinical experi-
ence suggesting a deleterious effect on outcomes, subjects
are strongly advised to abstain from alcohol and recrea-
tional drugs for the period of their HIRREM sessions and
for at least 3 weeks thereafter.
Procedure for HIRREM assessment
Assessment consists of serial measurements of two-channel
EEG using active sensors, with scalp locations identified
based on the International 10–20 EEG system. Two record-
ing sensors, two reference sensors, and one ground sensor
are used. Measurements are taken at homologous regions
of the hemispheres (F3/F4, C3/C4, T3/T4, P3/P4, O1/O2)
for eyes closed (1 min), partially closed (1 min), and eyes
open (1 min), with subject in an upright, seated position.
For eyes closed, subjects are asked to rest and relax quietly.
For eyes open, subjects are given standardized tasks
involving numerical digit-recall (F3/F4), reading silently
(C3/C4), calculations (P3/P4), listening comprehension
(P3/P4), and visual observation (O1/O2). A sixth mea-
surement is taken along the midline of the scalp at FZ/OZ.
The reference sensors are connected at A1/A2 and linked.
The EEG portion of the assessment takes approximately
45–60 min to complete.
Procedure for HIRREM exercises
With the subject comfortably at rest, sitting or reclining
in a zero-gravity chair, sensors are placed over specific
target areas on the scalp. As with the assessment, up to
two recording sensors, two reference sensors, and one
ground sensor are used. Most HIRREM protocols
(defined as a combination of sensor montage and the
specific software design) capture two channels of electro-
encephalic data between homologous regions of the hemi-
spheres. Two-channel single-sided protocols may be used
to focus attention on apparently recalcitrant oscillatory
activity localizing in a particular region. One-channel
protocols may also be used to focus attention, especially
in “alpha” and “beta” frequency bands, on single regions
without a particular interest in symmetry with the homol-
ogous region of the contralateral lobe.
Initial placements for the sensors are recommended by
the HIRREM software based on cortical regions and spec-
tral frequency ranges exhibiting the greatest asymmetries
and/or suboptimal proportionations of spectral power,
based on data collected during the assessment. Single
HIRREM sessions generally consist of 5–8 protocols, each
lasting 5–15 min. In general, sessions are provided on a
relatively compressed schedule, that is, as intensively as
two per day, or generally no more slowly than three per
week, with 10 sessions typically being completed within
3 weeks. A typical HIRREM session lasts 60–90 min.
During all HIRREM protocols, subjects wear standard
earbud headphones, through which they listen to the
musical tones generated by the HIRREM software algo-
rithms. Subjects are encouraged to relax in the zero-grav-
ity chair at a near-prone angle so as to maximize cerebral
blood flow, and they may be encouraged to visualize
themselves in a peaceful setting in nature or simply to
pay attention to their breathing. The majority of exercises
take place with eyes closed. For exercises with eyes open,
subjects may read a book or relax while watching chang-
ing graphics on a computer monitor.
High-resolution spectral analysis ofelectroencephalic data and dynamic,iterative engagement of dominantfrequencies
The HIRREM system includes proprietary preamplifiers
and filters which allow collection of electroencephalic data
ª 2013 The Authors. Published by Wiley Periodicals, Inc. 5
L. Gerdes et al. HIRREMTM: Auto-Calibration of Neural Oscillations

to the nearest 0.01 Hz, at the level of the sensor attached
to the scalp. HIRREM software analytics then identify
dominant frequencies in specific spectral brackets, in up
to 48,000 bins of spectral data for any given bracket.
Brackets are assigned by the software based on a proprie-
tary algorithm. The software compares the two channels
of data to ascertain the symmetry between channels of
EEG information and proportionation of spectral power
within the channels. From the bracket of frequencies
assigned for the subject’s exercise, the HIRREM software
translates the dominant EEG frequency in a given instant
of time to an audible musical tone, which is received by
the subject through earphones. Depending on algorithm
calculations, the delay between measurement and analysis
of neural oscillatory activity and consequent presentation
of corresponding musical tones can be as narrow as an
estimated 12 msec. The process then iterates.
The HIRREM mathematical algorithms to define spe-
cifically how and when the dominant EEG frequencies are
selected for resonance are informed by relationships
among the parameters of the individual’s own unique
spectral EEG. The specific tone is produced from a pro-
prietary mathematical algorithm principally informed by
the dominant frequency within the observed spectral
bracket. A sample sequence of tones produced during
1 min of a HIRREM exercise and the corresponding notes
on the pentatonic scale are available as Internet resources,
in the form of audio, and pdf files.
Application of HIRREM exercises to the bilateral tem-
poral lobes is emphasized, as we theorize that comparison
of spectral EEG amplitudes in simultaneous recordings at
the bilateral temporal lobes (T3 and T4 in the 10–20International EEG system) may provide an opportunity to
engage the degree of balance between the sympathetic and
parasympathetic divisions of the autonomic nervous sys-
tem. As noted in Introduction, numerous studies have
found that management of the autonomic nervous system
is lateralized in the cerebral hemispheres. Specifically,
right insular cortex appears to drive sympathetic func-
tioning, whereas left insular cortex drives parasympathetic
functioning (Craig 2005). T3 and T4 are located over
Brodmann areas 21 and 22, respectively, at the middle
and superior gyri of the temporal lobes (Homan et al.
1987) and are therefore in the proximity of insular cortex.
Apart from a focus on the temporal lobes, HIRREM exer-
cises take place for major regions of the cortex including
frontal, parietal, occipital lobes, central strip, and the
midline, and across the EEG frequency spectrum in each
of those locations.
At the conclusion of a single HIRREM session, the
provider runs an analysis program which shows summary
data for the session. Comparative amplitudes and coher-
ence of the two channels of data collected during various
protocols can be evaluated in the following 10 broadband
frequency ranges: 0–1, 1–3, 3–5.5, 5.5–7.5, 7.5–10, 10–12,12–15, 15–23, 23–36, and 36–48 Hz. Cortical regions and
spectral frequency ranges of interest can be chosen for
subsequent HIRREM sessions. Examples of the output
from this analysis program are shown in Figure 3, which
depicts changing amplitudes in the 0–1 and 36–48 Hz fre-
quency bands, over five successive HIRREM exercises at
the temporal lobes. As of the time of this writing, new
00:05
Left Left: Trend Right Right: Trend
00:00 00:10 00:15 00:2500:20 00:30 00:35 00:40 00:45
40.00u
37.50u
35.00u
32.50u
30.00u
27.50u
25.00u
22.50u
20.00u
17.50u
15.00u
10.00u
7.50u
5.00u
12.50u
Time
4.75u
4.50u
4.25u
4.00u
3.75u
3.50u
2.75u
2.50u
1.75u
1.50u
3.25u
3.00u
2.25u
2.00u
00:05
Left Left: Trend Right Right: Trend
00:00 00:10 00:15 00:2500:20 00:30 00:35 00:40 00:45
Time
(A)(B)
Figure 3. Changing asymmetry at the bilateral temporal lobes over the course of five successive HIRREM exercises, in the 0–1 Hz (A) and
36–48 Hz (B) frequency bands. Yellow line represents amplitudes at T3, and red line represents amplitudes at T4. Each HIRREM exercise is
represented by a background with alternating shades of gray.
6 ª 2013 The Authors. Published by Wiley Periodicals, Inc.
HIRREMTM: Auto-Calibration of Neural Oscillations L. Gerdes et al.

analytic software is being developed to enable computer-
guided recommendations for protocols to implement in
successive HIRREM sessions. The new session-to-session
analytic tool performs primarily time-domain analysis of
amplitudes in the 10 aforementioned ranges, aggregated
over 15-sec intervals after removing the first and last
30 sec to eliminate artifacts related to the start or end of
the exercise. Data are fitted using regression analysis
to determine trends of symmetry and proportionation of
spectral power. Based on the identified trends, HIRREM
protocol suggestions are made for the next session.
Use of HIRREM master database to guideiterative innovations in hardware andsoftware
All data associated with the HIRREM procedure including
responses to the questionnaires, the assessments, and all
HIRREM exercises are stored locally on computers at var-
ious locations throughout the world where HIRREM is
provided. These locations are linked by Internet to the
corporate headquarters of the developers of HIRREM
technology (Brain State Technologies, Scottsdale, AZ). On
a nightly basis, these data are uploaded without personal
identifiers into a master database located at the corporate
headquarters.
The information in this database allows for exploratory
hypothesis testing to identify possible correlations
between symptom clusters and EEG patterns, thereby
facilitating the refinement of HIRREM software designs
and protocol options. Thus, HIRREM technology is con-
tinuously adjusted and refined to selectively provide reso-
nance for cortical regions and EEG spectral ranges which
may better assist the subject’s own unique self-regulatory
process. Notably, the master database is not used to gen-
erate normative values for EEG parameters, against which
subjects would be compared and which would be held as
a basis for therapeutic goals.
Results
Overview
As of September 2012, HIRREM technology is being used
by over 200 providers in North America, Europe, South
Africa, Asia, and Australia. Over 50,000 subjects have
undergone HIRREM worldwide and are contained in the
database. Case series of outcomes have been reported for
individuals with neurodegenerative disease (Singh and
Gerdes 2009a) and depression (Singh and Gerdes 2009b).
Anecdotally, a range of benefits are reported including
relief from sleep disorders, depressive symptoms and
anxiety, reduced symptomatology related to trauma,
improved cognitive functioning, relief from addictive
urges, improvement in cardiovascular and gastrointestinal
conditions, and others. A randomized, wait-list controlled
pilot trial has shown efficacy of HIRREM for relieving
symptoms of insomnia (Tegeler et al. 2012), and a pla-
cebo-controlled trial testing efficacy for migraine has been
completed.
Changes in temporal lobe EEG asymmetryassociated with use of HIRREM as anintervention for insomnia
We present changes in temporal lobe asymmetry for 19
subjects enrolled in a randomized, wait-list, controlled
pilot trial of HIRREM as an intervention for insomnia.
Methods and main clinical outcomes for this study have
been reported elsewhere (Tegeler et al. 2012). Mean age of
subjects was 45 (70% women), and at baseline, mean score
on the Insomnia Severity Index (Bastien et al. 2001) was
18.8, indicating, on average, clinical insomnia of moderate
severity. Subjects also reported substantial depressive
symptomatology (average CES-D score 14.9). All subjects
underwent an average of nine (range 8–13) HIRREM ses-
sions, beginning either immediately after enrollment into
the study or after a waiting period (usual care) of 6 weeks.
At the primary endpoint, subjects undergoing HIRREM
reported a reduction of 10.3 points in the ISI, while those
undergoing usual care reported no change.
Though HIRREM exercises were conducted at the tem-
poral, occipital, parietal, central, and frontal lobes, and
anterior and posterior midline, temporal lobes were cho-
sen for the present analysis on an a priori basis, because of
the proximity of the insula and limbic structures related
to autonomic functioning (see High-resolution spectral
analysis of electroencephalic data and dynamic, iterative
engagement of dominant frequencies). Data for calculation
of asymmetry scores were derived from the HIRREM exer-
cise conducted at the bilateral temporal lobes, for each
subject and for each session. For those sessions in which
two exercises were conducted at the temporal lobes, the
first exercise was used for calculation of the asymmetry
score. Asymmetry scores were calculated based on the log
of the average spectral power (23–36 Hz) at T4 over the
course of the 8-min HIRREM exercise, minus log of the
average spectral power (23–36 Hz) at T3. The high fre-
quency (23-36 Hz) range of the EEG was chosen for the
present analysis because of evidence of high-frequency
arousal as being contributory to insomnia (Perlis et al.
2001; Wolynczyk-Gmaj and Szelenberger 2011).
Figure 4 shows the average asymmetry score for T3 in
comparison with T4, for all 19 subjects over the course of
their HIRREM sessions. Rightward asymmetry (T4 > T3)
diminished over the course of six HIRREM sessions, fol-
ª 2013 The Authors. Published by Wiley Periodicals, Inc. 7
L. Gerdes et al. HIRREMTM: Auto-Calibration of Neural Oscillations

lowed by a shift to average leftward asymmetry (T3 > T4)
for session 7, and a return to rightward asymmetry for
session 8. To test whether change in asymmetry was
correlated with improvement in insomnia symptoms, an
individual asymmetry change value was computed for
each individual, by fitting a simple linear equation to the
serial asymmetry scores of each subject. A positive slope
for this equation indicated a trend of higher asymmetry
scores over the course the sessions, or greater dominance
of T4 over T3, whereas a negative slope indicated a trend
of lower asymmetry scores, or diminishing dominance of
T4 over T3. A plot of individual change of asymmetry
scores against individual change in insomnia as measured
by the Insomnia Severity Index (Bastien et al. 2001) is
shown in Figure 5. There was a trend for reduction of
temporal lobe high-frequency EEG asymmetry in the
direction of less dominance of T4 over T3 to correlate
with greater reduction of insomnia symptoms.
Safety and side effects
HIRREM has been found to be a safe procedure. Based
on experience with provision of case management support
(by Brain State Technologies), feedback from clients and
the HIRREM provider community, and three IRB-
approved studies based at a tertiary medical center, the
developers and researchers are not aware of any serious
adverse events resulting from undergoing HIRREM.
On an anecdotal basis, individuals undergoing HIR-
REM may report an apparent “release of emotions” or
paradoxical effects especially initially, which can manifest
as brief periods of increased awareness of emotional
states, both positive and negative. These experiences are
typically transient, that is, lasting intermittently over
the course of one to several days. In the course of provi-
sion of HIRREM to 118 subjects participating in three
university-based IRB-approved studies, subthreshold
changes in emotional symptomatology (not requiring
additional clinical intervention or necessitating discontin-
uation of sessions) were estimated by the principal inves-
tigator to occur in approximately 5–10% of subjects. All
HIRREM sessions are administered by technologists who
have been certified in the procedure, including guidelines
for addressing emotional releases that may occur. If emo-
tional releases are prolonged or intense, individuals are
1 2 3 4Session
5 6 7 8
Asy
mm
etry
Sco
re
–0.3
–0.2
–0.1
0.0
0.1
0.2
0.3
0.4
0.5
0.6
Figure 4. Tukey plot of average asymmetry scores between T3 and T4 in the 23–36 Hz range, over the course of eight successive HIRREM
exercises for 19 subjects enrolled in a clinical trial evaluating efficacy of HIRREM as an intervention for insomnia. Whiskers extend to last
observation not more than 1.5 times the interquartile range. Dots represent observations more than 1.5 times the interquartile range.
Figure 5. Correlation between individual change in asymmetry
between T3 and T4 in 23–36 Hz range over eight serial HIRREM
exercises, and change in insomnia symptoms as measured by change
in ISI score. More negative change in asymmetry scores indicates
lesser dominance of amplitudes at T4 over T3. More negative ISI
change scores indicate greater reduction in insomnia symptoms.
Change in asymmetry is calculated as the slope of a linear equation
fitted to the series of asymmetry scores over eight serial HIRREM
exercises, for each individual.
8 ª 2013 The Authors. Published by Wiley Periodicals, Inc.
HIRREMTM: Auto-Calibration of Neural Oscillations L. Gerdes et al.

advised to see a mental health professional for additional
evaluation or treatment.
Discussion
Comparison with other interventions toremediate disturbances of neuraloscillations
There is no absolute schema for the classification of inter-
ventions that can impact neural oscillations, nor is there
a logical consensus for terminology. For example, while
the term “neuromodulation” is used by some providers
to refer specifically to surgically implanted devices for
direct stimulation of neural tissue, there is no doubt that
myriad other interventions can act as modulators of neu-
ral function either through stimulation of the cortex
through the skull, pharmacological action (e.g., influenc-
ing neuronal membrane potentials or ion channel func-
tion), or sensory stimulation of the peripheral nervous
system from consumer-oriented or computer-based
technologies.
A variety of device-based interventions exist which can
impact neural oscillations. Electroconvulsive therapy,
transcranial magnetic stimulation, and transcranial direct
current stimulation can impact neural oscillations
through delivery of electromagnetic energy from a device
to the cortex through the skull. Deep brain stimulation,
transcutaneous electrical nerve stimulation, vagus nerve
stimulation, and others impact neural oscillations by
delivery of electrical impulses through implanted devices
that are in direct contact with neural tissue. Stimulation
devices available in the consumer marketplace can entrain
neural oscillations toward specific and predetermined fre-
quencies through delivery of rhythmic light and/or sound.
EEG operant conditioning (also known as EEG biofeed-
back or neurofeedback) is a collection of techniques for
measuring neural oscillations in broadband EEG ranges
and teaching individuals how to consciously increase or
decrease the amplitudes in those ranges. Individuals are
presented with visual and/or auditory stimuli as feedback
when average amplitudes of the selected ranges cross a
predetermined threshold. These stimuli are thus presented
as either “rewards” for movement of energy toward the
specified parameter or “inhibits” if the energy moves in
the nonnormative direction. To set parameters of training,
providers may access databases of EEG assessments to for-
mulate a normative basis for evaluation and treatment.
Clinical studies of EEG operant conditioning have been
reported for a number of disorders including epilepsy
(Sterman 2010) and attention-deficit disorder (Arns et al.
2009). The technology is noninvasive and generally con-
sidered a low-risk procedure with minimal side effects.
A limitation of EEG operant conditioning (conscious
associative learning) to change average amplitudes of
broadband spectral EEG ranges (i.e., delta, theta, alpha,
beta, gamma) is that it is likely associated with collateral,
nonuseful learning. That is to say, learning to change
amplitudes across these broad ranges will entail learning
to change amplitudes for some segments of those fre-
quency ranges that are likely nonproblematic for that
individual (Salansky et al. 1998). Relatedly, use of broad-
band EEG ranges entails a relative blurring of large quan-
tities of EEG information. Szava et al. (1994) found that
broadband analysis could obscure peaks of energy detect-
able in narrower frequency ranges that appeared to be
associated with pathology. Also, the precise spectral loca-
tion of the peak frequency for the alpha (8–12 Hz) range
is variable across individuals, and the location of this
peak is a meaningful parameter that has been correlated
with development (Cragg et al. 2011) and cognitive per-
formance (Angelakis et al. 2004). Engagement with an
individual’s unique spectral EEG fingerprint is not possi-
ble with technologies that rely on standard broadband
EEG frequency ranges.
HIRREM and EEG artifact or noise
Artifact identification and rejection are thematic to the
field of EEG. EEG artifacts may include a variety of dis-
crete phenomena including abnormalities of the EEG
tracing which are due not to neural oscillation but rather
to scalp muscular contraction, eyeblinking, or head or
sensor movement.
For the practice of EEG operant conditioning, the iden-
tification of EEG artifact is mission-critical, because the
presentation of reward or inhibit signals in response to
peripheral muscular contractions (for example), rather
than neuronal oscillations, is subversive to the purpose
and basis of the enterprise. (Likewise, artifact identifica-
tion is critical for medical EEG especially insofar as defin-
itive diagnosis depends on accurate characterization of
EEG waveforms which are abnormal but may manifest
inconsistently.)
Because HIRREM technology does not aim to con-
sciously teach the individual through signals of reward or
inhibition, we postulate that there is little if any jeopardy
associated with providing auditory signals which are
informed by nonneural sources and are therefore “mean-
ingless.” (Nor does HIRREM aim to diagnose disease.)
Rather we infer that the brain responds to epochs of HIR-
REM sounds generated from grossly noisy EEG artifact in
the way that it would respond to grossly noisy sounds.
Furthermore, artifact-associated data will tend to be dis-
tributed symmetrically, and because HIRREM algorithms
are based on the relationship of activity between homolo-
ª 2013 The Authors. Published by Wiley Periodicals, Inc. 9
L. Gerdes et al. HIRREMTM: Auto-Calibration of Neural Oscillations

gous brain regions, artifactual signals will tend to cancel
one another out in the algorithmic equation.
We also hypothesize that, paradoxically, a possible
mechanism for benefit of HIRREM could be the engage-
ment between HIRREM and what is generally considered
background noise or randomness in the EEG. The core
technical aim of HIRREM is to resonate with dynamically
changing dominant frequencies in the spectral EEG. Vari-
ations of amplitudes in these frequencies are typically
characterized in stochastic terms. That is, the energies of
interest to HIRREM are in the category of apparently ran-
dom fluctuations in the EEG, or noise.
Variations in system noise levels can change the proba-
bility that a weak periodic signal will cross a threshold for
sensory processing. The presence of an optimal noise level
in a system can improve detection of a weak periodic sig-
nal, by boosting the signal sufficiently to cross the output
threshold. For example, small increments in the lumi-
nance of a square presented to the right eye are better
detected when there are tiny random fluctuations in the
luminance of a square presented to the left eye than when
the square presented to the left eye has constant lumi-
nance (Kitajo et al. 2003). This phenomenon has been
referred to as stochastic resonance or stochastic facilita-
tion, and it has been demonstrated for visual, auditory,
and tactile sensory modalities (McDonnell and Ward
2011).
An implication of stochastic facilitation is that the sys-
tem noise level may be a critical parameter for neural
information processing (McIntosh et al. 2010; McDonnell
and Ward 2011). If noise levels systematically change
through HIRREM, it could be hypothesized that HIRREM
impacts endogenous noise levels and thereby impacts
overall efficiency of information processing.
Possible contribution of placebo effects orother nonspecific factors
Delivery of HIRREM entails up to 10 or more visits
(90 min each) with HIRREM technologists, instruction to
relax while listening to musical tones, and being recum-
bent in a comfortable chair situated in a quiet environ-
ment. This combination of social interaction and
relaxation induction might be predicted to produce
improvements in self-reported well-being irrespective of
the specific pitch or timing of musical tones produced
through the HIRREM software algorithms. To establish
definitively that clinical improvements associated with
HIRREM are attributable to the specificity of software
algorithms and not placebo effects or other nonspecific
factors, placebo-controlled trials are indicated.
As a preliminary illustration of the contrast between
nonspecific relaxation induction and HIRREM, Figure 6
shows high-frequency (23–36 Hz) amplitudes in bilateral
temporal lobes during exposure to three different types of
sounds for a 37-year-old man with insomnia (Insomnia
Severity Index Score 18, indicating moderate clinical
insomnia) who presented to a community-based setting
for HIRREM provision. Prior to beginning the standard
HIRREM assessment and proceeding with the HIRREM
6.25u6.00u5.75u5.50u5.25u5.00u4.75u4.50u4.25u4.00u3.75u3.50u
2.75u2.50u
00:01 00:02 00:03 00:04 00:05 00:06
Time00:07 00:08 00:09 00:10 00:11 00:12
00:01 00:02 00:03 00:04 00:05 00:06
Time00:07 00:08 00:09 00:10 00:11 00:12
00:01 00:02 00:03 00:04 00:05 00:06
Time00:07 00:08 00:09 00:10 00:11 00:12
3.25u3.00u
6.25u6.00u5.75u5.50u
7.00u6.75u6.50u
5.25u5.00u4.75u4.50u4.25u4.00u3.75u3.50u
2.75u
3.25u3.00u
4.00u
3.75u
3.50u
2.75u
2.50u
3.25u
3.00u
2.25u
2.00u
(A)
(B)
(C)
Figure 6. High-frequency (23–36 Hz) amplitudes (microvolts) in
bilateral temporal lobes (T3 yellow, T4 red), for a 37-year-old man
with insomnia, obtained from continuous EEG recordings (eyes closed)
while listening to 12 min of white noise (A), random musical tones (B),
and musical tones generated from HIRREM software algorithms (C).
10 ª 2013 The Authors. Published by Wiley Periodicals, Inc.
HIRREMTM: Auto-Calibration of Neural Oscillations L. Gerdes et al.

intervention, the subject agreed to listen to three consecu-
tive sets (12 min each) of “relaxing sounds” while under-
going continuous EEG recording (using HIRREM
technology as described in High-resolution spectral
analysis of electroencephalic data and dynamic, iterative
engagement of dominant frequencies). The first two
sound sets were commercially available sound generators
for white noise (http://www.simplynoise.com) and ran-
dom musical tones (Winchime 3.0; http://www.sagebrush.
com). The third sound set was a HIRREM protocol for
the temporal lobes. In the interval before the second and
third sound sets, the subject rested (1 min) and partici-
pated in a digit-recall task (1 min). Figures 6A and B
demonstrate a consistent left hemispheric dominance
while the subject listened to white noise and random
musical tones, and no change in the amplitudes over the
course of the sound sets. Figure 6C demonstrates gradual
quieting, with progressive reduction of amplitudes begin-
ning at minute 1 and continuing through minute 9, as
well as disappearance of the asymmetry midway through
minute 9, while listening to the HIRREM tones.
Conclusion
Disturbances of neural oscillation have been reported with
a variety of disease states, and there is a need for expan-
sion of the repertoire of interventions which can posi-
tively impact oscillatory dynamics. The model of allostasis
implies that brain functioning has consequences not only
for neural systems but also for peripheral physiology, and
thus further highlights the imperative for optimization of
brain functional set points. Use of HIRREM, a noninva-
sive technology that creates sequences of resonance
between neural oscillatory frequencies and musical tones,
was associated with reduction of temporal lobe high-
frequency asymmetry and fewer insomnia symptoms
among individuals in a controlled clinical pilot trial.
Studies are currently ongoing to further investigate
potential applications of HIRREM and elucidate biophysi-
cal mechanisms of action.
Acknowledgments
The authors thank Catherine Tegeler for her editorial
assistance and Laura Atwood for assistance in preparing
the figures.
Conflict of Interest
L. Gerdes is the inventor of HIRREM technology, and
CEO of Brain State Technologies LLC. P. Gerdes and
S. W. Lee are employees of Brain State Technologies.
C. H. Tegeler was the Principal Investigator for a pilot
clinical trial in 2011, evaluating HIRREM for insomnia.
That study was supported by an unrestricted research
grant to the Department of Neurology at Wake Forest
School of Medicine from Brain State Technologies. The
PI has received no salary support or other tangible bene-
fits related to HIRREM technology, and has no other
conflicts to report related to this work.
References
Angelakis, E., J. F. Lubar, S. Stathopoulou, and J. Kounios.
2004. Peak alpha frequency: an electroencephalographic
measure of cognitive preparedness. Clin. Neurophysiol.
115:887–897.
Anokhin, A. P., W. Lutzenberger, A. Nikolaev, and
N. Birmbaumer. 2000. Complexity of electrocortical
dynamics in children: developmental aspects. Dev.
Psychobiol. 36:9–22.
Arns, M., S. de Ridder, U. Strehl, M. Breteler, and A. Coenen.
2009. Efficacy of neurofeedback treatment in ADHD: the
effects on inattention, impulsivity and hyperactivity: a meta-
analysis. Clin. EEG Neurosci. 40:180–189.
Avnon, Y., M. Nitzan, E. Sprecher, Z. Rogowski, and
D. Yarnitsky. 2004. Autonomic asymmetry in migraine:
augmented parasympathetic activation in left unilateral
migraineurs. Brain 127:2099–2108.
Babiloni, C., P. J. Visser, G. Frisoni, P. P. De Deyn,
L. Bresciani, V. Jelic, et al. 2010. Cortical sources of resting
EEG rhythms in mild cognitive impairment and subjective
memory complaint. Neurobiol. Aging 31:1787–1798.
Babloyantz, A., and A. Destexhe. 1986. Low-dimensional chaos
in an instance of epilepsy. Proc. Natl Acad. Sci. USA
83:3513–3517.
Baffy, G. 2012. Allostasis in nonalcoholic fatty liver disease:
implications for risk assessment. Dig. Dis. Sci. doi: 10.1007/
s10620-012-2344-8.
Bahreinian, S., G. D. Ball, T. K. Vander Leek, I. Colman,
B. J. McNeil, A. B. Becker, et al. 2012. Allostatic load
biomarkers and asthma in adolescents. Am. J. Respir. Crit.
Care Med. doi: 10.1164/rccm.201201-0025OC.
Barry, R. J., A. R. Clarke, and S. J. Johnstone. 2003. A review
of electrophysiology in attention-deficit/hyperactivity
disorder: I. Qualitative and quantitative
electroencephalography. Clin. Neurophysiol. 114:171–183.
Bastien, C., A. Vallieres, and C. Morin. 2001. Validation of the
insomnia severity index as an outcome measure for
insomnia research. Sleep Med. 2:297–307.
Borsook, D., N. Maleki, L. Becerra, and B. McEwen. 2012.
Understanding migraine through the lens of maladaptive
stress responses: a model disease of allostatic load. Neuron
73:219–234.
Bosl, W., A. Tierney, H. Tager-Flusberg, and C. Nelson. 2011.
EEG complexity as a biomarker for autism spectrum
disorder risk. BMC Med. 9:18.
ª 2013 The Authors. Published by Wiley Periodicals, Inc. 11
L. Gerdes et al. HIRREMTM: Auto-Calibration of Neural Oscillations

Buzsaki, G. 2006. Rhythms of the brain. Oxford Univ. Press,
New York.
Campanella, S., G. Petit, P. Maurage, C. Kornreich, P.
Verbanck, and X. Noel. 2009. Chronic alcoholism:
insights from neurophysiology. Neurophysiol. Clin.
39:191–207.
Cantero, J. L., M. Atienza, A. Cruz-Vadell, A. Suarez-Gonzalez,
and E. Gil-Neciga. 2009. Increased synchronization and
decreased neural complexity underlie thalamocortical
oscillatory dynamics in mild cognitive impairment.
Neuroimage 46:938–948.
Catarino, A., O. Churches, S. Baron-Cohen, A. Andrade, and
H. Ring. 2011. Atypical EEG complexity in autism spectrum
conditions: a multi-scale entropy analysis. Clin.
Neurophysiol. 122:2375–2383.
Chae, J. H., J. Jeong, B. S. Peterson, D. J. Kim, W. M. Bahk,
T. Y. Jun, et al. 2004. Dimensional complexity of the EEG
in patients with posttraumatic stress disorder. Psychiatry
Res. 131:79–89.
Cragg, L., N. Kovacevic, A. R. McIntosh, C. Poulsen, K.
Martinu, G. Leonard, et al. 2011. Maturation of EEG power
spectra in early adolescence: a longitudinal study. Dev. Sci.
14:935–943.
Craig, A. D. 2005. Forebrain emotional asymmetry: a
neuroanatomical basis? Trends Cogn. Sci. 9:566–571.
Dauwels, J., F. Vialatte, and A. Cichocki. 2010. Diagnosis of
Alzheimer’s disease from EEG signals: where are we
standing? Curr. Alzheimer Res. 7:487–505.
Davidson, R. J., P. Ekman, C. D. Saron, J. A. Senulis, and W.
V. Friesen. 1990. Approach-withdrawal and cerebral
asymmetry: emotional expression and brain physiology. I. J.
Pers. Soc. Psychol. 58:330–341.
Decker, M. J., H. Tabassum, J. M. Lin, and W. C. Reeves.
2009. Electroencephalographic correlates of chronic fatigue
syndrome. Behav. Brain Funct. 5:43.
Engdahl, B., A. C. Leuthold, H. R. Tan, S. M. Lewis, A. M.
Winskowski, T. N. Dikel, et al. 2010. Post-traumatic stress
disorder: a right temporal lobe syndrome? J. Neural Eng.
7:066005.
Gale, J. T., R. Amirnovin, Z. M. Williams, A. W. Flaherty, and
E. N. Eskandar. 2008. From symphony to cacophony:
pathophysiology of the human basal ganglia in Parkinson
disease. Neurosci. Biobehav. Rev. 32:378–387.
George, O., M. Le Moal, and G. F. Koob. 2012. Allostasis and
addiction: role of dopamine and corticotrophin-releasing
factor systems. Physiol. Behav. 106:58–64.
Goldberger, A. L., L. A. Amaral, J. M. Hausdorff, P. C. Ivanov,
C. K. Peng, and H. E. Stanley. 2002. Fractal dynamics in
physiology: alterations with disease and aging. Proc. Natl.
Acad. Sci. USA 99(Suppl. 1):2466–2472.
Hale, T. S., S. L. Smalley, P. D. Walshaw, G. Hanada, J.
Macion, J. T. McCracken, et al. 2010. Atypical EEG beta
asymmetry in adults with ADHD. Neuropsychologia
48:3532–3539.
Homan, R. W., J. Herman, and P. Purdy. 1987. Cerebral
location of international 10–20 system electrod placement.
Electroencephalogr. Clin. Neurophysiol. 66:376–382.
Isler, J. R., K. M. Martien, P. G. Grieve, R. I. Stark, and M. R.
Herbert. 2010. Reduced functional connectivity in visual
evoked potentials in children with autism spectrum
disorder. Clin. Neurophysiol. 121:2035–2043.
Jeong, J. 2004. EEG dynamics in patients with Alzheimer’s
disease. Clin. Neurophysiol. 115:1490–1505.
Kapczinski, F., E. Vieta, A. C. Andreazza, B. N. Frey, F. A.
Gomes, J. Tramontina, et al. 2008. Allostatic load in bipolar
disorder: implications for pathophysiology and treatment.
Neurosci. Biobehav. Rev. 32: 675–692.
Karlamangla, A. S., B. H. Singer, and T. E. Seeman. 2006.
Reduction in allostatic load in older adults is associated
with lower all-cause mortality risk: MacArthur studies of
successful aging. Psychosom. Med. 68:500–507.
Kitajo, K., D. Nozaki, L. M. Ward, and Y. Yamamoto. 2003.
Behavioral stochastic resonance within the human brain.
Phys. Rev. Lett. 90:218103.
Koob, G. F., and M. Le Moal. 2001. Drug addiction,
dysregulation of reward, and allostasis.
Neuropsychopharmacology 24:97–129.
Lazarev, V. V., A. Pontes, A. A. Mitrofanov, and L. C.
deAzevedo. 2010. Interhemispheric asymmetry in EEG
photic driving coherence in childhood autism. Clin.
Neurophysiol. 121:145–152.
Loizzo, J., M. Charlson, and J. Peterson. 2009. A program in
contemplative self-healing: stress, allostasis, and learning in
the Indo-Tibetan tradition. Ann. NY Acad. Sci. 1172:123–
147.
Margineanu, D. G. 2010. Epileptic hypersynchrony revisited.
NeuroReport 21:963–967.
Martinez-Lavin, M., and A. Vargas. 2009. Complex adaptive
systems allostasis in fibromyalgia. Rheum. Dis. Clin. North
Am. 35:285–298.
Marzano, C., M. Ferrara, E. Sforza, and L. De Gennaro. 2008.
Quantitative electroencephalogram (EEG) in insomnia: a
new window on pathophysiological mechanisms. Curr.
Pharm. Des. 14:3446–3455.
McDonnell, M. D., and L. M. Ward. 2011. The benefits of
noise in neural systems: bridging theory and experiment.
Nat. Rev. Neurosci. 12:415–425.
McEwen, B. S. 1998. Protective and damaging effects of stress
mediators. N. Engl. J. Med. 338:171–179.
McEwen, B. S. 2006. Sleep deprivation as a neurobiologic and
physiologic stressor: allostasis and allostatic load.
Metabolism 55(10 Suppl. 2):S20–S23.
McEwen, B. S. 2007. Physiology and neurobiology of stress
and adaptation: central role of the brain. Physiol. Rev.
87:873–904.
McIntosh, A. R., N. Kovacevic, and R. J. Itier. 2008. Increased
brain signal variability accompanies lower behavioral
variability in development. PLoS Comput. Biol. 4:e1000106.
12 ª 2013 The Authors. Published by Wiley Periodicals, Inc.
HIRREMTM: Auto-Calibration of Neural Oscillations L. Gerdes et al.

McIntosh, A. R., N. Kovacevic, S. Lippe, D. Garrett, C. Grady,
and V. Jirsa. 2010. The development of a noisy brain. Arch.
Ital. Biol. 148:323–337.
Meyer-Lindenberg, A. 1996. The evolution of complexity in
human brain development: an EEG study.
Electroencephalogr. Clin. Neurophysiol. 99:405–411.
Moeller, J. J., B. Tu, and C. W. Bazil. 2011. Quantitative and
qualitative analysis of ambulatory electroencephalography
during mild traumatic brain injury. Arch. Neurol. 68:1595–
1598.
Moss, F., L. M. Ward, and W. G. Sannita. 2004. Stochastic
resonance and sensory information processing: a tutorial
and review of application. Clin. Neurophysiol. 115:267–281.
Muller, V., and U. Lindenberger. 2012. Lifespan differences in
nonlinear dynamics during rest and auditory oddball
performance. Dev. Sci. 15:540–556.
Nenadovic, V., J. S. Hutchison, L. G. Dominguez, H. Otsubo,
M. P. Gray, R. Sharma, et al. 2008. Fluctuations in cortical
synchronization in pediatric traumatic brain injury. J.
Neurotrauma 25:615–627.
Ornish, D., L. W. Scherwitz, J. H. Billings, S. E. Brown, K. L.
Gould, T. A. Merritt, et al. 1998. Intensive lifestyle change
for reversal of coronary heart disease. JAMA 280:2001–
2007.
Perlis, M. L., H. Merica, M. T. Smith, and D. E. Giles. 2001.
Beta EEG activity and insomnia. Sleep Med. Rev. 5:363–
374.
Rabe, S., A. Beauducel, T. Z€ollner, A. Maercker, and A. Karl.
2006. Regional brain activity in posttraumatic stress disorder
after motor vehicle accident. J. Abnorm. Psychol. 115:687–
698.
Salansky, N., A. Fedotchev, and A. Bondar. 1998. Responses of
the nervous system to low frequency stimulation and EEG
rhythms: clinical implications. Neurosci. Biobehav. Rev.
22:395–409.
Seeman, T. E., E. Epel, T. Gruenewald, A. Karlamangla, and B.
S. McEwen. 2010. Socio-economic differentials in peripheral
biology: cumulative allostatic load. Ann. N. Y. Acad. Sci.
1186:223–239.
Shannon, M., T. L. King, and H. P. Kennedy. 2007. Allostasis:
a theoretical framework for understanding and evaluating
perinatal health outcomes. J. Obstet. Gynecol. Neonatal.
Nurs. 36:125–134.
Singh, V. K., and L. Gerdes 2009a. Brain state conditioning in
neurodegenerative disease. Front. Neurosci. (e-book) 3:132.
Singh, V. K., and L. Gerdes. 2009b. Overcoming depression
through brain state conditioning. Front. Neurosci.(e-book)
3:150.
Spironelli, C., B. Penolazzi, and A. Angrilli. 2008.
Dysfunctional hemispheric asymmetry of theta and beta
EEG activity during linguistic tasks in developmental
dyslexia. Biol. Psychol. 77:123–131.
Sponheim, S. R., K. A. McGuire, S. S. Kang, N. D. Davenport,
S. Aviyente, E. M. Bernat, et al. 2011. Evidence of disrupted
functional connectivity in the brain after combat-related
blast injury. Neuroimage 54:S21–S29.
St-Jean, G., I. Turcotte, and C. H. Bastien. 2012. Cerebral
asymmetry in insomnia sufferers. Front. Neurol. 3:47. Epub
Mar 30.
Sterling, P. 2004. Principles of allostasis: optimal design,
predictive regulation, pathophysiology, and rational
therapeutics. Pp. 17–64 in J. Schulkin, ed. Allostasis,
homestasis, and the costs of physiological adaptation.
Cambridge Univ. Press, New York.
Sterling, P. 2012. Allostasis: a model of predictive regulation.
Physiol. Behav. 106:5–15.
Sterman, M. B. 2010. Biofeedback in the treatment of epilepsy.
Cleve. Clin. J. Med. 77(Suppl. 3):S60–S67.
Streeter, C. C., P. L. Gerbarg, R. B. Saper, D. A. Ciraulo, and
R. P. Brown. 2012. Effects of yoga on the autonomic
nervous system, gamma-aminobutyric-acid, and allostasis in
epilepsy, depression, and post-traumatic stress disorder.
Med. Hypotheses 78:571–579.
Stroganova, T. A., G. Nygren, M. M. Tsetlin, I. N. Posikera, C.
Gillberg, M. Elam, et al. 2007. Abnormal EEG lateralization
in boys with autism. Clin. Neurophysiol. 118:1842–1854.
Stumvoll, M., P. A. Tataranni, N. Stefan, B. Vozarova, and C.
Bogardus. 2003. Glucose allostasis. Diabetes 52:903–909.
Swanson, N., T. Eichele, G. Pearlson, and V. D. Calhoun 2010.
Lateral differences in the default mode network in schizo-
phrenia. Pp. 605–620 in K. Hugdahl and R. Westerhausen,
eds. The two halves of the brain: information processing in
the cerebral hemispheres. MIT Press, Cambridge.
Szava, S., P. Valdes, R. Biscay, L. Galan, J. Bosch, I. Clark,
et al. 1994. High resolution quantitative EEG analysis. Brain
Topogr. 6:211–219.
Tegeler, C. H., S. Kumar, D. Conklin, S. W. Lee, L. Gerdes, D.
P. Turner, et al. 2012. Open label, randomized, crossover
pilot trial of high resolution, relational, resonance-based,
electroencephalic mirroring (HIRREM) to relieve insomnia.
Brain Behav. 2:814–824.
Uhlhaas, P. J., and W. Singer. 2010. Abnormal neural
oscillations and synchrony in schizophrenia. Nat. Rev.
Neurosci. 11:100–113.
Wolynczyk-Gmaj, D., and W. Szelenberger. 2011. Waking EEG
in primary insomnia. Acta Neurobiol. Exp. 71:387–392.
Yoon, B. W., C. A. Morillo, D. F. Cechetto, and V. Hachinski.
1997. Cerebral hemispheric lateralization in cardiac
autonomic control. Arch. Neurol. 54:741–744.
Supporting Information
Additional Supporting Information may be found in the
online version of this article:
Table S1. List of sequential tones for a sample HIRREM
exercise.
Audio File. Sample of HIRREM musical tones (1 min).
ª 2013 The Authors. Published by Wiley Periodicals, Inc. 13
L. Gerdes et al. HIRREMTM: Auto-Calibration of Neural Oscillations