higher education governance in and among the united states governance in and among the us.… ·...
TRANSCRIPT
Higher Education
Governance in and
among the United States
OECD/IMHE
Thursday 24 August, 2006
Paul Lingenfelter, President, SHEEO
Overview of Presentation
• Diversity among the states in: •Structure •Governance •Policy
• Distinct (more or less) state and federal roles •Funding •Policy– setting and pursuing priorities
• Universal challenges and tensions •Tertiary education – a necessity, not just an option •Institutional “autonomy” vs. public purpose •Achieving productivity gains •Accountability
•Standards and assessment (the K-12 approach) •Better consumer information •Goal setting and continuous improvement
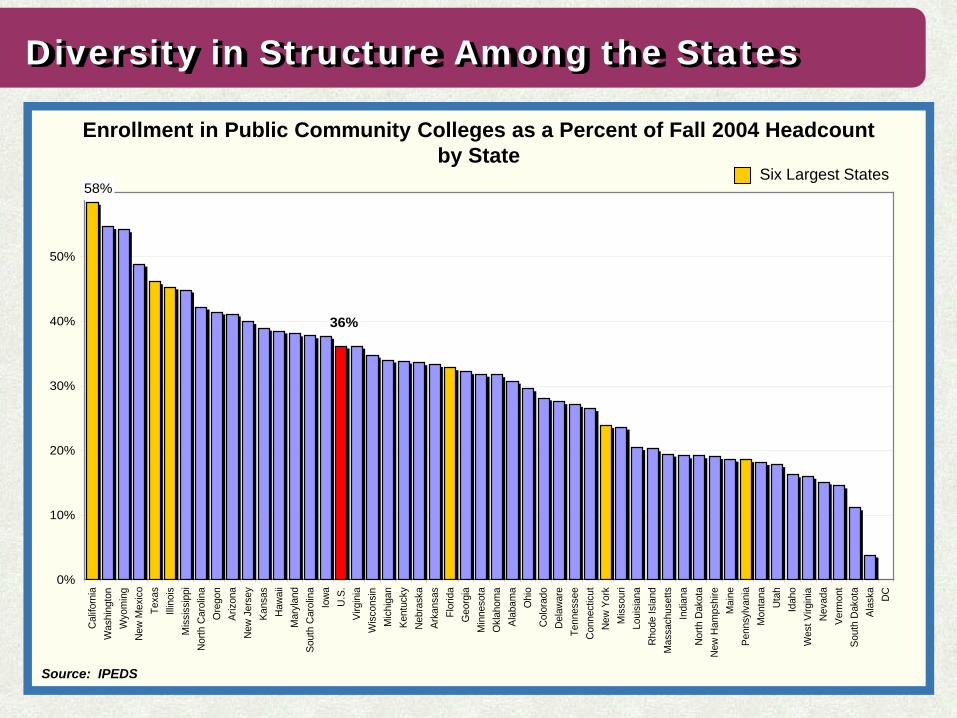
Diversity in Structure Among the States
Enrollment in Public Community Colleges as a Percent of Fall 2004 Headcount by State
Source: IPEDS
36%
58%
0%
10%
20%
30%
40%
50%
60%
Cal
iforn
iaW
ashi
ngto
nW
yom
ing
New
Mex
ico
Texa
sIll
inoi
sM
issi
ssip
piN
orth
Car
olin
aO
rego
nAr
izon
aN
ew J
erse
yKa
nsas
Haw
aii
Mar
ylan
dSo
uth
Car
olin
aIo
wa
U.S
.Vi
rgin
iaW
isco
nsin
Mic
higa
nKe
ntuc
kyN
ebra
ska
Arka
nsas
Flor
ida
Geo
rgia
Min
neso
taO
klah
oma
Alab
ama
Ohi
oC
olor
ado
Del
awar
eTe
nnes
see
Con
nect
icut
New
Yor
kM
isso
uri
Loui
sian
aR
hode
Isla
ndM
assa
chus
etts
Indi
ana
Nor
th D
akot
aN
ew H
amps
hire
Mai
nePe
nnsy
lvan
iaM
onta
naU
tah
Idah
oW
est V
irgin
iaN
evad
aVe
rmon
tSo
uth
Dak
ota
Alas
ka DC
Six Largest States
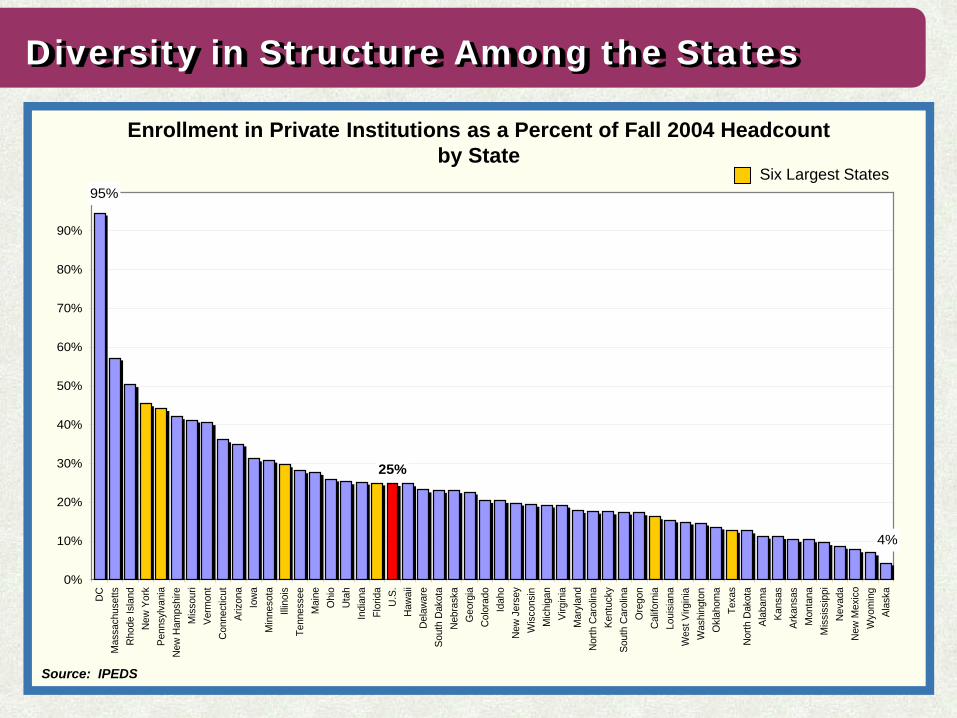
Diversity in Structure Among the States
Enrollment in Private Institutions as a Percent of Fall 2004 Headcount by State
Source: IPEDS
95%
25%
4%
0%
10%
20%
30%
40%
50%
60%
70%
80%
90%
100%
DC
Mas
sach
uset
tsR
hode
Isla
ndN
ew Y
ork
Penn
sylv
ania
New
Ham
pshi
reM
isso
uri
Verm
ont
Con
nect
icut
Ariz
ona
Iow
aM
inne
sota
Illin
ois
Tenn
esse
eM
aine
Ohi
oU
tah
Indi
ana
Flor
ida
U.S
.H
awai
iD
elaw
are
Sout
h D
akot
aN
ebra
ska
Geo
rgia
Col
orad
oId
aho
New
Jer
sey
Wis
cons
inM
ichi
gan
Virg
inia
Mar
ylan
dN
orth
Car
olin
aKe
ntuc
kySo
uth
Car
olin
aO
rego
nC
alifo
rnia
Loui
sian
aW
est V
irgin
iaW
ashi
ngto
nO
klah
oma
Texa
sN
orth
Dak
ota
Alab
ama
Kans
asAr
kans
asM
onta
naM
issi
ssip
piN
evad
aN
ew M
exic
oW
yom
ing
Alas
ka
Six Largest States
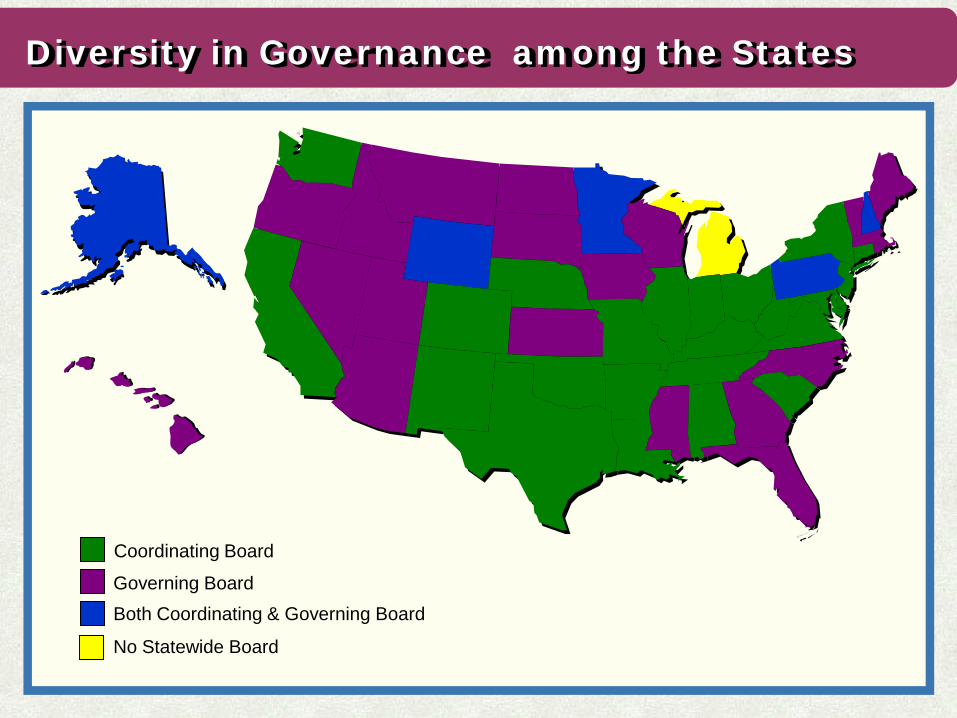
Diversity in Governance among the States
Coordinating Board
Governing Board Both Coordinating & Governing Board
No Statewide Board
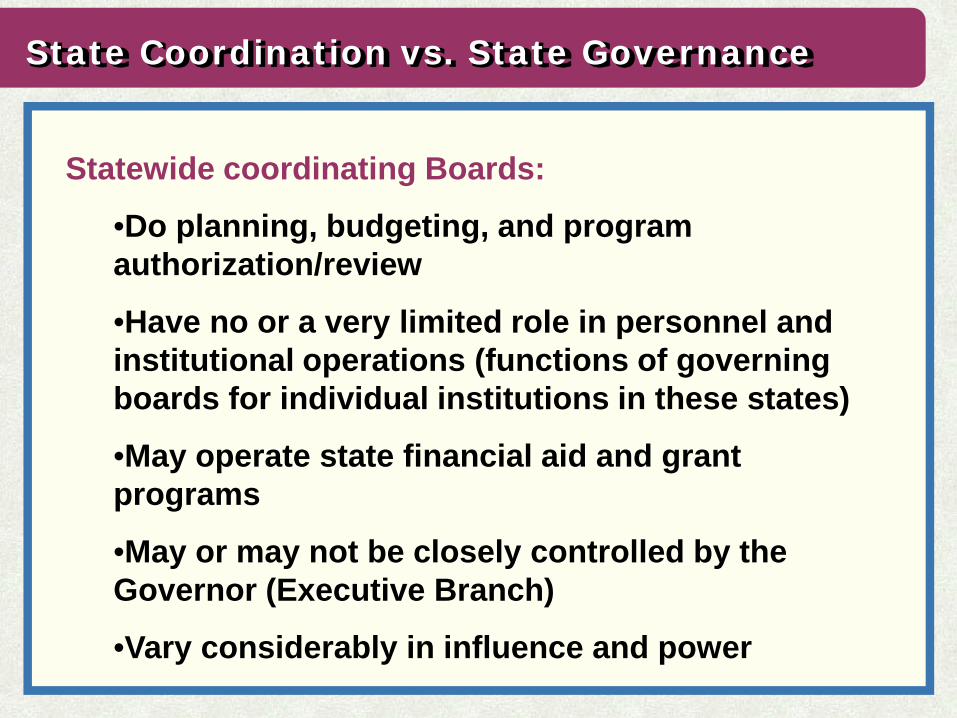
State Coordination vs. State Governance
Statewide coordinating Boards:
•Do planning, budgeting, and program authorization/review
•Have no or a very limited role in personnel and institutional operations (functions of governing boards for individual institutions in these states)
•May operate state financial aid and grant programs
•May or may not be closely controlled by the Governor (Executive Branch)
•Vary considerably in influence and power
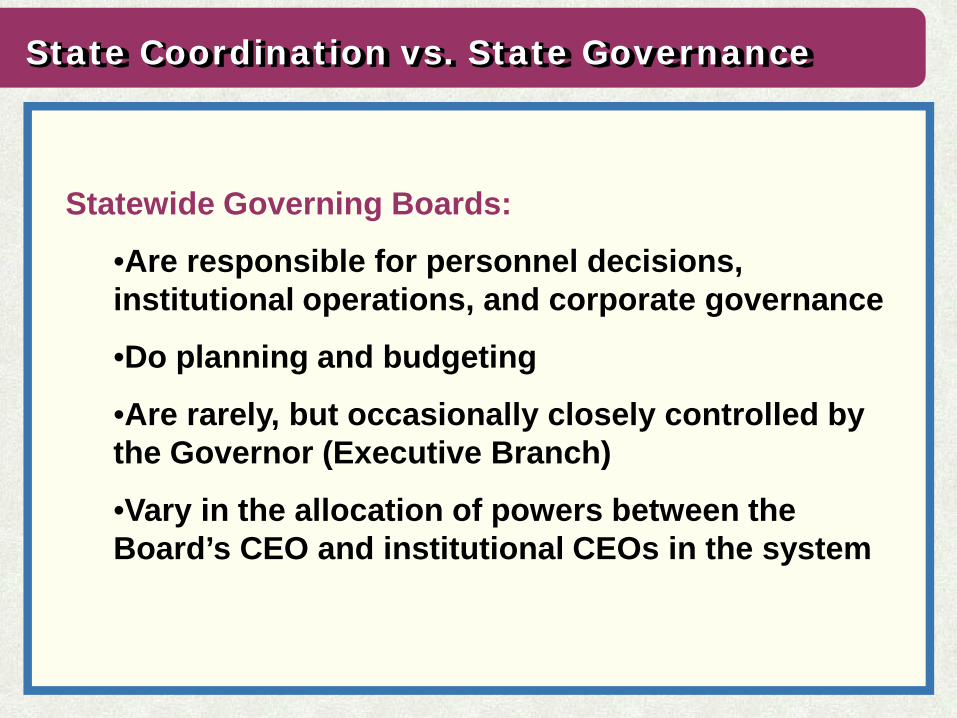
State Coordination vs. State Governance
Statewide Governing Boards:
•Are responsible for personnel decisions, institutional operations, and corporate governance
•Do planning and budgeting
•Are rarely, but occasionally closely controlled by the Governor (Executive Branch)
•Vary in the allocation of powers between the Board’s CEO and institutional CEOs in the system
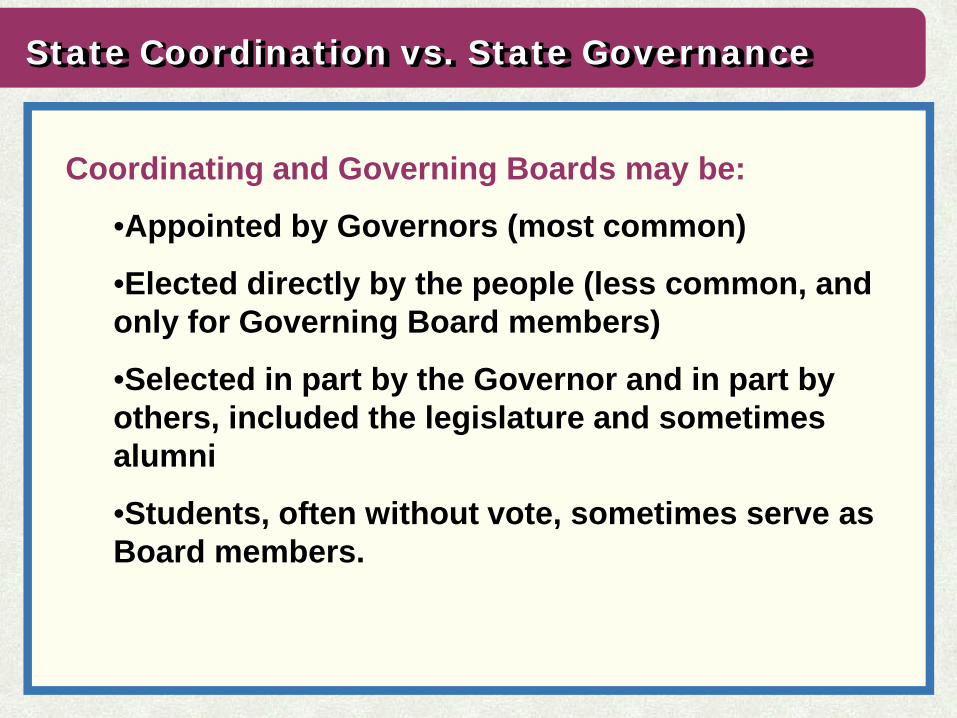
State Coordination vs. State Governance
Coordinating and Governing Boards may be:
•Appointed by Governors (most common)
•Elected directly by the people (less common, and only for Governing Board members)
•Selected in part by the Governor and in part by others, included the legislature and sometimes alumni
•Students, often without vote, sometimes serve as Board members.
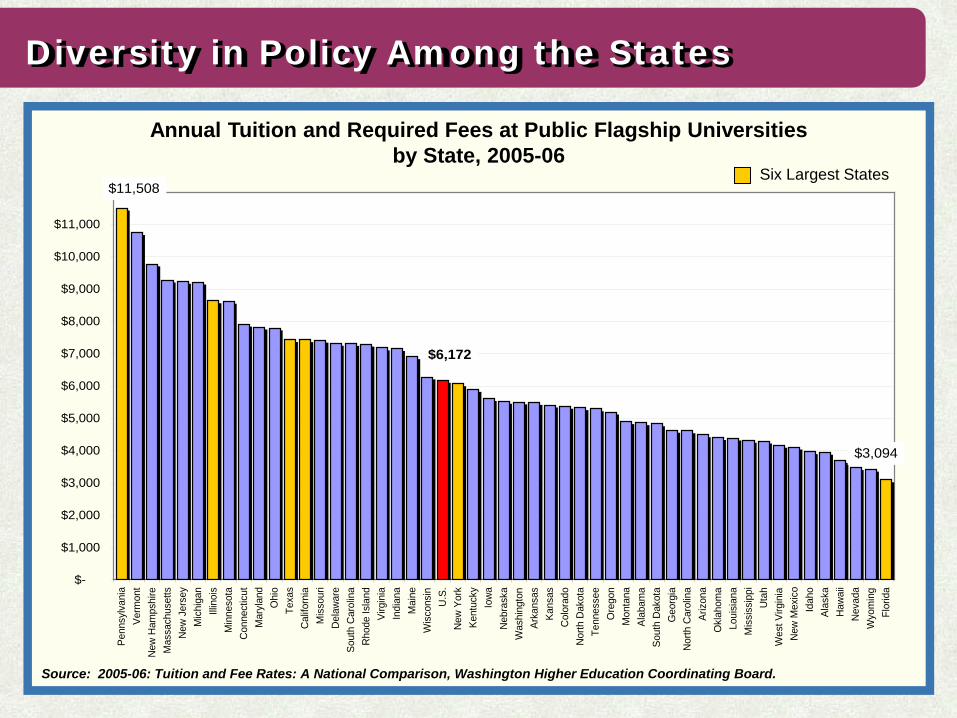
Diversity in Policy Among the States
Annual Tuition and Required Fees at Public Flagship Universities by State, 2005-06
Source: 2005-06: Tuition and Fee Rates: A National Comparison, Washington Higher Education Coordinating Board.
$6,172
$3,094
$11,508
$-
$1,000
$2,000
$3,000
$4,000
$5,000
$6,000
$7,000
$8,000
$9,000
$10,000
$11,000
$12,000
Penn
sylv
ania
Verm
ont
New
Ham
pshi
reM
assa
chus
etts
New
Jer
sey
Mic
higa
nIll
inoi
sM
inne
sota
Con
nect
icut
Mar
ylan
dO
hio
Texa
sC
alifo
rnia
Mis
sour
iD
elaw
are
Sout
h C
arol
ina
Rho
de Is
land
Virg
inia
Indi
ana
Mai
neW
isco
nsin
U.S
.N
ew Y
ork
Kent
ucky
Iow
aN
ebra
ska
Was
hing
ton
Arka
nsas
Kans
asC
olor
ado
Nor
th D
akot
aTe
nnes
see
Ore
gon
Mon
tana
Alab
ama
Sout
h D
akot
aG
eorg
iaN
orth
Car
olin
aAr
izon
aO
klah
oma
Loui
sian
aM
issi
ssip
piU
tah
Wes
t Virg
inia
New
Mex
ico
Idah
oAl
aska
Haw
aii
Nev
ada
Wyo
min
gFl
orid
a
Six Largest States
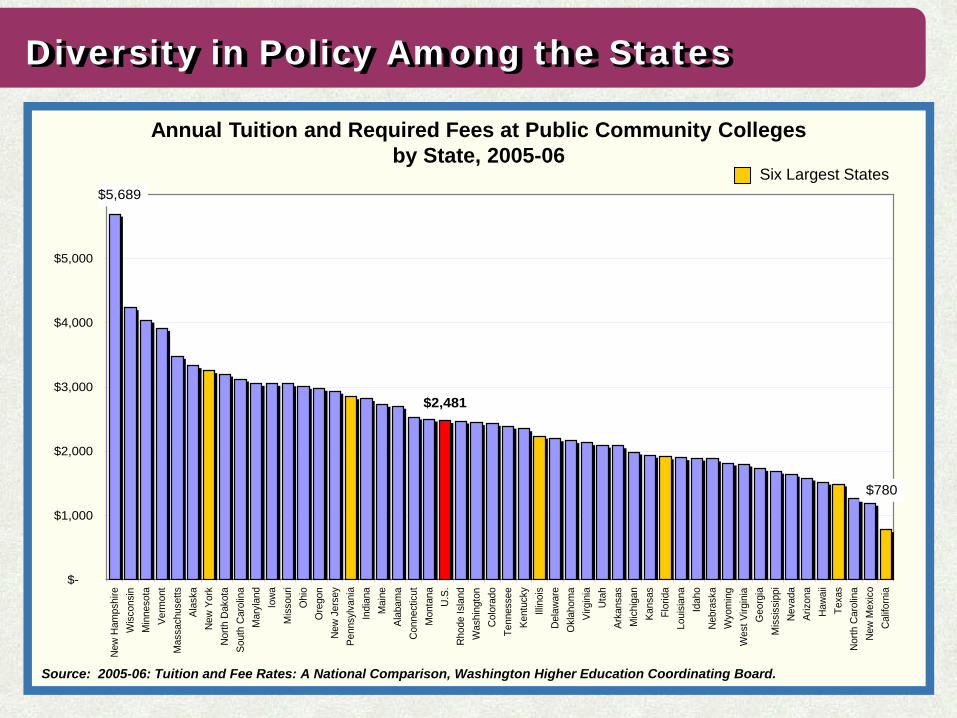
Diversity in Policy Among the States
Annual Tuition and Required Fees at Public Community Colleges by State, 2005-06
Source: 2005-06: Tuition and Fee Rates: A National Comparison, Washington Higher Education Coordinating Board.
$780
$2,481
$5,689
$-
$1,000
$2,000
$3,000
$4,000
$5,000
$6,000
New
Ham
pshi
reW
isco
nsin
Min
neso
taVe
rmon
tM
assa
chus
etts
Alas
kaN
ew Y
ork
Nor
th D
akot
aSo
uth
Car
olin
aM
aryl
and
Iow
aM
isso
uri
Ohi
oO
rego
nN
ew J
erse
yPe
nnsy
lvan
iaIn
dian
aM
aine
Alab
ama
Con
nect
icut
Mon
tana
U.S
.R
hode
Isla
ndW
ashi
ngto
nC
olor
ado
Tenn
esse
eKe
ntuc
kyIll
inoi
sD
elaw
are
Okl
ahom
aVi
rgin
iaU
tah
Arka
nsas
Mic
higa
nKa
nsas
Flor
ida
Loui
sian
aId
aho
Neb
rask
aW
yom
ing
Wes
t Virg
inia
Geo
rgia
Mis
siss
ippi
Nev
ada
Ariz
ona
Haw
aii
Texa
sN
orth
Car
olin
aN
ew M
exic
oC
alifo
rnia
Six Largest States
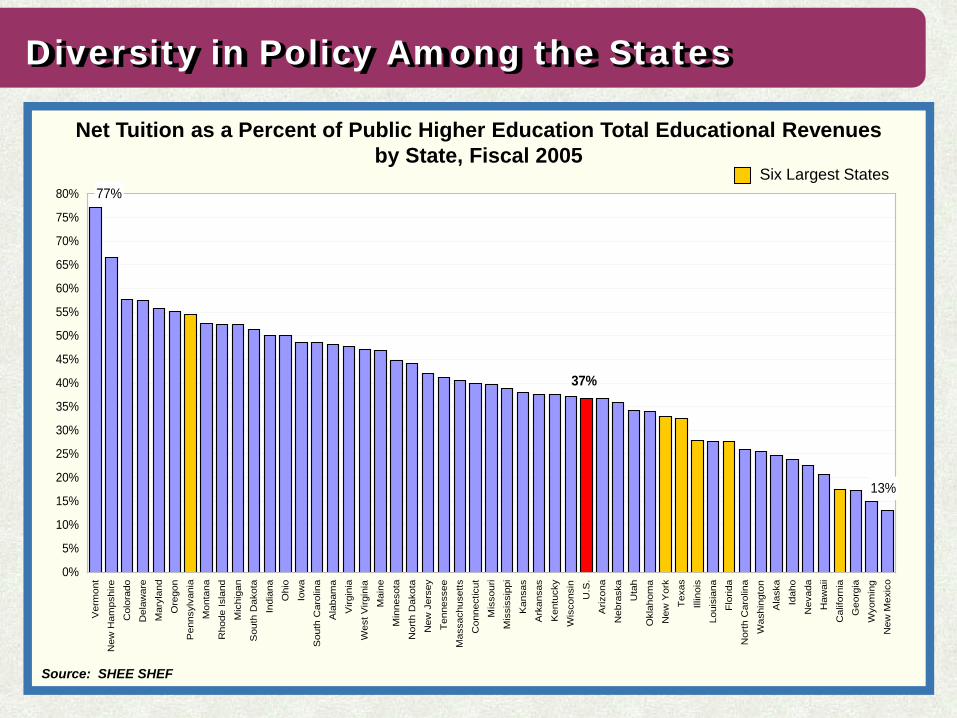
Diversity in Policy Among the States
Net Tuition as a Percent of Public Higher Education Total Educational Revenues by State, Fiscal 2005
Source: SHEE SHEF
37%
77%
13%
0%
5%
10%
15%
20%
25%
30%
35%
40%
45%
50%
55%
60%
65%
70%
75%
80%
Ver
mon
t
New
Ham
pshi
re
Col
orad
o
Del
awar
e
Mar
ylan
d
Ore
gon
Pen
nsyl
vani
a
Mon
tana
Rho
de Is
land
Mic
higa
n
Sou
th D
akot
a
Indi
ana
Ohi
o
Iow
a
Sou
th C
arol
ina
Ala
bam
a
Virg
inia
Wes
t Virg
inia
Mai
ne
Min
neso
ta
Nor
th D
akot
a
New
Jer
sey
Ten
ness
ee
Mas
sach
uset
ts
Con
nect
icut
Mis
sour
i
Mis
siss
ippi
Kan
sas
Ark
ansa
s
Ken
tuck
y
Wis
cons
in
U.S
.
Ariz
ona
Neb
rask
a
Uta
h
Okl
ahom
a
New
Yor
k
Tex
as
Illin
ois
Loui
sian
a
Flo
rida
Nor
th C
arol
ina
Was
hing
ton
Ala
ska
Idah
o
Nev
ada
Haw
aii
Cal
iforn
ia
Geo
rgia
Wyo
min
g
New
Mex
ico
Six Largest States
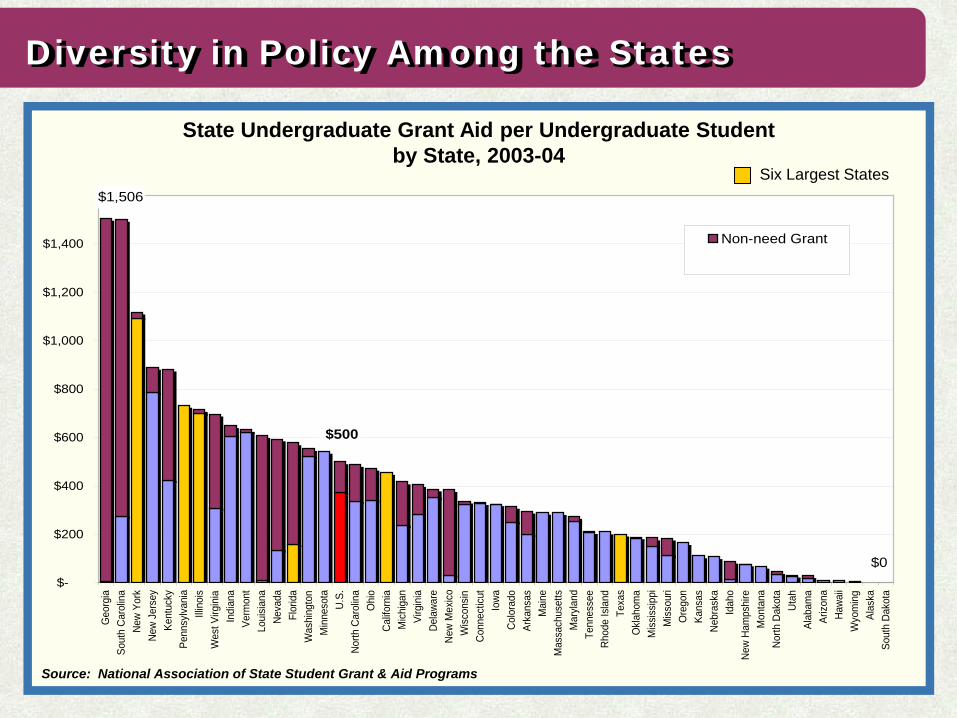
Diversity in Policy Among the States
State Undergraduate Grant Aid per Undergraduate Student by State, 2003-04
Source: National Association of State Student Grant & Aid Programs
$0
$500
$1,506
$-
$200
$400
$600
$800
$1,000
$1,200
$1,400
$1,600
Geo
rgia
Sout
h Ca
rolin
aNe
w Yo
rkNe
w Je
rsey
Kent
ucky
Penn
sylv
ania
Illin
ois
Wes
t Virg
inia
Indi
ana
Verm
ont
Loui
sian
aNe
vada
Flor
ida
Was
hing
ton
Min
neso
taU.
S.No
rth C
arol
ina
Ohi
oCa
lifor
nia
Mic
higa
nVi
rgin
iaDe
lawa
reNe
w M
exic
oW
isco
nsin
Conn
ectic
utIo
waCo
lora
doAr
kans
asM
aine
Mas
sach
uset
tsM
aryl
and
Tenn
esse
eRh
ode
Isla
ndTe
xas
Okl
ahom
aM
issi
ssip
piM
isso
uri
Ore
gon
Kans
asNe
bras
kaId
aho
New
Ham
pshi
reM
onta
naNo
rth D
akot
aUt
ahAl
abam
aAr
izon
aHa
waii
Wyo
min
gAl
aska
Sout
h Da
kota
Non-need Grant
Need Grant
Six Largest States
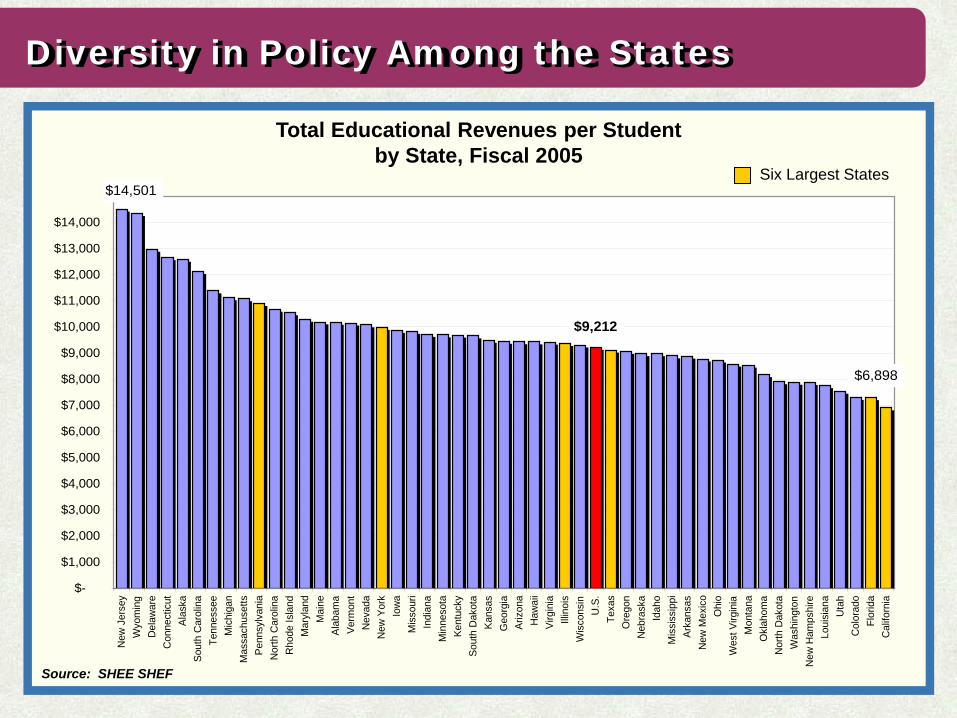
Diversity in Policy Among the States
Total Educational Revenues per Student by State, Fiscal 2005
Source: SHEE SHEF
$9,212
$6,898
$14,501
$-
$1,000
$2,000
$3,000
$4,000
$5,000
$6,000
$7,000
$8,000
$9,000
$10,000
$11,000
$12,000
$13,000
$14,000
$15,000
New
Jer
sey
Wyo
min
gD
elaw
are
Con
nect
icut
Alas
kaSo
uth
Car
olin
aTe
nnes
see
Mic
higa
nM
assa
chus
etts
Penn
sylv
ania
Nor
th C
arol
ina
Rho
de Is
land
Mar
ylan
dM
aine
Alab
ama
Verm
ont
Nev
ada
New
Yor
kIo
wa
Mis
sour
iIn
dian
aM
inne
sota
Kent
ucky
Sout
h D
akot
aKa
nsas
Geo
rgia
Ariz
ona
Haw
aii
Virg
inia
Illin
ois
Wis
cons
inU
.S.
Texa
sO
rego
nN
ebra
ska
Idah
oM
issi
ssip
piAr
kans
asN
ew M
exic
oO
hio
Wes
t Virg
inia
Mon
tana
Okl
ahom
aN
orth
Dak
ota
Was
hing
ton
New
Ham
pshi
reLo
uisi
ana
Uta
hC
olor
ado
Flor
ida
Cal
iforn
ia
Six Largest States
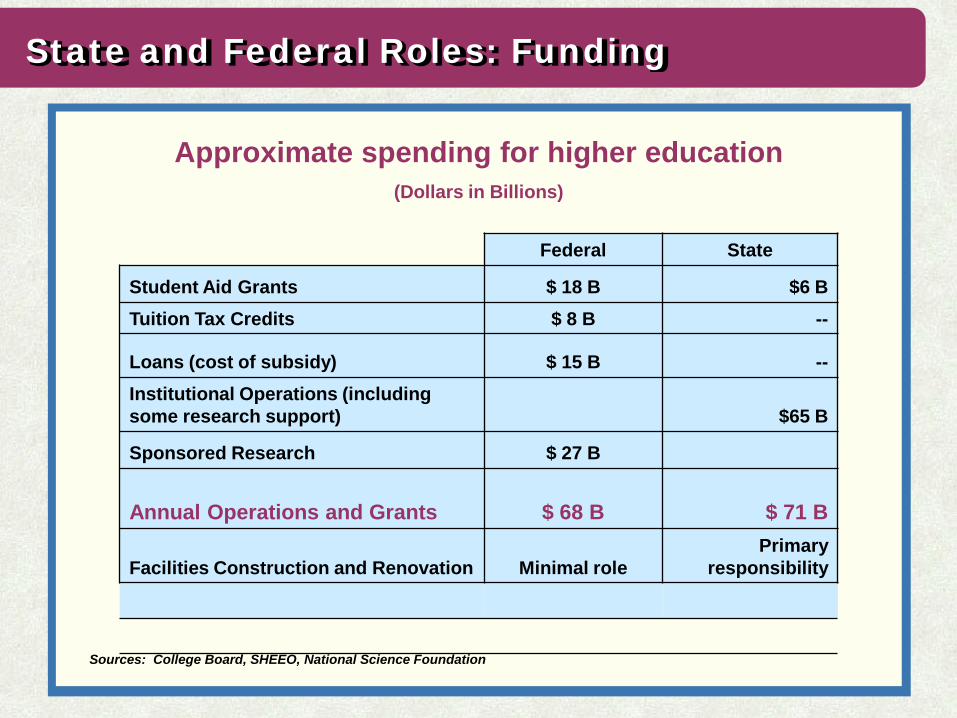
State and Federal Roles: Funding
Approximate spending for higher education (Dollars in Billions)
Sources: College Board, SHEEO, National Science Foundation
Federal State
Student Aid Grants $ 18 B $6 B Tuition Tax Credits $ 8 B --
Loans (cost of subsidy) $ 15 B -- Institutional Operations (including some research support) $65 B
Sponsored Research $ 27 B
Annual Operations and Grants $ 68 B $ 71 B
Facilities Construction and Renovation Minimal role Primary
responsibility
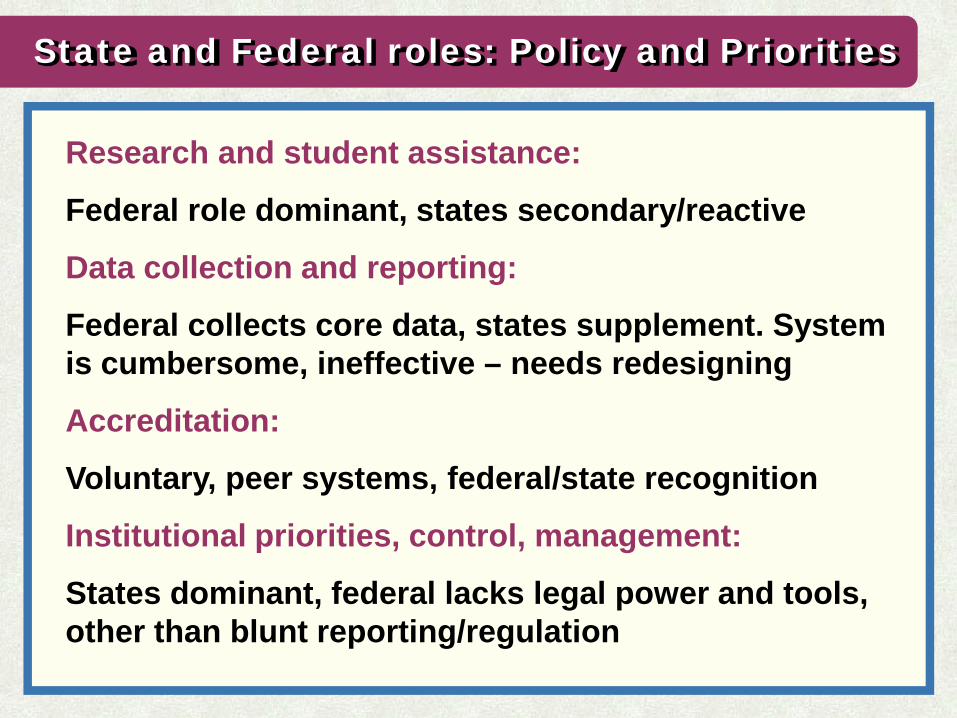
State and Federal roles: Policy and Priorities
Research and student assistance:
Federal role dominant, states secondary/reactive
Data collection and reporting:
Federal collects core data, states supplement. System is cumbersome, ineffective – needs redesigning
Accreditation:
Voluntary, peer systems, federal/state recognition
Institutional priorities, control, management:
States dominant, federal lacks legal power and tools, other than blunt reporting/regulation
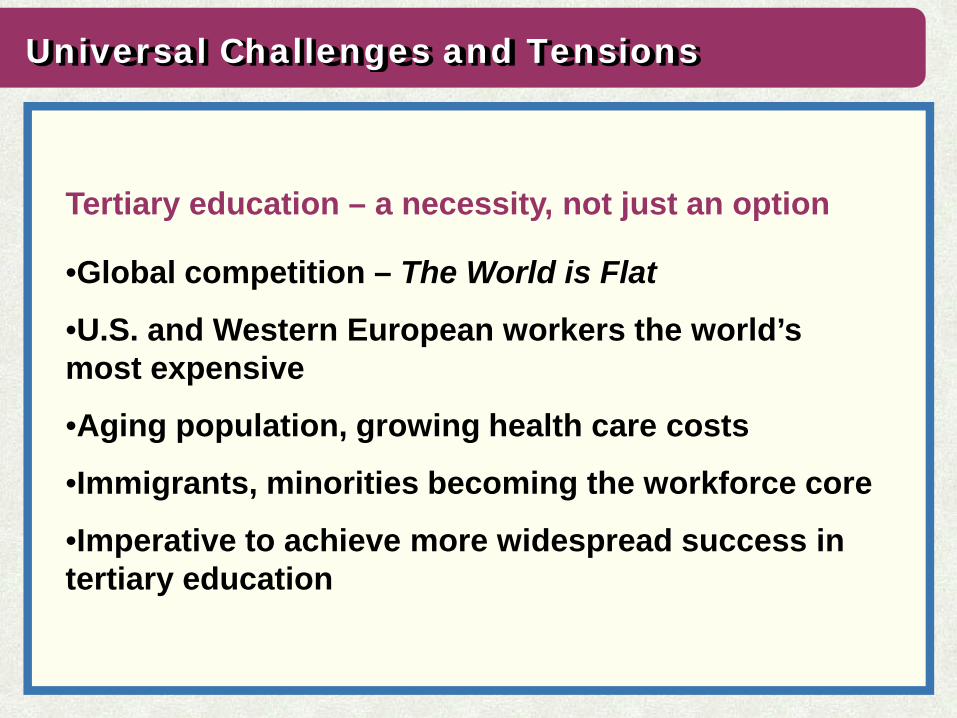
Universal Challenges and Tensions
Tertiary education – a necessity, not just an option
•Global competition – The World is Flat
•U.S. and Western European workers the world’s most expensive
•Aging population, growing health care costs
•Immigrants, minorities becoming the workforce core
•Imperative to achieve more widespread success in tertiary education
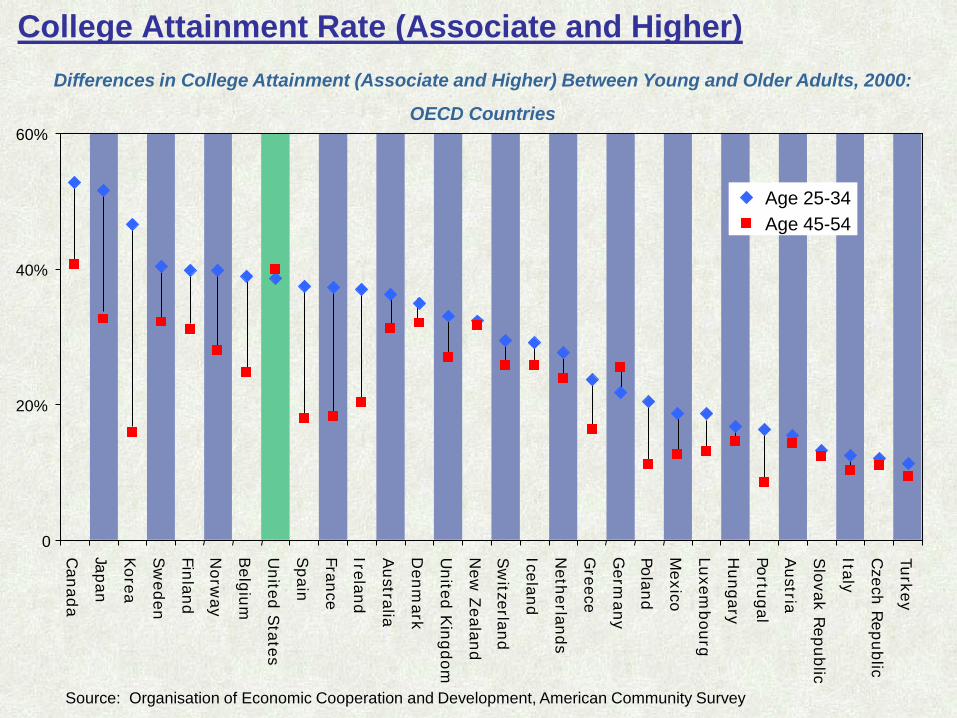
College Attainment Rate (Associate and Higher)
Source: Organisation of Economic Cooperation and Development, American Community Survey
Differences in College Attainment (Associate and Higher) Between Young and Older Adults, 2000:
OECD Countries
0
20%
40%
60%
Can
ada
Japan
Korea
Sw
eden
Finlan
d
Norw
ay
Belg
ium
United
States
Spain
France
Ireland
Australia
Den
mark
United
Kin
gdom
New
Zealan
d
Sw
itzerland
Iceland
Neth
erlands
Greece
Germ
any
Polan
d
Mexico
Luxem
bourg
Hungary
Portu
gal
Austria
Slovak R
epublic
Italy
Czech
Rep
ublic
Turkey
Age 25-34 Age 45-54
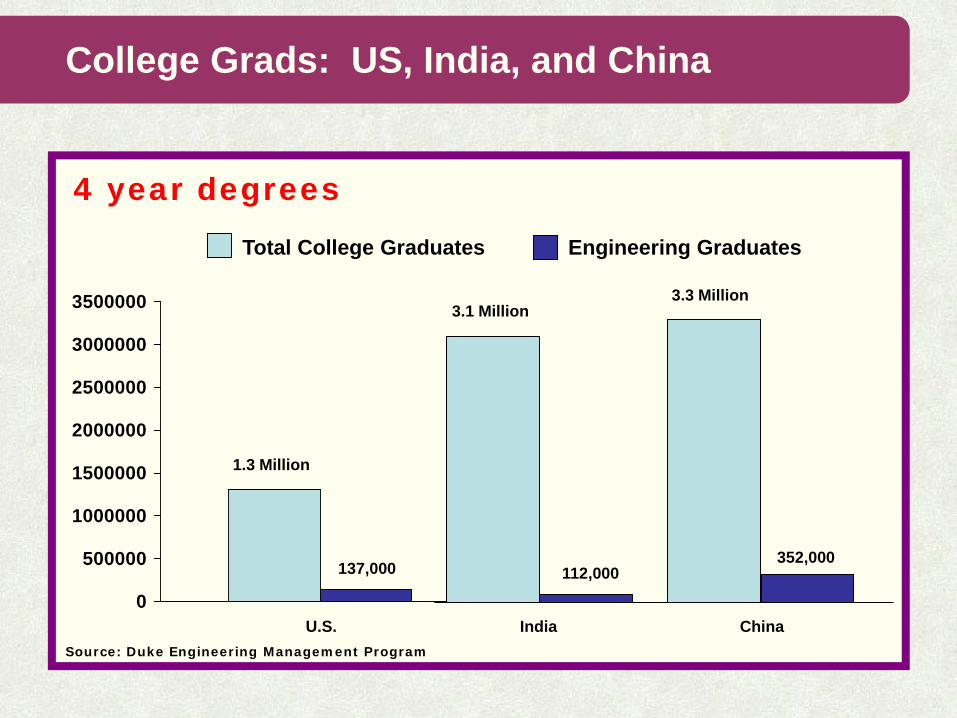
Total College Graduates Engineering Graduates
0
500000
1000000
1500000
2000000
2500000
3000000
3500000
U.S.
1.3 Million
137,000
India
3.1 Million
112,000
China
3.3 Million
352,000
4 year degrees
Source: Duke Engineering Management Program
College Grads: US, India, and China
Universal Challenges and Tensions
Institutional Autonomy vs. Public Purpose
•Fundamental freedom of thought and expression:
•Emphasized for academics and institutions
•Significant but limited institutional autonomy:
•Obligated to serve public purposes
•May be restricted in mission or programs supported with public funds
Universal Challenges and Tensions
Pressure to achieve productivity gains
•Prices growing much faster than inflation and income
•Due to subsidy reductions and
•Expenditure growth (to a smaller extent)
•Demand for widespread educational attainment
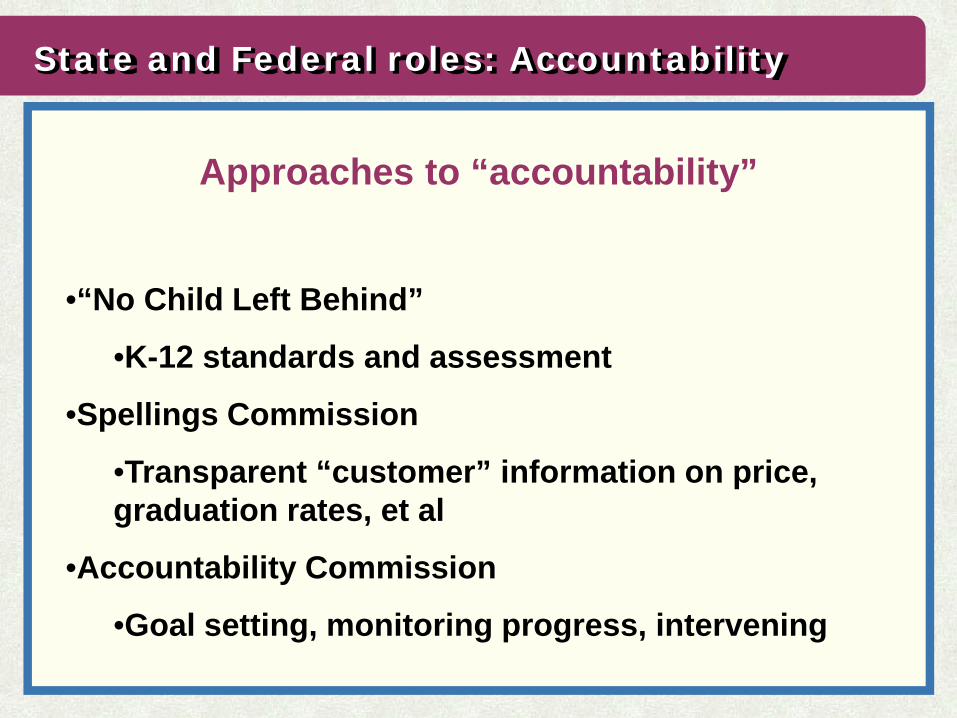
State and Federal roles: Accountability
Approaches to “accountability”
•“No Child Left Behind”
•K-12 standards and assessment
•Spellings Commission
•Transparent “customer” information on price, graduation rates, et al
•Accountability Commission
•Goal setting, monitoring progress, intervening
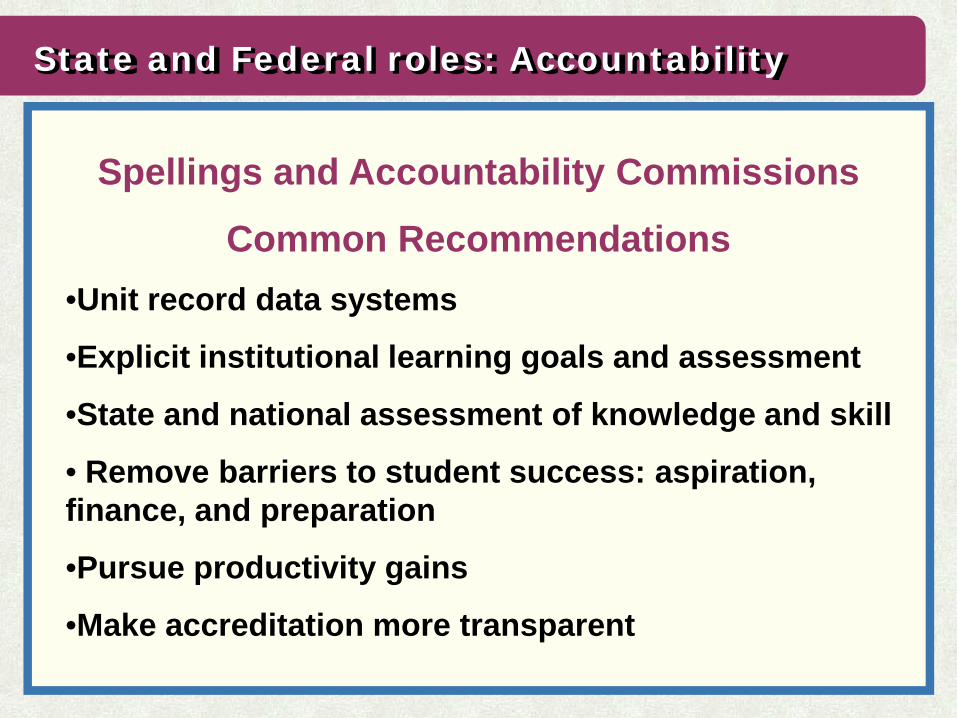
State and Federal roles: Accountability
Spellings and Accountability Commissions
Common Recommendations •Unit record data systems
•Explicit institutional learning goals and assessment
•State and national assessment of knowledge and skill
• Remove barriers to student success: aspiration, finance, and preparation
•Pursue productivity gains
•Make accreditation more transparent