high yield fixed income - fresno · james rich senior distressed research analyst 4 9 ......
TRANSCRIPT
HIGH YIELD FIXED INCOMEHIGH YIELD FIXED INCOME
Bradley J. Beman, CFA, CPAChief Investment Officer/Director of High YieldChief Investment Officer/Director of High Yield
Jim SchaefferHead of U.S. Leveraged Finance
P t BPeter BrennanHead of Distribution
March 8, 2012,
Presentation to: City of Fresno Retirement Systems
Local knowledge. Global power.Copyright © 2012 AEGON USA Investment Management, LLC www.aegoninvestments.com
CONTENTS
I. Overview p. 3 I. Overview p. 3
II. Investment Philosophy p. 7
III. Investment Process p. 8
IV High Yield Fixed Income Strategy p 10IV. High Yield Fixed Income Strategy p. 10
V. Performance p. 17
2Copyright © 2012 AEGON USA Investment Management, LLC www.aegoninvestments.com Local knowledge. Global power.
LOCAL KNOWLEDGE. GLOBAL POWER.THE AEGON ORGANIZATIONThroughout AEGON, we combine local knowledge and expertise with the
f di l b l resources of an expanding global company
AEGON is an international life insurance, pension and asset management company with businesses in over 20 markets in the Americas, Europe and Asia
AEGON Asset Management’s total assets under management was approximately $290.6 billion f 9/30/2011as of 9/30/2011
Approximately 27,000 employees worldwide
Three key global investment centers: AEGON USA, AEGON NL and AEGON UK
Oth i t t ti i th U it d St t E A i C d d L ti A i Other investment operations in the United States, Europe, Asia , Canada and Latin America
AEGON USA Investment Management, LLC (“AUIM”)
Experience managing a broad range of fixed income assets
SEC-registered investment adviser SEC registered investment adviser
Employs approximately 470 professionals
Total assets under management of AUIM approximately $112.8 billion as of 12/31/11
Collaboration with global counterparts on investment strategy
3Copyright © 2012 AEGON USA Investment Management, LLC www.aegoninvestments.com Local knowledge. Global power.
Claims compliance with the Global Investment Performance Standards (GIPS®)
Key investment centers in Cedar Rapids, Iowa; Chicago, Illinois and Baltimore, Maryland
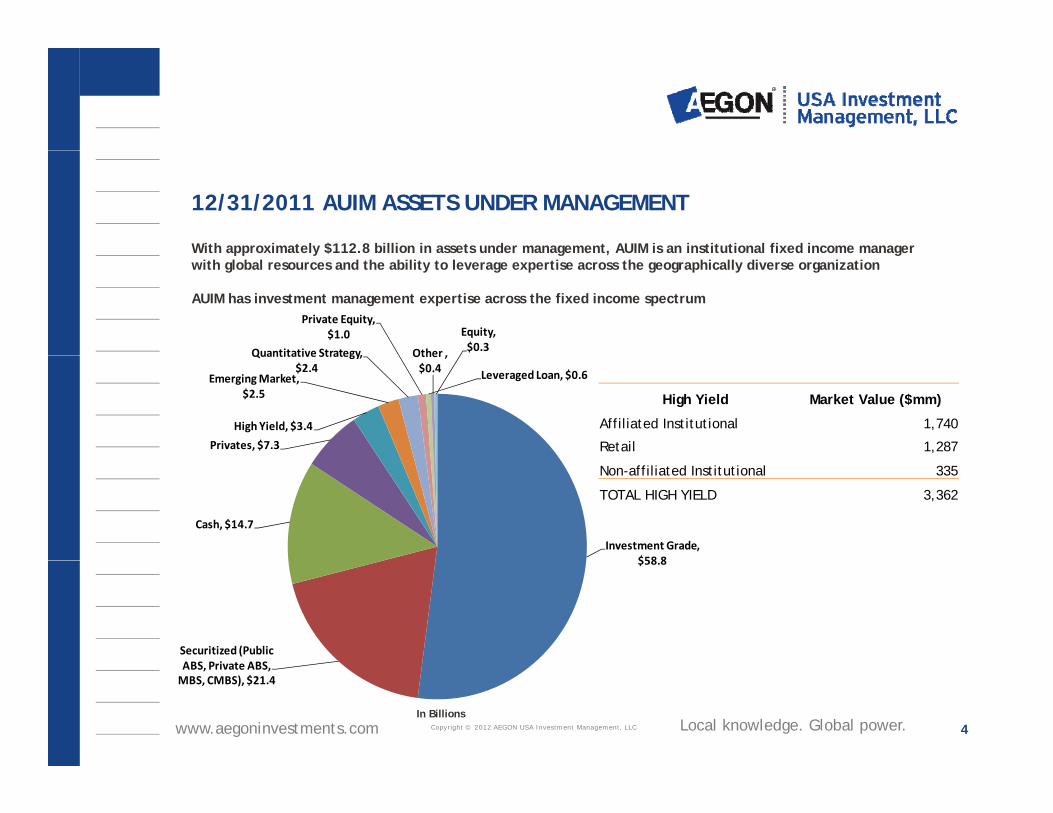
12/31/2011 AUIM ASSETS UNDER MANAGEMENT
With approximately $112.8 billion in assets under management, AUIM is an institutional fixed income manager With approximately $112.8 billion in assets under management, AUIM is an institutional fixed income manager with global resources and the ability to leverage expertise across the geographically diverse organization
AUIM has investment management expertise across the fixed income spectrum
Quantitative Strategy,
Private Equity, $1.0
Other ,
Equity, $0.3
Privates, $7.3High Yield, $3.4
Emerging Market, $2.5
Quantitative Strategy, $2.4 Leveraged Loan, $0.6
Other , $0.4
High Yield Market Value ($mm)
Affiliated Institutional 1,740
Retail 1,287
Investment Grade, $58 8
Cash, $14.7
Non-affiliated Institutional 335
TOTAL HIGH YIELD 3,362
$58.8
Securitized (Public ABS P i t ABS
4Copyright © 2012 AEGON USA Investment Management, LLC www.aegoninvestments.com Local knowledge. Global power.
ABS, Private ABS, MBS, CMBS), $21.4
In Billions
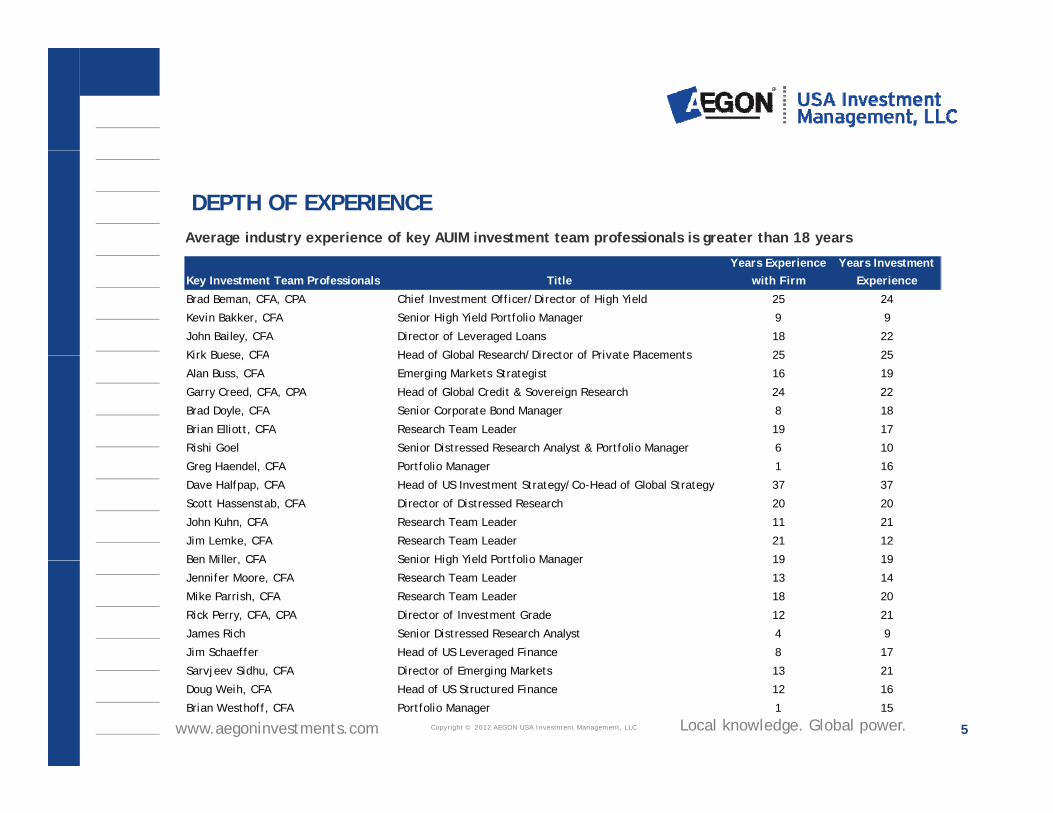
DEPTH OF EXPERIENCEAverage industry experience of key AUIM investment team professionals is greater than 18 years
Key Investment Team Professionals TitleYears Experience
with FirmYears Investment
Experience
Brad Beman, CFA, CPA Chief Investment Officer/Director of High Yield 25 24
Kevin Bakker, CFA Senior High Yield Portfolio Manager 9 9
John Bailey, CFA Director of Leveraged Loans 18 22
Kirk Buese CFA Head of Global Research/Director of Private Placements 25 25Kirk Buese, CFA Head of Global Research/Director of Private Placements 25 25
Alan Buss, CFA Emerging Markets Strategist 16 19
Garry Creed, CFA, CPA Head of Global Credit & Sovereign Research 24 22
Brad Doyle, CFA Senior Corporate Bond Manager 8 18
Brian Elliott, CFA Research Team Leader 19 17
Rishi Goel Senior Distressed Research Analyst & Portfolio Manager 6 10
Greg Haendel, CFA Portfolio Manager 1 16
Dave Halfpap, CFA Head of US Investment Strategy/Co-Head of Global Strategy 37 37
Scott Hassenstab, CFA Director of Distressed Research 20 20
John Kuhn, CFA Research Team Leader 11 21
Jim Lemke, CFA Research Team Leader 21 12
Ben Miller CFA Senior High Yield Portfolio Manager 19 19Ben Miller, CFA Senior High Yield Portfolio Manager 19 19
Jennifer Moore, CFA Research Team Leader 13 14
Mike Parrish, CFA Research Team Leader 18 20
Rick Perry, CFA, CPA Director of Investment Grade 12 21
James Rich Senior Distressed Research Analyst 4 9
Jim Schaeffer Head of US Leveraged Finance 8 17
5Copyright © 2012 AEGON USA Investment Management, LLC www.aegoninvestments.com Local knowledge. Global power.
Sarvjeev Sidhu, CFA Director of Emerging Markets 13 21
Doug Weih, CFA Head of US Structured Finance 12 16
Brian Westhoff, CFA Portfolio Manager 1 15
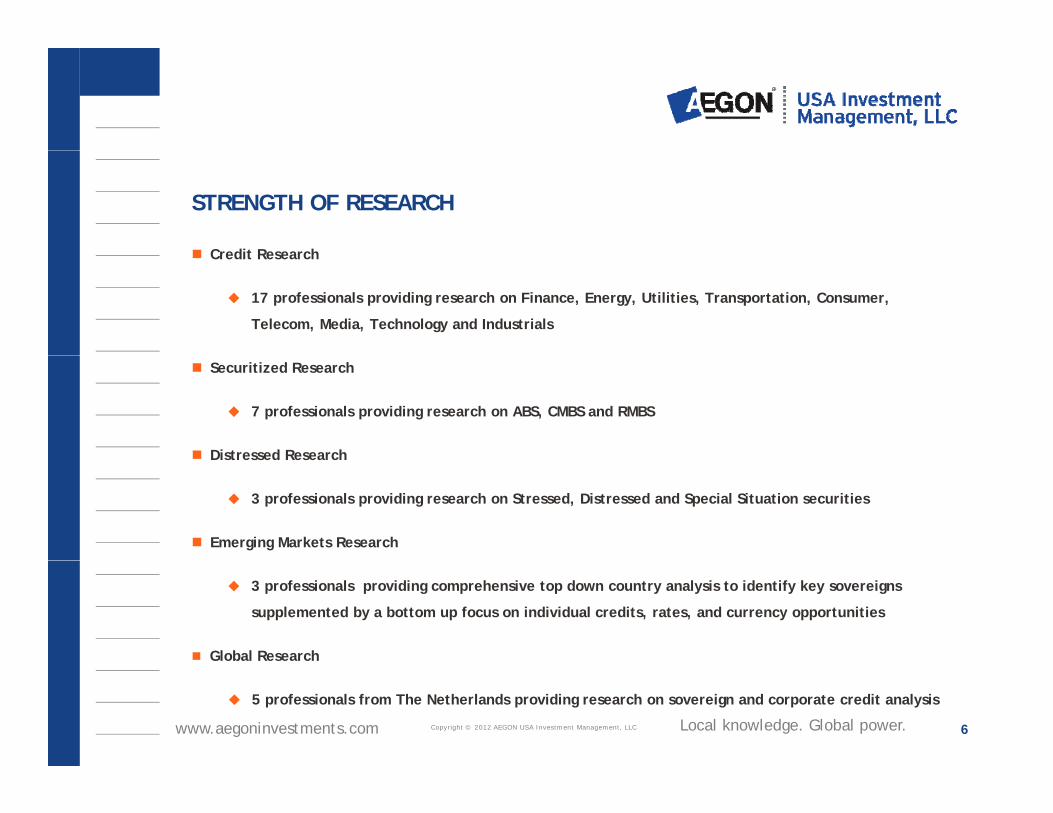
STRENGTH OF RESEARCH
Credit Research Credit Research
17 professionals providing research on Finance, Energy, Utilities, Transportation, Consumer,
Telecom, Media, Technology and Industrials
Securitized Research
7 professionals providing research on ABS, CMBS and RMBS
Distressed Research Distressed Research
3 professionals providing research on Stressed, Distressed and Special Situation securities
Emerging Markets Research
3 professionals providing comprehensive top down country analysis to identify key sovereigns
supplemented by a bottom up focus on individual credits, rates, and currency opportunities
Global Research
6Copyright © 2012 AEGON USA Investment Management, LLC www.aegoninvestments.com Local knowledge. Global power.
5 professionals from The Netherlands providing research on sovereign and corporate credit analysis
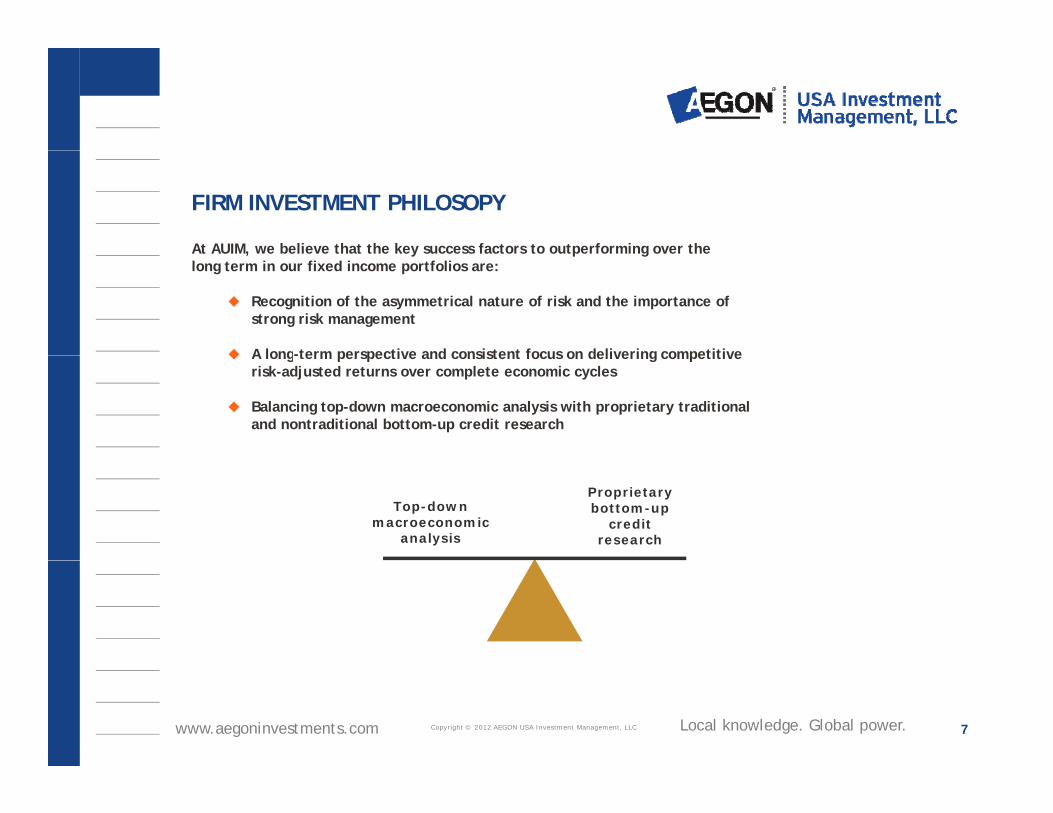
FIRM INVESTMENT PHILOSOPY
At AUIM, we believe that the key success factors to outperforming over the At AUIM, we believe that the key success factors to outperforming over the long term in our fixed income portfolios are:
Recognition of the asymmetrical nature of risk and the importance of strong risk management
A long-term perspective and consistent focus on delivering competitive A long-term perspective and consistent focus on delivering competitive risk-adjusted returns over complete economic cycles
Balancing top-down macroeconomic analysis with proprietary traditional and nontraditional bottom-up credit research
Top-downmacroeconomic
analysis
Proprietary bottom-up
creditresearch
7Copyright © 2012 AEGON USA Investment Management, LLC www.aegoninvestments.com Local knowledge. Global power.
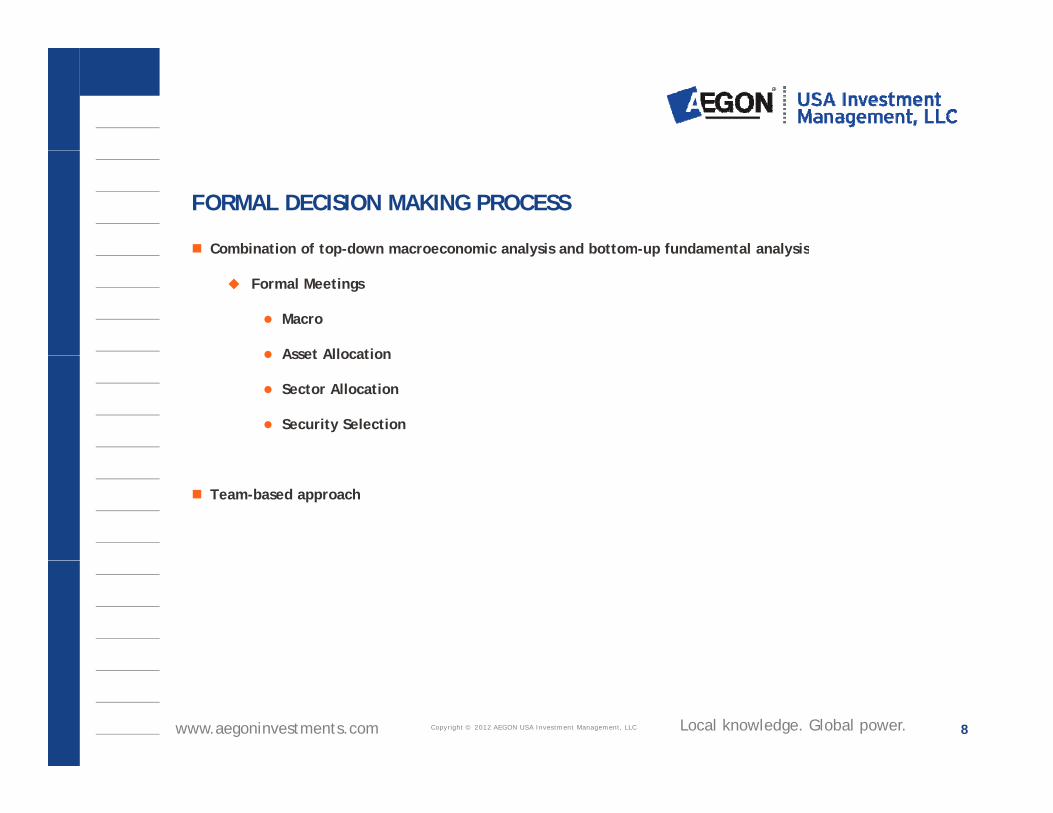
FORMAL DECISION MAKING PROCESS
Combination of top-down macroeconomic analysis and bottom-up fundamental analysisCombination of top down macroeconomic analysis and bottom up fundamental analysis
Formal Meetings
Macro
Asset Allocation Asset Allocation
Sector Allocation
Security Selection
Team-based approach
8Copyright © 2012 AEGON USA Investment Management, LLC www.aegoninvestments.com Local knowledge. Global power.
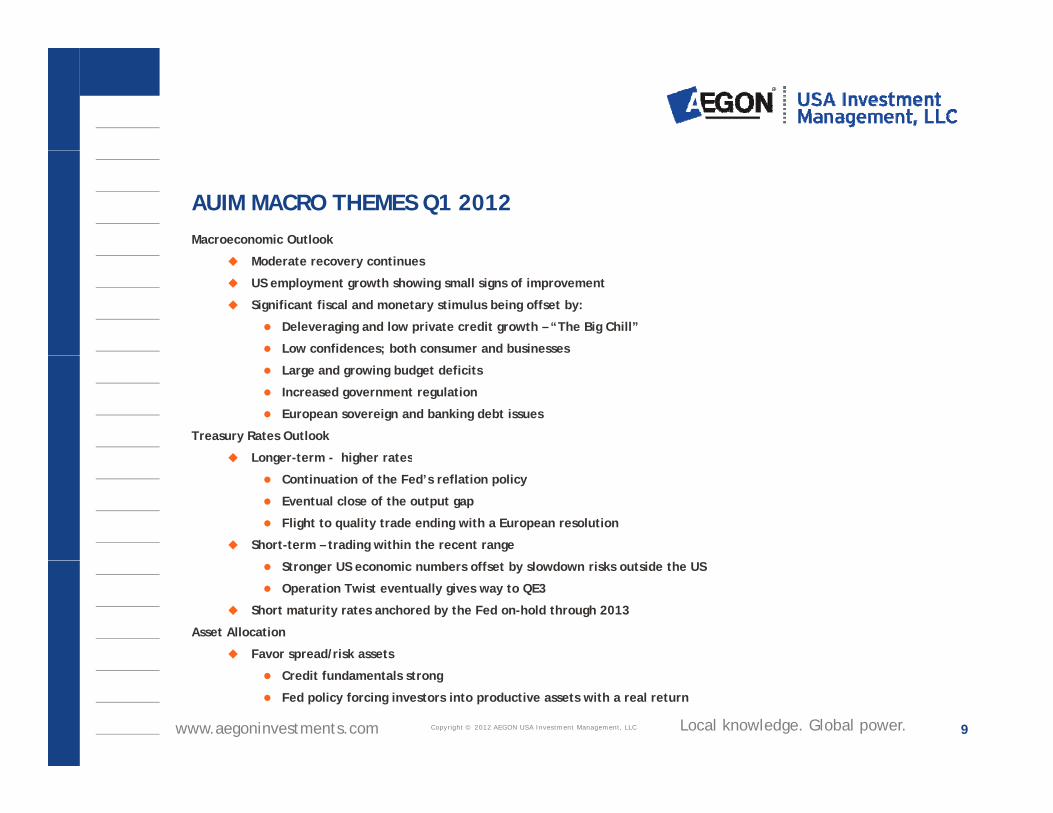
AUIM MACRO THEMES Q1 2012Macroeconomic Outlook
Moderate recovery continues
US employment growth showing small signs of improvement
Significant fiscal and monetary stimulus being offset by:
Deleveraging and low private credit growth – “The Big Chill”
Low confidences; both consumer and businesses
Large and growing budget deficits
Increased government regulation
European sovereign and banking debt issues
Treasury Rates Outlook
Longer-term - higher rates Longer-term - higher rates
Continuation of the Fed’s reflation policy
Eventual close of the output gap
Flight to quality trade ending with a European resolution
Short-term – trading within the recent range
Stronger US economic numbers offset by slowdown risks outside the US
Operation Twist eventually gives way to QE3
Short maturity rates anchored by the Fed on-hold through 2013
Asset Allocation
Favor spread/risk assets
9Copyright © 2012 AEGON USA Investment Management, LLC www.aegoninvestments.com Local knowledge. Global power.
Credit fundamentals strong
Fed policy forcing investors into productive assets with a real return
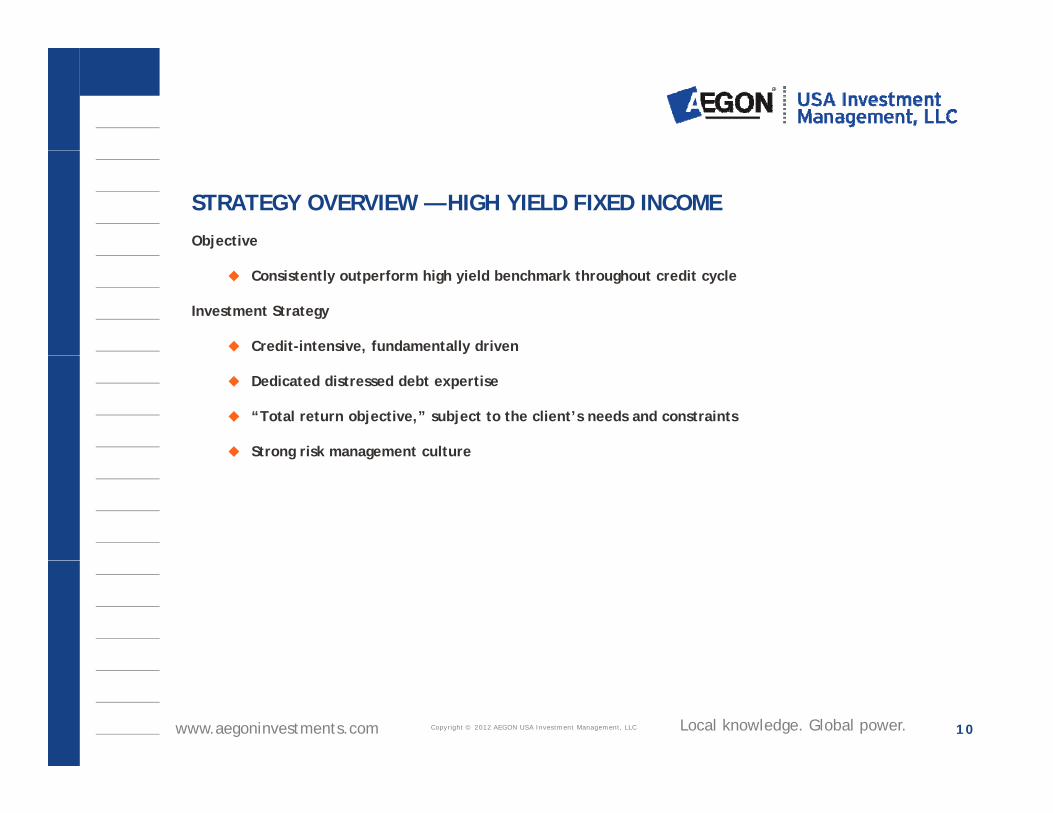
STRATEGY OVERVIEW — HIGH YIELD FIXED INCOME
Objective
Consistently outperform high yield benchmark throughout credit cycle
Investment Strategy
Credit-intensive, fundamentally driven
Dedicated distressed debt expertise
“Total return objective,” subject to the client’s needs and constraints
Strong risk management cultureg g
10Copyright © 2012 AEGON USA Investment Management, LLC www.aegoninvestments.com Local knowledge. Global power.
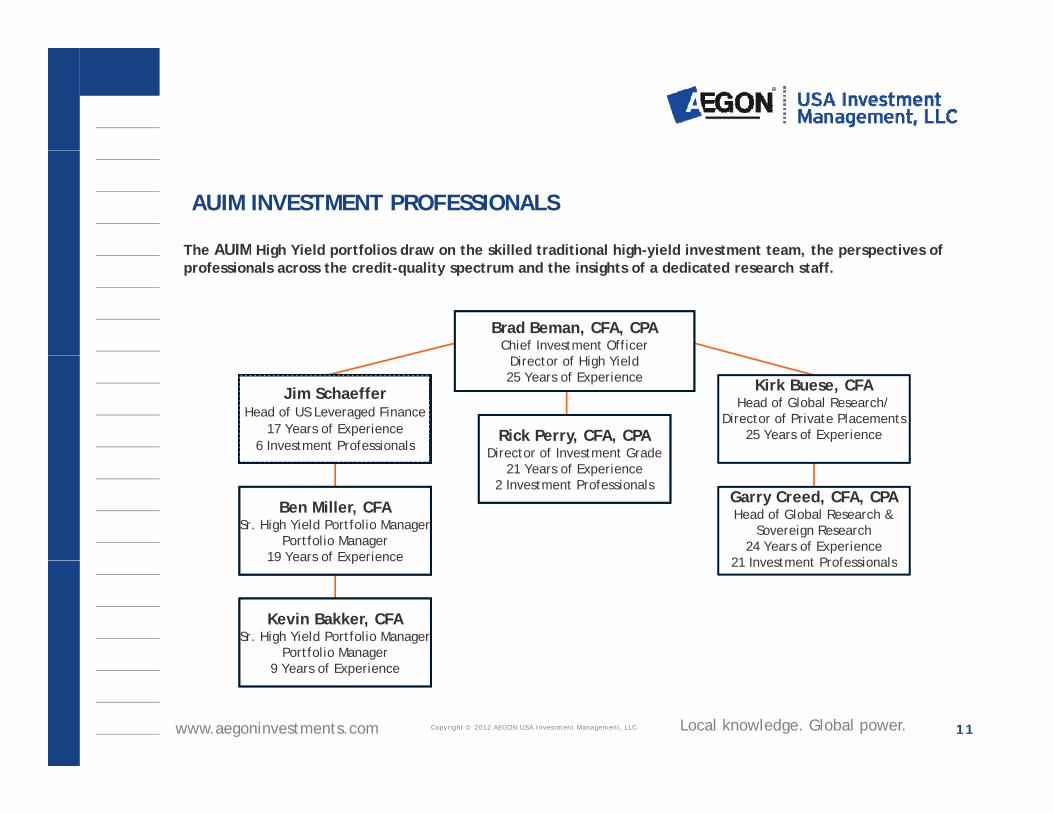
AUIM INVESTMENT PROFESSIONALS
The AUIM High Yield portfolios draw on the skilled traditional high-yield investment team, the perspectives of The AUIM High Yield portfolios draw on the skilled traditional high yield investment team, the perspectives of professionals across the credit-quality spectrum and the insights of a dedicated research staff.
Brad Beman, CFA, CPAChief Investment Officer
Director of High Yield25 Years of Experience
Rick Perry, CFA, CPADirector of Investment Grade
Jim SchaefferHead of US Leveraged Finance
17 Years of Experience6 Investment Professionals
Kirk Buese, CFAHead of Global Research/
Director of Private Placements25 Years of Experience
21 Years of Experience2 Investment Professionals
Ben Miller, CFA
Sr. High Yield Portfolio Manager Portfolio Manager
19 Years of Experience
Garry Creed, CFA, CPAHead of Global Research &
Sovereign Research24 Years of Experience
21 Investment Professionals19 Years of Experience
Kevin Bakker, CFA
Sr. High Yield Portfolio Manager Portfolio Manager
f
21 Investment Professionals
11Copyright © 2012 AEGON USA Investment Management, LLC www.aegoninvestments.com Local knowledge. Global power.
9 Years of Experience
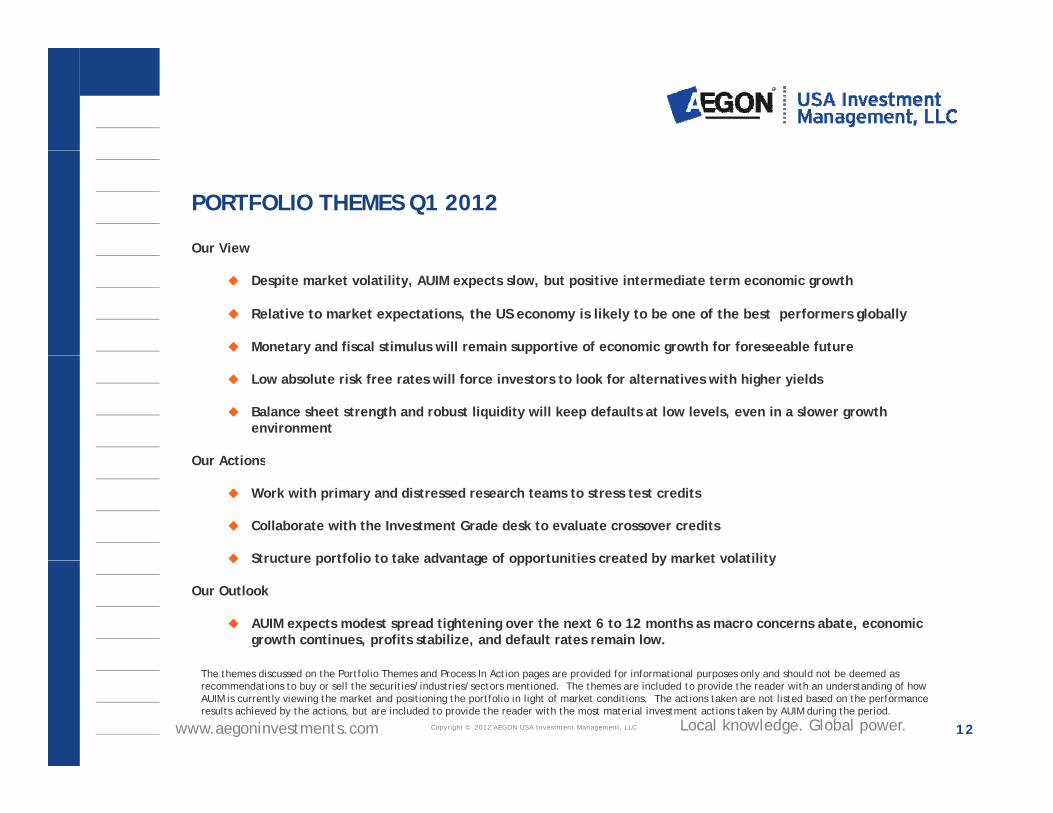
PORTFOLIO THEMES Q1 2012
Our View
Despite market volatility, AUIM expects slow, but positive intermediate term economic growth
Relative to market expectations, the US economy is likely to be one of the best performers globally
Monetary and fiscal stimulus will remain supportive of economic growth for foreseeable future
Low absolute risk free rates will force investors to look for alternatives with higher yields
Balance sheet strength and robust liquidity will keep defaults at low levels, even in a slower growth environment
O r ActionsOur Actions
Work with primary and distressed research teams to stress test credits
Collaborate with the Investment Grade desk to evaluate crossover credits
Structure portfolio to take advantage of opportunities created by market volatility Structure portfolio to take advantage of opportunities created by market volatility
Our Outlook
AUIM expects modest spread tightening over the next 6 to 12 months as macro concerns abate, economic growth continues, profits stabilize, and default rates remain low.
12Copyright © 2012 AEGON USA Investment Management, LLC www.aegoninvestments.com Local knowledge. Global power.
The themes discussed on the Portfolio Themes and Process In Action pages are provided for informational purposes only and should not be deemed as recommendations to buy or sell the securities/industries/sectors mentioned. The themes are included to provide the reader with an understanding of how AUIM is currently viewing the market and positioning the portfolio in light of market conditions. The actions taken are not listed based on the performance results achieved by the actions, but are included to provide the reader with the most material investment actions taken by AUIM during the period.
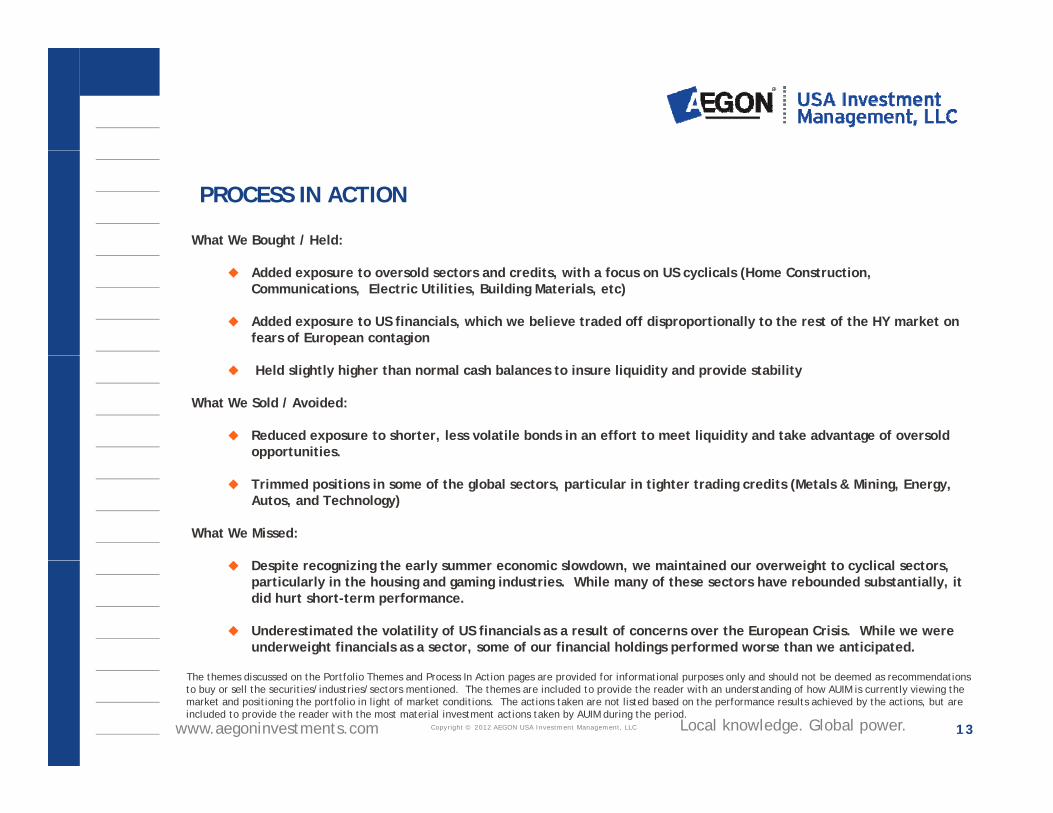
PROCESS IN ACTION
What We Bought / Held:
Added exposure to oversold sectors and credits, with a focus on US cyclicals (Home Construction, Communications, Electric Utilities, Building Materials, etc)
Added exposure to US financials, which we believe traded off disproportionally to the rest of the HY market on fears of European contagion
Held slightly higher than normal cash balances to insure liquidity and provide stability
What We Sold / Avoided:
Reduced exposure to shorter, less volatile bonds in an effort to meet liquidity and take advantage of oversold opportunities.pp
Trimmed positions in some of the global sectors, particular in tighter trading credits (Metals & Mining, Energy, Autos, and Technology)
What We Missed:
D i i i h l i l d i i d i h li l Despite recognizing the early summer economic slowdown, we maintained our overweight to cyclical sectors, particularly in the housing and gaming industries. While many of these sectors have rebounded substantially, it did hurt short-term performance.
Underestimated the volatility of US financials as a result of concerns over the European Crisis. While we were underweight financials as a sector, some of our financial holdings performed worse than we anticipated.
13Copyright © 2012 AEGON USA Investment Management, LLC www.aegoninvestments.com Local knowledge. Global power.
The themes discussed on the Portfolio Themes and Process In Action pages are provided for informational purposes only and should not be deemed as recommendations to buy or sell the securities/industries/sectors mentioned. The themes are included to provide the reader with an understanding of how AUIM is currently viewing the market and positioning the portfolio in light of market conditions. The actions taken are not listed based on the performance results achieved by the actions, but are included to provide the reader with the most material investment actions taken by AUIM during the period.
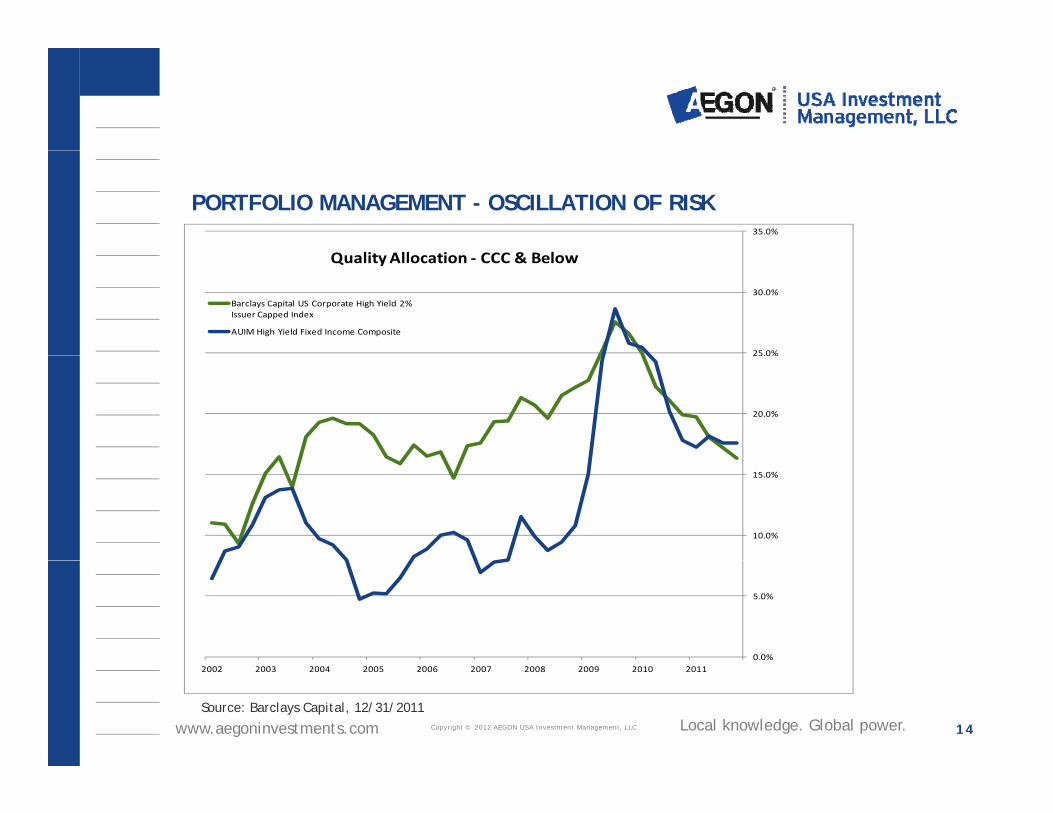
PORTFOLIO MANAGEMENT - OSCILLATION OF RISK 35.0%
Q li All i CCC & B l
25.0%
30.0%
Quality Allocation ‐ CCC & Below
Barclays Capital US Corporate High Yield 2% Issuer Capped Index
AUIM High Yield Fixed Income Composite
20.0%
25.0%
10.0%
15.0%
0.0%
5.0%
14Copyright © 2012 AEGON USA Investment Management, LLC www.aegoninvestments.com Local knowledge. Global power.Source: Barclays Capital, 12/31/2011
2011201020092008200720062005200420032002
STRONG CULTURE OF RISK MANAGEMENT
First line of defense – Management of portfolio risks
Collaborative traditional and distressed credit research efforts
Risk/Return Measurement & Analysis
Facilitated by independent Portfolio Risk Management team
AUIM makes full use of capabilities in BlackRock’s Aladdin system
Standard risk metrics (VaR, tracking error) in addition to scenario stress testing and what/if analysis for portfolio positioning
Peer review of all AUIM products and portfolios
Second line of defense – Assessment, Monitoring, and Reporting
Independent Portfolio Risk Control team monitors compliance with investment guidelines and restrictionsrestrictions
Risk Assessment – Compliance and Operational Risk Management teams provide independent risk identification, assessment, monitoring and reporting to AUIM senior management
Third line of defense – Independent Assurance
15Copyright © 2012 AEGON USA Investment Management, LLC www.aegoninvestments.com Local knowledge. Global power.
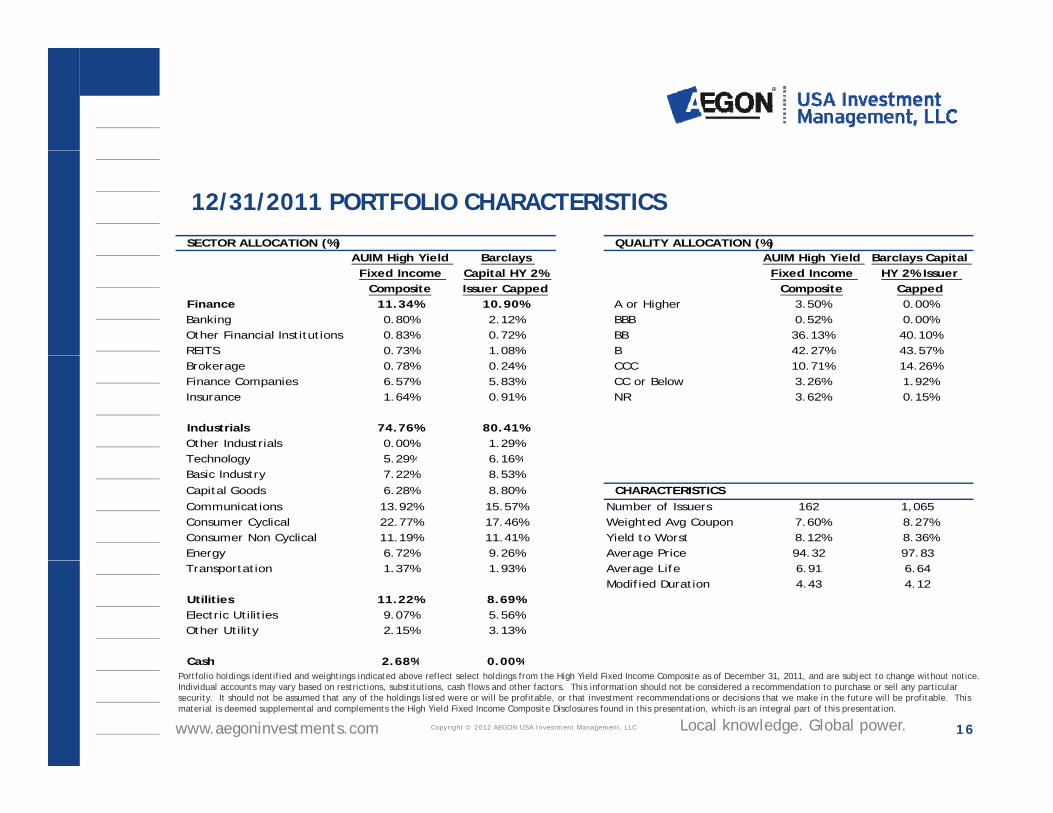
12/31/2011 PORTFOLIO CHARACTERISTICSSECTOR ALLOCATION (%) QUALITY ALLOCATION (%)
AUIM High Yield Fixed Income
Composite
Barclays Capital HY 2% Issuer Capped
AUIM High Yield Fixed Income
Composite
Barclays Capital HY 2% Issuer
CappedFinance 11.34% 10.90% A or Higher 3.50% 0.00%Banking 0.80% 2.12% BBB 0.52% 0.00%Other Financial Institutions 0.83% 0.72% BB 36.13% 40.10%REITS 0.73% 1.08% B 42.27% 43.57%Brokerage 0.78% 0.24% CCC 10.71% 14.26%Finance Companies 6.57% 5.83% CC or Below 3.26% 1.92%Insurance 1.64% 0.91% NR 3.62% 0.15%
Industrials 74.76% 80.41%Other Industrials 0.00% 1.29%Technology 5 29% 6 16%Technology 5.29% 6.16%Basic Industry 7.22% 8.53%
Capital Goods 6.28% 8.80%
Communications 13.92% 15.57% Number of Issuers 162 1,065Consumer Cyclical 22.77% 17.46% Weighted Avg Coupon 7.60% 8.27%Consumer Non Cyclical 11.19% 11.41% Yield to Worst 8.12% 8.36%Energy 6.72% 9.26% Average Price 94.32 97.83
CHARACTERISTICS
Transportation 1.37% 1.93% Average Life 6.91 6.64Modified Duration 4.43 4.12
Utilities 11.22% 8.69%Electric Utilities 9.07% 5.56%Other Utility 2.15% 3.13%
Cash 2 68% 0 00%
16Copyright © 2012 AEGON USA Investment Management, LLC www.aegoninvestments.com Local knowledge. Global power.
Portfolio holdings identified and weightings indicated above reflect select holdings from the High Yield Fixed Income Composite as of December 31, 2011, and are subject to change without notice. Individual accounts may vary based on restrictions, substitutions, cash flows and other factors. This information should not be considered a recommendation to purchase or sell any particular security. It should not be assumed that any of the holdings listed were or will be profitable, or that investment recommendations or decisions that we make in the future will be profitable. This material is deemed supplemental and complements the High Yield Fixed Income Composite Disclosures found in this presentation, which is an integral part of this presentation.
Cash 2.68% 0.00%
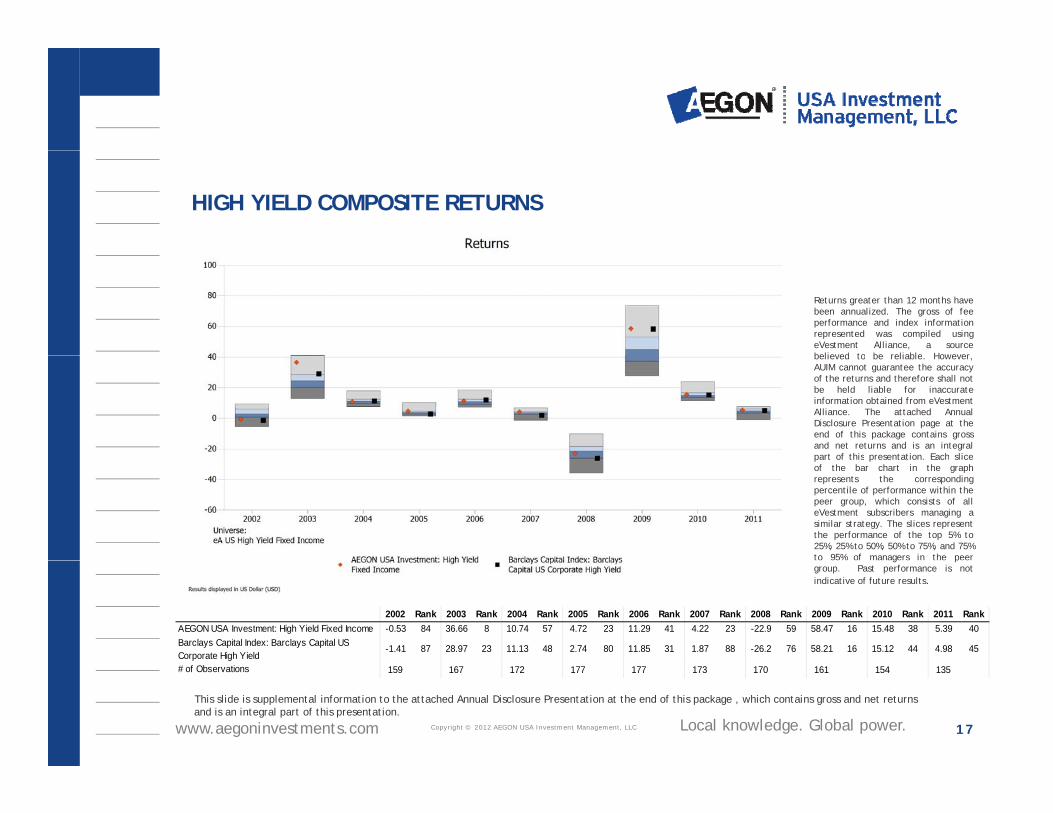
HIGH YIELD COMPOSITE RETURNS
Returns greater than 12 months havebeen annualized. The gross of feeperformance and index informationrepresented was compiled usingeVestment Alliance, a sourcebelieved to be reliable Howeverbelieved to be reliable. However,AUIM cannot guarantee the accuracyof the returns and therefore shall notbe held liable for inaccurateinformation obtained from eVestmentAlliance. The attached AnnualDisclosure Presentation page at theend of this package contains grossand net returns and is an integralpart of this presentation Each slicepart of this presentation. Each sliceof the bar chart in the graphrepresents the correspondingpercentile of performance within thepeer group, which consists of alleVestment subscribers managing asimilar strategy. The slices representthe performance of the top 5% to25%, 25% to 50%, 50% to 75%, and 75%to 95% of managers in the peerg pgroup. Past performance is notindicative of future results.
2002 Rank 2003 Rank 2004 Rank 2005 Rank 2006 Rank 2007 Rank 2008 Rank 2009 Rank 2010 Rank 2011 RankAEGON USA Investment: High Yield Fixed Income -0.53 84 36.66 8 10.74 57 4.72 23 11.29 41 4.22 23 -22.9 59 58.47 16 15.48 38 5.39 40Barclays Capital Index: Barclays Capital US Corporate High Yield
-1.41 87 28.97 23 11.13 48 2.74 80 11.85 31 1.87 88 -26.2 76 58.21 16 15.12 44 4.98 45
17Copyright © 2012 AEGON USA Investment Management, LLC www.aegoninvestments.com Local knowledge. Global power.
This slide is supplemental information to the attached Annual Disclosure Presentation at the end of this package , which contains gross and net returns and is an integral part of this presentation.
# of Observations 159 167 172 177 177 173 170 161 154 135
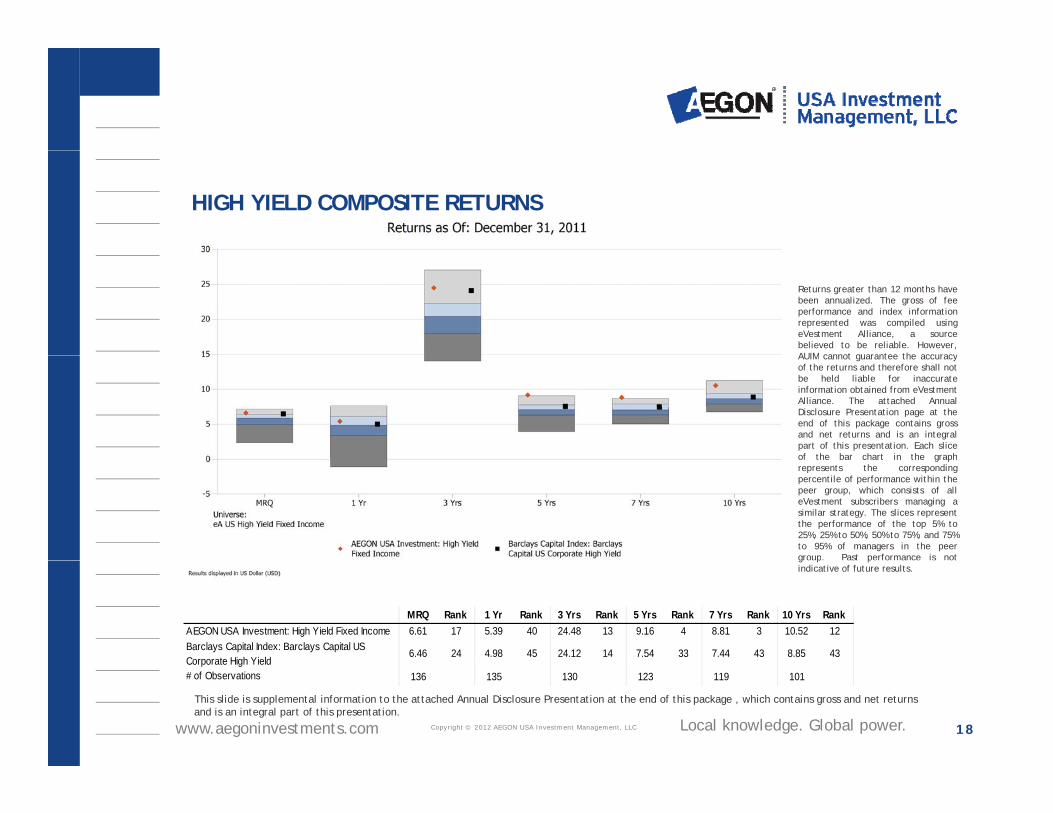
HIGH YIELD COMPOSITE RETURNS
Returns greater than 12 months havebeen annualized. The gross of feeperformance and index informationrepresented was compiled usingeVestment Alliance, a sourcebelieved to be reliable. However,AUIM cannot guarantee the accuracyAUIM cannot guarantee the accuracyof the returns and therefore shall notbe held liable for inaccurateinformation obtained from eVestmentAlliance. The attached AnnualDisclosure Presentation page at theend of this package contains grossand net returns and is an integralpart of this presentation. Each sliceof the bar chart in the graphof the bar chart in the graphrepresents the correspondingpercentile of performance within thepeer group, which consists of alleVestment subscribers managing asimilar strategy. The slices representthe performance of the top 5% to25%, 25% to 50%, 50% to 75%, and 75%to 95% of managers in the peergroup. Past performance is notg p pindicative of future results.
MRQ Rank 1 Yr Rank 3 Yrs Rank 5 Yrs Rank 7 Yrs Rank 10 Yrs RankAEGON USA Investment: High Yield Fixed Income 6.61 17 5.39 40 24.48 13 9.16 4 8.81 3 10.52 12Barclays Capital Index: Barclays Capital US Corporate High Yield
6.46 24 4.98 45 24.12 14 7.54 33 7.44 43 8.85 43
18Copyright © 2012 AEGON USA Investment Management, LLC www.aegoninvestments.com Local knowledge. Global power.
This slide is supplemental information to the attached Annual Disclosure Presentation at the end of this package , which contains gross and net returns and is an integral part of this presentation.
Corporate High Yield# of Observations 136 135 130 123 119 101
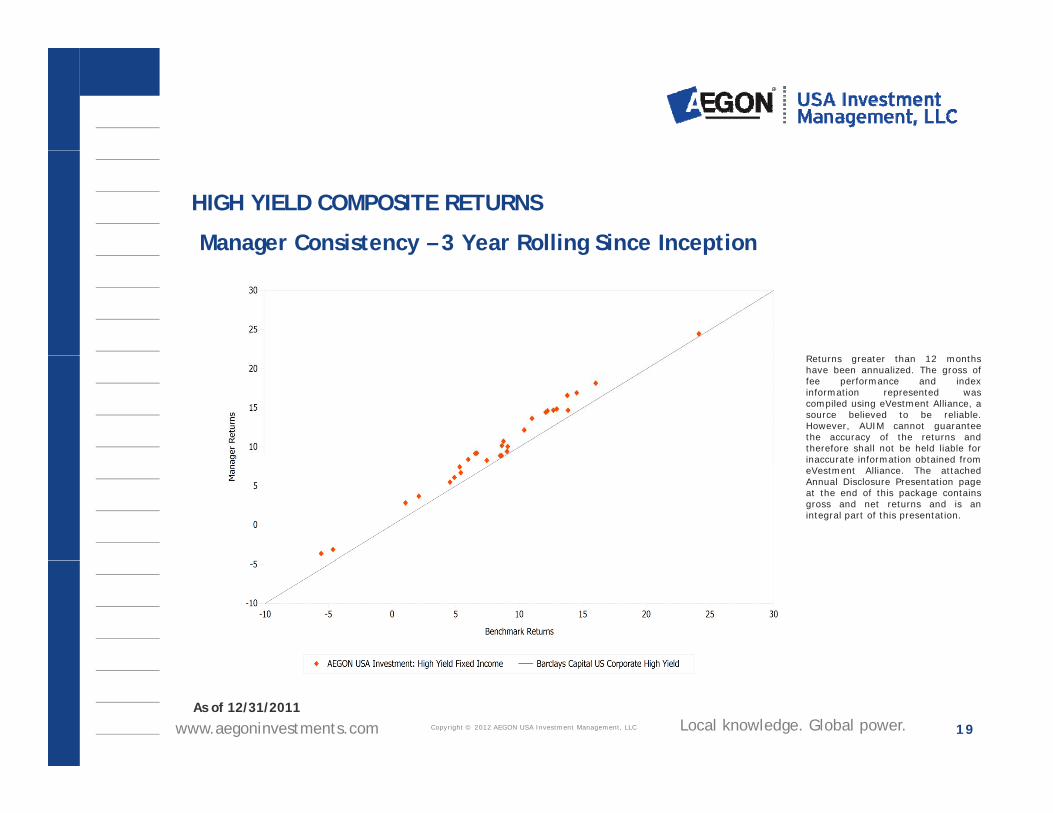
HIGH YIELD COMPOSITE RETURNS
Manager Consistency – 3 Year Rolling Since Inception
R t t th 12 th
g y g p
Returns greater than 12 monthshave been annualized. The gross offee performance and indexinformation represented wascompiled using eVestment Alliance, asource believed to be reliable.However, AUIM cannot guaranteethe accuracy of the returns andtherefore shall not be held liable forinaccurate information obtained frominaccurate information obtained fromeVestment Alliance. The attachedAnnual Disclosure Presentation pageat the end of this package containsgross and net returns and is anintegral part of this presentation.
19Copyright © 2012 AEGON USA Investment Management, LLC www.aegoninvestments.com Local knowledge. Global power.As of 12/31/2011
SUMMARY
Team of experienced investment professionalsTeam of experienced investment professionals
Highly disciplined investment process
Solid long-term performance record with proven ability to outperform in up and down markets
Strong risk management process Strong risk management process
Financial strength and access to substantial regional and global resources
20Copyright © 2012 AEGON USA Investment Management, LLC www.aegoninvestments.com Local knowledge. Global power.
HIGH YIELD MANAGEMENT TEAM Brad Beman, CFA, CPA joined AEGON in 1988. Brad is the Chief Investment Officer and Director of Public High
Yi ld I hi l B d b d i t f t t g i i l di g I t t G d C dit High Yi ld Yield. In his role Brad oversees a broad variety of asset categories including Investment Grade Credit, High Yield, Emerging Markets, Private Placements, Commercial Mortgage Backed Securities, Residential Mortgaged Back Securities, Distressed and Cash Management. Brad is a lead portfolio manager for the public high yield portfolios. Prior to his current role, Brad held various investment roles ranging from public fixed income research analyst to director of credit research. Brad received his BA from the University of Northern Iowa and his MBA from the University of Iowa.
Ben Miller, CFA joined AEGON in 1993. Ben is a High Yield Portfolio Manager. Ben’s responsibilities include high yield trading and portfolio management. Prior to his current role, Ben held various investment responsibilities ranging from private placement analyst to public fixed income research analyst. Ben received his BA from the University of Northern Iowa and his MBA from the University of Iowa.
Kevin Bakker, CFA joined AEGON in 2003. Kevin is a High Yield Portfolio Manager. Kevin’s responsibilities include high yield trading and portfolio management. Prior to his current role, Kevin was a public fixed income research analyst covering both high yield and investment grade corporate securities. Prior to joining AUIM, Kevin was employed by Archer Daniels Midland in various roles within their commodities trading division. Kevin received his BA from Loras College and his MBA from the University of Iowa.
Jim Schaeffer joined AEGON in 2004. Jim is Head of U.S. Leveraged Finance, where his responsibilities include managing the U.S. High Yield, Leveraged Loans, and Distressed Assets portfolio management platform. Jim is also responsible for the stressed and special situation securities and all restructuring and bankruptcy situations for AUIM. Prior to joining AEGON, Jim served as a Vice President at PPM America’s Distressed Debt and Workout Group. Jim also worked in corporate banking and investment banking positions at Wachovia Corporation, Bank of America
21Copyright © 2012 AEGON USA Investment Management, LLC www.aegoninvestments.com Local knowledge. Global power.
Securities and Donaldson, Lufkin & Jenrette in Chicago. Jim received his BS in Finance from Miami (Ohio) University and his MBA from the Wharton School of Business at the University of Pennsylvania.
AUIM HIGH YIELD FIXED INCOME COMPOSITE DISCLOSURES
C i A A l P f R l Composite Assets Annual Performance Results
Year End
Total Firm Assets
(Millions) USD
(Millions) Number of Accounts
Composite Gross of Fees %
Composite Net of Fees %
Composite Benchmark % BC HY 2 % Issuer Cap
Secondary Benchmark % BC HY FI
Composite Dispersion
Composite St. Dev.
Composite Benchmark
St. Dev
Secondary Benchmark
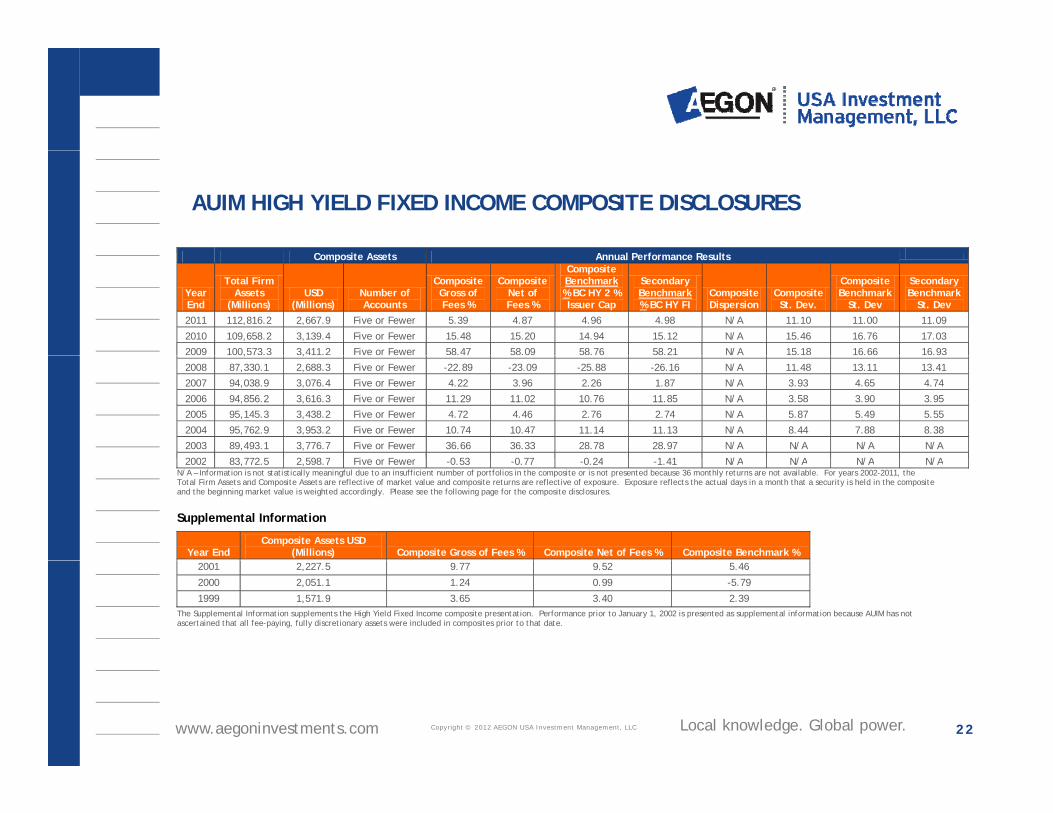
St. Dev 2011 112,816.2 2,667.9 Five or Fewer 5.39 4.87 4.96 4.98 N/A 11.10 11.00 11.09
2010 109,658.2 3,139.4 Five or Fewer 15.48 15.20 14.94 15.12 N/A 15.46 16.76 17.03
2009 100,573.3 3,411.2 Five or Fewer 58.47 58.09 58.76 58.21 N/A 15.18 16.66 16.93 , ,
2008 87,330.1 2,688.3 Five or Fewer -22.89 -23.09 -25.88 -26.16 N/A 11.48 13.11 13.41
2007 94,038.9 3,076.4 Five or Fewer 4.22 3.96 2.26 1.87 N/A 3.93 4.65 4.74
2006 94,856.2 3,616.3 Five or Fewer 11.29 11.02 10.76 11.85 N/A 3.58 3.90 3.95
2005 95,145.3 3,438.2 Five or Fewer 4.72 4.46 2.76 2.74 N/A 5.87 5.49 5.55
2004 95,762.9 3,953.2 Five or Fewer 10.74 10.47 11.14 11.13 N/A 8.44 7.88 8.38
2003 89,493.1 3,776.7 Five or Fewer 36.66 36.33 28.78 28.97 N/A N/A N/A N/A
2002 83 772 5 2 598 7 Fi F 0 53 0 77 0 24 1 41 N/A N/A N/A N/A N/A – Information is not statistically meaningful due to an insufficient number of portfolios in the composite or is not presented because 36 monthly returns are not available. For years 2002-2011, the Total Firm Assets and Composite Assets are reflective of market value and composite returns are reflective of exposure. Exposure reflects the actual days in a month that a security is held in the composite and the beginning market value is weighted accordingly. Please see the following page for the composite disclosures.
Supplemental Information
2002 83,772.5 2,598.7 Five or Fewer -0.53 -0.77 -0.24 -1.41 N/A N/A N/A N/A
Year End Composite Assets USD
(Millions) Composite Gross of Fees % Composite Net of Fees % Composite Benchmark %
The Supplemental Information supplements the High Yield Fixed Income composite presentation. Performance prior to January 1, 2002 is presented as supplemental information because AUIM has not ascertained that all fee-paying, fully discretionary assets were included in composites prior to that date.
2001 2,227.5 9.77 9.52 5.46
2000 2,051.1 1.24 0.99 -5.79
1999 1,571.9 3.65 3.40 2.39
22Copyright © 2012 AEGON USA Investment Management, LLC www.aegoninvestments.com Local knowledge. Global power.
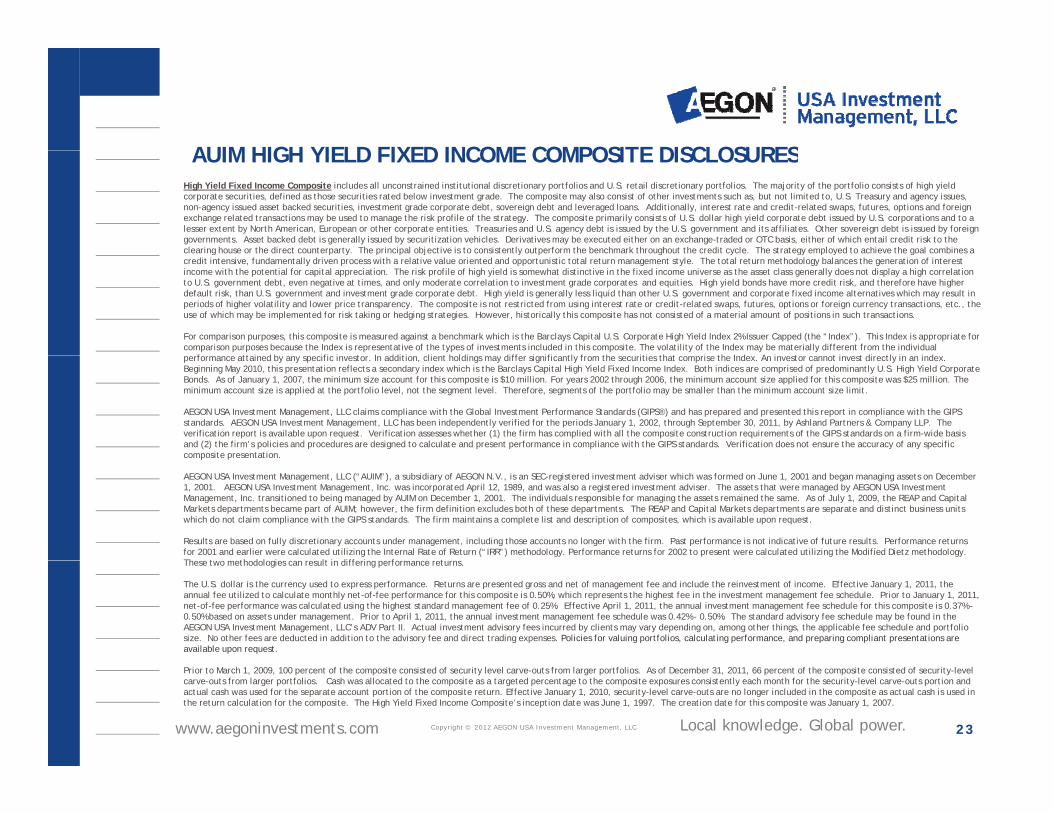
AUIM HIGH YIELD FIXED INCOME COMPOSITE DISCLOSURESAUIM HIGH YIELD FIXED INCOME COMPOSITE DISCLOSURESHigh Yield Fixed Income Composite includes all unconstrained institutional discretionary portfolios and U.S. retail discretionary portfolios. The majority of the portfolio consists of high yield corporate securities, defined as those securities rated below investment grade. The composite may also consist of other investments such as, but not limited to, U.S. Treasury and agency issues, non-agency issued asset backed securities, investment grade corporate debt, sovereign debt and leveraged loans. Additionally, interest rate and credit-related swaps, futures, options and foreign exchange related transactions may be used to manage the risk profile of the strategy. The composite primarily consists of U.S. dollar high yield corporate debt issued by U.S. corporations and to a lesser extent by North American, European or other corporate entities. Treasuries and U.S. agency debt is issued by the U.S. government and its affiliates. Other sovereign debt is issued by foreign governments. Asset backed debt is generally issued by securitization vehicles. Derivatives may be executed either on an exchange-traded or OTC basis, either of which entail credit risk to the clearing house or the direct counterparty. The principal objective is to consistently outperform the benchmark throughout the credit cycle. The strategy employed to achieve the goal combines a clearing house or the direct counterparty. The principal objective is to consistently outperform the benchmark throughout the credit cycle. The strategy employed to achieve the goal combines a credit intensive, fundamentally driven process with a relative value oriented and opportunistic total return management style. The total return methodology balances the generation of interest income with the potential for capital appreciation. The risk profile of high yield is somewhat distinctive in the fixed income universe as the asset class generally does not display a high correlation to U.S. government debt, even negative at times, and only moderate correlation to investment grade corporates and equities. High yield bonds have more credit risk, and therefore have higher default risk, than U.S. government and investment grade corporate debt. High yield is generally less liquid than other U.S. government and corporate fixed income alternatives which may result in periods of higher volatility and lower price transparency. The composite is not restricted from using interest rate or credit-related swaps, futures, options or foreign currency transactions, etc., the use of which may be implemented for risk taking or hedging strategies. However, historically this composite has not consisted of a material amount of positions in such transactions.
For comparison purposes, this composite is measured against a benchmark which is the Barclays Capital U.S. Corporate High Yield Index 2% Issuer Capped (the “Index”). This Index is appropriate for comparison purposes because the Index is representative of the types of investments included in this composite. The volatility of the Index may be materially different from the individual
f tt i d b ifi i t I dditi li t h ldi diff i ifi tl f th iti th t i th I d A i t t i t di tl i i d performance attained by any specific investor. In addition, client holdings may differ significantly from the securities that comprise the Index. An investor cannot invest directly in an index. Beginning May 2010, this presentation reflects a secondary index which is the Barclays Capital High Yield Fixed Income Index. Both indices are comprised of predominantly U.S. High Yield Corporate Bonds. As of January 1, 2007, the minimum size account for this composite is $10 million. For years 2002 through 2006, the minimum account size applied for this composite was $25 million. The minimum account size is applied at the portfolio level, not the segment level. Therefore, segments of the portfolio may be smaller than the minimum account size limit.
AEGON USA Investment Management, LLC claims compliance with the Global Investment Performance Standards (GIPS®) and has prepared and presented this report in compliance with the GIPS standards. AEGON USA Investment Management, LLC has been independently verified for the periods January 1, 2002, through September 30, 2011, by Ashland Partners & Company LLP. The verification report is available upon request. Verification assesses whether (1) the firm has complied with all the composite construction requirements of the GIPS standards on a firm-wide basis and (2) the firm’s policies and procedures are designed to calculate and present performance in compliance with the GIPS standards. Verification does not ensure the accuracy of any specific composite presentation.co pos te p ese tat o .
AEGON USA Investment Management, LLC (“AUIM”), a subsidiary of AEGON N.V., is an SEC-registered investment adviser which was formed on June 1, 2001 and began managing assets on December 1, 2001. AEGON USA Investment Management, Inc. was incorporated April 12, 1989, and was also a registered investment adviser. The assets that were managed by AEGON USA Investment Management, Inc. transitioned to being managed by AUIM on December 1, 2001. The individuals responsible for managing the assets remained the same. As of July 1, 2009, the REAP and Capital Markets departments became part of AUIM; however, the firm definition excludes both of these departments. The REAP and Capital Markets departments are separate and distinct business units which do not claim compliance with the GIPS standards. The firm maintains a complete list and description of composites, which is available upon request.
Results are based on fully discretionary accounts under management, including those accounts no longer with the firm. Past performance is not indicative of future results. Performance returns for 2001 and earlier were calculated utilizing the Internal Rate of Return (“IRR”) methodology. Performance returns for 2002 to present were calculated utilizing the Modified Dietz methodology. Th t th d l i lt i diff i f tThese two methodologies can result in differing performance returns.
The U.S. dollar is the currency used to express performance. Returns are presented gross and net of management fee and include the reinvestment of income. Effective January 1, 2011, the annual fee utilized to calculate monthly net-of-fee performance for this composite is 0.50%, which represents the highest fee in the investment management fee schedule. Prior to January 1, 2011, net-of-fee performance was calculated using the highest standard management fee of 0.25%. Effective April 1, 2011, the annual investment management fee schedule for this composite is 0.37% -0.50% based on assets under management. Prior to April 1, 2011, the annual investment management fee schedule was 0.42% - 0.50%. The standard advisory fee schedule may be found in the AEGON USA Investment Management, LLC’s ADV Part II. Actual investment advisory fees incurred by clients may vary depending on, among other things, the applicable fee schedule and portfolio size. No other fees are deducted in addition to the advisory fee and direct trading expenses. Policies for valuing portfolios, calculating performance, and preparing compliant presentations are available upon request.
23Copyright © 2012 AEGON USA Investment Management, LLC www.aegoninvestments.com Local knowledge. Global power.
Prior to March 1, 2009, 100 percent of the composite consisted of security level carve-outs from larger portfolios. As of December 31, 2011, 66 percent of the composite consisted of security-level carve-outs from larger portfolios. Cash was allocated to the composite as a targeted percentage to the composite exposures consistently each month for the security-level carve-outs portion and actual cash was used for the separate account portion of the composite return. Effective January 1, 2010, security-level carve-outs are no longer included in the composite as actual cash is used in the return calculation for the composite. The High Yield Fixed Income Composite’s inception date was June 1, 1997. The creation date for this composite was January 1, 2007.
DISCLOSURES
This material is to be used for institutional investors and not for any other purpose. The information This material is to be used for institutional investors and not for any other purpose. The information included in this document should not be construed as advertising, investment advice or a recommendation for the purchase or sale of any security. The enclosed information has been developed internally and/or obtained from sources believed to be reliable; however, the firm does not guaranty the accuracy, adequacy or completeness of such information. This material contains the current opinions of the manager and such opinions are subject to change without notice. This material contains general information only on investment matters; it should not be considered as a contains general information only on investment matters; it should not be considered as a comprehensive statement on any matter and should not be relied upon as such. The information it contains does not take into account any investor's investment objectives, particular needs or financial situation. The value of any investment may fluctuate. Results achieved in the past are no guarantee of future results. Please contact Kristin Krousie at [email protected] or 877-234-6862 for a fully compliant presentation and/or a list and description of all firm composites, and the firm descriptiondescription.
24Copyright © 2012 AEGON USA Investment Management, LLC www.aegoninvestments.com Local knowledge. Global power.