high-yield and bank loan outlook: summer headwinds in leveraged credit
DESCRIPTION
While spreads have since narrowed, we are still finding bargains in high-yield bonds and bank loansTRANSCRIPT
1Guggenheim Investments High-Yield and Bank Loan Outlook | Q2 2016
Risk assets rallied in the latter half of the first quarter of 2016, led by a dovish pivot in Federal Reserve communication that helped spur a rally in crude oil and a reversal of recent dollar strength. This in turn snapped two consecutive quarterly losses in high-yield corporate bonds and bank loans. The primary driver of wider spreads in the high-yield market persists, however, as the oil market is still characterized by a significant supply-demand imbalance. Near-term risks include further weakness in oil, the impact of a potential Fed hike over the summer, and the meaningful wave of downgrades that lie ahead in oil and basic materials.
Nevertheless, our fundamental outlook for leveraged credit remains constructive. Spreads exceeded 900 basis points in February 2016, levels that are consistent with implied six-month forward default rates in the 9–10 percent range. We believe this default risk is overestimated in the current environment. While spreads have since narrowed, we are still finding bargains in high-yield bonds and bank loans, but we remain mindful of the potential for another bout of market volatility.
Report Highlights
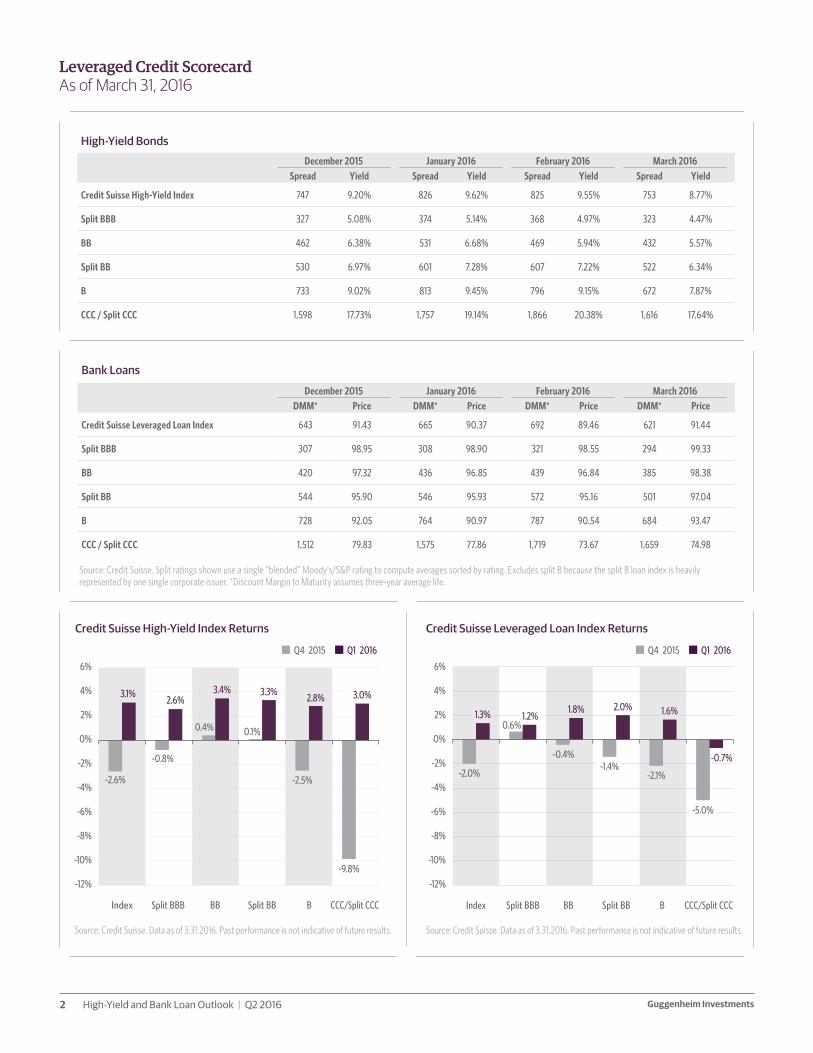
§The Credit Suisse High-Yield Bond and Leveraged Loan indexes posted gains of 3.1 percent and 1.3 percent in Q1 2016, respectively, following a rebound across risk assets that began in the middle of the quarter.
§Technical headwinds remain. In high-yield, a slew of downgrades may oversupply the market and push spreads higher. Bank loans may see some pressure given their positive correlation with high-yield bonds.
§ Fundamentally, both markets are performing well. Bank loan borrowers, in particular, may benefit from the Federal Reserve’s decision to delay raising interest rates, keeping borrowing costs at historically low levels.
§ As 10-year U.S. Treasury yields decline further, loss-adjusted yields in high-yield bonds and bank loans look especially attractive, even when stressed for the level of credit losses experienced during the financial crisis.
Investment Professionals
B. Scott Minerd
Chairman of Investments and Global Chief Investment Officer
Jeffrey B. Abrams
Senior Managing Director, Portfolio Manager
Kevin H. Gundersen, CFA
Senior Managing Director, Portfolio Manager
Thomas J. Hauser
Managing Director, Portfolio Manager
Maria M. Giraldo, CFA
Vice President, Investment Research
April 2016
High-Yield and Bank Loan OutlookSummer Headwinds in Leveraged Credit
Guggenheim InvestmentsHigh-Yield and Bank Loan Outlook | Q2 20162
Leveraged Credit Scorecard As of March 31, 2016
Bank Loans
December 2015 January 2016 February 2016 March 2016DMM* Price DMM* Price DMM* Price DMM* Price
Credit Suisse Leveraged Loan Index 643 91.43 665 90.37 692 89.46 621 91.44
Split BBB 307 98.95 308 98.90 321 98.55 294 99.33
BB 420 97.32 436 96.85 439 96.84 385 98.38
Split BB 544 95.90 546 95.93 572 95.16 501 97.04
B 728 92.05 764 90.97 787 90.54 684 93.47
CCC / Split CCC 1,512 79.83 1,575 77.86 1,719 73.67 1,659 74.98
High-Yield Bonds
December 2015 January 2016 February 2016 March 2016Spread Yield Spread Yield Spread Yield Spread Yield
Credit Suisse High-Yield Index 747 9.20% 826 9.62% 825 9.55% 753 8.77%
Split BBB 327 5.08% 374 5.14% 368 4.97% 323 4.47%
BB 462 6.38% 531 6.68% 469 5.94% 432 5.57%
Split BB 530 6.97% 601 7.28% 607 7.22% 522 6.34%
B 733 9.02% 813 9.45% 796 9.15% 672 7.87%
CCC / Split CCC 1,598 17.73% 1,757 19.14% 1,866 20.38% 1,616 17.64%
Source: Credit Suisse. Split ratings shown use a single “blended” Moody’s/S&P rating to compute averages sorted by rating. Excludes split B because the split B loan index is heavily represented by one single corporate issuer. *Discount Margin to Maturity assumes three-year average life.
Source: Credit Suisse. Data as of 3.31.2016. Past performance is not indicative of future results.
Credit Suisse High-Yield Index Returns Credit Suisse Leveraged Loan Index Returns
Source: Credit Suisse. Data as of 3.31.2016. Past performance is not indicative of future results.
0%
2%
4%
6%
-2%
-4%
-6%
-8%
-10%
-12%
CCC/Split CCCBSplit BBBBSplit BBBIndex
Q4 2015 Q1 2016
2.6%3.4% 3.3% 2.8% 3.0%
-2.6%
-0.8%
0.4% 0.1%
-2.5%
-9.8%
3.1%
CCC/Split CCCBSplit BBBBSplit BBBIndex
Q4 2015 Q1 2016
0%
2%
4%
6%
-2%
-4%
-6%
-8%
-10%
-12%
1.2%1.8% 2.0% 1.6%
-0.7%
1.3%
-2.0%
0.6%
-0.4%-1.4%
-2.1%
-5.0%
3Guggenheim Investments High-Yield and Bank Loan Outlook | Q2 2016
Macroeconomic Overview The Gravitational Pull of Global Rates
This year opened with what we called The Great Recession Scare of 2016. Forecasts
for U.S. and global economic growth were downgraded, and recession fears surged
along with market volatility, but we continue to believe that near-term recession
odds are low. Estimates for first quarter gross domestic product (GDP) in the U.S.
have been marked down, with the Federal Reserve Bank of Atlanta’s GDPNow
model tracking estimate for Q1 GDP growth at 0.4 percent annualized as of April 5.
While disappointing, weakness in the first quarter is also not surprising: Q1 GDP
has undershot full-year growth rates in six out of the last seven years. Over that
period, the growth rate of real GDP in Q1 has been 1.9 percentage points lower,
on average, than full-year growth.
Quarterly GDP numbers are also subject to numerous revisions. In addition to
the advanced quarterly GDP estimates undergoing two rounds of revisions in
the months following the initial release, the Bureau of Economic Analysis (BEA)
also conducts annual benchmark revisions of the National Income and Product
Accounts (NIPA), which result in restated historical figures. Following the 2015
revisions to the NIPA accounts, average real GDP growth rates in the first quarter
were revised up to 1.1 percent from 0.7 percent before the revisions. With all of
these adjustments in mind, we continue to expect real growth of about 2.5 percent
in 2016. The rebound in risk assets in the second half of the quarter may also
reflect diminished recession risks in the eyes of many market participants.
The outlook for economic growth outside of the United States softened in the first
quarter. A further deterioration in the euro zone inflation outlook prompted the
European Central Bank (ECB) to announce an increase in the size of its monthly
asset purchases by €20 billion to €80 billion per month, and a 10 basis-point
reduction in the deposit rate to -40 basis points. The ECB also expanded its
program to include purchases of high-quality corporate bonds and launched a new
four-year, fixed-rate targeted long-term refinancing operation (TLTRO), a program
that allows banks to borrow from the ECB based on the total amount they lend to
the nonfinancial private sector. European government bonds rallied following the
announcement, with the 10-year German bund ending the quarter with a yield of
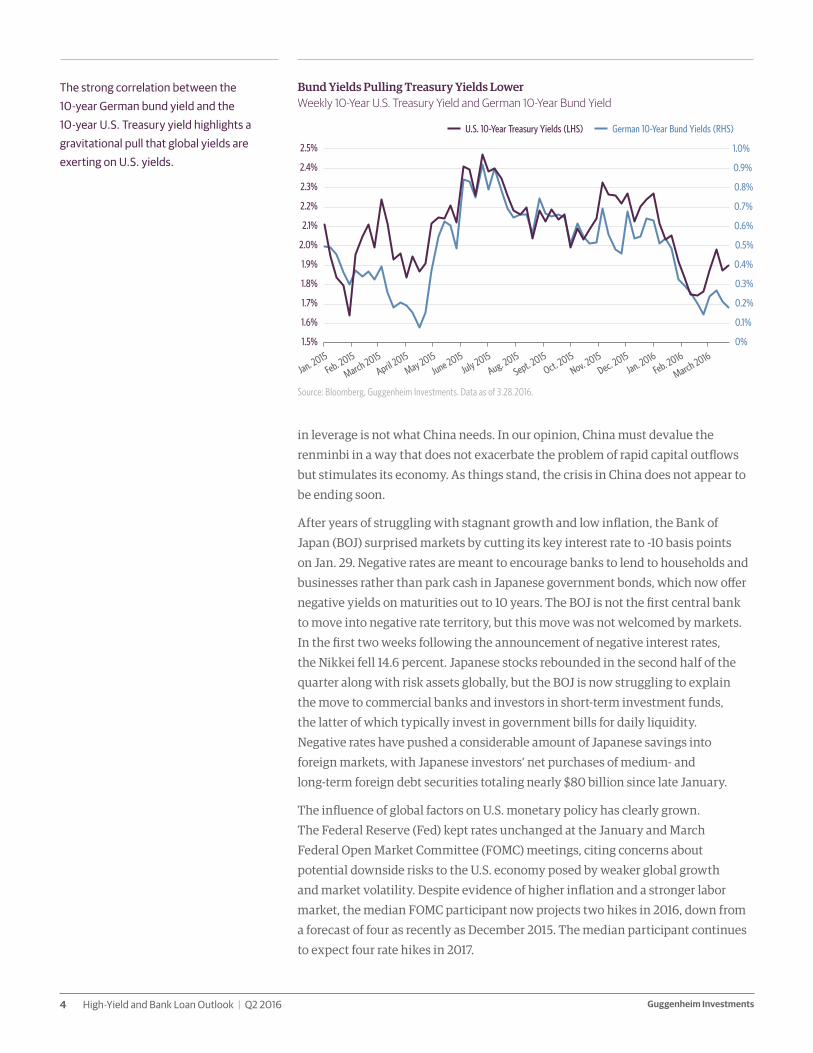
just 16 basis points. The strong correlation between the 10-year German bund yield
and the 10-year U.S. Treasury yield highlights a gravitational pull that global yields
are exerting on U.S. yields. The focus on efforts to ease euro zone credit conditions
also had positive spillovers for the U.S. high-yield and bank loan markets.
Ongoing stimulus efforts in Asia are also likely to contribute to low U.S. rates.
Chinese industrial production growth continued to slow in early 2016, prompting
the People’s Bank of China (PBOC) to cut its bank reserve requirement ratio at
the end of February. This is intended to stimulate credit growth by allowing
banks to hold fewer reserves against deposits. But with China’s total nonfinancial
debt-to-GDP ratio having risen at an alarming rate since 2008, a further increase
“The strains that are developing as a result of divergent monetary policies
—Japan struggling to deal with the strengthening yen and the ECB soon having to deal with the strengthening euro—are going to create headwinds for growth in those countries that are going to force them into further monetary action. More monetary liquidity going into those countries eventually spills into our own, which accounts for what we are seeing right now: Risk assets are rising in value along with falling Treasury yields. The high correlation between risk-free and risk assets is part of the rising tide of liquidity, which is continuing to push risk assets and safe-haven assets higher.”
– Scott Minerd, Chairman of Investments and Global Chief Investment Officer
Guggenheim InvestmentsHigh-Yield and Bank Loan Outlook | Q2 20164
in leverage is not what China needs. In our opinion, China must devalue the
renminbi in a way that does not exacerbate the problem of rapid capital outflows
but stimulates its economy. As things stand, the crisis in China does not appear to
be ending soon.
After years of struggling with stagnant growth and low inflation, the Bank of
Japan (BOJ) surprised markets by cutting its key interest rate to -10 basis points
on Jan. 29. Negative rates are meant to encourage banks to lend to households and
businesses rather than park cash in Japanese government bonds, which now offer
negative yields on maturities out to 10 years. The BOJ is not the first central bank
to move into negative rate territory, but this move was not welcomed by markets.
In the first two weeks following the announcement of negative interest rates,
the Nikkei fell 14.6 percent. Japanese stocks rebounded in the second half of the
quarter along with risk assets globally, but the BOJ is now struggling to explain
the move to commercial banks and investors in short-term investment funds,
the latter of which typically invest in government bills for daily liquidity.
Negative rates have pushed a considerable amount of Japanese savings into
foreign markets, with Japanese investors’ net purchases of medium- and
long-term foreign debt securities totaling nearly $80 billion since late January.
The influence of global factors on U.S. monetary policy has clearly grown.
The Federal Reserve (Fed) kept rates unchanged at the January and March
Federal Open Market Committee (FOMC) meetings, citing concerns about
potential downside risks to the U.S. economy posed by weaker global growth
and market volatility. Despite evidence of higher inflation and a stronger labor
market, the median FOMC participant now projects two hikes in 2016, down from
a forecast of four as recently as December 2015. The median participant continues
to expect four rate hikes in 2017.
Bund Yields Pulling Treasury Yields Lower Weekly 10-Year U.S. Treasury Yield and German 10-Year Bund Yield
The strong correlation between the 10-year German bund yield and the 10-year U.S. Treasury yield highlights a gravitational pull that global yields are exerting on U.S. yields.
Source: Bloomberg, Guggenheim Investments. Data as of 3.28.2016.
2.4%
2.5%
2.3%
2.2%
2.1%
2.0%
1.9%
1.8%
1.7%
1.6%
1.5%
0.9%
1.0%
0.8%
0.7%
0.6%
0.5%
0.4%
0.3%
0.2%
0.1%
0%
U.S. 10-Year Treasury Yields (LHS) German 10-Year Bund Yields (RHS)
Jan. 2015Feb. 2015
March 2015
April 2015
May 2015June 2015
July 2015Aug. 2015
Sept. 2015Oct. 2015
Nov. 2015Dec. 2015
Jan. 2016Feb. 2016
March 2016
5Guggenheim Investments High-Yield and Bank Loan Outlook | Q2 2016
In an environment where global rates are moving lower and markets are already
starved for yield, foreign investors are looking to the U.S. While we hear arguments to
the contrary, we expect that U.S. Treasury yields will fall further as the gravitational
pull of global yields gets stronger, and do not discount the possibility of 10-year U.S.
Treasury yields declining to closer to 1 percent before the end of the year.
Q1 2016 Leveraged Credit Performance RecapAnchored to Oil Prices
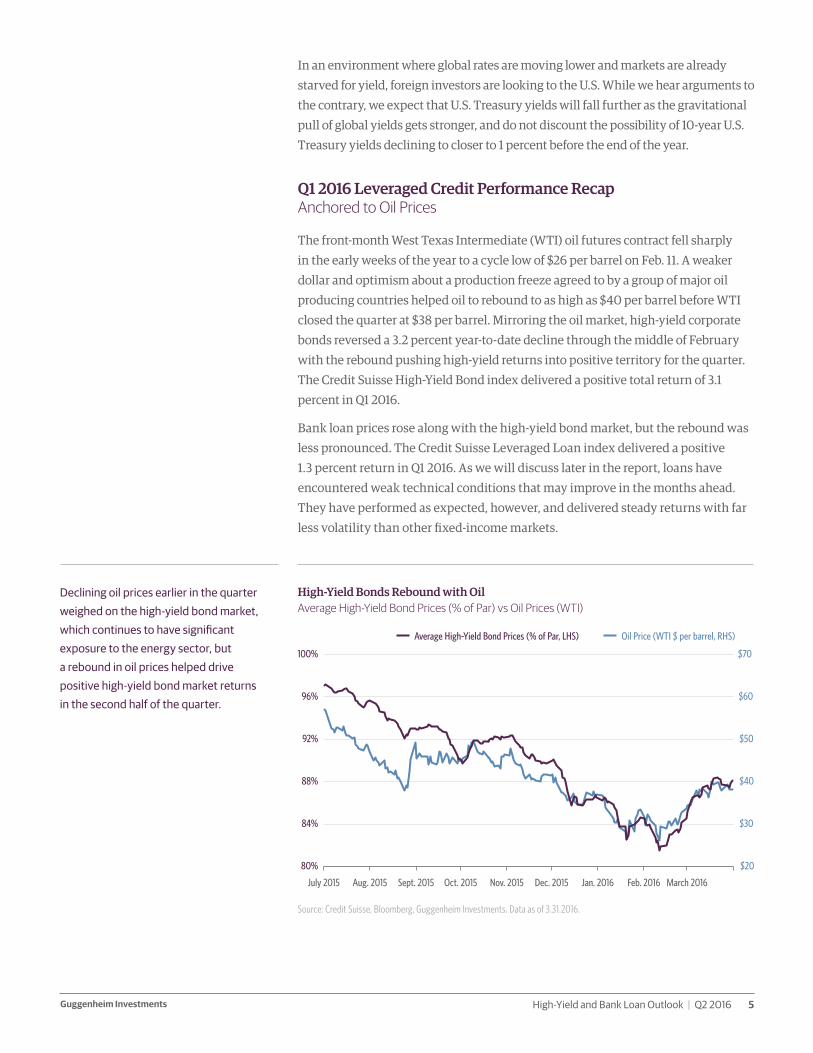
The front-month West Texas Intermediate (WTI) oil futures contract fell sharply
in the early weeks of the year to a cycle low of $26 per barrel on Feb. 11. A weaker
dollar and optimism about a production freeze agreed to by a group of major oil
producing countries helped oil to rebound to as high as $40 per barrel before WTI
closed the quarter at $38 per barrel. Mirroring the oil market, high-yield corporate
bonds reversed a 3.2 percent year-to-date decline through the middle of February
with the rebound pushing high-yield returns into positive territory for the quarter.
The Credit Suisse High-Yield Bond index delivered a positive total return of 3.1
percent in Q1 2016.
Bank loan prices rose along with the high-yield bond market, but the rebound was
less pronounced. The Credit Suisse Leveraged Loan index delivered a positive
1.3 percent return in Q1 2016. As we will discuss later in the report, loans have
encountered weak technical conditions that may improve in the months ahead.
They have performed as expected, however, and delivered steady returns with far
less volatility than other fixed-income markets.
High-Yield Bonds Rebound with Oil Average High-Yield Bond Prices (% of Par) vs Oil Prices (WTI)
Declining oil prices earlier in the quarter weighed on the high-yield bond market, which continues to have significant exposure to the energy sector, but a rebound in oil prices helped drive positive high-yield bond market returns in the second half of the quarter.
Source: Credit Suisse, Bloomberg, Guggenheim Investments. Data as of 3.31.2016.
96%
100%
92%
88%
84%
80%
$60
$70
$50
$40
$30
$20
Average High-Yield Bond Prices (% of Par, LHS) Oil Price (WTI $ per barrel, RHS)
July 2015 Aug. 2015 Sept. 2015 Oct. 2015 Nov. 2015 Dec. 2015 Jan. 2016 Feb. 2016 March 2016
Guggenheim InvestmentsHigh-Yield and Bank Loan Outlook | Q2 20166
The rebound in risk assets, in conjunction with rising oil prices, supports our
view that the decline in leveraged credit has been largely tied to the commodity
bear market and a sentiment-driven spillover into credits tied to other industries.
Our concern is that the rebound in oil prices is not yet supported by a turnaround
in the dynamics that initially caused prices to fall. Our analysis of inventory trends
and production levels suggests that the oil market will remain oversupplied until the
second half of 2016. Leveraged credit must contend with two important headwinds
between now and the second half of the year: a rise in credit defaults in the energy
and metals sectors, and a likely wave of ratings downgrades in both markets.
Volatility on the Horizon for High YieldTechnical Headwinds May Drive Spring Volatility
In January 2016, Moody’s placed 120 oil and gas companies and 55 mining
companies on review for a downgrade, reflecting expectations for persistently
poor conditions in commodity markets and a weakening global growth outlook
to weigh on commodity prices going forward. The potential for “fallen angels,”
a term given to corporate bonds that are downgraded from investment grade to
high yield, is a looming challenge for leveraged credit. The rating agencies are
expected to re-classify billions of dollars of investment-grade corporate credit to
below-investment grade, which may exert upward pressure on high-yield spreads.
Investors are one step ahead of the rating agencies, having already repriced
the investment-grade corporate bond market for potential downgrades last year.
As of the end of the first quarter, $260 billion of investment-grade corporate bonds
(based on par value) in the Barclays Investment-Grade Corporate Bond index
offered yields comparable to BB-rated corporate bonds, the majority in energy
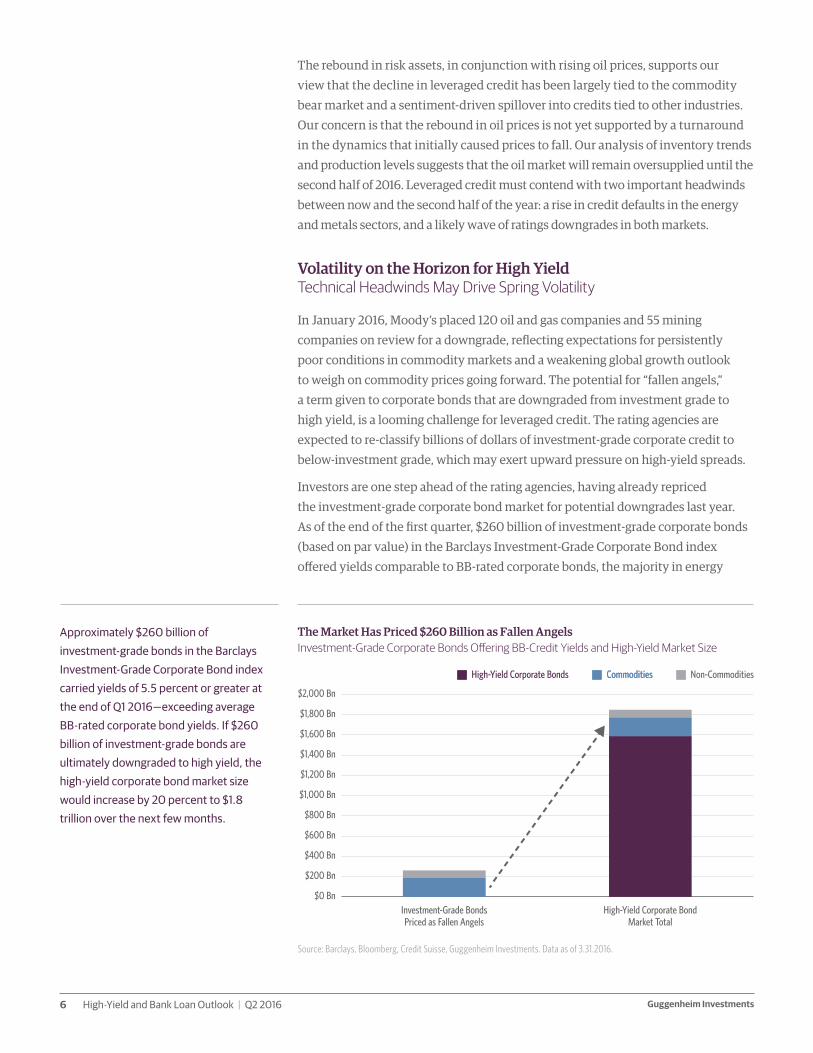
The Market Has Priced $260 Billion as Fallen Angels Investment-Grade Corporate Bonds Offering BB-Credit Yields and High-Yield Market Size
Approximately $260 billion of investment-grade bonds in the Barclays Investment-Grade Corporate Bond index carried yields of 5.5 percent or greater at the end of Q1 2016—exceeding average BB-rated corporate bond yields. If $260 billion of investment-grade bonds are ultimately downgraded to high yield, the high-yield corporate bond market size would increase by 20 percent to $1.8 trillion over the next few months.
Source: Barclays, Bloomberg, Credit Suisse, Guggenheim Investments. Data as of 3.31.2016.
$1,000 Bn
$1,200 Bn
$1,400 Bn
$1,600 Bn
$1,800 Bn
$2,000 Bn
$200 Bn
$0 Bn
$400 Bn
$600 Bn
$800 Bn
Investment-Grade Bonds Priced as Fallen Angels
High-Yield Corporate Bond Market Total
Commodities Non-CommoditiesHigh-Yield Corporate Bonds Commodities
7Guggenheim Investments High-Yield and Bank Loan Outlook | Q2 2016
and basic materials. Of this $260 billion, only $106 billion carry a negative outlook
by either Standard & Poor’s or Moody’s. A downgrade of all $260 billion to sub-
investment grade would increase the overall high-yield corporate bond market
size by 20 percent to $1.8 trillion. Energy would represent the largest sector of the
market, rising from an 11 percent share as of Q1 2016 to 25 percent by our estimates.
The high-yield market will have to weather negative headlines and forced selling
from investors unable to hold below-investment-grade credit.
Our fundamental outlook for bank loans is more positive than for the high-yield
corporate bond market. With only 4.4 percent exposure to energy and metals,
the bank loan market is more insulated from the credit problems plaguing high-
yield corporate bonds. Indeed, the 12-month trailing default rate for institutional
bank loans is 1.4 percent, just half of the 2.8 percent for high-yield bonds. However,
the strong relationship between the two markets weakens our near-term technical
outlook for loans.
As we highlighted in our Q1 report, bank loans trade in sympathy with the high-
yield corporate bond market, which poses a downside risk to loans given our
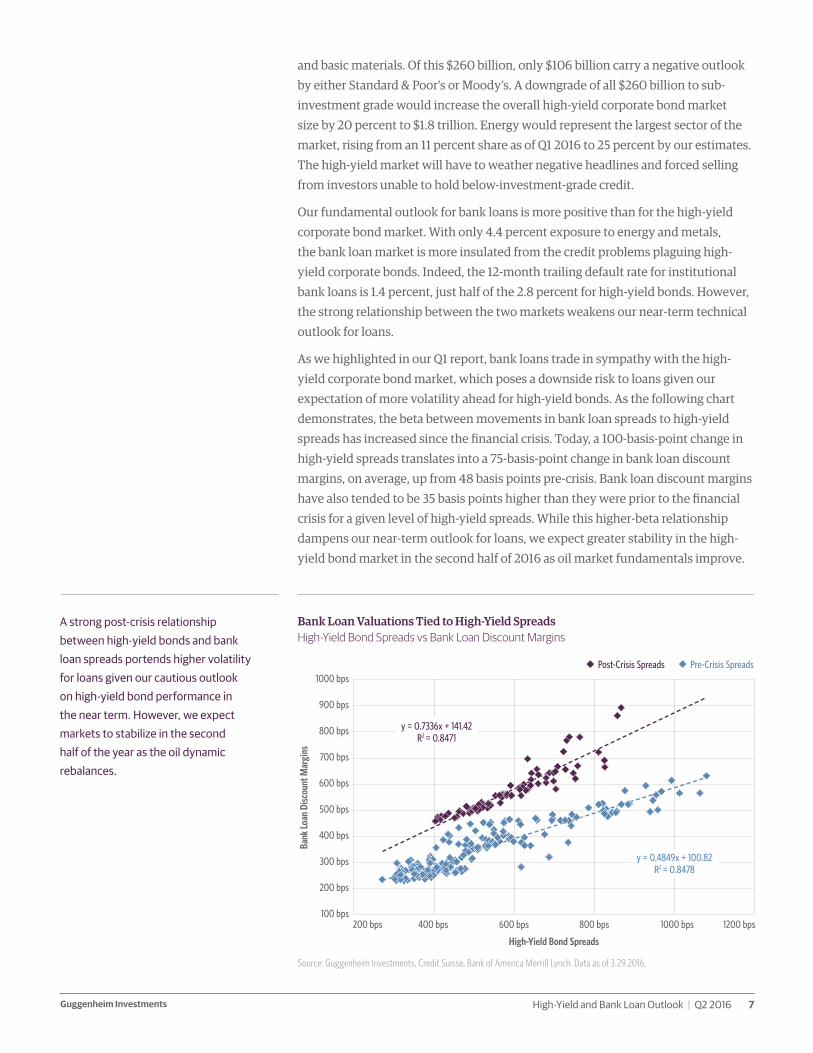
expectation of more volatility ahead for high-yield bonds. As the following chart
demonstrates, the beta between movements in bank loan spreads to high-yield
spreads has increased since the financial crisis. Today, a 100-basis-point change in
high-yield spreads translates into a 75-basis-point change in bank loan discount
margins, on average, up from 48 basis points pre-crisis. Bank loan discount margins
have also tended to be 35 basis points higher than they were prior to the financial
crisis for a given level of high-yield spreads. While this higher-beta relationship
dampens our near-term outlook for loans, we expect greater stability in the high-
yield bond market in the second half of 2016 as oil market fundamentals improve.
Bank Loan Valuations Tied to High-Yield Spreads High-Yield Bond Spreads vs Bank Loan Discount Margins
A strong post-crisis relationship between high-yield bonds and bank loan spreads portends higher volatility for loans given our cautious outlook on high-yield bond performance in the near term. However, we expect markets to stabilize in the second half of the year as the oil dynamic rebalances.
Source: Guggenheim Investments, Credit Suisse, Bank of America Merrill Lynch. Data as of 3.29.2016.
High-Yield Bond Spreads
Bank
Loan
Disc
ount
Mar
gins
1000 bps
900 bps
800 bps
700 bps
600 bps
500 bps
400 bps
300 bps
200 bps
100 bps200 bps 400 bps 600 bps 800 bps 1000 bps 1200 bps
Post-Crisis Spreads Pre-Crisis Spreads
y = 0.4849x + 100.82R2 = 0.8478
y = 0.7336x + 141.42R2 = 0.8471
Guggenheim InvestmentsHigh-Yield and Bank Loan Outlook | Q2 20168
The bank loan market must overcome its own technical headwinds. Collateralized
loan obligations (CLOs) have historically served as a stable source of demand for
loans, but new CLO issuance totaled only $5.4 billion in Q1 2016, well behind the
Q1 2015 total of $31 billion. Amid weak CLO issuance, mutual fund outflows totaled
$7.8 billion for the quarter, bringing net visible flows to -$2.4 billion for Q1 2016.
Slower loan supply growth has helped to offset softer demand from mutual funds
and CLOs, with newly issued institutional loan volumes down 31 percent on a year-
over-year basis through Q1 2016.
Spread volatility in secondary CLOs, particularly at the mezzanine level, is partially
responsible for weakness in the primary CLO market. BBB-rated and BB-rated post-
crisis CLO tranches widened to 711 basis points and 1,196 basis points, respectively,
their widest level since post-crisis CLOs were first created in 2012. In the latter half
of Q1, CLO spreads tightened in sympathy with the broader risk asset rally, thereby
easing primary market conditions for more originations moving forward.
On a more positive note, the decline in the expected future path of the federal
funds rate, based on median FOMC projections, is a credit positive for loans. Lower-
for-longer rates ease credit risk by allowing loan borrowers to continue to service
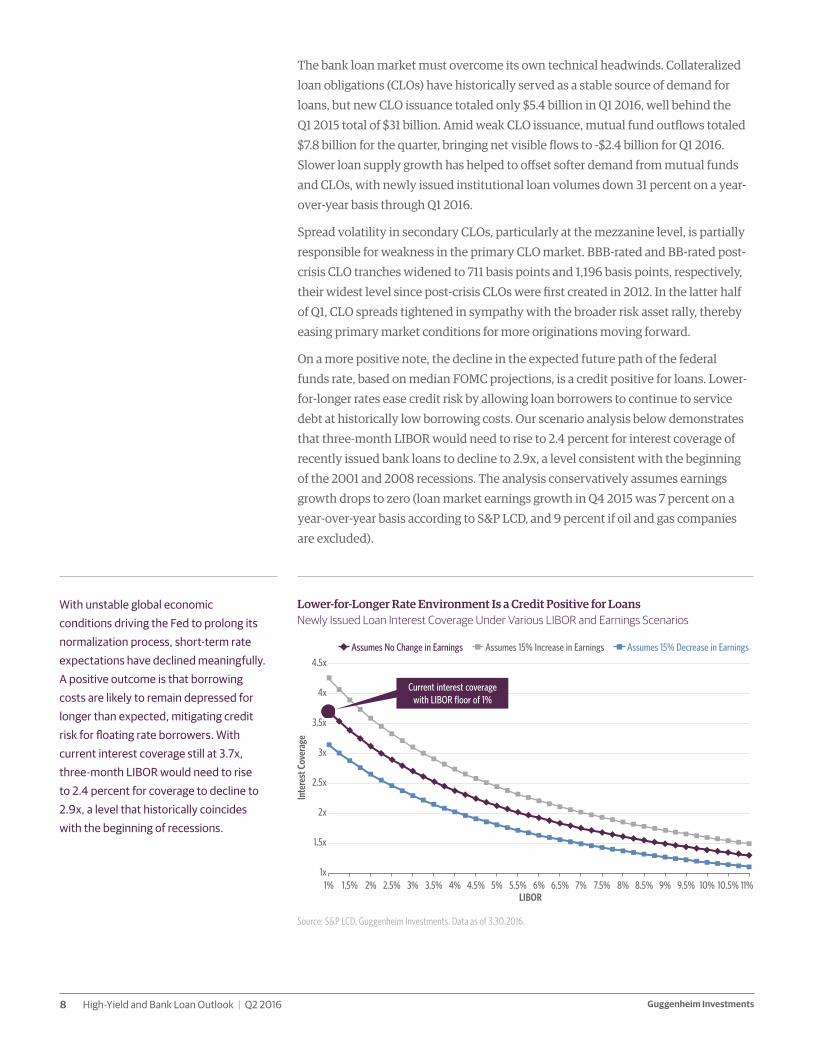
debt at historically low borrowing costs. Our scenario analysis below demonstrates
that three-month LIBOR would need to rise to 2.4 percent for interest coverage of
recently issued bank loans to decline to 2.9x, a level consistent with the beginning
of the 2001 and 2008 recessions. The analysis conservatively assumes earnings
growth drops to zero (loan market earnings growth in Q4 2015 was 7 percent on a
year-over-year basis according to S&P LCD, and 9 percent if oil and gas companies
are excluded).
Lower-for-Longer Rate Environment Is a Credit Positive for Loans Newly Issued Loan Interest Coverage Under Various LIBOR and Earnings Scenarios
With unstable global economic conditions driving the Fed to prolong its normalization process, short-term rate expectations have declined meaningfully. A positive outcome is that borrowing costs are likely to remain depressed for longer than expected, mitigating credit risk for floating rate borrowers. With current interest coverage still at 3.7x, three-month LIBOR would need to rise to 2.4 percent for coverage to decline to 2.9x, a level that historically coincides with the beginning of recessions.
Source: S&P LCD, Guggenheim Investments. Data as of 3.30.2016.
4x
4.5x
3.5x
3x
2.5x
2x
1.5x
1x1% 1.5% 2.5%2% 3% 3.5% 4% 4.5% 5% 5.5% 6% 6.5% 7% 7.5% 8% 8.5% 9% 9.5% 10% 10.5% 11%
Inte
rest
Cov
erag
e
LIBOR
Assumes 15% Decrease in EarningsAssumes 15% Increase in EarningsAssumes No Change in Earnings
Current interest coverage with LIBOR floor of 1%
9Guggenheim Investments High-Yield and Bank Loan Outlook | Q2 2016
Investment ImplicationsStressing High Yield for Financial Crisis Defaults
Our internal model relating high-yield spreads to defaults suggests that spreads
at 914 basis points in February 2016 were consistent with the 12-month trailing
high-yield default rate increasing to 9.5 percent by July 2016. Since their peak in
February, high-yield corporate bond spreads have tightened by 150 basis points
to end the quarter at 764 basis points, while bank loan discount margins have
tightened by 76 basis points to end the quarter at 578 basis points. While renewed
declines in oil prices pose near-term downside risks, we continue to see value in
leveraged credit at these spread levels, which we believe overstate default risks.
To illustrate the attractiveness of leveraged credit, even in a scenario of sharply
higher defaults, we analyzed a hypothetical portfolio of high-yield corporate bonds
beginning on March 31, 2016, and stressed the portfolio for actual credit losses
experienced between 2006 and 2010. The ratings distribution of the hypothetical
portfolio is based on the mix of the Credit Suisse High-Yield Bond index as of the
end of the quarter, and applies the rating mix between 2006 and 2010 beginning
in 2017. Actual credit loss rates are based on Moody’s data.
Assuming no credit losses, our simulated portfolio would generate returns of
8.1 percent annually between 2016 and 2022. Subtracting 2006–2010 weighted
average credit loss rates of approximately 2 percent per year would result in our
hypothetical high-yield portfolio earning 6.1 percent on an annualized basis,
assuming that bonds that do not default are repaid at par. The makeup of a high-
yield portfolio in the later years of the cycle matter significantly. In 2009, BB-rated
bonds suffered credit loss rates of only 1.1 percent, while B-rated bonds and CCC-
rated bonds lost 4.4 percent and 16.5 percent, respectively.
A similar analysis for the loan market produces results that also favor an allocation
to loans. In our loan analysis we shortened the portfolio life to only four years,
given that most loans are typically repriced or refinanced within three to four
years. Based on a four-year yield of 6.6 percent on the Credit Suisse Leveraged Loan
index, and applying credit loss rates of 1.9 percent experienced between 2006 and
2009, loans would produce an annualized return of 4.7 percent, assuming they are
repaid at par. This analysis conservatively assumes coupons remain unchanged.
At current levels, we believe long-term investors willing to hold through the cycle
would continue to benefit from an allocation to leveraged credit. Few other asset
classes offer credit loss-adjusted yields of 4.7–6.1 percent. In the U.S., investment-
grade corporate bonds yield just 3.2 percent, while intermediate Treasurys yield
only 1.3 percent. The spread over other asset classes compensates for higher
liquidity and volatility risk, but we believe these are loss-adjusted premiums
worth capturing in a world devoid of yield.
10Guggenheim Investments High-Yield and Bank Loan Outlook | Q2 2016
Important Notices and Disclosures
INDEX AND OTHER DEFINITIONSThe referenced indices are unmanaged and not available for direct investment. Index performance does not reflect transaction costs, fees or expenses.
The Credit Suisse Leveraged Loan Index tracks the investable market of the U.S. dollar denominated leveraged loan market. It consists of issues rated “5B” or lower, meaning that the highest rated issues included in this index are Moody’s/S&P ratings of Baa1/BB+ or Ba1/ BBB+. All loans are funded term loans with a tenor of at least one year and are made by issuers domiciled in developed countries.
The Credit Suisse High Yield Index is designed to mirror the investable universe of the $US-denominated high yield debt market.
The S&P 500 Index is a capitalization-weighted index of 500 stocks, actively traded in the U.S., designed to measure the performance of the broad economy, representing all major industries.
The Barclays Investment-Grade Corporate Bond Index covers USD-denominated, investment grade, and fixed-rate, taxable securities sold by industrial, utility, and financial issuers.
The Barclays U.S. Aggregate Index represents securities that are SEC-registered, taxable, and dollar denominated. The index covers the U.S. investment grade fixed rate bond market, with index components for government and corporate securities, mortgage pass-through securities, and asset-backed securities.
The BofA Merrill Lynch Core Fixed Rate Preferred Securities Index tracks the performance of fixed rate US dollar denominated preferred securities issued in the US domestic market.
Spread is the difference in yield to a Treasury bond of comparable maturity.
A basis point (bps) is a unit of measure used to describe the percentage change in the value or rate of an instrument. One basis point is equivalent to 0.01%.
Discount margin to maturity (dmm) is the return earned at maturity that is over and above a specific reference rate associated with some type of floating rate security. Discount margin to maturity assumes three year average life. Spreads and discount margin to maturity figures shown throughout this piece are expressed in basis points.
RISK CONSIDERATIONSFixed-income investments are subject to credit, liquidity, interest rate and, depending on the instrument, counter-party risk. These risks may be increased to the extent fixed-income investments are concentrated in any one issuer, industry, region or country. The market value of fixed-income investments generally will fluctuate with, among other things, the financial condition of the obligors on the underlying debt obligations or, with respect to synthetic securities, of the obligors on or issuers of the reference obligations, general economic conditions, the condition of certain financial markets, political events, developments or trends in any particular industry and changes in prevailing interest rates. Investing in bank loans involves particular risks.
Bank loans may become nonperforming or impaired for a variety of reasons. Nonperforming or impaired loans may require substantial workout negotiations or restructuring that may entail, among other things, a substantial reduction in the interest rate and/or a substantial write down of the principal of the loan. In addition, certain bank loans are highly customized and, thus, may not be purchased or sold as easily as publicly-traded securities. Any secondary trading market also may be limited, and there can be no assurance that an adequate degree of liquidity will be maintained. The transferability of certain bank loans may be restricted. Risks associated with bank loans include the fact that prepayments may generally occur at any time without premium or penalty. High-yield debt securities have greater credit and liquidity risk than investment grade obligations.
High-yield debt securities are generally unsecured and may be subordinated to certain other obligations of the issuer thereof. The lower rating of high-yield debt securities and below investment grade loans reflects a greater possibility that adverse changes in the financial condition of an issuer or in general economic conditions, or both, may impair the ability of the issuer thereof to make payments of principal or interest. Securities rated below investment grade are commonly referred to as “junk bonds.” Risks of high-yield debt securities may include (among others): (i) limited liquidity and secondary market support, (ii) substantial market place volatility resulting from changes in prevailing interest rates, (iii) the possibility that earnings of the high-yield debt security issuer may be insufficient to meet its debt service, and (iv) the declining creditworthiness and potential for insolvency of the issuer of such high-yield debt securities during periods of rising interest rates and/ or economic downturn. An economic downturn or an increase in interest rates could severely disrupt the market for high-yield debt securities and adversely affect the value of outstanding high-yield debt securities and the ability of the issuers thereof to repay principal and interest. Issuers of high-yield debt securities may be highly leveraged and may not have available to them more traditional methods of financing.
Past performance is not indicative of future results. There is neither representation nor warranty as to the current accuracy of, nor liability for, decisions based on such information. This article is distributed for informational purposes only and should not be considered as investment advice, a recommendation of any particular security, strategy or investment product, or as an offer of solicitation with respect to the purchase or sale of any investment.
This article should not be considered research nor is the article intended to provide a sufficient basis on which to make an investment decision. The article contains opinions of the author but not necessarily those of Guggenheim Partners, LLC, its subsidiaries, or its affiliates. Although the information presented herein has been obtained from and is based upon sources Guggenheim Partners, LLC, believes to be reliable, no representation or warranty, express or implied, is made as to the accuracy or completeness of that information. The author’s opinions are subject to change without notice. Forward-looking statements, estimates, and certain information contained herein are based upon proprietary and non-proprietary research and other sources. Information contained herein has been obtained from sources believed to be reliable but is not guaranteed as to accuracy.
This article may be provided to certain investors by FINRA licensed broker-dealers affiliated with Guggenheim Partners, LLC. Such broker-dealers may have positions in financial instruments mentioned in the article, may have acquired such positions at prices no longer available, and may make recommendations different from or adverse to the interests of the recipient. The value of any financial instruments or markets mentioned in the article can fall, as well as rise. Securities mentioned are for illustrative purposes only and are neither a recommendation nor an endorsement. Individuals and institutions outside of the United States are subject to securities and tax regulations within their applicable jurisdictions and should consult with their advisors as appropriate.
Guggenheim Funds Distributors, LLC, Member FINRA/SIPC, is an affiliate of Guggenheim Partners, LLC.1Guggenheim Investments total asset figure is as of 12.31.2015. The assets include leverage of $11.8bn for assets under management and $0.5bn for assets for which we provide administrative services. Guggenheim Investments represents the following affiliated investment management businesses: Guggenheim Partners Investment Management, LLC, Security Investors, LLC, Guggenheim Funds Investment Advisors, LLC, Guggenheim Funds Distributors, LLC, Guggenheim Real Estate, LLC, Transparent Value Advisors, LLC, GS GAMMA Advisors, LLC, Guggenheim Partners Europe Limited and Guggenheim Partners India Management.2Guggenheim Partners’ assets under management are as of 12.31.2015 and include consulting services for clients whose assets are valued at approximately $47bn.
Whilst this document may be issued outside the United Kingdom directly by Guggenheim Partners Investment Management, LLC, which is responsible for its contents, wherever issued, it is being issued inside and outside the United Kingdom by Guggenheim Investment Advisors (Europe) Limited (which is authorized and regulated by the Financial Conduct Authority (“FCA”) only to and/or is directed only at persons who are professional clients or eligible counterparties for the purposes of the FCA’s Conduct of Business Sourcebook.
Applicable to Middle East Investors: Contents of this report prepared by Guggenheim Partners Investment Management, LLC, Transparent Value Advisors, LLC and Guggenheim Partners Europe Limited, all registered entities in their respective jurisdictions, and affiliates of Guggenheim KBBO Partners Limited, the Authorised Firm regulated by the Dubai Financial Services Authority. This report is intended for qualified investor use only as defined in the DFSA Conduct of Business Module.
©2016, Guggenheim Partners, LLC. No part of this article may be reproduced in any form, or referred to in any other publication, without express written permission of Guggenheim Partners, LLC.
Guggenheim Funds Distributors, LLC is an affiliate of Guggenheim Partners, LLC and Guggenheim Investments. For information, call 800.345.7999 or 800.820.0888.
GPIM22160

Contact us
New York
330 Madison Avenue New York, NY 10017 212 739 0700
Chicago
227 W Monroe Street Chicago, IL 60606 312 827 0100
Santa Monica
100 Wilshire Boulevard Santa Monica, CA 90401 310 576 1270
London
5th Floor, The Peak 5 Wilton Road London, SW1V 1LG +44 20 3059 6600
About Guggenheim InvestmentsGuggenheim Investments is the global asset management and investment advisory
division of Guggenheim Partners, with $199 billion1 in total assets across fixed
income, equity, and alternative strategies. We focus on the return and risk needs
of insurance companies, corporate and public pension funds, sovereign wealth
funds, endowments and foundations, consultants, wealth managers, and high-net-
worth investors. Our 275+ investment professionals perform rigorous research to
understand market trends and identify undervalued opportunities in areas that are
often complex and underfollowed. This approach to investment management has
enabled us to deliver innovative strategies providing diversification opportunities
and attractive long-term results.
About Guggenheim PartnersGuggenheim Partners is a global investment and advisory firm with more than
$240 billion2 in assets under management. Across our three primary businesses
of investment management, investment banking, and insurance services, we have
a track record of delivering results through innovative solutions. With 2,500
professionals based in more than 25 offices around the world, our commitment
is to advance the strategic interests of our clients and to deliver long-term results
with excellence and integrity. We invite you to learn more about our expertise
and values by visiting GuggenheimPartners.com and following us on Twitter at
twitter.com/guggenheimptnrs.