high through-put analysis of contaminants in drinking ... · flexcube autosampler with 900ul ......
TRANSCRIPT

High Through-put Analysis of Contaminants in Drinking Water or Surface Water with Integrated Sample Clean-up and Spectral Confirmation
Julie Marr, Ph.D.Agilent Technologies

For water screening and quantitation in the 10 ppt range usually requires solid phase extraction (SPE) to preconcentrate the target compounds in the sample solution
Page 3
100 mL water sample
1 mLorganic extract
Injection volume:10 µL
10 ng/L 1 ug/L 10 pg o.c.
Typical sample preparation for water
2

Solid Phase Extraction (SPE)
• 1-5 liters transported to the lab
• Trace enrich onto a cartridge or disk
• Elute with few mLs solvent, dry, reconstitute
• Amenable LC, % organic solvent
• 1-5 mL eluent loaded into autosampler vial
• 2-20 uL injected, HPLC with UV/MS detection
3

Solid Phase Extraction (SPE)
Approaches: 1. Automate SPE in LCMS workflow 2. Bypass SPE and direct injection-both reduce sample size and solvent volumes.
4

Agenda
• Instrumentation and system configurations
• Method comparison• Direct injection (Agilent 6490 QQQ)
• Online SPE (Agilent 6460 QQQ)
• Spectral Confirmation
• Conclusion
5

Triple Quadrupoles from Agilent
6460 Triple Quad
6430 Triple Quad
6420 Triple Quad
6490 Triple Quad
6460 Triple Quad
Perf
orm
ance
6420 Triple Quad
Dynamic MRM
MRM TriggeredMRM
Triple Quad MRMAcquisition
DataDependent
6

Agilent Jet Stream
7

Page 8
QQQ Analyte Optimization:2 key settings.Fragmentor Voltage Collision Energy

Experiment
• 28 pesticides spiked into samples of drinking water, ground water and surface water (Part of a round robin from German government)
• Analyzed via direct injection with Agilent 6490 QQQ
• Analyzed via on-line SPE with Agilent 6460 QQQ with Flex cube
9

Instrumentation and system configurationDirect injection
10
• G6490A QQQ mass spectrometer with Agilent Jet
Stream ionization source and dual ion funnel ion optics
• Dynamic MRM acquisition
• Infinity 1290 UHPLC system consisting of G4220A
binary pump, G4226A High Performance sampler
equipped with G4216A 1290 large volume injection kit,
G1316C column compartment
• Zorbax Eclipse Plus C-18 RRHD, 100 x 2.1 mm, 1.8
µm
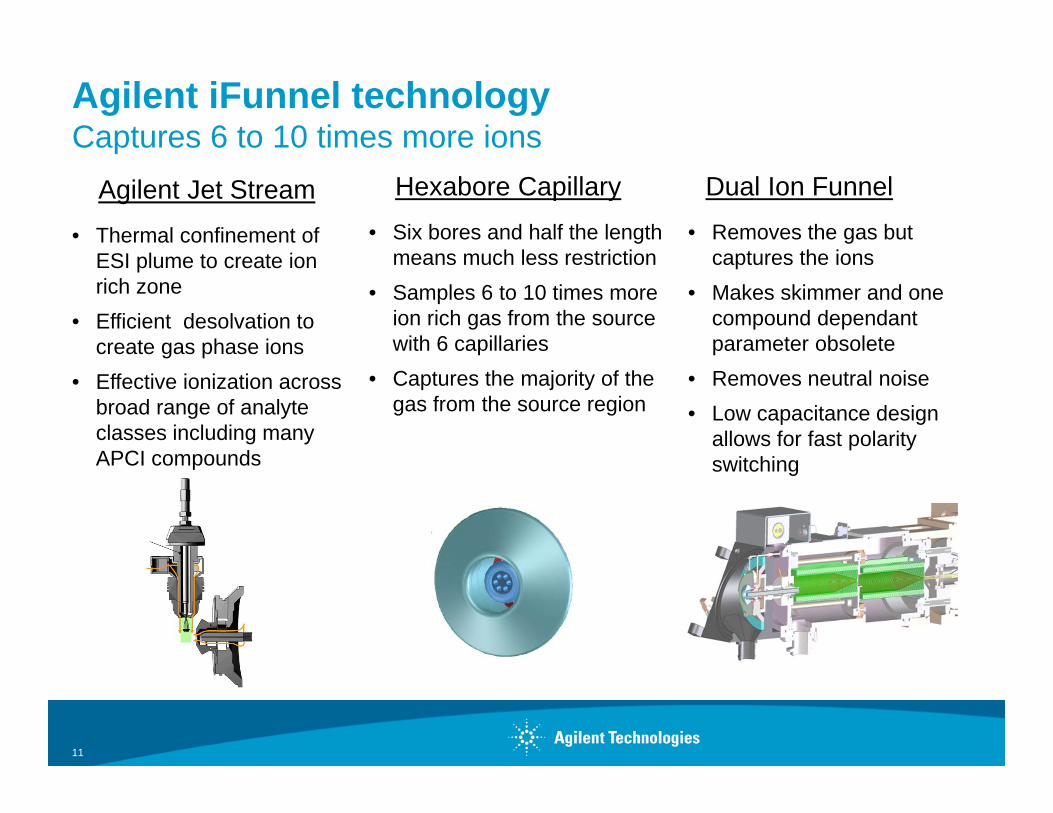
Agilent iFunnel technologyCaptures 6 to 10 times more ions
Agilent Jet Stream• Thermal confinement of
ESI plume to create ionrich zone
• Efficient desolvation to create gas phase ions
• Effective ionization across broad range of analyte classes including many APCI compounds
11
Hexabore Capillary• Six bores and half the length
means much less restriction• Samples 6 to 10 times more
ion rich gas from the source with 6 capillaries
• Captures the majority of the gas from the source region
Dual Ion Funnel• Removes the gas but
captures the ions• Makes skimmer and one
compound dependant parameter obsolete
• Removes neutral noise• Low capacitance design
allows for fast polarity switching

Instrumentation and system configurationOnline SPE
12
• G6460A QQQ mass spectrometer with Agilent Jet
Stream ionization source
• Dynamic MRM acquisition
• Infinity HPLC system consisting of G1312B
binary pump, G1329B autosampler with 900 µL
sample head, G4227A Flexible Cube with two
G4232B 2-position/10-port valves, G1316C
column compartment
• 2 x PLRP-S cartridges, 12.5 x 2.1 mm in Guard
Column Hardware Kit for trapping
• Zorbax Eclipse Plus C-18, 150 x 2.1 mm, 3.5 µm

Online SPE with the Flex Cube
Flexcube
Autosampler with 900uL loop and extension seat capillary
1290 Binary Pump
1290 Autosampler
Column Compartment
6460 QQQ
13

Instrumentation and system configurationG4227A Flexible Cube
14
Figure 1) The Agilent 1290 Infinity Flexible Cube is an additional module to the 1290/1260 Infinity LC system hosting up to two 1200 Infinity Series Quick-Change valves.
Quick-Change valve 1 and 2Solvent selection valve(3 wash solvents)
Reciprocating single-piston pump (4 ml/min, 60 bar)Rail for additional valves

Stages in operation for ON-Line SPE LC/MS
1. Load water sample (0.5 to 2.3 ml) on the enrichment cartridge.
2. Valve switch, ‘backflush‘ desorb using hplc gradient.
3. Separate on the analytical column and collect MRM tranistions on the QQQ.
4. Condition the second enrichment cartridge using the flexcube pump during analysis.
5. Ready for next sample after ~ 22 minutes.
15
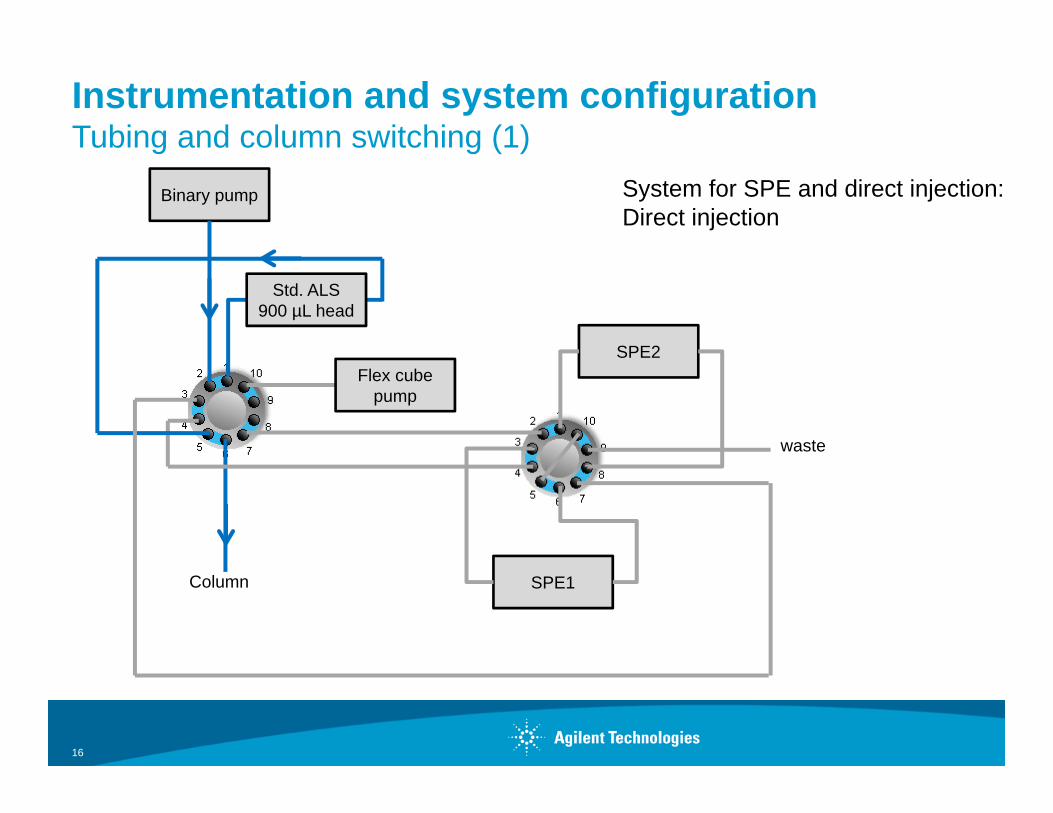
Instrumentation and system configurationTubing and column switching (1)
16
Binary pump
Column
Flex cube pump
SPE2
SPE1
System for SPE and direct injection:Direct injection
Std. ALS 900 µL head
waste

Instrumentation and system configurationTubing and column switching (2)
17
System for SPE and direct injection:Load with FlexCube on SPE1
Binary pump
Column
Flex cube pump
SPE2
SPE1
Std. ALS 900 µL head
waste
Load

Instrumentation and system configurationTubing and column switching (3)
18
System for SPE and direct injection:Elute and analyze from SPE1,load on SPE2
Binary Pump
Column
Flex cube pump
SPE2
SPE1
Std. ALS 900 µL head
waste
Load
Elute

LCMS method comparisonDirect injection method
19
Parameter Values
Injection volume: 100 µl
Gradient program: 0.00 min – 2% B1.00 min – 2% B2.00 min – 25% B13.0 min – 100% B15.0 min – 100% B15.1 min – 2 % BPost time: 2 min
Mobile phase: 5 mM ammonium formate in water (A) and methanol (B)
MS parameters: 28 compounds with 2 transitions for each compoundDynamic MRM acquisition, Minimum Dwell time 20 ms
Spray chamber conditions:
Gas temp.: 120°CDry gas: 14 l/minNebulizer: 35 psiSheath gas temp: 350°CSheath gas flow: 12 l/minCapVoltage: 3000 VNozzle voltage 300 V
Calibration: External calibration in drinking water(1 – 5 –) 10 – 20 – 50 – 100 – 200 – 500 – 1000 ng/L; QC 100 ng/L
Sample pretreatment: Samples were centrifuged for 5 min @ 15,000rpm

LCMS method comparisonOnline SPE method
20
Parameter Values
Injection volume: 900 µl
Gradient program: 0.00 min – 2% B2.00 min – 2% B2.50 min – 25% B12.0 min – 100% B22.0 min – 100% B22.1 min – 2 % BPost time: 10 min
Loading:
0.00 min – Pump 60 s, flow 1 mL/min, Channel A1 (water)2.00 min – Switch Valve2.10 min – Pump 180 s, flow 1.5 mL/min, Channel A2 (acetonitrile)6.00 min – Pump 300 s, flow 1.5 mL/min, Channel A1 (water)
Mobile phase: 0.01% formic acid and 5 mM ammonium formate in water (A) and methanol (B)
MS parameters: 28 compounds with 2 transitions for each compoundDynamic MRM acquisition, Minimum Dwell time 17.5 ms
Spray chamber conditions:
Gas temp.: 260°CDry gas: 9 l/minNebulizer: 45 psiSheath gas temp: 300°CSheath gas flow: 12 l/minCapVoltage: 3500 VNozzle voltage 500 V
Calibration: External calibration in drinking water10 – 25 – 50 – 100 – 200 – 500 ng/L; QC 100 ng/L
Sample pretreatment: Samples were centrifuged for 5 min @ 15,000rpm

Results direct injectionMRM traces for target compounds
21
4x10
0
0.5
1
1.5
2
2.5
3
3.5
4
4.5
5
5.5
6
6.5
7
7.5
8
8.5
Cpd 28: Pendimethalin: +ESI MRM Frag=380.0V CF=0.000 DF=0.000 [email protected] (282.2000 -> 211.9000) Cal_2-r001.d
9.270382985
10.887170583
11.719174139
9.965156322
9.63894213
4.19666735 5.415
563237.14955880
12.22343112 13.468
341538.710287885.828
214803.3109546
8.1934158
1 1
Counts vs. Acquisition Time (min)2.5 3 3.5 4 4.5 5 5.5 6 6.5 7 7.5 8 8.5 9 9.5 10 10.5 11 11.5 12 12.5 13 13.5 14
Chl
orid
azon
-des
phen
yl
Chl
orid
azon
-met
hyl-d
esph
enyl
2,6-
Dic
hlor
oben
zam
ide
Dei
sopr
opyl
atra
zine
Met
amitr
onC
hlor
idaz
onD
eset
hyla
trazi
ne
Sim
azin
e/M
etrib
uzin
/Bro
mac
ilD
eset
hylte
rbut
ylaz
ine
Carbamazepine
Chl
orot
olur
one
Atra
zine
/Met
azac
hlor
Isop
rotu
ron/
Met
alax
yl/L
enac
ilD
iuro
n
Eth
ofum
esat
Terb
utyl
azin
e/B
osca
lid
Ala
chlo
r/Met
olac
hlor
Chl
orve
nfin
phos
Chl
orpy
rifos
/Qui
noxy
fen/
Pen
dim
etha
lin

Acquisition Time (min)11.4 11.6 11.8 12 12.2 12.4 12.6 12.8 13
Cou
nts 3x10
0
0.1
0.2
0.3
0.4
0.5
0.6
0.7
0.8
0.9
1
1.1
359.0 -> 98.9 , 359.0 -> 155.1
Ratio = 95.2 (100.7 %)
Chlorfenvinphos - 7 Levels, 7 Levels Used, 14 Points, 14 Points Used, 3 QCs
Concentration (ng/L)-50 0 50 100 150 200 250 300 350 400 450 500 550 600 650 700 750 800 850 900 950 1000 1050
Res
pons
es 6x10
-0.05
00.05
0.1
0.150.2
0.250.3
0.35
0.40.45
0.50.55
0.6
0.650.7
0.750.8
0.85
0.90.95
y = 916.360832 * x + 1694.987087R^2 = 0.99986274Type:Linear, Origin:Blank offset, Weight:None
Results direct injectionChlorfenvinphos (RT 12.2 min)
22
1, 5, 10, 50, 100, 500, 1000 ng/l – 7 level
5 ng/L in tap water

4x10
0
0.1
0.2
0.3
0.4
0.5
0.6
0.7
0.8
0.9
1
1.1
1.2
1.3
1.4
1.5
1.6
1.7
1.8
1.9
2
Cpd 1: Chloridazon desphenyl: +ESI MRM Frag=105.0V CF=0.000 DF=0.000 [email protected] (146.0000 -> 117.0000) 50ppt_2.d
8.954128263
7.94666631 9.544
93936 11.16784154
10.07240659
6.69912654
5.4734880
6.0923573 10.684
426713.5503158
11.745866
4.63472
Counts vs. Acquisition Time (min)4.5 5 5.5 6 6.5 7 7.5 8 8.5 9 9.5 10 10.5 11 11.5 12 12.5 13 13.5 14 14.5 15
Results Online-SPEMRM traces for target compounds
23
Chl
orid
azon
-des
phen
yl
Chl
orid
azon
-met
hyl-d
esph
enyl
2,6-
Dic
hlor
oben
zam
ide
Dei
sopr
opyl
atra
zine
Met
amitr
onC
hlor
idaz
on/D
eset
hyla
trazi
ne
Des
ethy
lterb
utyl
azin
e/Le
naci
lM
etrib
uzin
Chl
orot
olur
one
Atrazine/Metalaxyl/Isoproturon
Diu
ron
Eth
ofum
esat
Terb
utyl
azin
e
Ala
chlo
r/Met
olac
hlor
Chl
orve
nfin
phos
Chl
orpy
rifos
/Pen
dim
etha
lin
Bro
mac
ilC
arba
maz
epin
e/S
imaz
in
Met
azac
hlor
Bos
calid
Qui
noxy
fen

Chlorphenvinphos - 6 Levels, 6 Levels Used, 6 Points, 6 Points Used, 2 QCs
Concentration (ng/ml)-40 -20 0 20 40 60 80 100 120 140 160 180 200 220 240 260 280 300 320 340 360 380 400 420 440 460 480 500 520 540
5x10
-0.1
0
0.1
0.2
0.3
0.4
0.5
0.6
0.7
0.8
0.9
1
1.1
1.2
y = 238.605692 * xR^2 = 0.99983783Type:Linear, Origin:Force, Weight:None
Results Online-SPEChlorfenvinphos (RT 11.3 min)
24
10, 20, 50, 100, 200, 500 ng/l – 6 level

Direct injection (6490 QQQ) vs Online SPE Sample 1 (6460 QQQ) (Tap water)
Average SD Reference AccuracyChloridazon-desphenyl 0.05Chloridazon-methyldesphenyl 0.0889 ± 0.0039 0.08 111.12,6-Dichlorbenzamid 0.0502 ± 0.0025 0.05 100.5Atrazin-desisopropyl 0.1116 ± 0.0019 0.1 111.6Metamitron 0.0921 ± 0.0017 0.08 115.1Chloridazon 0.0975 ± 0.0011 0.1 97.5Atrazin-desethyl 0.0530 ± 0.0005 0.05 106.0Metribuzin 0.0920 ± 0.0018 0.08 115.0Bromacil 0.1292 ± 0.0026 0.1 129.2Simazin 0.0903 ± 0.0014 0.08 112.9Carbamazepin 0.1063 ± 0.0004 0.1 106.3Terbuthylazin-desethyl 0.0581 ± 0.0005 0.05 116.2Chlortoluron 0.0907 ± 0.0008 0.08 113.3Metazachlor 0.0954 ± 0.0003 0.08 119.3Metalaxyl 0.0558 ± 0.0006 0.05 111.7Atrazin 0.1043 ± 0.0017 0.08 130.4Lenacil 0.0554 ± 0.0006 0.05 110.8Isoproturon 0.1390 ± 0.0012 0.12 115.9Diuron 0.0948 ± 0.0008 0.08 118.5Ethofumesat 0.1044 ± 0.0071 0.1 104.4Boscalid 0.0972 ± 0.0010 0.08 121.5Terbuthylazin 0.1274 ± 0.0007 0.1 127.4Alachlor 0.0959 ± 0.0005 0.08 119.8Metolachlor 0.0919 ± 0.0003 0.08 114.9Chlorfenvinphos 0.0621 ± 0.0008 0.05 124.1Chlorpyrifos 0.0424 ± 0.0029 0.12 35.3Quinoxyfen 0.0767 ± 0.0068 0.08 95.8Pendimethalin 0.1390 ± 0.0120 0.1 139.0
Average SD Reference AccuracyChloridazon-desphenyl 0.0478 ± 0.0004 0.05 95.5Chloridazon-methyldesphenyl 0.0773 ± 0.0003 0.08 96.62,6-Dichlorbenzamid 0.0459 ± 0.0002 0.05 91.8Atrazin-desisopropyl 0.1037 ± 0.0004 0.1 103.7Metamitron 0.0834 ± 0.0013 0.08 104.2Chloridazon 0.0996 ± 0.0005 0.1 99.6Atrazin-desethyl 0.0524 ± 0.0003 0.05 104.9Metribuzin 0.0799 ± 0.0004 0.08 99.9Bromacil 0.1043 ± 0.0015 0.1 104.3Simazin 0.0788 ± 0.0012 0.08 98.5Carbamazepin 0.0973 ± 0.0008 0.1 97.3Terbuthylazin-desethyl 0.0527 ± 0.0009 0.05 105.3Chlortoluron 0.0794 ± 0.0016 0.08 99.2Metazachlor 0.0818 ± 0.0008 0.08 102.3Metalaxyl 0.0475 ± 0.0007 0.05 95.0Atrazin 0.0874 ± 0.0013 0.08 109.3Lenacil 0.0515 ± 0.0010 0.05 102.9Isoproturon 0.1256 ± 0.0015 0.12 104.6Diuron 0.0816 ± 0.0014 0.08 102.0Ethofumesat 0.0997 ± 0.0018 0.1 99.7Boscalid 0.0750 ± 0.0003 0.08 93.8Terbuthylazin 0.1105 ± 0.0021 0.1 110.5Alachlor 0.0731 ± 0.0010 0.08 91.4Metolachlor 0.0744 ± 0.0003 0.08 92.9Chlorfenvinphos 0.0338 ± 0.0006 0.05 67.6Chlorpyrifos 0.0379 ± 0.0015 0.12 31.6Quinoxyfen 0.0507 ± 0.0012 0.08 63.4Pendimethalin 0.0716 ± 0.0018 0.1 71.6

Direct injection (6490 QQQ) vs Online SPE (6460 QQQ) Sample 3 (Surface water)
Average SD Reference AccuracyChloridazon-desphenyl 0.2317 ± 0.0013 0.182 127.3Chloridazon-methyldesphenyl 0.2868 ± 0.0019 0.319 89.92,6-Dichlorbenzamid 0.0914 ± 0.0005 0.1 91.4Atrazin-desisopropyl 0.1407 ± 0.0013 0.16 87.9Metamitron 0.0432 ± 0.0002 0.05 86.5Chloridazon 0.0446 ± 0.0004 0.05 89.2Atrazin-desethyl 0.0963 ± 0.0010 0.1 96.3Metribuzin 0.1681 ± 0.0023 0.18 93.4Bromacil 0.0462 ± 0.0004 0.05 92.4Simazin 0.1460 ± 0.0030 0.16 91.2Carbamazepin 0.1259 ± 0.0015 0.137 91.9Terbuthylazin-desethyl 0.0789 ± 0.0009 0.08 98.7Chlortoluron 0.0629 ± 0.0008 0.068 92.5Metazachlor 0.1672 ± 0.0017 0.16 104.5Metalaxyl 0.0940 ± 0.0006 0.1 94.0Atrazin 0.3033 ± 0.0034 0.3 101.1Lenacil 0.1758 ± 0.0018 0.18 97.7Isoproturon 0.1128 ± 0.0013 0.117 96.4Diuron 0.2940 ± 0.0025 0.3 98.0Ethofumesat 0.0468 ± 0.0007 0.05 93.7Boscalid 0.1477 ± 0.0011 0.16 92.3Terbuthylazin 0.0530 ± 0.0002 0.05 106.0Alachlor 0.2836 ± 0.0030 0.3 94.5Metolachlor 0.0468 ± 0.0004 0.05 93.6Chlorfenvinphos 0.1293 ± 0.0012 0.16 80.8Chlorpyrifos 0.0596 ± 0.0005 0.1 59.6Quinoxyfen 0.0487 ± 0.0009 0.1 48.7Pendimethalin 0.1024 ± 0.0006 0.16 64.0
Average SD Reference AccuracyChloridazon-desphenyl 0.182Chloridazon-methyldesphenyl 0.2767 ± 0.0104 0.319 86.72,6-Dichlorbenzamid 0.1089 ± 0.0036 0.1 108.9Atrazin-desisopropyl 0.1673 ± 0.0015 0.16 104.6Metamitron 0.0509 ± 0.0011 0.05 101.9Chloridazon 0.0471 ± 0.0009 0.05 94.2Atrazin-desethyl 0.1322 ± 0.0024 0.1 132.2Metribuzin 0.1845 ± 0.0029 0.18 102.5Bromacil 0.0550 ± 0.0029 0.05 110.0Simazin 0.1704 ± 0.0034 0.16 106.5Carbamazepin 0.1653 ± 0.0019 0.137 120.7Terbuthylazin-desethyl 0.0917 ± 0.0019 0.08 114.6Chlortoluron 0.0745 ± 0.0004 0.068 109.6Metazachlor 0.2108 ± 0.0024 0.16 131.7Metalaxyl 0.1147 ± 0.0014 0.1 114.7Atrazin 0.3506 ± 0.0036 0.3 116.9Lenacil 0.1791 ± 0.0020 0.18 99.5Isoproturon 0.1300 ± 0.0011 0.117 111.1Diuron 0.3598 ± 0.0037 0.3 119.9Ethofumesat 0.0562 ± 0.0067 0.05 112.4Boscalid 0.1914 ± 0.0029 0.16 119.6Terbuthylazin 0.0636 ± 0.0005 0.05 127.1Alachlor 0.3727 ± 0.0054 0.3 124.2Metolachlor 0.0600 ± 0.0007 0.05 120.1Chlorfenvinphos 0.1956 ± 0.0029 0.16 122.2Chlorpyrifos 0.0938 ± 0.0018 0.1 93.8Quinoxyfen 0.0591 ± 0.0028 0.1 59.1Pendimethalin 0.1389 ± 0.0030 0.16 86.8

Results direct injectionQC samples (100 ng/L)
28
Chlorpyrifos
Chlorfenvinphos

Results direct injectionQC samples (100 ng/L)
29
Pendimethalin
Quinoxyfen

Spectral Confirmation: triggered MRM (tMRM)Quantitation with Confirmation: Fingerprinting
30
Full Scan Approach:Scan the entire fingerprint
tMRM Approach:Focus on known fingerprint features
Two possible scenarios:
- Confirmation of positive findings with additional information (spectral matching)
- Elimination of potential false detects caused by matrix interferences

tMRM Scanning
31
0 0.5 1.0 1.5 2.0 2.5 3.0 3.5 4.0 4.5 5.0
tMRM Scan < 50ms
Acquisition Time (seconds)
tMRM Scans
Ideal situation: 1 Peak 5 sec wide, no Matrix
UHPLC compatible, good peak shape, good quantitation
Trigger tMRM

32
Triggered MRM (tMRM) Analysis
Threshold
Secondary MRM Transitions are “Triggered”
Primary cycle (below threshold)
Triggered cycle (above threshold)
Compound Precursor Product
Analyte 1 334.0 145.0
Analyte 1 334.0 117.0
Compound Precursor Product
Analyte 1 334.0 145.0
Analyte 1 334.0 117.0
Analyte 1 334.0 132.1
Analyte 1 334.0 105.1
Analyte 1 334.0 91.1
Analyte 1 334.0 76.0
Analyte 1 334.0 119.0

33
tMRM Product Ion Spectrum
x103
876543210
80 100 120 140 160 180 200 220 240 260 280 300 320 340
334.2171.1
145.0
132.1
117.0
105.191.176.0
tMRM Product Ion Spectrum
x103
876543210
80
76.0
x103
876543210 80 100
91.1
x103
876543210 80 100 120
105.1
x103
876543210 80 100 120
117.0
x103
876543210 100 140
132.1
x103
876543210 80 100 120
119.0
x103
876543210 100 140 180
145.0 x10³
876543210 100 140 180
147.0
x103
876543210 80 100 120 140 160 180
171.1
334 > 76 334 > 91 334 > 105 334 > 117 334 > 119
334 > 132 334 > 145 334 > 147 334 > 171

Real samples – Tebuthiuron in chamomile extract
34
Reference spectrum
Acquisition Time (min)9.2 9.3 9.4 9.5 9.6 9.7 9.8 9.9 10
Cou
nts 4x10
0
0.5
1
1.5
2
2.5
3
3.5
4
229.1 -> 172.1 , 229.1 -> 116.0
Ratio = 40.3 (204.3 %)
+ MRM (9.667-9.748 min, 7 scans) (229.1 -> **) Blan…
Mass-to-Charge (m/z)50 75 100 125 150 175 200 225
3x10
-1.4
-1.2
-1
-0.8
-0.6
-0.4
-0.2
0
0.2
0.4
0.6
0.8
1
1.2
172.1
172.1
157.1
116.0
62.0 116.089.1157.1
57.1229.1
Lib Match Score=68.4

Real samples – Tebuthiuron in chamomile extract
35
Reference spectrum
Acquisition Time (min)9 9.1 9.2 9.3 9.4 9.5 9.6 9.7 9.8
Cou
nts 4x10
-0.2
0
0.2
0.4
0.6
0.8
1
1.2
1.4
1.6
1.8
2
2.2
229.1 -> 172.1 , 229.1 -> 116.0
Ratio = 19.8 (100.6 %)
+ MRM (9.309-9.387 min, 6 scans) (229.1 -> **) 10n…
Mass-to-Charge (m/z)50 75 100 125 150 175 200 225
3x10
-1.4
-1.2
-1
-0.8
-0.6
-0.4
-0.2
0
0.2
0.4
0.6
0.8
1
1.2
172.1
172.1
62.0
62.0 116.0
116.089.1
89.1
157.1
157.1
229.1
Lib Match Score=100.0

Agilent MassHunter Software
36
Instrument Control
Real-time monitoring
Method set-up
Autotune
Qualitative Analysis
Chromatographic results
Spectral results
Find compounds
Quantitative Analysis
User filters
Compound results
Calibration curve
Reporting Easily Customisable
Based on Excel and XML technology

37
MassHunter Quantitative Software Batch-at-a-Glance
target compound 'spectrum' calibration curveoverlaid quantifier and qualifier EICs

Conclusions• Direct injection resulted in good sensitivity and reproducibility for all
compounds (LLOQ at or below 5 ng/L).
• Accuracy of most compounds within acceptable limits (± 20 %) except for the four most lipophilic compounds
• For these compounds successive loss in signal has been observed for the QC samples, indicating the adsorption of the compounds to the sample vials.
• Even for surface water no significant matrix effect has been observed.
• For Online-SPE all compounds except Chloridazon-desphenyl could be analyzed with acceptable recoveries
• Linear calibrations and good sensitivity has been observed for most compounds
• Accuracy for most compounds within acceptable limits (± 20 %) with slightly higher RSD values and deviations compared to the direct injection method.
• No systematic errors were observed eventually due to the use of silanized sample vials
Page 38