high-speed rail system noise assessmentonlinepubs.trb.org/onlinepubs/trr/1990/1255/1255-014.pdf ·...
TRANSCRIPT

TRANSPORTATION RESEARCH RECORD 1255 119
High-Speed Rail System Noise Assessment
CARLE. HANSON
This high-speed rail system noise assessment is in two parts: (a) a noise assessment procedure for the environmental impact analysis of high-speed rail systems and (b) a discussion of the noise characteristics of high-speed trains, including conventional steel wheel and steel rail trains and magnetically levitated (maglev) trains. Aerodynamic noise dominates the wayside noise levels at speeds above 150 mph. The result is that maglev and conventional tracked trains can have similar noise levels at high speeds. A procedure for estimating noise impact corridors for high-speed rail is used in an example.
The general environmental assessment procedure for new transportation projects and some of the noise information from high-speed rail systems that can be used for impact assessment purposes are described. The noise assessment procedure for high-speed rail (HSR), or any other rail project, has not been specified by any agency. UMTA is currently developing noise and vibration impact procedures to be applied to urban transit projects. A similar approach is proposed to be applied to HSR. Included in this paper are data on noise generated by operation of high-speed trains; the surprising result is that noise from maglev systems seems to be the same as that from conventional rail systems at high speeds.
PROJECT PHASE
The noise analysis is done in stages as a major project develops. At an early stage when alternatives are being analyzed, a more general treatment of the noise impacts is appropriate. Corridor screening can be used to identify potential problem areas and to contribute to a comparison of alternatives on an equal basis, with the use of simple screening distances and land use maps. Later, after alternatives have been defined, the noise analysis will focus on site-specific impacts. General assessment, the next refinement, is performed using the level of detail associated with preliminary engineering and the draft environmental impact statement (DEIS). At this intermediate stage, problem areas are identified before the final operational details are known. Detailed calculations are needed in the final design and for the final environmental impact statement (FEIS), when complete operational details and site details are known. This paper provides general information that could be used directly in the first step, corridor screening, and as background information in the more detailed stages.
Harris, Miller, Miller, & Hanson Inc., 429 Marrett Road, Lexington, Mass. 02173.
CRITERIA
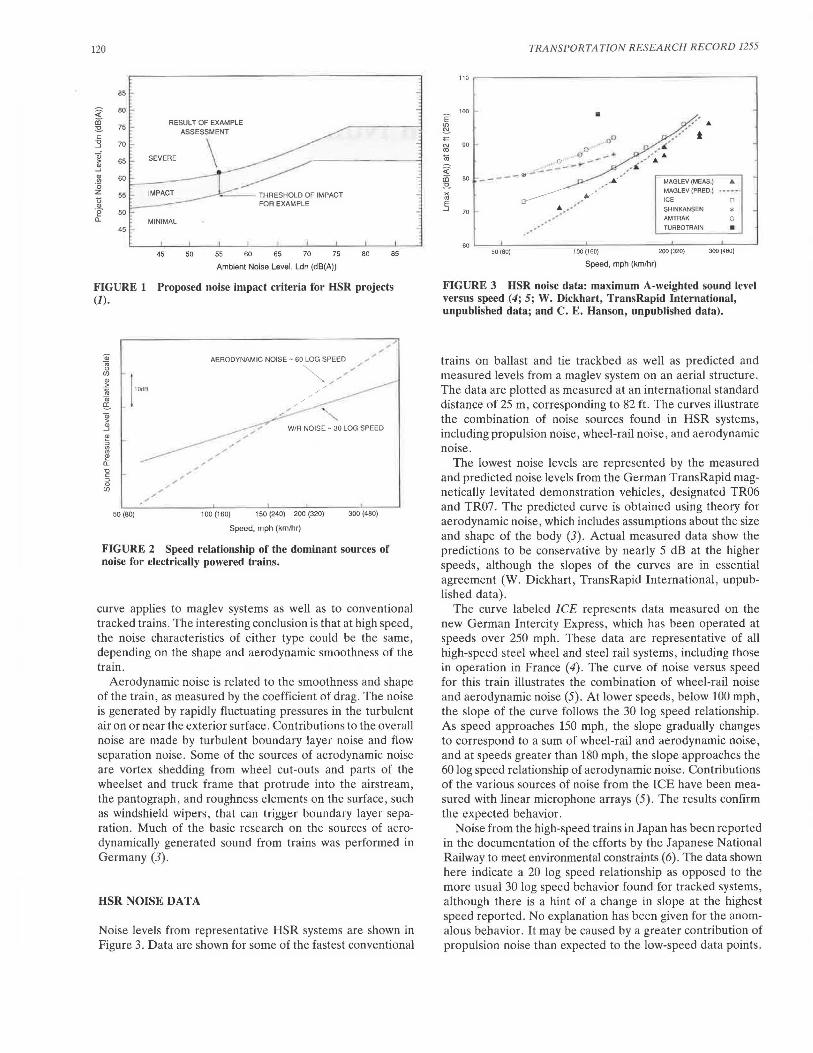
Noise impact assessment is based on criteria for community acceptability for a new project. After reviewing the available noise criteria established by the various agencies, UMTA is considering a combination of absolute criteria and relative criteria based on Ldn> the day-night sound level (1). Shown in Figure 1 are 1 proposed noise criteria for HSR based on the proposed UMT A criteria. The lower curve in Figure 1 represents the onset of noise impact. For conditions below this curve, noise impact is minimal and noise mitigation would not need to be considered . For conditions that fall in the area between the two curves in Figure 1, noise impact is identified. Under these conditions, mitigation would need to be investigated, but not necessarily provided (except for land use where serenity and quiet are of extraordinary significance or where mitigation costs are reasonable). Finally, the upper curve in Figure 1 represents the onset of severe noise impact. For conditions above this curve, noise mitigation would be necessary wherever it is feasible, according to the requirements of the applicable environmental enforcement authority .
HSR NOISE CHARACTERISTICS
Noise from tracked vehicles comes from a variety of sources, including the propulsion system, the wheel-rail interaction, the aerodynamics, and the guideway. The propulsion system tends to dominate noise at low speeds, with elect.ric traction considerably quieter than diesel- or turbine-powered trains. Wheel-rail interaction becomes the dominant noise source for speeds higher than 50 mph for conventional electric trains, with an approximate noise versus (normalized) speed dependency according to the following relationship (2): Wheel-rail noi~e is proportional to 30 log speed.
Until recently, aerodynamic noise sources have been associated with aircraft and ignored in ground transportation vehicles. Airflow over vehicles generates noise for all vehicles, however. Furthermore, with the advent of HSR, this source comes into the picture very strongly as speed increases because of the following relationship (3) : Aerodynamic noise is proportional to 60 log speed.
These relationships are shown in Figure 2 for typical trains. Both curves apply to conventional steel wheel and steel rail trains where wheel-rail sources dominate up to speeds of 150 mph, above which the aerodynamic noise becomes dominant. A magnetically levitated (maglev) train is subject to the same aerodynamic conditions as other trains, with the same noise generation characteristics. Consequently, the aerodynamic noise
120
85 -
< 80
ar 75 :!'!.
" -0 70 _J
a; > 65 Q) _J
Q) 60 "' ·o z 55 0 Q) ·e 50
o._
45 -MINIMAL
45 so
~-'"~-- THRESHOLD OF IMPACT FOR EXAMPLE
55 60 65 70 75
Ambient Noise Level, Ldn (dB(A))
80 85
FIGURE 1 Proposed noise impact criteria for HSR projects (1).
10d8
50 (80)
AERODYNAMIC NOISE - 60 LOG SPEED ,, "
~ ,,, ... " , "
100 (160) 150 (240) 200 (320) 300 (480)
Speed, mph (km/hr)
,. ,.. ,..
FIGURE 2 Speed relationship of the dominant sources of noise for electrically powered trains.
curve applies to maglev systems as well as to conventional tracked trains. The interesting conclusion is that at high speed, the noise characteristics of either type could be the same, depending on the shape and aerodynamic smoothness of the train.
Aerodynamic noise is related to the smoothness and shape of the train, as measured by the coefficient of drag. The noise is generated by rapidly fluctuating pressures in the turbulent air on or near the exterior surface. Contributions to the overall noise are made by turbulent boundary layer noise and flow separation noise. Some of the sources of aerodynamic noise are vortex shedding from wheel cut-outs and parts of the wheelset and truck frame that protrude into the airstream, the pantograph, and roughness elements on the surface, such as windshield wipers, lhal t:an lrigge1 boundary layer separation. Much of the basic research on the sources of aerodynamically generated sound from trains was performed in Germany (3).
HSR NOISE DATA
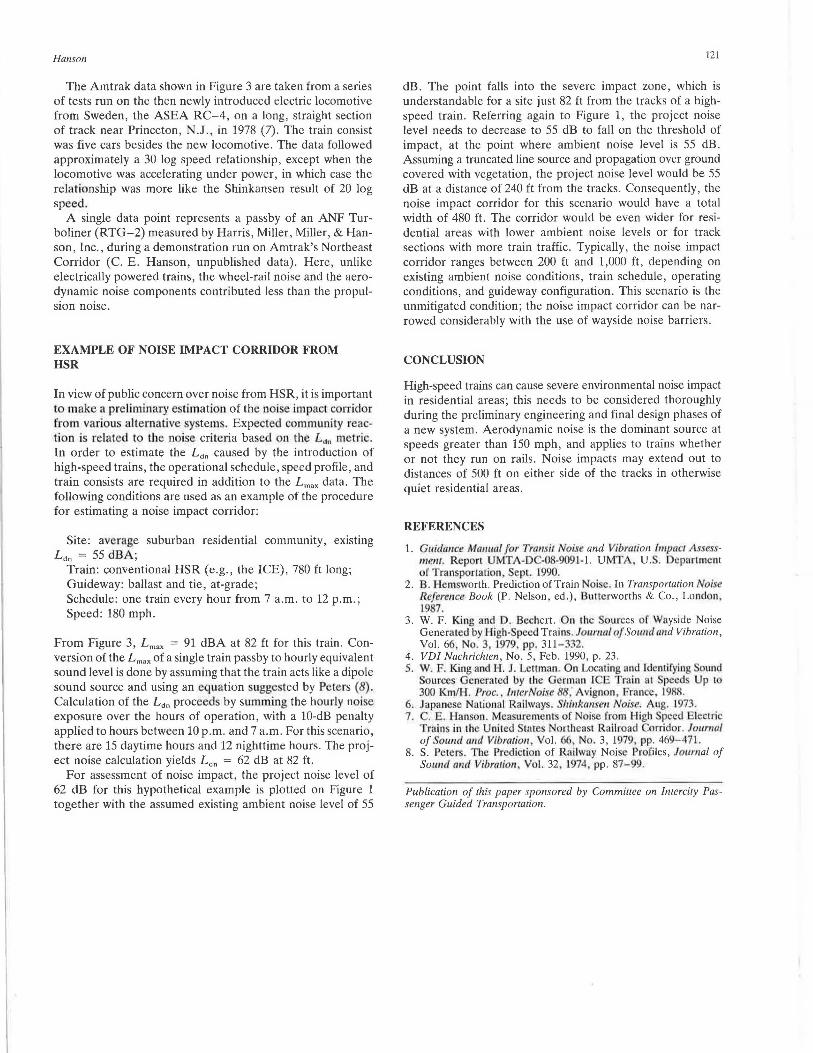
Noise levels from representative HSR systems are shown in Figure 3. Data are shown for some of the fastest conventional
TRANSPORTATION RESEARCH RECORD 1255
110 ~---------------------..
•
----- ... -MAGLEV (MEAS)
MAGLEV (PRED)
ICE
SHINKANSEN
AMTRAK
TU ABO TRAIN
" 0
* 0
• so '---.._ _____ _. _ _____ _._ ___ _._ _ __,
50 (80) 100 (160) 200 (320) 300 (460)
Speed, mph (km/hr)
FIGURE 3 HSR noise data: maximum A-weighted sound level versus speed (4; 5; W. Dickhart, TransRapid International, unpublished data; and C. E. Hanson, unpublished data).
trains on ballast and tie trackbed as well as predicted and measured levels from a maglev system on an aerial structure. The data are plotted as measured at an international standard distance of 25 m, corresponding to 82 ft. The curves illustrate the combination of noise sources found in HSR systems, including propulsion noise, wheel-rail noise, and aerodynamic noise.
The lowest noise levels are represented by the measured and predicted noise levels from the German TransRapid magnetically levitated demonstration vehicles, designated TR06 and TR07. The predicted curve is obtained using theory for aerodynamic noise , which includes assumptions about the size and shape of the body (3). Actual measured data show the predictions to be conservative by nearly 5 dB at the higher speeds, although the slopes of the curves are in essential agreement (W. Dickhart, TransRapid International, unpublished data).
The curve labeled ICE represents data measured on the new German Intercity Express , which has been operated at speeds over 250 mph. These data are representative of all high-speed steel wheel and steel rail systems, including those in operation in France ( 4). The curve of noise versus speed for this train illustrates the combination of wheel-rail noise and aerodynamic noise (5). At lower speeds, below 100 mph, the slope of the curve follows the 30 Jog speed relationship . As speed approaches 150 mph, the slope gradually changes to correspond to a sum of wheel-rail and aerodynamic noise, and at speeds greater than 180 mph, the slope approaches the 60 Jog speed relationship of aerodynamic noise. Contributions of the various sources of noise from the ICE have been measured with linear microphone arrays (5). The results confirm the expected behavior.
Noise from the high-speed trains in Japan has been reported in the documentation of the efforts by the Japanese National Railway to meet environmental constraints (6) . The data shown here indicate a 20 log speed relationship as opposed to the more usual 30 Jog speed behavior found for tracked systems, although there is a hint of a change in slope at the highest speed reported . No explanation has been given for the anomalous behavior. It may be caused by a greater contribution of propulsion noise than expected to the low-speed data points.
Hanson
The Amtrak data shown in Figure 3 are taken from a series of tests run on the then newly introduced electric locomotive from Sweden, the ASEA RC-4, on a long, straight section of track near Princeton, N.J., in 1978 (7). The train consist was five cars besides the new locomotive. The data followed approximately a 30 log speed relationship, except when the locomotive was accelerating under power, in which case the relationship was more like the Shinkansen result of 20 log speed.
A single data point represents a passby of an ANF Turboliner (RTG-2) measured by Harris, Miller, Miller, & Hanson, Inc., during a demonstration run on Amtrak's Northeast Corridor (C. E. Hanson, unpublished data). Here, unlike electrically powered trains, the wheel-rail noise and the aerodynamic noise components contributed less than the propulsion noise.
EXAMPLE OF NOISE IMPACT CORRIDOR FROM HSR
In view of public concern over noise from HSR, it is important to make a preliminary e timation of the noise impact corridor from various alternative ystem . Expected community reaction is related to the noise criteria ba, ed on the L~0 metric. In order to estimate the Ldn caused by the introduction of high-speed trains, the operational schedule, speed profile, and train consists are required in addition to the Lmax data. The following conditions are used as an example of the procedure for estimating a noise impact corridor:
Site: average suburban residential community, existing Ldn = 55 dBA;
Train: conventional HSR (e.g., the ICE), 780 ft long; Guideway: ballast and tie, at-grade; Schedule: one train every hour from 7 a.m. to 12 p.m.; Speed: 180 mph.
From Figure 3, Lmax = 91 dBA at 82 ft for this train. Conversion of the Lmax of a single train pass by to hourly equivalent sound level is done by assuming that the train acts like a dipole sound source and using an equation suggested by Peters (8). Calculation of the Ldn proceeds by summing the hourly noise exposure over the hours of operation, with a 10-dB penalty applied to hours between 10 p.m. and 7 a.m. For this scenario, there are 15 daytime hours and 12 nighttime hours. The project noise calculation yields Ldn = 62 dB at 82 ft.
For assessment of noise impact, the project noise level of 62 dB for this hypothetical example is plotted on Figure 1 together with the assumed existing ambient noise level of 55
121
dB. The point falls into the severe impact zone, which is understandable for a site just 82 ft from the tracks of a highspeed train. Referring again to Figure 1, the project noise level needs to decrease to 55 dB to fall on the threshold of impact, at the point where ambient noise level is 55 dB. Assuming a truncated line source and propagation over ground covered with vegetation, the project noise level would be 55 dB at a distance of 240 ft from the tracks. Consequently, the noise impact corridor for this scenario would have a total width of 480 ft. The corridor would be even wider for residential areas with lower ambient noise levels or for track sections with more train traffic. Typically, the noise impact corridor ranges between 200 ft and 1,000 ft, depending on existing ambient noise conditions, train schedule, operating conditions, and guideway configuration. This scenario is the unmitigated condition; the noise impact corridor can be narrowed considerably with the use of wayside noise barriers.
CONCLUSION
High-speed trains can cause severe environmental noise impact in residential areas; this needs to be considered thoroughly during the preliminary engineering and final design phases of a new system. Aerodynamic noise is the dominant source at speeds greater than 150 mph, and applies to trains whether or not they run on rails. Noise impacts may extend out to distances of 500 ft on either side of the tracks in otherwise quiet residential areas.
REFERENCES
1. G11ida11ce Ma111111/ for Tmnsit Noise and Vibration /111p11tt As essme111. Rep rt UMTA-DC-0 -9091-1. UMTA, U .. Department of Transporration Sept. 1990.
2. B. Hemsworth. Prediction of Train N i e. In Transportation Noi e Reference Book (P. Nelson, ed.), Bnttcrworths & Co., London, 19 7.
3. W. F. King and D. Becher!. On the , ources of Wayside Noise Generated by High-Speed Trains. Joum11/ of Sound 1111d Vibration, Vol. 66 No. 3, 1979, pp. 311 - 332.
4. VD! Nachrichten, No. 5, Feb. 1990, p. 23. 5. W. F. [(fog and H. J. Lettman. On Locating and Identifying ound
• ourccs Generated by the Germun ICE Train at Speed Up to 300 Km/H . Proc., lmerNoise ; Avignon , France, 1988.
6. Japanese National Railways. Slti11k1111se11 Noise. Aug. 1973. 7. C. E . Hanson. Mca ·uremcnts of Noise from High peed Electric
Train in the United lutes Northea t Railroad Corridor. Jo1mw/ of. owul a11d Vibratio11 , Vol. 66, o. 3, 1979, pp. 469-471.
8. S. Peters. The Prediction of Railway Noi e Profiles, Journal of Sound mu/ Vi/Jr11tio11, Vol. 32, 1974 pp. 87- 99.
P11blication of this paper sponsored by Cammi/lee on Intercity Passenger Guided Transportation.