high growth, low supply cost montney developer · does not include all costs for super pad...
TRANSCRIPT
TSX: VII.TO
High Growth, Low Supply Cost
Montney DeveloperSeptember 2017
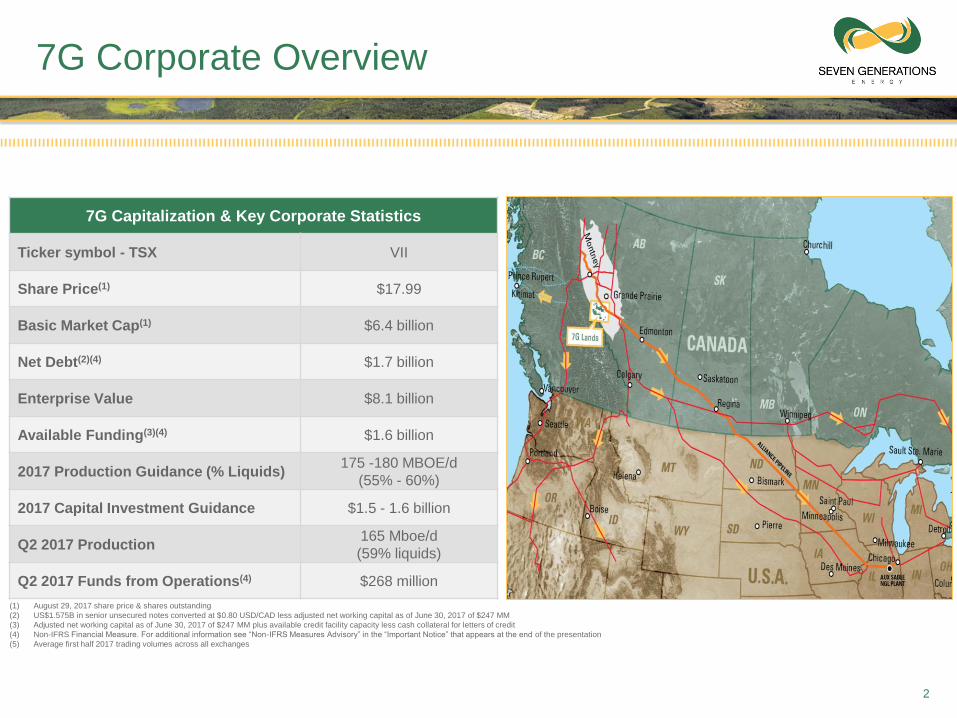
7G Corporate Overview
2
7G Capitalization & Key Corporate Statistics
Ticker symbol - TSX VII
Share Price(1) $17.99
Basic Market Cap(1) $6.4 billion
Net Debt(2)(4) $1.7 billion
Enterprise Value $8.1 billion
Available Funding(3)(4) $1.6 billion
2017 Production Guidance (% Liquids)175 -180 MBOE/d
(55% - 60%)
2017 Capital Investment Guidance $1.5 - 1.6 billion
Q2 2017 Production165 Mboe/d
(59% liquids)
Q2 2017 Funds from Operations(4) $268 million
(1) August 29, 2017 share price & shares outstanding
(2) US$1.575B in senior unsecured notes converted at $0.80 USD/CAD less adjusted net working capital as of June 30, 2017 of $247 MM
(3) Adjusted net working capital as of June 30, 2017 of $247 MM plus available credit facility capacity less cash collateral for letters of credit
(4) Non-IFRS Financial Measure. For additional information see “Non-IFRS Measures Advisory” in the “Important Notice” that appears at the end of the presentation
(5) Average first half 2017 trading volumes across all exchanges
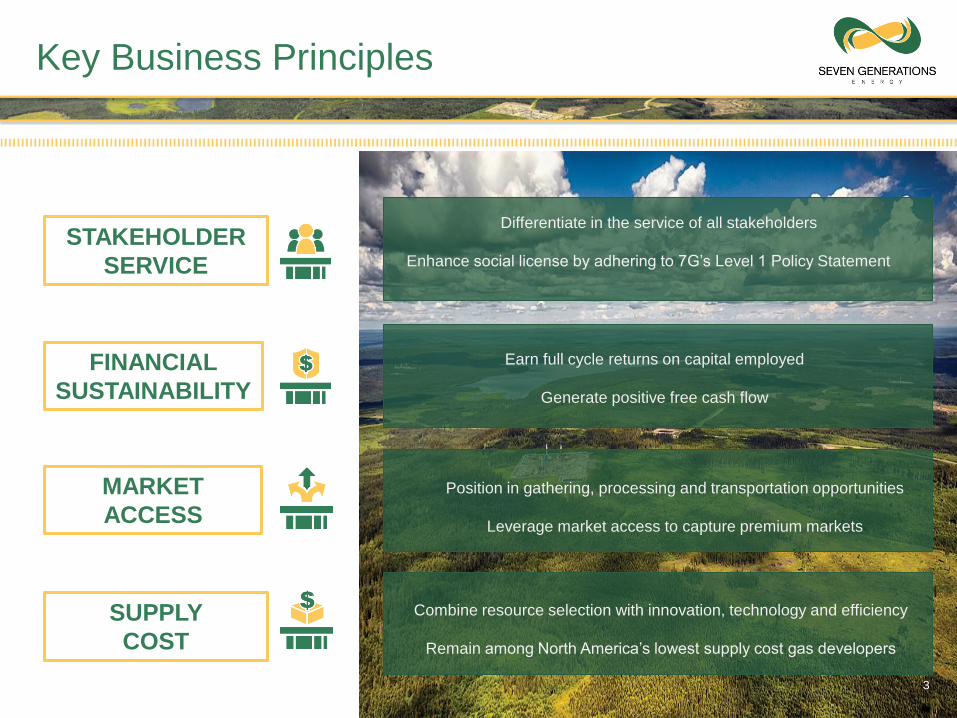
Key Business Principles
3
Position in gathering, processing and transportation opportunities
Leverage market access to capture premium markets
Combine resource selection with innovation, technology and efficiency
Remain among North America’s lowest supply cost gas developers
Differentiate in the service of all stakeholders
Enhance social license by adhering to 7G’s Level 1 Policy Statement
MARKET
ACCESS
STAKEHOLDER
SERVICE
SUPPLY
COST
Earn full cycle returns on capital employed
Generate positive free cash flow
FINANCIAL
SUSTAINABILITY
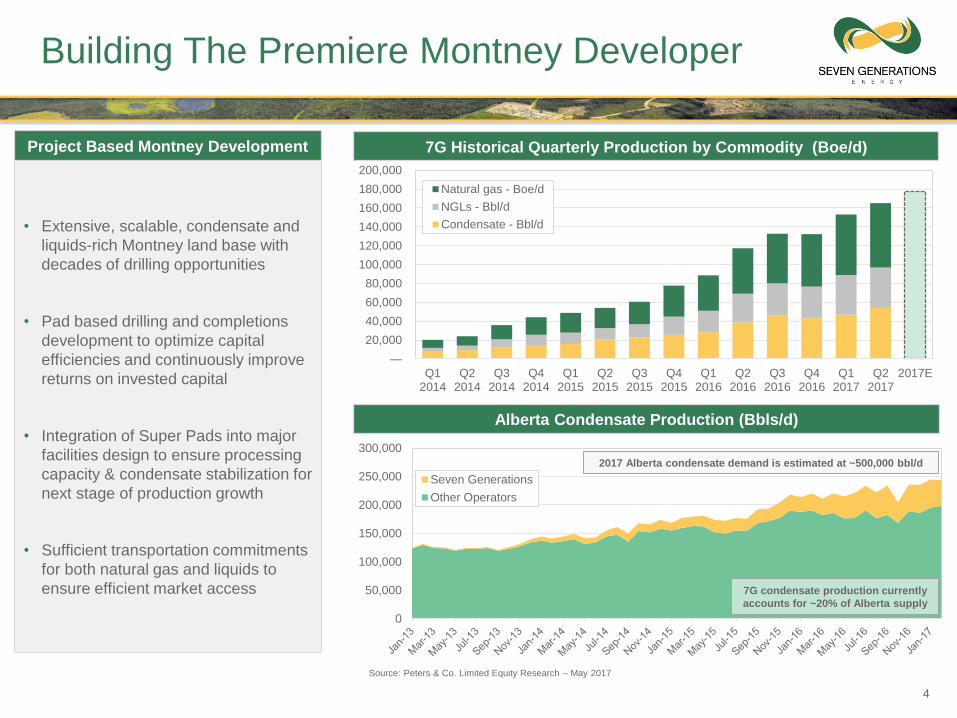
Building The Premiere Montney Developer
4
7G Historical Quarterly Production by Commodity (Boe/d)
Alberta Condensate Production (Bbls/d)
Source: Peters & Co. Limited Equity Research – May 2017
Project Based Montney Development
• Extensive, scalable, condensate and
liquids-rich Montney land base with
decades of drilling opportunities
• Pad based drilling and completions
development to optimize capital
efficiencies and continuously improve
returns on invested capital
• Integration of Super Pads into major
facilities design to ensure processing
capacity & condensate stabilization for
next stage of production growth
• Sufficient transportation commitments
for both natural gas and liquids to
ensure efficient market access
—
20,000
40,000
60,000
80,000
100,000
120,000
140,000
160,000
180,000
200,000
Q12014
Q22014
Q32014
Q42014
Q12015
Q22015
Q32015
Q42015
Q12016
Q22016
Q32016
Q42016
Q12017
Q22017
2017E
Natural gas - Boe/d
NGLs - Bbl/d
Condensate - Bbl/d
0
50,000
100,000
150,000
200,000
250,000
300,000
Seven Generations
Other Operators
2017 Alberta condensate demand is estimated at ~500,000 bbl/d
7G condensate production currently
accounts for ~20% of Alberta supply
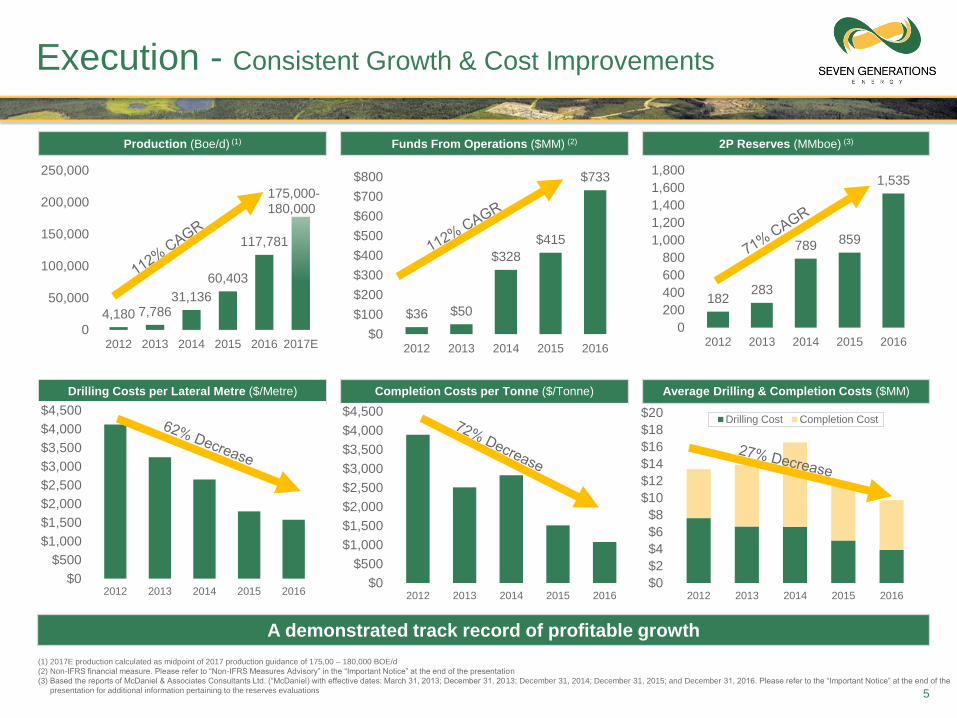
Execution - Consistent Growth & Cost Improvements
5
(1) 2017E production calculated as midpoint of 2017 production guidance of 175,00 – 180,000 BOE/d
(2) Non-IFRS financial measure. Please refer to “Non-IFRS Measures Advisory” in the “Important Notice” at the end of the presentation
(3) Based the reports of McDaniel & Associates Consultants Ltd. (“McDaniel) with effective dates: March 31, 2013; December 31, 2013; December 31, 2014; December 31, 2015; and December 31, 2016. Please refer to the “Important Notice” at the end of the
presentation for additional information pertaining to the reserves evaluations
A demonstrated track record of profitable growth
182283
789 859
1,535
0
200
400
600
800
1,000
1,200
1,400
1,600
1,800
2012 2013 2014 2015 2016
Funds From Operations ($MM) (2)Production (Boe/d) (1) 2P Reserves (MMboe) (3)
Completion Costs per Tonne ($/Tonne)Drilling Costs per Lateral Metre ($/Metre) Average Drilling & Completion Costs ($MM)
$36 $50
$328
$415
$733
$0
$100
$200
$300
$400
$500
$600
$700
$800
2012 2013 2014 2015 2016
4,180 7,78631,136
60,403
117,781
175,000-180,000
0
50,000
100,000
150,000
200,000
250,000
2012 2013 2014 2015 2016 2017E
$0
$500
$1,000
$1,500
$2,000
$2,500
$3,000
$3,500
$4,000
$4,500
2012 2013 2014 2015 2016
$0
$500
$1,000
$1,500
$2,000
$2,500
$3,000
$3,500
$4,000
$4,500
2012 2013 2014 2015 2016$0
$2
$4
$6
$8
$10
$12
$14
$16
$18
$20
2012 2013 2014 2015 2016
Drilling Cost Completion Cost
108.0127.1
186.1 195.5 198.3218.2
241.2
307.7336.3
421.5 428.1
381.5
436.8467.4
502.3
0.0
100.0
200.0
300.0
400.0
500.0
600.0
Q12014
Q22014
Q32014
Q42014
Q12015
Q22015
Q32015
Q42015
Q12016
Q22016
Q32016
Q42016
Q12017
Q22017
2017E
Pro
d/s
h (
Boe/d
per
MM
Share
s)
- Equity issued during quarter
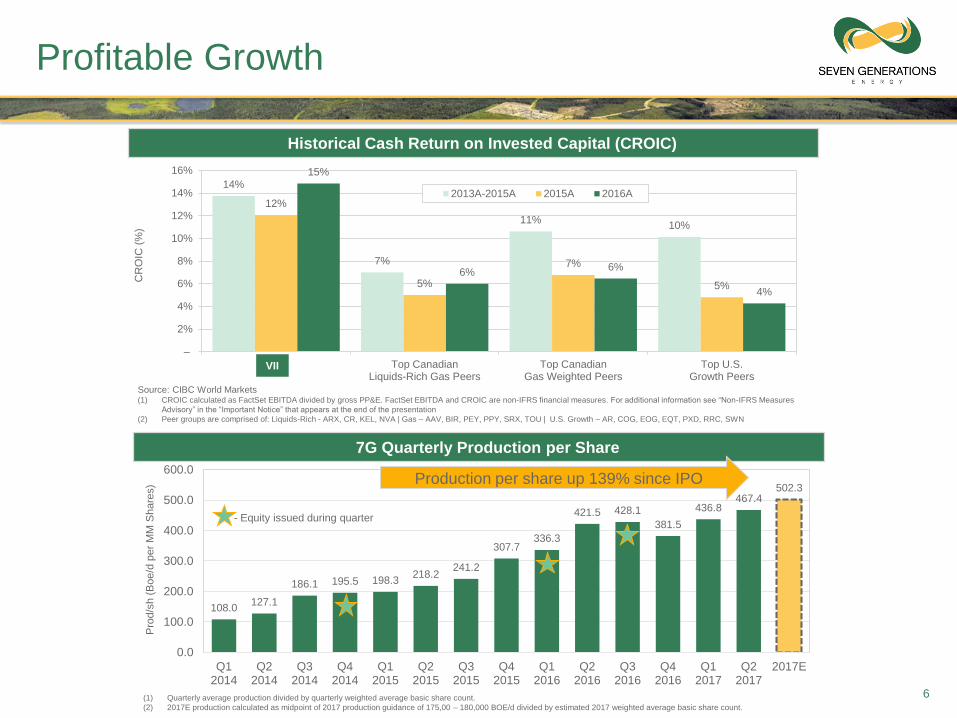
14%
7%
11%10%
12%
5%
7%
5%
15%
6%6%
4%
–
2%
4%
6%
8%
10%
12%
14%
16%
VII Top CanadianLiquids-Rich Gas Peers
Top CanadianGas Weighted Peers
Top U.S.Growth Peers
CR
OIC
(%
)
2013A-2015A 2015A 2016A
Profitable Growth
6
• 7G Quarterly Production per Share
(1) Quarterly average production divided by quarterly weighted average basic share count.
(2) 2017E production calculated as midpoint of 2017 production guidance of 175,00 – 180,000 BOE/d divided by estimated 2017 weighted average basic share count.
Production per share up 139% since IPO
• Historical Cash Return on Invested Capital (CROIC)
Source: CIBC World Markets(1) CROIC calculated as FactSet EBITDA divided by gross PP&E. FactSet EBITDA and CROIC are non-IFRS financial measures. For additional information see “Non-IFRS Measures
Advisory” in the “Important Notice” that appears at the end of the presentation
(2) Peer groups are comprised of: Liquids-Rich - ARX, CR, KEL, NVA | Gas – AAV, BIR, PEY, PPY, SRX, TOU | U.S. Growth – AR, COG, EOG, EQT, PXD, RRC, SWN
VII
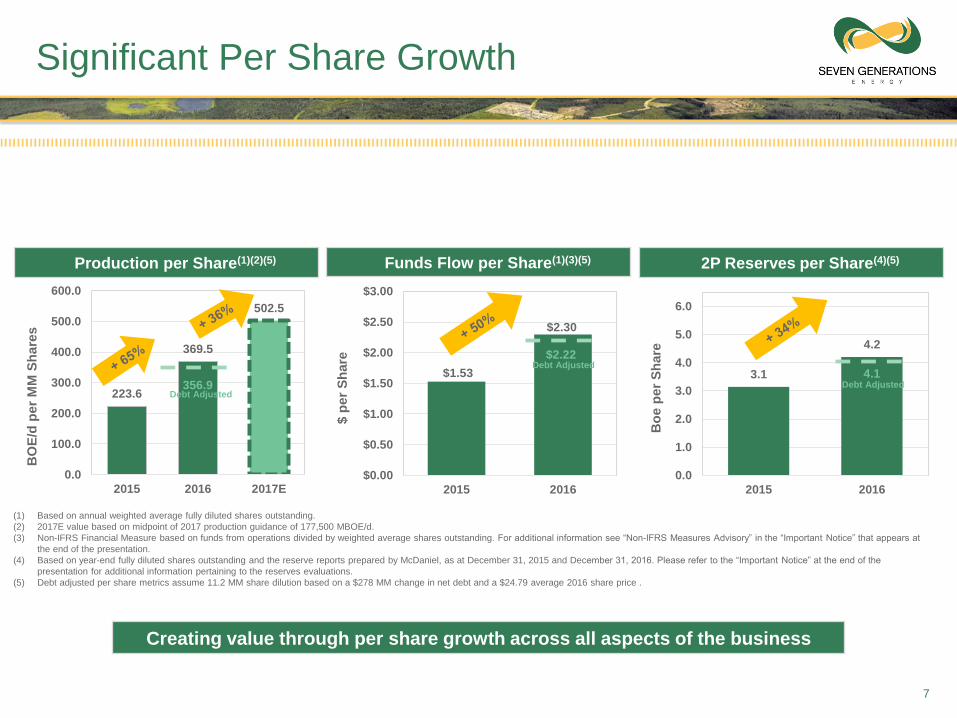
223.6
369.5
502.5
0.0
100.0
200.0
300.0
400.0
500.0
600.0
2015 2016 2017E
BO
E/d
per
MM
Sh
are
s
$1.53
$2.30
$0.00
$0.50
$1.00
$1.50
$2.00
$2.50
$3.00
2015 2016
$ p
er
Sh
are
3.1
4.2
0.0
1.0
2.0
3.0
4.0
5.0
6.0
2015 2016
Bo
ep
er
Sh
are
Significant Per Share Growth
7
Creating value through per share growth across all aspects of the business
(1) Based on annual weighted average fully diluted shares outstanding.
(2) 2017E value based on midpoint of 2017 production guidance of 177,500 MBOE/d.
(3) Non-IFRS Financial Measure based on funds from operations divided by weighted average shares outstanding. For additional information see “Non-IFRS Measures Advisory” in the “Important Notice” that appears at
the end of the presentation.
(4) Based on year-end fully diluted shares outstanding and the reserve reports prepared by McDaniel, as at December 31, 2015 and December 31, 2016. Please refer to the “Important Notice” at the end of the
presentation for additional information pertaining to the reserves evaluations.
(5) Debt adjusted per share metrics assume 11.2 MM share dilution based on a $278 MM change in net debt and a $24.79 average 2016 share price .
• Production per Share(1)(2)(5) • Funds Flow per Share(1)(3)(5) • 2P Reserves per Share(4)(5)
356.9Debt Adjusted
Debt Adjusted
$2.22Debt Adjusted
4.1
8
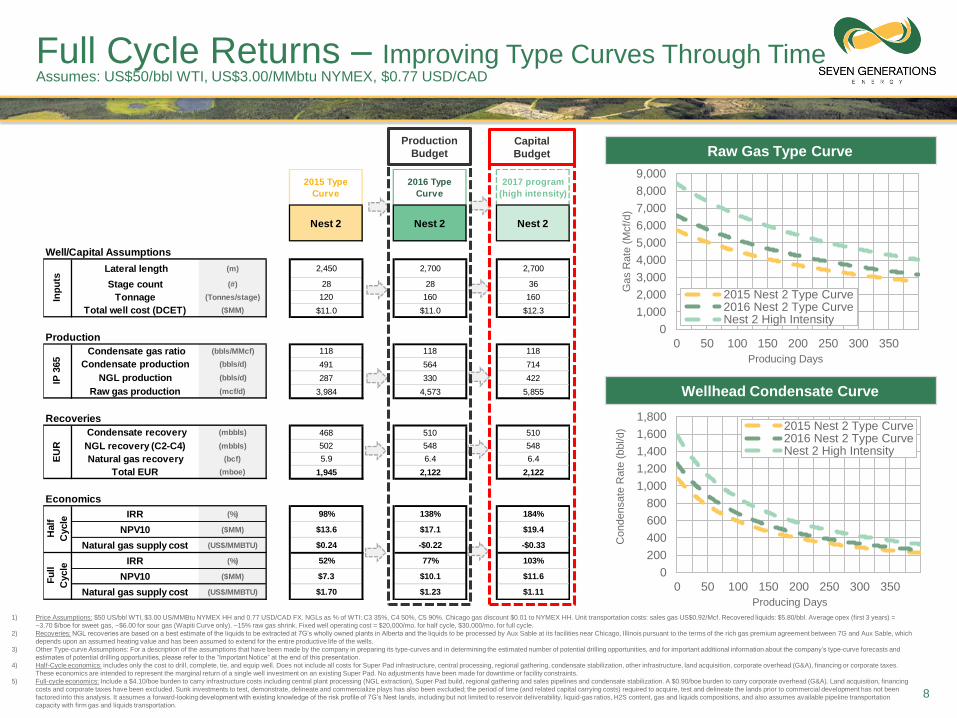
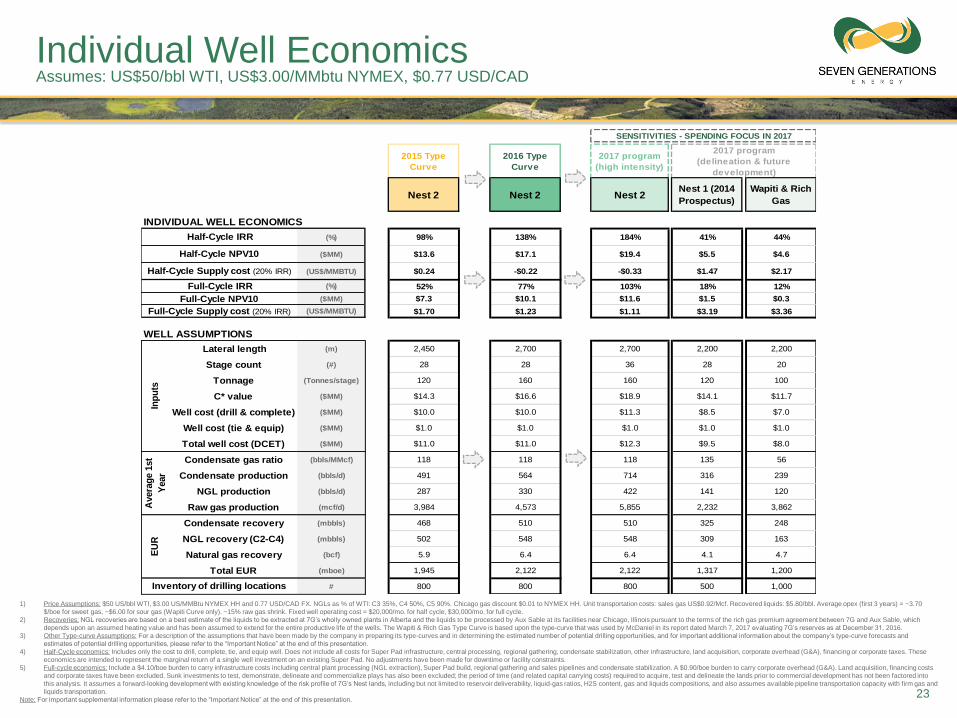
Full Cycle Returns – Improving Type Curves Through Time Assumes: US$50/bbl WTI, US$3.00/MMbtu NYMEX, $0.77 USD/CAD
1) Price Assumptions: $50 US/bbl WTI, $3.00 US/MMBtu NYMEX HH and 0.77 USD/CAD FX. NGLs as % of WTI: C3 35%, C4 50%, C5 90%. Chicago gas discount $0.01 to NYMEX HH. Unit transportation costs: sales gas US$0.92/Mcf. Recovered liquids: $5.80/bbl. Average opex (first 3 years) =
~3.70 $/boe for sweet gas, ~$6.00 for sour gas (Wapiti Curve only). ~15% raw gas shrink. Fixed well operating cost = $20,000/mo. for half cycle, $30,000/mo. for full cycle.
2) Recoveries: NGL recoveries are based on a best estimate of the liquids to be extracted at 7G’s wholly owned plants in Alberta and the liquids to be processed by Aux Sable at its facilities near Chicago, Illinois pursuant to the terms of the rich gas premium agreement between 7G and Aux Sable, which
depends upon an assumed heating value and has been assumed to extend for the entire productive life of the wells.
3) Other Type-curve Assumptions: For a description of the assumptions that have been made by the company in preparing its type-curves and in determining the estimated number of potential drilling opportunities, and for important additional information about the company’s type-curve forecasts and
estimates of potential drilling opportunities, please refer to the “Important Notice” at the end of this presentation.
4) Half-Cycle economics: includes only the cost to drill, complete, tie, and equip well. Does not include all costs for Super Pad infrastructure, central processing, regional gathering, condensate stabilization, other infrastructure, land acquisition, corporate overhead (G&A), financing or corporate taxes.
These economics are intended to represent the marginal return of a single well investment on an existing Super Pad. No adjustments have been made for downtime or facility constraints.
5) Full-cycle economics: Include a $4.10/boe burden to carry infrastructure costs including central plant processing (NGL extraction), Super Pad build, regional gathering and sales pipelines and condensate stabilization. A $0.90/boe burden to carry corporate overhead (G&A). Land acquisition, financing
costs and corporate taxes have been excluded. Sunk investments to test, demonstrate, delineate and commercialize plays has also been excluded; the period of time (and related capital carrying costs) required to acquire, test and delineate the lands prior to commercial development has not been
factored into this analysis. It assumes a forward-looking development with existing knowledge of the risk profile of 7G’s Nest lands, including but not limited to reservoir deliverability, liquid-gas ratios, H2S content, gas and liquids compositions, and also assumes available pipeline transportation
capacity with firm gas and liquids transportation.
2015 Type
Curve
2016 Type
Curve
2017 program
(high intensity)
Nest 2 Nest 2 Nest 2
Well/Capital Assumptions
Lateral length (m) 2,450 2,700 2,700
Stage count (#) 28 28 36
Tonnage (Tonnes/stage) 120 160 160
Total well cost (DCET) ($MM) $11.0 $11.0 $12.3
Production
Condensate gas ratio (bbls/MMcf) 118 118 118
Condensate production (bbls/d) 491 564 714
NGL production (bbls/d) 287 330 422
Raw gas production (mcf/d) 3,984 4,573 5,855
Recoveries
Condensate recovery (mbbls) 468 510 510
NGL recovery (C2-C4) (mbbls) 502 548 548
Natural gas recovery (bcf) 5.9 6.4 6.4
Total EUR (mboe) 1,945 2,122 2,122
Economics
IRR (%) 98% 138% 184%
NPV10 ($MM) $13.6 $17.1 $19.4
Natural gas supply cost (US$/MMBTU) $0.24 -$0.22 -$0.33
IRR (%) 52% 77% 103%
NPV10 ($MM) $7.3 $10.1 $11.6
Natural gas supply cost (US$/MMBTU) $1.70 $1.23 $1.11
Half
Cycle
Fu
ll
Cycle
IP 3
65
Inp
uts
EU
R
Production
BudgetCapital
Budget • Raw Gas Type Curve
0
1,000
2,000
3,000
4,000
5,000
6,000
7,000
8,000
9,000
0 50 100 150 200 250 300 350
Gas R
ate
(M
cf/
d)
Producing Days
2015 Nest 2 Type Curve2016 Nest 2 Type CurveNest 2 High Intensity
• Wellhead Condensate Curve
0
200
400
600
800
1,000
1,200
1,400
1,600
1,800
0 50 100 150 200 250 300 350
Condensate
Rate
(bbl/d)
Producing Days
2015 Nest 2 Type Curve2016 Nest 2 Type CurveNest 2 High Intensity
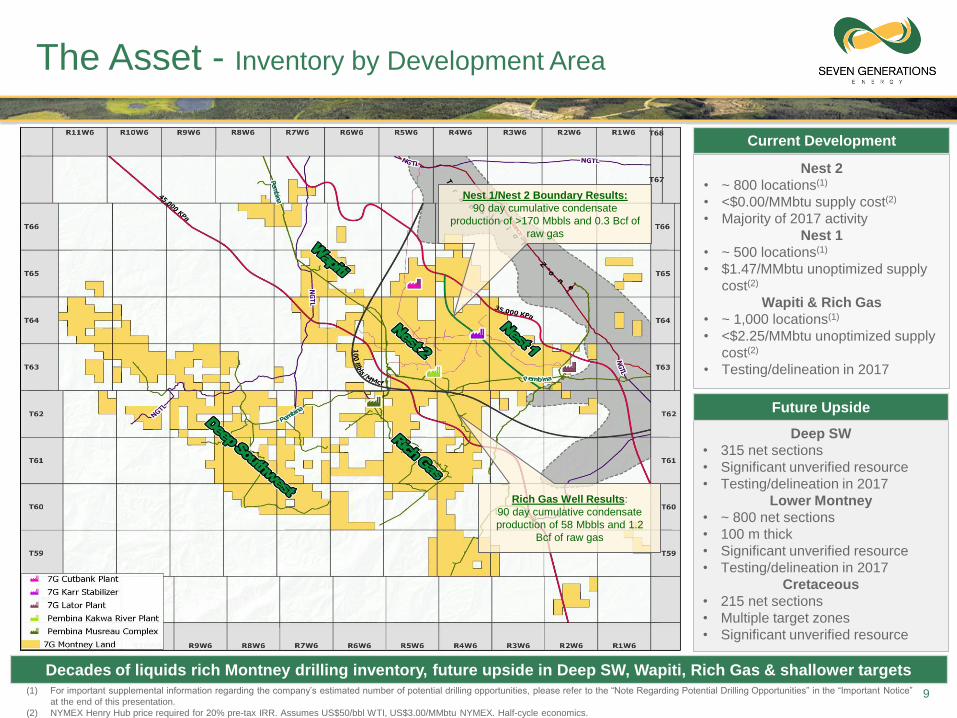
The Asset - Inventory by Development Area
9
Decades of liquids rich Montney drilling inventory, future upside in Deep SW, Wapiti, Rich Gas & shallower targets (1) For important supplemental information regarding the company’s estimated number of potential drilling opportunities, please refer to the “Note Regarding Potential Drilling Opportunities” in the “Important Notice”
at the end of this presentation.
(2) NYMEX Henry Hub price required for 20% pre-tax IRR. Assumes US$50/bbl WTI, US$3.00/MMbtu NYMEX. Half-cycle economics.
Nest 2
• ~ 800 locations(1)
• <$0.00/MMbtu supply cost(2)
• Majority of 2017 activity
Nest 1
• ~ 500 locations(1)
• $1.47/MMbtu unoptimized supply
cost(2)
Wapiti & Rich Gas
• ~ 1,000 locations(1)
• <$2.25/MMbtu unoptimized supply
cost(2)
• Testing/delineation in 2017
Deep SW
• 315 net sections
• Significant unverified resource
• Testing/delineation in 2017
Lower Montney
• ~ 800 net sections
• 100 m thick
• Significant unverified resource
• Testing/delineation in 2017
Cretaceous
• 215 net sections
• Multiple target zones
• Significant unverified resource
Current Development
Future Upside
Nest 1/Nest 2 Boundary Results:
90 day cumulative condensate
production of >170 Mbbls and 0.3 Bcf of
raw gas
Rich Gas Well Results:
90 day cumulative condensate
production of 58 Mbbls and 1.2
Bcf of raw gas
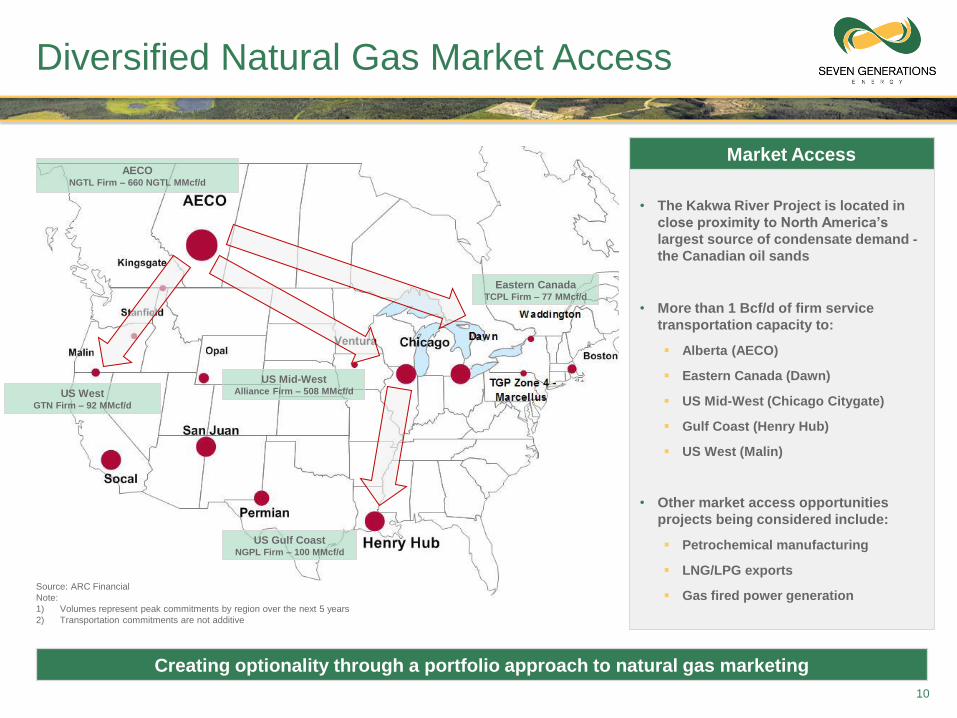
Diversified Natural Gas Market Access
10
Creating optionality through a portfolio approach to natural gas marketing
AECO NGTL Firm – 660 NGTL MMcf/d
Eastern CanadaTCPL Firm – 77 MMcf/d
US Mid-WestAlliance Firm – 508 MMcf/d
US Gulf CoastNGPL Firm – 100 MMcf/d
Source: ARC Financial
Note:
1) Volumes represent peak commitments by region over the next 5 years
2) Transportation commitments are not additive
• The Kakwa River Project is located in
close proximity to North America’s
largest source of condensate demand -
the Canadian oil sands
• More than 1 Bcf/d of firm service
transportation capacity to:
Alberta (AECO)
Eastern Canada (Dawn)
US Mid-West (Chicago Citygate)
Gulf Coast (Henry Hub)
US West (Malin)
• Other market access opportunities
projects being considered include:
Petrochemical manufacturing
LNG/LPG exports
Gas fired power generation
• Market Access
US WestGTN Firm – 92 MMcf/d
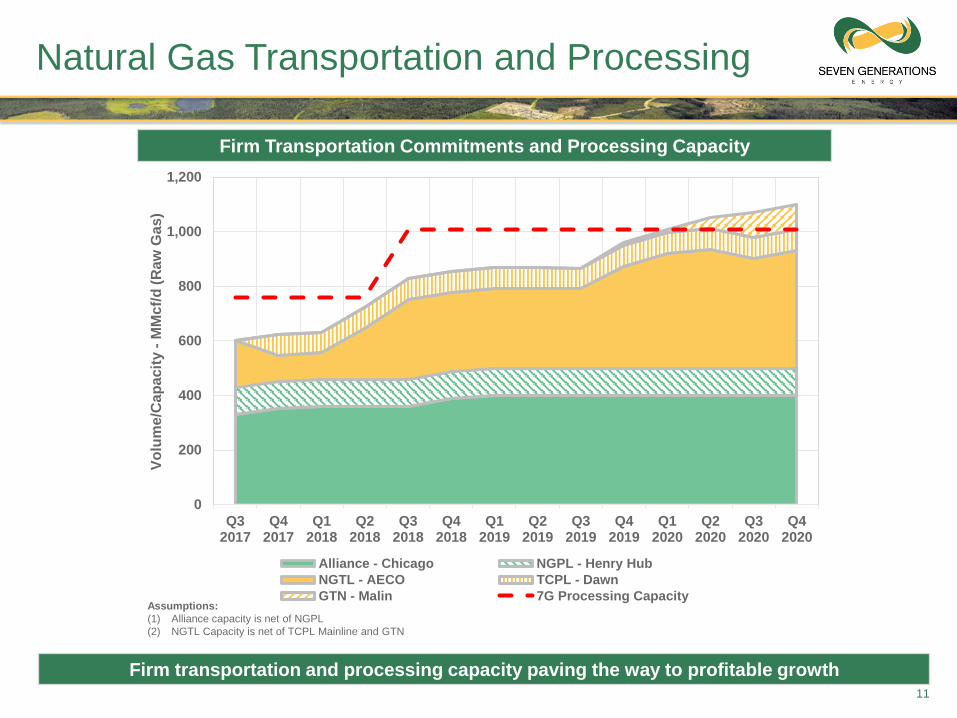
0
200
400
600
800
1,000
1,200
Q32017
Q42017
Q12018
Q22018
Q32018
Q42018
Q12019
Q22019
Q32019
Q42019
Q12020
Q22020
Q32020
Q42020
Vo
lum
e/C
ap
acit
y -
MM
cf/
d (
Ra
w G
as)
Alliance - Chicago NGPL - Henry Hub
NGTL - AECO TCPL - Dawn
GTN - Malin 7G Processing Capacity
Natural Gas Transportation and Processing
Firm transportation and processing capacity paving the way to profitable growth11
Firm Transportation Commitments and Processing Capacity
Assumptions:
(1) Alliance capacity is net of NGPL
(2) NGTL Capacity is net of TCPL Mainline and GTN
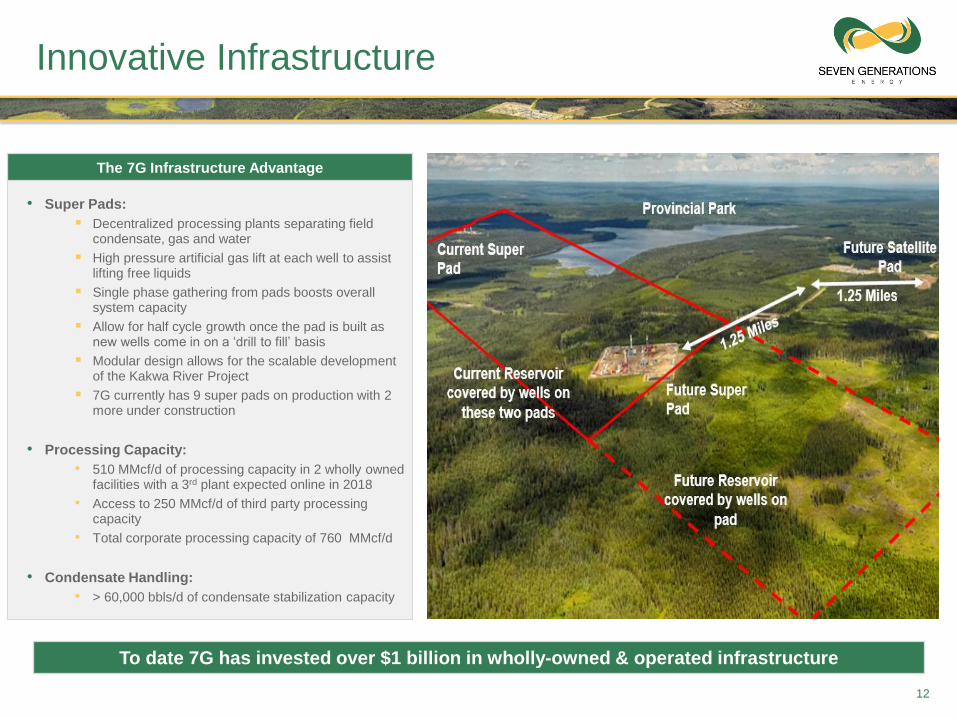
Innovative Infrastructure
To date 7G has invested over $1 billion in wholly-owned & operated infrastructure
• Super Pads:
Decentralized processing plants separating field condensate, gas and water
High pressure artificial gas lift at each well to assist lifting free liquids
Single phase gathering from pads boosts overall system capacity
Allow for half cycle growth once the pad is built as new wells come in on a ‘drill to fill’ basis
Modular design allows for the scalable development of the Kakwa River Project
7G currently has 9 super pads on production with 2 more under construction
• Processing Capacity:
• 510 MMcf/d of processing capacity in 2 wholly owned facilities with a 3rd plant expected online in 2018
• Access to 250 MMcf/d of third party processing capacity
• Total corporate processing capacity of 760 MMcf/d
• Condensate Handling:
• > 60,000 bbls/d of condensate stabilization capacity
12
The 7G Infrastructure Advantage
13
APPENDIX
We believe that companies have only the rights given to them by society. While people have a natural entitlement to basic rights,corporations are an instrument created by society to provide its needs and ought to have no expectation of basic entitlements other thanequitable rights with other corporations, including those wholly owned by a person. We recognize that rights, sufficient to build andoperate an energy project, can be granted and taken away by society. Over the longer term, companies can only expect to thrive if theyserve the legitimate needs of society in which they exist. To thrive, companies must differentiate, rise above the pack, standout as beingamong the best with all of their stakeholders. At Seven Generations Energy Ltd., we acknowledge this granted entitlement and acceptfrom our stakeholders a duty to thrive and an understanding of the need to differentiate. Specifically, in acceptance of this challenge todifferentiate with all stakeholders, we acknowledge:
Only those who best serve their stakeholders can expect the support required to survive for the longer term.
The need of our business partners and infrastructure
customers to be treated fairly and attentively;
Level 1 Policy
14
The need of society for us to conduct our business in a
way that protects the natural beauty of the environment
and preserves the capacity of the earth to meet the needs
of present and future generations;
The need of Canada and Alberta for us to obey all
regulations and to proactively assist with the formulation
of new policy that enables our company and our industry
to better serve society;
The need of the communities where we operate to
be engaged in the planning of our projects and to
participate in the benefits arising from them as they
are built and operated;
The need of our shareholders and capital providers to have their investment managed responsibly
and ethically and to earn strong returns.
The need of our suppliers and service providers to be
treated fairly and paid promptly for equipment and services
provided to us and to receive feedback from us that can
help them to be competitive and thrive in their businesses;
The need of our employees to be compensated fairly and
provided a safe, healthy and happy work environment
including a healthy work life – outside life balance; and
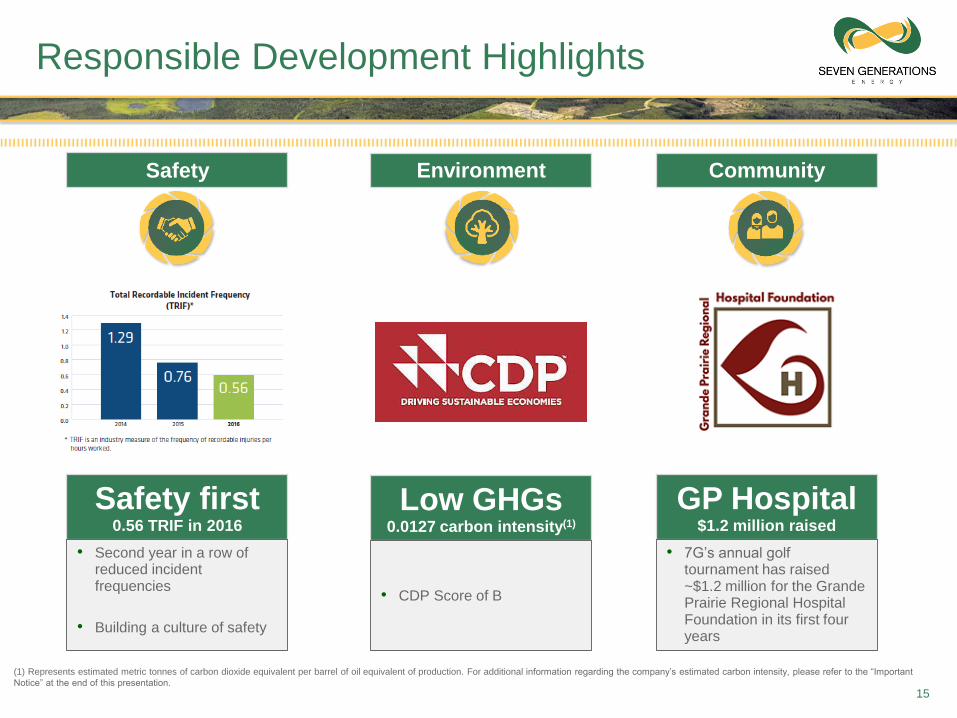
Low GHGs 0.0127 carbon intensity(1)
GP Hospital $1.2 million raised
Safety first 0.56 TRIF in 2016
Responsible Development Highlights
15
• Second year in a row of reduced incident frequencies
• Building a culture of safety
• CDP Score of B
• 7G’s annual golf tournament has raised ~$1.2 million for the Grande Prairie Regional Hospital Foundation in its first four years
Safety Environment Community
(1) Represents estimated metric tonnes of carbon dioxide equivalent per barrel of oil equivalent of production. For additional information regarding the company’s estimated carbon intensity, please refer to the “Important
Notice” at the end of this presentation.
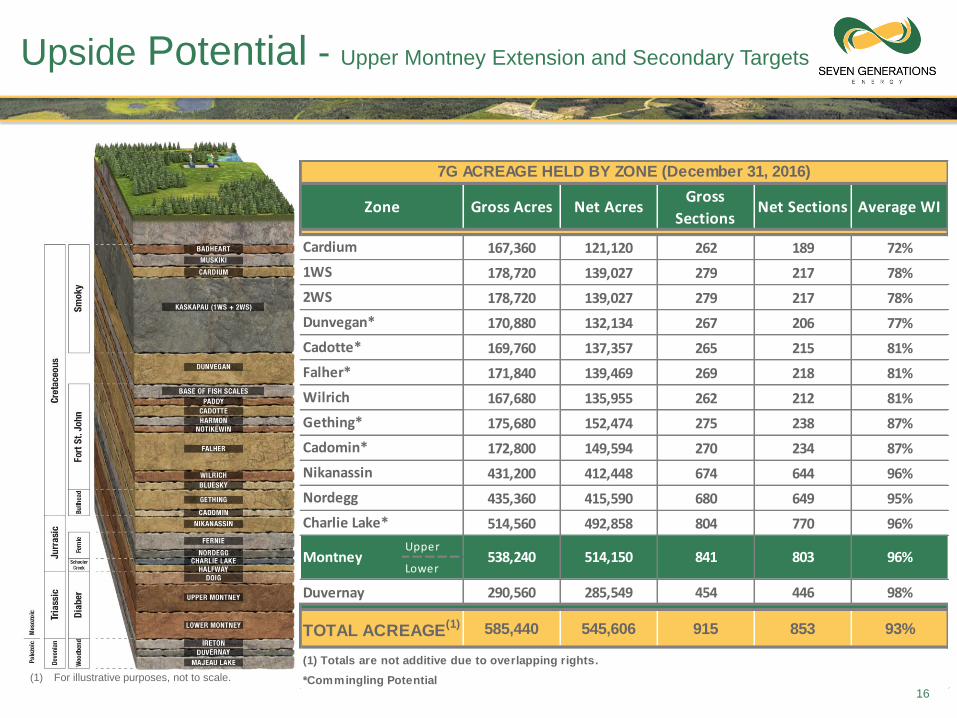
Upside Potential - Upper Montney Extension and Secondary Targets
16
(1) For illustrative purposes, not to scale.
Gross Acres Net AcresGross
SectionsNet Sections Average WI
167,360 121,120 262 189 72%
178,720 139,027 279 217 78%
178,720 139,027 279 217 78%
170,880 132,134 267 206 77%
169,760 137,357 265 215 81%
171,840 139,469 269 218 81%
167,680 135,955 262 212 81%
175,680 152,474 275 238 87%
172,800 149,594 270 234 87%
431,200 412,448 674 644 96%
435,360 415,590 680 649 95%
514,560 492,858 804 770 96%
Upper
Lower
Duvernay 290,560 285,549 454 446 98%
585,440 545,606 915 853 93%
(1) Totals are not additive due to overlapping rights.
*Commingling Potential
514,150 841 803 96%
TOTAL ACREAGE(1)
538,240
Cadomin*
Nikanassin
Nordegg
Charlie Lake*
Montney
Gething*
7G ACREAGE HELD BY ZONE (December 31, 2016)
Zone
Cardium
1WS
2WS
Dunvegan*
Cadotte*
Falher*
Wilrich
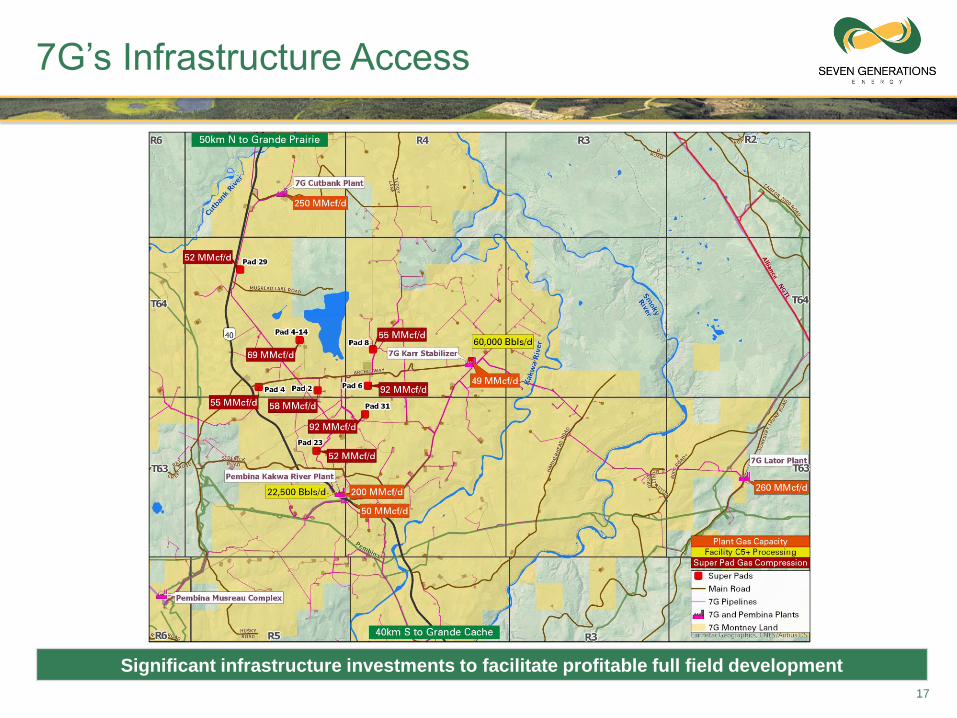
7G’s Infrastructure Access
17
Significant infrastructure investments to facilitate profitable full field development
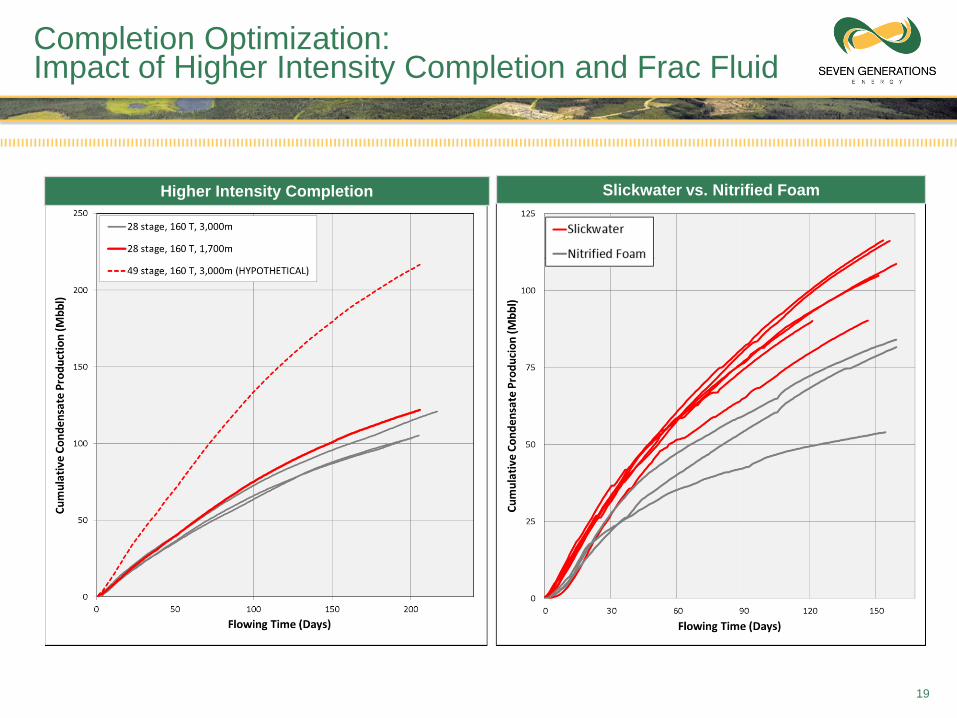
Completion Optimization:Impact of Higher Intensity Completion and Frac Fluid
19
Higher Intensity Completion Slickwater vs. Nitrified Foam

$14.43$15.39
$11.17 $11.50
$14.26
$16.05
$10.97$11.68
$0.00
$2.00
$4.00
$6.00
$8.00
$10.00
$12.00
$14.00
$16.00
$18.00
F&D FD&A F&D FD&A
1P 2P
3 Yr Avg.
Dec. 31, 2016
Reserves & Resources
19
Note: The information shown on this slide is based upon the reports prepared by McDaniel, the Company’s independent qualified reserves evaluator, evaluating the Company’s reserves, contingent resources and prospective
resources, as at the effective dates that are shown above. The evaluated contingent resources that are reflected herein have been classified as “development pending” and are considered to have the highest chance of
commerciality of all resources other than reserves. For important information regarding the Company’s independently evaluated reserves, contingent resources and prospective resources and the F&D costs and FD&A costs
that have been calculated by the Company, please refer to the “Important Notice” that appears at the end of this presentation.
Reserves booked to 22% of land with significant resource potential
Year End 2P Reserves (MMBoe) 1P & 2P Finding Costs ($/Boe)
182283
789859
1,535
0
200
400
600
800
1,000
1,200
1,400
1,600
1,800
2012 2013 2014 2015 2016
Natural Gas
Liquids
December 31, 2016 December 31, 2015 ∆YoY
Category MMBoe % Liquids NPV10 ($MM) MMBoe % Liquids NPV10 ($MM) MMBoe NPV10 ($MM)
PDP 166 53% $1,991 73 55% $878 127% 127%
1P 825 54% $5,146 424 52% $2,937 95% 75%
2P 1,535 53% $9,996 859 52% $6,507 79% 54%
Best Estimate Contingent – Risked 1,391 44% $3,068 771 45% $2,790 80% 10%
Best Estimate Prospective – Risked 787 47% $723 418 46% $1,071 88% -32%
1.5X 1.4X
2.6X
2.9X
2.3X
1.3X
1.7X 1.7X
1.5X
1.7X
0.0X
0.5X
1.0X
1.5X
2.0X
2.5X
3.0X
3.5X
Q1 2015 Q2 2015 Q3 2015 Q4 2015 Q1 2016 Q2 2016 Q3 2016 Q4 2016 Q1 2017 Q2 2017
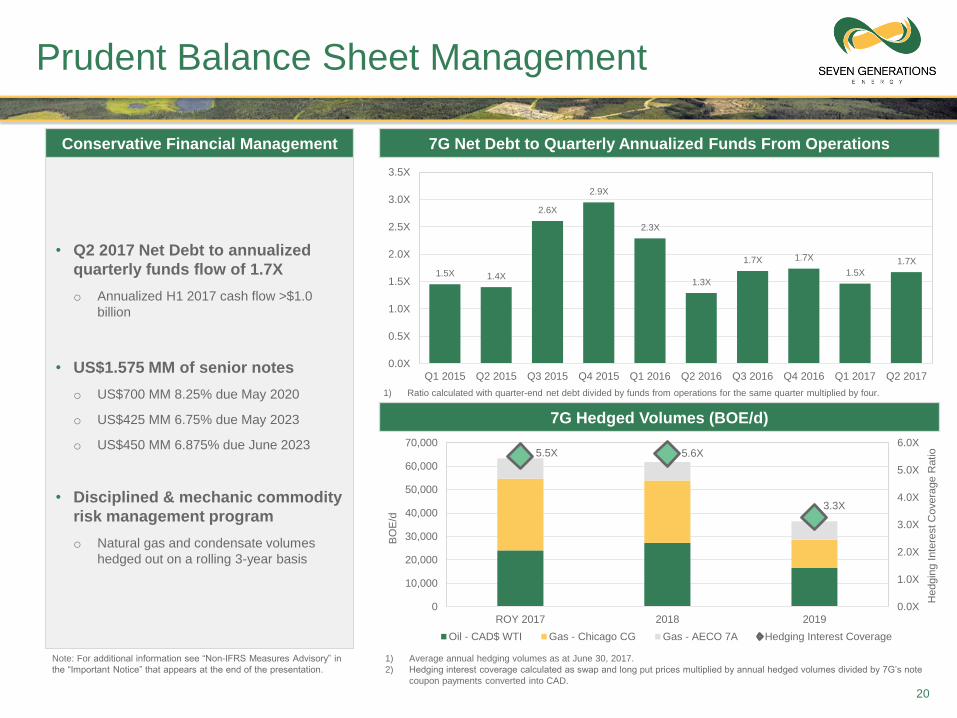
Prudent Balance Sheet Management
20
Conservative Financial Management
• Q2 2017 Net Debt to annualized
quarterly funds flow of 1.7X
o Annualized H1 2017 cash flow >$1.0
billion
• US$1.575 MM of senior notes
o US$700 MM 8.25% due May 2020
o US$425 MM 6.75% due May 2023
o US$450 MM 6.875% due June 2023
• Disciplined & mechanic commodity
risk management program
o Natural gas and condensate volumes
hedged out on a rolling 3-year basis
7G Net Debt to Quarterly Annualized Funds From Operations
Note: For additional information see “Non-IFRS Measures Advisory” in
the “Important Notice” that appears at the end of the presentation.
7G Hedged Volumes (BOE/d)
1) Average annual hedging volumes as at June 30, 2017.
2) Hedging interest coverage calculated as swap and long put prices multiplied by annual hedged volumes divided by 7G’s note
coupon payments converted into CAD.
1) Ratio calculated with quarter-end net debt divided by funds from operations for the same quarter multiplied by four.
5.5X 5.6X
3.3X
0.0X
1.0X
2.0X
3.0X
4.0X
5.0X
6.0X
0
10,000
20,000
30,000
40,000
50,000
60,000
70,000
ROY 2017 2018 2019
Hedgin
g I
nte
rest C
overa
ge R
atio
BO
E/d
Oil - CAD$ WTI Gas - Chicago CG Gas - AECO 7A Hedging Interest Coverage
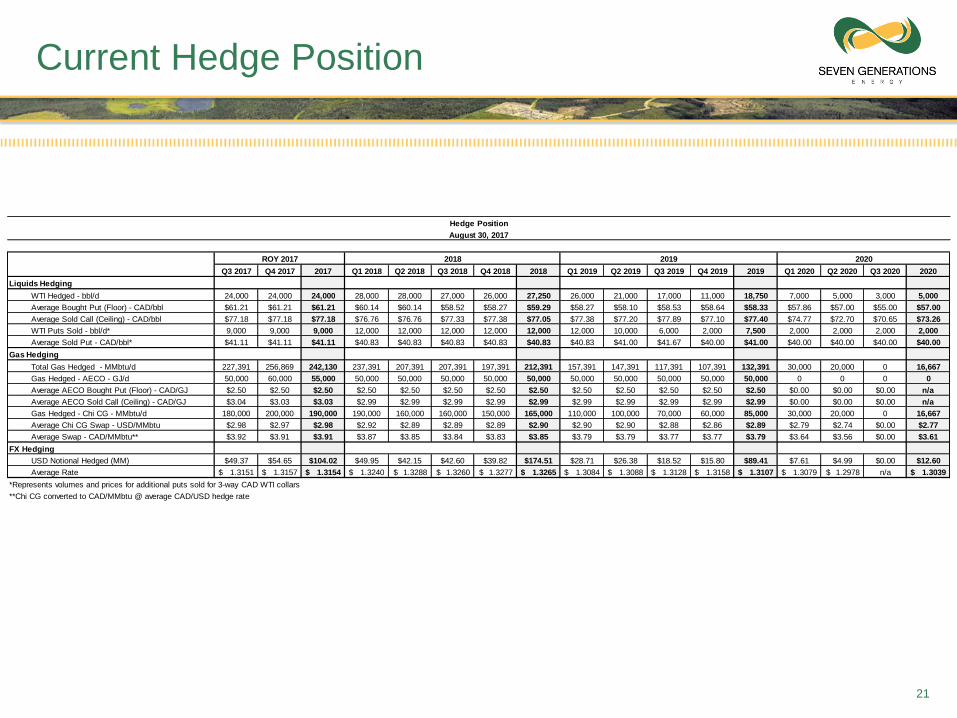
Current Hedge Position
21
Q3 2017 Q4 2017 2017 Q1 2018 Q2 2018 Q3 2018 Q4 2018 2018 Q1 2019 Q2 2019 Q3 2019 Q4 2019 2019 Q1 2020 Q2 2020 Q3 2020 2020
Liquids Hedging
WTI Hedged - bbl/d 24,000 24,000 24,000 28,000 28,000 27,000 26,000 27,250 26,000 21,000 17,000 11,000 18,750 7,000 5,000 3,000 5,000
Average Bought Put (Floor) - CAD/bbl $61.21 $61.21 $61.21 $60.14 $60.14 $58.52 $58.27 $59.29 $58.27 $58.10 $58.53 $58.64 $58.33 $57.86 $57.00 $55.00 $57.00
Average Sold Call (Ceiling) - CAD/bbl $77.18 $77.18 $77.18 $76.76 $76.76 $77.33 $77.38 $77.05 $77.38 $77.20 $77.89 $77.10 $77.40 $74.77 $72.70 $70.65 $73.26
WTI Puts Sold - bbl/d* 9,000 9,000 9,000 12,000 12,000 12,000 12,000 12,000 12,000 10,000 6,000 2,000 7,500 2,000 2,000 2,000 2,000
Average Sold Put - CAD/bbl* $41.11 $41.11 $41.11 $40.83 $40.83 $40.83 $40.83 $40.83 $40.83 $41.00 $41.67 $40.00 $41.00 $40.00 $40.00 $40.00 $40.00
Gas Hedging
Total Gas Hedged - MMbtu/d 227,391 256,869 242,130 237,391 207,391 207,391 197,391 212,391 157,391 147,391 117,391 107,391 132,391 30,000 20,000 0 16,667
Gas Hedged - AECO - GJ/d 50,000 60,000 55,000 50,000 50,000 50,000 50,000 50,000 50,000 50,000 50,000 50,000 50,000 0 0 0 0
Average AECO Bought Put (Floor) - CAD/GJ $2.50 $2.50 $2.50 $2.50 $2.50 $2.50 $2.50 $2.50 $2.50 $2.50 $2.50 $2.50 $2.50 $0.00 $0.00 $0.00 n/a
Average AECO Sold Call (Ceiling) - CAD/GJ $3.04 $3.03 $3.03 $2.99 $2.99 $2.99 $2.99 $2.99 $2.99 $2.99 $2.99 $2.99 $2.99 $0.00 $0.00 $0.00 n/a
Gas Hedged - Chi CG - MMbtu/d 180,000 200,000 190,000 190,000 160,000 160,000 150,000 165,000 110,000 100,000 70,000 60,000 85,000 30,000 20,000 0 16,667
Average Chi CG Swap - USD/MMbtu $2.98 $2.97 $2.98 $2.92 $2.89 $2.89 $2.89 $2.90 $2.90 $2.90 $2.88 $2.86 $2.89 $2.79 $2.74 $0.00 $2.77
Average Swap - CAD/MMbtu** $3.92 $3.91 $3.91 $3.87 $3.85 $3.84 $3.83 $3.85 $3.79 $3.79 $3.77 $3.77 $3.79 $3.64 $3.56 $0.00 $3.61
FX Hedging
USD Notional Hedged (MM) $49.37 $54.65 $104.02 $49.95 $42.15 $42.60 $39.82 $174.51 $28.71 $26.38 $18.52 $15.80 $89.41 $7.61 $4.99 $0.00 $12.60
Average Rate 1.3151$ 1.3157$ 1.3154$ 1.3240$ 1.3288$ 1.3260$ 1.3277$ 1.3265$ 1.3084$ 1.3088$ 1.3128$ 1.3158$ 1.3107$ 1.3079$ 1.2978$ n/a 1.3039$
*Represents volumes and prices for additional puts sold for 3-way CAD WTI collars
**Chi CG converted to CAD/MMbtu @ average CAD/USD hedge rate
2020
Hedge Position
August 30, 2017
ROY 2017 2018 2019
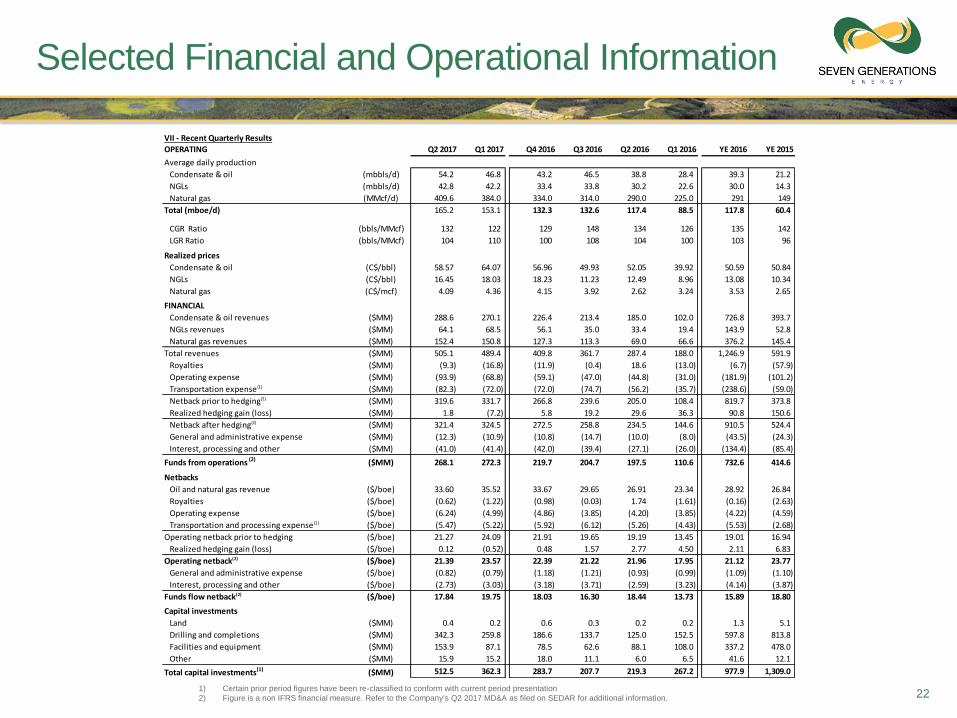
Selected Financial and Operational Information
1) Certain prior period figures have been re-classified to conform with current period presentation
2) Figure is a non IFRS financial measure. Refer to the Company's Q2 2017 MD&A as filed on SEDAR for additional information. 22
VII - Recent Quarterly Results
OPERATING Q2 2017 Q1 2017 Q4 2016 Q3 2016 Q2 2016 Q1 2016 YE 2016 YE 2015
Average daily production
Condensate & oil (mbbls/d) 54.2 46.8 43.2 46.5 38.8 28.4 39.3 21.2
NGLs (mbbls/d) 42.8 42.2 33.4 33.8 30.2 22.6 30.0 14.3
Natural gas (MMcf/d) 409.6 384.0 334.0 314.0 290.0 225.0 291 149
Total (mboe/d) 165.2 153.1 132.3 132.6 117.4 88.5 117.8 60.4
CGR Ratio (bbls/MMcf) 132 122 129 148 134 126 135 142
LGR Ratio (bbls/MMcf) 104 110 100 108 104 100 103 96
Realized prices
Condensate & oil (C$/bbl) 58.57 64.07 56.96 49.93 52.05 39.92 50.59 50.84
NGLs (C$/bbl) 16.45 18.03 18.23 11.23 12.49 8.96 13.08 10.34
Natural gas (C$/mcf) 4.09 4.36 4.15 3.92 2.62 3.24 3.53 2.65
FINANCIAL
Condensate & oil revenues ($MM) 288.6 270.1 226.4 213.4 185.0 102.0 726.8 393.7
NGLs revenues ($MM) 64.1 68.5 56.1 35.0 33.4 19.4 143.9 52.8
Natural gas revenues ($MM) 152.4 150.8 127.3 113.3 69.0 66.6 376.2 145.4
Total revenues ($MM) 505.1 489.4 409.8 361.7 287.4 188.0 1,246.9 591.9
Royalties ($MM) (9.3) (16.8) (11.9) (0.4) 18.6 (13.0) (6.7) (57.9)
Operating expense ($MM) (93.9) (68.8) (59.1) (47.0) (44.8) (31.0) (181.9) (101.2)
Transportation expense (1) ($MM) (82.3) (72.0) (72.0) (74.7) (56.2) (35.7) (238.6) (59.0)
Netback prior to hedging(2) ($MM) 319.6 331.7 266.8 239.6 205.0 108.4 819.7 373.8
Realized hedging gain (loss) ($MM) 1.8 (7.2) 5.8 19.2 29.6 36.3 90.8 150.6
Netback after hedging(2) ($MM) 321.4 324.5 272.5 258.8 234.5 144.6 910.5 524.4
General and administrative expense ($MM) (12.3) (10.9) (10.8) (14.7) (10.0) (8.0) (43.5) (24.3)
Interest, processing and other ($MM) (41.0) (41.4) (42.0) (39.4) (27.1) (26.0) (134.4) (85.4)
Funds from operations (2) ($MM) 268.1 272.3 219.7 204.7 197.5 110.6 732.6 414.6
Netbacks
Oil and natural gas revenue ($/boe) 33.60 35.52 33.67 29.65 26.91 23.34 28.92 26.84
Royalties ($/boe) (0.62) (1.22) (0.98) (0.03) 1.74 (1.61) (0.16) (2.63)
Operating expense ($/boe) (6.24) (4.99) (4.86) (3.85) (4.20) (3.85) (4.22) (4.59)
Transportation and processing expense (1) ($/boe) (5.47) (5.22) (5.92) (6.12) (5.26) (4.43) (5.53) (2.68)
Operating netback prior to hedging ($/boe) 21.27 24.09 21.91 19.65 19.19 13.45 19.01 16.94
Realized hedging gain (loss) ($/boe) 0.12 (0.52) 0.48 1.57 2.77 4.50 2.11 6.83
Operating netback(2) ($/boe) 21.39 23.57 22.39 21.22 21.96 17.95 21.12 23.77
General and administrative expense ($/boe) (0.82) (0.79) (1.18) (1.21) (0.93) (0.99) (1.09) (1.10)
Interest, processing and other ($/boe) (2.73) (3.03) (3.18) (3.71) (2.59) (3.23) (4.14) (3.87)
Funds flow netback(2) ($/boe) 17.84 19.75 18.03 16.30 18.44 13.73 15.89 18.80
Capital investments
Land ($MM) 0.4 0.2 0.6 0.3 0.2 0.2 1.3 5.1
Drilling and completions ($MM) 342.3 259.8 186.6 133.7 125.0 152.5 597.8 813.8
Facilities and equipment ($MM) 153.9 87.1 78.5 62.6 88.1 108.0 337.2 478.0
Other ($MM) 15.9 15.2 18.0 11.1 6.0 6.5 41.6 12.1
Total capital investments(1) ($MM) 512.5 362.3 283.7 207.7 219.3 267.2 977.9 1,309.0
1) Price Assumptions: $50 US/bbl WTI, $3.00 US/MMBtu NYMEX HH and 0.77 USD/CAD FX. NGLs as % of WTI: C3 35%, C4 50%, C5 90%. Chicago gas discount $0.01 to NYMEX HH. Unit transportation costs: sales gas US$0.92/Mcf. Recovered liquids: $5.80/bbl. Average opex (first 3 years) = ~3.70
$/boe for sweet gas, ~$6.00 for sour gas (Wapiti Curve only). ~15% raw gas shrink. Fixed well operating cost = $20,000/mo. for half cycle, $30,000/mo. for full cycle.
2) Recoveries: NGL recoveries are based on a best estimate of the liquids to be extracted at 7G’s wholly owned plants in Alberta and the liquids to be processed by Aux Sable at its facilities near Chicago, Illinois pursuant to the terms of the rich gas premium agreement between 7G and Aux Sable, which
depends upon an assumed heating value and has been assumed to extend for the entire productive life of the wells. The Wapiti & Rich Gas Type Curve is based upon the type-curve that was used by McDaniel in its report dated March 7, 2017 evaluating 7G’s reserves as at December 31, 2016.
3) Other Type-curve Assumptions: For a description of the assumptions that have been made by the company in preparing its type-curves and in determining the estimated number of potential drilling opportunities, and for important additional information about the company’s type-curve forecasts and
estimates of potential drilling opportunities, please refer to the “Important Notice” at the end of this presentation.
4) Half-Cycle economics: Includes only the cost to drill, complete, tie, and equip well. Does not include all costs for Super Pad infrastructure, central processing, regional gathering, condensate stabilization, other infrastructure, land acquisition, corporate overhead (G&A), financing or corporate taxes. These
economics are intended to represent the marginal return of a single well investment on an existing Super Pad. No adjustments have been made for downtime or facility constraints.
5) Full-cycle economics: Include a $4.10/boe burden to carry infrastructure costs including central plant processing (NGL extraction), Super Pad build, regional gathering and sales pipelines and condensate stabilization. A $0.90/boe burden to carry corporate overhead (G&A). Land acquisition, financing costs
and corporate taxes have been excluded. Sunk investments to test, demonstrate, delineate and commercialize plays has also been excluded; the period of time (and related capital carrying costs) required to acquire, test and delineate the lands prior to commercial development has not been factored into
this analysis. It assumes a forward-looking development with existing knowledge of the risk profile of 7G’s Nest lands, including but not limited to reservoir deliverability, liquid-gas ratios, H2S content, gas and liquids compositions, and also assumes available pipeline transportation capacity with firm gas and
liquids transportation.
Note: For important supplemental information please refer to the “Important Notice” at the end of this presentation.
Individual Well EconomicsAssumes: US$50/bbl WTI, US$3.00/MMbtu NYMEX, $0.77 USD/CAD
23
2015 Type
Curve
2016 Type
Curve
2017 program
(high intensity)
Nest 2 Nest 2 Nest 2Nest 1 (2014
Prospectus)
Wapiti & Rich
Gas
INDIVIDUAL WELL ECONOMICS
(%) 98% 138% 184% 41% 44%
($MM) $13.6 $17.1 $19.4 $5.5 $4.6
(US$/MMBTU) $0.24 -$0.22 -$0.33 $1.47 $2.17
(%) 52% 77% 103% 18% 12%
($MM) $7.3 $10.1 $11.6 $1.5 $0.3
(US$/MMBTU) $1.70 $1.23 $1.11 $3.19 $3.36
WELL ASSUMPTIONS
Lateral length (m) 2,450 2,700 2,700 2,200 2,200
Stage count (#) 28 28 36 28 20
Tonnage (Tonnes/stage) 120 160 160 120 100
C* value ($MM) $14.3 $16.6 $18.9 $14.1 $11.7
Well cost (drill & complete) ($MM) $10.0 $10.0 $11.3 $8.5 $7.0
Well cost (tie & equip) ($MM) $1.0 $1.0 $1.0 $1.0 $1.0
Total well cost (DCET) ($MM) $11.0 $11.0 $12.3 $9.5 $8.0
Condensate gas ratio (bbls/MMcf) 118 118 118 135 56
Condensate production (bbls/d) 491 564 714 316 239
NGL production (bbls/d) 287 330 422 141 120
Raw gas production (mcf/d) 3,984 4,573 5,855 2,232 3,862
Condensate recovery (mbbls) 468 510 510 325 248
NGL recovery (C2-C4) (mbbls) 502 548 548 309 163
Natural gas recovery (bcf) 5.9 6.4 6.4 4.1 4.7
Total EUR (mboe) 1,945 2,122 2,122 1,317 1,200
# 800 800 800 500 1,000Inventory of drilling locations
SENSITIVITIES - SPENDING FOCUS IN 2017
2017 program
(delineation & future
development)
Avera
ge 1
st
Year
EU
RIn
pu
ts
Half-Cycle IRR
Half-Cycle NPV10
Half-Cycle Supply cost (20% IRR)
Full-Cycle IRR
Full-Cycle NPV10
Full-Cycle Supply cost (20% IRR)
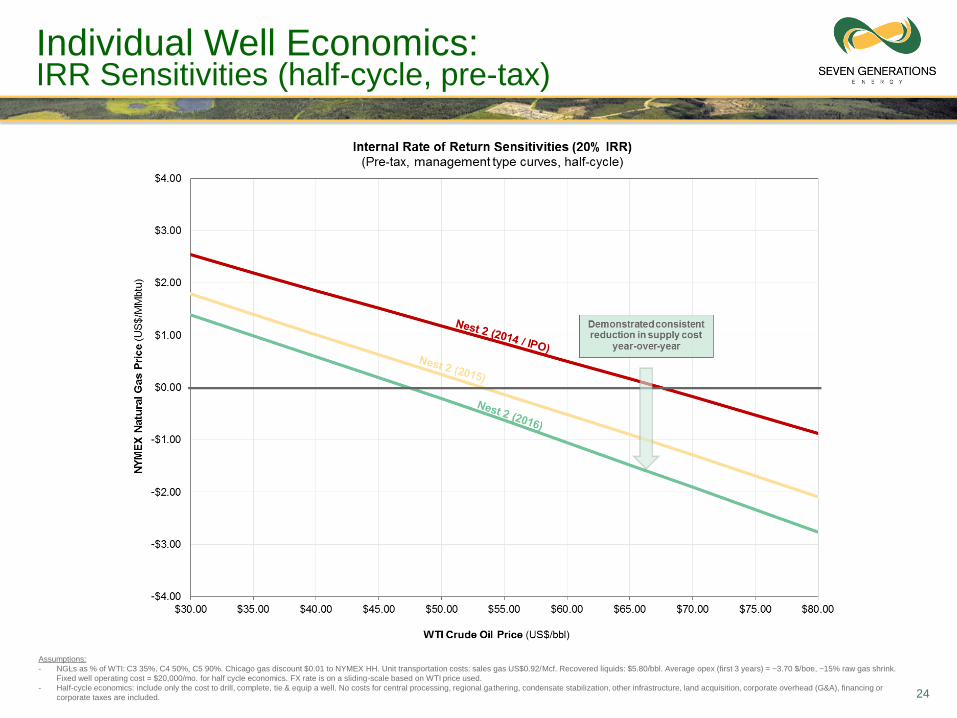
Individual Well Economics: IRR Sensitivities (half-cycle, pre-tax)
24
Assumptions:
- NGLs as % of WTI: C3 35%, C4 50%, C5 90%. Chicago gas discount $0.01 to NYMEX HH. Unit transportation costs: sales gas US$0.92/Mcf. Recovered liquids: $5.80/bbl. Average opex (first 3 years) = ~3.70 $/boe, ~15% raw gas shrink.
Fixed well operating cost = $20,000/mo. for half cycle economics. FX rate is on a sliding-scale based on WTI price used.
- Half-cycle economics: include only the cost to drill, complete, tie & equip a well. No costs for central processing, regional gathering, condensate stabilization, other infrastructure, land acquisition, corporate overhead (G&A), financing or
corporate taxes are included.
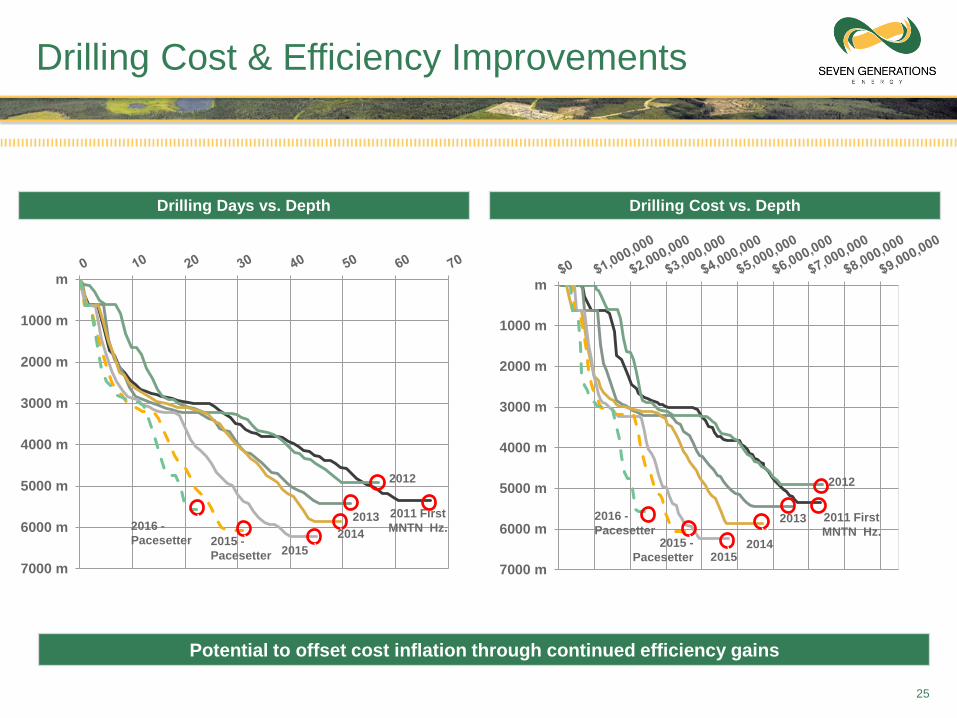
Drilling Cost & Efficiency Improvements
25
Drilling Days vs. Depth Drilling Cost vs. Depth
Potential to offset cost inflation through continued efficiency gains
m
1000 m
2000 m
3000 m
4000 m
5000 m
6000 m
7000 m
2011 First
MNTN Hz.
2012
2013v
2014v2015 -
Pacesetter
v
2015
2016 -
Pacesetter
m
1000 m
2000 m
3000 m
4000 m
5000 m
6000 m
7000 m
2011 First
MNTN Hz.
2012
2013
v2014v2015 -
Pacesetter
v2015
2016 -
Pacesetter
v
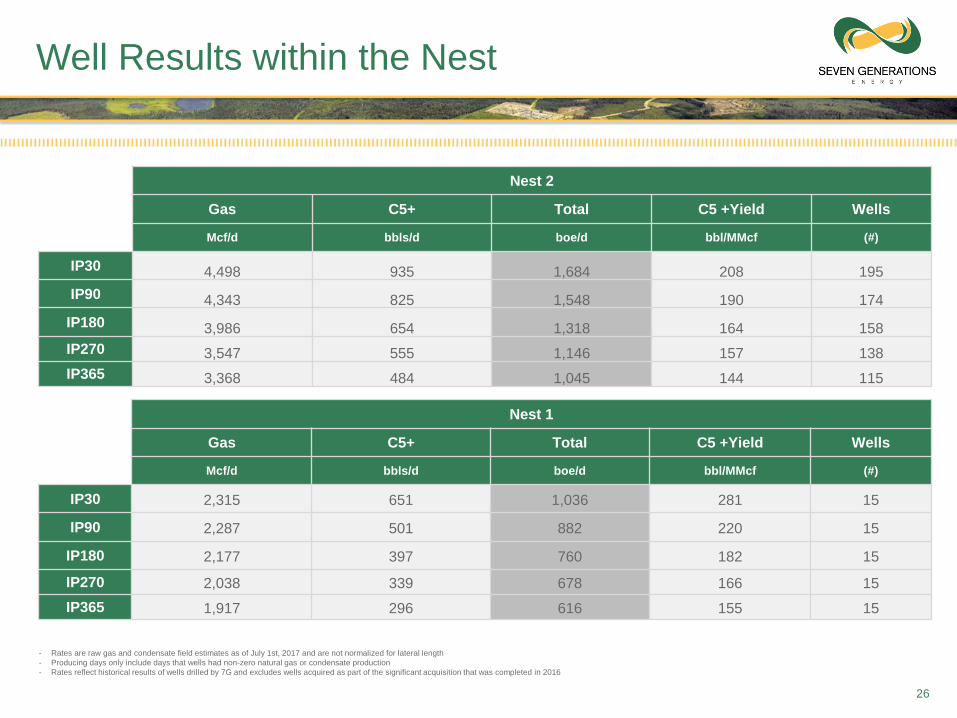
Well Results within the Nest
- Rates are raw gas and condensate field estimates as of July 1st, 2017 and are not normalized for lateral length
- Producing days only include days that wells had non-zero natural gas or condensate production
- Rates reflect historical results of wells drilled by 7G and excludes wells acquired as part of the significant acquisition that was completed in 2016
Nest 2
Gas C5+ Total C5 +Yield Wells
Mcf/d bbls/d boe/d bbl/MMcf (#)
IP30 4,498 935 1,684 208 195
IP90 4,343 825 1,548 190 174
IP180 3,986 654 1,318 164 158
IP270 3,547 555 1,146 157 138
IP365 3,368 484 1,045 144 115
Nest 1
Gas C5+ Total C5 +Yield Wells
Mcf/d bbls/d boe/d bbl/MMcf (#)
IP30 2,315 651 1,036 281 15
IP90 2,287 501 882 220 15
IP180 2,177 397 760 182 15
IP270 2,038 339 678 166 15
IP365 1,917 296 616 155 15
26
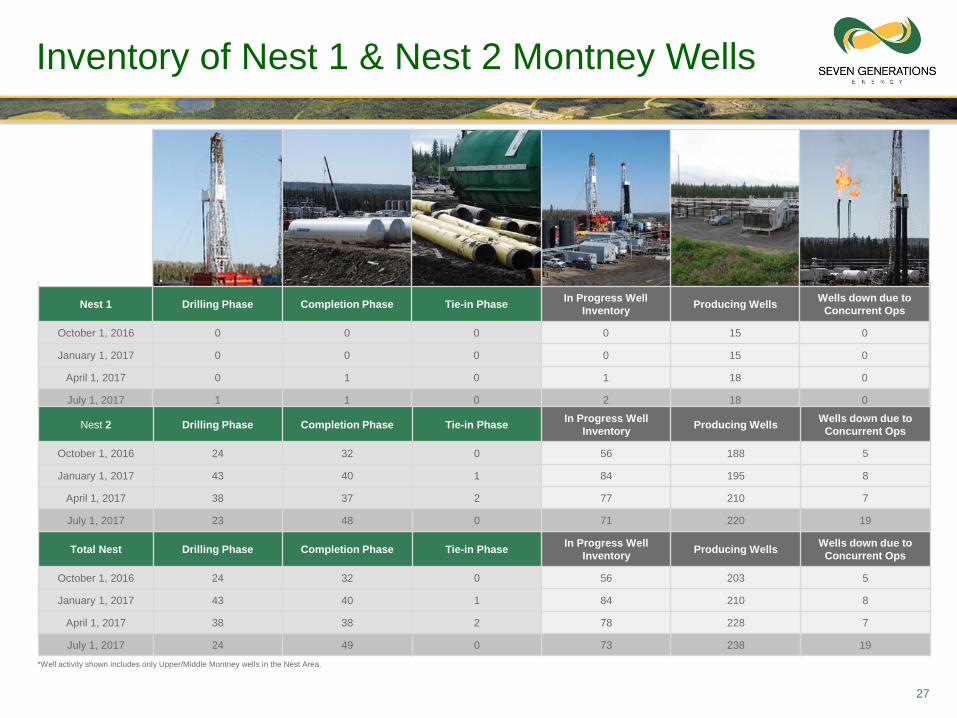
Inventory of Nest 1 & Nest 2 Montney Wells
Nest 1 Drilling Phase Completion Phase Tie-in PhaseIn Progress Well
InventoryProducing Wells
Wells down due to
Concurrent Ops
October 1, 2015 0 1 0 1 15 0
January 1, 2016 0 0 0 0 15 0
April 1, 2016 0 0 0 0 15 0
July 1, 2016 0 0 0 0 15 0
Total Nest Drilling Phase Completion Phase Tie-in PhaseIn Progress Well
InventoryProducing Wells
Wells down due to
Concurrent Ops
October 1, 2016 24 32 0 56 203 5
January 1, 2017 43 40 1 84 210 8
April 1, 2017 38 38 2 78 228 7
July 1, 2017 24 49 0 73 238 19
*Well activity shown includes only Upper/Middle Montney wells in the Nest Area.
27
Nest 1 Drilling Phase Completion Phase Tie-in PhaseIn Progress Well
InventoryProducing Wells
Wells down due to
Concurrent Ops
October 1, 2016 0 0 0 0 15 0
January 1, 2017 0 0 0 0 15 0
April 1, 2017 0 1 0 1 18 0
July 1, 2017 1 1 0 2 18 0
Nest 2 Drilling Phase Completion Phase Tie-in PhaseIn Progress Well
InventoryProducing Wells
Wells down due to
Concurrent Ops
October 1, 2016 24 32 0 56 188 5
January 1, 2017 43 40 1 84 195 8
April 1, 2017 38 37 2 77 210 7
July 1, 2017 23 48 0 71 220 19
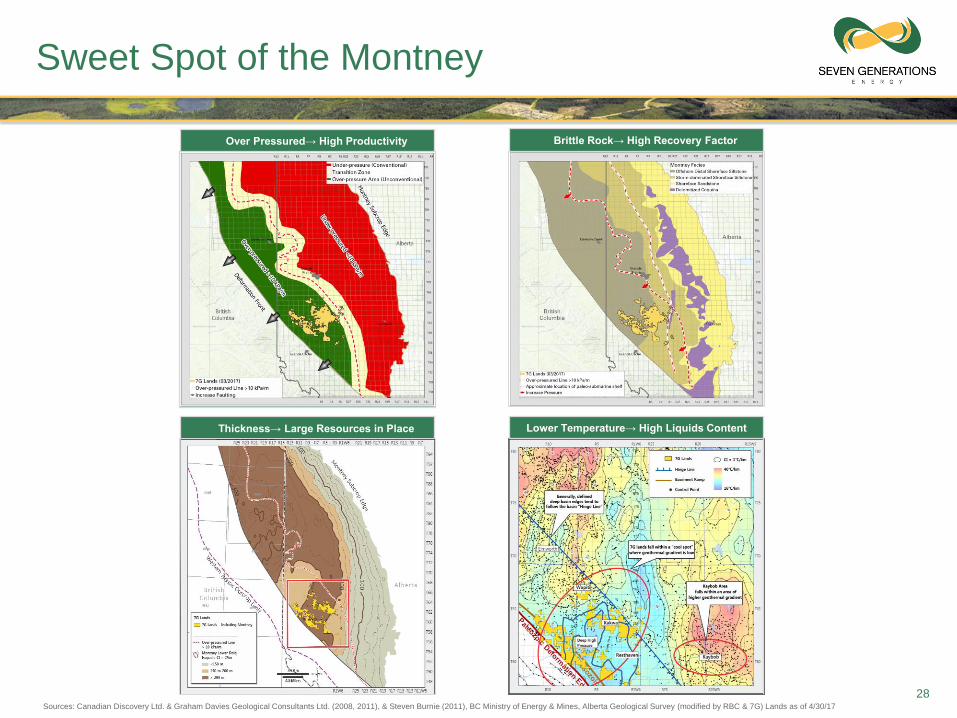
Sweet Spot of the Montney
Sources: Canadian Discovery Ltd. & Graham Davies Geological Consultants Ltd. (2008, 2011), & Steven Burnie (2011), BC Ministry of Energy & Mines, Alberta Geological Survey (modified by RBC & 7G) Lands as of 4/30/17
• Thickness→ Large Resources in Place
• Over Pressured→ High Productivity • Brittle Rock→ High Recovery Factor
28
Lower Temperature→ High Liquids Content
Important Notice
General Advisory
The information contained in this presentation does not purport to be all-
inclusive or contain all information that readers may require. Prospective
investors are encouraged to conduct their own analysis and review of Seven
Generations Energy Ltd. (“Seven Generations”, “7G”, the “company” or the
“Company”) and of the information contained in this presentation. Without
limitation, prospective investors should read the entire record of publicly filed
documents relating to the Company, consider the advice of their financial,
legal, accounting, tax and other professional advisors and such other factors
they consider appropriate in investigating and analyzing the Company. An
investor should rely only on the information provided by the Company and is
not entitled to rely on parts of that information to the exclusion of others. The
Company has not authorized anyone to provide investors with additional or
different information, and any such information, including statements in media
articles about Seven Generations, should not be relied upon. In this
presentation, unless otherwise indicated, all dollar amounts are expressed in
Canadian dollars.
An investment in the securities of Seven Generations is speculative and
involves a high degree of risk that should be considered by potential investors.
Seven Generations’ business is subject to the risks normally encountered in
the oil and gas industry and, more specifically, the shale and tight liquids-rich
natural gas sector of the oil and natural gas industry, and certain other risks
that are associated with Seven Generations’ stage of development. An
investment in the Company’s securities is suitable only for those purchasers
who are willing to risk a loss of some or all of their investment and who can
afford to lose some or all of their investment.
Non-IFRS Measures Advisory
In addition to using financial measures prescribed by International Financial
Reporting Standards (“IFRS”), references are made in this presentation to
“netbacks”, “operating netback”, “available funding”, “funds from operations”,
“funds flow per sshare”, “adjusted working capital”, “net debt”, “adjusted
earnings before interest, taxes, depreciation and amortization” or “adjusted
EBITDA”, “FactSet EBITDA” and “cash return on invested capital” or “CROIC”,
which are measures that do not have any standardized meaning as prescribed
by IFRS. Accordingly, the Company’s use of such terms may not be
comparable to similarly defined measures presented by other entities and
comparisons should not be made between such measures provided by the
Company and by other companies without also taking into account any
differences in the way that the calculations were prepared. For further details
about “operating netback”, “net debt”, “available funding”, “funds from
operations”, “adjusted working capital” and “adjusted EBITDA” see “Non-IFRS
Financial Measures” in the Company’s Management’s Discussion and
Analysis for three months ended March 31, 2017, which is available on the
SEDAR website at www.sedar.com.
“Adjusted EBITDA” as defined and calculated in the company’s Management
Discussion and Analysis is based on the covenant calculation in the
company’s credit facility. :”FactSet EBITDA” is calculated by a third party and
differs from adjusted EBITDA primarily through the exclusion of realized
hedging gains and losses.
Cash return on invested capital (“CROIC”) is FactSet EBITDA divided by the
average unamortized cost of developed and producing oil and natural gas
assets and is a performance measure of a company’s ability to generate
returns on capital investments. The 2016 CROIC of 15% reflects FactSet
EBITDA of $757.9 million divided by the average cost of oil and natural gas
assets of $5,104.6 million. The 2015 CROIC of 12% reflects FactSet EBITDA
of $334.2 million divided by the average cost of oil and natural gas assets of
$2,769.9 million.
Forward-Looking Information Advisory
This presentation contains certain forward-looking information and statements
that involve various risks, uncertainties and other factors. The use of any of
the words “anticipate”, “continue”, “estimate”, “expect”, “may”, “will”, “should”,
“believe”, “plans”, and similar expressions are intended to identify forward-
looking information or statements. In particular, but without limiting the
foregoing, this presentation contains forward-looking information and
statements pertaining to the following: the Company’s objectives, strategies
and competitive strengths; the ability to earn full cycle returns on capital
employed; the ability to leverage market access to capture premium markets;
ability to remain among North America’s lowest supply-cost gas developers;
expected production, profitable production growth and estimated quarterly
production per share; rig counts; anticipated liquids yields; well counts; the
Company’s planned capital investments and allocation of capital; ability to
optimize capital efficiencies and continuously improve returns on capital
invested; type curves; forecasted decline rates; cumulative production
expected based upon the utilization of certain specified completion designs;
estimated number of undeveloped drilling opportunities or drilling locations;
estimated recoveries; expectation that there are decades of drilling
opportunities in the Company’s Montney assets; anticipated drilling and
completion costs, facilities costs, and other costs in 2017; market access
options; forecasted half-cycle and full-cycle economics, including forecasted
NPVs, IRRs, price sensitivities and break-even prices; estimated future costs,
supply costs, cost reductions and cost performance; forecasted well
economics; planned development activities; resource potential from various
areas and formations within 7G’s development properties; ability to
commercialize assets outside of the Company’s Nest area; transportation and
processing capacity; expectation that the Company will have a new natural
gas processing plant online in 2018; future upside potential of the Deep SW
area, the Wapiti area, the Rich Gas area and shallower targets within the
Company’s properties; management’s estimation that there is significant
unverified resource in the Deep SW area, the Lower Montney formation and
Cretaceous formation; ability to continuously improve returns on capital
invested; estimated condensate demand in Alberta; and pressure, thickness,
geology and temperature estimates in the Montney formation. In addition,
references to reserves and resources are deemed to be forward-looking
information, as they involve the implied assessment, based on certain
estimates and assumptions, that the reserves and resources described exist in
the quantities predicted or estimated.
With respect to forward-looking information contained in this presentation,
assumptions have been made, regarding, among other things: that wells
drilled in the same fashion in the same formations in proximity to the type-
wells that were used in 7G’s type-curve forecasts will deliver similar production
results, including liquids yields; future oil, natural gas liquids and natural gas
prices; the Company’s ability to obtain qualified staff and equipment in a
timely and cost efficient manner; the Company’s ability to market production of
oil, NGLs and natural gas successfully to customers; the Company’s future
production levels; the applicability of technologies for the Company’s reserves;
future capital investments by the Company; future cash flows from production;
future sources of funding for the Company’s capital program; the Company’s
future debt levels; geological and engineering estimates in respect of the
Company’s reserves and resources estimates; the Company’s production
growth will be sufficient to meet firm transportation and processing capacity;
the geography of the areas in which the Company is conducting exploration
and development activities, and the access, economic and physical limitations
to which the Company may be subject from time to time; the impact of
competition; the regulatory framework governing royalties, taxes,
environmental and operational matters in the jurisdictions in which the
Company conducts its business and any other jurisdictions in which the
Company may conduct its business in the future; and the Company’s ability to
obtain financing on acceptable terms.
Assumptions made in the calculation of forecasted half-cycle and full-cycle
economics, including forecasted NPVs, IRRs, price sensitivities, commodity
prices and recovery factors, and the assumptions made in the preparation of
type-curves, are provided in footnotes proximate to those disclosures. An
assumption has also been made that further well delineation activities will
confirm management’s estimates regarding reservoir quality of its properties
that fall outside of the Company’s core development areas. With respect to
the estimated number of drilling locations or potential drilling opportunities that
are referenced herein, various assumptions have been made. These
assumptions are described under the heading “Note Regarding Potential
Drilling Opportunities” below.
32
Important Notice
(cont. from previous slide) Actual results could differ materially from those
anticipated in forward-looking information as a result of the risks and risk
factors that are set forth in the Company’s Annual Information Form dated
March 7, 2017 (the “AIF”), which is available on SEDAR at www.sedar.com,
including, but not limited to: the possibility of failure to realize the anticipated
benefits from the significant asset acquisition that was completed in 2016;
volatility in market prices and demand for oil, NGLs and natural gas, and
hedging activities related thereto; general economic, business and industry
conditions; variance of the Company’s actual capital costs, operating costs
and economic returns from those anticipated; the ability to find, develop or
acquire additional reserves and the availability of the capital or financing
necessary to do so on satisfactory terms; risks related to the exploration,
development and production of oil and natural gas reserves and resources;
negative public perception of oil sands development, oil and natural gas
development and transportation, hydraulic fracturing and fossil fuels; actions
by governmental authorities, including changes in government regulation,
royalties and taxation; the rescission, or amendment to the conditions of,
groundwater licenses of the Company; management of the Company’s
growth; the ability to successfully identify and make attractive acquisitions,
joint ventures or investments, or successfully integrate future acquisitions or
businesses; the availability, cost or shortage of rigs, equipment, raw materials,
supplies or qualified personnel; adoption or modification of climate change
legislation by governments; the absence or loss of key employees; uncertainty
associated with estimates of oil, NGLs and natural gas reserves and resources
and the variance of such estimates from actual future production; dependence
upon compressors, gathering lines, pipelines and other facilities, certain of
which the Company does not control; the ability to satisfy obligations under
the Company’s firm commitment transportation arrangements; the
uncertainties related to the Company’s identified drilling locations; the high-
risk nature of successfully stimulating well productivity and drilling for and
producing oil, NGLs and natural gas; operating hazards and uninsured risks;
risk of fires, floods and natural disasters; the possibility that the Company’s
drilling activities may encounter sour gas; execution risks associated with the
Company’s business plan; failure to acquire or develop replacement reserves;
the concentration of the Company’s assets in the Kakwa River Project area;
unforeseen title defects; aboriginal claims; failure to accurately estimate
abandonment and reclamation costs; development and exploratory drilling
efforts and well operations may not be profitable or achieve the targeted
return; horizontal drilling and completion technique risks and failure of drilling
results to meet expectations for reserves or production; limited intellectual
property protection for operating practices and dependence on employees and
contractors; third-party claims regarding the Company’s right to use
technology and equipment; expiry of certain leases for the undeveloped
leasehold acreage in the near future; failure to realize the anticipated benefits
of acquisitions or dispositions; failure of properties acquired now or in the
future to produce as projected and inability to determine reserve and resource
potential, identify liabilities associated with acquired properties or obtain
protection from sellers against such liabilities; changes in the application,
interpretation and enforcement of applicable laws and regulations; restrictions
on drilling intended to protect certain species of wildlife; potential conflicts of
interests; actual results differing materially from management estimates and
assumptions; seasonality of the Company’s activities and the Canadian oil and
gas industry; alternatives to and changing demand for petroleum products;
extensive competition in the Company’s industry; changes in the Company’s
credit ratings; dependence upon a limited number of customers; lower oil,
NGLs and natural gas prices and higher costs; failure of 2D and 3D seismic
data used by the Company to accurately identify the presence of oil and
natural gas; risks relating to commodity price hedging instruments; terrorist
attacks or armed conflict; cyber security risks, loss of information and
computer systems; inability to dispose of non-strategic assets on attractive
terms; security deposits required under provincial liability management
programs; reassessment by taxing authorities of the Company’s prior
transactions and filings; variations in foreign exchange rates and interest
rates; third-party credit risk including risk associated with counterparties in risk
management activities related to commodity prices and foreign exchange
rates; sufficiency of insurance policies; potential litigation; variation in future
calculations of non-IFRS measures; sufficiency of internal controls; breach of
agreements by counterparties and potential enforceability issues in contracts;
impact of expansion into new activities on risk exposure; inability of the
Company to respond quickly to competitive pressures; and the risks related to
the common Shares that are publicly traded and the Company’s senior notes
and other indebtedness, including the potential inability to comply with the
covenants in the credit agreement related to the Company’s credit facilities
and/or the covenants in the indentures in respect of the Company’s senior
unsecured notes.
Financial outlook and future-oriented financial information contained in this
presentation regarding prospective financial performance, financial position,
cash flows or well economics is based on assumptions about future events,
including economic conditions and proposed courses of action, based on
management’s assessment of the relevant information that is currently
available. Projected operational information also contains forward-looking
information and is based on a number of material assumptions and factors, as
are set out herein. Such projections may also be considered to contain future
oriented financial information or a financial outlook. The actual results of the
Company’s operations for any period will likely vary from the amounts set forth
in these projections, and such variations may be material. Actual results will
vary from projected results. Readers are cautioned that any such financial
outlook and future-oriented financial information contained herein should not
be used for purposes other than those for which it is disclosed herein.
The forward-looking statements included in this presentation are expressly
qualified by the foregoing cautionary statements and are made as of the date
of this presentation. The Company does not undertake any obligation to
publicly update or revise any forward-looking statements except as required by
applicable securities laws. No assurance can be given that these expectations
will prove to be correct and such forward-looking statements included in this
presentation should not be unduly relied upon. Certain information contained
herein has been prepared by third-party sources (and is identified as such)
and has not been independently audited or verified by the Company.
Presentation of Oil and Gas Information
Estimates of the Company’s reserves, contingent resources and prospective
resources and the net present value of future net revenue attributable to the
Company’s reserves, contingent resources and prospective resources are
based upon the reports prepared by McDaniel & Associates Consultants Ltd.
(“McDaniel”), the Company’s independent qualified reserves evaluator, as at
the effective dates that are specified in this presentation. The estimates of
reserves, contingent resources and prospective resources provided in this
presentation are estimates only and there is no guarantee that the estimated
reserves, contingent resources and prospective resources will be recovered.
Actual reserves, contingent resources and prospective resources may be
greater than or less than the estimates provided in this in this presentation and
the differences may be material. Estimates of net present value of future net
revenue attributable to the Company’s reserves, contingent resources and
prospective resources do not represent fair market value and there is
uncertainty that the net present value of future net revenue will be realized.
There is no assurance that the forecast price and cost assumptions applied by
McDaniel in evaluating Seven Generations’ reserves, contingent resources
and prospective resources will be attained and variances could be material.
There is no certainty that any portion of the prospective resources will be
discovered. If discovered, there is no certainty that it will be commercially
viable to produce any portion of the prospective resources. There is also
uncertainty that it will be commercially viable to produce any part of the
contingent resources. Estimates of net present value of future net revenue
from contingent resources and prospective resources are preliminary in nature
and are provided to assist the reader in reaching an opinion on the merit and
likelihood of the Company proceeding with the required investment. Such
estimates include contingent resources and prospective resources that are
considered too uncertain with respect to the chance of development and
chance of discovery to be classified as reserves. Readers should refer to the
AIF for a discussion of the significant factors relevant to the estimates of
prospective resources and contingent resources, a description of the Kakwa
River Project, including estimated costs and timelines and the specific
contingencies which prevent the classification of the Company’s contingent
resources as reserves.
This presentation includes estimates of contingent resources and prospective
resources, as at December 31, 2015 and December 31, 2016, that have been
risked by McDaniel for the probability of loss or failure in accordance with the
COGE Handbook. For contingent resources, the risk component relating to the
likelihood that an accumulation will be commercially developed is referred to
as the chance of development. For contingent resources the chance of
commerciality is equal to the chance of development. The contingent
resources evaluated by McDaniel, as at December 31, 2015 and December
31, 2016, were classified in the “development pending” project maturity sub-
class and are considered to have the highest chance of commerciality of all
resources other than reserves. In its December 31, 2015 and December 31,
2016 evaluations, McDaniel evaluated the risks and contingencies that were
relevant to the contingent resources, as are described in the AIF, and
determined that a 95% chance of development was appropriate for the
contingent resources that were assigned to the development pending project
maturity sub-class. The risked contingent resource volumes and associated
net present value, as at December 31, 2015 and December 31, 2016 were
determined by multiplying the un-risked volumes and values by the associated
chance of development that was estimated by McDaniel (i.e. 95%).
Prospective resources have both an associated chance of discovery and a
chance of development. Not all exploration projects will result in discoveries.
The chance that an exploration project will result in the discovery of petroleum
is referred to as the chance of discovery.
33
Important Notice
(cont. from previous slide) Thus, for an undiscovered accumulation, the
chance of commerciality is the product of two risk components — the chance
of discovery and the chance of development. McDaniel has sub-classified the
prospective resources that were evaluated, as at December 31, 2015 and as
at December 31, 2016, by maturity status, consistent with the requirements of
the COGE Handbook. The prospective resources associated with the upper
Montney, as at December 31, 2015 and as at December 31, 2016, were sub-
classified as “prospect” and the prospective resources associated with the
lower Montney were sub-classified as “lead”. The evaluation of the risks and
the risking process relevant to the upper Montney prospective resources and
the lower Montney prospective resources as at December 31, 2016 are
described in the AIF, and the evaluation of the risks and the risking process
relevant to the upper Montney prospective resources and the lower Montney
prospective resources at December 31, 2015 are described in the annual
information form dated March 8, 2016 (the “2015 AIF”) that are available on
SEDAR at www.sedar.com
Risks that could impact the chance of discovery and chance of development
are described in the AIF and include: geological uncertainty and uncertainty
regarding individual well drainage areas; uncertainty regarding the consistency
of productivity that may be achieved from lands with attributed resources;
potential delays in development due to product prices, access to capital,
availability of markets and/or take-away capacity; and uncertainty regarding
potential flow rates from wells and the economics of those wells. Significant
factors that may change the prospective resources and contingent resources
estimates are described in the AIF and include further delineation drilling,
which could change the estimates either positively or negatively, future
technology improvements, which would positively affect the estimates, and
additional transportation and processing capacity that could affect the volumes
recoverable or type of production. Additional facility design work, development
plans, reservoir studies and delineation drilling is expected to be completed by
the Company in accordance with its long-term resource development plan.
The reserves and resources information contained in this presentation should
be reviewed in conjunction with the AIF and 2015 AIF, which contain
important additional information regarding the independent reserve, contingent
resource and prospective resource evaluations that were conducted by
McDaniel and a description of, and important information about, the reserves
and resources terms used in this presentation. The AIF and 2015 AIF are
available on the SEDAR website at www.sedar.com.
Note Regarding Oil and Gas Metrics
This presentation includes certain oil and gas metrics, including barrels of oil
equivalent (“boes”), operating netback, finding and development (“F&D”) costs
and finding, development acquisition (“FD&A”) costs, and carbon intensity,
which do not have standardized meanings or standard methods of calculation
and therefore such measures may not be comparable to similar measures
used by other companies and should not be used to make comparisons. Such
metrics have been included herein to provide readers with additional
information to evaluate the Company’s performance; however, such measures
are not reliable indicators of the future performance of the Company and
future performance may not compare to the performance in previous periods
and therefore such metrics should not be relied upon.
Seven Generations has adopted the standard of 6 Mcf:1 bbl when converting
natural gas to oil equivalent. Condensate and other NGLs are converted to oil
equivalent at a ratio of 1 bbl:1 bbl. Boes may be misleading, particularly if
used in isolation. A boe conversion ratio of 6 Mcf:1 bbl is based roughly on an
energy equivalency conversion method primarily applicable at the burner tip
and does not represent a value equivalency at 7G’s sales points. Given the
value ratio based on the current price of oil as compared to natural gas is
significantly different from the energy equivalency of 6 Mcf: 1 bbl, utilizing a
conversion ratio at 6 Mcf: 1 bbl may be misleading as an indication of value.
Operating netback is calculated on a per boe basis and is determined by
deducting royalties, operating and transportation expenses from oil and
natural gas revenue and, except where otherwise indicated, after adjusting for
realized hedging gains or losses. Operating netback is utilized by the
Company and others to better analyze the operating performance of its oil and
natural gas assets.
FD&A costs are calculated as the sum of exploration and development capital,
plus acquisition capital, plus changes in future development costs for the given
year, divided by total reserve additions for that year, based upon the
independent reserves evaluations that were conducted by McDaniel. F&D
costs are calculated as the sum of exploration and development costs, plus
changes in future development costs (excluding future development capital
associated with acquisitions and dispositions), divided by reserve additions
(excluding reserves added via acquisitions), based upon the independent
reserves evaluations that were conducted by McDaniel. Both F&D costs and
FD&A costs have been presented since acquisition and disposition activity can
result in reserve replacement metrics that are not indicative of the long-term
cost structure that is expected from the Company’s assets.
The carbon intensity estimate provided herein was calculated by 7G with the
assistance of third parties. 7G quantified and reported its greenhouse gas
(“GHG”) emissions using what is referred to as the “operational control”
approach. 7G’s deemed organizational boundary included its corporate offices
and all natural gas extraction and processing facilities (including well pads).
7G elected to report its Scope 1 and 2 GHG emissions and not to report its
Scope 3 GHG emissions. For the purposes of 7G’s GHG emissions reporting:
• Scope 1 emissions were defined as direct emissions from GHG sources that
7G owned or controlled (including, but not limited to, emissions from stationary
equipment, mobile combustion, and process emissions and fugitive
emissions);
• Scope 2 emissions were defined as indirect GHG emissions that resulted
from 7G’s consumption of energy in the form of purchased electricity; and
• Scope 3 emissions were defined as 7G’s indirect emissions other than those
covered in Scope 2, including from all sources not owned or controlled by 7G,
but which occurred as a result of 7G’s activities.
Notably, 7G’s drilling and completion activities in the relevant period were
conducted by third parties and, consequently, those activities were deemed to
be Scope 3.
7G uses third parties to help quantify its GHG emissions. For the 2015
reporting year, Deloitte LLP was retained by Seven Generations to evaluate
GHG emissions from all major facilities located in Alberta (gas plants, gas
gathering systems and batteries) in accordance with Alberta’s Specified Gas
Emitters Regulation (“SGER”) reporting program, Alberta’s Specified Gas
Reporting Regulation, and Environment and Climate Change Canada’s
Greenhouse Gas Emissions Reporting Program, and to quantify 7G’s Scope 1
emissions for reporting purposes. To conduct this quantification, emission
calculation methods were taken from the approved reference sources listed in
the SGER guidance publication titled “Technical Guidance for Completing
Specified Gas Baseline Emission Intensity Applications”. Further quantification
of Scope 1 emissions and quantification Scope 2 emissions for reporting
purposes was conducted by DXD Consulting Inc. (“DXD”) using API 2009
guidance and emissions factors. The Carbon Disclosure Project’s (“CDP”)
CDP Climate Change 2016 Questionnaire was then prepared and filed by 7G
utilizing information that was provided by Deloitte LLP and DXD.
Note Regarding Type-Curves
The Nest 1 and Nest 2 type curves that have either been provided herein, or
have been used in connection with the forecasted economics and in
determining the estimated number of potential drilling opportunities that are
referred to in this presentation, have been estimated using a combination of a
statistical approaches to early-life production from 7G’s Nest 1 and Nest 2
wells, matched to volumetric estimates that are attributable to properties in the
Company’s Nest 1 and Nest 2 areas, based on known reservoir parameters.
Early-life statistics use data from the Company’s producing Nest 1 and Nest 2
wells, adjusted for stage count and lateral length on a producing rate versus
time basis, a cumulative volume versus time basis, and a producing rate
versus cumulative volume basis, to ensure a reasonable fit. The Company’s
historical drilling in its Nest 2 area has predominantly been in the upper and
middle intervals of the Montney formation with 77 wells providing the statistical
basis for anticipated future well results. The Company’s historical drilling in its
Nest 1 area has predominantly been in the upper and middle intervals of the
Montney formation, with 11 wells providing the statistical basis for anticipated
future well results.
In the report prepared by McDaniel dated March 7, 2017 evaluating the tight
oil, conventional natural gas, shale gas and NGL reserves attributable to
certain assets of Seven Generations as at December 31, 2016 (the “McDaniel
Reserves Report”), the report prepared by McDaniel dated March 7, 2017
evaluating the shale gas and NGL contingent resources attributable to certain
of the assets of Seven Generations as at December 31, 2016 (the “McDaniel
Contingent Resources Report”), and the report prepared by McDaniel dated
March 7, 2017 evaluating the shale gas and NGL prospective resources
attributable to certain of the assets of Seven Generations as at December 31,
2016 (the “McDaniel Prospective Resources Report”), McDaniel assigned
proved plus probable reserves to 78% of the Nest 2 sections evaluated; best
estimate contingent resources to 22% of the Nest 2 sections evaluated;
proved plus probable reserves to 50% of the Nest 1 sections evaluated; and
best estimate contingent resources to 50% of the Nest 1 sections evaluated.
The type-curve estimates in respect of the Wapiti & Rich Gas areas
referenced herein is almost identical to the type-curve that was used by
McDaniel in the preparation of the McDaniel Reserves Report, the McDaniel
Contingent Resources Report and the McDaniel Prospective Resources
Report. The Wapiti & Rich Gas type-curve uses a combination of statistical
approaches to early-life production from wells that were drilled by Seven
Generations’ competitors, matched to volumetric estimates that are
attributable to properties in the company’s Wapiti area based on expected
reservoir parameters. Early-life statistics use data from the type-wells,
adjusted for stage count and lateral length on a producing rate versus time
basis, a cumulative volume versus time basis, and a producing rate versus
cumulative volume basis, to ensure a reasonable fit. The type-wells are
located in the middle interval of the Montney formation, with 13 wells providing
the statistical basis for anticipated future well results.
34
Important Notice
(cont. from previous slide) Recoverable hydrocarbon calculations use
forecasted EUR factors applied to volumetric estimates and decline curves are
used to align early statistical results with the forecasted EURs. The EURs for
each type-curve area were estimated by qualified reserves evaluators from
Seven Generations based on estimated resources, the estimated number of
wells to be drilled in each section, estimated lateral well length and estimated
recovery factors. EURs do not have any standardized meaning and readers
are cautioned that the estimated EURs may not be comparable to EUR
estimates prepared by the company’s competitors. Actual EURs may vary
significantly from the company’s estimates.
The Company has opted to provide the type-curve forecasts that have been
prepared by qualified reserves evaluators from Seven Generations in this
document, rather than the type-curves that were prepared by McDaniel, since
the internally generated type-curves are what the company has used to
determine its production guidance, capital budget and development plans.
Note Regarding Potential Drilling Opportunities
The references to drilling locations or potential drilling opportunities that are
contained herein have been prepared by qualified reserves evaluators from
Seven Generations as at the date hereof. These estimates were prepared in
accordance with the standards set forth in the COGE Handbook.
Of the 800 potential drilling opportunities that are estimated to be contained
within in the company’s Nest 2 area: 72% were attributed proved plus
probable reserves in the McDaniel Reserves Report; 28% were attributed best
estimate contingent resources in the McDaniel Contingent Resources Report;
and 0% were attributed best estimate prospective resources in the McDaniel
Prospective Resources Report.
Of the 500 potential drilling opportunities that are estimated to be contained
within the company’s Nest 1 area: 46% were attributed proved plus probable
reserves in the McDaniel Reserves Report; 54% were attributed best estimate
contingent resources in the McDaniel Contingent Resources Report; and 0%
were attributed best estimate prospective resources in the McDaniel
Prospective Resources Report.
Of the 1,000 potential drilling opportunities that are estimated to be contained
within the company’s Wapiti & Rich Gas area: 8% were attributed proved plus
probable reserves in the McDaniel Reserves Report; 47% were attributed best
estimate contingent resources in the McDaniel Contingent Resources Report;
and 45% were attributed best estimate prospective resources in the McDaniel
Prospective Resources Report.
For the purposes of estimating potential drilling opportunities, the company
has assumed that natural gas production will be delivered through Alliance
Pipeline and that liquids will be extracted at 7G’s wholly-owned plants in
Alberta and also at Aux Sable’s facilities near Chicago, Illinois.
Oil and Gas Definitions
“best estimate” is a classification of estimated resources described in the
Canadian Oil and Gas Evaluation Handbook, which is considered to be the
best estimate of the quantity that will actually be recovered. It is equally likely
that the actual quantities recovered will be greater or less than the best
estimate. Resources in the best estimate case have a 50% probability that the
actual quantities recovered will equal or exceed the estimate.
“COGE Handbook” means the Canadian Oil and Gas Evaluation Handbook
maintained by the Society of Petroleum Evaluation Engineers (Calgary
Chapter), as amended from time to time.
“contingent resources” are the quantities of petroleum estimated, as of a
given date, to be potentially recoverable from known accumulations using
established technology or technology under development, but which are not
currently considered to be commercially recoverable due to one or more
contingencies. Contingencies are conditions that must be satisfied for a
portion of contingent resources to be classified as reserves that are: (a)
specific to the project being evaluated; and (b) expected to be resolved within
a reasonable timeframe. Contingencies may include factors such as
economic, legal, environmental, political and regulatory matters or a lack of
markets. It is also appropriate to classify as contingent resources the
estimated discovered recoverable quantities associated with a project in the
early evaluation stage.
“developed producing reserves” are those reserves that are expected to be
recovered from completion intervals open at the time of the estimate. These
reserves may be currently producing or, if shut in, they must have previously
been on production, and the date of resumption of production must be known
with reasonable certainty.
“developed reserves” are those reserves that are expected to be recovered
from existing wells and installed facilities or, if facilities have not been
installed, that would involve a low expenditure (for example, when compared
to the cost of drilling a well) to put the reserves on production. The developed
category may be subdivided into producing and non-producing.
“development pending” is a sub-classification of contingent resources
estimates based upon project maturity which is appropriate where resolution
of the final conditions for development is being actively pursued (high chance
of development).
“gross” means: (i) in relation to the Company’s interest in production,
reserves, contingent resources or prospective resources, its “company gross”
production, reserves, contingent resources or prospective resources, which
are the Company’s working interest (operating or non-operating) share before
deduction of royalties and without including any royalty interests of the
Company; (ii) in relation to wells, the total number of wells in which a company
has an interest; and (iii) in relation to properties, the total area of properties in
which the Company has an interest.
“lead” is a sub-classification of prospective resources estimates based upon
project maturity which is appropriate where a potential accumulation is within
a play requires more data acquisition and/or evaluation in order to be
classified as a prospect.
“liquids” refers to oil, condensate and other NGLs.
“net” means: (i) in relation to the Company’s interest in production or
reserves, the Company’s working interest (operating or non-operating) share
after deduction of royalty obligations, plus the Company’s royalty interest in
production or reserves; (ii) in relation to the Company’s interest in wells, the
number of wells obtained by aggregating the Company’s working interest in
each of its gross wells; and (iii) in relation to the Company’s interest in a
property, the total area in which the Company has an interest multiplied by the
working interest owned by the Company.
“probable reserves” are those additional reserves that are less certain to be
recovered than proved reserves. It is equally likely that the actual remaining
quantities recovered will be greater or less than the sum of the estimated
proved plus probable reserves.
“prospect” is a sub-classification of prospective resources estimates based
upon project maturity which is appropriate where a potential accumulation
within a play is sufficiently well defined to present a viable drilling target.
“prospective resources” means quantities of petroleum estimated, as of a
given date, to be potentially recoverable from undiscovered accumulations by
application of future development projects. Prospective resources have both
an associated chance of discovery and a chance of development.
“proved reserves” are those reserves that can be estimated with a high
degree of certainty to be recoverable. It is likely that the actual remaining
quantities recovered will exceed the estimated proved reserves.
“reserves” are estimated remaining quantities of oil and natural gas and
related substances anticipated to be recoverable from known accumulations,
as of a given date, based on: (i) analysis of drilling, geological, geophysical
and engineering data; (ii) the use of established technology; and (iii) specified
economic conditions, which are generally accepted as being reasonable.
Reserves are classified according to the degree of certainty associated with
the estimates.
“risked” means adjusted for the probability of loss or failure in accordance
with the COGE Handbook.
35
Abbreviations
AB
AECO
bbl or bbls
bcf
boe
Btu
C*
°C
CAD or C$
CAGR
CGR
Chi CG
CROIC
C2
C3
C4
C5+
d
DCET
Deep SW
EBITDA
EUR
F&D
FD&A
ft
FX
FY
Gj
H1
H2
H2S
HH
IP 30
IP 90
IP 180
IP 270
IP 365
IPO
IRR
km
kpa
LGR
LNG
LPG
m
Mbbls
Mboe
Alberta
physical storage and trading hub for natural gas on the TransCanada Alberta
transmission system
barrels or barrels
billion cubic feet
barrels of oil equivalent
British thermal units
The drilling and completion cost allowance under the Alberta Modernized Royalty
Framework
Degrees celsius
Canadian dollars
compound annual growth rate
condensate/gas ratio
Chicago Citygate
cash return on invested capital
ethane
propane
butane
pentanes plus
day
drill complete and tie-in
The area that the company refers to as Deep Southwest that is shown in this
presentation
earnings before interest, taxes, depreciation and amortization
estimated ultimate recovery
finding and development cost
Finding, development and acquisition cost
feet
foreign exchange rate
full year
Gigajoule
first half of the year
second half of the year
hydrogen sulfide
Henry Hub
initial production for the first 30 days
initial production for the first 90 days
initial production for the first 180 days
initial production for the first 270 days
initial production for the first 365 days
initial public offering
internal rate of return
kilometres
Kilopascals
liquid/gas ratio
liquefied natural gas
liquefied petroleum gas
metres
thousand of barrels
thousands of barrels of oil equivalent
Mcf
MM
MMboe
Mmbtu
MMcf
MNTN. Hz
mo
Nest
Nest 1
Nest 2
NGL
NGPL
NGTL
NPV
NPV10
NPV20
NYMEX
OPEX
PDP
PP&E
PSI
prospectus
Prosp. Res.
Q1
Q2
Q3
Q4
Rich Gas
ROY
sh
Super Pad
TCPL
TSX
U.S.
USD or US$
Wapiti
WI
WTI
YE
YoY
YTD
1P
2C
2P
$MM or MM$
Δ
thousand cubic feet
million
million barrels of oil equivalent
million British thermal units
million cubic feet
Montney horizontal well
month
Both the Nest 1 and Nest 2 areas combined
The area that is contained within the primary development block of the Kakwa River Project that is shown
and described in this presentation
The higher return prospects that are contained within the primary development block of the Kakwa River
Project that is shown and described in this presentation
natural gas liquids
Natural Gas Pipeline Company of America pipeline system
NOVA Gas Transmission Ltd. Pipeline system
net present value
net present value discounted at an annual 10% discount rate
net present value discounted at an annual 20% discount rate
New York Mercantile Exchange
operating expense
gross proved developed producing reserves
Property, plant and equipment
pounds per square inch
supplemented PREP Prospectus filed by the Company on October 29, 2014
gross prospective resources (best estimate)
First quarter of the year
Second quarter of the year
Third quarter of the year
Fourth quarter of the year
the area that the company refers to as Rich Gas in this presentation
rest of year
share
decentralized processing plants that separate field condensate and natural gas
TransCanada Pipelines
Toronto Stock Exchange
United States of America
United Stated dollars
the area that the company refers to as Wapiti in this presentation
working interest
West Texas Intermediate
year-end
year-over-year
year to date
gross total proved reserves
gross best estimate contingent resources
gross total proved plus probable reserves
millions of dollars
change
36