hewlett packard - fundamental research report
TRANSCRIPT
Hewlett Packard (NYSE-HPQ)
TERM PAPER
Usman Riaz
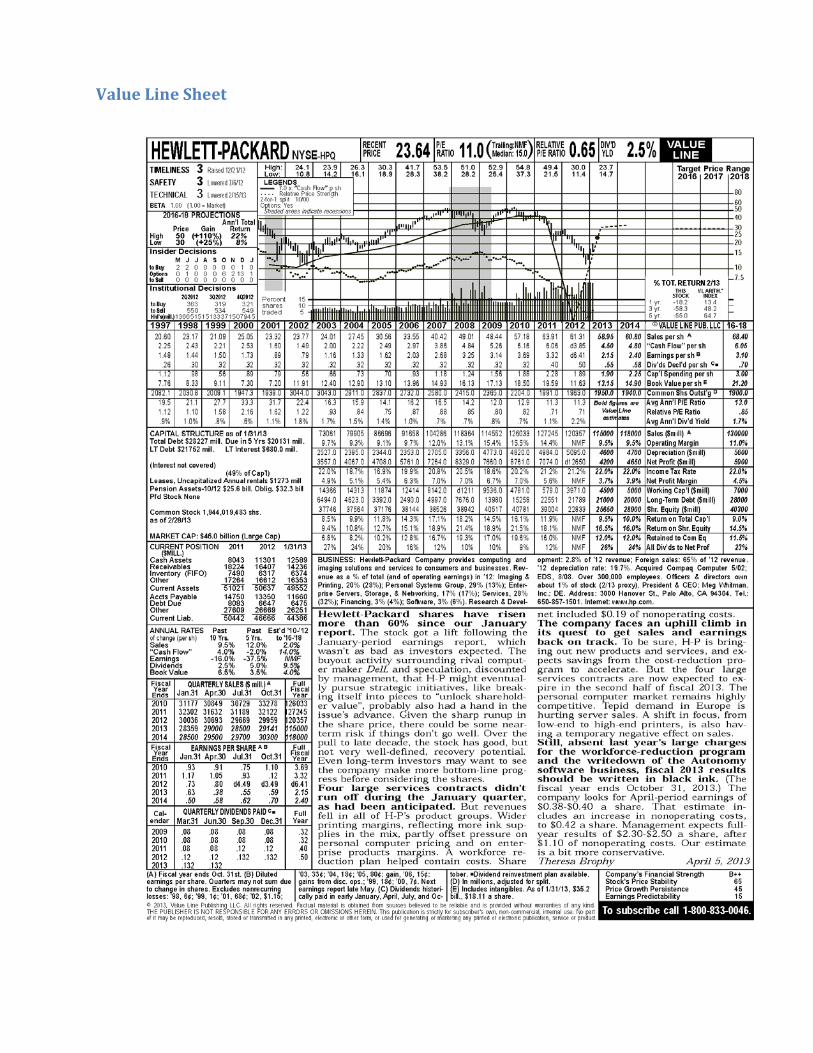
Summary Hewlett Packard is recovering from a slum that saw its stock price fell to 10 year low in November 2012. This was mainly due to the acquisition of Autonomy that proved to be overpriced. Hewlett Packard is back and doing great and its stock has gained more than 60% since November 2012. Hewlett Packard is one of the leading global providers of computing and imaging solutions and services for business and home. The company is focused on capitalizing on the opportunities of the Internet and the proliferation of electronic services. Earnings are expected to rise due to the good outlook of the company. Consequently I find the stock to be growing steadily after a decline and the company doing extremely good in the market. The recovery power of the stock indicates why long term investors will always be interested in the stock. I would suggest holding the stock.
Consensus I think there is always going to be a growth in technology based companies. With Hewlett Packard being one of the leading technological companies in the world it will never have a negative growth. Technology is something that never stops and innovations and inventions are coming out every now and then. Besides that, there is an upgrade cost for computers and other technology related equipment that every company has to bear periodically. So there is one thing for sure that Hewlett Packard has a positive growth.
Now the question arises that how much is the growth. For that I have taken in account the current situation of Hewlett Packard, its market share, its competitors, and buyer preferences when choosing a brand. The current situation at Hewlett Packard is getting better by the day. The analysts are giving a positive rating to Hewlett Packard and are very hopeful of the stock going up. The market share of Hewlett Packard at this time is the highest in US for PC Vendors and printers. So as reported by International Data Corporation, I have used 16.0% as the market share of Hewlett Packard.
Growth in Earnings should be moderately growing. Hewlett Packard is doing great in the market and its sales have grown in the current year. The earnings are going to increase given the performance continues. Although there are problems that Hewlett Packard is facing in increasing the sales, still it is more probable that the sales will increase. After a damaging 2012, the recovery has been significant and above expectations. Taking all these factors and the strong competitors such as Apple, Dell and Lenovo in consideration, I expect the company’s earnings to grow at 3%. This figure seems very suitable to me because the growth is restricted but definite, plus the upgrading which is essentials for the clients will always be there for Hewlett Packard. So new sales, upgrades, service and maintenance will be the main sources of revenue for the company.
Hewlett Packard faces a challenge of being in the industry where it faces some of the fiercest competitors. Giants such as Apple, Dell, Lenovo and Samsung are a few names worth mentioning. Hewlett Packard although doing great and having the highest market share in the US, is not the leader
worldwide. So with the situation Hewlett Packard is in, I think Hewlett Packard will show a moderate growth.
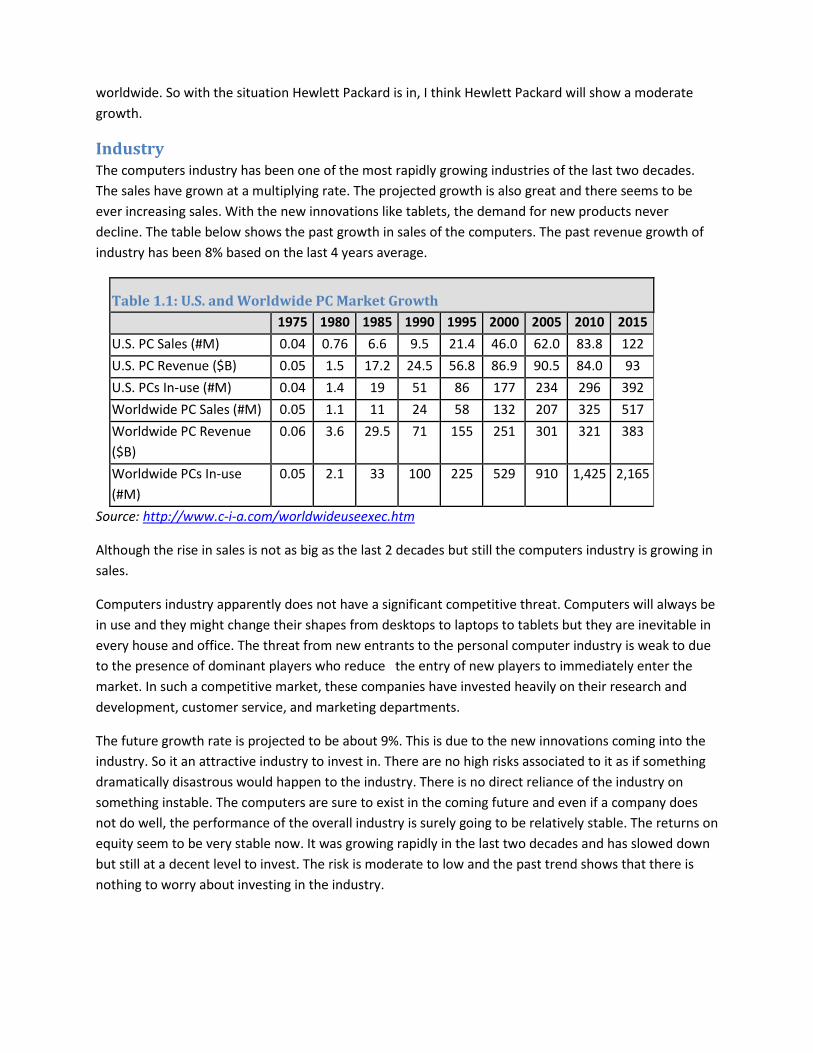
Industry The computers industry has been one of the most rapidly growing industries of the last two decades. The sales have grown at a multiplying rate. The projected growth is also great and there seems to be ever increasing sales. With the new innovations like tablets, the demand for new products never decline. The table below shows the past growth in sales of the computers. The past revenue growth of industry has been 8% based on the last 4 years average.
Table 1.1: U.S. and Worldwide PC Market Growth 1975 1980 1985 1990 1995 2000 2005 2010 2015
U.S. PC Sales (#M) 0.04 0.76 6.6 9.5 21.4 46.0 62.0 83.8 122 U.S. PC Revenue ($B) 0.05 1.5 17.2 24.5 56.8 86.9 90.5 84.0 93 U.S. PCs In-use (#M) 0.04 1.4 19 51 86 177 234 296 392 Worldwide PC Sales (#M) 0.05 1.1 11 24 58 132 207 325 517 Worldwide PC Revenue ($B)
0.06 3.6 29.5 71 155 251 301 321 383
Worldwide PCs In-use (#M)
0.05 2.1 33 100 225 529 910 1,425 2,165
Source: http://www.c-i-a.com/worldwideuseexec.htm
Although the rise in sales is not as big as the last 2 decades but still the computers industry is growing in sales.
Computers industry apparently does not have a significant competitive threat. Computers will always be in use and they might change their shapes from desktops to laptops to tablets but they are inevitable in every house and office. The threat from new entrants to the personal computer industry is weak to due to the presence of dominant players who reduce the entry of new players to immediately enter the market. In such a competitive market, these companies have invested heavily on their research and development, customer service, and marketing departments.
The future growth rate is projected to be about 9%. This is due to the new innovations coming into the industry. So it an attractive industry to invest in. There are no high risks associated to it as if something dramatically disastrous would happen to the industry. There is no direct reliance of the industry on something instable. The computers are sure to exist in the coming future and even if a company does not do well, the performance of the overall industry is surely going to be relatively stable. The returns on equity seem to be very stable now. It was growing rapidly in the last two decades and has slowed down but still at a decent level to invest. The risk is moderate to low and the past trend shows that there is nothing to worry about investing in the industry.
Company Hewlett-Packard Company or Hewlett Packard is an American multinational information technology corporation headquartered in Palo Alto, California, United States. Founded in 1939 by Bill Hewlett and Dave Packard, Hewlett-Packard Co. is a global provider of products, technologies, software solutions, and services to individual consumers, small- and medium-sized businesses and large enterprises, including the public and education sectors. It specializes in developing and manufacturing computing, data storage, and networking hardware, designing software and delivering services. Major product lines include personal computing devices, enterprise, and industry standard servers, related storage devices, networking products, software and a diverse range of printers, and other imaging products.
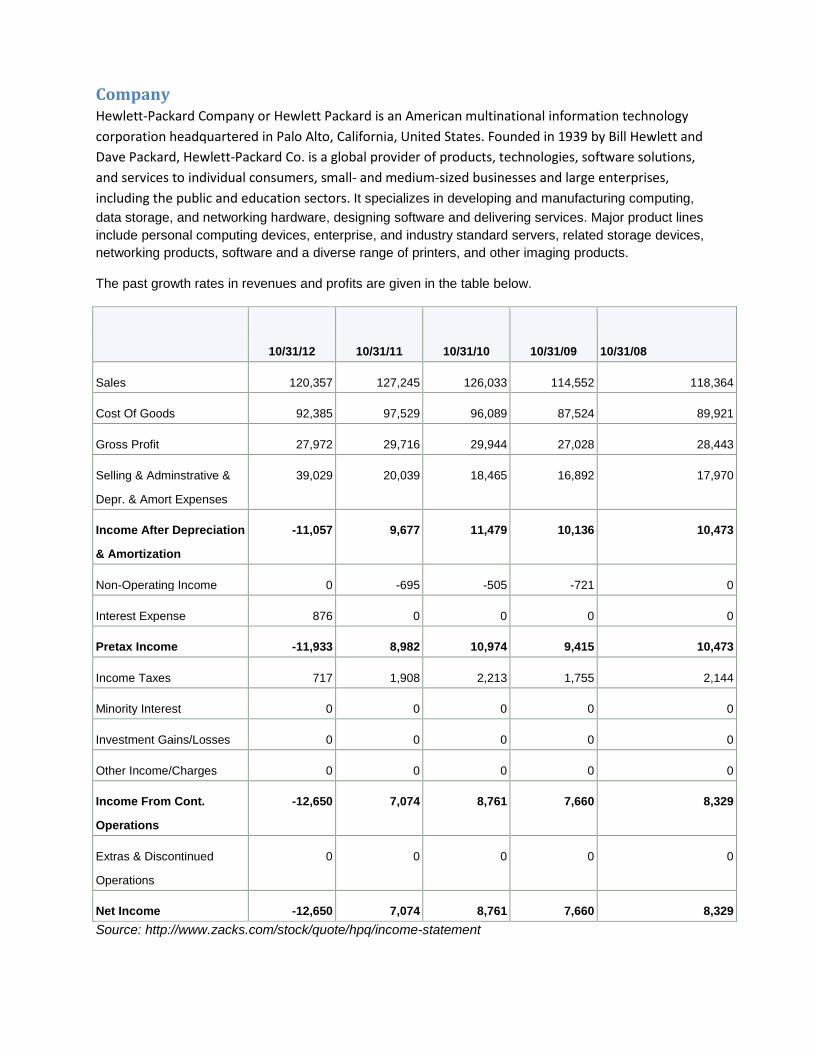
The past growth rates in revenues and profits are given in the table below.
10/31/12 10/31/11 10/31/10 10/31/09 10/31/08
Sales 120,357 127,245 126,033 114,552 118,364
Cost Of Goods 92,385 97,529 96,089 87,524 89,921
Gross Profit 27,972 29,716 29,944 27,028 28,443
Selling & Adminstrative &
Depr. & Amort Expenses
39,029 20,039 18,465 16,892 17,970
Income After Depreciation
& Amortization
-11,057 9,677 11,479 10,136 10,473
Non-Operating Income 0 -695 -505 -721 0
Interest Expense 876 0 0 0 0
Pretax Income -11,933 8,982 10,974 9,415 10,473
Income Taxes 717 1,908 2,213 1,755 2,144
Minority Interest 0 0 0 0 0
Investment Gains/Losses 0 0 0 0 0
Other Income/Charges 0 0 0 0 0
Income From Cont.
Operations
-12,650 7,074 8,761 7,660 8,329
Extras & Discontinued
Operations
0 0 0 0 0
Net Income -12,650 7,074 8,761 7,660 8,329 Source: http://www.zacks.com/stock/quote/hpq/income-statement
As we can see that there was an increase in revenue from 2009 to 2011 of an average 5%. There after the revenue declined in 2012 by 6%. The profits for the years 2008 – 2011 have been stable but Hewlett Packard suffered a loss in 2012. This was also due to the bad acquisition of Autonomy. The growth rate of Hewlett Packard has been a little lower than that of the whole industry. The main reason that I identified is that Hewlett Packard, unlike some other competitors does not make all the products. So it specializes in the products that it manufactures. But the company is doing well and making a comeback. The new ventures such as cloud computing have proved to be a real success and showing on the company’s income statement. The company has reported earnings of 1,232 Million for the first quarter of 2013. This is very impressive considering the poor performance in 2012 and the Autonomy acquisition that left the company in trouble.
Hewlett Packard is a high quality company. The strength of the stock to bounce back from a slum shows the ability of the company. The company has been rated BBB+ by most of the big rating companies.
SWOT Below is the SWOT analysis of Hewlett Packard.
Strengths: • Brand name recognition is a key strength of Hewlett Packard. People have a high perception of
the company and it is known for its good quality products. • Has successfully transformed from a B2B only company to a consumer based company. It has
become one of the biggest names in the consumer market • One of the 11 most recognizable brands in 2012 Best Global Brands. Source: interbrand.com • Has achieved economies of scale to minimize the cost and maximize profits. • Diversification in 4 different product lines gives Hewlett Packard the advantage over its
competitors and makes it less dependent on a specific product. • The market share of Hewlett Packard is rated as the highest in US market. • Some very successful acquisitions of Compaq (2002), Mercury Interactive (2006) and Electronic
Data Systems Corporation (2008) and 3Com (2010). These all proved to be great moves for the company.
Weaknesses • Hewlett Packard does not have significant software product and consulting services as
compared to its competitors such as IBM. • Hewlett Packard has always been known for its lack of good account management.
Opportunities • Hewlett Packard has invested in cloud computing which is turning out to be a great investment.
Hewlett Packard’s SaaS named Hewlett Packard Cloud Assure is already in the market to help business effectively adopt the cloud based services.
• Hewlett Packard can also transform one of its weakness to an opportunity if it start offering consulting services like IBM and Accenture.
• Hewlett Packard has been slow in coming into new markets such as tablets. I think tablets are a great product and Hewlett Packard should be coming up with more models.
• Hewlett Packard can also step up into mobile phone markets. Hewlett Packard was one of the leaders in PDA’s and pocket computers in the last decade but somehow has not continued its adventure and has not taken the challenge of coming into the mobile phone market.
Threats • Forecasters predict a decrease in the demand for various IT products. The economic slowdown
has negatively affected many market segments, including information technology. Hewlett Packard has experienced this decline not only in the U.S. but also in its global markets compared to the past.
• The competitors of Hewlett Packard are big giants. Hewlett Packard although has the greatest market share but it faces severe competition from companies like Dell, Apple, Acer, Lenovo and Samsung. In some parts of the world Hewlett Packard is not even in the top 3 manufacturers. So to compete with companies like Lenovo which price its products aggressively, Hewlett Packard has to cut down its profits to stay competitive in the market.
• The serious threat that Hewlett Packard and the other tech companies are facing is a rapid technological change. Companies are under the pressure to release the new products faster and faster.
Finance Hewlett Packard has a strong balance sheet that has a current assets of $50 Billion. The ratios are also showing that it is liquid. Some of the key ratios are given below. Although not the best in its industry but as a company these ratios depict a relatively strong balance sheet.
Current Ratio: 1.09
Quick Ratio: 0.66
Cash Ratio: 0.24
Being such a huge company the cash flows are strong. Although there has been a decline in the cash flow from last years but still the company has a strong cash flow statement.
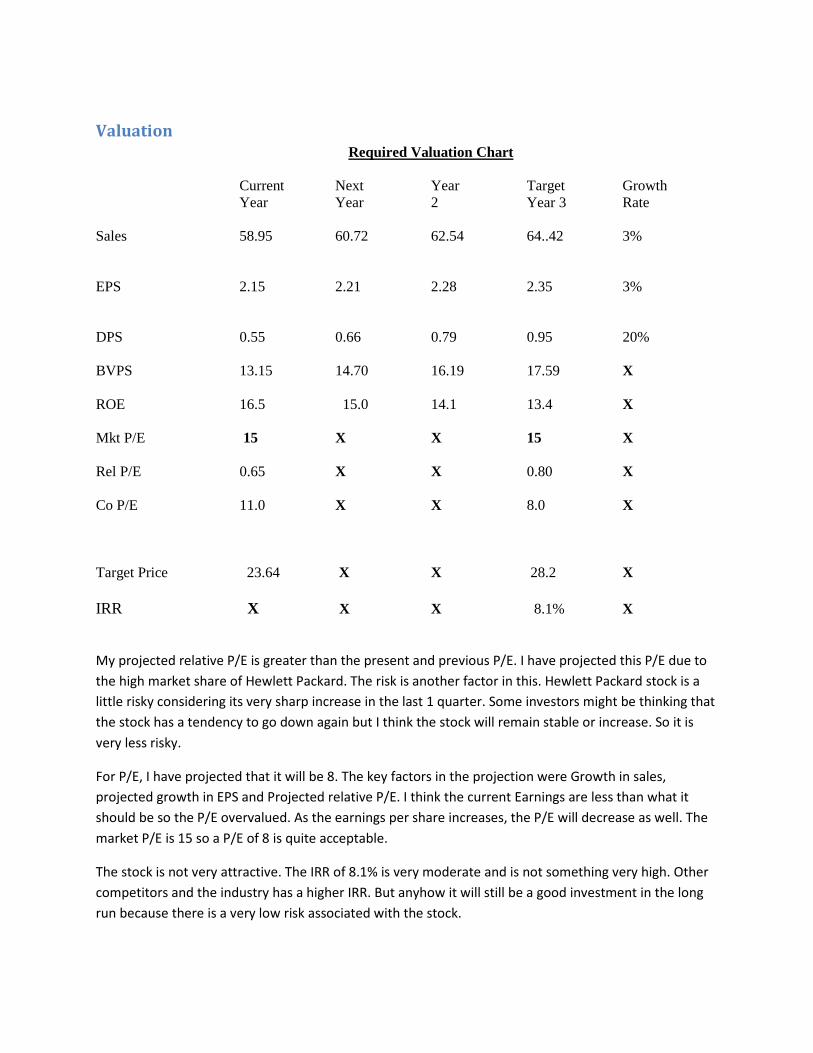
Valuation Required Valuation Chart
Current Next Year Target Growth Year Year 2 Year 3 Rate
Sales 58.95 60.72 62.54 64..42 3%
EPS 2.15 2.21 2.28 2.35 3%
DPS 0.55 0.66 0.79 0.95 20%
BVPS 13.15 14.70 16.19 17.59 X
ROE 16.5 15.0 14.1 13.4 X
Mkt P/E 15 X X 15 X
Rel P/E 0.65 X X 0.80 X
Co P/E 11.0 X X 8.0 X Target Price 23.64 X X 28.2 X IRR X X X 8.1% X
My projected relative P/E is greater than the present and previous P/E. I have projected this P/E due to the high market share of Hewlett Packard. The risk is another factor in this. Hewlett Packard stock is a little risky considering its very sharp increase in the last 1 quarter. Some investors might be thinking that the stock has a tendency to go down again but I think the stock will remain stable or increase. So it is very less risky.
For P/E, I have projected that it will be 8. The key factors in the projection were Growth in sales, projected growth in EPS and Projected relative P/E. I think the current Earnings are less than what it should be so the P/E overvalued. As the earnings per share increases, the P/E will decrease as well. The market P/E is 15 so a P/E of 8 is quite acceptable.
The stock is not very attractive. The IRR of 8.1% is very moderate and is not something very high. Other competitors and the industry has a higher IRR. But anyhow it will still be a good investment in the long run because there is a very low risk associated with the stock.

The stock has a very low risk associated to it. The Beta of 1 suggests that the movement of stock will be corresponding to the industry’s beta. So the risk is minimal. The earnings are not volatile except for the last two quarters of 2012. Hence a little risk is still associated to the stock. The balance sheet is still very powerful and the critical ratios are indicating the strength of the company even in this rebuilding period. So there is a very minimal risk attached to the stock but still it is a good long term investment.
Bibliography
www.valueline.com
www.morningstar.com
http://www.zacks.com
http://finance.yahoo.com
http://www.c-i-a.com/
http://www.nasdaq.com
Value Line Sheet
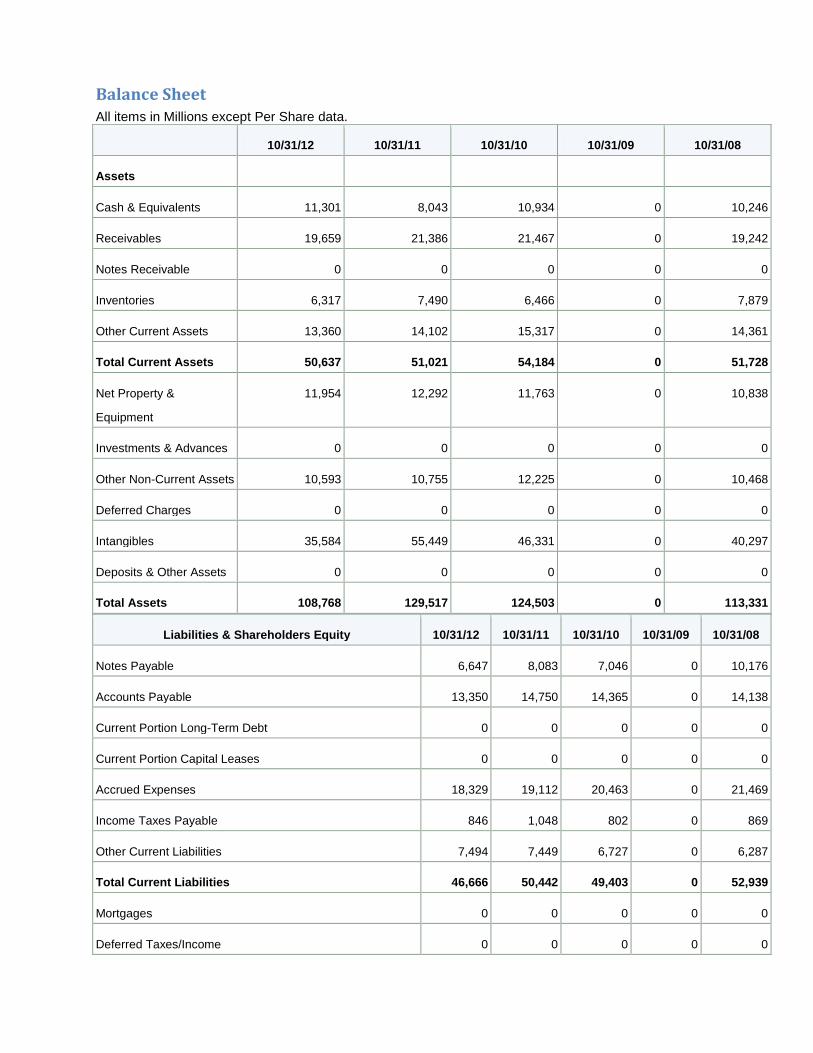
Balance Sheet All items in Millions except Per Share data.
10/31/12 10/31/11 10/31/10 10/31/09 10/31/08
Assets
Cash & Equivalents 11,301 8,043 10,934 0 10,246
Receivables 19,659 21,386 21,467 0 19,242
Notes Receivable 0 0 0 0 0
Inventories 6,317 7,490 6,466 0 7,879
Other Current Assets 13,360 14,102 15,317 0 14,361
Total Current Assets 50,637 51,021 54,184 0 51,728
Net Property &
Equipment
11,954 12,292 11,763 0 10,838
Investments & Advances 0 0 0 0 0
Other Non-Current Assets 10,593 10,755 12,225 0 10,468
Deferred Charges 0 0 0 0 0
Intangibles 35,584 55,449 46,331 0 40,297
Deposits & Other Assets 0 0 0 0 0
Total Assets 108,768 129,517 124,503 0 113,331
Liabilities & Shareholders Equity 10/31/12 10/31/11 10/31/10 10/31/09 10/31/08
Notes Payable 6,647 8,083 7,046 0 10,176
Accounts Payable 13,350 14,750 14,365 0 14,138
Current Portion Long-Term Debt 0 0 0 0 0
Current Portion Capital Leases 0 0 0 0 0
Accrued Expenses 18,329 19,112 20,463 0 21,469
Income Taxes Payable 846 1,048 802 0 869
Other Current Liabilities 7,494 7,449 6,727 0 6,287
Total Current Liabilities 46,666 50,442 49,403 0 52,939
Mortgages 0 0 0 0 0
Deferred Taxes/Income 0 0 0 0 0
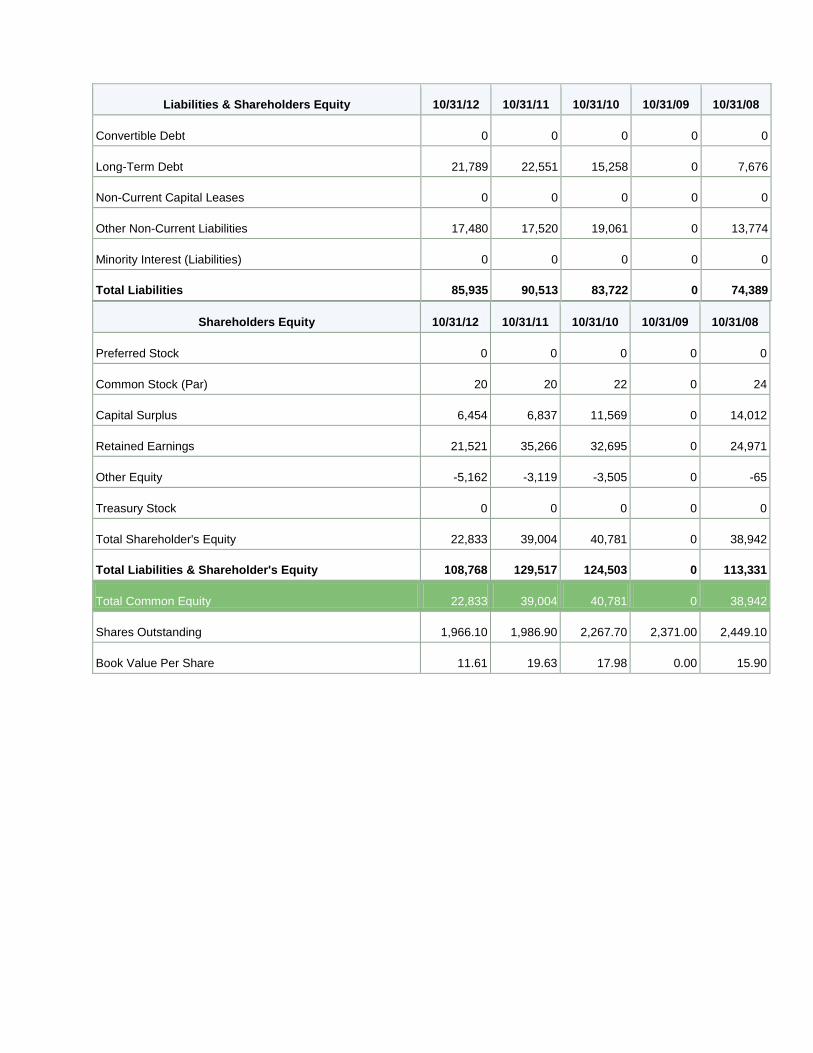
Liabilities & Shareholders Equity 10/31/12 10/31/11 10/31/10 10/31/09 10/31/08
Convertible Debt 0 0 0 0 0
Long-Term Debt 21,789 22,551 15,258 0 7,676
Non-Current Capital Leases 0 0 0 0 0
Other Non-Current Liabilities 17,480 17,520 19,061 0 13,774
Minority Interest (Liabilities) 0 0 0 0 0
Total Liabilities 85,935 90,513 83,722 0 74,389
Shareholders Equity 10/31/12 10/31/11 10/31/10 10/31/09 10/31/08
Preferred Stock 0 0 0 0 0
Common Stock (Par) 20 20 22 0 24
Capital Surplus 6,454 6,837 11,569 0 14,012
Retained Earnings 21,521 35,266 32,695 0 24,971
Other Equity -5,162 -3,119 -3,505 0 -65
Treasury Stock 0 0 0 0 0
Total Shareholder's Equity 22,833 39,004 40,781 0 38,942
Total Liabilities & Shareholder's Equity 108,768 129,517 124,503 0 113,331
Total Common Equity 22,833 39,004 40,781 0 38,942
Shares Outstanding 1,966.10 1,986.90 2,267.70 2,371.00 2,449.10
Book Value Per Share 11.61 19.63 17.98 0.00 15.90
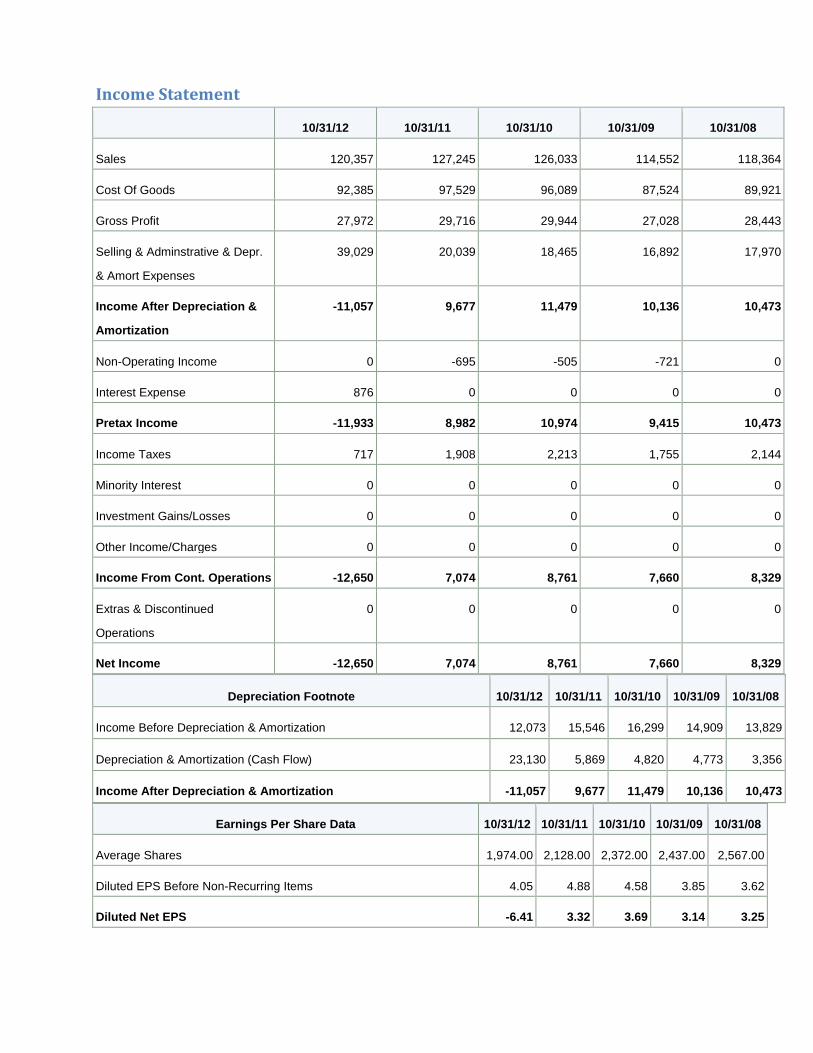
Income Statement
10/31/12 10/31/11 10/31/10 10/31/09 10/31/08
Sales 120,357 127,245 126,033 114,552 118,364
Cost Of Goods 92,385 97,529 96,089 87,524 89,921
Gross Profit 27,972 29,716 29,944 27,028 28,443
Selling & Adminstrative & Depr.
& Amort Expenses
39,029 20,039 18,465 16,892 17,970
Income After Depreciation &
Amortization
-11,057 9,677 11,479 10,136 10,473
Non-Operating Income 0 -695 -505 -721 0
Interest Expense 876 0 0 0 0
Pretax Income -11,933 8,982 10,974 9,415 10,473
Income Taxes 717 1,908 2,213 1,755 2,144
Minority Interest 0 0 0 0 0
Investment Gains/Losses 0 0 0 0 0
Other Income/Charges 0 0 0 0 0
Income From Cont. Operations -12,650 7,074 8,761 7,660 8,329
Extras & Discontinued
Operations
0 0 0 0 0
Net Income -12,650 7,074 8,761 7,660 8,329
Depreciation Footnote 10/31/12 10/31/11 10/31/10 10/31/09 10/31/08
Income Before Depreciation & Amortization 12,073 15,546 16,299 14,909 13,829
Depreciation & Amortization (Cash Flow) 23,130 5,869 4,820 4,773 3,356
Income After Depreciation & Amortization -11,057 9,677 11,479 10,136 10,473
Earnings Per Share Data 10/31/12 10/31/11 10/31/10 10/31/09 10/31/08
Average Shares 1,974.00 2,128.00 2,372.00 2,437.00 2,567.00
Diluted EPS Before Non-Recurring Items 4.05 4.88 4.58 3.85 3.62
Diluted Net EPS -6.41 3.32 3.69 3.14 3.25