hertfordshire county council pension fund
DESCRIPTION
Hertfordshire County Council Pension Fund. The search for stable contributions. Bryan Chalmers, FFA Barry McKay, FFA 23 March 2010. What we’ll cover today. 1. Basics. 2. Funding update. 3. Stability. 4. Individual employers. 2. 2. Event. Responsibility. Timescale. - PowerPoint PPT PresentationTRANSCRIPT
Hymans Robertson LLP and Hymans Robertson Financial Services LLP are authorised and regulated by the Financial Services Authority
Hertfordshire County Council Pension Fund
The search for stable contributions
• Bryan Chalmers, FFA
• Barry McKay, FFA
• 23 March 2010
2
What we’ll cover today
1. Basics
2. Funding update
3. Stability
4. Individual employers
3
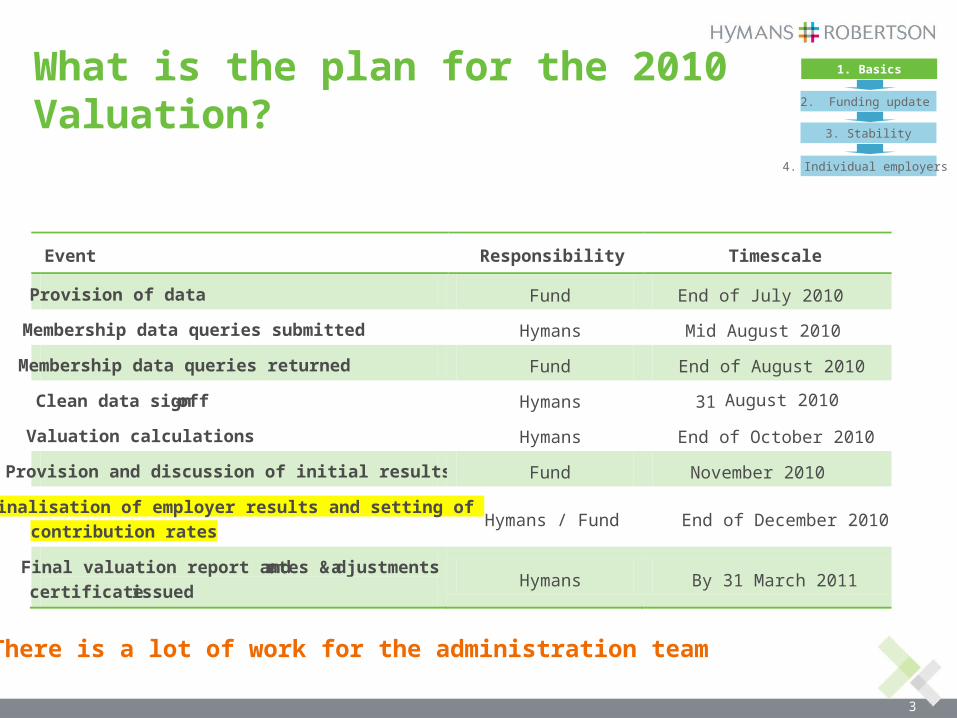
What is the plan for the 2010 Valuation?
There is a lot of work for the administration team
Event Responsibility Timescale
Provision of data Fund End of July 2010
Membership data queries submitted Hymans Mid August 2010
Membership data queries returned Fund End of August 2010
Clean data sign-off Hymans 31 August 2010
Valuation calculations Hymans End of October 2010
Provision and discussion of initial results Fund November 2010
Finalisation of employer results and setting of
contribution rates Hymans / Fund End of December 2010
Final valuation report and rates & a djustments
certificate issued Hymans By 31 March 2011
1. Basics
2. Funding update
3. Stability
4. Individual employers
4
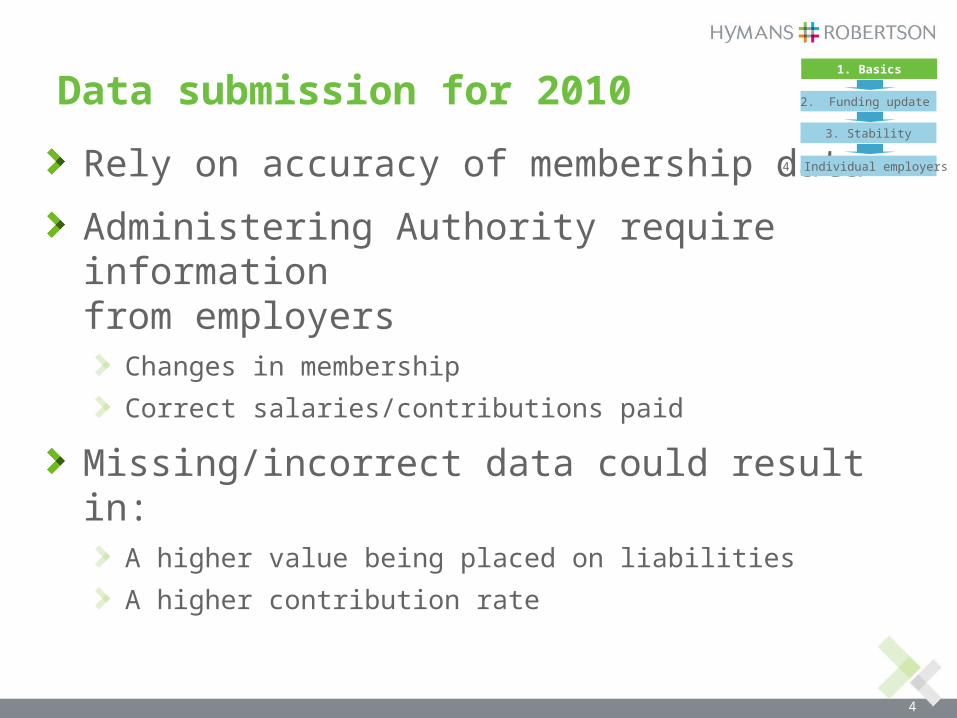
Data submission for 2010
Rely on accuracy of membership data
Administering Authority require information from employers
Changes in membership
Correct salaries/contributions paid
Missing/incorrect data could result in:A higher value being placed on liabilities
A higher contribution rate
1. Basics
2. Funding update
3. Stability
4. Individual employers
5
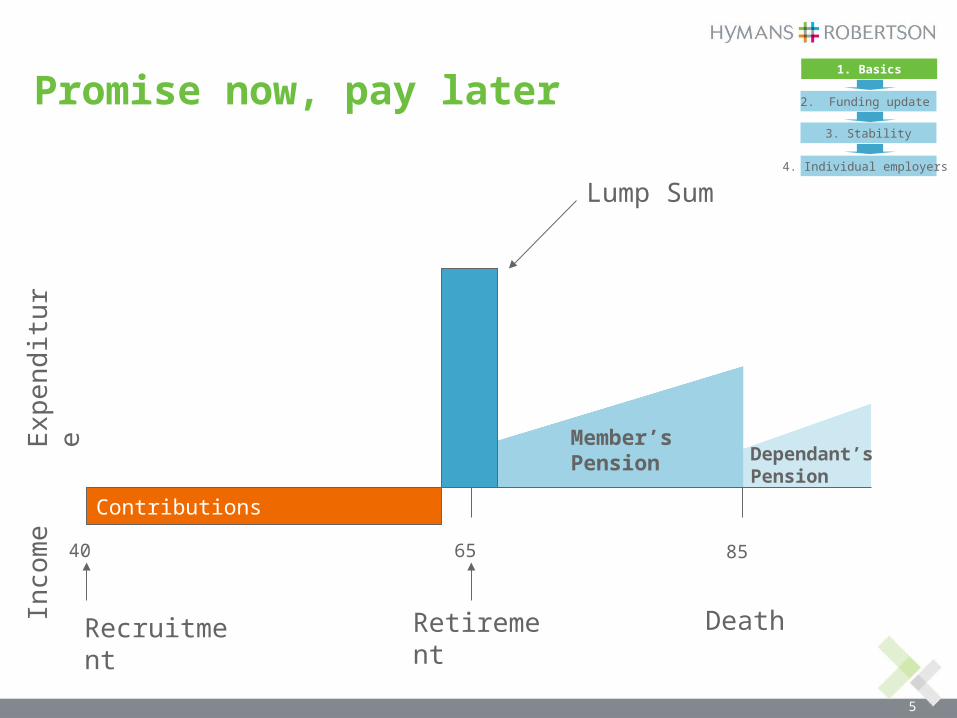
Promise now, pay later
Lump Sum
Dependant’s Pension
Member’s Pension
40 65 85
Recruitment
Contributions
Exp
en
ditu
reIn
com
e
Retirement Death
1. Basics
2. Funding update
3. Stability
4. Individual employers
6
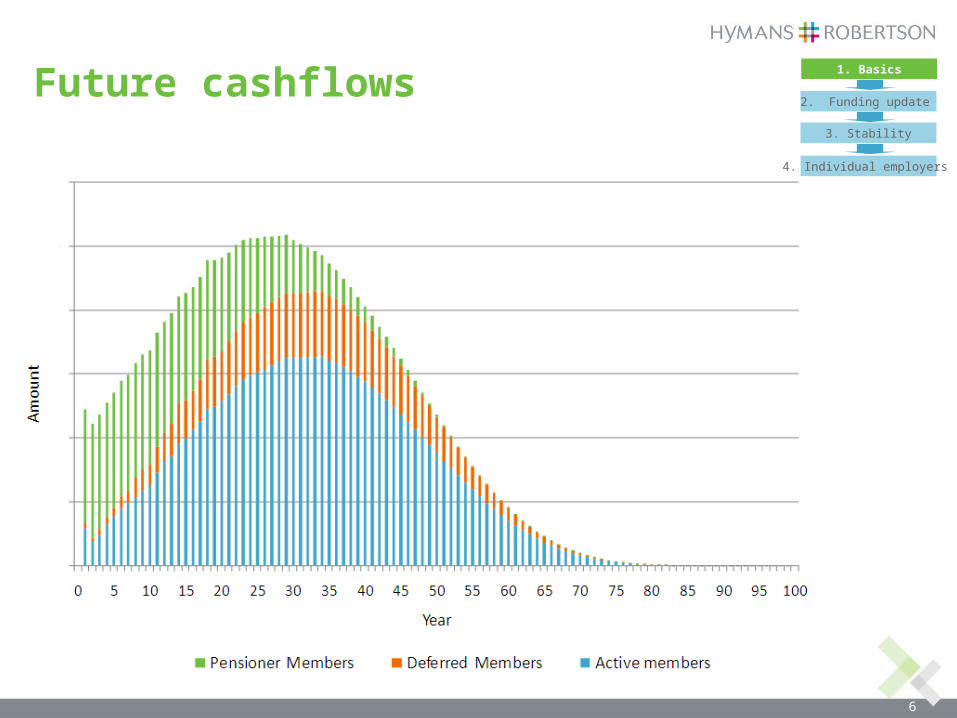
Future cashflows1. Basics
2. Funding update
3. Stability
4. Individual employers
7
Why do we do a valuation?
We have to
Recommend employer contribution rates
Assess how well pension promises are covered?
Monitor experience vs. assumptions
1. Basics
2. Funding update
3. Stability
4. Individual employers
8
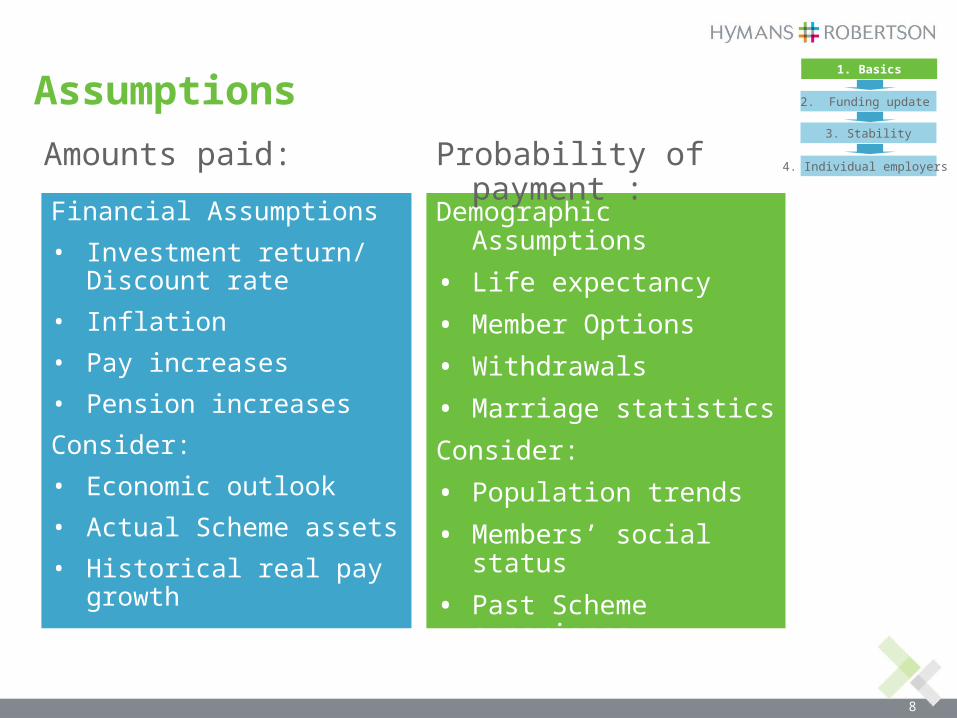
Assumptions
Financial Assumptions
• Investment return/ Discount rate
• Inflation
• Pay increases
• Pension increases
Consider:
• Economic outlook
• Actual Scheme assets
• Historical real pay growth
Demographic Assumptions
• Life expectancy
• Member Options
• Withdrawals
• Marriage statistics
Consider:
• Population trends
• Members’ social status
• Past Scheme experience
Amounts paid: Probability of payment :
1. Basics
2. Funding update
3. Stability
4. Individual employers
9
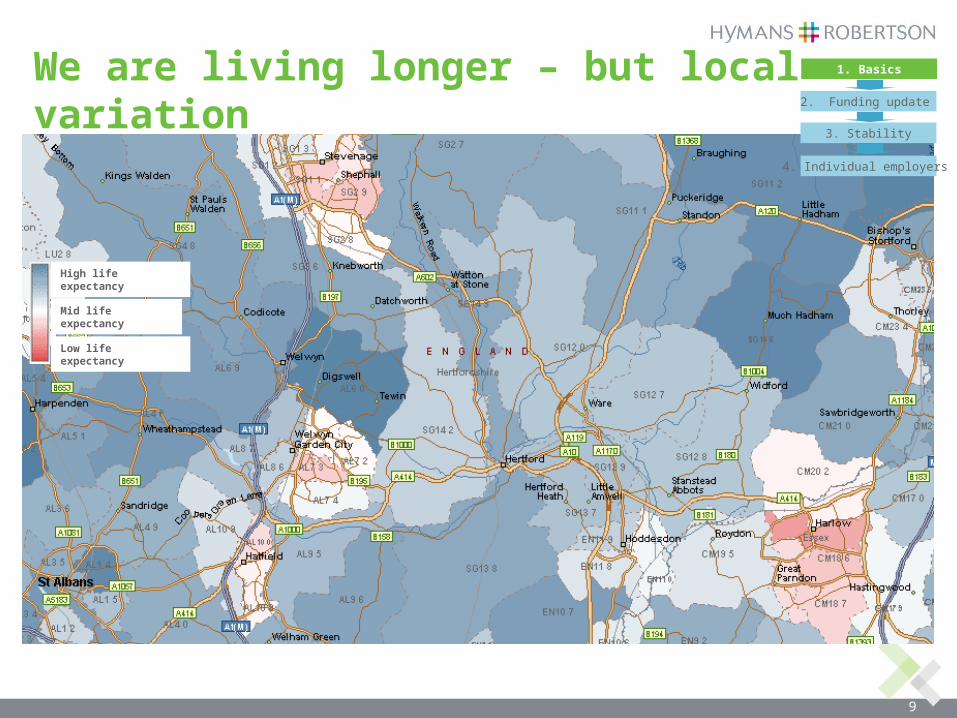
We are living longer – but local variation
High life expectancy
Mid life expectancy
Low life expectancy
1. Basics
2. Funding update
3. Stability
4. Individual employers
10
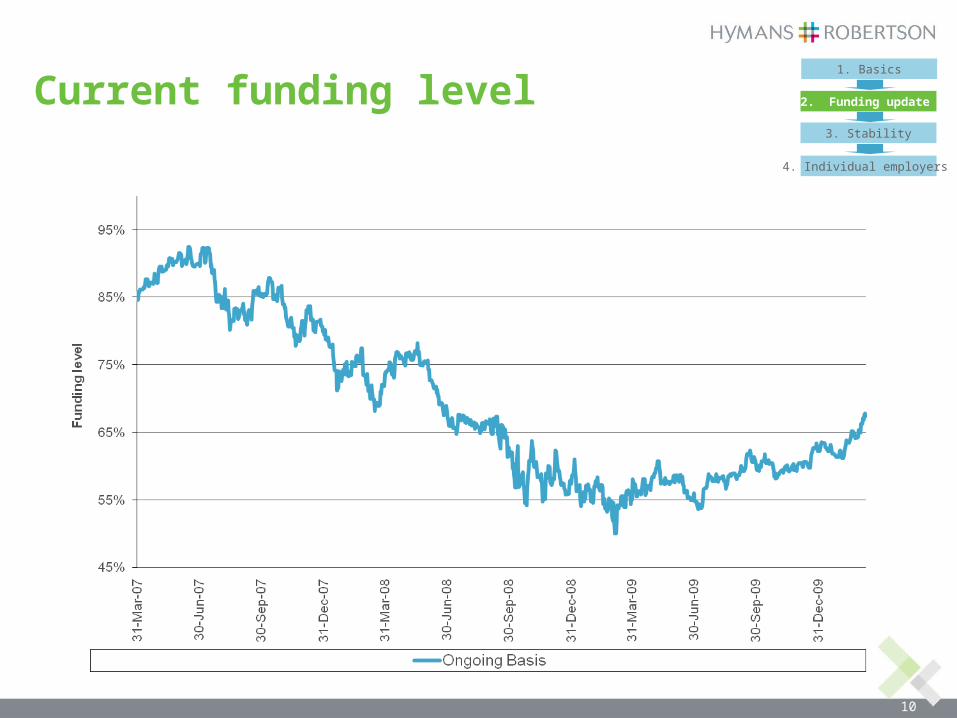
Current funding level1. Basics
2. Funding update
3. Stability
4. Individual employers
11
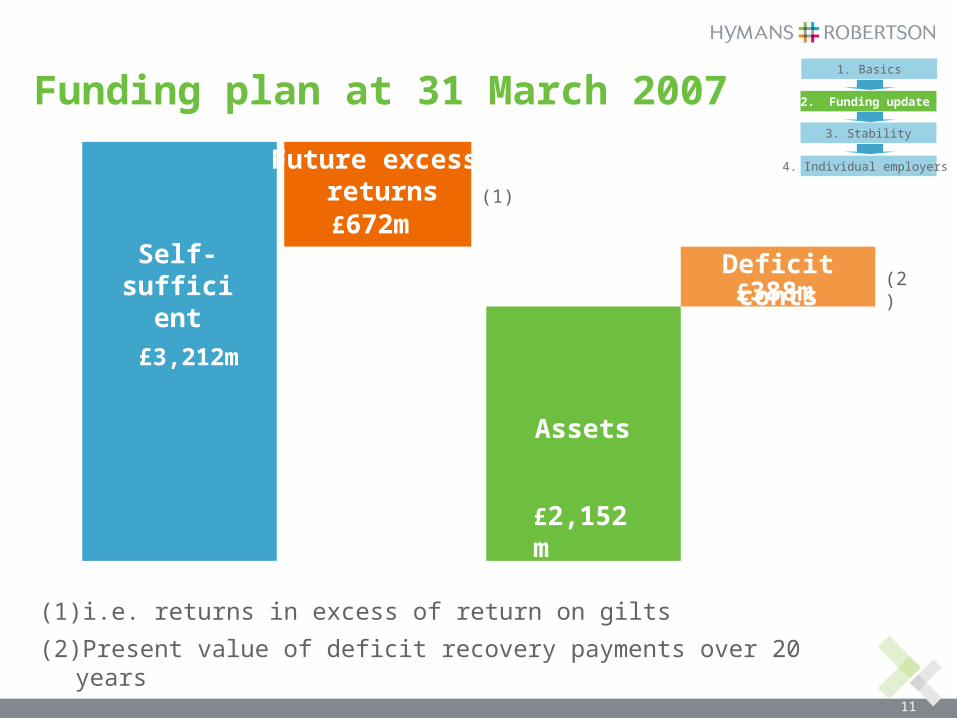
Funding plan at 31 March 2007
“
£3.6bn
£4.8bn
Self-sufficient
£3,212m
Assets
£2,152m
Future excess returns£672m
(1) i.e. returns in excess of return on gilts
(1)
Deficit conts£388m
(2)
(2) Present value of deficit recovery payments over 20 years
1. Basics
2. Funding update
3. Stability
4. Individual employers
12
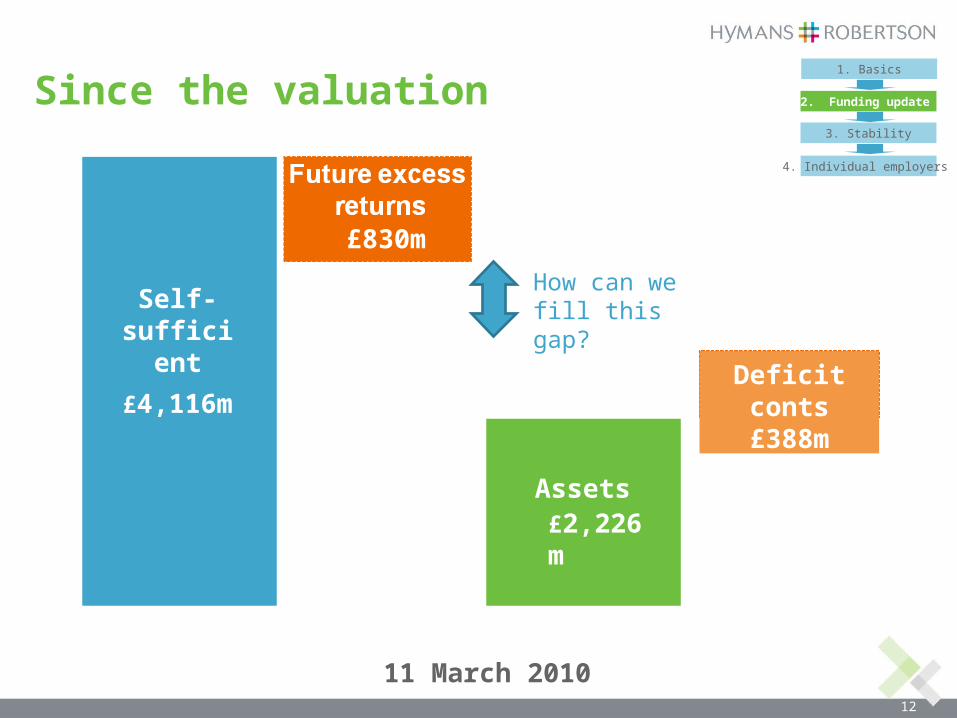
Since the valuation
Self-sufficient
£4,116m
Assets£2,226m
Deficit conts£388m
11 March 2010
£830m
How can we fill this gap?
1. Basics
2. Funding update
3. Stability
4. Individual employers
13
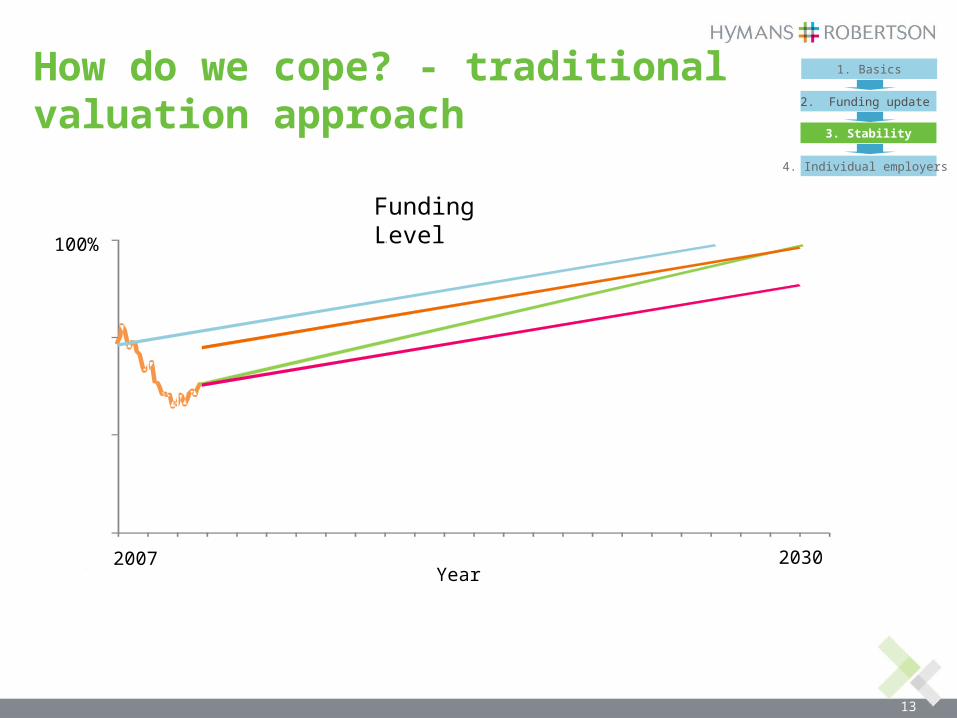
How do we cope? - traditional valuation approach
Funding Level100%
2007 2010 2027 2030Year
1. Basics
2. Funding update
3. Stability
4. Individual employers
14
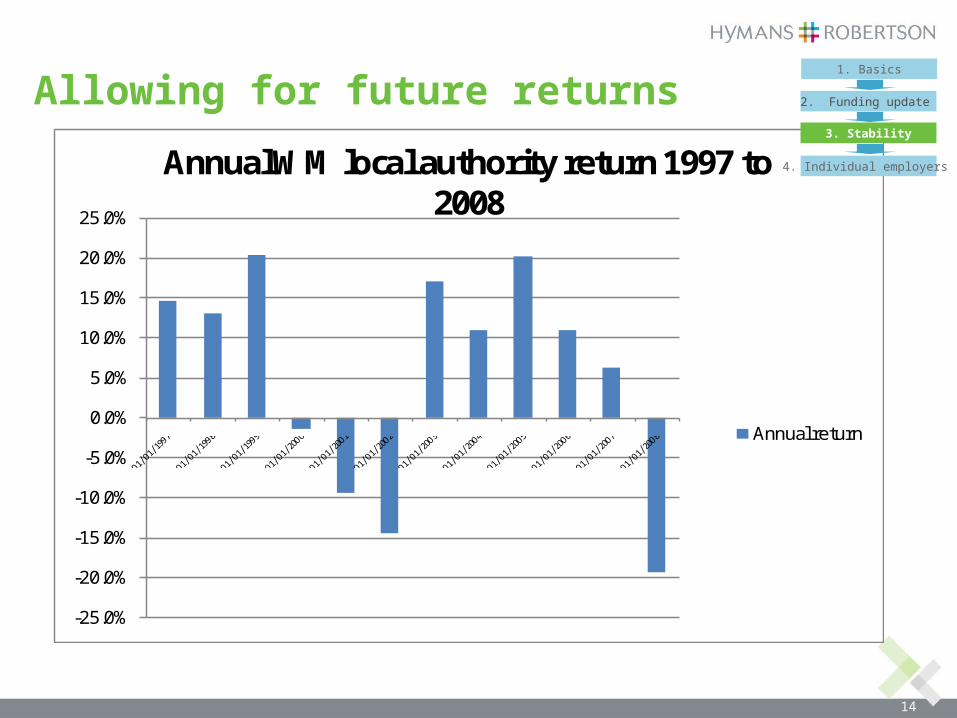
Allowing for future returns
-25.0%
-20.0%
-15.0%
-10.0%
-5.0%
0.0%
5.0%
10.0%
15.0%
20.0%
25.0%
Annual WM local authority return 1997 to 2008
Annual return
1. Basics
2. Funding update
3. Stability
4. Individual employers
15
0
50
100
150
200
250
300
Pro
ject
ed
Fu
nd
ing
Le
vel
Time
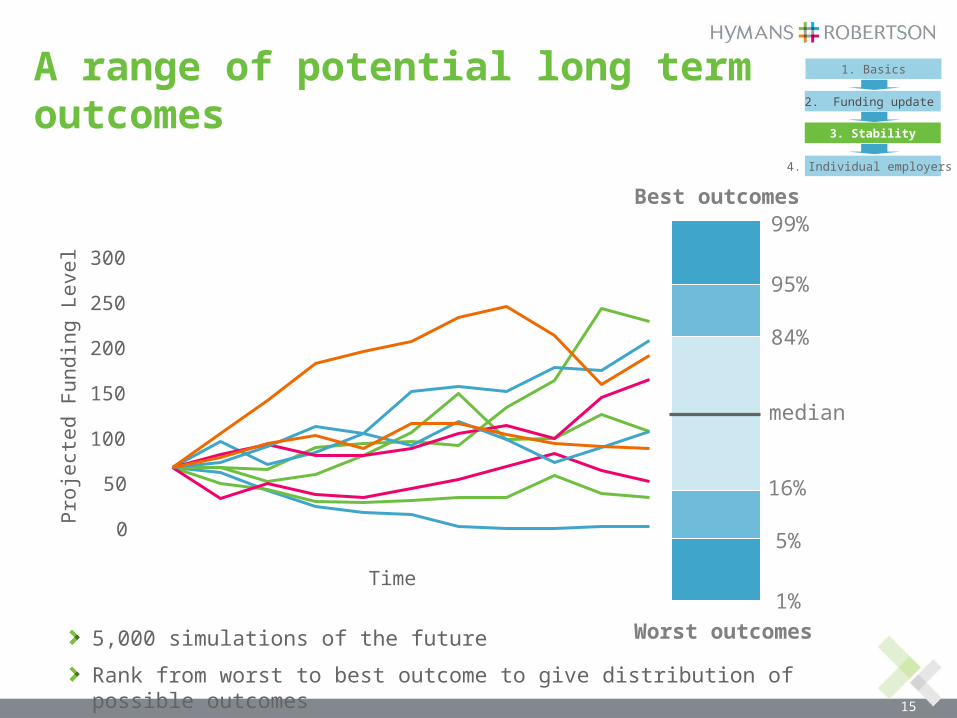
median
Worst outcomes
Best outcomes
1%
95%
84%
16%
5%
99%
A range of potential long term outcomes
5,000 simulations of the future
Rank from worst to best outcome to give distribution of possible outcomes
1. Basics
2. Funding update
3. Stability
4. Individual employers
16
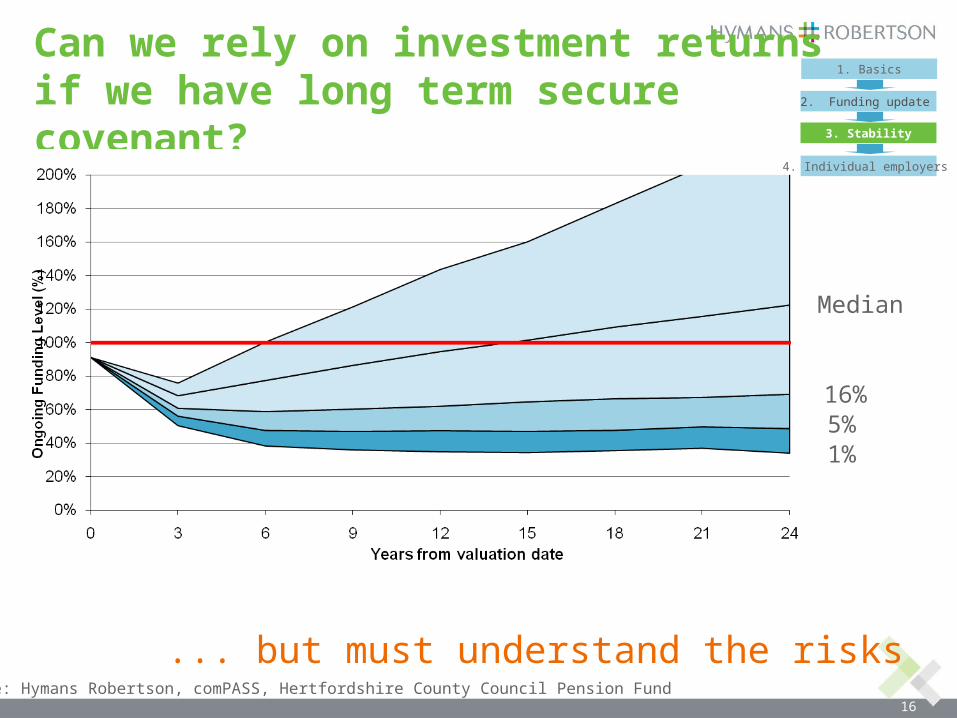
Can we rely on investment returns if we have long term secure covenant?
Median
... but must understand the risksSource: Hymans Robertson, comPASS, Hertfordshire County Council Pension Fund
16%5%1%
1. Basics
2. Funding update
3. Stability
4. Individual employers
17
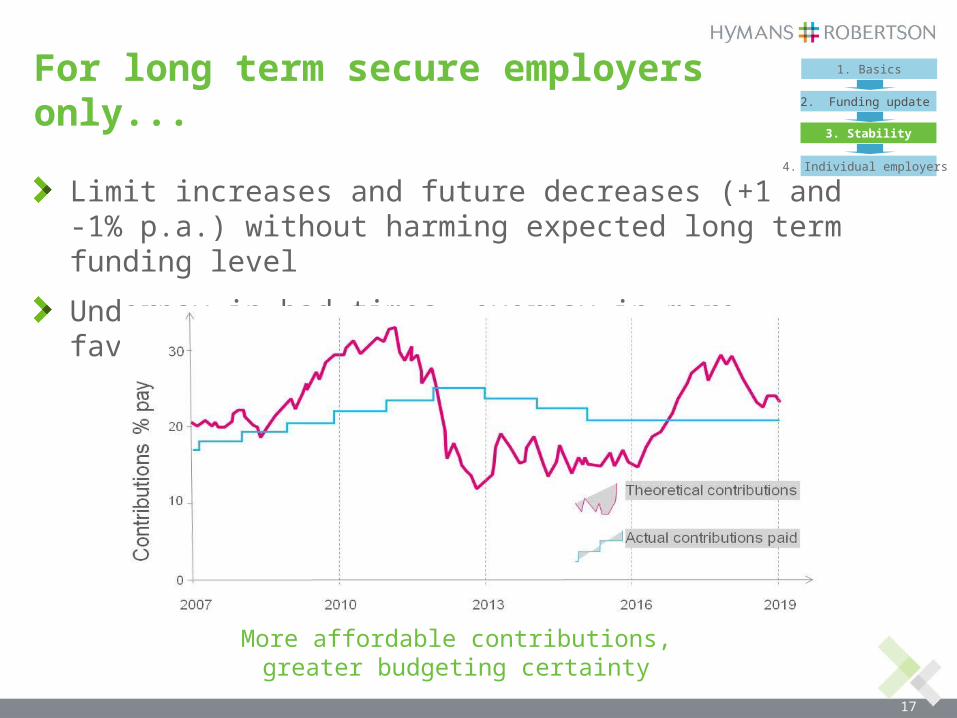
For long term secure employers only...
Limit increases and future decreases (+1 and -1% p.a.) without harming expected long term funding level
Underpay in bad times, overpay in more favourable conditions
More affordable contributions,greater budgeting certainty
1. Basics
2. Funding update
3. Stability
4. Individual employers
18
Benefits of risk based valuation
Understand Fund dynamic
Early warning system
Better Governance/More Transparency
Employer specific analysis
Support for change
1. Basics
2. Funding update
3. Stability
4. Individual employers
19
Less secure & shorter-term employers
Challenge: protect the fund
avoid pushing employers into insolvency
Reconsider deficit recovery
Seek additional security
Understand the risks
Assess the likelihood of meeting target funding
1. Basics
2. Funding update
3. Stability
4. Individual employers
20
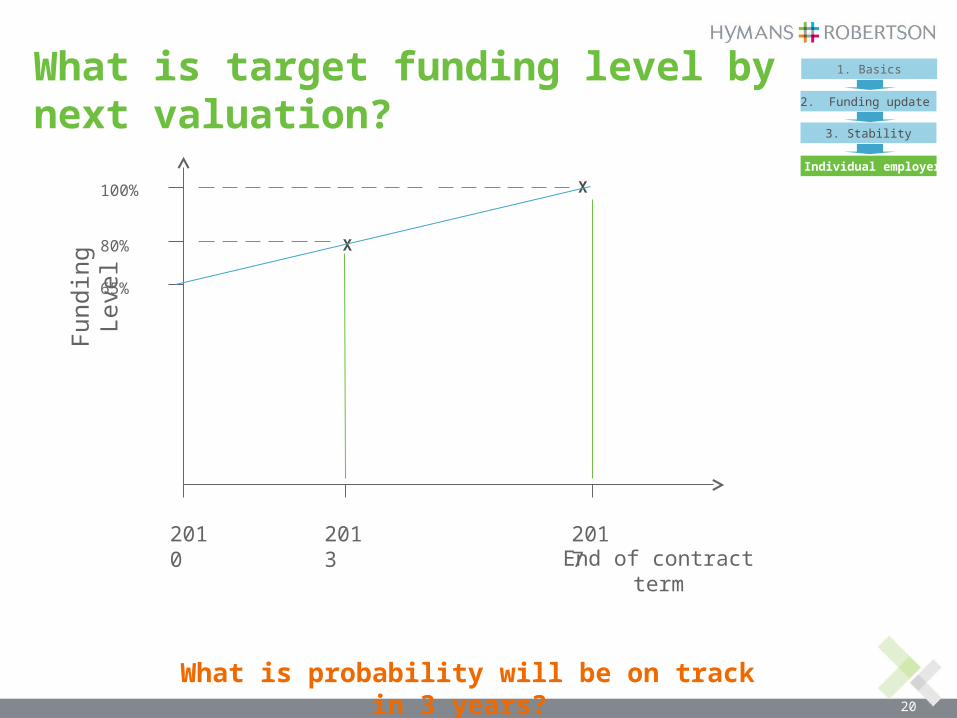
What is target funding level by next valuation?
What is probability will be on track in 3 years?
X
2010 2013 2017End of contract term
Fun
ding
Lev
el
100%
80%
65%
X
1. Basics
2. Funding update
3. Stability
4. Individual employers
21
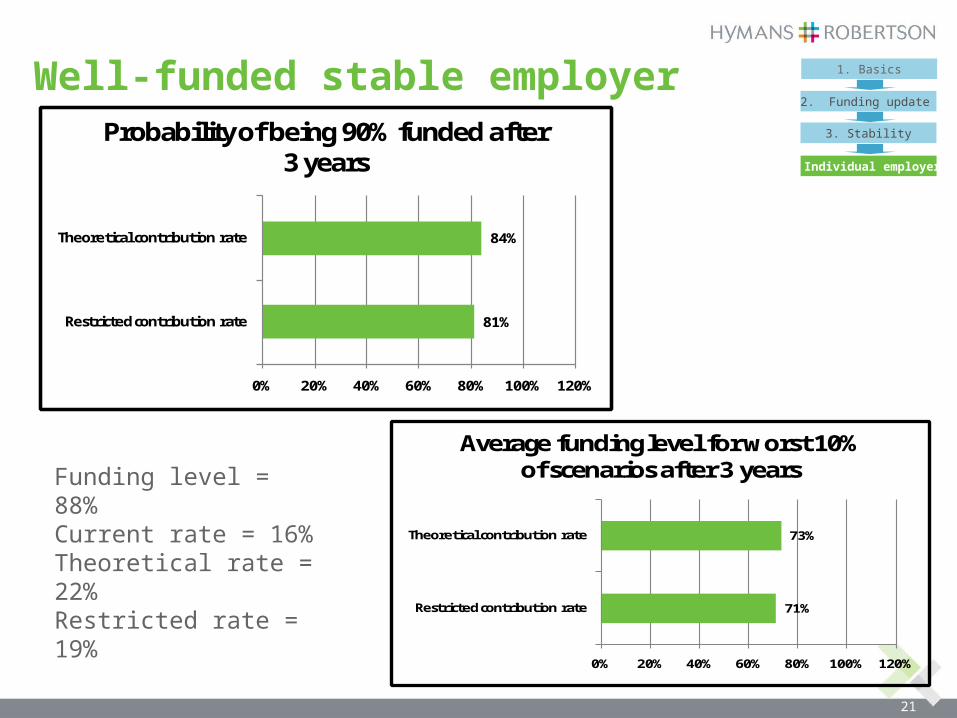
Well-funded stable employer 1. Basics
2. Funding update
3. Stability
4. Individual employers
Funding level = 88%Current rate = 16%Theoretical rate = 22%Restricted rate = 19%
81%
84%
0% 20% 40% 60% 80% 100% 120%
Restricted contribution rate
Theoretical contribution rate
Probability of being 90% funded after 3 years
71%
73%
0% 20% 40% 60% 80% 100% 120%
Restricted contribution rate
Theoretical contribution rate
Average funding level for worst 10% of scenarios after 3 years
22
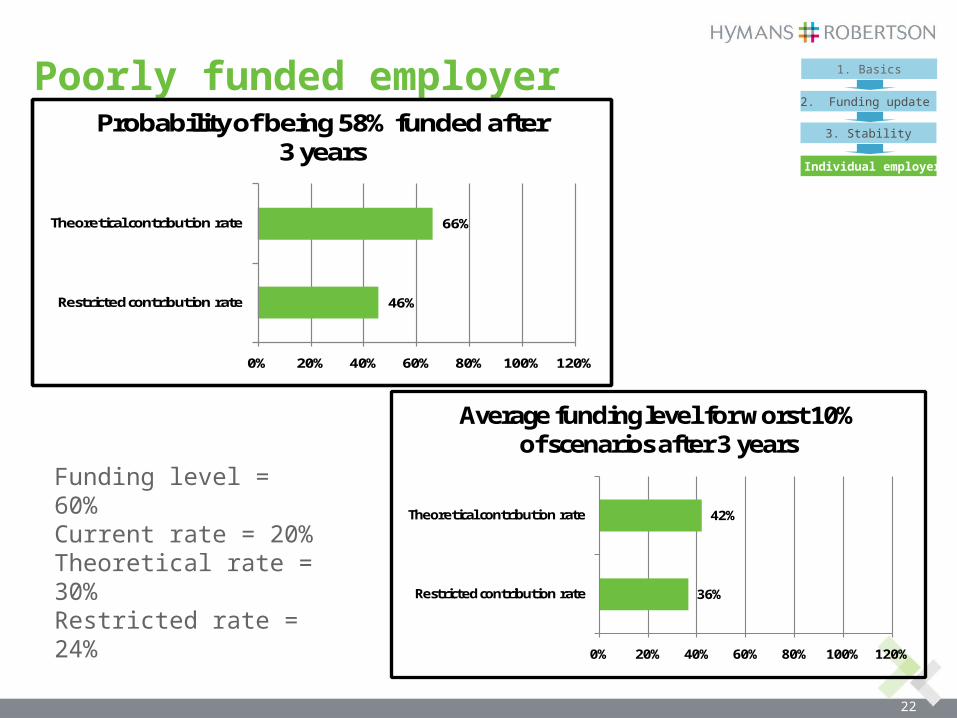
Poorly funded employer 1. Basics
2. Funding update
3. Stability
4. Individual employers
Funding level = 60%Current rate = 20%Theoretical rate = 30%Restricted rate = 24%
46%
66%
0% 20% 40% 60% 80% 100% 120%
Restricted contribution rate
Theoretical contribution rate
Probability of being 58% funded after 3 years
36%
42%
0% 20% 40% 60% 80% 100% 120%
Restricted contribution rate
Theoretical contribution rate
Average funding level for worst 10% of scenarios after 3 years
23
Conclusions and next steps
For long term secure employersIncreases in contributions required
But can stabilise increases
Without any long term damage to the Fund
Underpay in bad times, overpay in more favourable conditions
For other employersIncreases in contributions inevitable
Dialogue with AA is essential
Risk assessment to test likelihood of meeting target funding
Based on evidence of security
1. Basics
2. Funding update
3. Stability
4. Individual employers

Hymans Robertson LLP and Hymans Robertson Financial Services LLP are authorised and regulated by the Financial Services Authority
Thank You
Any questions?