heritage foods limitedheritagefoods.in/images/quq1fy18.pdf · heritage foods limited ... haryana,...
TRANSCRIPT
Heritage Foods Limited
Financial Results – Q1FY18 Hyderabad, 10th August 2017
Stock Code: BSE: 519552 NSE: HERITGFOOD
Quarterly Update
The release contains forward-looking statements, identified by words like
‘plans’, ‘expects’, ‘will’, ‘anticipates’, ‘believes’, ‘intends’, ‘projects’,
‘estimates’ and so on. All statements that address expectations or projections
about the future, but not limited to the Company’s strategy for growth,
product development, market position, expenditures and financial results, are
forward-looking statements. Since these are based on certain assumptions and
expectations of future events, the Company cannot guarantee that these are
accurate or will be realized. Actual results might differ materially from those
either expressed or implied in the statement depending on the circumstances.
Therefore the investors are requested to make their own independent
assessments and judgments by considering all relevant factors before making
any investment decision. The Company assumes no responsibility to publicly
amend, modify or revise any such statements on the basis of subsequent
developments, information or events.
Bring Home Health & Happiness
Disclaimer
2
Bring Home Health & Happiness 3
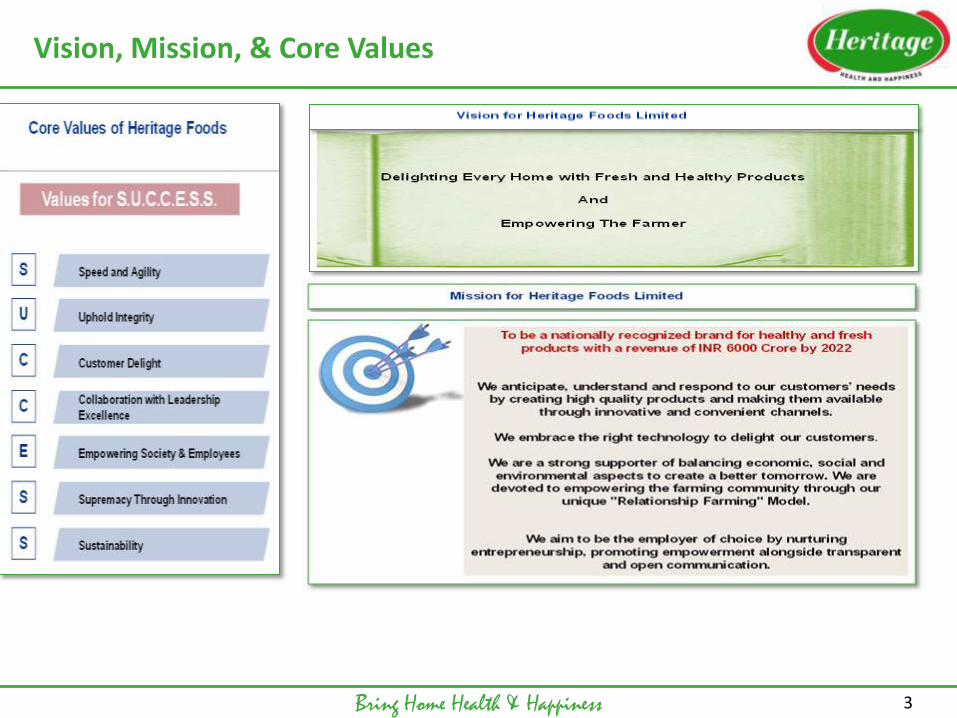
Vision, Mission, & Core Values
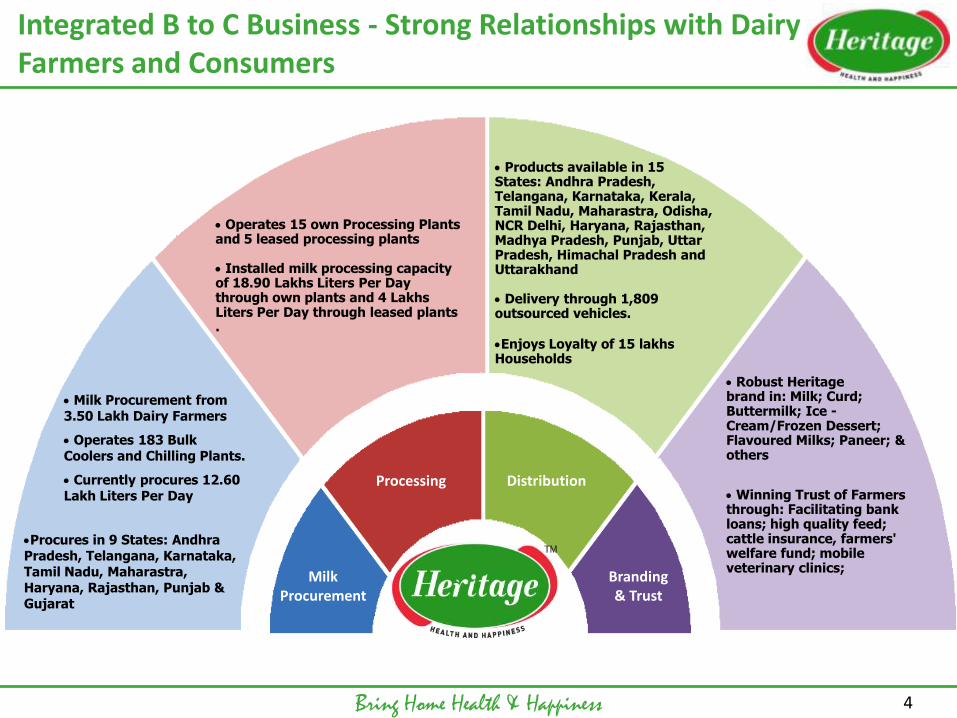
Integrated B to C Business - Strong Relationships with Dairy Farmers and Consumers
Bring Home Health & Happiness 4
Milk Procurement from 3.50 Lakh Dairy Farmers
Operates 183 Bulk Coolers and Chilling Plants.
Currently procures 12.60 Lakh Liters Per Day
Milk Procurement
Processing Distribution
Branding & Trust
Operates 15 own Processing Plants and 5 leased processing plants Installed milk processing capacity of 18.90 Lakhs Liters Per Day through own plants and 4 Lakhs Liters Per Day through leased plants .
Products available in 15 States: Andhra Pradesh, Telangana, Karnataka, Kerala, Tamil Nadu, Maharastra, Odisha, NCR Delhi, Haryana, Rajasthan, Madhya Pradesh, Punjab, Uttar Pradesh, Himachal Pradesh and Uttarakhand
Delivery through 1,809 outsourced vehicles. Enjoys Loyalty of 15 lakhs Households
Robust Heritage brand in: Milk; Curd; Buttermilk; Ice -Cream/Frozen Dessert; Flavoured Milks; Paneer; & others
Winning Trust of Farmers through: Facilitating bank loans; high quality feed; cattle insurance, farmers' welfare fund; mobile veterinary clinics;
Procures in 9 States: Andhra Pradesh, Telangana, Karnataka, Tamil Nadu, Maharastra, Haryana, Rajasthan, Punjab & Gujarat
Bring Home Health & Happiness 5
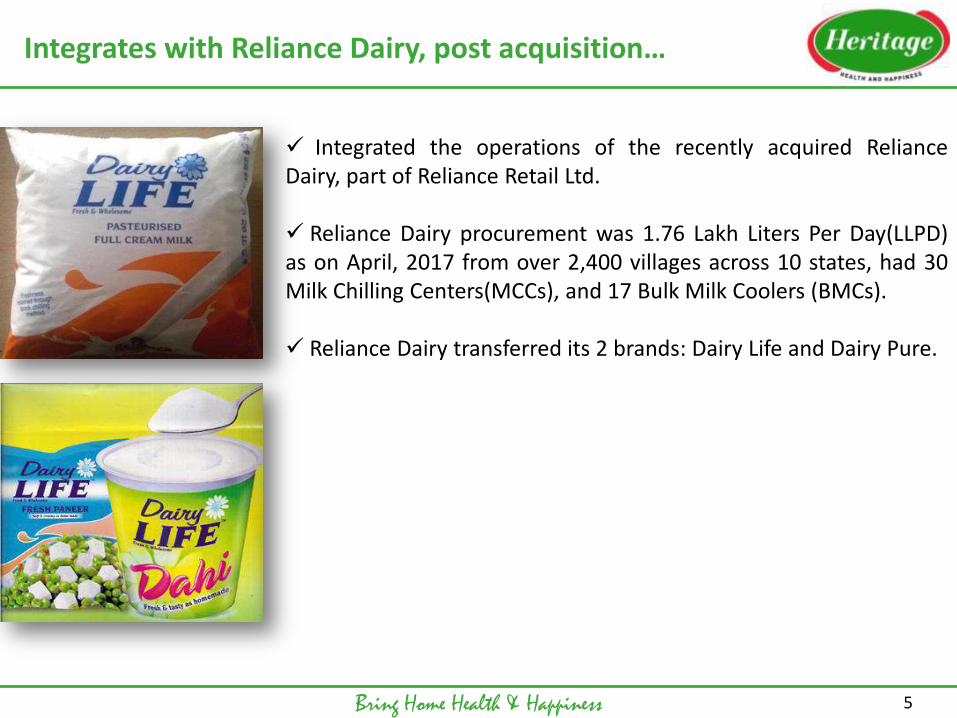
Integrates with Reliance Dairy, post acquisition…
Integrated the operations of the recently acquired Reliance Dairy, part of Reliance Retail Ltd. Reliance Dairy procurement was 1.76 Lakh Liters Per Day(LLPD) as on April, 2017 from over 2,400 villages across 10 states, had 30 Milk Chilling Centers(MCCs), and 17 Bulk Milk Coolers (BMCs). Reliance Dairy transferred its 2 brands: Dairy Life and Dairy Pure.
Bring Home Health & Happiness
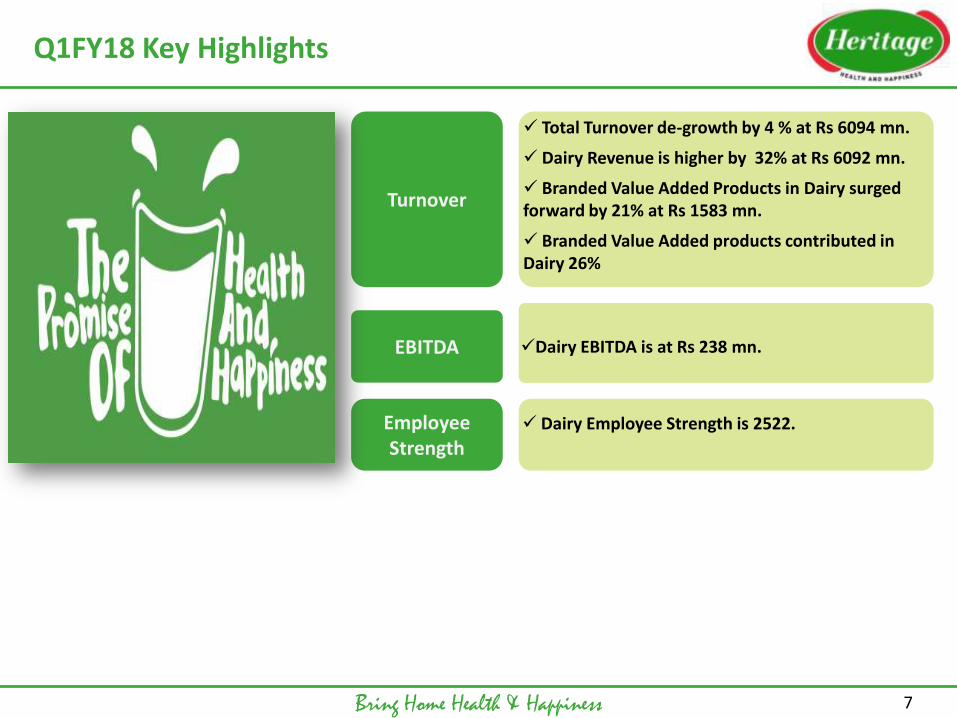
Q1FY18 Key Highlights
7
Turnover
Total Turnover de-growth by 4 % at Rs 6094 mn.
Dairy Revenue is higher by 32% at Rs 6092 mn.
Branded Value Added Products in Dairy surged forward by 21% at Rs 1583 mn.
Branded Value Added products contributed in Dairy 26%
EBITDA
Dairy EBITDA is at Rs 238 mn.
Employee Strength
Dairy Employee Strength is 2522.
llpd: lakh liters per day
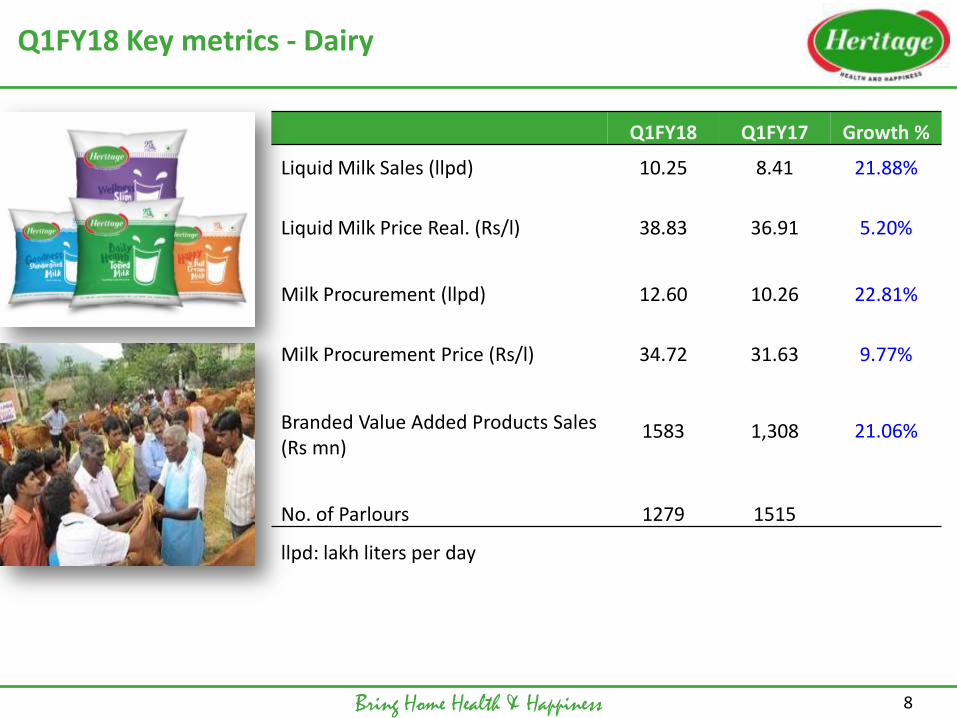
Q1FY18 Key metrics - Dairy
Bring Home Health & Happiness
Q1FY18 Q1FY17 Growth %
Liquid Milk Sales (llpd) 10.25 8.41 21.88%
Liquid Milk Price Real. (Rs/l) 38.83 36.91 5.20%
Milk Procurement (llpd) 12.60 10.26 22.81%
Milk Procurement Price (Rs/l) 34.72 31.63 9.77%
Branded Value Added Products Sales (Rs mn)
1583 1,308 21.06%
No. of Parlours 1279 1515
8
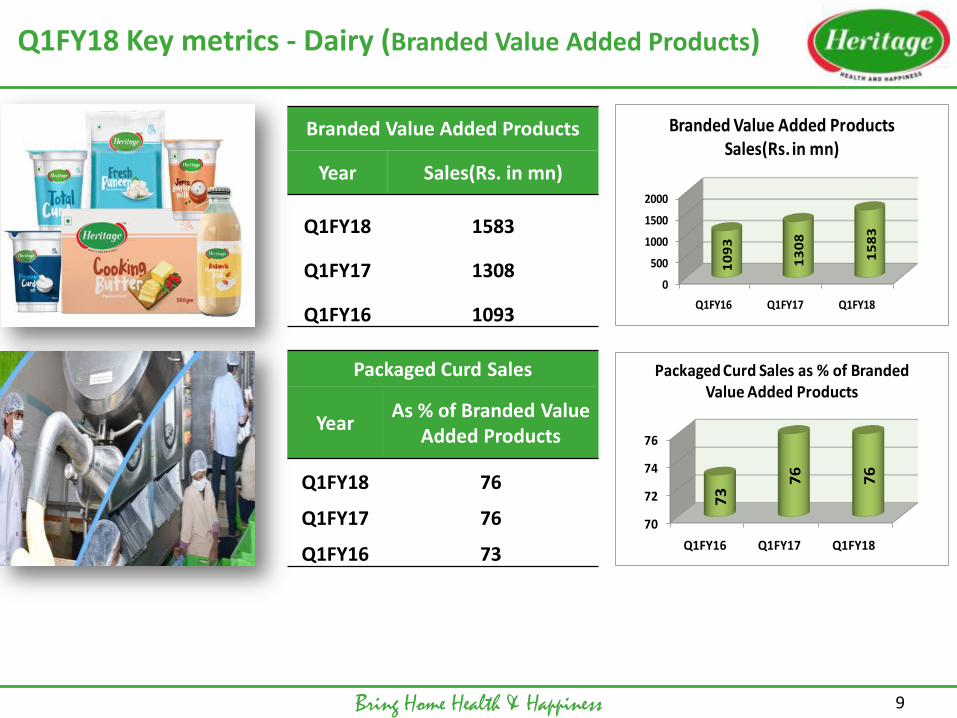
Branded Value Added Products
Year Sales(Rs. in mn)
Q1FY18 1583
Q1FY17 1308
Q1FY16 1093
Packaged Curd Sales
Year As % of Branded Value
Added Products
Q1FY18 76
Q1FY17 76
Q1FY16 73
Q1FY18 Key metrics - Dairy (Branded Value Added Products)
Bring Home Health & Happiness 9
0
500
1000
1500
2000
Q1FY16 Q1FY17 Q1FY18
10
93
13
08
15
83
Branded Value Added Products Sales(Rs. in mn)
70
72
74
76
Q1FY16 Q1FY17 Q1FY18
73
76
76
Packaged Curd Sales as % of Branded Value Added Products
Q1FY18 Key Highlights - Dairy
Bring Home Health & Happiness
10
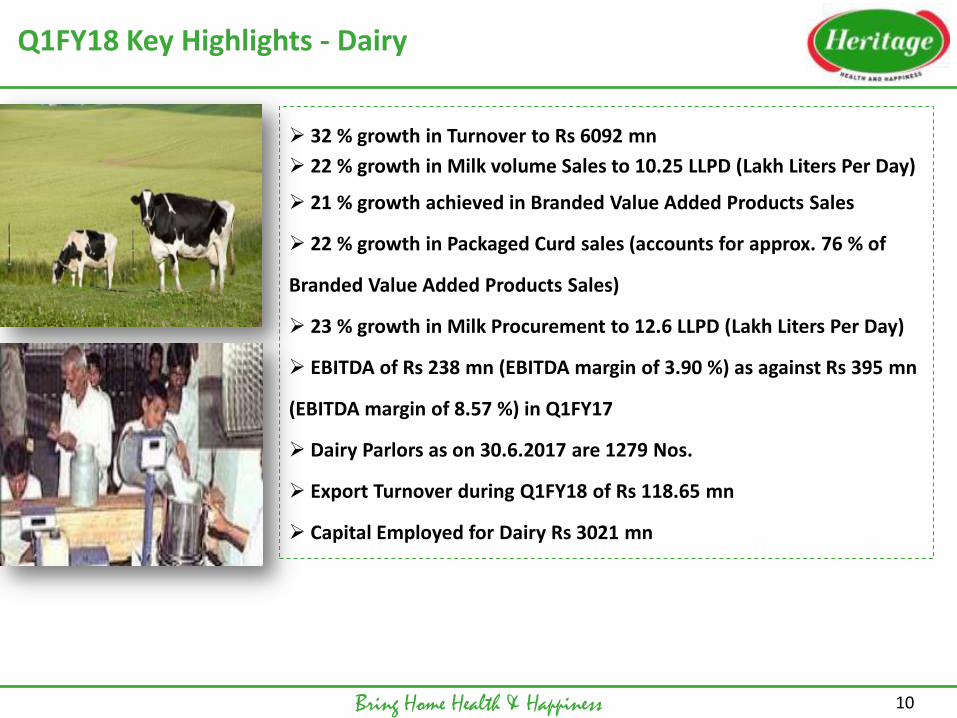
32 % growth in Turnover to Rs 6092 mn
22 % growth in Milk volume Sales to 10.25 LLPD (Lakh Liters Per Day)
21 % growth achieved in Branded Value Added Products Sales
22 % growth in Packaged Curd sales (accounts for approx. 76 % of
Branded Value Added Products Sales)
23 % growth in Milk Procurement to 12.6 LLPD (Lakh Liters Per Day)
EBITDA of Rs 238 mn (EBITDA margin of 3.90 %) as against Rs 395 mn
(EBITDA margin of 8.57 %) in Q1FY17
Dairy Parlors as on 30.6.2017 are 1279 Nos.
Export Turnover during Q1FY18 of Rs 118.65 mn
Capital Employed for Dairy Rs 3021 mn
Q1FY18 Key Highlights – Renewable Energy
Bring Home Health & Happiness
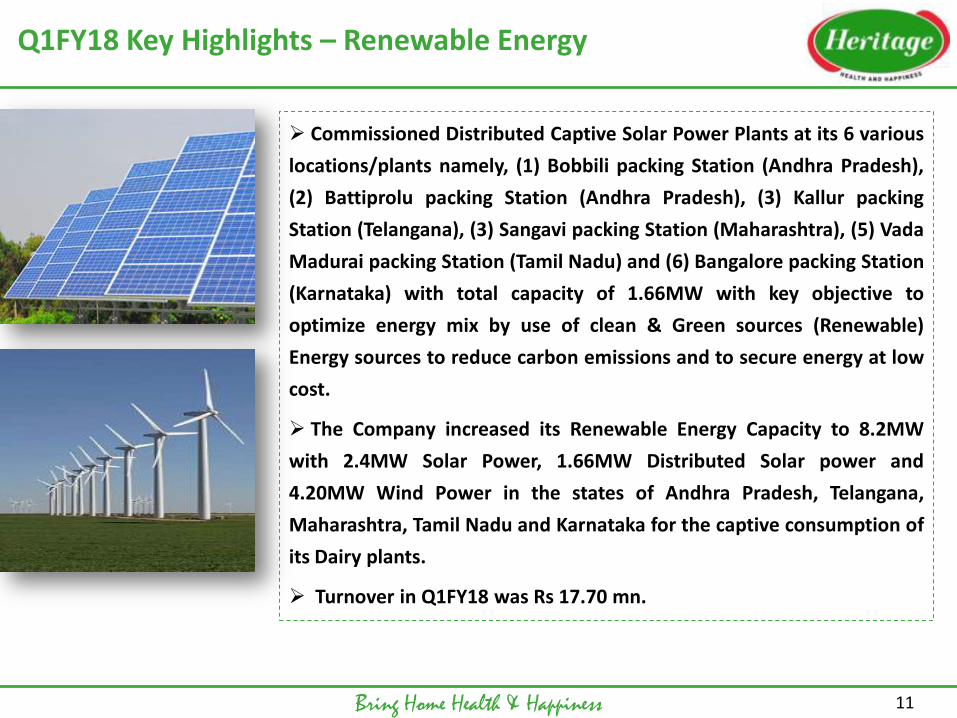
Commissioned Distributed Captive Solar Power Plants at its 6 various
locations/plants namely, (1) Bobbili packing Station (Andhra Pradesh),
(2) Battiprolu packing Station (Andhra Pradesh), (3) Kallur packing
Station (Telangana), (3) Sangavi packing Station (Maharashtra), (5) Vada
Madurai packing Station (Tamil Nadu) and (6) Bangalore packing Station
(Karnataka) with total capacity of 1.66MW with key objective to
optimize energy mix by use of clean & Green sources (Renewable)
Energy sources to reduce carbon emissions and to secure energy at low
cost.
The Company increased its Renewable Energy Capacity to 8.2MW
with 2.4MW Solar Power, 1.66MW Distributed Solar power and
4.20MW Wind Power in the states of Andhra Pradesh, Telangana,
Maharashtra, Tamil Nadu and Karnataka for the captive consumption of
its Dairy plants.
Turnover in Q1FY18 was Rs 17.70 mn.
11
Q1FY18 Financial Results - Standalone
Bring Home Health & Happiness 12
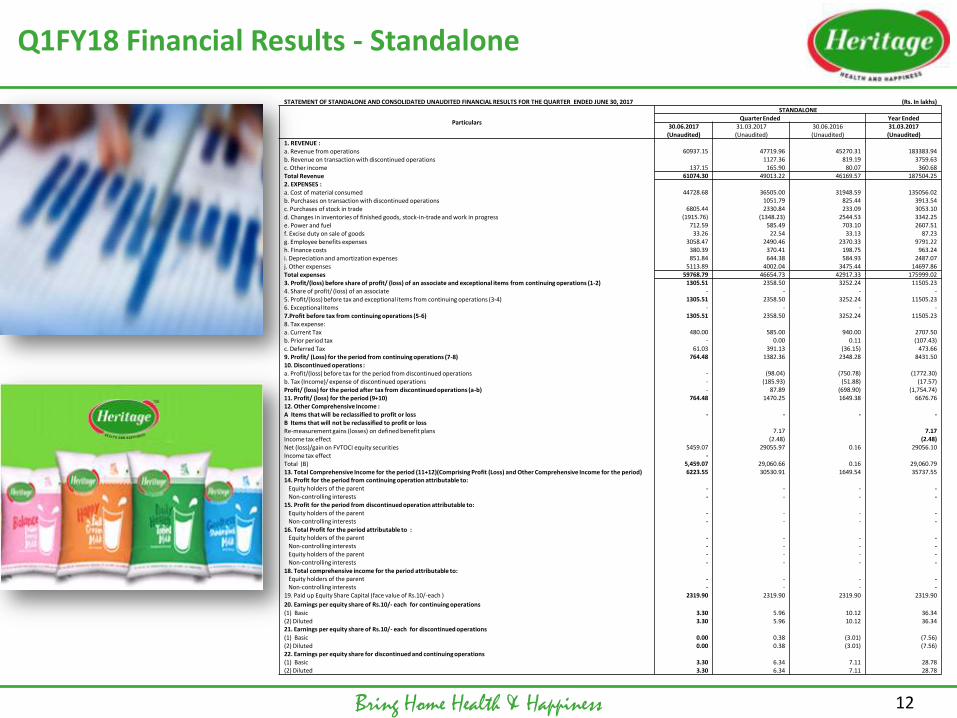
STATEMENT OF STANDALONE AND CONSOLIDATED UNAUDITED FINANCIAL RESULTS FOR THE QUARTER ENDED JUNE 30, 2017 (Rs. In lakhs)
Particulars
STANDALONE Quarter Ended Year Ended
30.06.2017 31.03.2017 30.06.2016 31.03.2017 (Unaudited) (Unaudited) (Unaudited) (Unaudited)
1. REVENUE : a. Revenue from operations 60937.15 47719.96 45270.31 183383.94
b. Revenue on transaction with discontinued operations 1127.36 819.19 3759.63
c. Other income 137.15 165.90 80.07 360.68 Total Revenue 61074.30 49013.22 46169.57 187504.25
2. EXPENSES :
a. Cost of material consumed 44728.68 36505.00 31948.59 135056.02 b. Purchases on transaction with discontinued operations 1051.79 825.44 3913.54
c. Purchases of stock in trade 6805.44 2330.84 233.09 3053.10
d. Changes in inventories of finished goods, stock-in-trade and work in progress (1915.76) (1348.23) 2544.53 3342.25 e. Power and fuel 712.59 585.49 703.10 2607.51
f. Excise duty on sale of goods 33.26 22.54 33.13 87.23
g. Employee benefits expenses 3058.47 2490.46 2370.33 9791.22 h. Finance costs 380.39 370.41 198.75 963.24
i. Depreciation and amortization expenses 851.84 644.38 584.93 2487.07
j. Other expenses 5113.89 4002.04 3475.44 14697.86
Total expenses 59768.79 46654.73 42917.33 175999.02 3. Profit/(loss) before share of profit/ (loss) of an associate and exceptional items from continuing operations (1-2) 1305.51 2358.50 3252.24 11505.23
4. Share of profit/ (loss) of an associate - - - -
5. Profit/(loss) before tax and exceptional items from continuing operations (3-4) 1305.51 2358.50 3252.24 11505.23 6. Exceptional Items - - - -
7.Profit before tax from continuing operations (5-6) 1305.51 2358.50 3252.24 11505.23
8. Tax expense: a. Current Tax 480.00 585.00 940.00 2707.50
b. Prior period tax - 0.00 0.11 (107.43)
c. Deferred Tax 61.03 391.13 (36.15) 473.66 9. Profit/ (Loss) for the period from continuing operations (7-8) 764.48 1382.36 2348.28 8431.50
10. Discontinued operations :
a. Profit/(loss) before tax for the period from discontinued operations - (98.04) (750.78) (1772.30) b. Tax (Income)/ expense of discontinued operations - (185.93) (51.88) (17.57)
Profit/ (loss) for the period after tax from discontinued operations (a-b) - 87.89 (698.90) (1,754.74)
11. Profit/ (loss) for the period (9+10) 764.48 1470.25 1649.38 6676.76 12. Other Comprehensive Income :
A Items that will be reclassified to profit or loss - - - -
B Items that will not be reclassified to profit or loss Re-measurement gains (losses) on defined benefit plans 7.17 7.17
Income tax effect (2.48) (2.48)
Net (loss)/gain on FVTOCI equity securities 5459.07 29055.97 0.16 29056.10 Income tax effect - Total (B) 5,459.07 29,060.66 0.16 29,060.79
13. Total Comprehensive Income for the period (11+12)(Comprising Profit (Loss) and Other Comprehensive Income for the period) 6223.55 30530.91 1649.54 35737.55 14. Profit for the period from continuing operation attributable to: Equity holders of the parent - - - - Non-controlling interests - - - - 15. Profit for the period from discontinued operation attributable to: Equity holders of the parent - - - - Non-controlling interests - - - - 16. Total Profit for the period attributable to : Equity holders of the parent - - - - Non-controlling interests - - - - Equity holders of the parent - - - - Non-controlling interests - - - -
18. Total comprehensive income for the period attributable to: Equity holders of the parent - - - - Non-controlling interests - - - - 19. Paid up Equity Share Capital (face value of Rs.10/-each ) 2319.90 2319.90 2319.90 2319.90
20. Earnings per equity share of Rs.10/- each for continuing operations
(1) Basic 3.30 5.96 10.12 36.34 (2) Diluted 3.30 5.96 10.12 36.34 21. Earnings per equity share of Rs.10/- each for discontinued operations
(1) Basic 0.00 0.38 (3.01) (7.56) (2) Diluted 0.00 0.38 (3.01) (7.56) 22. Earnings per equity share for discontinued and continuing operations
(1) Basic 3.30 6.34 7.11 28.78 (2) Diluted 3.30 6.34 7.11 28.78
Q1FY18 Financial Results - Consolidated
Bring Home Health & Happiness 13
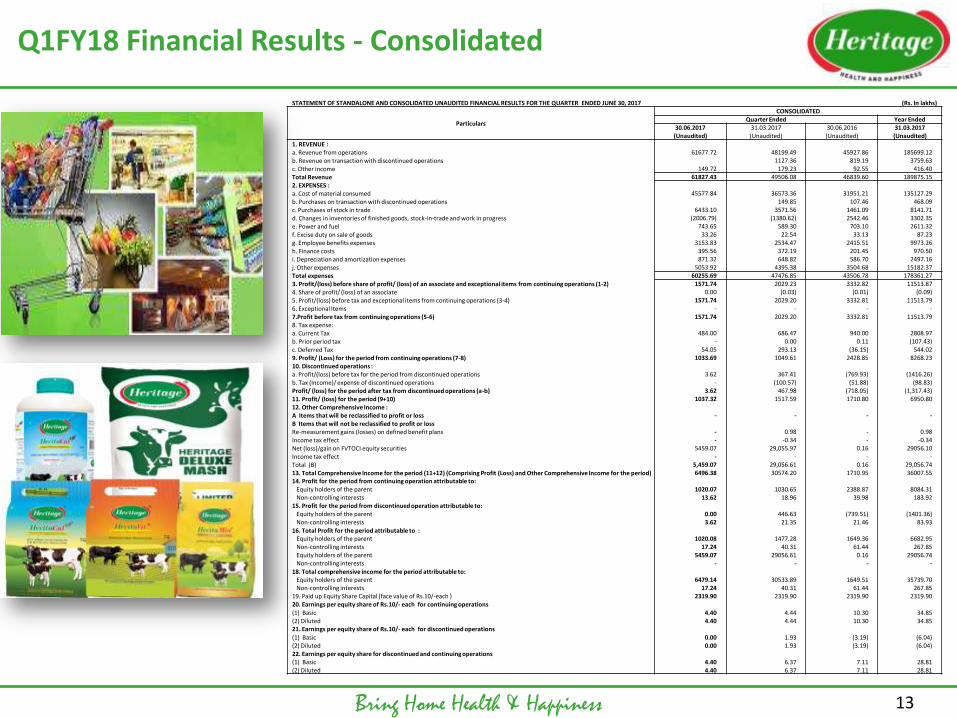
STATEMENT OF STANDALONE AND CONSOLIDATED UNAUDITED FINANCIAL RESULTS FOR THE QUARTER ENDED JUNE 30, 2017 (Rs. In lakhs)
Particulars
CONSOLIDATED Quarter Ended Year Ended
30.06.2017 31.03.2017 30.06.2016 31.03.2017 (Unaudited) (Unaudited) (Unaudited) (Unaudited)
1. REVENUE :
a. Revenue from operations 61677.72 48199.49 45927.86 185699.12 b. Revenue on transaction with discontinued operations 1127.36 819.19 3759.63
c. Other income 149.72 179.23 92.55 416.40 Total Revenue 61827.43 49506.08 46839.60 189875.15
2. EXPENSES : a. Cost of material consumed 45577.84 36573.36 31951.21 135127.29
b. Purchases on transaction with discontinued operations 149.85 107.46 468.09 c. Purchases of stock in trade 6433.10 3571.56 1461.09 8141.71
d. Changes in inventories of finished goods, stock-in-trade and work in progress (2006.79) (1380.62) 2542.46 3302.35 e. Power and fuel 743.65 589.30 703.10 2611.32
f. Excise duty on sale of goods 33.26 22.54 33.13 87.23 g. Employee benefits expenses 3153.83 2534.47 2415.51 9973.26
h. Finance costs 395.56 372.19 201.45 970.50 i. Depreciation and amortization expenses 871.32 648.82 586.70 2497.16
j. Other expenses 5053.92 4395.38 3504.68 15182.37 Total expenses 60255.69 47476.85 43506.78 178361.27
3. Profit/(loss) before share of profit/ (loss) of an associate and exceptional items from continuing operations (1-2) 1571.74 2029.23 3332.82 11513.87 4. Share of profit/ (loss) of an associate 0.00 (0.03) (0.01) (0.09)
5. Profit/(loss) before tax and exceptional items from continuing operations (3-4) 1571.74 2029.20 3332.81 11513.79 6. Exceptional Items - - - -
7.Profit before tax from continuing operations (5-6) 1571.74 2029.20 3332.81 11513.79 8. Tax expense:
a. Current Tax 484.00 686.47 940.00 2808.97 b. Prior period tax - 0.00 0.11 (107.43)
c. Deferred Tax 54.05 293.13 (36.15) 544.02 9. Profit/ (Loss) for the period from continuing operations (7-8) 1033.69 1049.61 2428.85 8268.23
10. Discontinued operations : a. Profit/(loss) before tax for the period from discontinued operations 3.62 367.41 (769.93) (1416.26)
b. Tax (Income)/ expense of discontinued operations - (100.57) (51.88) (98.83) Profit/ (loss) for the period after tax from discontinued operations (a-b) 3.62 467.98 (718.05) (1,317.43)
11. Profit/ (loss) for the period (9+10) 1037.32 1517.59 1710.80 6950.80
12. Other Comprehensive Income : A Items that will be reclassified to profit or loss - - - -
B Items that will not be reclassified to profit or loss Re-measurement gains (losses) on defined benefit plans - 0.98 - 0.98
Income tax effect - -0.34 - -0.34 Net (loss)/gain on FVTOCI equity securities 5459.07 29,055.97 0.16 29056.10
Income tax effect - - - - Total (B) 5,459.07 29,056.61 0.16 29,056.74
13. Total Comprehensive Income for the period (11+12) (Comprising Profit (Loss) and Other Comprehensive Income for the period) 6496.38 30574.20 1710.95 36007.55 14. Profit for the period from continuing operation attributable to: Equity holders of the parent 1020.07 1030.65 2388.87 8084.31 Non-controlling interests 13.62 18.96 39.98 183.92 15. Profit for the period from discontinued operation attributable to: Equity holders of the parent 0.00 446.63 (739.51) (1401.36) Non-controlling interests 3.62 21.35 21.46 83.93 16. Total Profit for the period attributable to : Equity holders of the parent 1020.08 1477.28 1649.36 6682.95 Non-controlling interests 17.24 40.31 61.44 267.85 Equity holders of the parent 5459.07 29056.61 0.16 29056.74 Non-controlling interests - - - -
18. Total comprehensive income for the period attributable to: Equity holders of the parent 6479.14 30533.89 1649.51 35739.70 Non-controlling interests 17.24 40.31 61.44 267.85 19. Paid up Equity Share Capital (face value of Rs.10/-each ) 2319.90 2319.90 2319.90 2319.90 20. Earnings per equity share of Rs.10/- each for continuing operations (1) Basic 4.40 4.44 10.30 34.85 (2) Diluted 4.40 4.44 10.30 34.85 21. Earnings per equity share of Rs.10/- each for discontinued operations
(1) Basic 0.00 1.93 (3.19) (6.04) (2) Diluted 0.00 1.93 (3.19) (6.04) 22. Earnings per equity share for discontinued and continuing operations (1) Basic 4.40 6.37 7.11 28.81 (2) Diluted 4.40 6.37 7.11 28.81
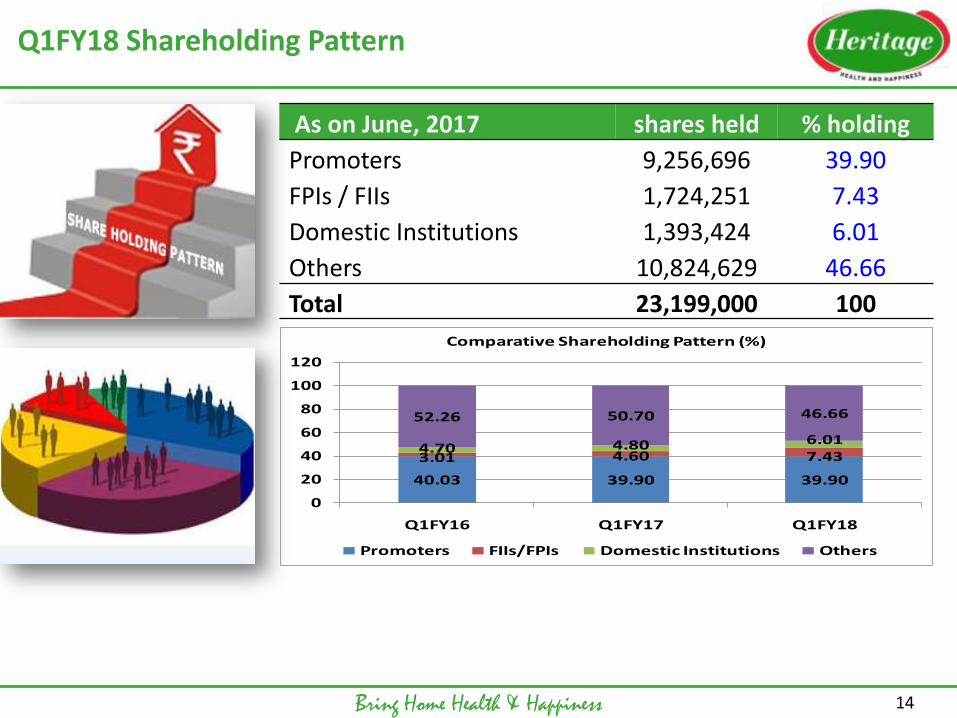
Q1FY18 Shareholding Pattern
Bring Home Health & Happiness
As on June, 2017 shares held % holding
Promoters 9,256,696 39.90
FPIs / FIIs 1,724,251 7.43
Domestic Institutions 1,393,424 6.01
Others 10,824,629 46.66
Total 23,199,000 100
14
40.03 39.90 39.90
3.01 4.60 7.434.70 4.80 6.01
52.26 50.70 46.66
0
20
40
60
80
100
120
Q1FY16 Q1FY17 Q1FY18
Comparative Shareholding Pattern (%)
Promoters FIIs/FPIs Domestic Institutions Others
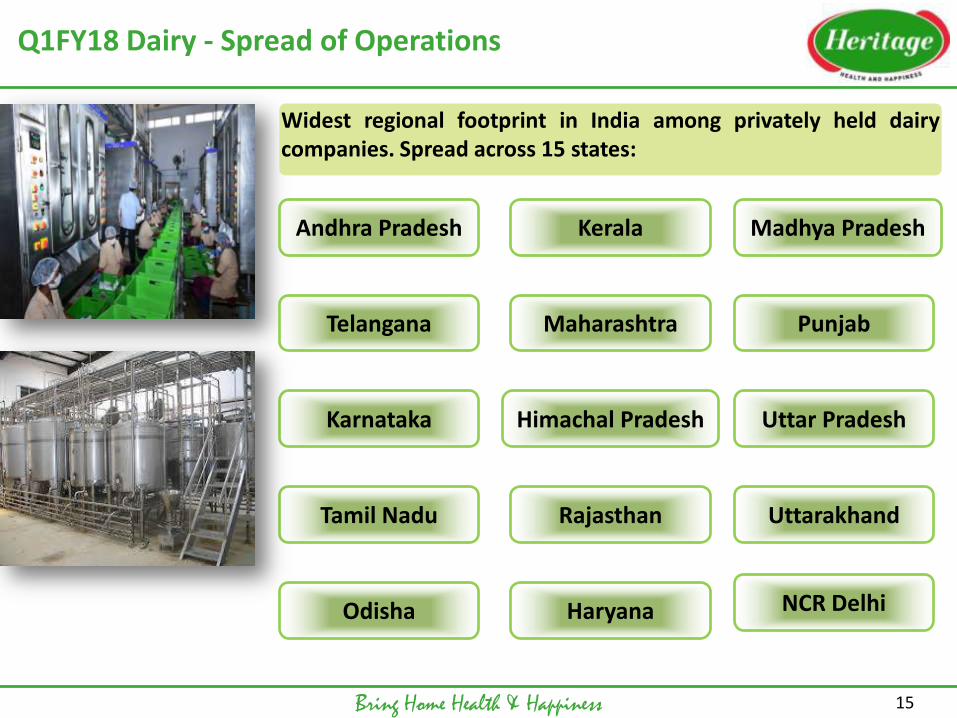
Q1FY18 Dairy - Spread of Operations
Bring Home Health & Happiness 15
Widest regional footprint in India among privately held dairy companies. Spread across 15 states:
Andhra Pradesh
Telangana
Karnataka
Tamil Nadu
Kerala
Maharashtra
Himachal Pradesh
Odisha
Rajasthan
Haryana
Madhya Pradesh
Punjab
Uttar Pradesh
Uttarakhand
NCR Delhi
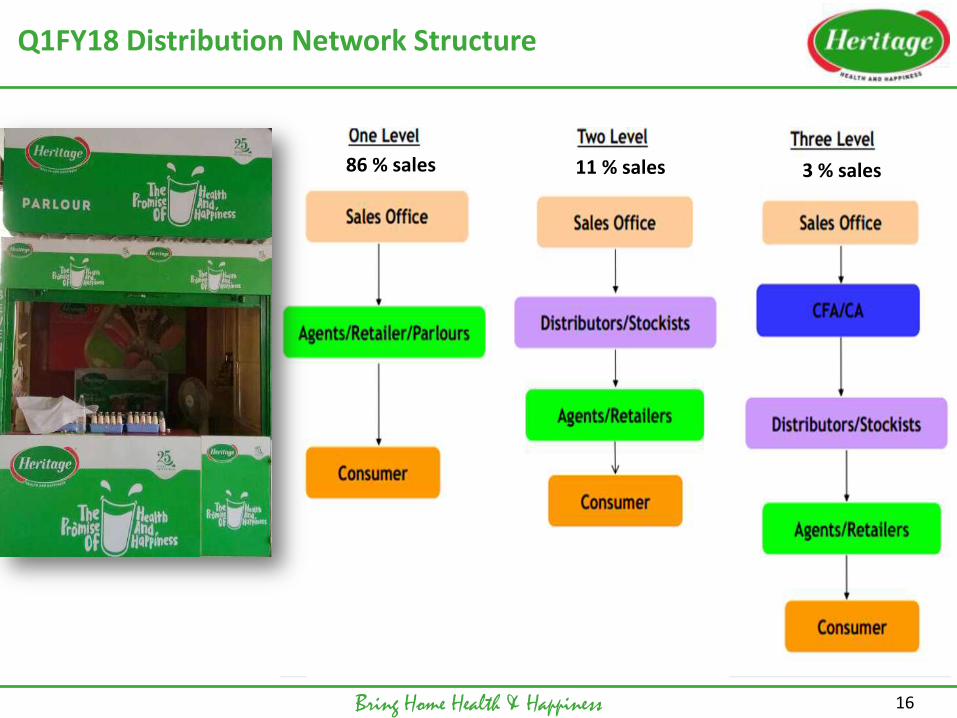
11 % sales 86 % sales 3 % sales
Q1FY18 Distribution Network Structure
Bring Home Health & Happiness 16
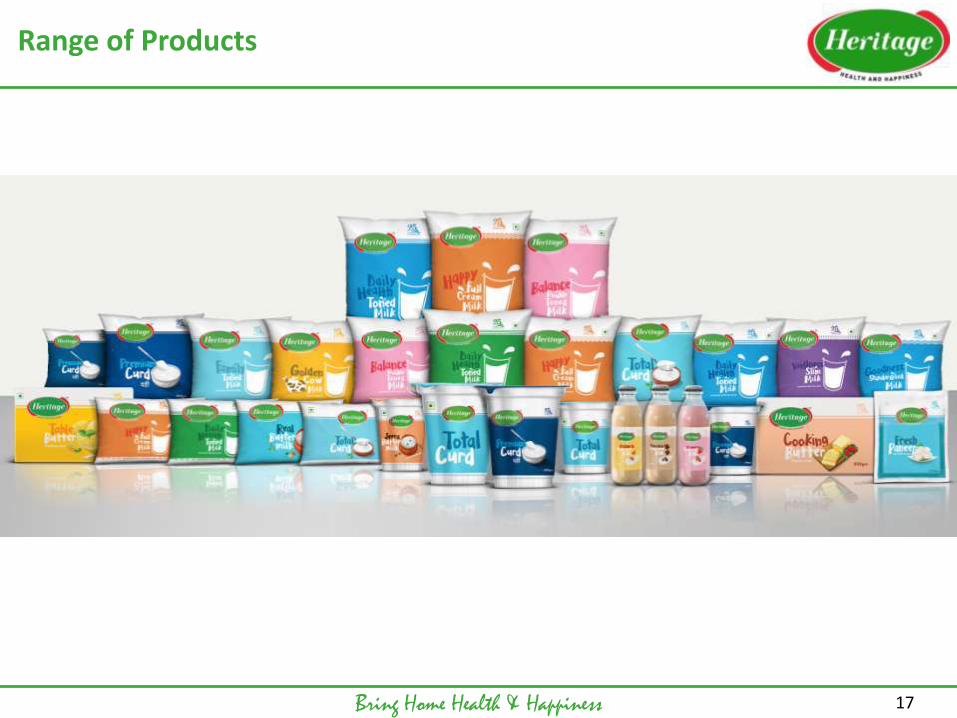
Range of Products
Bring Home Health & Happiness 17
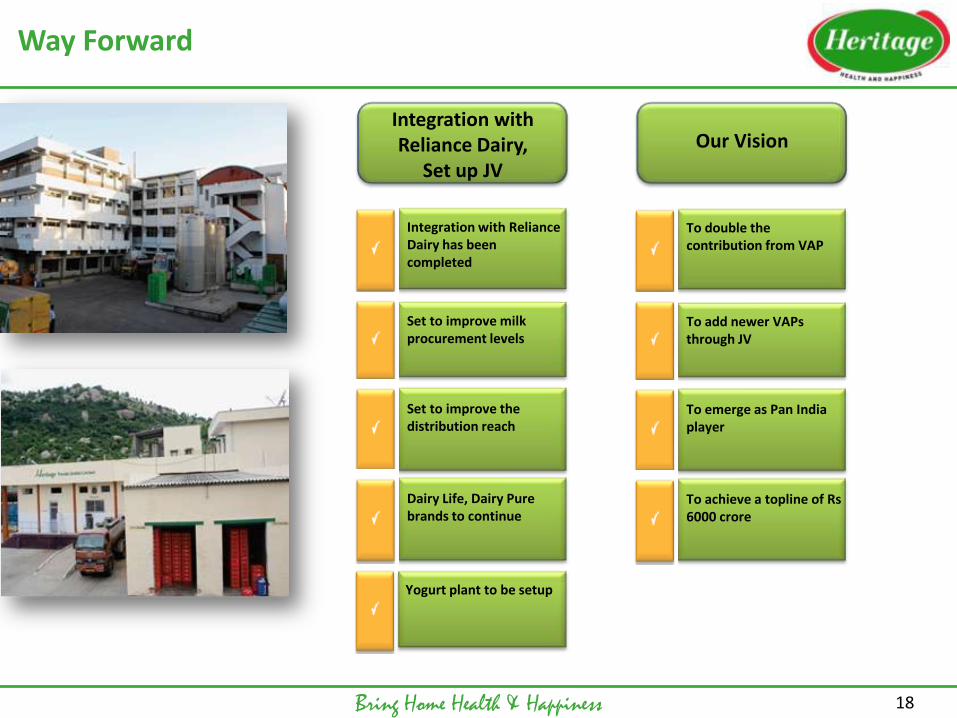
Way Forward
Bring Home Health & Happiness 18
Integration with Reliance Dairy has been completed
Integration with Reliance Dairy,
Set up JV
Our Vision
To double the contribution from VAP
Set to improve milk procurement levels
To add newer VAPs through JV
Set to improve the distribution reach
To emerge as Pan India player
Dairy Life, Dairy Pure brands to continue
To achieve a topline of Rs 6000 crore
Yogurt plant to be setup
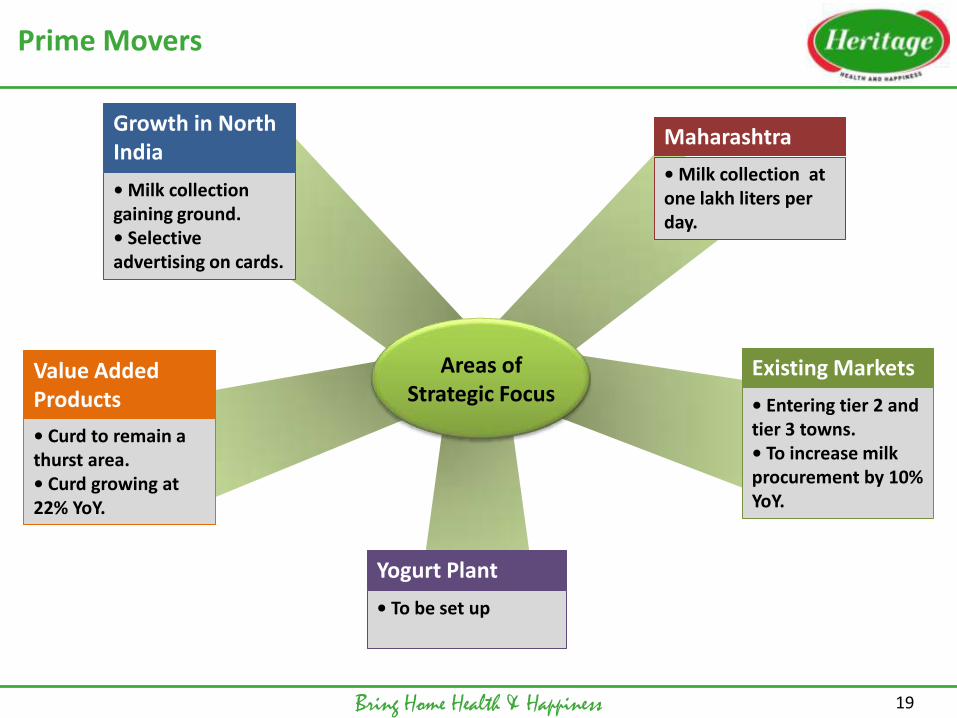
Prime Movers
Bring Home Health & Happiness 19
Areas of Strategic Focus
Growth in North India
Maharashtra
Existing Markets
Yogurt Plant
Value Added Products
• Milk collection gaining ground. • Selective advertising on cards.
• Milk collection at one lakh liters per day.
• Entering tier 2 and tier 3 towns. • To increase milk procurement by 10% YoY.
• Curd to remain a thurst area. • Curd growing at 22% YoY.
• To be set up
Thank You