here today, gone tomorrow: understanding freshman ...optimalprediction.com/files/pdf/v1a14.pdf ·...
TRANSCRIPT

Optimal Data Analysis Copyright 2010 by Optimal Data Analysis, LLC
2010, Vol. 1, Release 1 (September 17, 2010), 101-124 2155-0182/10/$3.00
101
Here Today, Gone Tomorrow:
Understanding Freshman Attrition
Using Person-Environment Fit Theory
Jennifer Howard Smith, Ph.D., Fred B. Bryant, Ph.D., Applied Research Solutions, Inc. Loyola University Chicago
David Njus, Ph.D., and Emil J. Posavac, Ph.D. Luther College Loyola University Chicago (Emeritus)
Person-Environment (PE) fit theory was used to explore the rela-
tionship between student involvement and freshman retention. In-
coming freshmen (N=382) were followed longitudinally in a two-
wave panel study, the summer before beginning college, and again
during the spring of their freshman year. Involvement levels, a
variety of summer and spring preferences (Ps), and spring percep-
tions (Es) regarding specific aspects of their college environment
were assessed. Twelve PE fit indicators were derived and com-
pared with respect to their relationship with student involvement
and retention. Results indicated that involvement was linked to
some PE fit indicators. Traditional parametric statistical analyses
were compared with a new, nonparametric technique, Classifica-
tion Tree Analysis (CTA), to identify the most accurate classifica-
tion model for use in designing potential attrition interventions.
Discriminant analysis was 14% more accurate than CTA in classi-
fying returners (97% vs. 85%), but CTA was 962% more accurate
classifying dropouts (8% vs. 84%). CTA identified nine clusters—
five of returners and four of dropouts, revealing that different sub-
groups of freshmen chose to return (and stay) for different reasons.
Students’ end-of-the-year preferences appear to be more important
than anticipated preferences, college perceptions, or PE fit levels.
People most at risk of dropping out of
organizational settings are those who have been
there the shortest periods of time.1 Thus, in col-
lege settings, students most at risk of dropping
out are freshmen.2,3
Although researchers have
long known about college attrition problems and
have proposed a variety of theoretical models as
potential remedies, little progress has been made
102
in actually reducing student dropout rates.2-4
The act of leaving college prior to graduation is
often seen as a form of failure on the part of the
attritor, and not on the part of the institution.
However, it may be that features of college en-
vironments may be at least partly responsible
for the early withdrawal of some students.3 This
possibility makes a theory which addresses both
person- and environment-focused variables (i.e.,
PE fit theory) potentially important in better un-
derstanding college attrition.
A large body of research has investi-
gated the issue of college attrition, linking stu-
dent departure to low levels of student integra-
tion and involvement. It is important to distin-
guish between two different conceptualizations
of “involvement” discussed in the education lit-
erature. One way to define involvement is be-
haviorally—as the degree to which students par-
ticipate in academic and social activities. Here,
involvement is defined solely in terms of stu-
dent behaviors (e.g., number of activities at-
tended, frequency of participation). A second
way to define involvement is psychologically—
as students’ level of perceived commitment to,
or affiliation with, their university.5,6
The pre-
sent study uses only the behaviorally-based con-
ceptualization of involvement.
Encouraging students to be involved in
campus activities seems to be an effective way
of positively influencing their perceptions and
ultimately their persistence.2-4,7-10
Student in-
volvement has been shown to affect commit-
ment to graduate; this commitment, in turn, has
been linked to both intentions to remain enrolled
and actual re-enrollment decisions.2-4,11
Calling students’ freshman year a “stra-
tegic leverage point,” Tinto claims that most
attrition decisions arise either explicitly during
the freshman year or have their roots in the first-
year experience.3 To maximize the chances for
students to make a commitment to graduate,
Tinto calls for an increase in freshman opportu-
nities to engage in (formal and informal) social
and academic activities. Astin’s research also
links college involvement to student develop-
ment and college retention.7-10,12,13
According to
Astin, attritors’ modal explanation for dropping
out is boredom with college. Indeed, boredom
may simply be another name for being unin-
volved. Of course, being uninvolved may be
caused by person-focused factors (e.g., student’s
lack of initiative), environment-focused factors
(e.g., lack of college opportunities), or both.
One way to understand the interaction of
person-focused and environment-focused fac-
tors on behavior is through Person-Environment
(PE) fit theory. Several studies have demon-
strated the relationship between the “fit” of stu-
dent characteristics (P) and college attributes
(E), and a plethora of educational variables in-
cluding physical symptoms,14,15
academic and
social competency,16
satisfaction,17
academic
achievement,18
student stress and strain,19
level
of cognitive development,20
withdrawal, alcohol
consumption, anxiety, the use of mental health
services, grade point average,14
coping stra-
tegies,21
volunteer motivation22
, school crime
and misbehavior,23
willingness to recommend
their college to prospective students,24
and re-
tention.25
However, few studies have investi-
gated the direct link between PE Fit and student
retention. Tinto alludes to PE fit in his retention
model, but offers no specific recommendations
concerning how to measure congruence between
student preferences and college characteristics,
nor conceptual or operational definitions of PE
misfit. Empirical tests of Tinto’s model also
lack these components.26
Astin also alludes to
PE fit in his retention research. However, like
Tinto, he does not explicitly measure PE misfit
in ways recommended by congruence research-
ers, such as assessing PE variables on commen-
surate conceptually corresponding scales.
The task of validly assessing the match
between personal properties and environmental
features is difficult.20,27-29
Researchers must de-
termine which P and E variables are the most
relevant to the population of interest. They also
must find the best way to combine these salient
dimensions into a congruence, or fit, score.
Those studying PE fit must balance the two di-
103
mensions, giving equal consideration to both.
Unfortunately, this often is not the case. Even
when one is certain that this balance has been
achieved, researchers must be certain that each
personal variable has a commensurate environ-
mental variable in order to justify calculating a
valid PE fit score.6,27,30-32
Whether to calculate
single or multiple PE fit indicators is another
important measurement issue to consider. The
notion of breaking down complex environments
into more manageably-sized Es can be traced to
Barker33
and Wicker,34
, and is still apparent to-
day in studies of noisy production lines,35
hos-
pital wings,36
college dormitories,37
career
counseling departments,38,39
and classrooms.40
A college campus may be an ideal candidate for
this type of research since most university set-
tings contain distinct sets of populations, op-
portunities, and values.15,41
Tinto proposed that
college environments actually are comprised of
clusters of social and academic communities or
subcultures.3 If micro-environments within a
school can be identified, it may be reasonable to
derive PE fit indicators for each dimension, ra-
ther than to rely simply on one overall con-
gruence score.
Researchers are far from reaching a con-
sensus regarding how best to operationally de-
fine the PE fit construct. The most frequently
used measure of congruence is the difference
score, which really is an indicator of PE misfit.32
P and E items are subtracted from one another,
producing a “discrepancy” score. Traditionally,
“Real E” items are subtracted from correspond-
ing “Ideal P” items, with the underlying as-
sumption that one’s actual environment typi-
cally will not exceed one’s ideal version of it.
Some PE fit researchers compute the absolute
value of this difference score, asserting that “P
less than E” effects are similar to “E greater
than P” effects.14,25,36,42
Others, however, have
preserved the direction of PE incongruence by
eliminating the absolute value sign.23,31,43-45
It is crucial that the personal (P) and en-
vironmental (E) components comprising the
congruence construct are carefully defined. Re-
searchers, however, disagree on how best to do
this. Examples of P conceptualizations are di-
verse and include dimensions such as: ideals,19
expectations,37
values,46,47
needs,11,48,49
inter-
ests,18,50,51
personalities,52
choices,50
and demo-
graphic information.7
Researchers have conceptualized the en-
vironmental (E) component of PE congruence a
variety of ways as well. Some define environ-
ments phenomenologically, by assessing occu-
pants’ images of a setting, rather than assessing
a setting’s objective features. Advocates of this
approach believe that perceptions have real con-
sequences.3,24
From this perspective, university
settings are defined in terms of their perceived
“climates”.48,49
A second E conceptualization
defines college environments in terms of the
aggregate of students’ characteristics.5,6,50,53
Environments from this perspective are defined
by who their occupants are (e.g., choice of ma-
jor, ability levels, and ethnic backgrounds), ra-
ther than by what their occupants perceive.
A third way to conceptualize college en-
vironments is by the activities that occur on
campus. Behaviorally-based E conceptualiza-
tions are concerned with what students and fac-
ulty actually do, rather than what perceptions
they share or what characteristics they pos-
sess.1,3,4,7,8,10
From this perspective both the op-
portunity for activities and the activities them-
selves combine to represent the E component.
Measures of student-college congruence
will differ depending on which of these P and E
conceptualizations are used to derive the con-
gruence construct. Using the image-based E,
PE fit assesses whether an institution lives up to
the reputation or mystique surrounding it. Us-
ing the “characteristics-based” E, PE fit repre-
sents how closely each student matches the at-
tributes of the student body majority. However,
using the third, “behaviorally-based” conceptu-
alization of “E,” PE Fit assesses the match be-
tween students’ preferences for involvement,
and the actual opportunities to become involved
in college.

104
If environments can be defined both sub-
jectively (e.g., climates) and objectively (e.g.,
aggregate characteristics), so can congruence
measures. According to French, “subjective”
PE fit reflects the match between people’s pref-
erences regarding their self-concept and their
setting, and their beliefs about these attributes.31
“Objective” PE fit, on the other hand, uses in-
formation that is independent of the biases un-
derlying human perceptions. Actual attributes
of both the person (e.g., knowledge, abilities)
and the environment (e.g., policies, activities)
interact to produce these PE fit indicators.
Some researchers have expressed a con-
cern about the potential for excess error within
subjective PE fit variables, claiming that an
over-reliance on perceptual data may lead to the
attenuation of true effects.19
They argue that
any one person’s assessment of the actual envi-
ronment (the E component) will contain associ-
ated error variance resulting from personal bi-
ases and the lack of relevant environmental in-
formation.6,27
For example, students are often
unaware of, or even denied access to, infor-
mation concerning specific activities and inter-
actions occurring on their campus. This lack of
knowledge may add error to E scores and atten-
uate the true effects of PE congruence.
In response to these concerns, some re-
searchers have suggested that the measurement
gap between objective and subjective reality be
narrowed.42
Tracey and Sherry proposed that a
more accurate measure of the actual environ-
ment is the mean of all respondents’ “Real E”
ratings. They claim that these environmental
“consensus” scores are highly reliable because
they are unlikely to be affected by individual
variation. They also claim that these more ob-
jective congruence measures possess more con-
struct validity, for they better represent the dis-
crepancy between ideal and actual settings.
Tracey and Sherry used this technique to
examine the relationship between PE fit and
student strain in a college residence hall. They
asked residents to describe the preferred char-
acteristics (P) of a residence hall and then to de-
scribe the actual characteristics (E) of their own
residence hall. In addition to creating subjective
discrepancy scores by subtracting each partici-
pant’s P score from her E score, Tracey and
Sherry also created an objective PE fit indicator
by computing the mean of all floormates’ E
scores and subtracting this measure of central
tendency from each P score. It was found that
discrepancy scores based on a consensus of E
were more highly correlated with student stress
and strain than respondents’ own “subjective”
PE fit scores. The superior strength of using the
mean of “Real E” scores has been demonstrated
in other studies investigating student-college
congruence.16
However, advocates of these “ob-
jective” measures of PE fit are not without their
critics. Edwards is leery of congruence meas-
ures that hold one element constant, such as
when the mean of “actual” ratings is used to
represent E.54,55
He argues that when PE fit is
computed this way, discrepancy scores merely
represent the variance attributable to one ele-
ment (e.g., P), and thus do not represent PE con-
gruence at all.
Besides determining how to measure PE
fit, another unresolved issue involves when to
measure congruence. The traditional approach
to measuring PE fit is to ask respondents to pro-
vide both their personal preferences (P) and
their environmental descriptions (E) concur-
rently.16,35,46
While this strategy is convenient
(i.e., requiring only one data collection session),
this design may suffer from a number of con-
ceptual and methodological problems, such as
restriction in range due to natural attrition. In-
dividuals who experience PE misfit over time
either exit or adapt to their environments, thus
spuriously shrinking the range of the personal
characteristics remaining and reducing the
measure’s predictive power.14,15,56
Selective at-
trition results, leaving only those most congru-
ent, and presumably those most productive and
satisfied, to occupy the setting, and to complete
researchers’ measures. This may pose a prob-
lem, since most participants of PE fit studies are
individuals who have occupied their settings the
105
longest.29
Individuals with considerable experi-
ence and familiarity with a setting (e.g., tenured
employees, seniors in college) are likely to pos-
sess synchronized preferences and perceptions.
These members are typically few in number and
may comprise an unrepresentative sample.5
Range restriction problems also raise the issue
of external validity threats. If tenured occupants
possess a unique set of similar characteristics,
results from any one PE fit study may be lack-
ing with respect to generalizability.57
One way
to remedy this problem is to examine longitudi-
nally populations that recently have entered an
environment. College freshmen may serve as an
ideal group for this approach.
Instead of measuring congruence at one
point in time, several researchers have begun to
utilize longitudinal research strategies to better
understand degrees of, or changes in, PE fit.
This nonconcurrent approach to measuring PE
fit, although more time consuming, offers many
benefits. For instance, these designs enable re-
searchers to assess occupants’ desires and per-
ceptions both before and after they are influ-
enced by the impact of their environments. If
planned carefully, nonconcurrent designs are
also able to include both congruent and incon-
gruent individuals in their pool of respondents.
Additionally, these designs also allow for dif-
ferent PE fit scores both before (e.g., “Antici-
patory PE fit”) and after (“Present PE fit”) indi-
viduals enter and familiarize themselves with a
setting to be calculated.14,46
Statistical Analysis Options
One goal of this project was to describe
and classify as accurately as possible two
groups of freshmen—those who returned as
sophomores and those who did not—using PE
fit variables and involvement indices. Two sta-
tistical techniques were compared with respect
to their ability to accuracy classify returners and
attritors. In addition to a traditional discrimi-
nant analysis (DA), an alternative statistical
technique also was performed on the data. Op-
timal Data Analysis (ODA) is a unique nonpar-
ametric approach to statistical classification that
explicitly maximizes the average percentage ac-
curacy in classification (PAC) across groups in
a sample.58
ODA works by finding an optimal
classification solution which consists of a cut-
point (the point that lies midway between suc-
cessive observations that are from different
groups) and a direction, which is analogous to
the “sign” of a conventional statistic like a cor-
relation. ODA finds the cutpoint and direction
combination such that no other combination can
result in fewer misclassifications: by definition,
the resulting model is always optimal.58
A special application of ODA, hierarchi-
cally optimal classification tree analysis (here-
after referred to as CTA) was used in the present
study, to distinguish returners from attritors.
CTA is an iterative ODA procedure that con-
structs a classification tree which hierarchically
maximizes the mean percent accuracy in classi-
fication (mean PAC) for a sample.58
CTA is
accomplished after several steps. First, a stop-
ping rule is determined a priori (e.g., experi-
mentwise Type I error of p<0.05). Second,
ODA is performed for every attribute (predictor)
separately, using the total sample. The attribute
yielding the greatest standard effect size is then
chosen and the cases are split according to this
model’s cutscore and direction on the attribute
having greatest effect strength (the model will
likely be imperfect, making both correct and
incorrect classifications). Third, ODA is per-
formed again using all of the attributes, but only
on a subset of the sample—the respondents who
were predicted to be in one class only (e.g.,
dropouts) in an attempt to improve classification
for this partition only. If a new attribute is
found to improve the predictive value it is added
to that particular “branch” of the classification
tree. If not, the branch ends there. The classifi-
cation tree “grows” until a sufficient number of
attributes is found that best describes each sub-
set of the sample. Branches are then “pruned”
(i.e., nodes are removed) if their Type I error
exceeds a set criterion, or if the branches do not
enhance the model’s overall mean PAC.58.59
106
Traditional DA assumes that a set of at-
tributes is equally relevant and meaningful to all
members of a particular sample.59
CTA, in con-
trast, creates separate discriminant functions for
different subsets of the sample while describing
clusters of individuals that share the same com-
mon pathway. For example, it may be that stu-
dents choose to leave or to remain for different
reasons. One segment of the freshman class may
return for social reasons, while another segment
may return for academic reasons. These spe-
cialized student clusters, which would be over-
looked with traditional DA, may help to identify
unique sets of “at-risk” freshmen.
Another advantage of CTA is freedom
from the restrictive assumptions underlying par-
ametric tests. DA requires that several assump-
tions be satisfied, such as independence, linear-
ity, and distributions that are normal, in order
for the estimated Type I error rate to be valid.61
In contrast, for CTA “p” (i.e., the probability of
making a Type I error) is exact and always val-
id, because it is based solely on the structural
features of a particular data set. 58
Because bias may enter a classification
solution if the coefficients used to assign a par-
ticipant to a particular group are derived using
that person’s data, it is important to perform
leave-one-out (LOO) validity analysis (also
called the jackknife procedure).58
This proce-
dure is then repeated, holding a different case
out each time, for every case. An advantage of
CTA is that LOO analysis is performed at every
step in the analysis.
Purpose and Hypotheses
This study was conducted with three
purposes in mind. The main purpose of this
study was to assess the degree to which in-
volvement in college activities was associated
with first year students’ PE fit levels, and the
degree to which these PE fit levels impacted
their decisions to return as sophomores. A se-
cond purpose was to determine the relative con-
tributions that different PE fit derivations make
in explaining student involvement and attrition.
Finally, this study sought to compare traditional
multivariate statistical strategies with nonpara-
metric optimal analyses. Based on previous
empirical tests of PE fit theory and college re-
tention models, these three goals resulted in the
following six predictions.
1. The first hypothesis addressed the di-
mensionality of the PE fit construct, and pre-
dicted that student “Ideals” (Ps) with respect to
college environment preferences would be mul-
tidimensional, and thus multiple PE fit indica-
tors would be derived—one per dimension. It
also was expected that these dimensions would
be stable over time, from summer until spring.
2. The second hypothesis addressed the
relationship between students’ participation in
college activities and their subsequent PE con-
gruence levels. It was hypothesized the more
that students participated in college activities,
the greater would be their degree of PE fit.
3. The third hypothesis addressed the re-
lationship between PE fit and retention deci-
sions. It was proposed that students with greater
PE fit would be more likely to return for their
sophomore year than students with more incon-
gruent levels.
4. In-coming freshmen may not be as
certain of their college environment preferences
prior to beginning college, so the fourth hypoth-
esis predicted “Present” PE fit (Posttest Ideals
minus Posttest Reals) scores would be a better
predictor of return status, and a better criterion
of college involvement, than “Anticipatory” PE
fit (Pretest Ideal minus Posttest Real).
5. Because it is likely that no one student
can accurately describe all dimensions of a col-
lege environment, “Objective” PE fit (Posttest
Ideals minus the mean of Posttest Reals) was
hypothesized to be a better predictor of return
status, and a better criterion for college in-
volvement, than “Subjective” PE fit (individual
Posttest Ideals minus individual Posttest Reals).
6. Lastly, it was proposed that PE con-
gruence measures would be more strongly re-
lated to college involvement and retention deci-
107
sions than either college preferences (P) or col-
lege perceptions (E) alone.
Method
Participants. In-coming freshmen from
a large Midwestern Catholic university were
surveyed during summer registration sessions,
and again during the spring of their freshman
year either in residence halls (for on-campus
students) or by postal mail (for commuters). A
total of 1,108 freshmen of the 1,186 students
comprising the freshman class (93.4%) com-
pleted summer questionnaires, and 420 of these
freshmen (38%) completed spring question-
naires (12 additional students completed the
posttest, but not the pretest.) Of the 420 spring
participants, 382 placed a confidential identifi-
cation number on both questionnaires, allowing
their summer and spring responses to be linked
and compared. Data from these 382 “pretest-
posttest” students were subsequently used to test
the hypotheses; they represented 34.5% of the
original sample.
Procedure and Instruments. Pretest data
were obtained during summer registration ses-
sions before the students’ first semester. Post-
test data were obtained at the end of partici-
pants’ freshman year. Social security numbers
were used to match students’ pretest and post-
test responses. The confidential treatment of re-
sponses was clearly emphasized to participants
and was strictly enforced.
Pretest. In an attempt to increase the re-
sponse rate, pretest data were collected during
summer orientation sessions. All but 78 stu-
dents who comprised the freshman class (1,108
of 1,186) gathered in groups of approximately
200 in a university auditorium the first morning
of their respective registration sessions (numer-
ous sessions were held throughout the summer).
After completing math placement exams, fresh-
men completed the PE fit pretest questionnaire.
Pretest items assessed respondents’ col-
lege preferences. These items represented “an-
ticipated” ideals (Ps), since they were completed
before students actually experienced college
life. Participants evaluated various features of a
college environment using 7-point scales, rang-
ing from “very undesirable” to “very desirable.”
The pretest questionnaire contained 46
items which were either created specifically for
this college environment or were borrowed from
past PE congruence instruments. Eleven items
were chosen to correspond to the various com-
ponents of a new university program designed
to encourage freshman participation and to en-
hance freshman retention implemented that
year. For example, freshmen were asked to in-
dicate how desirable it would be to go on a re-
treat, to use electronic-mail to communicate
with faculty, and to go to the symphony or the-
ater. Fourteen items corresponded to activities
common to any university setting, such as vot-
ing in a campus election, or attending a social
event. Twenty-one items were borrowed and
modified from the Organizational Culture Pro-
file Item Set.46
This set of items tapped stu-
dents’ preferences for certain environmental
“presses” or images. For example, freshmen
were asked to indicate how desirable it would be
for their college environment to be rule-ori-
ented, to be supportive, to foster independence,
and to allow them time to themselves.
Posttest. The posttest questionnaire was
distributed in the spring of respondents’ first
year, approximately 9 months after the pretest.
Students residing on-campus were given post-
test questionnaires in their residence halls.
Commuter students were surveyed via the mail.
Respondents rated the same set of col-
lege dimensions that were included in the pre-
test questionnaire with the exception of three
items (“reward minimal effort with high
grades;” “reward good performance with high
grades;” “have the same classmates in several of
my courses”) which were eliminated due to the
findings of an exploratory principal components
analysis which are discussed below. However,
unlike the pretest instrument which contained
only items assessing college ideals (“Anticipa-
tory” Ps), the posttest instrument contained both
college preference (“Present” P) and college
108
perception (i.e., “Real” E) items presented on
commensurate scales.
For preference (P) ratings, students were
asked to indicate the degree to which they de-
sired various college attributes, and the degree
to which they would desire participating in a
variety of college activities (1=not at all; 7=
very much). For perception (E) ratings, students
were asked to indicate the extent to which each
attribute accurately described their college im-
pressions and experiences (1=not at all; 7=very
much). Anchors differed depending on whether
E items were presented as continuous (1=never;
7=very often) or discrete (yes/no) variables.
Attributes
Three major groups of attributes were
measured to test the specified hypotheses.
Student Involvement. Sixteen “Real” (E)
items were combined to create an involvement
index which assessed the extent to which stu-
dents participated in both academic activities
(e.g., speaking up in class; seeking out one’s
advisor) and social activities (e.g., attending a
cultural event; being active in campus politics)
during their first year. Psychologically-based
aspects of involvement, such as students’ com-
mitment to the university, were not assessed.
Five of the 16 involvement items tapped
activities that could be done repeatedly through-
out one’s freshman year (e.g., chat with an in-
structor, go to church with friends), and were
rated on 7-point scales ranging from “never” to
“very often.” The remaining 11 items included
events that, for the most part, students would
engage in only once or twice during the school
year (e.g., go on a retreat, dine with a professor).
To indicate whether or not they engaged in these
activities, students circled either “Yes” or “No.”
To create an overall index of involve-
ment for each student, the sum for each of the
two sets of items was converted to standard (z)
scores, and multiplied by the number of items
comprising those sets (5 and 11, respectively).
These scores were then added together and di-
vided by 16 to create an overall standardized
involvement index.
PE Fit. Derivation of PE fit indicators
was complex, and involved four steps. First, two
principal components analyses were performed
on the summer and spring sets of Ideal data to
determine the dimensionality of student college
preferences (Ps). Three factors were revealed
and named “College Image,” “Student Experi-
ence,” and “Traditional-Catholic.” E items were
then categorized on the basis of these factors so
that PE fit scores could be derived (see Results).
The second step involved computing PE
Fit indicators as difference scores. PE fit indi-
cators were computed at the factor level only.31
However, in contrast to French’s congruency
formula, the absolute values of these differences
were used so that specific multivariate statistical
analyses could be performed.31
Thus, for the
present study, PE fit was calculated as the ab-
solute value of the difference between the sum
of student preference (P) items and the sum of
the commensurate set of student perception (E)
items for each of the three dimensions: PE
Fit=P - E. These differences were then
divided by the number of commensurate pairs in
each of the three factors (16, 13, and 8 items,
respectively). The magnitude of absolute dif-
ference scores increases as P and E ratings be-
come increasingly discrepant, so small congru-
ence scores represent greater PE fit.
Because several authors suggest differ-
ent ways to derive PE fit scores, the third step
involved deriving four distinct kinds of discrep-
ancy scores (Table 1).19,30,44
First, to determine
the degree of congruence for students who had
not yet experienced college life, “Anticipatory”
PE fit scores were computed by taking the dif-
ference between pretest Ideal ratings and post-
test Real ratings. Second, to determine stu-
dents’ level of congruence at the end of their
first year, “Present” PE fit scores were derived
by computing the difference between posttest
Ideal ratings and posttest Real ratings.

109
Table 1: PE Fit Components and Derivations
Component Operational Definition
Anticipatory Personal Preferences (P)a Pretest Ideal items
Present Personal Preferences (P) Posttest Ideal items
Actual Environmental Properties (E) Posttest Real items
Type of PE Fitb Derivation of Difference Score
c
Anticipatory Subjective PE Fit Pretest Ideals minus Posttest Reals
Anticipatory Objective PE Fit Pretest Ideals minus (mean) Posttest Reals
Present Subjective PE Fit Posttest Ideals minus Posttest Reals
Present Objective PE Fit Posttest Ideals minus (mean) Posttest Reals
-----------------------------------------------------------------------------------------------------------
Note: aThis construct was assessed during summer orientation sessions. All other attributes were derived
using data collected at the end of respondents' first year. bThese variables were computed for each of the
three dimensions (College Image, Student Experience, and Traditional-Catholic). cAll PE fit derivations
used the absolute value of the differences.
The third and fourth types of PE fit indi-
cators differed with respect to how the E attrib-
utes were computed. “Subjective” congruence
scores were derived by taking the difference be-
tween each freshman’s set of (posttest) Ideal
and Real scores. “Objective” fit scores were
computed by replacing respondents’ individual
Real scores with the mean of all students’ Real
rating. Crossing Anticipatory and Present con-
gruence measures with Subjective and Objective
measures, a total of four PE fit indicators re-
sulted: (a) Anticipatory Subjective PE Fit; (b)
Present Subjective PE Fit; (c) Anticipatory Ob-
jective PE fit; and (d) Present Objective PE fit.
The final fourth step in the derivation of
PE fit indicators involved computing congru-
ence scores across the three dimensions revealed
in the first step. The four PE fit indicators de-
rived for each of these factors resulted in a total
of 12 types of PE fit indicators (see Table 2).
Return Status. Retention information
was obtained via the university’s Department of
Institutional Research. Respondents failing to
return for the sophomore year were classified as
attritors, regardless of the reason for departure.
Results
Pretest-Posttest Respondents vs. Pretest-
Only Respondents. Analyses comparing re-
spondents who completed only the pretest with
respondents who completed both measures were
performed. Summer Ideal responses, as well as
additional demographic and academic infor-
mation, were compared. Because comparisons
are meaningful only for students who had the
opportunity to complete both measures, 44 stu-
dents who completed the fall semester but who
did not re-enroll for the spring semester were
omitted from these analyses.
Results revealed that pretest-posttest and
pretest only students were comparable on sev-
eral important dimensions. For instance, these
groups did not differ greatly with respect to at-
trition rates (10.5% vs. 13.7%, respectively), nor
did they differ statistically with respect to an-
ticipatory preferences on the three PE fit dimen-
sions (ps>0.05, mean effect size=0.10). These
groups also did not have different expectations
regarding first-semester GPAs (3.51 vs. 3.57,
respectively, effect size=0.04), or first-year cu-
mulative GPAs (3.61 for both groups).
110
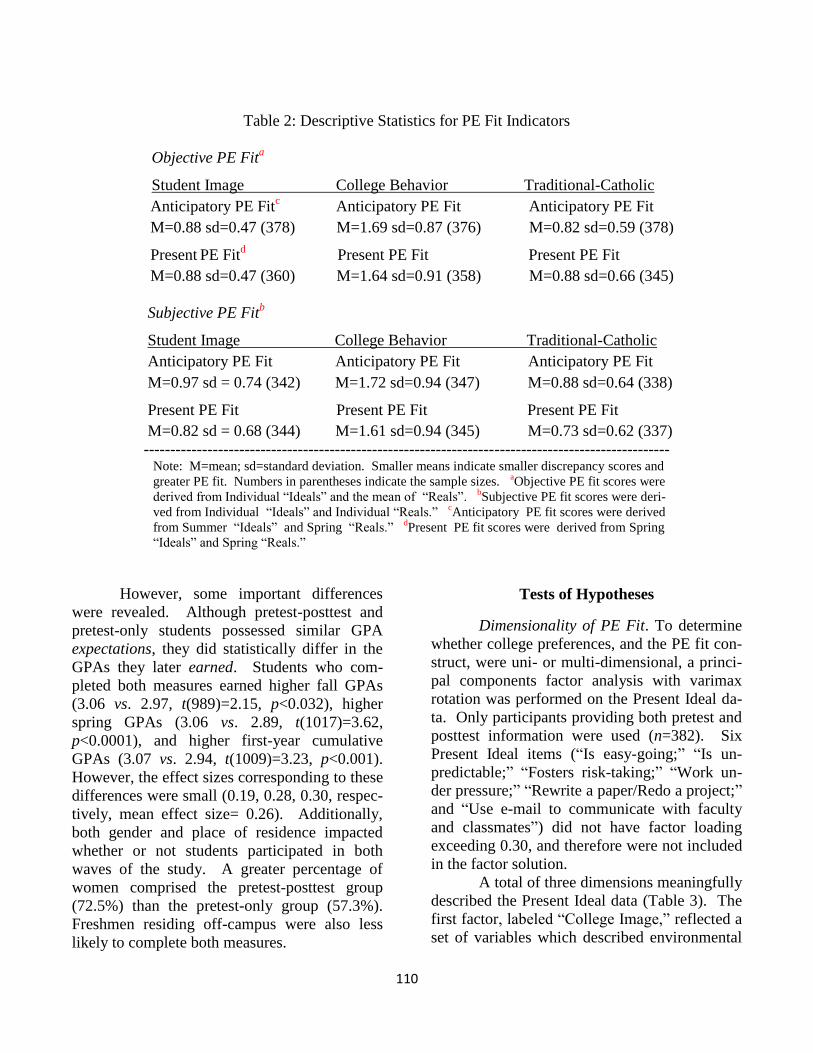
Table 2: Descriptive Statistics for PE Fit Indicators
Objective PE Fita
Student Image College Behavior Traditional-Catholic
Anticipatory PE Fitc Anticipatory PE Fit Anticipatory PE Fit
M=0.88 sd=0.47 (378) M=1.69 sd=0.87 (376) M=0.82 sd=0.59 (378)
Present PE Fit
d Present PE Fit Present PE Fit
M=0.88 sd=0.47 (360) M=1.64 sd=0.91 (358) M=0.88 sd=0.66 (345)
Subjective PE Fitb
Student Image College Behavior Traditional-Catholic
Anticipatory PE Fit Anticipatory PE Fit Anticipatory PE Fit
M=0.97 sd = 0.74 (342) M=1.72 sd=0.94 (347) M=0.88 sd=0.64 (338)
Present PE Fit Present PE Fit Present PE Fit
M=0.82 sd = 0.68 (344) M=1.61 sd=0.94 (345) M=0.73 sd=0.62 (337)
--------------------------------------------------------------------------------------------------- Note: M=mean; sd=standard deviation. Smaller means indicate smaller discrepancy scores and
greater PE fit. Numbers in parentheses indicate the sample sizes. aObjective PE fit scores were
derived from Individual “Ideals” and the mean of “Reals”. bSubjective PE fit scores were deri-
ved from Individual “Ideals” and Individual “Reals.” cAnticipatory PE fit scores were derived
from Summer “Ideals” and Spring “Reals.” dPresent PE fit scores were derived from Spring
“Ideals” and Spring “Reals.”
However, some important differences
were revealed. Although pretest-posttest and
pretest-only students possessed similar GPA
expectations, they did statistically differ in the
GPAs they later earned. Students who com-
pleted both measures earned higher fall GPAs
(3.06 vs. 2.97, t(989)=2.15, p<0.032), higher
spring GPAs (3.06 vs. 2.89, t(1017)=3.62,
p<0.0001), and higher first-year cumulative
GPAs (3.07 vs. 2.94, t(1009)=3.23, p<0.001).
However, the effect sizes corresponding to these
differences were small (0.19, 0.28, 0.30, respec-
tively, mean effect size= 0.26). Additionally,
both gender and place of residence impacted
whether or not students participated in both
waves of the study. A greater percentage of
women comprised the pretest-posttest group
(72.5%) than the pretest-only group (57.3%).
Freshmen residing off-campus were also less
likely to complete both measures.
Tests of Hypotheses
Dimensionality of PE Fit. To determine
whether college preferences, and the PE fit con-
struct, were uni- or multi-dimensional, a princi-
pal components factor analysis with varimax
rotation was performed on the Present Ideal da-
ta. Only participants providing both pretest and
posttest information were used (n=382). Six
Present Ideal items (“Is easy-going;” “Is un-
predictable;” “Fosters risk-taking;” “Work un-
der pressure;” “Rewrite a paper/Redo a project;”
and “Use e-mail to communicate with faculty
and classmates”) did not have factor loading
exceeding 0.30, and therefore were not included
in the factor solution.
A total of three dimensions meaningfully
described the Present Ideal data (Table 3). The
first factor, labeled “College Image,” reflected a
set of variables which described environmental
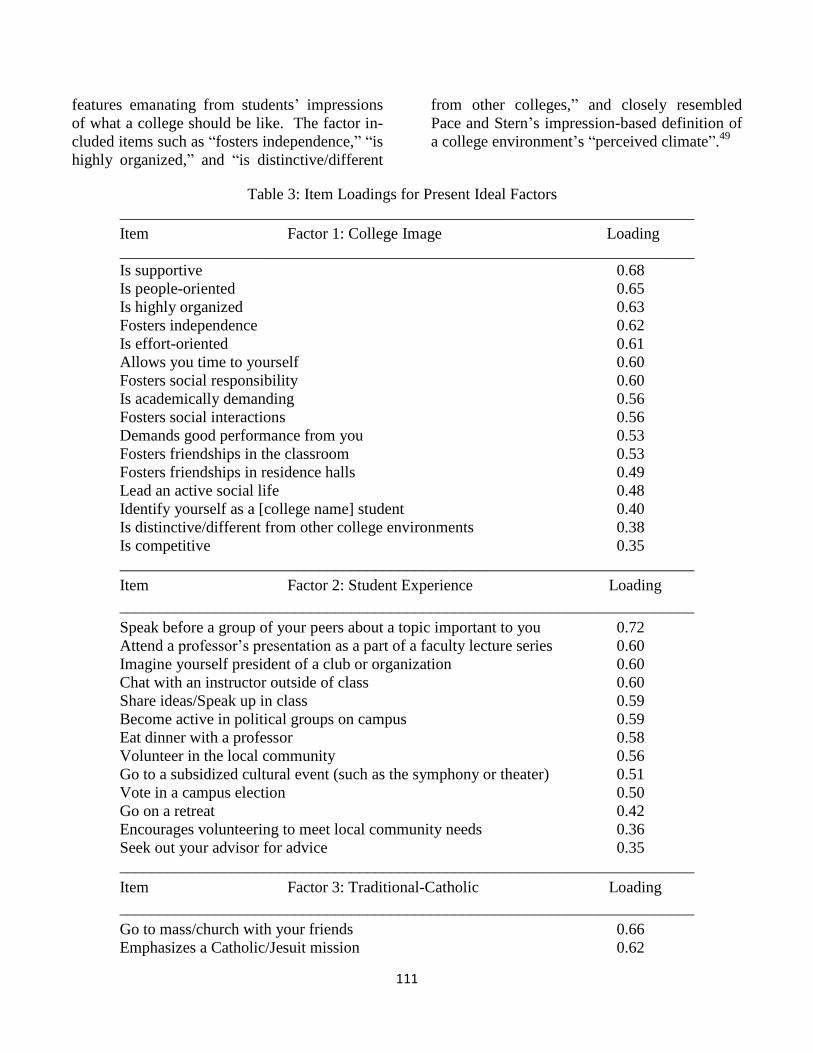
111
features emanating from students’ impressions
of what a college should be like. The factor in-
cluded items such as “fosters independence,” “is
highly organized,” and “is distinctive/different
from other colleges,” and closely resembled
Pace and Stern’s impression-based definition of
a college environment’s “perceived climate”.49
Table 3: Item Loadings for Present Ideal Factors
________________________________________________________________________
Item Factor 1: College Image Loading
________________________________________________________________________
Is supportive 0.68
Is people-oriented 0.65
Is highly organized 0.63
Fosters independence 0.62
Is effort-oriented 0.61
Allows you time to yourself 0.60
Fosters social responsibility 0.60
Is academically demanding 0.56
Fosters social interactions 0.56
Demands good performance from you 0.53
Fosters friendships in the classroom 0.53
Fosters friendships in residence halls 0.49
Lead an active social life 0.48
Identify yourself as a [college name] student 0.40
Is distinctive/different from other college environments 0.38
Is competitive 0.35
________________________________________________________________________
Item Factor 2: Student Experience Loading
________________________________________________________________________
Speak before a group of your peers about a topic important to you 0.72
Attend a professor’s presentation as a part of a faculty lecture series 0.60
Imagine yourself president of a club or organization 0.60
Chat with an instructor outside of class 0.60
Share ideas/Speak up in class 0.59
Become active in political groups on campus 0.59
Eat dinner with a professor 0.58
Volunteer in the local community 0.56
Go to a subsidized cultural event (such as the symphony or theater) 0.51
Vote in a campus election 0.50
Go on a retreat 0.42
Encourages volunteering to meet local community needs 0.36
Seek out your advisor for advice 0.35
________________________________________________________________________
Item Factor 3: Traditional-Catholic Loading
________________________________________________________________________
Go to mass/church with your friends 0.66
Emphasizes a Catholic/Jesuit mission 0.62

112
Emphasizes a single set of values throughout the university 0.52
Attend a Pep-Rally before a game 0.50
Is rule-oriented 0.48
Go to a planned social event in your residence hall 0.46
Is team-oriented 0.44
Is grade-oriented 0.40
------------------------------------------------------------------------------------------------------------ Note: Displayed items include only Present Ideal items with factor loadings>0.30. For factors 1, 2 and 3,
respectively: Chronbach’s alpha=0.85, 0.83, and 0.78; eigenvalue=8.19, 3.10, and 2.27.
The second factor represented respond-
ents’ preferences regarding academic and social
experiences. Included in this dimension were
“action” items, rather than “image” items like
those comprising the first factor. This factor
was labeled “Student Experience” and included
items such as “share ideas/speak up in class,”
“volunteer in the local community,” and “seek
out your advisor for advice.” This factor closely
resembled Astin’s behaviorally-based definition
of “college environment”.9,10,12
The third and final dimension combined
both “image” and “behavior” items to reflect
what seem to be respondents’ preferences for a
conservative college experience. Traditional
college attributes as well as features related to
religiously affiliated schools comprised this fac-
tor labeled “Traditional-Catholic” and included
items such as “emphasizes a single set of values
throughout the university,” “is rule-oriented,”
and “attend a pep-rally before a big game.”
Correlations among these three college dimen-
sions were positive (College Image and Student
Experience, r=0.45; College Image and Tradi-
tional-Catholic, r=0.40; and Student Experience
and Traditional-Catholic, r=0.41, all ps<0.01).
To test the stability of this three-factor so-
lution, a principal components factor analysis
with varimax rotation also was performed on the
Anticipatory Ideal items. This factor solution
was then compared to the factor structure re-
sulting from the Present Ideal data using Coeffi-
cients of Congruence (COC). Results compar-
ing the two three-factor solutions revealed that
the underlying factor structures of the two data
sets were highly congruent. The highest COC
was between summer and spring Student Expe-
rience dimensions (0.96), with the College Im-
age dimension also showing comparable factor
structures (0.93). The Traditional-Catholic di-
mensions were least congruent, but the degree
of factor correspondence was still high (0.70).
Because PE fit scores involve the differ-
ence between commensurate “Ideal” and “Real”
scores, only one of these two factor solutions
were used to compute the discrepancy scores.
The dimensions resulting from the posttest data
were chosen for two reasons. First, although the
two sets of three-factor solutions displayed
comparable internal consistencies (Cronbach
alphas=0.84, 0.83, 0.81 for summer factors vs.
Cronbach alphas=0.85, 0.83, 0.71 for respective
spring factors), the Present Ideal factors account
for a larger percentage of the variance (36.5%
vs. 34.8%) in their respective data set.
The second reason for choosing the Pre-
sent Ideal factors involved students’ degree of
familiarity with their college setting. After hav-
ing experienced a college environment for nine
months, students should be better able to de-
scribe their college preferences than before
starting school. Spring factors thus served as
the basis from which PE fit scores were derived.
Student Involvement and PE Fit. To test
the prediction that highly involved freshmen
would possess more congruent PE fit levels,
correlations were calculated between the in-
volvement index and eight PE fit indicators (the
involvement index was derived using 16 Student
Experience Real items: thus, the four congru-
ence measures related to the Student Experience
dimension were not included in these analyses
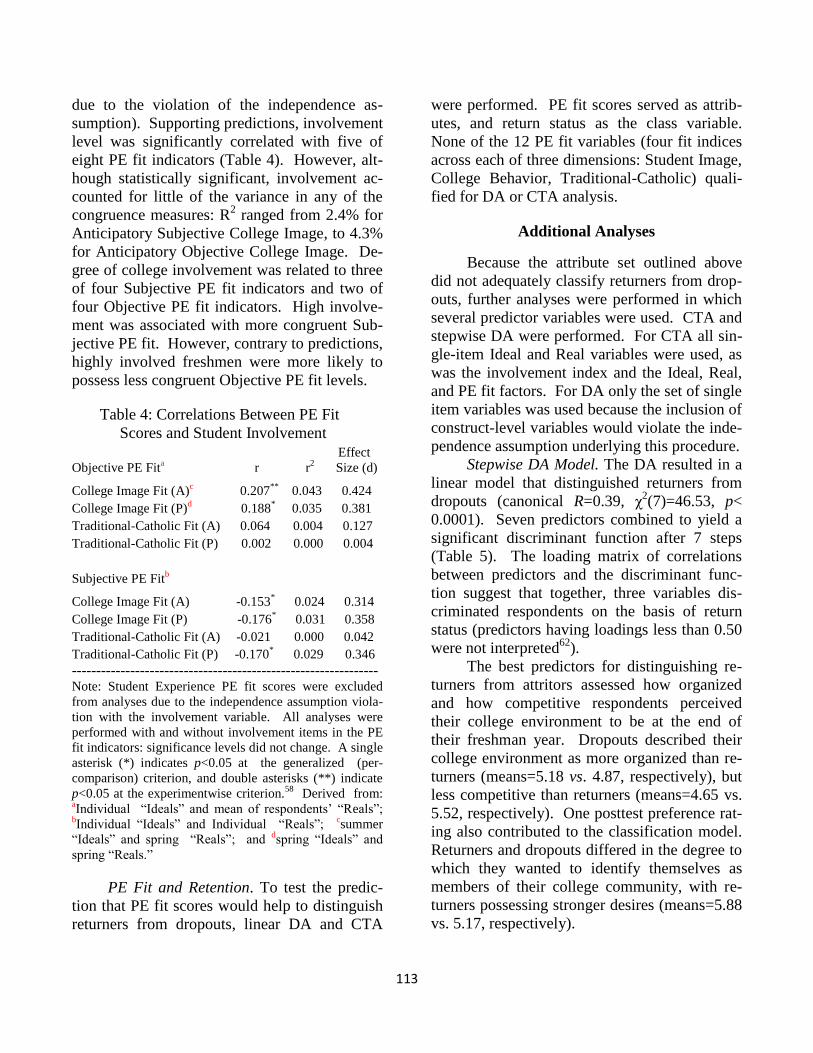
113
due to the violation of the independence as-
sumption). Supporting predictions, involvement
level was significantly correlated with five of
eight PE fit indicators (Table 4). However, alt-
hough statistically significant, involvement ac-
counted for little of the variance in any of the
congruence measures: R2 ranged from 2.4% for
Anticipatory Subjective College Image, to 4.3%
for Anticipatory Objective College Image. De-
gree of college involvement was related to three
of four Subjective PE fit indicators and two of
four Objective PE fit indicators. High involve-
ment was associated with more congruent Sub-
jective PE fit. However, contrary to predictions,
highly involved freshmen were more likely to
possess less congruent Objective PE fit levels.
Table 4: Correlations Between PE Fit
Scores and Student Involvement
Effect
Objective PE Fita
r r2 Size (d)
College Image Fit (A)c 0.207
** 0.043 0.424
College Image Fit (P)d 0.188
* 0.035 0.381
Traditional-Catholic Fit (A) 0.064 0.004 0.127
Traditional-Catholic Fit (P) 0.002 0.000 0.004
Subjective PE Fitb
College Image Fit (A) -0.153*
0.024 0.314
College Image Fit (P) -0.176* 0.031 0.358
Traditional-Catholic Fit (A) -0.021 0.000 0.042
Traditional-Catholic Fit (P) -0.170* 0.029
0.346
--------------------------------------------------------------- Note: Student Experience PE fit scores were excluded
from analyses due to the independence assumption viola-
tion with the involvement variable. All analyses were
performed with and without involvement items in the PE
fit indicators: significance levels did not change. A single
asterisk (*) indicates p<0.05 at the generalized (per-
comparison) criterion, and double asterisks (**) indicate
p<0.05 at the experimentwise criterion.58
Derived from: aIndividual “Ideals” and mean of respondents’ “Reals”;
bIndividual “Ideals” and Individual “Reals”;
csummer
“Ideals” and spring “Reals”; and dspring “Ideals” and
spring “Reals.”
PE Fit and Retention. To test the predic-
tion that PE fit scores would help to distinguish
returners from dropouts, linear DA and CTA
were performed. PE fit scores served as attrib-
utes, and return status as the class variable.
None of the 12 PE fit variables (four fit indices
across each of three dimensions: Student Image,
College Behavior, Traditional-Catholic) quali-
fied for DA or CTA analysis.
Additional Analyses
Because the attribute set outlined above
did not adequately classify returners from drop-
outs, further analyses were performed in which
several predictor variables were used. CTA and
stepwise DA were performed. For CTA all sin-
gle-item Ideal and Real variables were used, as
was the involvement index and the Ideal, Real,
and PE fit factors. For DA only the set of single
item variables was used because the inclusion of
construct-level variables would violate the inde-
pendence assumption underlying this procedure.
Stepwise DA Model. The DA resulted in a
linear model that distinguished returners from
dropouts (canonical R=0.39, χ2(7)=46.53, p<
0.0001). Seven predictors combined to yield a
significant discriminant function after 7 steps
(Table 5). The loading matrix of correlations
between predictors and the discriminant func-
tion suggest that together, three variables dis-
criminated respondents on the basis of return
status (predictors having loadings less than 0.50
were not interpreted62
).
The best predictors for distinguishing re-
turners from attritors assessed how organized
and how competitive respondents perceived
their college environment to be at the end of
their freshman year. Dropouts described their
college environment as more organized than re-
turners (means=5.18 vs. 4.87, respectively), but
less competitive than returners (means=4.65 vs.
5.52, respectively). One posttest preference rat-
ing also contributed to the classification model.
Returners and dropouts differed in the degree to
which they wanted to identify themselves as
members of their college community, with re-
turners possessing stronger desires (means=5.88
vs. 5.17, respectively).
114
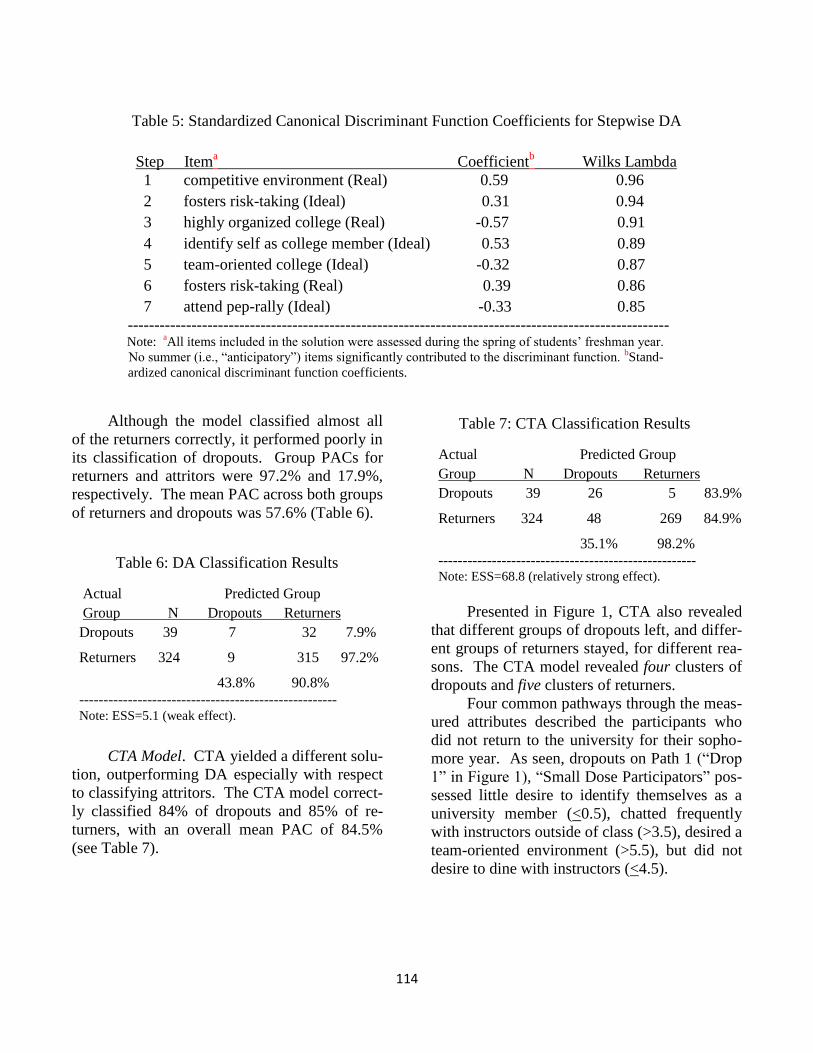
Table 5: Standardized Canonical Discriminant Function Coefficients for Stepwise DA
Step Itema Coefficient
b Wilks Lambda
1 competitive environment (Real) 0.59 0.96
2 fosters risk-taking (Ideal) 0.31 0.94
3 highly organized college (Real) -0.57 0.91
4 identify self as college member (Ideal) 0.53 0.89
5 team-oriented college (Ideal) -0.32 0.87
6 fosters risk-taking (Real) 0.39 0.86
7 attend pep-rally (Ideal) -0.33 0.85
------------------------------------------------------------------------------------------------------ Note:
aAll items included in the solution were assessed during the spring of students’ freshman year.
No summer (i.e., “anticipatory”) items significantly contributed to the discriminant function. bStand-
ardized canonical discriminant function coefficients.
Although the model classified almost all
of the returners correctly, it performed poorly in
its classification of dropouts. Group PACs for
returners and attritors were 97.2% and 17.9%,
respectively. The mean PAC across both groups
of returners and dropouts was 57.6% (Table 6).
Table 6: DA Classification Results
Actual Predicted Group
Group N Dropouts Returners
Dropouts 39 7 32 7.9%
Returners 324 9 315 97.2%
43.8% 90.8%
----------------------------------------------------- Note: ESS=5.1 (weak effect).
CTA Model. CTA yielded a different solu-
tion, outperforming DA especially with respect
to classifying attritors. The CTA model correct-
ly classified 84% of dropouts and 85% of re-
turners, with an overall mean PAC of 84.5%
(see Table 7).
Table 7: CTA Classification Results
Actual Predicted Group
Group N Dropouts Returners
Dropouts 39 26 5 83.9%
Returners 324 48 269 84.9%
35.1% 98.2%
----------------------------------------------------- Note: ESS=68.8 (relatively strong effect).
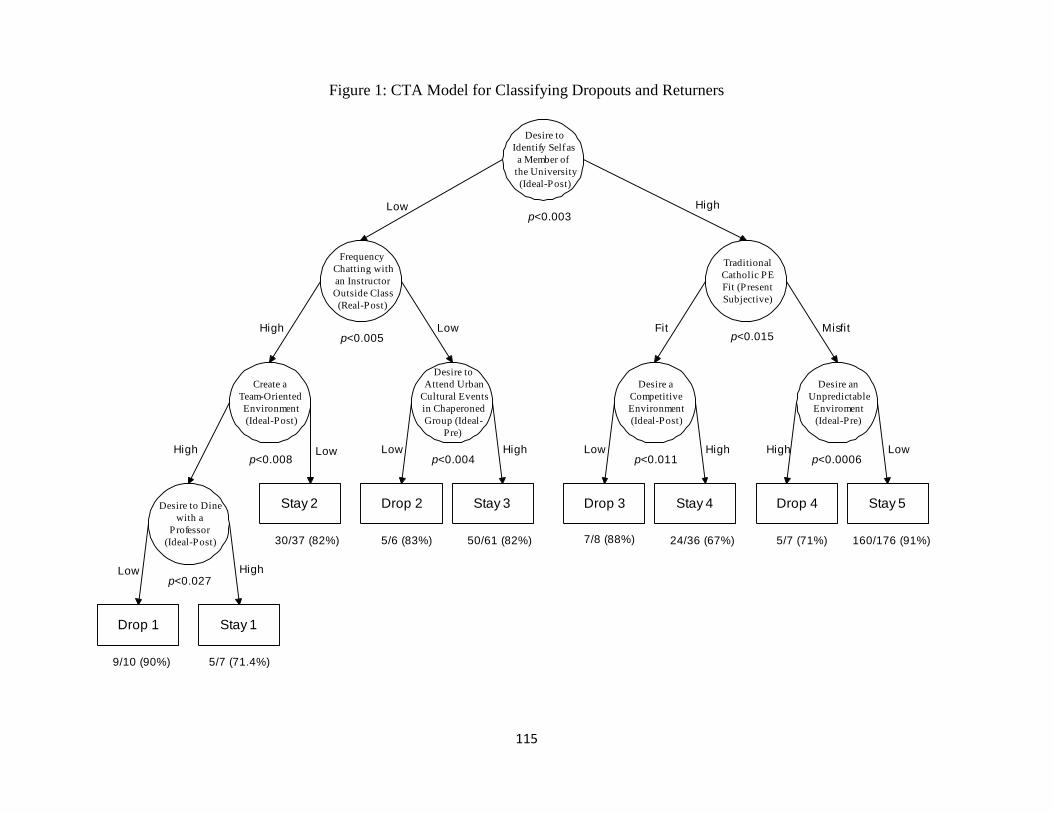
Presented in Figure 1, CTA also revealed
that different groups of dropouts left, and differ-
ent groups of returners stayed, for different rea-
sons. The CTA model revealed four clusters of
dropouts and five clusters of returners.
Four common pathways through the meas-
ured attributes described the participants who
did not return to the university for their sopho-
more year. As seen, dropouts on Path 1 (“Drop
1” in Figure 1), “Small Dose Participators” pos-
sessed little desire to identify themselves as a
university member (<0.5), chatted frequently
with instructors outside of class (>3.5), desired a
team-oriented environment (>5.5), but did not
desire to dine with instructors (<4.5).
115
Figure 1: CTA Model for Classifying Dropouts and Returners
Desire to
Identify Self as
a Member of
the University
(Ideal-Post)
Frequency
Chatting with
an Instructor
Outside Class
(Real-Post)
Create a
Team-Oriented
Environment
(Ideal-Post)
Desire to Dine
with a
Professor
(Ideal-Post)
Desire to
Attend Urban
Cultural Events
in Chaperoned
Group (Ideal-
Pre)
Desire a
Competitive
Environment
(Ideal-Post)
Desire an
Unpredictable
Enviroment
(Ideal-Pre)
Traditional
Catholic PE
Fit (Present
Subjective)
Stay 3 Drop 3 Stay 4 Drop 4 Stay 5Stay 2 Drop 2
Drop 1 Stay 1
p<0.003
p<0.005
p<0.008 p<0.004 p<0.011
p<0.015
p<0.0006
p<0.027
Low High
High Low Fit Misfit
High
Low High
Low Low High Low High High Low
9/10 (90%) 5/7 (71.4%)
30/37 (82%) 5/6 (83%) 50/61 (82%) 7/8 (88%) 24/36 (67%) 5/7 (71%) 160/176 (91%)

116
Dropouts on Path 2 (Drop 2), “Involve-
ment Avoiders,” also possessed little desire to
identify themselves as a university member
(<5.5), but rarely chatted with their instructors
outside of class (<3.5). “Involvement Avoid-
ers” also indicated during summer registration
that they were not interested in attending urban
cultural events in a chaperoned group (<4.5).
Dropouts on Path 3 (Drop 3), “Congruent
Non-Competitors,” differed from the first two
clusters. These students did want to identify
themselves as a university member (>5.5). Alt-
hough this cluster of dropouts possessed strong
Traditional-Catholic PE fit (<0.19), they did not
desire a competitive college environment (<5.5).
The final set of Path 4 dropouts (Drop 4),
“Incongruent Thrill-Seekers,” were similar to
those on Path 3 in that they desired to identify
themselves as university members. However,
these attritors revealed incongruent Traditional-
Catholic PE fit levels (>0.19), and possessed
pre-enrollment desires to attend a college with
an unpredictable environment (>5.5).
The PACs for Paths 1, 2, 3, and 4 classi-
fying dropouts were 90% (9/10), 83.3% (5/6),
and 88% (7/8), and 71% (5/7), respectively.
Five common pathways were used to clas-
sify students who chose to return to the univer-
sity as sophomores.
Path 1 returners (Stay 1), “Large-Dose
Participants,” possessed little desire to identify
themselves as a university member (<5.5), chat-
ted frequently with their instructors outside of
class (>3.5), desired a team-oriented envi-
ronment (>5.5), and also desired to dine with
their instructors (>4.5).
Returners on Path 2 (stay 2), “Academi-
cally Involved Independents,” were similar to
those on Path 1 in that they possessed little de-
sire to identify themselves as a university mem-
ber (<5.5) and chatted frequently with their in-
structors outside of class (>3.5). However, they
differed from “Large Dose Participants” in that
they did not desire a team-oriented college envi-
ronment (<5.5).
Returners on Path 3 (Stay 3), “Culture
Seekers,” also possessed little desire to identify
themselves as a university member (<5.5), and
indicated that they did not often chat with their
instructors outside of class (<3.5). However,
“Culture Seekers” indicated during summer
reistration sessions a desire to attend urban cul-
tural events with classmates and faculty mem-
bers (>4.5).
Returners on Path 4 (stay 4), “Congruent
Competitors,” did want to identify themselves
as a university member (>5.5), possessed good
Traditional-Catholic PE fit (<5.5), and desired a
competitive college environment (>5.5).
Finally, returners on Path 5 (Stay 5), “In-
congruent Routine-Seekers,” wanted to identify
themselves as university members (>5.5), pos-
sessed little Traditional-Catholic PE fit (>0.19),
and did not desire a unpredictable environment
(<5.5).
The PACs for these five pathways were
71.4% (5/7); 81.8% (30/37); 82.0% (50/61);
66.7% (24/36); and 90.9% (160/176), respec-
tively.
Objective vs. Subjective PE Fit. It was
predicted that Objective PE fit scores would be
more closely related to involvement, and would
better predict students’ return status, than Sub-
jective PE fit scores. Results did not support
these predictions. No Objective PE fit score
contributed to the understanding of student re-
tention and attrition. Only one subjectively de-
rived congruence measure (Present Traditional-
Catholic PE Fit) assisted in classifying returners
and attritors, but only for the expanded ODA-
CTA model.
A surprising pattern emerged when the in-
volvement index was correlated with both Sub-
jective and Objective PE fit indicators. The re-
lationship between Subjective PE fit and in-
volvement was in the opposite direction of the
relationship between Objective PE fit and in-
volvement. As predicted, highly involved stu-
dents tended to have more congruent subjec-
tively derived PE fit scores. However, contrary
to predictions highly involved students tended to

117
have more incongruent PE fit scores when this
variable was computed using the mean of all
respondents’ Real scores. Thus, it appears that
the direction of the relationship between student
involvement and PE congruence may be contin-
gent upon how the PE fit scores were derived.
This unexpected relationship might best be ex-
plained by measurement artifacts, rather than
true effects (discussed below).
Anticipatory vs. Present PE Fit. It was
hypothesized that Present PE fit scores would
better predict return status and be more closely
associated with students’ involvement levels
than Anticipatory PE fit scores. The logic be-
hind this prediction was that first-year students
would have a better understanding of what they
desired in a university after having experienced
college life for two semesters.
Results revealed that Present congruence
measures were only slightly better than Antici-
patory congruence measures with respect to in-
volvement and return status. Three Present PE
fit scores, but only two Anticipatory PE fit
scores, were associated with students’ level of
participation in college activities (see Table 4).
With respect to return status, the only congru-
ence measure that was included in any of the
classification models was Present Subjective
Traditional-Catholic, derived from posttest
items (see Figure 1).
PE Fit vs. P and E Variables. It was hy-
pothesized that PE fit difference scores would
outperform P (Ideal) and E (Real) scores alone.
Results did not support this prediction. Student
involvement was more highly correlated with
the P factors and E factors than with the PE fit
factors (see Table 8). To test the relationship
between P and E dimensions and retention,
MANOVAs and discriminant analyses were
performed, using the six Ideal (P) and three Real
(E) factors in place of the PE Fit indicators to
test for group differences between returners and
non-returners. P and E factors did not improve
the accuracy in classifying freshman returners
from dropouts.
Table 8: Correlations Between Student
Involvement and Ideal (P) and
Real (E) Factors
Effect
Ideal (P) Dimension
r r2 Size (d)
College Image (A)a
0.250**
0.063 0.519
College Image (P)b 0.210
** 0.044 0.429
Student Experience (A) 0.348
** 0.121 0.742
Student Experience (P) 0.439
** 0.190 0.969
Traditional-Catholic (A) 0.357
**
0.127
0.763
Traditional-Catholic (P) 0.401**
0.161 0.876
Real (E) Dimension
College Image
0.293
** 0.086 0.613
Traditional-Catholic 0.539**
0.291 1.280
--------------------------------------------------------------- Note: The Student Experience Real factor was excluded
from these analyses due to the independence assumption
violation between this variable and the involvement at-
tribute. All analyses were performed with and without
involvement items in the Real and Ideal factors: signifi-
cance levels did not change. Double asterisks (**) indi-
cate p<0.05 at the experimentwise criterion.58
aAntici-
patory (derived from summer items). bPresent (derived
from spring items).
Additionally, three CTA and three DA
procedures were run—each containing the two P
(Anticipatory and Present) and one E factor cor-
responding to the three college dimensions (Col-
lege Image, Student Experience, Traditional-
Catholic). Neither CTA nor DA procedures
generated a classification solution with respect
to return status when Real and Ideal factors re-
placed PE fit factors. However, as discussed
above, when ancillary analyses expanded dis-
criminant procedures to include single-item P
and E variables, preferences and perceptions
outperformed PE fit scores in distinguishing
freshman returners from non-returners.
Discussion
The PE Fit literature has linked student-
college congruence to a host of desirable educa-
tional variables (e.g., academic achievement,
perceived competency), yet has virtually ig-
nored attrition and retention variables. The pre-
sent study attempted to merge the separate re-

118
tention and PE Fit paradigms, by investigating
the relationships among involvement, student-
college congruence, and withdrawal decisions
for one population of college freshmen over a
period of one year.
Although most PE fit indicators were
linked to student involvement levels, the corre-
lations between separate P and E factors and
involvement were stronger. The variable most
highly correlated with student involvement
measured students’ perceptions (E) regarding
the Traditional-Catholic nature of their college.
Students who believed that the “press” of their
college environment emphasized religious val-
ues, grades, and school rules, were most likely
to participate in campus activities. Highly in-
volved students also seemed to have desired
these characteristics, since the variable corre-
lated next highly with involvement was the Tra-
ditional-Catholic P factor.
It appears that the relationship between in-
volvement and student-college congruence was
contingent upon the way that the PE Fit indica-
tor was derived. When subjective congruence
scores were used, the relationship between these
PE fit indicators and involvement was as pre-
dicted; the greater students’ level of involve-
ment, the greater the match between students’
preferences and perceptions. However, when
objective congruence scores were used, greater
student participation resulted in more discrepant
congruence scores.
One explanation for this change in direc-
tion may lie in the relationship between in-
volvement and the Ideal (P) component of the
PE fit score. By using the average “Real” rating
across all respondents to derive Objective PE fit
scores, any variability related to the E compo-
nent of congruence was lost. Thus, variability
in objectively derived PE fit scores was due to
differences in student preferences (P items) on-
ly. This was not the case with subjectively de-
rived congruence scores in which both P and E
responses were free to vary.
In this study, involvement was, in fact,
positively correlated with all six Ideal ratings (rs
ranged from 0.21 to 0.44, all ps<0.01, mean ef-
fect size=0.72). Thus, the relationship between
Objective PE fit and involvement may simply
have represented a measurement artifact. Be-
cause students with the highest college stand-
ards (P ratings) were likely to have been the
same students who frequently participated in
college activities, it was made to appear that
greater participation was linked to greater (ob-
jective) incongruence.
This is consistent with Edwards’ assertion
that PE fit measures must allow both the P and
E components to contribute to the total variabil-
ity.54,55
When only one component is permitted
to vary, Edwards claims that PE fit is no longer
being assessed. Since this may have been the
case in the present study, all analyses using Ob-
jective PE fit scores should be rendered suspect.
So, how is it that several congruence re-
searchers have demonstrated that Objective PE
fit was superior to Subjective PE fit in their
studies? The answer may simply be they have
not. A closer examination of these studies re-
vealed that measurement problems suggested by
Edwards may also explain these findings as
well. For instance, Tracey and Sherry studied
the relationship between Objective PE fit, Sub-
jective PE fit, and student distress.19
They
found that objective measures of congruence
were more highly correlated with distress than
Subjective PE fit measures. However, this was
only the case when students’ Ideal (P) ratings
also were negatively correlated with distress.
When distress and college preferences were pos-
itively related, Subjective PE fit scores were
more highly correlated with college distress than
Objective PE fit. Thus, Tracey and Sherry’s
findings may suffer from the same problems as
those found in the present study.
Although many studies suggest that the
congruence between preferences (Ps) and per-
ceptions (Es) is superior to either component
alone in predicting behavior, studies do exist
that refute this claim.63,64
The present study
might be included in this group since no classi-
fication model differentiated returners from at-
119
tritors when psychometrically constructed PE fit
indicators were used as predictors.
When exploratory analyses were ex-
panded to include student preferences and per-
ceptions measured at the individual item level,
the present study supports the notion that P and
E components may be more important in classi-
fying returners from attritors than congruence
measures that combined these components. On-
ly one of the 12 PE fit indicators significantly
classified returners from non-returners, and this
was only for the expanded CTA model. Present
Subjective Traditional-Catholic PE fit scores
assisted in the classification of two clusters of
dropouts and two clusters of returners. No con-
gruence score was included in the traditional
discriminant function. All other variables in
both models were either P or E items.
Ideal and Real factors differed in their
contribution to the classification models. Alt-
hough the DA solution was comprised of both P
and E variables, the CTA model was comprised
almost completely of P variables. The only E
item in the classification tree assessed the fre-
quency of student-teacher interactions outside of
the classroom.
The time of the year in which P variables
were assessed also made a difference. The ma-
jority of the DA and the CTA items comprising
these classification solutions contained re-
sponses that were assessed in the spring of re-
spondents’ freshman year. Spring preferences
were better predictors of college retention than
previous summer preferences perhaps because
in their second semester, students did not have
to speculate about aspects of college life they
had yet to experience.
The CTA model may be consistent with
Tinto’s theory that links freshman involvement
with retention.3 According to Tinto, different
types of involvement are critical at different
points in time. Upon arriving to campus, the
social sphere is critical to students, as they seek
to find a support network. However, the focus
soon switches to the academic sphere once
freshmen begin their second month of college.
After the first few weeks on campus, classrooms
become first year students’ “gateways to [fu-
ture] involvement” in other social and academic
arenas (p. 134). Here, fledgling students learn
to engage in both formal and informal activities
with both faculty and peers. Thus, according to
Tinto, the quality of the learning experience
(e.g., contact with, and helpfulness of, faculty
and classmates) is not freshmen’s first priority
when they arrive on campus, but soon becomes
the crucial predictor of their overall satisfaction
with the college experience.
The left side of the CTA model (see Fig-
ure 1) seemed to reflect this emphasis on infor-
mal academically-oriented interactions. All be-
haviorally-based items in the CTA model in-
volved informal interactions with faculty mem-
bers. Both brief (chat with instructor) and ex-
tended (dine with professor; attend a cultural
event) faculty interactions helped to distinguish
returners from non-returners. Thus, it appears
that student-teacher interactions may have been
more important for enhancing freshman reten-
tion than purely social peer-only interactions.
Although the left side of the CTA model
contained mostly behaviorally-based variables,
the right side of the tree contained image-based
preferences in addition to a Traditional-Catholic
congruence variable. This side, then, reflected
retention decisions based on the value-system of
one’s institution (Traditional-Catholic congru-
ence) as well as the degree of thrill-seeking
“press” that was thought to exist on campus.
Interestingly, this “thrill-seeking” component
was similar to the most important items in the
traditional DA classification model. In that
model, perceptions regarding how “competi-
tive” and “organized” their college was contrib-
uted greatly to the differentiation of dropouts
from attritors. However, unlike the CTA model,
no behaviorally-based items were included in
the DA model. These findings emphasize one
of CTA’s major strengths. Clusters of respond-
ents that would not have been found with one
linear discriminant function, were revealed with
CTA.
120
Although results from these models are in-
teresting, three important limitations must be
noted. First, both the CTA and the DA classifi-
cation solutions yielding a solution on the basis
of retention were exploratory. Only after the
psychometrically derived constructs were una-
ble to distinguish attritors from returners, were
individual “ideal” and “real” items included in
the analyses.
Second, although the CTA model held up
under LOO (jackknife) tests for overfitting, nei-
ther model was able to be cross-validated using
a training sample, for which group membership
was known, and a holdout sample, for which
group membership was predicted, and later
compared to reality. Although the pretest sam-
ple size was large enough to divide, the posttest
sample size was not. Future studies that intend
to follow freshmen students longitudinally
should focus on increasing the response rate in
spring phases of data collection. Special efforts
also should be made to encourage commuting
freshmen and freshmen who are struggling aca-
demically to participate, since these groups were
somewhat under-represented in this study.
Finally, neither classification model was
able to classify students on the basis of return
status better than simply relying on the base
rates. Because the vast majority of freshmen
did return to campus for their sophomore year,
simply using the classification rule, “Predict all
students to return” would have resulted in a
classification accuracy of close to 90%. Neither
the DA model nor the CTA model could beat
this rule.
However, it is important to note that the
beating the base rates may not be a relevant cri-
terion with which to base the adequacy of the
classification models in this study. Because ex-
ploring the perceptions and behaviors of stu-
dents most at-risk of dropping out is of utmost
importance to college administrators, finding the
model that most accurately classifies this “vul-
nerable” group may be more important than
finding the model that most accurately classifies
all students (dropouts and returners). The ex-
panded CTA model was able to do just that.
The relationship between PE fit and reten-
tion might have been stronger if the reasons
driving students’ decisions to exit or remain in
their academic setting were assessed. Factors
impacting one’s decision to leave college are
both numerous and complex. Researchers have
discussed several kinds of dropouts, including
temporary or permanent; voluntary or involun-
tary; and attrition for academic or social rea-
sons.3,7,65
Additionally, leaving college may not
necessarily result in negative outcomes if, for
instance, one’s experience with a university re-
sults in highly aversive outcomes, and better
options exist elsewhere.66
It may be that PE fit
levels impact only certain kinds of attrition.
Future researchers might want to fine-tune
the return-status variable to better assist college
personnel in stream-lining their retention efforts.
Reasons for dropping could be assessed using
an exit interview or written questionnaire at the
time of departure. An interesting and poten-
tially important future study could combine the
use of exit interviews with CTA techniques to
better understand freshman attrition. If reasons
for leaving differed among the different “clus-
ters” of attritors, CTA models could be used as
diagnostic tools for college admissions directors
and administrators.
There are four important findings that may
be of interest for those in the business of en-
hancing freshman involvement and retention.
First, it may be important to encourage both
students and faculty to seek each other out when
they are not in the classroom. Behaviorally-
based items that helped to distinguish returners
from non-returners included, not peer-interac-
tions, but different types of faculty-student in-
teractions.
Second, in addition to desires for interac-
tions with faculty members, students’ images of
their college are also important to students. The
value system that a college promotes, as well as
the competitiveness and predictability of its cli-
mate, all appear to be important components in
121
the understanding of student retention. These
factors may help to impact how much of a col-
lege “member” students feel they are.
Third, college preferences may be more
important than college perceptions in classifying
freshmen on the basis of return status. It also
may matter when researchers document these
college desires. If students really do not know
what they want in a college until they have oc-
cupied it for some time, administrators may
want to wait until the spring of students’ fresh-
man year to assess college preferences and per-
ceptions.
Finally, there appears to be specific statis-
tical analysis which is ideally suited for the task
of understanding college student attrition. CTA
was far superior in classifying dropouts than
traditional discriminant analysis techniques
(84% vs. 18%). This finding is important since
attritors comprise the group about which college
administrators are most concerned. Addition-
ally, CTA was able to identify unique clusters of
dropouts (and returners) implying that, indeed,
students choose to leave their colleges for a
plethora of reasons. This ability to refine our
understanding of college attrition may be an im-
portant first step in actually reducing the num-
ber of students who choose this route.
References
1Schneider, B. (1987). E = f (P, B): The road to
a radical approach to person-environment fit.
Journal of Vocational Behavior, 31, 353-361.
2Tinto, V. (1975). Dropout from higher educa-
tion: A theoretical synthesis of recent research.
Review of Educational Research, 45, 89-125.
3Tinto, V. (1993). Leaving college: Rethinking
the causes and cures of student attrition. Chica-
go: University of Chicago Press.
4Chapman, D. W., & Pascarella, E. T. (1983).
Predictors of academic and social integration of
college students. Research in Higher Education,
19, 295-322.
5Moos, R. H. (1976). The human context: Envi-
ronmental determinants of behaviors. New
York: Wiley.
6Moos, R. H. (1979). Evaluating educational
environments. San Francisco: Jossey-Hill.
7Astin, A. W. (1975). Preventing students from
dropping out. San Francisco: Jossey-Bass Pub-
lishers.
8Astin, A. W. (1985). Involvement: The corner-
stone of excellence. Changes, 35-39.
9Astin, A. W. (1991). Assessment for excel-
lence: The philosophy and practice of assess-
ment and evaluation in higher education. NY:
American Council on Education: Macmillan.
10Astin, A. W. (1993). What matters in college?
San Francisco: Jossey-Bass Publishers.
11Stern, G. (1970). People in context: Measur-
ing person-environment congruence in educa-
tion and industry. New York: Wiley.
12Astin, A. W. (1968). The college environment.
Washington, D.C.: American Council on Edu-
cation.
13Astin, A. W. (1977). Four critical years. San
Francisco: Jossey-Bass Publishers.
14Cook, J. R. (1987). Anticipatory person-envi-
ronment fit as a predictor of college student
health and adjustment. Journal of College Stu-
dent Personnel, 28, 394-398.
15Nielsen, H. D., & Moos, R. H. (1977). Stu-
dent-environment interaction in the develop-
ment of physical symptoms. Research in Higher
Education, 6, 139-156.
16Janosik, S., Creamer, D. G., & Cross, L. H.
(1988). The relationship of residence halls' stu-
dent-environment fit and sense of competence.
Journal of College Student Development, 29,
320-326.
122
17Pervin, L. A. (1967). Satisfaction and per-
ceived self-environment similarity: A semantic
differential study of student-college interaction.
Journal of Personality, 35, 623-634.
18Reuterfors, D. L., Schneider, L. J., & Overton,
T. D. (1979). Academic achievement: An ex-
amination of Holland's congruency, consistency,
and differentiation predictions. Journal of Vo-
cational Behavior, 14, 181-189.
19Tracey, T. J., & Sherry, P. (1984). College dis-
tress as a function of person-environment fit.
Journal of College Student Personnel, 25, 436-
442.
20Hadley, T., & Graham, J. W. (1987). The in-
fluence of cognitive development on percep-
tions of environmental press. Journal of College
Student Personnel, 28, 388-394.
21Eagan, A. E., & Walsh, W. B.(1995). Person-
environment congruence and coping strategies.
The Career Development Quarterly, 43, 246-
256.
22Sergent, M. T., & Sedlacek, W. E. (1990).
Volunteer motivation across student organiza-
tions: A test of person-environment fit theory.
Journal of College Student Development, 31,
255-261.
23Kulka, R. A., Klingel, D. M., & Mann, D. W.
(1980). School crime and disruption as a func-
tion of student-school fit: An empirical assess-
ment. Journal of Youth and Adolescence, 9,
353-370.
24Treadway, D. M. (1979). Use of campus-wide
ecosystem surveys to monitor a changing insti-
tution. In L. A. Huebner (Ed.). Redesigning
campus environments: New directions for stu-
dent services (No. 8). San Francisco: Jossey-
Bass.
25Pervin, L. A., & Rubin, D. B. (1967). Student
dissatisfaction with college and the college
dropout: A transactional approach. The Journal
of Social Psychology, 72, 285-295.
26Fox, R. N. (1986). Application of a conceptual
model of college withdrawal to disadvantaged
students. American Educational Research Jour-
nal, 23, 415-424.
27Caplan, R. D. (1987). Person-environment fit
theory and organizations: Commensurate di-
mensions, time perspectives, and mechanisms.
Journal of Vocational Behavior, 31, 248-267.
28Osipow, S. H. (1987). Applying person-envi-
ronment theory to vocational behavior. Journal
of Vocational Behavior, 31, 333-336.
29Schneider, B. (1987). The people make the
place. Personnel Psychology, 40, 437-453.
30Chatman, J. A. (1989). Improving interac-
tional organizational research: A model of per-
son-organization fit. Academy of Management
Review, 14, 333-349.
31French, J. R. P., Jr., Rodgers, W., & Cobb, S.
(1974). Adjustment as person-environment fit.
In G. V. Coelho, D. A. Hamburg, & J. E. Adams
(Eds.), Coping and Adaptation. New York:
Basic Books.
32Rounds, J. B., Dawis, R. V., & Lofquist, L. H.
(1987). Measurement of person-environment fit
and prediction of satisfaction in the theory of
work adjustment. Journal of Vocational Behav-
ior, 31, 297-318.
33Barker, R. G. (1963). On the nature of the en-
vironment. Journal of Social Issues, 19, 26-27.
34Wicker, A. W. (1972). Processes which medi-
ate behavior-environment congruence. Behav-
ioral Science, 17, 265-277.
35MacDonald, N., & Ronayne, T. (1989). Jobs
and their environments: The psychological im-
pact of work and noise. The Irish Journal of
Psychology, 10, 39-55.
123
36Nehrke, M. F., Morganti, J. B., Cohen, S. H.,
Hulicka, I. M., Whitbourne, S. K., Turner, R. R.,
& Cataldo, J. F. (1984). Differences in person-
environment congruence between microenvi-
ronments. Canadian Journal on Aging, 3, 117-
132.
37Moos, R. H., & Gerst, M. (1974). University
residence environment scale manual. Palo Alto,
CA: Consulting Psychologists Press.
38Huebner, L. A. (1975). An ecological assess-
ment: Person-environment fit. Unpublished doc-
toral dissertation. Colorado State University.
39Salamone, P. R., & Daughton, S. (1984). As-
sessing work environments for career counsel-
ing. Vocational Guidance Quarterly, 33, 45-54.
40Moos, R. H., & Trickett, E. J. (1974). Class-
room environment scale manual. Palo Alto, CA:
Consulting Psychologists Press.
41Evans, N. J. (1983). Environmental assess-
ment: Current practices and future directions.
Journal of College Student Personnel, 24, 293-
299.
42Pervin, L. A. (1967). A twenty-college study
of student x college interaction using TAPE
(Transactional Analysis of Personality and En-
vironment): Rationale, reliability, and validity.
Journal of Educational Psychology, 58, 290-
302.
43Boxx, W. R., Odom, R. Y., & Dunn, M. G.
(1991). Organizational values and value congru-
ency and their impact on satisfaction, commit-
ment, and cohesion. Public Personnel Manage-
ment, 20, 195-205.
44Caplan, R. D., & Van Harrison, R. (1993).
Person-environment fit theory: Some history,
recent developments, and future directions.
Journal of Social Issues, 49, 253-275.
45Kaldenberg, D. O., & Becker, B. W. (1992).
Workload and psychological strain: A test of the
French, Rodgers, and Cobb hypothesis. Journal
of Organizational Behaviors, 13, 617-624.
46O'Reilly, C. A., III, Chatman, J., Y Caldwell,
D. F. (1991). People and organizational culture:
A profile comparison approach to assessing per-
son-organizational fit. Academy of Management
Journal, 34, 487-516.
47Posner, B. Z. (1992). Person-organization val-
ues congruence: No support for individual dif-
ferences as a moderating influence. Human Re-
lations, 45, 351-361.
48Murray, H. A. (1938). Explorations in person-
ality. New York: Oxford University Press.
49Pace, C. R., & Stern, G. G. (1958). An ap-
proach to the measurements of psychological
characteristics of college environments. Journal
of Educational Psychology, 49, 269-277.
50Holland, J. L. (1987). Some speculation about
the investigation of person-environment trans-
actions. Journal of Vocational Behavior, 31,
337-340.
51Spokane, A. R., & Derby, D. P. (1979). Con-
gruence, personality pattern, and satisfaction in
college women. Journal of Vocational Behav-
ior, 15, 36-42.
52Pervin, L. A. (1968). Performance and satis-
faction as a function of individual-environment
fit. Psychological Bulletin, 69, 56-68.
53Astin, A. W., & Panos, R. J. (1969). The edu-
cational and vocational development of stu-
dents. Washington, D.C.: American Council on
Education.
54Edwards, J. R. (1993). Problems with the use
of profile similarity indices in the study of con-
gruence in organizational research. Personnel
Psychology, 46, 641-665.
55Edwards, J. R., & Perry, M. E. (1993). On the
use of polynomial regression equations as an

124
alternative to difference scores in organizational
research. Academy of Management Journal, 36,
1577-1613.
56Finney, H. C. (1967). Development and
change of political liberalism among Berkeley
undergraduates. Unpublished Doctoral Disser-
tation, University of California, Berkeley.
57Cook, T. D., & Campbell, D. T. (1979). Qua-
si-experimentation. Chicago: Rand-McNally.
58Yarnold, P.R., Soltysik, R.C. (2005). Optimal
data analysis: A guidebook with Software for
Windows. Washington DC: APA Books.
59Yarnold, P. R. (1996). Discriminating geriatric
and non-geriatric patients using functional status
information: An example of classification tree
analysis via uniODA. Educational and Psycho-
logical Measurement, 56, 656-667.
61Silva, A. P. D., & Stam, A. (1995). Discrimi-
nant analysis. In L. G. Grimm & P. R. Yarnold
(Eds.), Reading and understanding multivariate
statistics. (pp. 277-318). Washington, D.C.:
American Psychological Association.
62Tabachnick, B. G., & Fidell, L. S. (1996). Us-
ing multivariate statistics (3rd ed.). Northridge,
CA: HarperCollins.
63Bretz, R. D., Jr., Ash, R. A., & Dreher, G. F.
(1989). Do people make the place? An exami-
nation of the Attraction-Selection-Attrition hy-
pothesis. Personnel Psychology, 42, 561-581.
64Witt, P. H., & Handal, P. J. (1984). Person-
Environment fit: Is satisfaction predicted by
congruency, environment, or personality? Jour-
nal of College Student Personnel, 25, 503-508.
65Jacoby, B. (1989). The student as commuter:
Developing a comprehensive institutional re-
sponse. Washington, D.C.: The George Wash-
ington University.
66Louis, M. R. (1990). Surprise and sense mak-
ing: What newcomers experience in entering
unfamiliar organizational settings. Administra-
tive Science Quarterly, 25, 226-251.
Author Notes
This research derives from Jennifer
Howard Smith’s doctoral dissertation under the
direction of Emil J. Posavac, with assistance
from dissertation committee members John D.
Edwards, R. Scott Tindale and Eugene B.
Zechmeister, and statistical consultation from
Paul R. Yarnold and Fred B. Bryant. eMail: