hepatocellular cancer: the impact of obesity, type 2 diabetes and a multidisciplinary team
TRANSCRIPT

Research Article
Hepatocellular cancer: The impact of obesity, type 2 diabetesand a multidisciplinary team
Jessica Dyson1,�, Bryan Jaques2,�, Dipankar Chattopadyhay2,3, Rajiv Lochan2, Janine Graham4,Debasish Das1, Tahira Aslam5, Imran Patanwala1, Sameer Gaggar1, Michael Cole3, Kate Sumpter2,4,
Stephen Stewart1,6, John Rose5, Mark Hudson1, Derek Manas2, Helen L. Reeves1,2,3,⇑
1The Liver Group, Department of Medicine, Freeman Hospital, Newcastle-upon-Tyne Hospitals NHS Foundation Trust, UK; 2Hepatopancre-atobiliary Team, Freeman Hospital, Newcastle-upon-Tyne Hospitals NHS Foundation Trust, UK; 3Northern Institute for Cancer Research,
Newcastle University, Newcastle-upon-Tyne, UK; 4Northern Centre for Cancer Care, Freeman Hospital, Newcastle-upon-Tyne Hospitals NHSFoundation Trust, UK; 5Department of Radiology, Freeman Hospital, Newcastle-upon-Tyne Hospitals NHS Foundation Trust, UK; 6Centre for
Liver Disease, Mater Miscericordiae University Hospital, Dublin, Ireland
See Focus, pages 1–2
Background & Aims: Hepatocellular cancer (HCC) commonlycomplicates chronic liver disease and increases in incidence havebeen reported despite falling prevalences of viral hepatitis.Methods: Following the introduction of centralised specialistteams to manage patients with cancer in England, we character-ised the demographics of patients with HCC referred to the New-castle-upon-Tyne Hospitals NHS Foundation Trust between 2000and 2010. Regional HCC mortality data was from Public HealthEngland.Results: HCC related mortality in the region rose 1.8 fold in10 years, from 2.0 to 3.7 per 100,000. 632 cases were reviewed cen-trally, with 2–3 fold increases in referrals of patients with associ-ated hepatitis C, alcoholic liver disease or no chronic liver diseaseand a >10 fold increase in HCC associated with non-alcoholic fattyliver disease (NAFLD). By 2010 NAFLD accounted for 41/118(34.8%) cases. Irrespective of associated etiologies, metabolic riskfactors were present in 78/118 (66.1%) cases in 2010, associatedwith regional increases in obesity and diabetes. Median overallsurvival was just 10.7 months. Although patients with NAFLD asso-ciated HCC were older (71.3 yr vs. 67.1 yr; p <0.001) and theircancers less often detected by surveillance, their survival was
Journal of Hepatology 20
Keywords: Non-alcoholic fatty liver disease; Hepatocellular cancer; Obesity; Type2 diabetes; Multidisciplinary team.Received 5 March 2013; received in revised form 29 July 2013; accepted 12 August2013; available online 23 August 2013q DOI of original article: http://dx.doi.org/10.1016/j.jhep.2013.10.003.⇑ Corresponding author. Address: Northern Institute for Cancer Research, Paul ‘OGorman Building, The Medical School, Framlington Place, Newcastle University,Newcastle-upon-Tyne NE2 4HH, UK. Tel.: +44 0191 2464423 (Work)/2137210(Clinical Secretary).E-mail address: [email protected] (H.L. Reeves).
� These authors contributed equally to this work.Abbreviations: NAFLD, non-alcoholic fatty liver disease; HCC, hepatocellular can-cer; CLD, chronic liver disease; BCLC, Barcelona Clinic for Liver Cancer; ALD, al-coholic liver disease; HCV, hepatitis C; HBV, hepatitis B; PBC, primary biliarycirrhosis; AIH, autoimmune hepatitis; HPB, hepatopancreatobiliary; MDM, mul-tidisciplinary meeting; OLTx, orthotopic liver transplant; BSC, best supportivecare.
similar to other etiologies. This was attributed to significantlyhigher incidental presentation (38.2%) and lower prevalence of cir-rhosis (77.2%).Conclusions: HCC related mortality is increasing, with typicalpatients being elderly with metabolic risk factors. The prognosisfor most of the cases is poor, but older patients with co-morbid-ities can do well, managed, within a specialist multidisciplinaryteam if their cancer is detected pre-symptomatically.� 2013 European Association for the Study of the Liver. Publishedby Elsevier B.V. All rights reserved.
Introduction
Historically, hepatocellular cancer (HCC) has accounted for less than1% of cancer cases in the UK, although worldwide, HCC is the 4thcommonest cause of cancer related death [1]. Geographical varia-tions in incidence and mortality have largely reflected the preva-lence of hepatitis B and C (HBV; HCV) viral infections associatedwith chronic liver disease (CLD). In regions of low viral prevalence,alcoholic liver disease (ALD) has been the predominant risk factor,although the increasing contribution of obesity related liver disease,namely non-alcoholic fatty liver disease (NAFLD), is suspected. Irre-spective of etiology, HCC incidence and annual mortality data areremarkably similar owing to the lack of effective therapies for thevast majority. Over the last two decades, several life prolongingadvances have been introduced for the management of patientswithearly and intermediate stage HCC, highlighting the need not only forearlier detection, but also accurate staging. Surgical resection or livertransplantation provides the opportunity for cure, while embolicand ablative therapies can extend survival [2]. The tyrosine kinaseinhibitor sorafenib can prolong survival for patients with advancedHCC and well preserved liver function [3,4]. In the face of evolvingtreatment opportunities requiring careful application in the pres-ence of co-existing liver disease, patient assessment and manage-ment increasingly require specialist multidisciplinary input.
14 vol. 60 j 110–117

Year20
0020
0120
0220
0320
0420
0520
0620
0720
0820
0920
1020
11
MD
M -
num
ber o
f ref
erre
d ca
ses
with
HC
C
0
20
40
60
80
100
120BCLC-A BCLC-B BCLC-C BCLC-D MDM mortalityNYCRIS mortality
Fig. 1. Increasing HCC mortality and referrals to the regional multidisciplin-
JOURNAL OF HEPATOLOGY
With the aims of improving cancer care across the nation andaddressing regional variations in the quality of services delivered,the ‘NHS Cancer Plan’ was introduced in England by the Depart-ment of Health in July 2000 [5]. As a consequence, all patients withcancer should be referred to a regional specialist multidisciplinarymeeting (MDM). In this study, we have explored HCC related mor-tality across the decade following the Cancer Plan 2000, character-ising the cohort of patients with HCC referred to the regionalhepatopancreatobiliary (HPB) MDM in Newcastle-upon-Tyne. In2000 less than 10% of regional patients were referred to specialistservices, increasing to over 85% by 2010. Regional mortalityincreased nearly 2 fold in this time frame and cohort analysis con-firmed a relatively late stage of detection for the majority ofpatients. We also report the remarkable increase in the prevalenceof the metabolic syndrome and type 2 diabetes mellitus (T2DM) inthe cohort as a whole, with over a third of patients developing HCCon a background of non-alcoholic fatty liver disease (NAFLD).
ary team between 2000 and 2010. Regional mortality increased 1.8 fold. By theend of the decade, referrals to the specialist MDM had markedly increased, with86% concordance between regional and MDM reported mortality.
Patients and methods
Consecutive patients referred to the Newcastle-upon-Tyne Hospitals NHS FoundationTrust HPB MDM between the years 2000 and 2010 have been included. This HPB teamserved a stable population of approximately three million individuals in the NorthEast of England, Cumbria and North Yorkshire and its weekly meeting was supportedby an intranet secure clinical database on which data was prospectively collected. Thepresence of associated liver disease was determined on history, examination, liverscreen and imaging. Patients classed as having NAFLD were men or women with evi-dence of a fatty liver on biopsy or imaging, with an otherwise negative liver screen,drinking <21 or <14 units of alcohol per week respectively for at least 5 years priorto their first presentation with liver disease. Patients were staged and managedaccording to the Barcelona Clinic for Liver Cancer (BCLC) model [2,6]. TNM, Child-Pugh, OKUDA, CLIP, and BCLC stages were documented, as were demographic andclinical parameters, mode of detection/presentation, ECOG performance status, treat-ments offered and survival. Data were interpreted alongside regional HCC mortalitydata, provided by Northern and Yorkshire Cancer Registry and Information Service(NYCRIS) (http://www.nycris.nhs.uk). The study was registered with the hospitaltrust audit department and cases were followed until 30/06/2013, defining a mini-mum period of 2.5 years post diagnosis.
Statistical analyses
All statistical analyses were done with SPSS for Windows, version 14 (SPSS Inc. Chi-cago Illinois, USA), licensed to Newcastle University. Associations were explored bylinear regression, with differences between groups of continuous variables assessedby t-test (parametric data) or Kruskal Wallis (non-parametric data) tests. Differ-ences between categorical variables were assessed by Pearson Chi square, or Fish-er’s exact tests approximated using a Monte Carlo approach where cells within acontingency table of greater than 2 � 2 contained low numbers (<5). A p value of<0.05 was considered significant. Survival was recorded as months from diagnosisto 30/06/2013. Differences in cumulative survival were determined using the Kap-lan-Meier method and a Log-Rank test. The Cox proportional hazards-regressionmodel was used to identify parameters associated with survival. Factors initiallyconsidered by univariate analysis included age, mode of presentation, gender, bodymass index (BMI), number of tumours, size of largest tumour, serum alpha-fetopro-tein (AFP), serum albumin, serum bilirubin, clotting (INR), serum sodium, serumcreatinine, performance status, primary treatment, associated etiology, as well asthe presence of T2DM, metabolic risk factors, cirrhosis, extrahepatic disease, portalvein thrombosis (PVT), ascites, encephalopathy, or constitutional symptoms. A cut-off of p <0.01 was used to select variables entered into the multivariate model.
Results
The increasing regional burden of HCC
In the last decade, 632 patients with a diagnosis of HCC con-firmed either radiologically in the presence of cirrhosis, or by
Journal of Hepatology 201
liver biopsy, were managed by the Newcastle MDM. The numbersof cases referred per year increased steadily in that time frame,from just 8 patients in 2000 to 118 patients in 2010 (Fig. 1). Toestimate the relative contributions of rising incidence and thesuccess of Cancer Plan 2000 initiated change in referral practice,we compared mortality data within the regional catchment areaprovided by NYCRIS to that within the MDM cohort. These data(Fig. 1) support both contributing factors, with a 1.8 fold increasein regional mortality (rising from 2.0 to 3.7 per 100,000) and >10fold increase in patients referred. The initially low mortalitywithin the MDM cohort raised the possibility of referral bias, thusage and stage at presentation were explored. The average age ofthe patients referred rose from a median of 57.0 years in 2000, to69.9 years in 2010 (Pearson correlation 0.183; p <0.001),although the proportions of the patients with early, intermediateor advanced disease did not change significantly, as demon-strated by the breakdown according to BCLC stage (Fig. 1) (Pear-son Chi square p = 0.478). Thus, there was an increase in referralof patients with all BCLC stages of disease, including those con-sidered curative (Stage A; 89 cases, 14.1%), those considered fitbut with more advanced disease (Stage B; 95 cases, 15.0%), aswell as those with symptomatic disease (Stage C; 284 cases,44.9%) and very symptomatic or advanced disease suitable onlyfor best palliative supportive care (Stage D; 164 cases, 26.0%).Despite the lack of change in BCLC stage, treatments offered havechanged in 10 years, as summarised in Table 1.
The choice of first line therapy in an aging population with HCC
In the year 2000, of the 8 patients referred, 6 received an ortho-topic liver transplant (OLTx). While the actual numbers trans-planted per year remained constant, proportionately thisrepresented 75% in 2000 vs. just 5.9% in 2010. Although theincrease in age and associated co-morbidity likely limited the roleof transplantation for patients referred in later years, supportingearly referral bias, what increased markedly, rather than thenumbers of patients transplanted, was the median time spenton the transplant waiting list, rising from 150 days in the year2000 to 350 days in 2010. Consequently, the numbers of patientsremoved from the waiting list because of HCC progression ordeteriorating fitness also increased. While patients transplanted
4 vol. 60 j 110–117 111
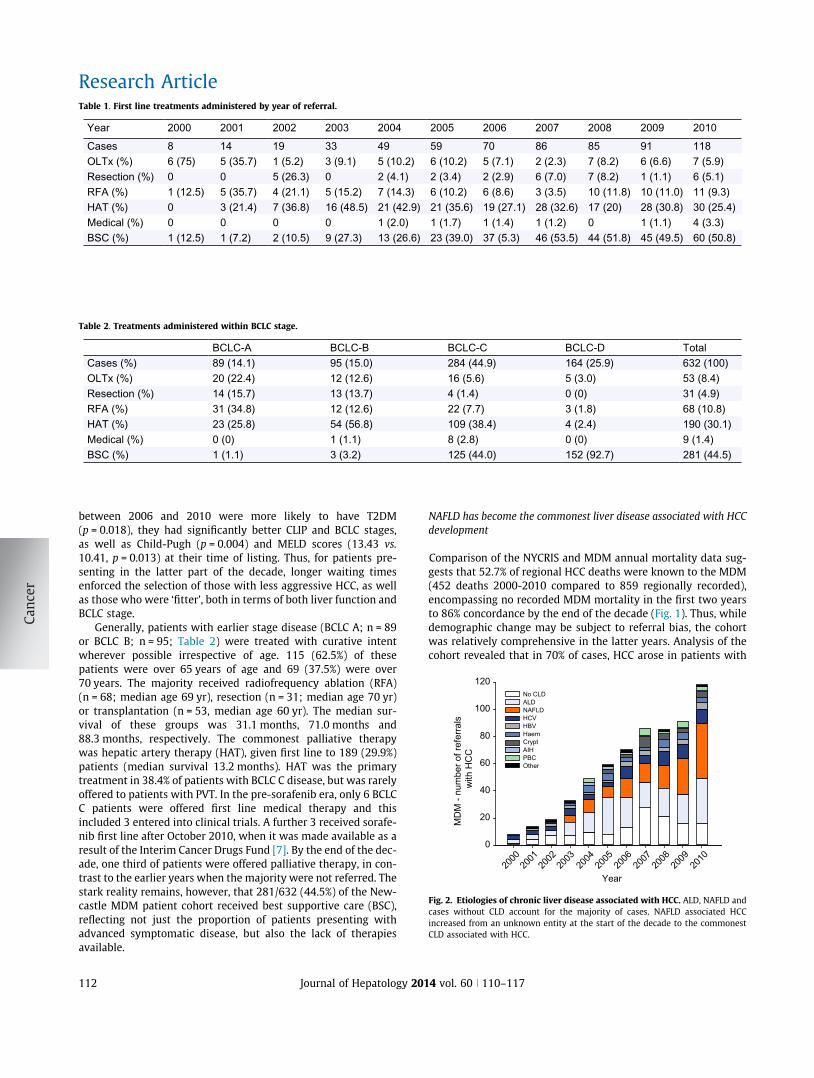
Table 1. First line treatments administered by year of referral.
Year 2000 2001 2002 2003 2004 2005 2006 2007 2008 2009 2010
Cases 8 14 19 33 49 59 70 86 85 91 118OLTx (%) 6 (75) 5 (35.7) 1 (5.2) 3 (9.1) 5 (10.2) 6 (10.2) 5 (7.1) 2 (2.3) 7 (8.2) 6 (6.6) 7 (5.9)Resection (%) 0 0 5 (26.3) 0 2 (4.1) 2 (3.4) 2 (2.9) 6 (7.0) 7 (8.2) 1 (1.1) 6 (5.1)RFA (%) 1 (12.5) 5 (35.7) 4 (21.1) 5 (15.2) 7 (14.3) 6 (10.2) 6 (8.6) 3 (3.5) 10 (11.8) 10 (11.0) 11 (9.3)HAT (%) 0 3 (21.4) 7 (36.8) 16 (48.5) 21 (42.9) 21 (35.6) 19 (27.1) 28 (32.6) 17 (20) 28 (30.8) 30 (25.4)Medical (%) 0 0 0 0 1 (2.0) 1 (1.7) 1 (1.4) 1 (1.2) 0 1 (1.1) 4 (3.3)BSC (%) 1 (12.5) 1 (7.2) 2 (10.5) 9 (27.3) 13 (26.6) 23 (39.0) 37 (5.3) 46 (53.5) 44 (51.8) 45 (49.5) 60 (50.8)
Table 2. Treatments administered within BCLC stage.
BCLC-A BCLC-B BCLC-C BCLC-D TotalCases (%) 89 (14.1) 95 (15.0) 284 (44.9) 164 (25.9) 632 (100)OLTx (%) 20 (22.4) 12 (12.6) 16 (5.6) 5 (3.0) 53 (8.4)Resection (%) 14 (15.7) 13 (13.7) 4 (1.4) 0 (0) 31 (4.9)RFA (%) 31 (34.8) 12 (12.6) 22 (7.7) 3 (1.8) 68 (10.8)HAT (%) 23 (25.8) 54 (56.8) 109 (38.4) 4 (2.4) 190 (30.1)Medical (%) 0 (0) 1 (1.1) 8 (2.8) 0 (0) 9 (1.4)BSC (%) 1 (1.1) 3 (3.2) 125 (44.0) 152 (92.7) 281 (44.5)
Year20
0020
0120
0220
0320
0420
0520
0620
0720
0820
0920
10
MD
M -
num
ber o
f ref
erra
ls
with
HC
C
0
20
40
60
80
100
120No CLD ALD NAFLD HCV HBV Haem Crypt AIH PBC Other
Fig. 2. Etiologies of chronic liver disease associated with HCC. ALD, NAFLD andcases without CLD account for the majority of cases. NAFLD associated HCCincreased from an unknown entity at the start of the decade to the commonestCLD associated with HCC.
Research Article
between 2006 and 2010 were more likely to have T2DM(p = 0.018), they had significantly better CLIP and BCLC stages,as well as Child-Pugh (p = 0.004) and MELD scores (13.43 vs.10.41, p = 0.013) at their time of listing. Thus, for patients pre-senting in the latter part of the decade, longer waiting timesenforced the selection of those with less aggressive HCC, as wellas those who were ‘fitter’, both in terms of both liver function andBCLC stage.
Generally, patients with earlier stage disease (BCLC A; n = 89or BCLC B; n = 95; Table 2) were treated with curative intentwherever possible irrespective of age. 115 (62.5%) of thesepatients were over 65 years of age and 69 (37.5%) were over70 years. The majority received radiofrequency ablation (RFA)(n = 68; median age 69 yr), resection (n = 31; median age 70 yr)or transplantation (n = 53, median age 60 yr). The median sur-vival of these groups was 31.1 months, 71.0 months and88.3 months, respectively. The commonest palliative therapywas hepatic artery therapy (HAT), given first line to 189 (29.9%)patients (median survival 13.2 months). HAT was the primarytreatment in 38.4% of patients with BCLC C disease, but was rarelyoffered to patients with PVT. In the pre-sorafenib era, only 6 BCLCC patients were offered first line medical therapy and thisincluded 3 entered into clinical trials. A further 3 received sorafe-nib first line after October 2010, when it was made available as aresult of the Interim Cancer Drugs Fund [7]. By the end of the dec-ade, one third of patients were offered palliative therapy, in con-trast to the earlier years when the majority were not referred. Thestark reality remains, however, that 281/632 (44.5%) of the New-castle MDM patient cohort received best supportive care (BSC),reflecting not just the proportion of patients presenting withadvanced symptomatic disease, but also the lack of therapiesavailable.
112 Journal of Hepatology 201
NAFLD has become the commonest liver disease associated with HCCdevelopment
Comparison of the NYCRIS and MDM annual mortality data sug-gests that 52.7% of regional HCC deaths were known to the MDM(452 deaths 2000-2010 compared to 859 regionally recorded),encompassing no recorded MDM mortality in the first two yearsto 86% concordance by the end of the decade (Fig. 1). Thus, whiledemographic change may be subject to referral bias, the cohortwas relatively comprehensive in the latter years. Analysis of thecohort revealed that in 70% of cases, HCC arose in patients with
4 vol. 60 j 110–117

JOURNAL OF HEPATOLOGY
either underlying alcohol induced cirrhosis (ALD; n = 178; 28.2%),non-alcoholic fatty liver disease (NAFLD, n = 136; 21.5%), or in theabsence of any known chronic liver disease (CLD; n = 129; 20.4%)(Fig. 2). It was referrals of HCC cases associated with NAFLDwhich rose the most dramatically however, and in 2010, NAFLDassociated HCC accounted for 35% of all cases (41/118). In thiscohort, only those cases where fatty liver disease had been docu-mented in the case notes, based on biopsy proven or radiologicalevidence, were attributed to ‘NAFLD’. Those cases where the met-abolic syndrome was the only risk factor for chronic liver disease,but where there was no documented evidence of fatty liver dis-ease, were recorded as having ‘no known chronic liver disease’.Of the 136 patients with recorded NAFLD over the decade, 31(22.8%) had no clinical, radiological or biopsy evidence ofcirrhosis.Obesity and type 2 diabetes were common across all etiologicalgroups
While the emergence of NAFLD as an increasingly prevalent dis-ease contributed to the dramatic increase in HCC cases referred tothe MDM, there was also a marked increase in HCC cases arisingin individuals with ALD, as well in those without evidence of CLD.The increase in ALD related HCC cases in the North of Englandreflects the rising prevalence of mortality attributed to alcoholinduced cirrhosis being higher than elsewhere in the country[8]. Alcohol excess however, cannot explain the dramatic increasein patients developing HCC in the absence of CLD. In our cohort,we looked at the prevalence of features of the metabolic syn-drome in all cases, not just those ascribed to NAFLD (Table 3).While raised BMI and T2DM were commoner in patients withNAFLD associated HCC, 51.4% of patients with cirrhosis secondaryto alcohol and 48.4% of patients without known CLD also hadmetabolic risk factors, as defined by the presence of at leastone major (T2DM, BMI >30), or two minor (hypertension, hyper-triglyceridaemia, reduced HDL cholesterol, previous cardiovascu-lar event) features. Although causality between the metabolicsyndrome and the increase in numbers of HCC cases is not wellestablished, in one third (31%) of all HCC cases referred to our ter-tiary centre in the last decade, there was no other risk factor forliver disease/cancer identified. While these features were morecommon in the latter years of the Newcastle cohort (62.3% in2008-2010), they were previously common in patients referredfrom our catchment area with HCC (52.2% in 2000-2007;p = 0.018). What changed most notably, was simply the sheernumber of individuals affected. Of the 118 patients referred in2010, 78 (66.1%) had documented metabolic risk factors,(Fig. 3) including 61 (51.7%) with T2DM.
Comparisons within the etiological groups
Patient demographic, disease and tumour characteristics withinHCC associated etiological groups are presented in Table 3. HCCcases more commonly occurred in the absence of histological orradiologically evident cirrhosis in patients with NAFLD (22.8%),HBV (17.2%) and haemachromatosis (22.9%) (p <0.001). Generallyspeaking, HCC was commoner in men than women, although themale preponderance was less marked in those without CLD andNAFLD related HCC. The age at presentation with cancer also var-ied with etiology. The median age for those with no CLD was74 years, compared to 60 years for HCV patients, 66 years for
Journal of Hepatology 201
those with ALD, and 71 for those with NAFLD associated HCC(Kruskal-Wallis; p <0.0001).
HCC surveillance was with 6 monthly abdominal ultrasoundscan and AFP measurement. Patients without CLD were not insurveillance programmes and consequently the majority (81/130 or 62.3%) presented symptomatically. In contrast, 30/65(46.2%) of patients with HCV had their disease detected by sur-veillance, as did 57/178 (32.0%) of patients with ALD, and just31/136 (22.8%) of patients with NAFLD (Table 3 and Supplemen-tary Fig. 1). The proportion of ALD and NAFLD patients presentingwith symptomatic disease was similar (38–39%) as more patientswith NAFLD were detected incidentally (38.2% vs. 29.2% for ALD).
Not unexpectedly, patients without CLD tended to presentwith larger tumours and at a more advanced TNM stage (Table 3and Supplementary Fig. 2). Their liver function and consequentChild Pugh score/stage remained relatively preserved. Ascites,bilirubin and albumin contribute to the OKUDA score, whichwas significantly lower/better in patients without CLD. Excludingcases without CLD revealed that patients with ALD were morelikely to present with ascites, encephalopathy, a lower albuminand a raised bilirubin, as reflected in a significantly higher ChildPugh score and stage. After exclusion of patients without CLD,none of the combined staging systems revealed significant differ-ences in stage at presentation between etiological groups.
The treatments offered within the etiological groups differed(Table 4). Patients without CLD were not offered transplantation,but had the highest rate of resection (14.6%). Owing to the laterstage of presentation, this group also had the highest proportionof patients offered no treatment or BSC (54.6%) and their mediansurvival was just 7.2 months (Table 3). Patients with HCV relateddisease had the highest rate of transplantation (24.6%), reflectingtheir younger age and disease being detected at an earlier stage.Survival and treatments offered to ALD and NAFLD patients weresimilar, although the surgical option for ALD was OLTx, while forNAFLD patients resection was more frequent, reflecting the lowerprevalence of cirrhosis. Although medical therapy was rarelyoffered first line, in combination with second line therapy, a totalof 26 patients from the cohort (4.1%) have received palliativesorafenib. The median age of patients receiving sorafenib was70 years and the majority had cirrhosis (15/26), with NAFLDbeing the commonest cause (10 patients).
Factors associated with survival in the Newcastle cohort
The median survival for patients within the cohort was10.7 months. Significant variables by uni and multivariate analy-sis are shown in Supplementary Table 1. As in previous series, inmultivariate analysis both liver function and tumour characteris-tics were independent predictors of survival. ECOG performancewas a powerful independent predictor of survival, as was the pri-mary treatment administered. The survival discriminatory powerof the staging systems (Childs Pugh, TNM, OKUDA, CLIP, andBCLC) used in the Newcastle cohort is shown in SupplementaryFig. 3 and each confirmed significant differences. The BCLC stag-ing system, which includes an assessment of ECOG performancestatus, was superior to other staging systems in this cohort. Itwas also the only staging system that performed equally wellwithin each of the etiological categories.
While liver function, tumour characteristics and treatmentsclearly have a major impact on survival, as do performance statusand the presence of constitutional symptoms, the mode of
4 vol. 60 j 110–117 113

Table 3. Characteristics within etiological groups.
Variable No CLD ALD NAFLD HCV HBV Haem Crypt AIH PBC Other p valueTotal cases 130 178 136 65 29 34 27 8 20 5 All categories/
no CLD removed
Age (median yr) 74.0 66.0 71.0 60.0 65.0 67.5 73.0 69.5 73.5 66.0 <0.001/<0.001BMI 26.7 ± 0.6 28.8 ± 0.4 32.0 ± 0.6 25.2 ± 0.7 26.1 ± 1.0 27.8 ± 1.1 23.9 ± 1.4 28.5 ± 1.0 25.1 ± 1.4 26.3 ± 1.5 <0.001/<0.001Type 2 diabetes, no/yes 92/31 115/65 27/109 44/21 21/8 20/14 21/5 6/2 17/3 4/1 <0.001/<0.001Met risk factors, no/yes 63/59 84/89 0/136 38/26 18/10 16/18 18/8 4/4 15/5 4/1 <0.001/<0.001Cirrhosis, no/yes 130/0 0/178 31/105 2/63 5/24 7/27 0/28 0/8 0/20 1/4 <0.001/<0.001Sex, M/F 100/30 165/13 106/30 51/14 26/3 31/3 18/9 2/6 6/14 5/0 <0.001/<0.001Pres: surv/inc/symp 0/49/81 57/52/69 31/52/53 30/17/18 11/6/12 12/12/11 5/5/17 3/3/2 9/6/5 2/0/3 <0.001/0.045No. of tumours 2.7 ± 0.3 3.0 ± 0.2 2.3 ± 0.2 1.9 ± 0.2 3.4 ± 0.5 2.7 ± 0.4 2.4 ± 0.4 1.8 ± 0.3 1.6 ± 0.2 2.0 ± 0.7 0.046/0.063Size of largest (cm) 9.8 ± 0.5 5.2 ± 0.3 5.3 ± 0.3 4.0 ± 0.4 6.3 ± 1.2 5.2 ± 0.6 5.9 ± 0.9 5.2 ± 1.1 4.5 ± 0.6 5.6 ± 2.0 <0.001/0.190AFP (median) 81 39 10 24 46 21 20 359 32 87 0.224/0.400
AFP >10 ng/ml 80 (63%) 105 (59%) 69 (51%) 44 (68%) 21 (72%) 19 (56%) 15 (56%) 6 (75%) 12 (60%) 5 (100%) 0.157/0.130AFP >200 ng/ml 58 (46%) 59 (34%) 34 (25%) 13 (20%) 11 (38%) 10 (29%) 9 (33%) 4 (50%) 8 (40%) 2 (40%) 0.013/0.242
EH disease 37 (28%) 24 (14%) 20 (15%) 6 (9%) 9 (31%) 3 (9%) 7 (26%) 0 (0%) 1 (5%) 2 (40%) <0.001/0.041PVT 33 (26%) 52 (29%) 44 (32%) 14 (21%) 4 (14%) 12 (35%) 7 (25%) 1 (12%) 5 (25%) 1 (20%) 0.550/0.473Encephalopathy 0 (0%) 21 (12%) 10 (7%) 6 (9%) 0 (0%) 0 (0%) 1 (4%) 2 (25%) 0 (0%) 0 (0%) <0.001/0.058Ascites 10 (8%) 82 (46%) 43 (32%) 19 (29%) 1 (3%) 5 (14%) 11 (41%) 2 (25%) 5 (25%) 1 (20%) <0.001/<0.001Albumin (g/L) 37.7 ± 0.5 33.6 ± 0.5 35.6 ± 0.5 34.2 ± 0.7 37.0 ± 0.9 35.9 ± 1.1 34.5 ± 1.2 34.4 ± 1.6 34.7 ± 1.0 34.0 ± 2.5 <0.001/0.007Bilirubin (µmol/L) 18.5 ± 3.9 39.5 ± 3.3 28.3 ± 3.9 30.5 ± 3.3 29.1 ± 5.4 40.8 ± 11.0 39.0 ± 9.3 37.4 ± 10 25.1 ± 4.2 21.0 ± 9.2 <0.001/0.005INR 1.0 ± 0.02 1.2 ± 0.03 1.1 ± 0.03 1.1 ± 0.03 1.1 ± 0.05 1.1 ± 0.03 1.1 ± 0.03 1.2 ± 0.05 1.0 ± 0.03 1.7 ± 0.7 <0.001/0.001Sodium (mmol/L) 138 ± 0.3 143 ± 7.0 138 ± 0.3 136 ± 0.5 136 ± 0.9 137 ± 0.5 137 ± 1.0 136 ± 1.8 136 ± 0.8 136 ± 1.0 0.002/0.024Creatinine (µmol/L) 100 ± 3.1 105 ± 3.0 110 ± 4.3 90 ± 3.3 101 ± 11.7 117 ± 15.1 95 ± 4.2 91 ± 6.9 86 ± 5.6 100 ± 8.9 0.004/002CP score 5.6 ± 0.1 7.7 ± 0.2 6.6 ± 0.2 7.1 ± 0.3 6.2 ± 0.4 6.4 ± 0.3 7.3 ± 0.5 7.2 ± 0.8 6.4 ± 0.4 6.4 ± 1.0 <0.001/0.001MELD score 8.9 ± 0.3 11.9 ± 0.4 10.5 ± 0.4 10.4 ± 0.5 10.5 ± 0.8 11.3 ± 1.0 10.8 ± 0.7 11.1 ± 1.1 9.2 ± 0.6 12.5 ± 3.1 <0.001/0.030PST (0/1+2/3+4) 39/61/30 53/85/40 50/62/24 30/27/8 12/15/2 14/13/7 8/15/4 3/5/0 10/8/2 1/3/1 0.655/0.705Overall survival (median mo)
7.2 10.8 11.4 18.3 11.8 10.4 5.4 4.9 20.6 4.1 0.099/0.053
Continuous data are presented as mean ± standard error.CLD, chronic liver disease; ALD, alcoholic liver disease; NAFLD, non-alcoholic fatty liver disease; HCV, hepatitis C virus; HBV, hepatitis B virus; Haem, haemochromatosis; Crypt, cryptogenic cirrhosis; AIH, autoimmunehepatitis; PBC, primary biliary cirrhosis; BMI, body mass index; Pres, presentation; surv, surveillance; Inc, incidental, Symp, symptomatic; CP, Child Pugh score; MELD, Model for End Stage Liver Disease; PST, performancestatus test. Cases in category ‘other’ included 3 with a-1-antitrypsin deficiency, 1 with primary sclerosing cholangitis, and 1 with congenital heart disease/cardiac cirrhosis.
ResearchA
rticle
114Journal
ofH
epatology2014
vol.60j110–117

Year20
0020
0120
0220
0320
0420
0520
0620
0720
0820
0920
10
≥1 m
ajor
or 2
min
or m
etab
olic
ris
k fa
cror
s
0
20
40
60
80
100
120
140NoYes
Fig. 3. The prevalence of metabolic risk factors in patients with HCC inNorthern England. Metabolic risk factors, defined as 1 major (obesity or type 2diabetes), or two minor (hypertension, hypertriglyceridaemia, reduced HDLcholesterol, previous cardiovascular event) were common, affecting 66.1% ofindividuals referred in 2010.
JOURNAL OF HEPATOLOGY
presentation was significantly associated with survival indepen-dently of these factors. Incidental presentation accounted for201 (31.8%) patients, compared to 161 (25.5%) detected by sur-veillance and 270 (42.7%) presenting symptomatically. Survivalwas particularly poor in the symptomatic group, but similar inthe incidental and surveillance groups (Supplementary Table 2).Compared to the surveillance group, the mean age of the inciden-tal category was higher (69.3 vs. 66.4; p = 0.005), patients had lar-ger tumours (5.7 ± 0.3 vs. 3.7 ± 0.2; p <0.001) and patients alsohad more frequent metabolic risk factors (65.2% vs. 55.0%;p = 0.043). The enhanced survival of the incidental group wasinstead attributed to the lower incidence of cirrhosis (64.5% vs.99.4%; p <0.001).
Discussion
In Japan the incidence of HCC is falling [9], attributed to thescreening of blood supplies and a reduction in HCV infection[10]. In countries where the prevalence of viral hepatitis is low,however, the incidence of HCC continues to rise. Over 10 yearsago, an association between obesity and liver cancer wasreported in Northern European [11,12] and American populations[13]. Obesity related T2DM may be central to HCC risk and largeepidemiological studies in individuals with HCC support both a
Table 4. Treatments administered within etiological groups.
No CLD ALD NAFLD HCV HBV
Cases (%) 130 (20.4) 178 (28.2) 136 (21.5) 65 (10.3) 29 (OLTx (%) 0 (0) 20 (11.2) 9 (6.6) 16 (24.6) 4 (1Resection (%) 19 (14.6) 1 (0.5) 6 (4.4) 2 (3.1) 0 (0RFA (%) 4 (3.1) 25 (14.5) 14 (10.3) 8 (12.3) 1 (3HAT (%) 33 (25.4) 51 (28.7) 47 (34.6) 18 (27.7) 12 (Medical (%) 3 (2.3) 1 (0.5) 2 (1.5) 0 (0) 1 (3BSC (%) 71 (54.6) 80 (44.9) 58 (42.7) 21 (32.3) 11 (
Journal of Hepatology 201
synergistic role in individuals predisposed to HCC because ofchronic liver disease, as well as an independent one [14,15].Recent studies confirm an increased risk of HCC in individualswith NAFLD related cirrhosis [16,17] and the growing numberof the latter is a cause for concern [18,19].
The data in this paper are from a cohort of individuals pre-senting an area where the incidence of HCC is historically low,with the impact of the metabolic syndrome more visible becauseof the lesser influence of viral hepatitis in the region [20]. In theNorth East of England, UK Office of National Statistics (ONS) cen-sus data confirms that the population has remained relativelystable (age, gender, race, immigration) over the time period stud-ied [21–23] and the increase in HCC mortality in the catchmentarea for the Newcastle MDM was in keeping with steadily risingCLD mortality [8]. The latter has largely been attributed to alco-hol excess, a well recognised public health problem in this region,with alcohol-related deaths in men increasing from 15.2 per100,000 in 2000 to 22.6 in 2010 [24]. However, analysis of theNewcastle MDM referred individuals with HCC in the latter yearswas comprehensive enough (>80%) to conclude that both ALDand NAFLD associated cases have contributed to HCC mortality,with NAFLD being the commonest association in 2010. This studyalso highlights the role of obesity related diseases in those withHCC arising in other etiologies, with two thirds of all patientshaving metabolic risk factors in 2010.
At a national level, data from The Health Survey for Englandand government departments demonstrate increases in the prev-alence of metabolic risk factors. In 2000, 21% of males had a BMIP30 compared to 26.2% in 2010 [25,26], with the prevalence ofdiabetes increasing from 2.8% to 5.9% [27]. Diabetes affected15.2% of individuals >65 years in 2010 [28,29]. Notably, the NorthEast of England population was more severely affected by meta-bolic risk factors [27,30,31], with a significantly higher cardiovas-cular mortality [32]. Although cardiovascular mortality remains amajor cause of death nationwide, consequent to a combination ofpreventive measures and advances in medical treatment, thesedeaths are falling [33]. While liver disease related deaths inpatients with NAFLD have long been recognised [34], theincreases we are seeing may become yet more apparent, evenin the absence of cirrhosis, unless similarly successful strategiescan be identified and introduced.
Characterisation of the MDM cohort also highlighted theadvanced age of many of the patients referred. While NHS CancerPlan guidelines do not allow discrimination by age, elderlypatients have been under-represented in studies assessing theefficacies of therapies, both curative and palliative. Treatmentsare implemented presently without knowledge of whether or
Haem Crypt AIH PBC Other
4.6) 34 (5.5) 27 (4.3) 8 (1.3) 20 (3.2) 5 (0.8)3.8) 1 (2.9) 1 (3.7) 1 (12.5) 1 (5.0) 0 (0)) 2 (5.9) 0 (0) 0 (0) 1 (5.0) 0 (0).4) 6 (17.6) 4 (14.8) 3 (37.5) 3 (15) 0 (0)41.3) 10 (29.4) 9 (33.3) 2 (25) 7 (35.0) 1 (20).4) 0 (0) 1 (3.7) 0 (0) 1 (5.0) 0 (0)37.9) 15 (44.1) 12 (44.4) 2 (25) 7 (35.0) 4 (80)
4 vol. 60 j 110–117 115
Research Article
not they are cost-effective or prolong life in these individuals.Amid this concern, we still face the reality that for half of thepatients referred to the central MDM, the outcome was BSC.While the need for earlier detection methods and better medicaltherapies is recognised, given the significant impact on servicesany recommendation for this growing group of individuals islikely to have, so is the need for economic evaluation throughprospective trials or modelling exercises, which explore the min-imum level of effectiveness and the maximum cost of an inter-vention. Presently, these data indicate that despite advancedage and co-morbidity in patients with NAFLD associated HCC,similar outcomes are possible in pre-symptomatic patients, par-ticularly in those without cirrhosis. Thus active treatment shouldcontinue to be pursued. However, we do need to be able to rec-ognise those elderly patients who are better served by BSC. ECOGperformance was clearly associated with outcome in the MDMcohort, but in elderly patients, a more comprehensive assessmentof co-morbidity or frailty may have an important role to play[35,36].In summary, in this region where the prevalence of obesityand diabetes is high and rising, the characterisation of ourMDM cohort highlights their impact and likely contribution toregional HCC mortality. The MDM was established with the aimof addressing inequalities in cancer care, and given that greaterthan 85% of cases were referred by 2010, and half of all patientsreceived either curative or palliative treatments (compared toonly 10% being referred centrally for consideration of therapyin 2000), this can be regarded as a success. Moving forward, theMDM has delivered a platform within which the relative effec-tiveness and survival attributed to therapies could be assessed,providing an evidence base for future recommendations recogn-ising age related frailty and co-morbidity, as well as tumour stageand liver function.
Financial support
Dr. Reeves is supported by the European Community’s SeventhFramework Programme (FP7/2001-2013) under grant agreementHEALTH-F2-2009-241762 for the project FLIP.
Conflict of interest
The authors who have taken part in this study declared that theydo not have anything to disclose regarding funding or conflict ofinterest with respect to this manuscript.
Acknowledgments
This paper work would not have been possible without the con-tribution of the Newcastle-upon-Tyne Hospitals NHS FoundationTrust multidisciplinary team. Thanks also to Professor Luke Vale,Health Foundation Chair in Health Economics and Deputy Direc-tor, Institute of Health & Society, Newcastle University.
Supplementary data
Supplementary data associated with this article can be found, inthe online version, at http://dx.doi.org/10.1016/j.jhep.2013.08.011.
116 Journal of Hepatology 201
References
[1] Ferlay J, Parkin DM, Steliarova-Foucher E. Estimates of cancer incidence andmortality in Europe in 2008. Eur J Cancer 2010;46:765–781.
[2] Bruix J, Sherman M. Management of hepatocellular carcinoma. Hepatology2005;42:1208–1236.
[3] Llovet JM, Ricci S, Mazzaferro V, Hilgard P, Gane E, Blanc JF, et al. Sorafenib inadvanced hepatocellular carcinoma. N Engl J Med 2008;359:378–390.
[4] Cheng AL, Kang YK, Chen Z, Tsao CJ, Qin S, Kim JS, et al. Efficacy and safety ofsorafenib in patients in the Asia-Pacific region with advanced hepatocellularcarcinoma: a phase III randomised, double-blind, placebo-controlled trial.Lancet Oncol 2009;10:25–34.
[5] Department of Health. The NHS cancer plan: a plan for investment, a plan forreform; 2000.
[6] Llovet JM, Fuster J, Bruix J. The Barcelona approach: diagnosis, staging, andtreatment of hepatocellular carcinoma. Liver Transpl 2004;10:S115–S120.
[7] Department of Health. The cancer drugs fund: guidance to support operationof the cancer drugs fund in 2012–13. In: Health do, editor. <www.dh.go-v.uk>; 2012.
[8] Office for National Statistics. Alcohol-related deaths in the UK, 2010.<www.ons.gov.uk>: ONS; 2010.
[9] Tanaka H, Imai Y, Hiramatsu N, Ito Y, Imanaka K, Oshita M, et al. Decliningincidence of hepatocellular carcinoma in Osaka, Japan, from 1990 to 2003.Ann Intern Med 2008;148:820–826.
[10] Armstrong GL, Alter MJ, McQuillan GM, Margolis HS. The past incidence ofhepatitis C virus infection: implications for the future burden of chronic liverdisease in the United States. Hepatology 2000;31:777–782.
[11] Moller H, Mellemgaard A, Lindvig K, Olsen JH. Obesity and cancer risk: adanish record-linkage study. Eur J Cancer 1994;30A:344–350.
[12] Wolk A, Gridley G, Svensson M, Nyren O, McLaughlin JK, Fraumeni JF, et al. Aprospective study of obesity and cancer risk (Sweden). Cancer CausesControl 2001;12:13–21.
[13] Calle EE, Rodriguez C, Walker-Thurmond K, Thun MJ. Overweight, obesity,and mortality from cancer in a prospectively studied cohort of U.S. adults. NEngl J Med 2003;348:1625–1638.
[14] El-Serag HB, Tran T, Everhart JE. Diabetes increases the risk of chronicliver disease and hepatocellular carcinoma. Gastroenterology 2004;126:460–468.
[15] Nordenstedt H, White DL, El-Serag HB. The changing pattern of epidemiol-ogy in hepatocellular carcinoma. Dig Liver Dis 2010;42:S206–S214.
[16] Ascha MS, Hanouneh IA, Lopez R, Tamimi TA, Feldstein AF, Zein NN. Theincidence and risk factors of hepatocellular carcinoma in patients withnonalcoholic steatohepatitis. Hepatology 2010;51:1972–1978.
[17] Terminology of nodular hepatocellular lesions. International working party.Hepatology 1995;22:983–993.
[18] Neuschwander-Tetri BA, Caldwell SH. Nonalcoholic steatohepatitis: sum-mary of an AASLD single topic conference. Hepatology 2003;37:1202–1219.
[19] Farrell GC. The liver and the waistline: fifty years of growth. J GastroenterolHepatol 2009;24:S105–S118.
[20] Health Protection Agency. Hepatitis C in the UK; 2009. <www.hpa.org.uk>.[21] Office for National Statistics. Census 2001, local authority profiles &
population pyramids. <www.ons.gov.uk/ons/rel/census/census-2001-local/north-east.pdf>.
[22] Office for National Statistics. News release: census gives insights intocharacteristics of the North East’s population; 2012. <http://www.ons.go-v.uk/ons/rel/mro/news-release/census-2-1-north-east/census-gives-insights-into-characteristics-of-the-north-east-s-population.html>.
[23] Office for National Statistics. Census, key statistics for local authorities inEngland and wales; 2011. http://www.ons.gov.uk/ons/publications/re-ref-erence-tables.html?edition=tcm%3A77-286262.
[24] Office for National Statistics. Reference table: alcohol-related deaths inEngland and wales, 1991 to 2011. http://www.ons.gov.uk/ons/publications/re-reference-tables.html?edition=tcm%3A77-288756.
[25] National Audit Office. Memorandum for the committee of public accounts.An update on the government’s approach to tackling obesity, Department ofHealth; 2012. <http://www.nao.org.uk/wp-content/uploads/2012/2007/tackling_obesity_update.pdf>.
[26] The NHS Information Centre Health and Social Care. Health Survey forEngland – Trend tables; 2011. <http://www.hscic.gov.uk/catalogue/PUB09302>.
[27] Health and Social Care Information Centre. Prescribing for diabetes inEngland – 2002–2008. <http://www.hscic.gov.uk/pubs/prescribingdiabetes>.
[28] The NHS Information Centre Health and Social Care. National diabetes audit,executive summary 2009–2010.
4 vol. 60 j 110–117
JOURNAL OF HEPATOLOGY
[29] Diabetes UK. Diabetes in the UK 2012 – Key statistics on, diabetes; 2012.[30] Public Health England. Health profiles data tables: people diagnosed withdiabetes. http://www.apho.org.uk/default.aspx?QN=HP_DATATABLES.[31] Health and Social Care Information Centre. HSCIC indicator portal. <https://
indicators.ic.nhs.uk/webview/>.[32] Ellis A, Fry R. Regional health inequalities in England. In: Statistics OfN,
editor; 2010.[33] Townsend N, Wickramasinghe K, Bhatnagar P, Smolina K, Nichols M, Leal J,
et al. Coronary heart disease statistics 2012 edition. London: British HeartFoundation; 2012.
Journal of Hepatology 201
[34] Matteoni CA, Younossi ZM, Gramlich T, Boparai N, Liu YC, McCullough AJ.Nonalcoholic fatty liver disease: a spectrum of clinical and pathologicalseverity. Gastroenterology 1999;116:1413–1419.
[35] Ruiz M, Reske T, Cefalu C, Estrada J. Management of elderly and frail elderlycancer patients: the importance of comprehensive geriatrics assessment andthe need for guidelines. Am J Med Sci 2012;346:66–69.
[36] Hamaker ME, Jonker JM, de Rooij SE, Vos AG, Smorenburg CH, van MunsterBC. Frailty screening methods for predicting outcome of a comprehensivegeriatric assessment in elderly patients with cancer: a systematic review.Lancet Oncol 2012;13:e437–e444.
4 vol. 60 j 110–117 117