hepa filter in-place testing efficiency variations due … - hepa filter in-place testing... ·...
TRANSCRIPT

HEPA FILTER IN-PLACE TESTING EFFICIENCY VARIATIONS DUE TO THE EFFECTS OF INADEQUATE
MIXING AND VARYING AIRFLOW RATES
Eric M. Banks
NUCON International, Inc.
Abstract
HEPA filters are subject to periodic in-place testing to determine the efficiency of the installed filter bank. This test consists of injecting an aerosol upstream of the HEPA bank and measuring of the upstream and downstream aerosol concentrations. The ratio between the upstream concentration and the downstream concentration indicates the bank’s removal efficiency. This paper will present data showing that poor mixing of the challenge aerosol as a result of poor injection port location and uneven dust loading of the prefilter section causes large variations in the as-measured in-place test results. Also presented are the effects of airflow variations on measured efficiencies on a HEPA filter bank with a known leak.
Introduction The purpose of performing an air-aerosol mixing test is to ensure that the challenge agent, as it approaches the bank being tested, is well mixed. If this can be proven, then a single point sample taken anywhere in the upstream plane of the bank being tested will yield valid test results. There are many factors that may affect the in-place test results of installed HEPA filter banks. Of these, the following have a major effect on the measured HEPA bank efficiency: airflow rates, prefilter efficiency, prefilter loading, location of the injection point, method of injection, upstream sample line location and sample method, and downstream sample line location and sample method. To qualify an injection point, it is customary to perform an air-aerosol mixing test during acceptance testing and after any modification that may effect the mixing of the challenge agent. The methodology that is normally followed for aerosol mixing is presented in ASME N510, Section 9 or ASME AG-1 Section TA. The results presented in this paper are based on testing a 6000 SCFM Nuclear Air Treatment System (NATS) operated at 5000 SCFM. Various injection methods and sampling techniques were employed and the results are presented in this paper.
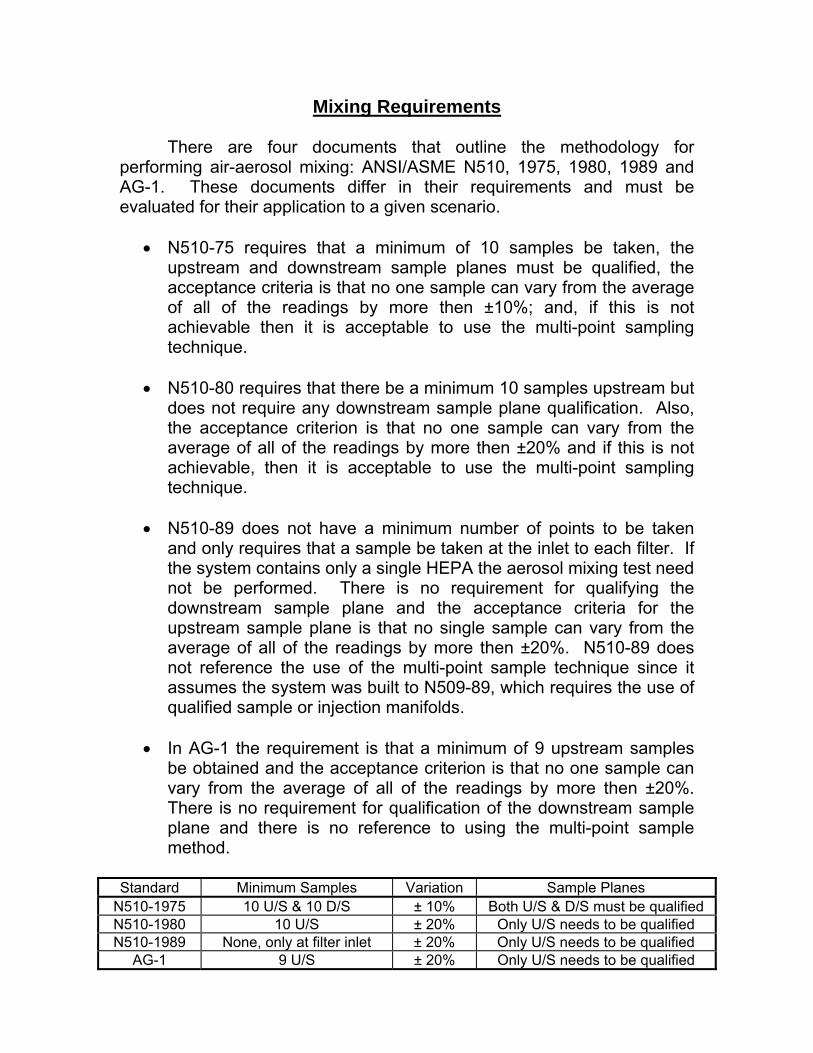
Mixing Requirements There are four documents that outline the methodology for performing air-aerosol mixing: ANSI/ASME N510, 1975, 1980, 1989 and AG-1. These documents differ in their requirements and must be evaluated for their application to a given scenario.
• N510-75 requires that a minimum of 10 samples be taken, the upstream and downstream sample planes must be qualified, the acceptance criteria is that no one sample can vary from the average of all of the readings by more then ±10%; and, if this is not achievable then it is acceptable to use the multi-point sampling technique.
• N510-80 requires that there be a minimum 10 samples upstream but
does not require any downstream sample plane qualification. Also, the acceptance criterion is that no one sample can vary from the average of all of the readings by more then ±20% and if this is not achievable, then it is acceptable to use the multi-point sampling technique.
• N510-89 does not have a minimum number of points to be taken
and only requires that a sample be taken at the inlet to each filter. If the system contains only a single HEPA the aerosol mixing test need not be performed. There is no requirement for qualifying the downstream sample plane and the acceptance criteria for the upstream sample plane is that no single sample can vary from the average of all of the readings by more then ±20%. N510-89 does not reference the use of the multi-point sample technique since it assumes the system was built to N509-89, which requires the use of qualified sample or injection manifolds.
• In AG-1 the requirement is that a minimum of 9 upstream samples
be obtained and the acceptance criterion is that no one sample can vary from the average of all of the readings by more then ±20%. There is no requirement for qualification of the downstream sample plane and there is no reference to using the multi-point sample method.
Standard Minimum Samples Variation Sample Planes
N510-1975 10 U/S & 10 D/S ± 10% Both U/S & D/S must be qualified N510-1980 10 U/S ± 20% Only U/S needs to be qualified N510-1989 None, only at filter inlet ± 20% Only U/S needs to be qualified
AG-1 9 U/S ± 20% Only U/S needs to be qualified
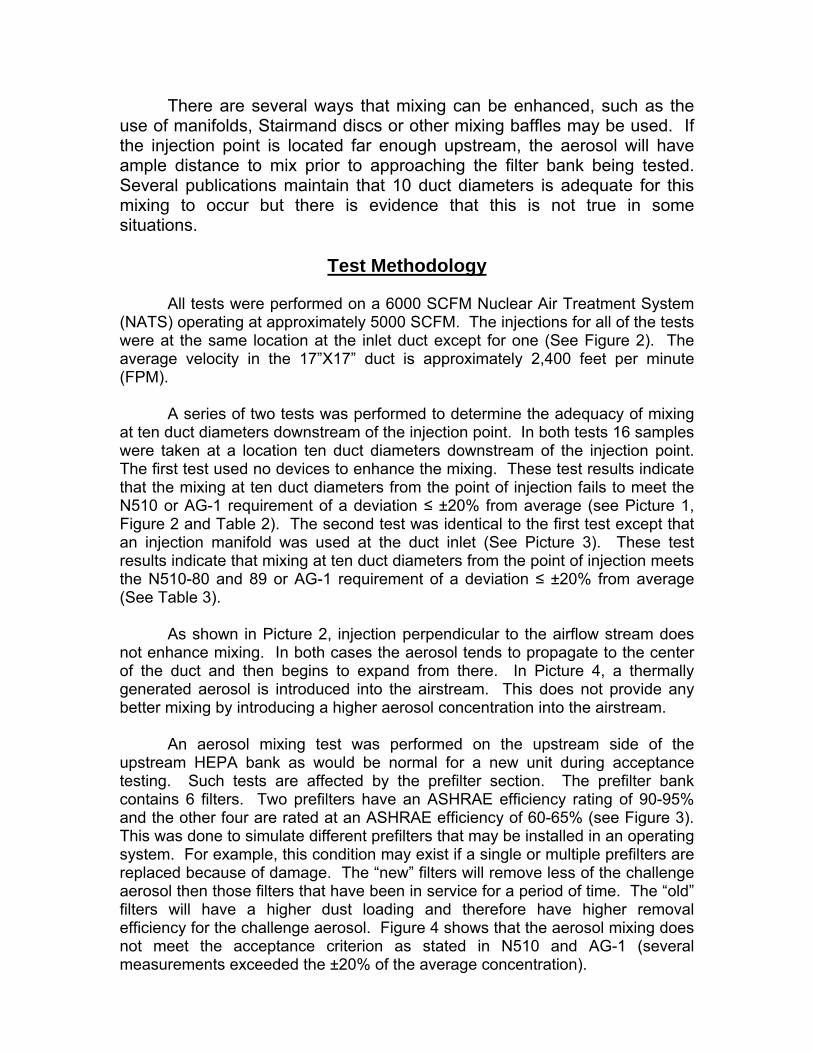
There are several ways that mixing can be enhanced, such as the use of manifolds, Stairmand discs or other mixing baffles may be used. If the injection point is located far enough upstream, the aerosol will have ample distance to mix prior to approaching the filter bank being tested. Several publications maintain that 10 duct diameters is adequate for this mixing to occur but there is evidence that this is not true in some situations.
Test Methodology All tests were performed on a 6000 SCFM Nuclear Air Treatment System (NATS) operating at approximately 5000 SCFM. The injections for all of the tests were at the same location at the inlet duct except for one (See Figure 2). The average velocity in the 17”X17” duct is approximately 2,400 feet per minute (FPM). A series of two tests was performed to determine the adequacy of mixing at ten duct diameters downstream of the injection point. In both tests 16 samples were taken at a location ten duct diameters downstream of the injection point. The first test used no devices to enhance the mixing. These test results indicate that the mixing at ten duct diameters from the point of injection fails to meet the N510 or AG-1 requirement of a deviation ≤ ±20% from average (see Picture 1, Figure 2 and Table 2). The second test was identical to the first test except that an injection manifold was used at the duct inlet (See Picture 3). These test results indicate that mixing at ten duct diameters from the point of injection meets the N510-80 and 89 or AG-1 requirement of a deviation ≤ ±20% from average (See Table 3). As shown in Picture 2, injection perpendicular to the airflow stream does not enhance mixing. In both cases the aerosol tends to propagate to the center of the duct and then begins to expand from there. In Picture 4, a thermally generated aerosol is introduced into the airstream. This does not provide any better mixing by introducing a higher aerosol concentration into the airstream. An aerosol mixing test was performed on the upstream side of the upstream HEPA bank as would be normal for a new unit during acceptance testing. Such tests are affected by the prefilter section. The prefilter bank contains 6 filters. Two prefilters have an ASHRAE efficiency rating of 90-95% and the other four are rated at an ASHRAE efficiency of 60-65% (see Figure 3). This was done to simulate different prefilters that may be installed in an operating system. For example, this condition may exist if a single or multiple prefilters are replaced because of damage. The “new” filters will remove less of the challenge aerosol then those filters that have been in service for a period of time. The “old” filters will have a higher dust loading and therefore have higher removal efficiency for the challenge aerosol. Figure 4 shows that the aerosol mixing does not meet the acceptance criterion as stated in N510 and AG-1 (several measurements exceeded the ±20% of the average concentration).

An aerosol mixing test was performed on the upstream side of the prefilters. Injection remained at the inlet duct as with the previous tests but did not use the injection manifold. Results for this test show that the aerosol was mixed extremely well and met even the most stringent requirement for mixing as required in N510-75. The requirement for this version of N510 is that no one reading deviate from the average concentration by more the ±10% (See Figure 5).
HEPA Testing Eight different tests were performed on the upstream HEPA bank using different sample locations, different sample methods and different aerosol injection positions. A leak of approximately 0.5% was introduced into the lower left filter (The filter located at the bottom of the bank next to the wall, see Figure 4.). No changes were made to this leak throughout the course of these tests. • Test number one was performed with the upstream sample taken at the
highest concentration found during the aerosol mixing test (See Figure 4). The downstream sample was taken from the sample manifold located at the inlet to the adsorber bank (See Figure 6). The test results indicate a percent penetration of 0.56%. Injection was at the inlet of the duct.
• Test number two was performed with the upstream sample taken at the
lowest concentration found during the aerosol mixing test (See Figure 4). The downstream sample was taken from the sample manifold located at the inlet to the adsorber bank (See Figure 6). The test results indicate a percent penetration of 0.70%. Injection was at the inlet of the duct.
• Test number three was performed with the upstream sample taken upstream
of the prefilter bank (See Figure 5). The downstream sample was taken from the sample manifold located at the inlet to the adsorber bank (See Figure 6). The test results indicate a percent penetration of 0.50%. Injection was at the inlet of the duct.
• Test number four was performed with the upstream sample taken at the
lowest concentration found during the aerosol mixing test (See Figure 4). The downstream sample was taken from a single point located next to the leak (See Figure 4). The test results indicate a percent penetration of 22.50%. Injection was at the inlet of the duct.
• Test number five was performed with the upstream sample taken at the
lowest concentration found during the aerosol mixing test (See Figure 4). The downstream sample was taken from a single point located furthest from the leak (See Figure 4). The test results indicate a percent penetration of 0.01%. Injection was at the inlet of the duct.
• Test number six was performed with the upstream sample taken at the lowest concentration found during the aerosol mixing test (See Figure 4). The downstream sample was taken from the sample manifold located at the inlet to the adsorber bank (See Figure 6). The test results indicate a percent penetration of 0.55%. Injection was relocated to the inlet of the housing (See Figure 2 Injection 2).
• Test number seven was performed with the upstream sample taken at the
lowest concentration found during the aerosol mixing test (see Figure 4). The downstream sample was taken at the fan discharge which is downstream of both HEPA banks (see Figure 2). The test results indicate a percent penetration of 0.01%. Injection was at the inlet of the duct.
• Test number eight was performed with the upstream sample taken at the
lowest concentration found during the aerosol mixing test (See Figure 4). The downstream sample was taken from the sample manifold located at the inlet to the adsorber bank (see Figure 6). The airflow rate was reduced to approximately 1500 SCFM. The test results indicate a percent penetration of 1.29%. Injection was at the inlet of the duct.
Table 1
HEPA IN-PLACE TEST RESULTS SUMMARY Test # 1 2 3 4 5 6 7 8
% Pene. 0.56 0.70 0.50 22.50 0.01 0.55 0.01 1.29 % Eff. 99.44 99.30 99.50 77.50 99.99 99.45 99.99 98.71
Graph 1
0.56 0.7 0.5
22.5
0.01 0.55 0.01 1.290
5
10
15
20
% P
enet
ratio
n
1 2 3 4 5 6 7 8Test Number
HEPA Penetration

Picture 1
Picture 2

Picture 3
Picture 4

Figure 1
5000 SCFM Air Treatment System

Figure 2
17”X17” Sample Location
Injection 1
10 Duct Diameters
Injection 2

Table 2: Without Manifold
20 40 50 40
06 10 30 30
10 06 40 30
10 20 40 40
Average Concentration is 26.375 Lowest Reading is 06 which is 77.2% Low Highest Reading is 50 which is 89.5% High
Table 3: With Manifold
24 20 20 20
24 20 20 20
20 20 20 20
18 20 20 20
Average Concentration is 20.375 Lowest Reading is 18 which is 11.66% Low Highest Reading is 24 which is 17.8% High
Airflow
Airflow
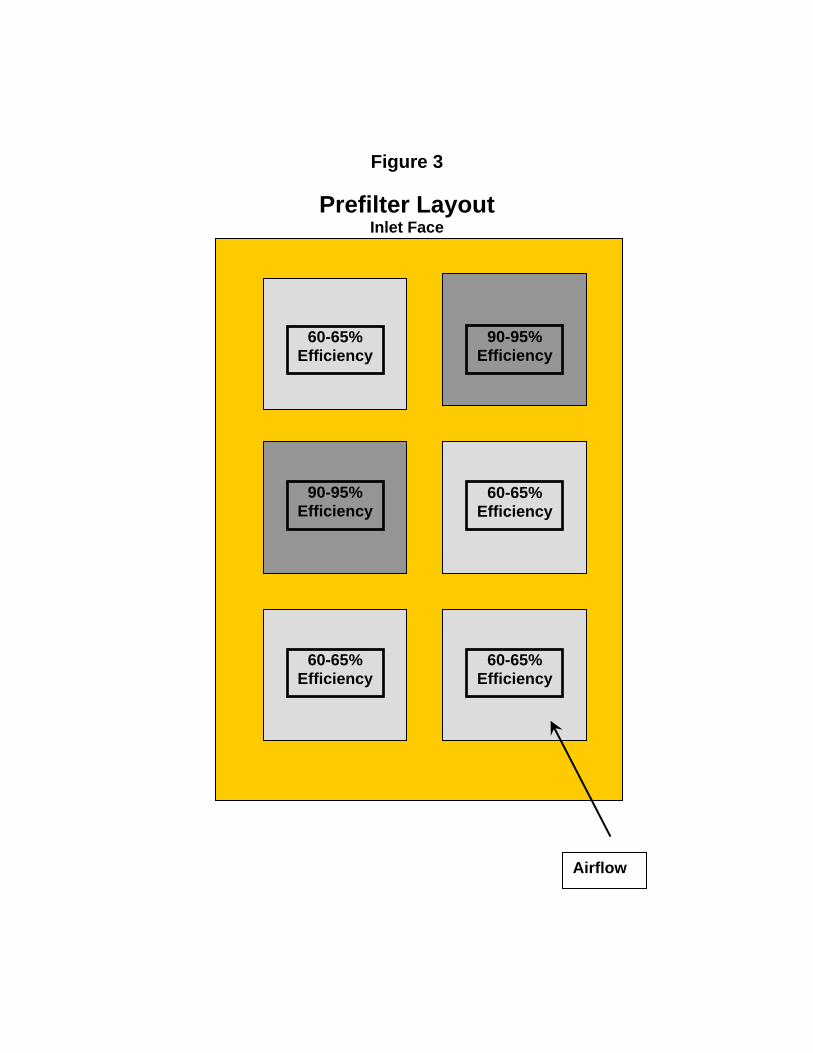
Figure 3
Prefilter Layout Inlet Face
Airflow
90-95% Efficiency
90-95% Efficiency
60-65% Efficiency
60-65% Efficiency
60-65% Efficiency
60-65% Efficiency

Figure 4
Aerosol Mixing Results at the HEPA Inlet Inlet Face
Highest Reading = 90 Is 17.2% Higher Then The Average
Lowest Reading = 50 Is 34.9% Lower Then The Average
Airflow
50
58
83
87
68 71
86
89
86
90
Leak

Figure 5
Aerosol Mixing Results at the Prefilter Inlet
Inlet Face
Highest Reading = 61 Is 1.7% Higher Then The Average
Lowest Reading = 59 Is 1.7% Lower Then The Average
Airflow
60
59
61
60
60 59
61
61
59
60

Figure 6
Adsorber Bank Inlet and Sample Manifold
Airflow Manifold
Conclusion This series of HEPA in-place tests shows that it is possible to have eight different test results without changing the size or location of the leak. Test results ranging from “passing” to “failing” can be obtained on the same system depending on the test technique and methodology. As demonstrated by this battery of tests, it is not just a simple matter to inject ten duct diameters upstream of a HEPA bank and expect to get acceptable results. At ten duct diameters from the point of injection and an air velocity above 2000 FPM mixing cannot be achieved without the aid of an additional mixing device. Aerosol detector fluctuations of more than two or three percent of the meter value for the upstream or downstream reading is a good indication that mixing is inadequate. If these conditions exist, a means to increase the mixing must be employed. It is important to consider the impact on testing when changing prefilters and selecting injection and sampling points. The author wishes to thank the following individuals for their valuable help and suggestions for this paper: Mr. Michael Wilkens, Mr. Joshua Lawson and Mr. Robert Watton.
References ANSI/ASME N509: Nuclear Power Plant Air Cleaning Units and Components ANSI/ASME N510: Testing of Nuclear Air Cleaning Systems ASME AG-1: Code on Nuclear Air and Gas Treatment ERDA 76-21: Nuclear Air Cleaning Handbook DOE-HDBK-1169-2003: DOE Handbook, Nuclear Air Cleaning Handbook