hemodynamic puzzle
TRANSCRIPT
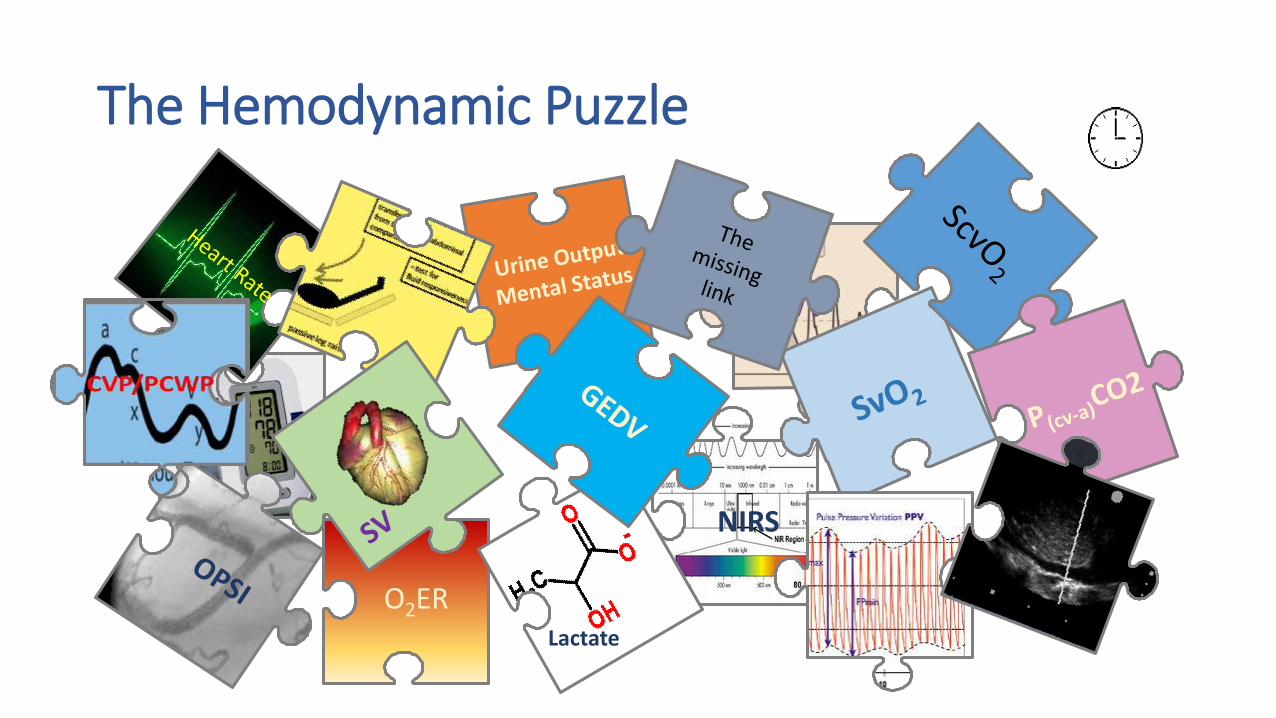
The Hemodynamic Puzzle
O2ER
NIRS
SVV
Lactate

Ene
rgy
Met
abo
lism
(Oxy
gen
Co
nsu
mp
tio
n)
(Ml/
min
/m2)
Delayed Repayment of O2 Debt
Full Recovery Possible
Excessive O2 Deficit Produces Lethal Cell Injury
with Non-recovery Recovery Possible
Time
Oxygen Deficit
Oxygen Deficit
Oxygen Deficit
Oxygen Debt: To Pay or Not to Pay?
The principle task of acute care is
to avoid or correct oxygen debt
by optimization of the oxygen
supply and consumption.
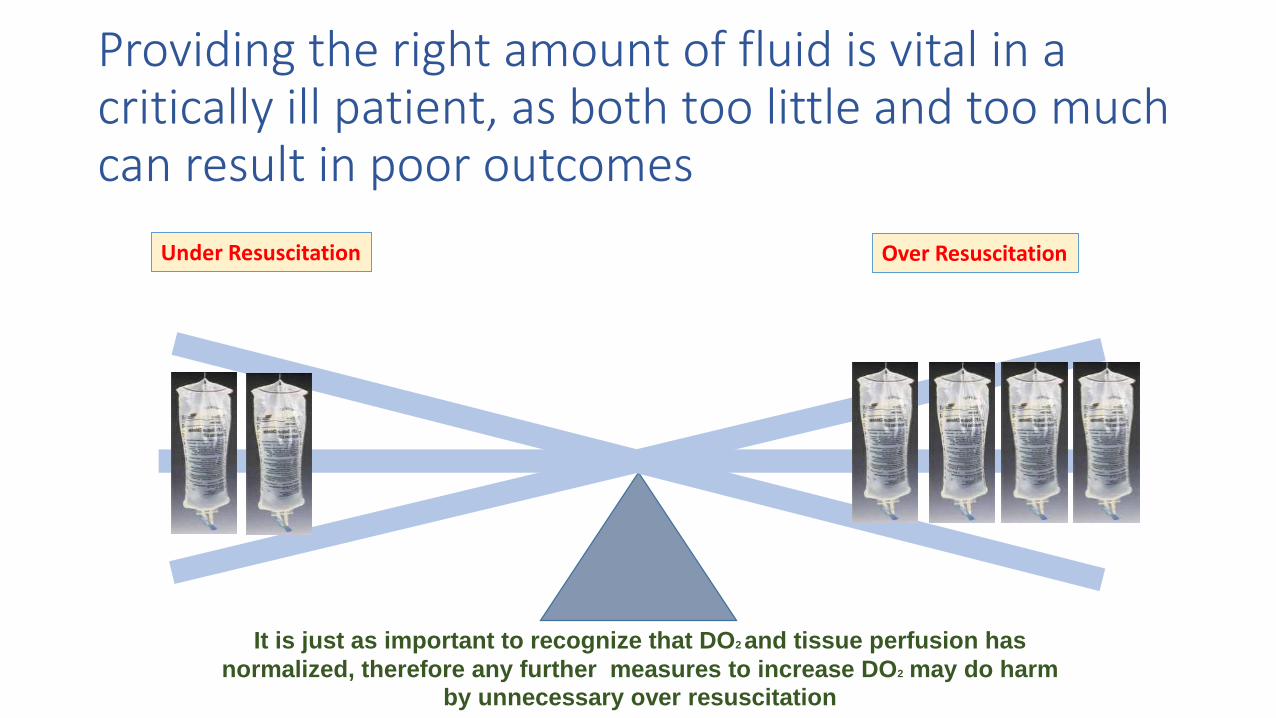
Providing the right amount of fluid is vital in a critically ill patient, as both too little and too much can result in poor outcomes
Under Resuscitation Over Resuscitation
It is just as important to recognize that DO2 and tissue perfusion has
normalized, therefore any further measures to increase DO2 may do harm
by unnecessary over resuscitation

HR and BP as Resuscitation Endpoint
NIRS
SVV SvO2Heart Rate
Urine OutputMental Status
OPSI
GEDV
SV

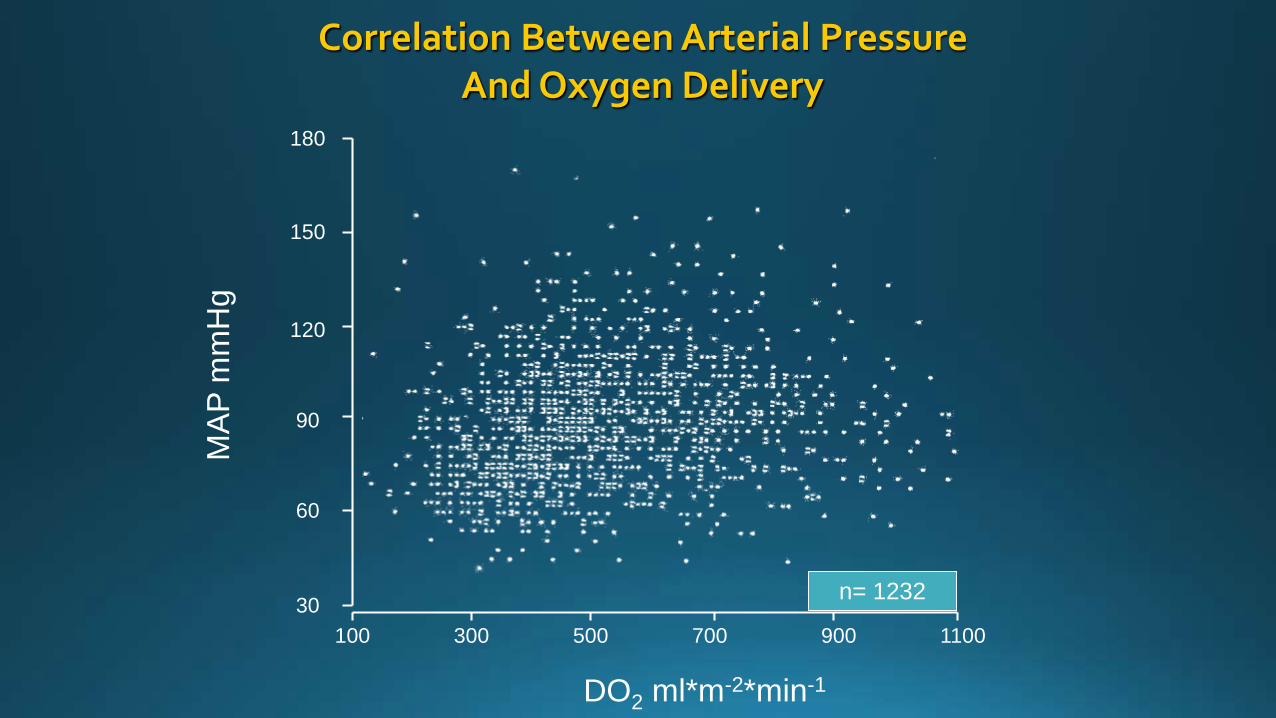
DO2 ml*m-2*min-1
100 300 500 700 900 1100
n= 123230
60
90
120
150
180
MA
P m
mH
g
Correlation Between Arterial Pressure And Oxygen Delivery

DO2 ml*m-2*min-1
100 300 500 700 900 1100
n= 123630
60
90
120
150
180
HR
b/m
in
Correlation Between Heart Rate And Oxygen Delivery

CVP as a Resuscitation Endpoint
NIRS
SVV SvO2Heart Rate
Urine OutputMental Status
OPSI
GEDV
SV

Passive leg raising (PLR)Volume of blood transferred (usually 200-300 mL) to the heart during PLR is sufficient to increase the left cardiac preload and thus challenge the Frank-Starling curve.
Maximal effect occurs at 30-90 seconds and assess for a 10% increase in stroke volume (cardiac output monitor) or using a surrogate such as pulse pressure (using an arterial line)

Diagnostic Accuracy of Passive Leg Raising for Prediction of Fluid Responsiveness in Adults: Systematic Review and Meta-analysis of Clinical Studies.
• Meta-analysis 9 studies
• PLR changes in CO predicts fluid responsiveness
• Regardless of ventilation mode and cardiac rhythm
• Difference in CO of 18% distinguished responder from NR
Cavallaro, F. et al. Intensive Care Med. 2010 Sep;36(9):1475-83
The pooled sensitivity and specificity of PLR-cCO were
89.4% (84.1-93.4%) and 91.4% (85.9-95.2%) respectively
AUC= 0.96

CVP as a Resuscitation Endpoint
NIRS
SVV SvO2Heart Rate
Urine OutputMental Status
OPSI
GEDV
SVCVP

• European survey:
More the 90% of intensivist or anesthesiologists used the CVP to guide fluid management.
• Canadian survey:
90% of intensivists used the CVP to monitor fluid resuscitation in patients with septic shock.

Crit Care Med 2013; 41:1774–1781)
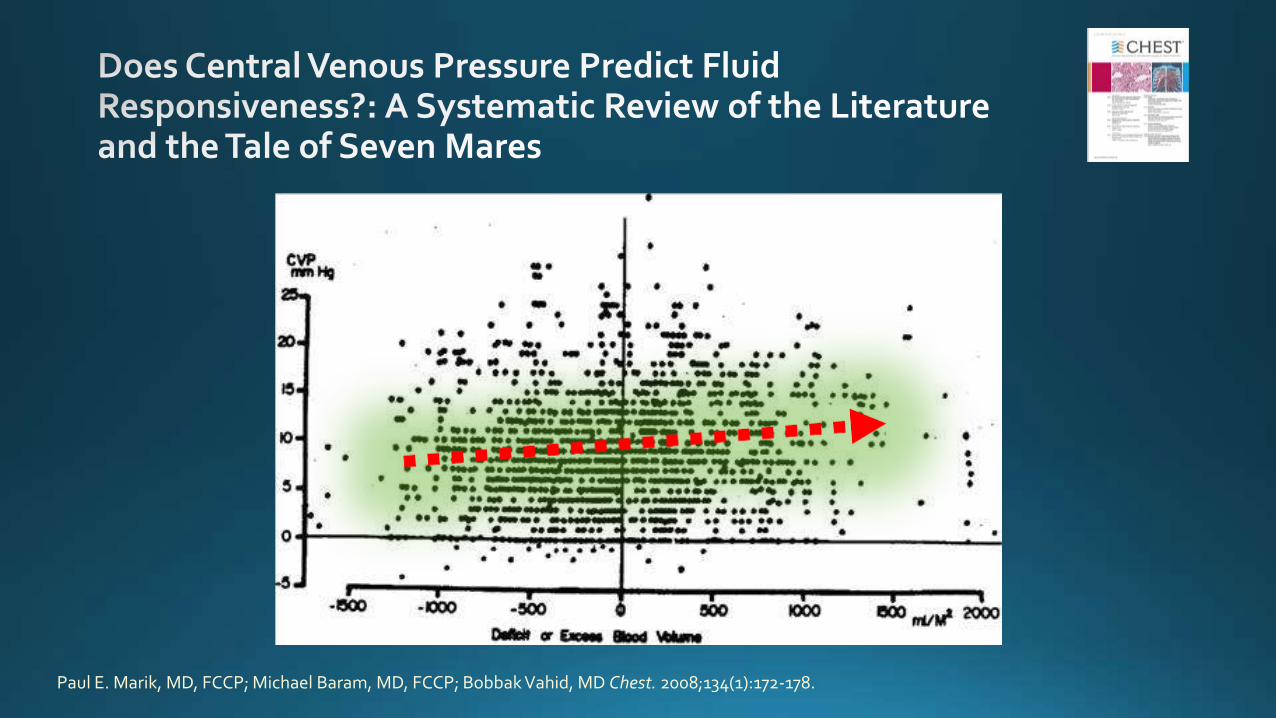
Paul E. Marik, MD, FCCP; Michael Baram, MD, FCCP; Bobbak Vahid, MD Chest. 2008;134(1):172-178.

Osman D1, Ridel C, Ray P, Monnet X, Anguel N, Richard C, Teboul JL. Crit Care Med. 2007 Jan;35(1):64-8.
The study demonstrates that cardiac filling pressures are poor
predictors of fluid responsiveness in septic patients. Therefore,
their use as targets for volume resuscitation must be
discouraged, at least after the early phase of sepsis has concluded

There are no data to support the widespread practice of using central venous pressure to guide fluid therapy. This approach to fluid
resuscitation should be abandoned.
Marik PE, Cavallazzi R . Crit Care Med. 2013 Jul;41(7):1774-81..
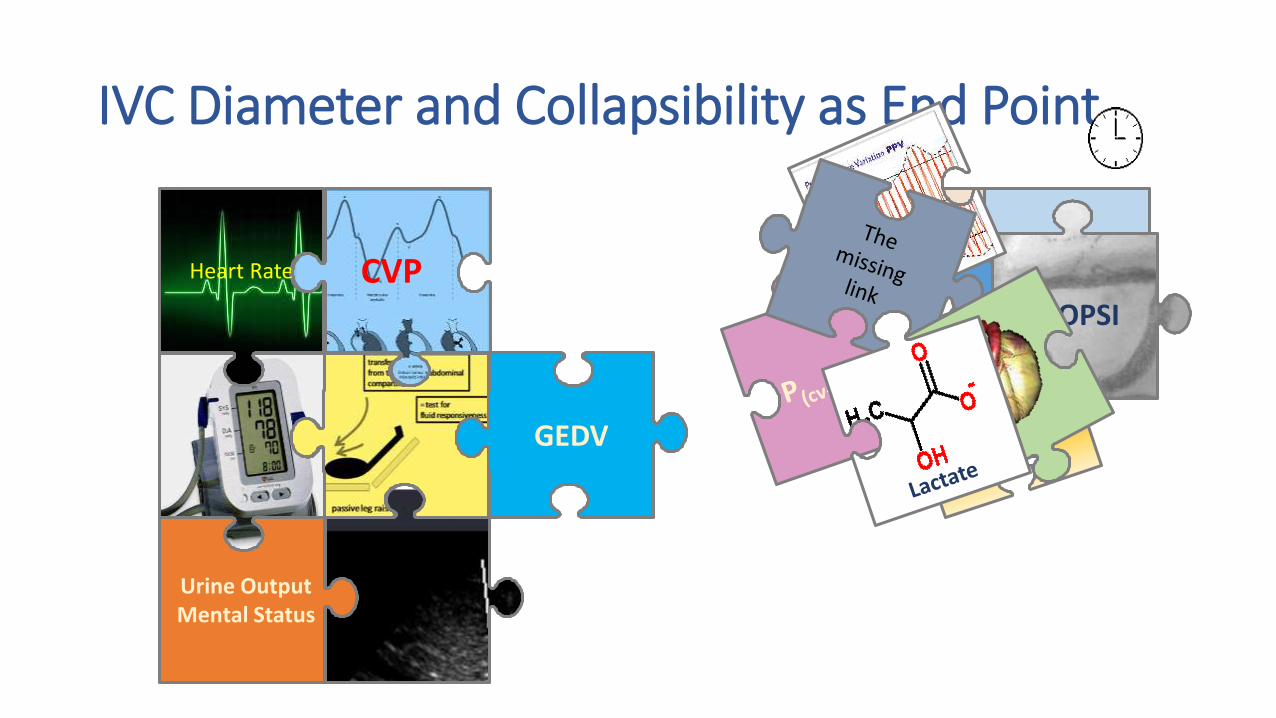
IVC Diameter and Collapsibility as End Point
NIRS
SVV SvO2Heart Rate
Urine OutputMental Status
OPSI
GEDV
CVP

Simultaneous measurements of the central venous pressure (CVP) and IVC diameter at the end of expiration in 108 mechanically ventilated patients

Collapsibility Index = 𝑰𝑽𝑪
𝒎𝒂𝒙−𝑰𝑽𝑪𝒎𝒊𝒏
𝑰𝑽𝑪𝒎𝒂𝒙
>12% = responders(PPV 93% and NPV92%).

Collapsibility Index = 𝑰𝑽𝑪
𝒎𝒂𝒙−𝑰𝑽𝑪𝒎𝒊𝒏
𝑰𝑽𝑪𝒎𝒂𝒙
<12% = non-responders (PPV 93% and NPV92%).
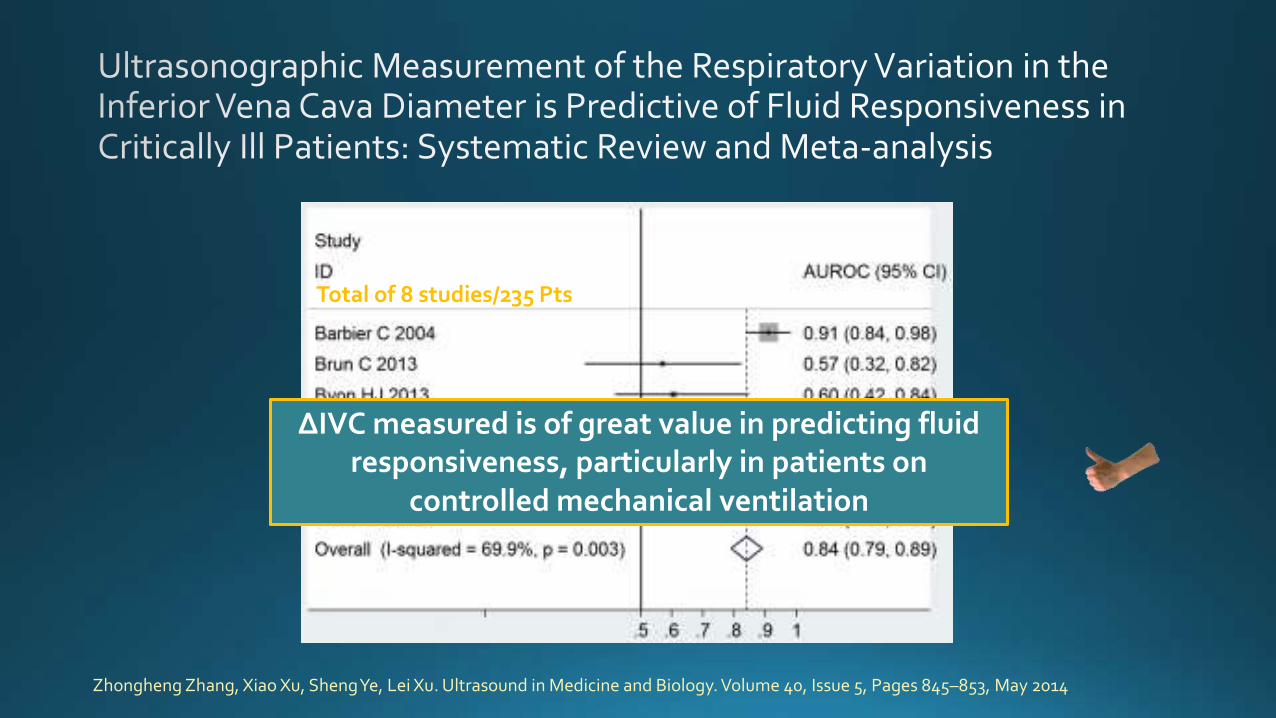
Zhongheng Zhang, Xiao Xu, Sheng Ye, Lei Xu. Ultrasound in Medicine and Biology. Volume 40, Issue 5, Pages 845–853, May 2014
Total of 8 studies/235 Pts
ΔIVC measured is of great value in predicting fluid responsiveness, particularly in patients on
controlled mechanical ventilation

CO/SV as a Resuscitation Endpoint
NIRS
SVV SvO2Heart Rate
Urine OutputMental Status
OPSI
SV/CO
CVP
GEDV

Effects of Cardiac Output and Stroke Volume Guided Hemorrhage and Fluid Resuscitation
CI-group SVI-group
Tbsl T0 tend Tbsl T0 Tend
SVI (ml/m2) 33.6 ± 6.2 14.6 ± 10.1 23.4 ± 7.9 26.8 ± 4.7 13.4 ± 2.3 26.6 ± 4.1
CI (l/min/m2) 2.88 ± 0.42 1.79 ± 0.53 2.73 ± 0.35 2.6 ± 0.4 1.8 ± 0.3 2.9 ± 0.5
MAP (mmHg) 127 ± 13.07 75 ± 25 85 ± 22 112 ± 23 74 ± 18 91 ± 19
Heart rate (beats/min) 87 ± 16 140 ± 40 124 ± 37 95 ± 12 131 ± 27 107 ± 16
Central venous oxygen saturation (%)
81 ± 8 58 ± 18 64 ± 15 78 ± 7 61 ± 5 73 ± 9
Venous to arterial carbon dioxide gap (mm Hg)
3.3 ± 3.1 8.9 ± 3.3 7.8 ± 4.8 5.3 ± 2 9.6 ± 2.3 5.1 ± 2.6
GEDV (ml/m2) 317 ± 36 198 ± 57 249 ± 46 309 ± 57 231 ± 61 287 ± 49
Stroke volume variation (%) 10.8 ± 5.5 17.3 ± 5.1 16.4 ± 8.2 13.6 ± 4.3 22.6 ± 5.6 12.2 ± 4.3
Nemeth, M. et al. Acta Anaesthesiol Scand (2014). doi:10.1111/aas.12312
21 animal subjects were bled until CI (n=9) or SVI (n=12) decreased by 50% then resuscitated during 60 minutes with LR till target is achieved
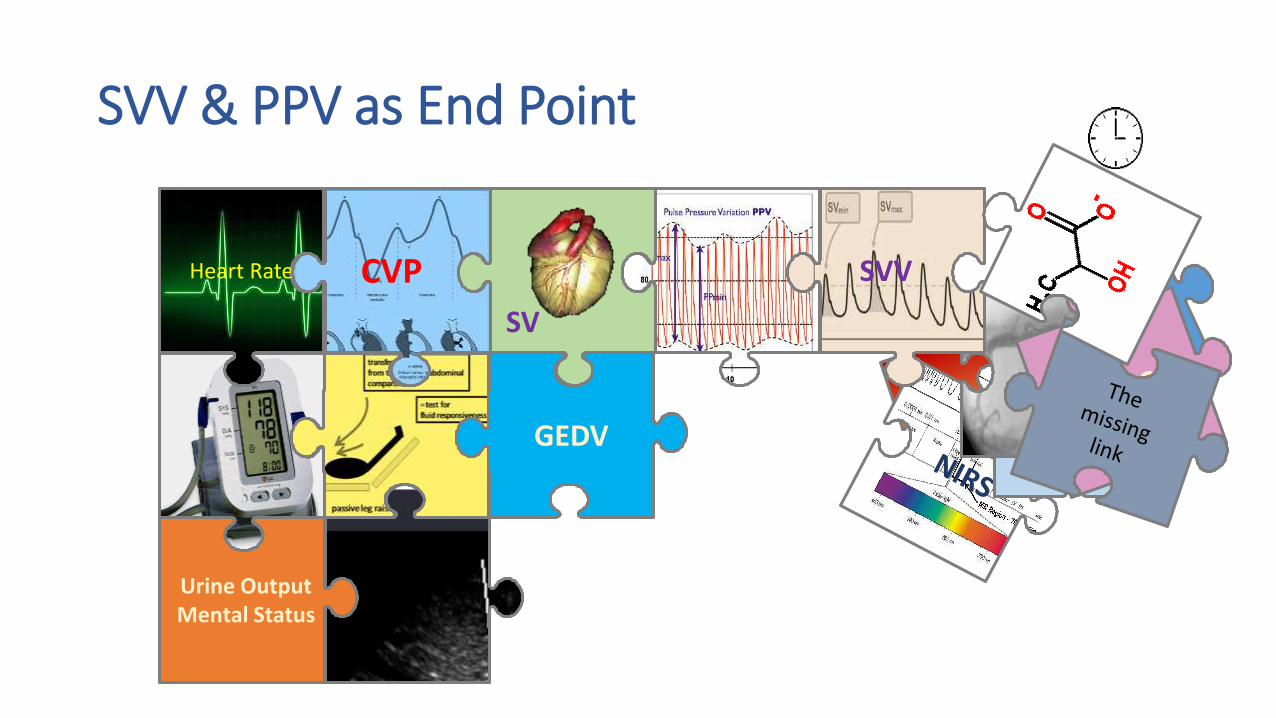
SVV & PPV as End Point
SvO2
Heart Rate
Urine OutputMental Status
OPSI
SV
GEDV
SVVCVP

Hemodynamics During Positive Pressure Ventilation: SVV and PPV
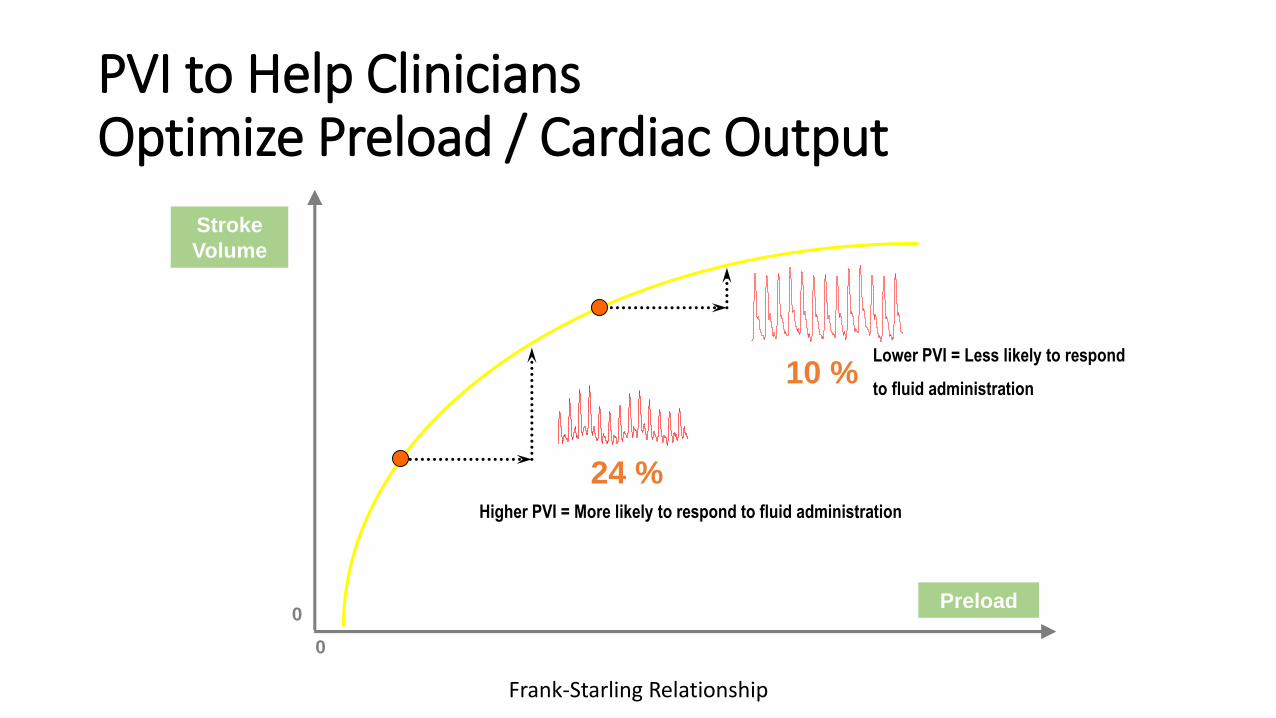
Preload
Stroke
Volume
0
0
Higher PVI = More likely to respond to fluid administration
24 %
10 %Lower PVI = Less likely to respond
to fluid administration
PVI to Help Clinicians Optimize Preload / Cardiac Output
Frank-Starling Relationship
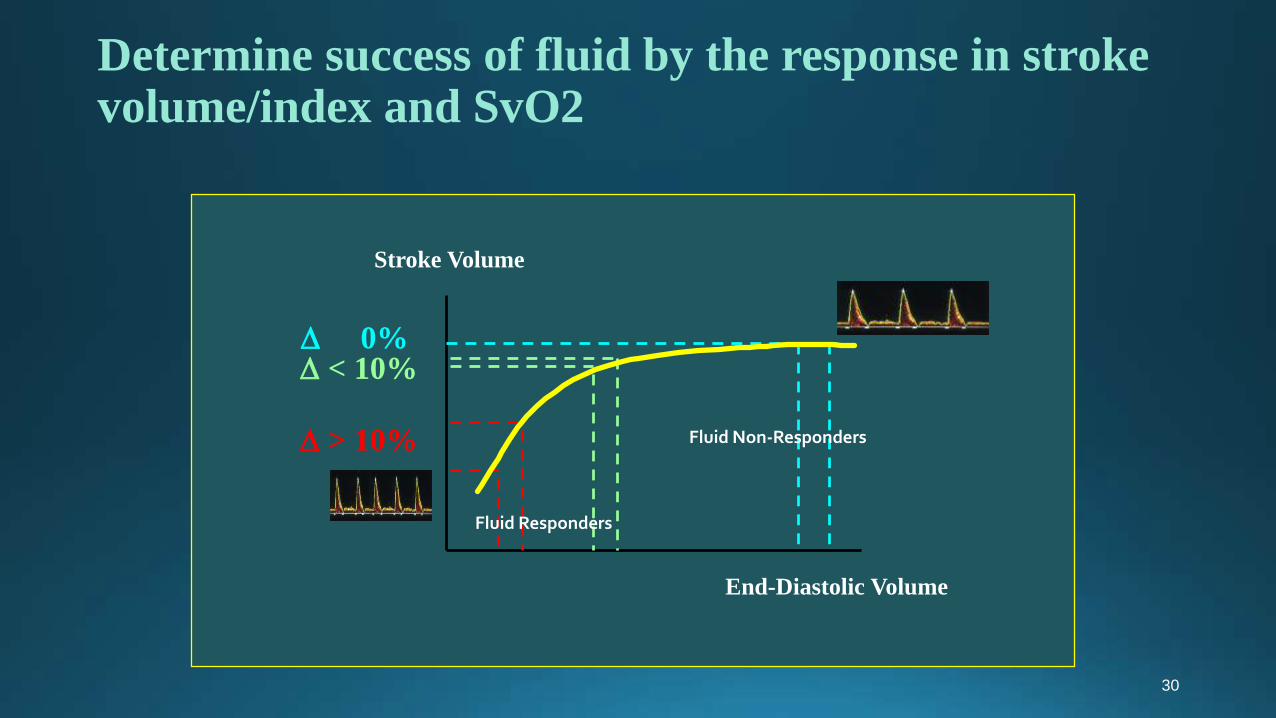
Determine success of fluid by the response in stroke volume/index and SvO2
30
Stroke Volume
End-Diastolic Volume
D < 10%
D > 10%
D 0%
Fluid Responders
Fluid Non-Responders

Dynamic parameters should be used preferentially to static parameters to
predict fluid responsiveness in ICU patients

Dynamic Changes in Arterial Waveform Derived Variables and Fluid Responsiveness in Mechanically Ventilated Patients: A Systematic Review of Literature
Marik, PE et al. (2009). Citi Care Med. 37: 2642-2647
Sens. 0.89Spec. 0.88AUC= 0.94

Lactic Acid as Endpoint Resuscitation
Heart Rate
Urine OutputMental Status
OPSI
SV
Lactate
CVP
GEDV
SVV

Oxygen consumption
VO2 mls/min
Oxygen delivery
DO2 mls/min300mls/min
Lactate
Critical DO2
Oxygen Debt
DO2 independent in normal patients
DO2 dependent in septic patients

Prolonged lactate clearance is associated with increased mortality in the surgical intensive care unit
J. McNelis et al. The American Journal of Surgery 182 (2001) 481–485

Early lactate-guided therapy in intensive care unit patients: a multicenter, open-label, randomized controlled trial.
Jansen TC,van Bommel J, Schoonderbeek FJ,Sleeswijk Visser SJ, vander Klooster JM, Lima AP, et al. Am J Respir Crit Care Med (2010) 182:752–
61.doi:10.1164/rccm.200912-1918OC
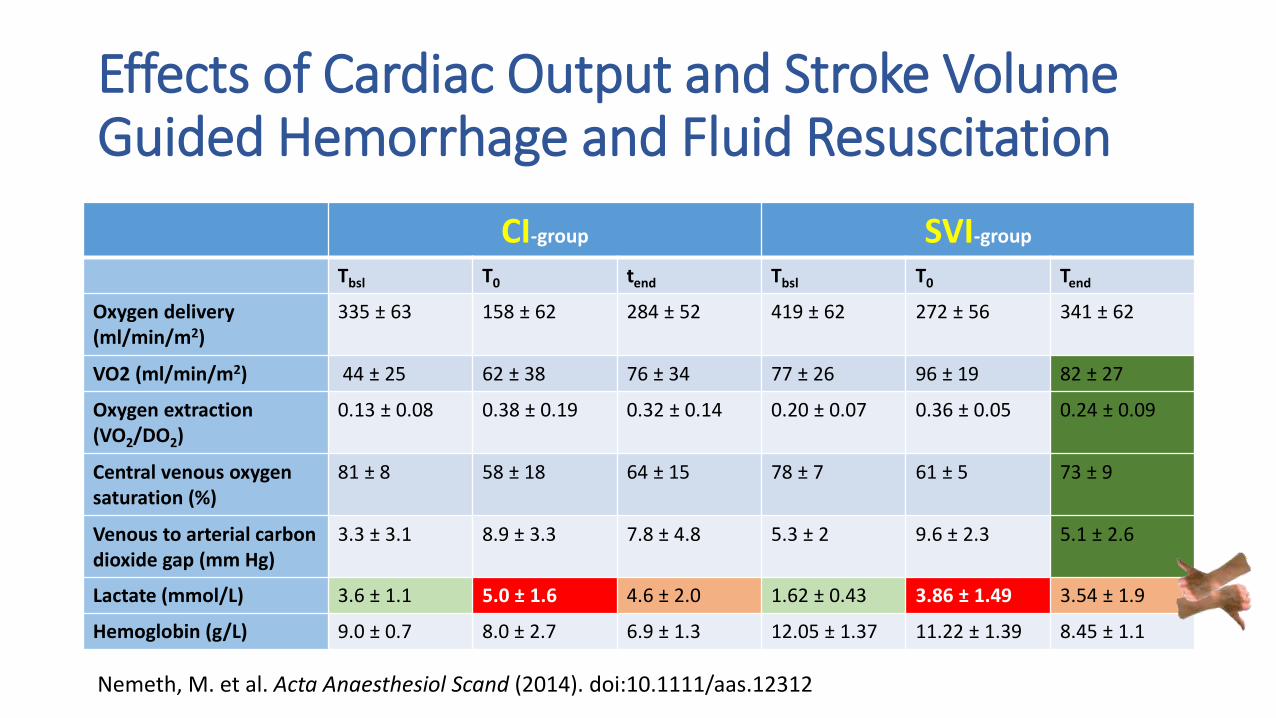
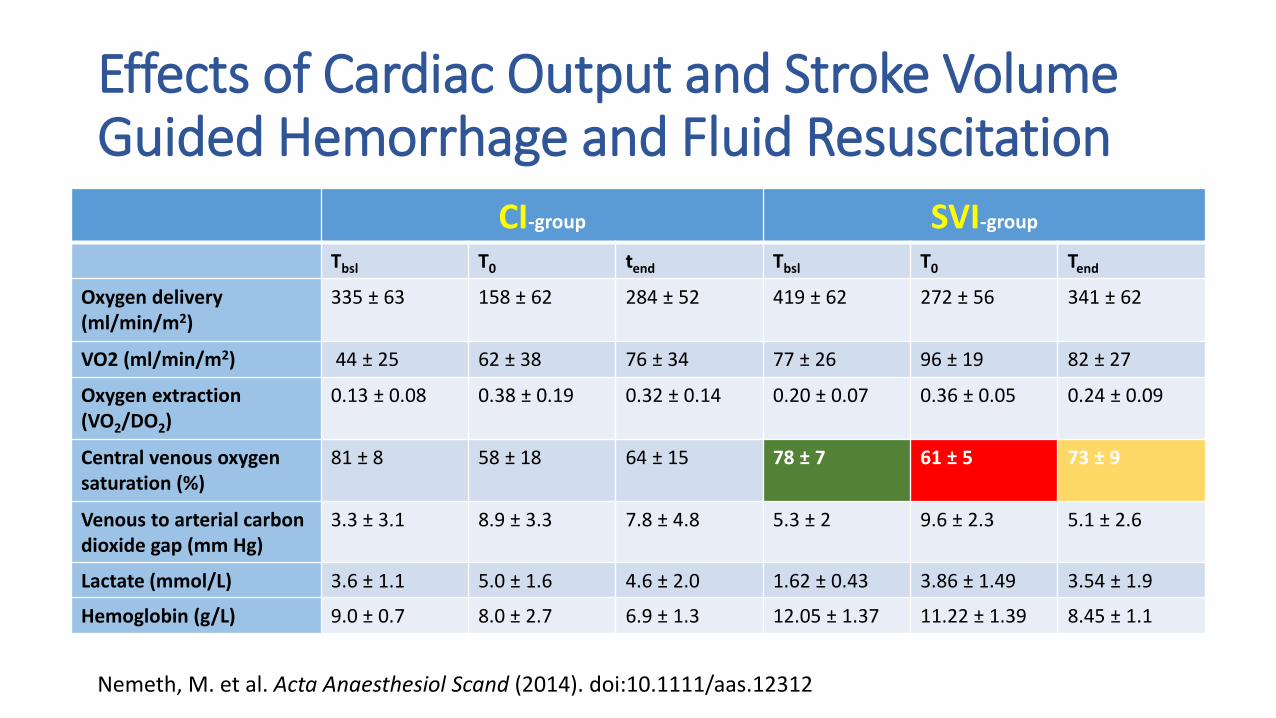
Effects of Cardiac Output and Stroke Volume Guided Hemorrhage and Fluid Resuscitation
CI-group SVI-group
Tbsl T0 tend Tbsl T0 Tend
Oxygen delivery (ml/min/m2)
335 ± 63 158 ± 62 284 ± 52 419 ± 62 272 ± 56 341 ± 62
VO2 (ml/min/m2) 44 ± 25 62 ± 38 76 ± 34 77 ± 26 96 ± 19 82 ± 27
Oxygen extraction (VO2/DO2)
0.13 ± 0.08 0.38 ± 0.19 0.32 ± 0.14 0.20 ± 0.07 0.36 ± 0.05 0.24 ± 0.09
Central venous oxygen saturation (%)
81 ± 8 58 ± 18 64 ± 15 78 ± 7 61 ± 5 73 ± 9
Venous to arterial carbon dioxide gap (mm Hg)
3.3 ± 3.1 8.9 ± 3.3 7.8 ± 4.8 5.3 ± 2 9.6 ± 2.3 5.1 ± 2.6
Lactate (mmol/L) 3.6 ± 1.1 5.0 ± 1.6 4.6 ± 2.0 1.62 ± 0.43 3.86 ± 1.49 3.54 ± 1.9
Hemoglobin (g/L) 9.0 ± 0.7 8.0 ± 2.7 6.9 ± 1.3 12.05 ± 1.37 11.22 ± 1.39 8.45 ± 1.1
Nemeth, M. et al. Acta Anaesthesiol Scand (2014). doi:10.1111/aas.12312
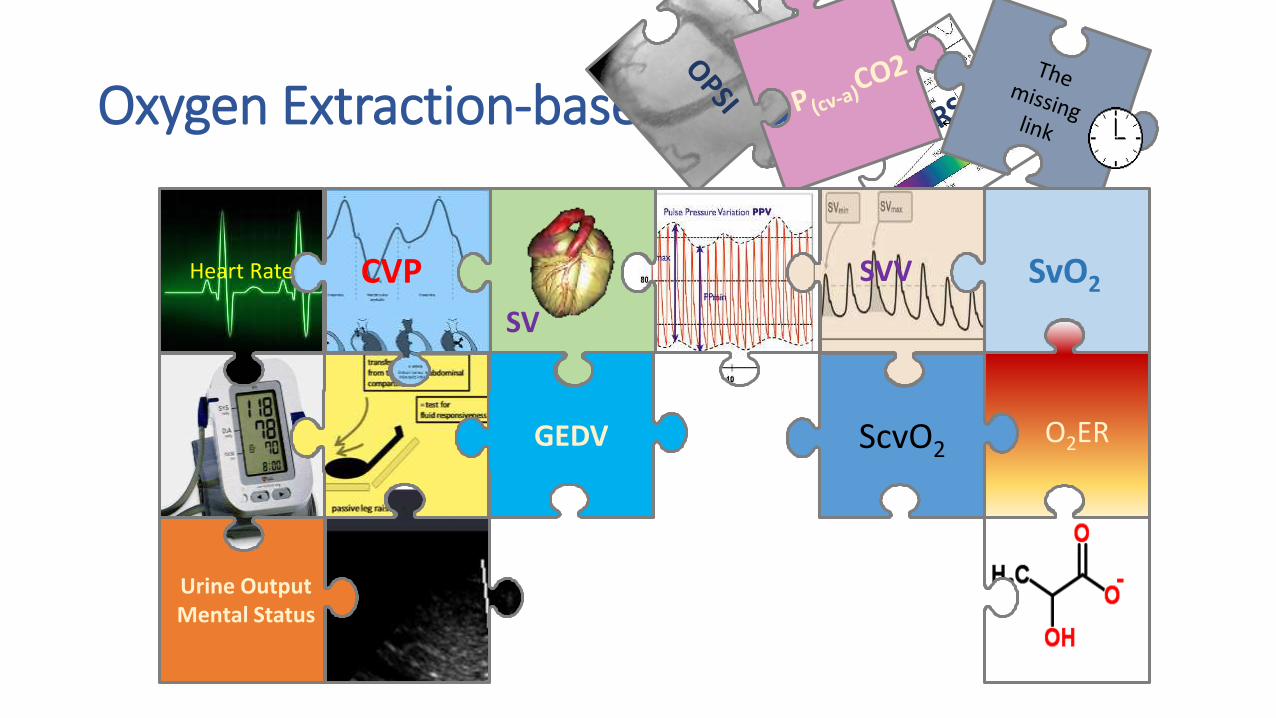
Oxygen Extraction-based Resuscitation
SVVHeart Rate
Urine OutputMental Status
SV
GEDV
SVV
O2ER
SvO2
ScvO2
CVP
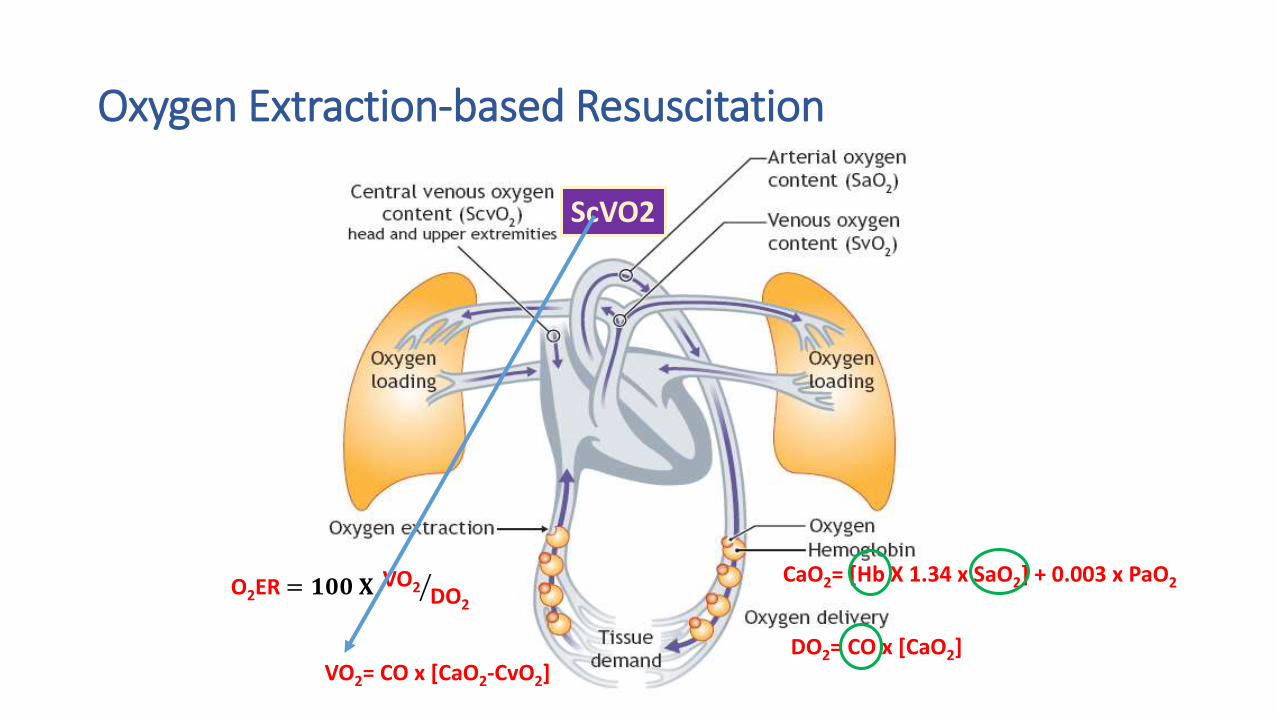
DO2= CO x [CaO2]
CaO2= [Hb X 1.34 x SaO2] + 0.003 x PaO2
VO2= CO x [CaO2-CvO2]
O2ER = 𝟏𝟎𝟎 𝐗 VO2 DO2
Oxygen Extraction-based Resuscitation
ScVO2
Effects of Cardiac Output and Stroke Volume Guided Hemorrhage and Fluid Resuscitation
CI-group SVI-group
Tbsl T0 tend Tbsl T0 Tend
Oxygen delivery (ml/min/m2)
335 ± 63 158 ± 62 284 ± 52 419 ± 62 272 ± 56 341 ± 62
VO2 (ml/min/m2) 44 ± 25 62 ± 38 76 ± 34 77 ± 26 96 ± 19 82 ± 27
Oxygen extraction (VO2/DO2)
0.13 ± 0.08 0.38 ± 0.19 0.32 ± 0.14 0.20 ± 0.07 0.36 ± 0.05 0.24 ± 0.09
Central venous oxygen saturation (%)
81 ± 8 58 ± 18 64 ± 15 78 ± 7 61 ± 5 73 ± 9
Venous to arterial carbon dioxide gap (mm Hg)
3.3 ± 3.1 8.9 ± 3.3 7.8 ± 4.8 5.3 ± 2 9.6 ± 2.3 5.1 ± 2.6
Lactate (mmol/L) 3.6 ± 1.1 5.0 ± 1.6 4.6 ± 2.0 1.62 ± 0.43 3.86 ± 1.49 3.54 ± 1.9
Hemoglobin (g/L) 9.0 ± 0.7 8.0 ± 2.7 6.9 ± 1.3 12.05 ± 1.37 11.22 ± 1.39 8.45 ± 1.1
Nemeth, M. et al. Acta Anaesthesiol Scand (2014). doi:10.1111/aas.12312
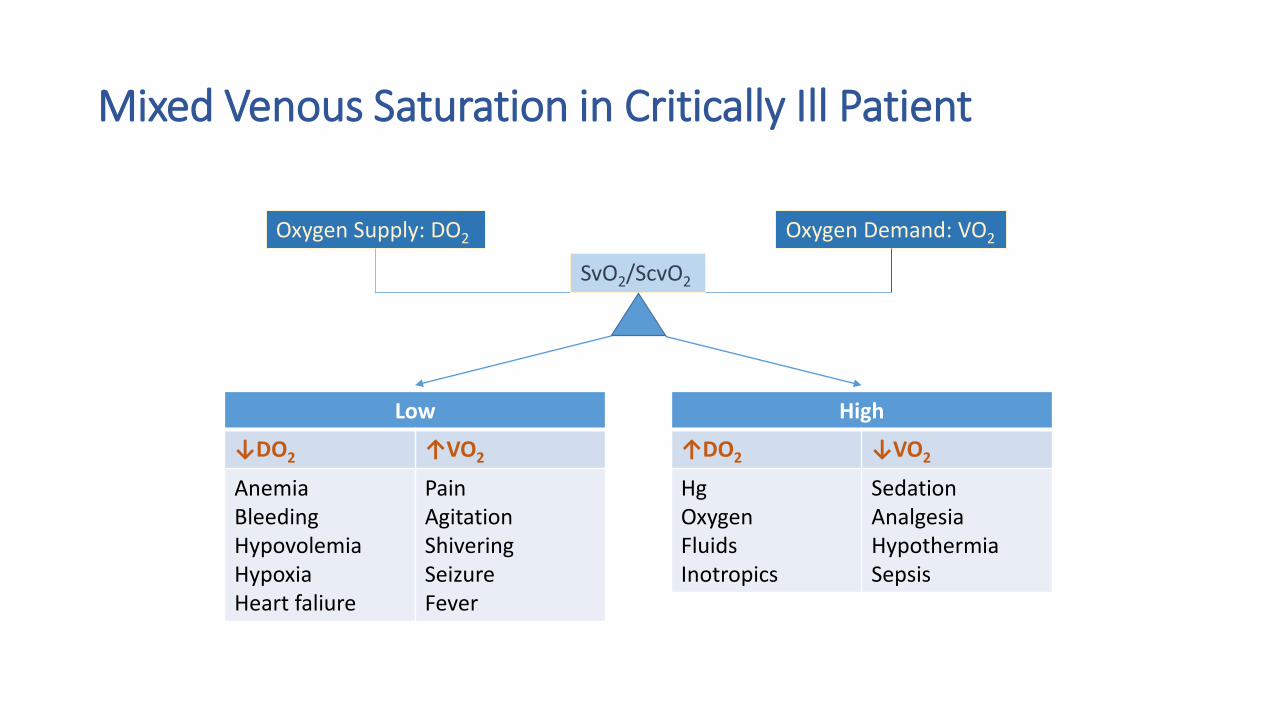
Mixed Venous Saturation in Critically Ill Patient
Oxygen Supply: DO2 Oxygen Demand: VO2
SvO2/ScvO2
Low
↓DO2 ↑VO2
AnemiaBleedingHypovolemiaHypoxiaHeart faliure
PainAgitationShiveringSeizureFever
High
↑DO2 ↓VO2
HgOxygenFluidsInotropics
SedationAnalgesiaHypothermiaSepsis
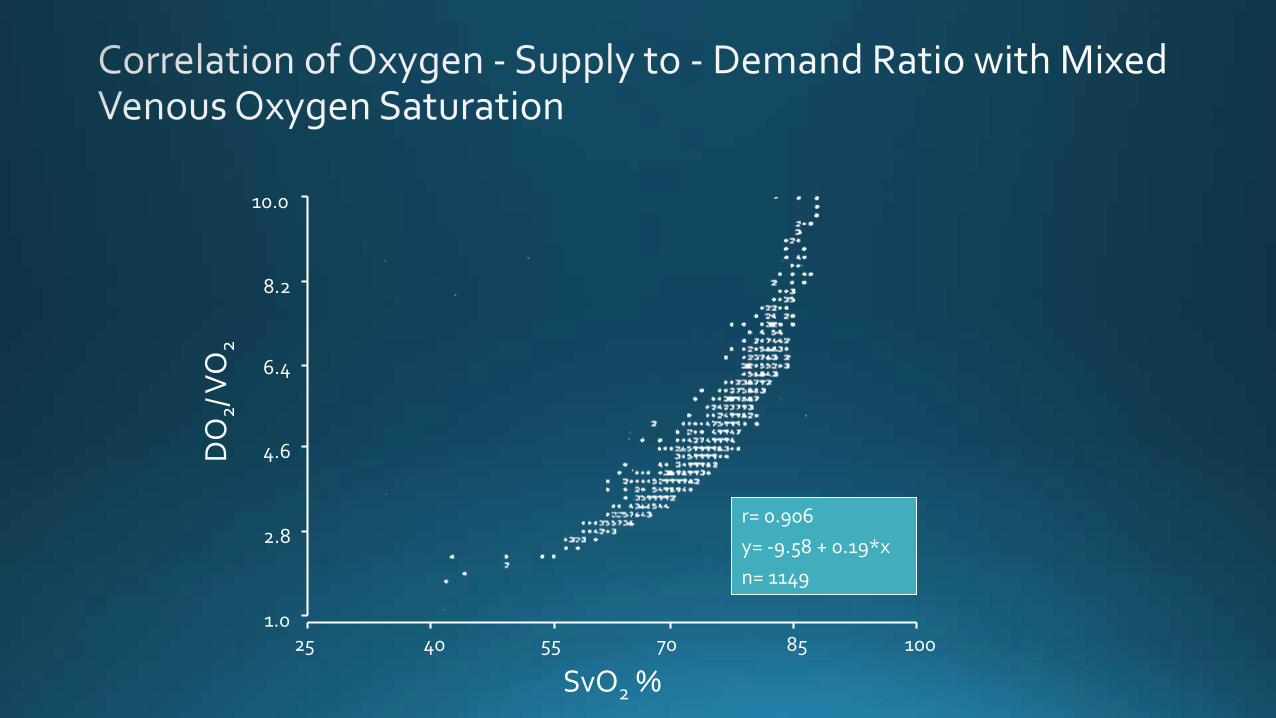
SvO2 %
DO
2/ V
O2
25 705540 85 1001.0
2.8
4.6
6.4
8.2
10.0
r= 0.906
y= -9.58 + 0.19*x
n= 1149

Lee J et al. (1972) Anaesthesiology 36: 472
% S
svO
2
% SvO2
100
80
60
40
20
0 20 40 60 80 100
r= 0.73
r= 0.88
Shock
Normal
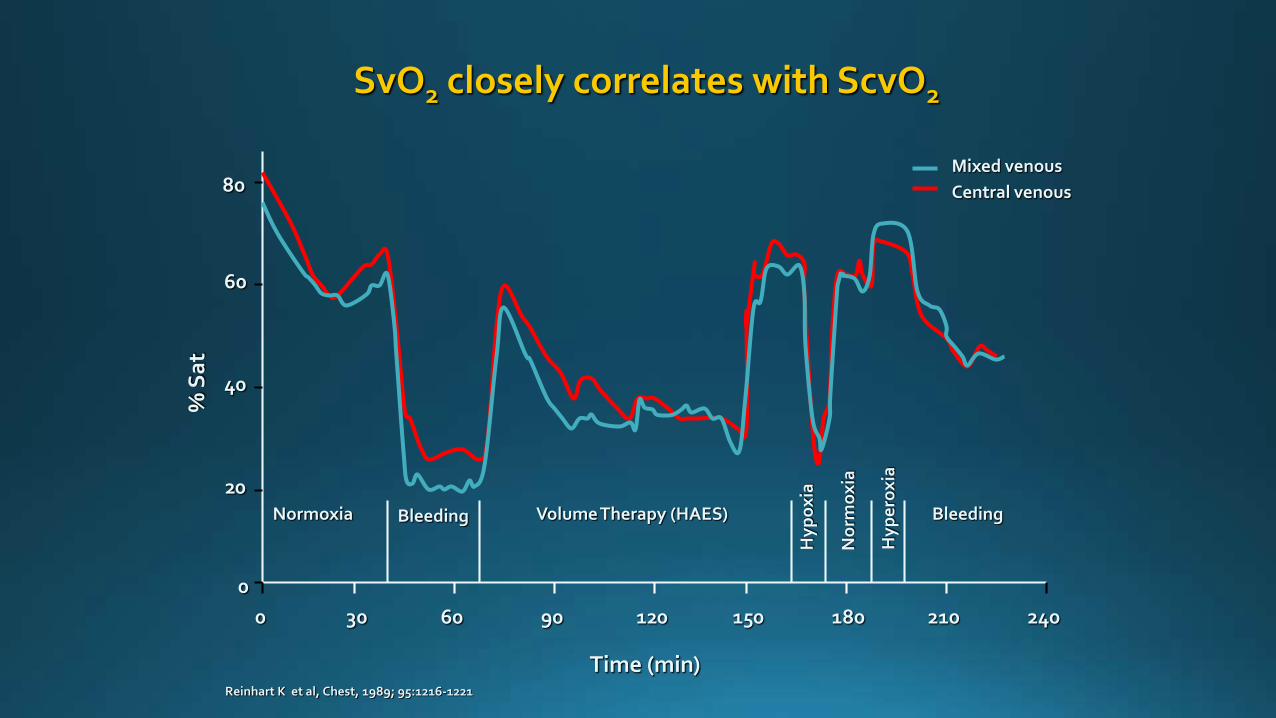
Reinhart K et al, Chest, 1989; 95:1216-1221
SvO2 closely correlates with ScvO2
Time (min)
% S
at
80
60
40
20
0
300 60 90 120 150 180 210 240
Normoxia Bleeding Volume Therapy (HAES) Bleeding
Hy
po
xia
No
rmo
xia
Hy
pe
rox
ia
Mixed venous
Central venous

Pope, J et al. Ann Emerg Med. 55:40-46
ScvO2 of > 90%, ScvO2 of < 70%,

Oxygen Parameters as Endpoint
SVVHeart Rate
Urine OutputMental Status
SV
GEDV
SVV
O2ER
SvO2
ScvO2
P(cv-a)CO2
CVP
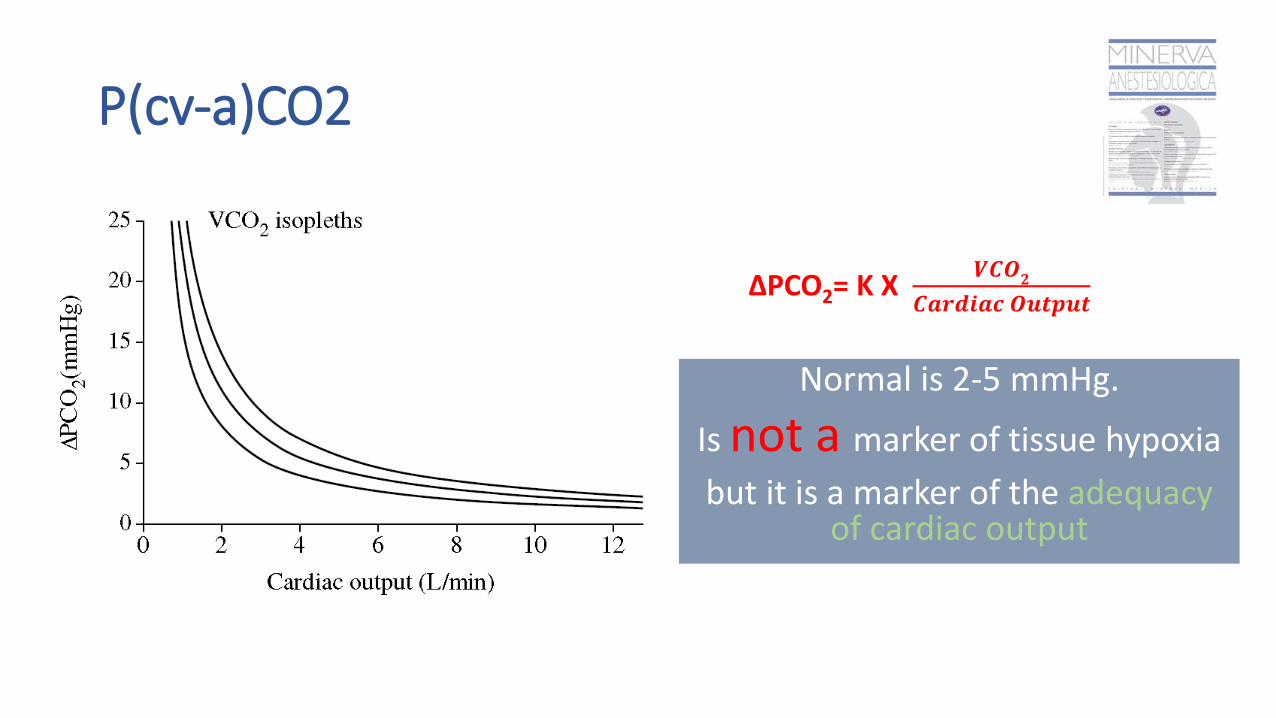
P(cv-a)CO2
Normal is 2-5 mmHg.
Is not a marker of tissue hypoxia
but it is a marker of the adequacy of cardiac output
∆PCO2= K X 𝑽𝑪𝑶
𝟐
𝑪𝒂𝒓𝒅𝒊𝒂𝒄 𝑶𝒖𝒕𝒑𝒖𝒕

Persistently high venous-to-arterial carbon dioxide differences during early resuscitation are associated with poor outcomes in septic shock
Ospina-Tascón GA et al., Crit Care. 2013; 17(6)
The persistence of high Pv-aCO2during the early resuscitation of septic shock was associated with
more severe multi-organ dysfunction and worse outcomes at
day-28
H-H, mixed venous-to-arterial carbon dioxide difference (Pv-aCO2) high at Time 0 (T0) and 6 hours later (T6); L-H, Pv-aCO2 normal at T0 and high at T6; H-L, Pv-aCO2 high at T0 and normal at T6; and L-L, Pv-aCO2 normal at T0 and T6

Central Venous-to-Arterial Gap Is a Useful Parameter in Monitoring Hypovolemia-Caused Altered Oxygen Balance: Animal Study
ScvO2 < 73% and CO2 gap >6 mmHg can be complementary tools
in detecting hypovolemia-caused imbalance of oxygen
extraction.
Kocsi S et al, Crit Care Res Pract. 2013; 583-598.
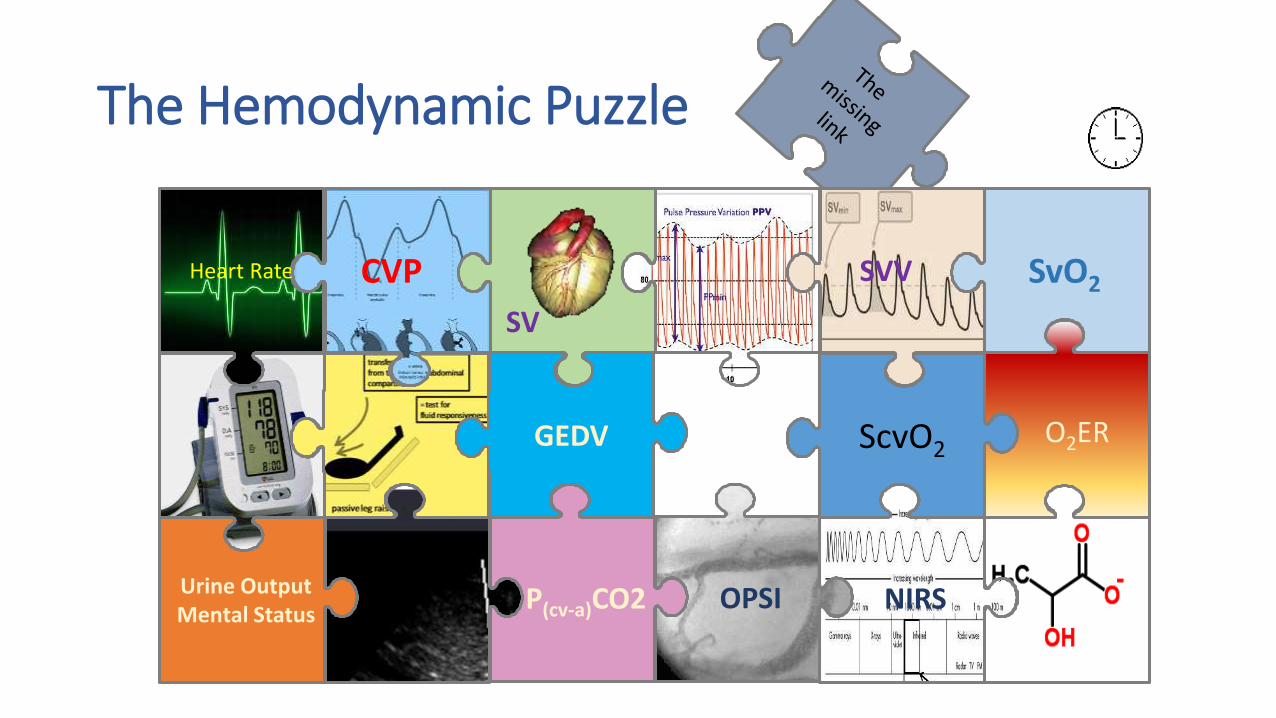
The Hemodynamic Puzzle
SVVHeart Rate
Urine OutputMental Status
SV
GEDV
SVV
O2ER
SvO2
ScvO2
P(cv-a)CO2 NIRSOPSI
CVP
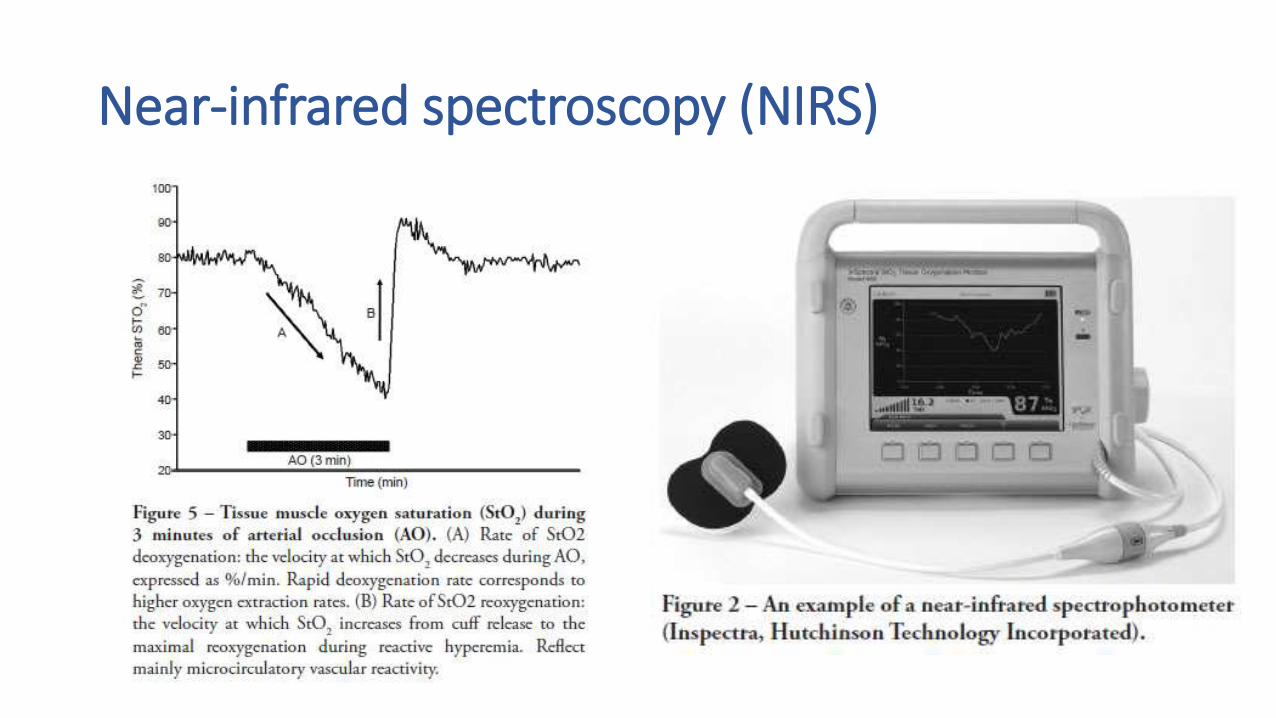
Near-infrared spectroscopy (NIRS)
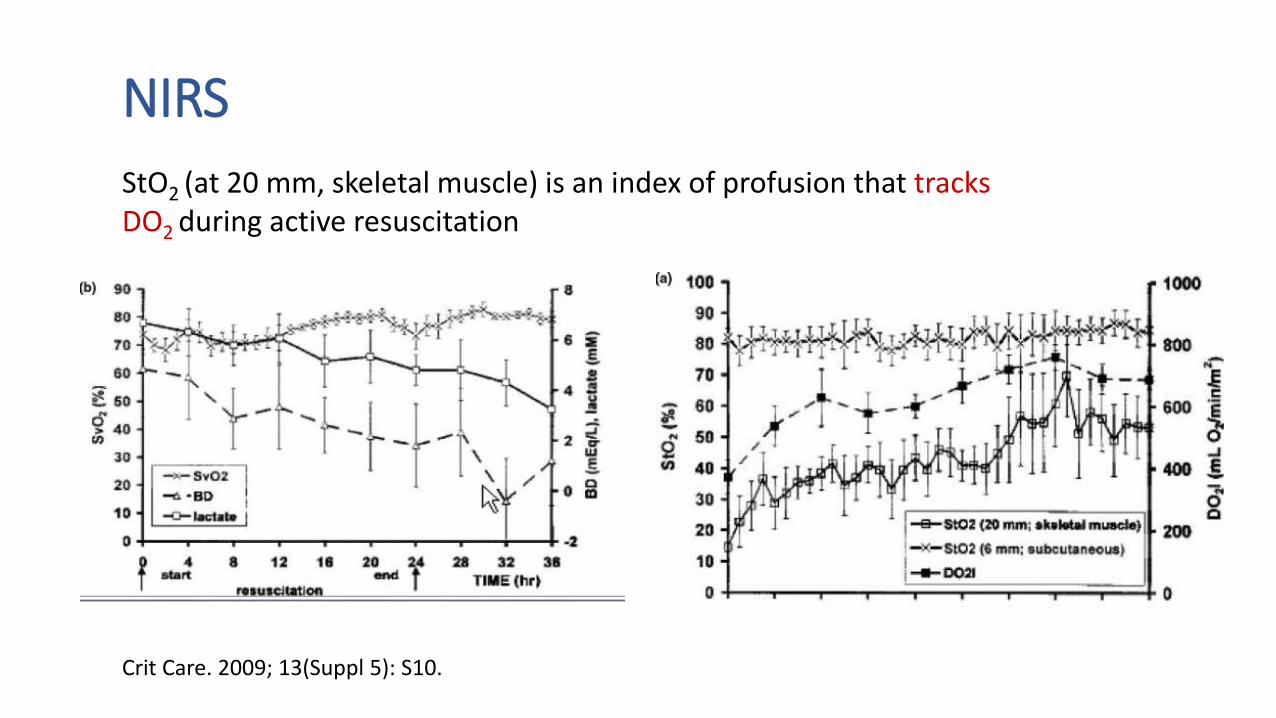
NIRS
StO2 (at 20 mm, skeletal muscle) is an index of profusion that tracks DO2 during active resuscitation
Crit Care. 2009; 13(Suppl 5): S10.

Orthogonal Polarization Spectral Imaging (OPS): Sublingual capillaroscopy.
Orthogonal polarization spectral (OPS) imaging is an optical imaging technique that uses a handheld microscope and green polarized light to visualize the red blood cells in the microcirculation of organ surfaces
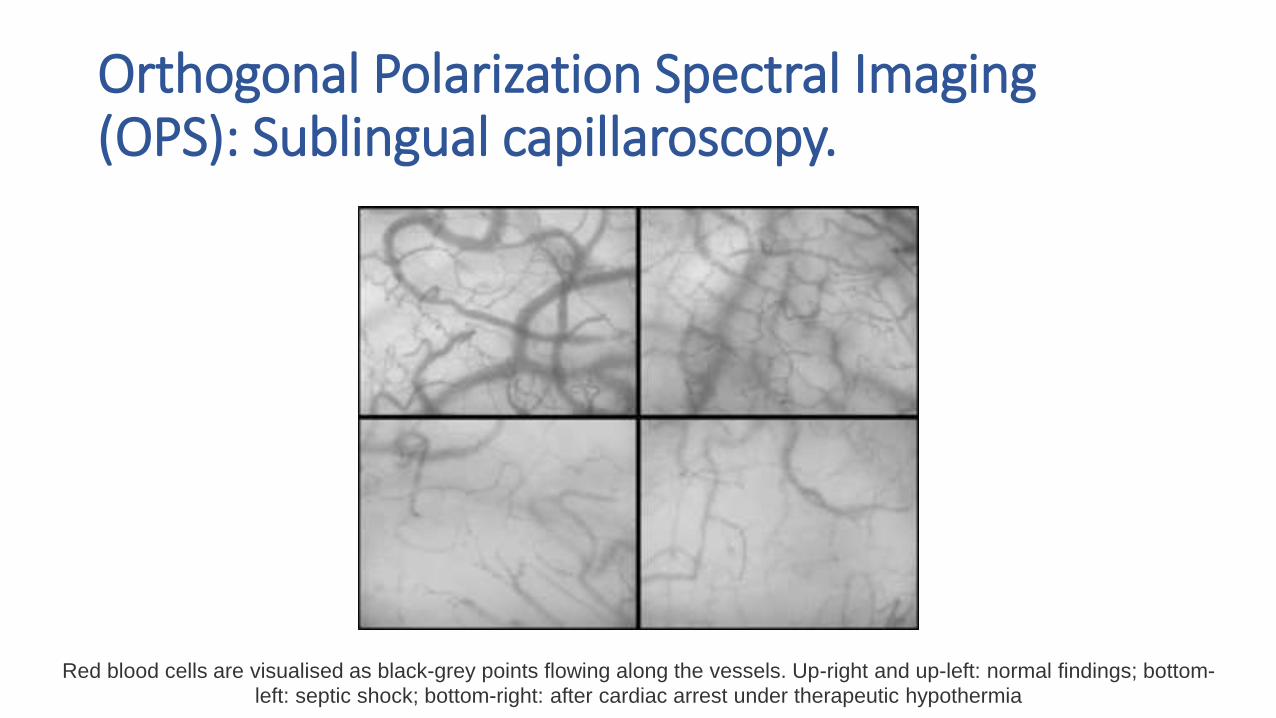
Orthogonal Polarization Spectral Imaging (OPS): Sublingual capillaroscopy.
Red blood cells are visualised as black-grey points flowing along the vessels. Up-right and up-left: normal findings; bottom-
left: septic shock; bottom-right: after cardiac arrest under therapeutic hypothermia


The Hemodynamic Puzzle
O2ER
NIRS
SVV SvO2
ScvO2
Heart Rate
Urine OutputMental Status
OPSI
GEDV
P(cv-a)CO2
Lactate
SV
CVP