hemodynamic patterning of the avian atrioventricular valve pdfs/hemodynamic... · hemodynamic...
TRANSCRIPT

a RESEARCH ARTICLE
Hemodynamic Patterning of the AvianAtrioventricular ValveHuseyin C. Yalcin,1,2 Akshay Shekhar,1 Tim C. McQuinn,3 and Jonathan T. Butcher1*
In this study, we develop an innovative approach to rigorously quantify the evolving hemodynamic envi-ronment of the atrioventricular (AV) canal of avian embryos. Ultrasound generated velocity profiles wereimported into Micro-Computed Tomography generated anatomically precise cardiac geometries betweenHamburger-Hamilton (HH) stages 17 and 30. Computational fluid dynamic simulations were then con-ducted and iterated until results mimicked in vivo observations. Blood flow in tubular hearts (HH17) waslaminar with parallel streamlines, but strong vortices developed simultaneous with expansion of thecushions and septal walls. For all investigated stages, highest wall shear stresses (WSS) are localized toAV canal valve–forming regions. Peak WSS increased from 19.34 dynes/cm2 at HH17 to 287.18 dynes/cm2 atHH30, but spatiotemporally averaged WSS became 3.62 dynes/cm2 for HH17 to 9.11 dynes/cm2 for HH30.Hemodynamic changes often preceded and correlated with morphological changes. These results estab-lish a quantitative baseline supporting future hemodynamic analyses and interpretations. DevelopmentalDynamics 240:23–35, 2011. VC 2010 Wiley-Liss, Inc.
Key words: computational modeling; shear stress; blood flow; rheology; mechanotransduction; morphogenesis; mitralvalve; embryo; mechanobiology; finite element; simulation; vortex
Accepted 29 September 2010
INTRODUCTION
The formation of the embryonic heartis one of the most fascinating and com-plex developmental events. Over 100years of research has documented itschanging three-dimensional shape andcontraction patterns, although ourunderstanding of the process remainslargely qualitative. The vertebrateheart originates as bilaterally symmet-ric mesodermal fields that fuse to forma tubular structure with the inflow seg-ment caudal to the outflow. This tubethen loops and bulges such that theprimitive ventricular segment forms
caudally to the atrial segment. Forhigher order vertebrates such as birdsand mammals, the myocardial wall ofthe tube expands, becoming trabecu-lated, and a septal ridge progresses cra-nially until it meets with a similar mes-enchymal protrusion that divides theatria and ventricles into left and rightportions. Concomitant with this pro-cess is the formation of the valvular ap-paratus, which originates as endocar-dium lining the atrioventricular (AV)canal and outflow tract (Cruz andMarkward, 1998). A subset of thesecells is induced to transform into mes-enchymal cells (called endocardial to
mesenchymal transformation, EMT)that invade the underlying gelatinousmatrix, remodeling it into cushionsthat perform valve-like function. Thesecushions eventually fuse togethermedially, forming left and right inlets.EMT occurs at Hamburger-Hamilton(HH) stage 16 and cushion fusionapproximately 60 hr later at HH26. Atthis time, a second lateral set of cush-ions form, eventually remodeling intothe lateral leaflets of the AV valve(although in the chick the right AVbecomes a muscular flap structure).The residual medial cushion compo-nents and the lateral cushions then
1Department of Biomedical Engineering, Cornell University, Ithaca, New York2Department of Mechanical Engineering, Dogus University, Istanbul, Turkey3Department of Pediatrics, University of Washington, Seattle, WashingtonGrant sponsor: American Heart Association; Grant number: 0830384N; Grant sponsor: National Science Foundation; Grant sponsor:National Institutes of Health; Grant numbers: HL0077, RR016434, HL033756, HL083975; Grant sponsor: Leducq Foundation; Grantsponsor: The Hartwell Foundation.*Correspondence to: Jonathan T. Butcher, Department of Biomedical Engineering, 304 Weill Hall, Cornell University,Ithaca NY 14853-7501. E-mail: [email protected]
DOI 10.1002/dvdy.22512Published online 15 December 2010 in Wiley Online Library (wileyonlinelibrary.com).
DEVELOPMENTAL DYNAMICS 240:23–35, 2011
VC 2010 Wiley-Liss, Inc.
Dev
elop
men
tal D
ynam
ics

become remodeled into thin fibrousleaflets populated by largely fibroblas-tic phenotypes and quiescent endothe-lium (Combs and Yutzey, 2009). Recentstudies have given significant clarity tothe morphogenic phases of the remod-eling AV valves as a dynamic three-dimensional event (Butcher and Mark-wald, 2007). The mechanisms drivingthese morphogenic processes, however,remain incompletely understood.
The heart continually pumps bloodwhile growing and remodeling, whichsuggests that hemodynamic stresseswithin the heart may provide morpho-genic cues to guide downstream devel-opment (Hove et al., 2003; Forouharet al., 2006; Culver and Dickinson,2010). This idea has been studied forat least the past 60 years throughlargely qualitative means (Pattenet al., 1948; Savard et al., 1960; Jaffee,1965). Early observations of blood flowthrough the embryonic outflow tractvia dye injections suggest that pre-ferred streamlines form prior to itsseptation into pulmonary and aorticbranches (Jaffee, 1965; Yoshida et al.,1983). Changes in these streamlinesthrough mechanical perturbations tocardiac inflow were suggested to pre-cede morphogenetic defects (Hogerset al., 1995; Hu et al., 2009). Groenen-dijk et al. recently provided mechanis-tic insight by showing that theseinflow hemodynamic alterationscaused local endocardial gene expres-sion changes, but correlation withlocal hemodynamic indices was notcarried out (Groenendijk et al., 2005).Reckova et al. showed that ligation ofthe left atria or banding of the outflowtract alters ventricular myocardialand conduction system maturation,but hemodynamics was not quantified(Reckova et al., 2003). More recently, itwas shown that hemodynamics drivesvalve morphogenesis and function(Vermot et al., 2009), which could berelated directly to changes in tissue bi-ological composition (Butcher et al.,2007a). Studies in zebrafish embryosusing spherical beads to impede car-diac inflow or outflow also confirmthese observations (Hove et al., 2003).
In order to better understand therelationships between mechanical andbiological signaling in embryonic de-velopment, detailed quantification ofthe local mechanical conditions isrequired. Several studies have quanti-
fied local myocardial wall strains(Taber et al., 1993; Miller et al., 1997),but quantifying hemodynamics hasbeen more limited. The major techni-ques have been video-microscopy ofdye injections (Hogers et al., 1995; Huet al., 2009), Doppler ultrasound(Butcher et al., 2007a; McQuinn et al.,2007), and particle-image velocimetry(PIV) (Vennemann et al., 2006). Pulseddye injections follow blood wellbut require extremely fast camerasto avoid noise. Doppler ultrasoundprobes can record blood velocity atmuch faster rates (>10 kHz), and havebeen used extensively to quantifyglobal hemodynamic indices in embry-onic chick and mouse (Clark and Hu,1982; Hu and Clark, 1989; Phoonet al., 2004). Doppler ultrasound with-out B-mode guidance is difficult toaccurately place, and is only able torectify the peak blood velocity withoutrespect to cross-sectional variations(Butcher et al., 2007a). Fast scanningconfocal microscopy (Liebling et al.,2006) and optical coherence tomogra-phy (Jenkins et al., 2007) have alsobeen used to visualize cardiac morpho-genesis and quantify hemodynamicsin vivo, but their 3D imaging capacityis limited to very early hearts (pre-HH20).
Many studies have shown that endo-thelial/endocardial cells are highlysensitive to changes in wall shearstress (WSS) (Girard and Nerem,1993; Butcher and Nerem, 2006;Butcher et al., 2006; Farcas et al.,2009). Very little, however, is knownabout the levels and directions of WSSwithin the developing heart.While rel-atively straightforward to calculate instraight tubes like blood vessels, theextremely tortuous geometry, smalllength scales, and changing bloodcharacteristics invalidate many of thesimplifying theoretical assumptionscommonly applied. Computationalfluid dynamics (CFD) modeling is veryuseful in cardiovascular researchfor elucidating complex fluid motionswhere experimental measurementschemeswould provide only limited in-formation and/or in cases where keyfluidic features are unknown a priori.Previous studies focusing on the adultcarotid artery have shown that geome-try is themost critical feature for accu-rate computational analysis (Birchallet al., 2006), which consequently is the
most difficult to determine in thesesmall organisms. Few CFD studies onembryonic hearts have been conductedto date. Those that do exist generallyapply geometries generated from 3Dreconstructions of histological sections(DeGroff et al., 2003; Groenendijket al., 2005; Liu et al., 2007), which suf-fer from variable geometry in fixationand processing. We recently adaptedmicro-computed tomography (Micro-CT) for generating high-resolutionimages of embryonic heart develop-ment, from which we were able toquantify several features of cardiacmorphogenesis (Butcher et al., 2007b).This approach was recently used toquantify the hemodynamics withinthe developing aortic arches (Wanget al., 2009), but to date a comprehen-sive 3D CFD analysis of intracardiacembryonic heart hemodynamics hasnot been done. The objective of thisstudy, therefore, was to perform adetailed quantitative analysis of thehemodynamics of the developing leftAVregion of the embryonic chick heartthrough the valvulogenic window be-ginning at EMT (HH17) until onset ofcondensation of cushion tissue intothin fibrous leaflets (HH30).
RESULTS
In Vivo Diastolic Blood Flow
and Rheology in the Left AV
Junction
We used high-frequency ultrasoundto measure the AV inflow velocitiesand diameters in embryonic chicksbetween stages HH17 and HH30, theresults of which are shown in Figure1A–D. We found a monotonic increasein peak AV blood velocity from 2.7 62.194 cm/s to 42.86 1.13 cm/s, similarto other published reports (Butcheret al., 2007a). Peak AV diameterincreased from 0.26 6 0.02 to 0.54 60.03 mm. HH17 and HH23 AV velocityprofiles contained two peaks corre-sponding to the passive and active con-traction phases, respectively, confirm-ing our previous results (Butcheret al., 2007a). Only one AV velocitypeak was observed in the AV afterHH23. Temporal cardiac averagedvelocities are 0.89 6 0.16, 2.13 6 0.37,3.086 0.99, 3.856 0.50 cm/s for stagesHH17, HH23, HH27, and HH30,respectively.
24 YALCIN ET AL.
Dev
elop
men
tal D
ynam
ics

Fig. 1. Stage-specific AV orifice diameter (left) and peak velocity (right) as measured by ultrasound. Insets on right are representative originalDoppler velocity recordings. A: HH17. B: HH23. C: HH 27. D: HH 30. Correlation of AV canal velocity with left atrial (LA) input velocity for stages(E) HH27 and (F) HH30.
HEMODYNAMICS OF AV CANAL MORPHOGENESIS 25
Dev
elop
men
tal D
ynam
ics
Generation of Anatomical
Geometries and Atrial Inflow
Boundary Conditions for CFD
Simulations
For these studies, we generated 3Danatomical geometries of the AV canalregion and included the adjoiningatrial and ventricular segments.Microfil polymer casting enabled us tomaintain consistent, physiologicallydilated chamber dimensions thatwere converted to digital volumes viaMicro-CT. These static anatomic geo-metries were used to approximate the‘‘instant’’ of diastolic inflow. CFD simu-lations were then conducted to quan-tify the 3D hemodynamic environmentof this entire AV region, including the
partial atrial inflow and ventricularzones. Simulations required staticinflow and outflow zones, which weapproximated as flat elliptical regionson the partial atrial and ventricularregions. In this way, flow would pro-gress from atrium to ventricle directly.Atrial flowwas not possible tomeasurevia Doppler ultrasound because ofhigh noise and directional changeswithin the contracting chamber, butmidline AV Doppler recordings wereeasily achieved. Since our CFD simu-lations require this input atrial veloc-ity profile as a boundary condition, wechose to iterate CFD simulations mod-ulating the magnitude of a ‘‘fictitious’’atrial inflow profile. Correlationcurves were established with steady-
flow simulations until CFD simulatedmidline AV velocity converged with invivo measurements. This in vivo vali-dated atrial scaling factor was thenapplied to the AV midline velocity pro-file and used as the input for CFD sim-ulations. For HH17 and HH23, backcalculated atrial velocities were foundto be very close to measured in vivo AVvelocities (i.e., scaling factor around1). Therefore, in simulations, meas-ured velocities were used directly forthese stages. For HH27 and HH30,however, scaling factors were 7.50 and7.37, respectively (Fig. 1E and F).
Boundary Layer Estimation
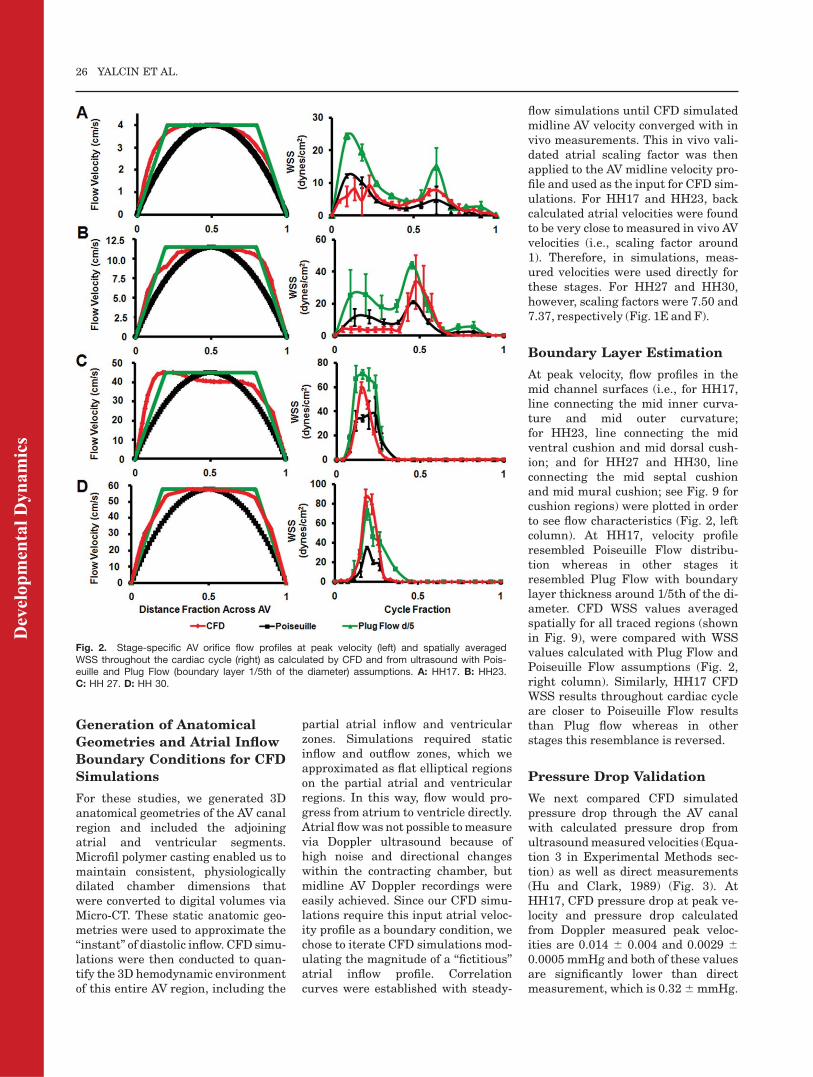
At peak velocity, flow profiles in themid channel surfaces (i.e., for HH17,line connecting the mid inner curva-ture and mid outer curvature;for HH23, line connecting the midventral cushion and mid dorsal cush-ion; and for HH27 and HH30, lineconnecting the mid septal cushionand mid mural cushion; see Fig. 9 forcushion regions) were plotted in orderto see flow characteristics (Fig. 2, leftcolumn). At HH17, velocity profileresembled Poiseuille Flow distribu-tion whereas in other stages itresembled Plug Flow with boundarylayer thickness around 1/5th of the di-ameter. CFD WSS values averagedspatially for all traced regions (shownin Fig. 9), were compared with WSSvalues calculated with Plug Flow andPoiseuille Flow assumptions (Fig. 2,right column). Similarly, HH17 CFDWSS results throughout cardiac cycleare closer to Poiseuille Flow resultsthan Plug flow whereas in otherstages this resemblance is reversed.
Pressure Drop Validation
We next compared CFD simulatedpressure drop through the AV canalwith calculated pressure drop fromultrasoundmeasured velocities (Equa-tion 3 in Experimental Methods sec-tion) as well as direct measurements(Hu and Clark, 1989) (Fig. 3). AtHH17, CFD pressure drop at peak ve-locity and pressure drop calculatedfrom Doppler measured peak veloc-ities are 0.014 6 0.004 and 0.0029 60.0005 mmHg and both of these valuesare significantly lower than directmeasurement, which is 0.326mmHg.
Fig. 2. Stage-specific AV orifice flow profiles at peak velocity (left) and spatially averagedWSS throughout the cardiac cycle (right) as calculated by CFD and from ultrasound with Pois-euille and Plug Flow (boundary layer 1/5th of the diameter) assumptions. A: HH17. B: HH23.C: HH 27. D: HH 30.
26 YALCIN ET AL.
Dev
elop
men
tal D
ynam
ics

At HH23, CFD result compares wellwith direct measurement, 0.38 6 0.11versus 0.40 6 0.03 mmHg whereasDoppler velocity pressure calculationresulted in significantly lower value,0.05 6 0.004 mmHg. At HH27, CFDresult and Doppler velocity pressurecalculation are not significantly differ-ent, 0.61 6 0.027 versus 0.50 6 0.014mmHg (P > 0.05) and these valuescompare well with direct measure-ment 0.56 6 0.03. Similarly at HH30,CFD result and Doppler velocity pres-sure calculation are not significantlydifferent, 0.71 6 0.024 versus 0.69 60.036 mmHg (P > 0.05) and these val-ues compare well with direct measure-ment, 0.82 6 0.03 mmHg. Taken to-gether with the boundary layeranalysis, these results demonstratethat our static wall geometries andinflow approximations of the in vivostate are reasonable.
CFD Simulation Results
Peak WSS increased monotonicallyfrom 19.34 6 4.45 at HH17 to 287.18 667.45 dynes/cm2 at HH30 (Table 1).Similarly, spatially averaged WSS atpeak velocity increased monotonically
from9.176 3.2 to 86.276 8.6 during de-velopment. Spatially and temporallyaveraged stress varied between 3.62 60.32 and 9.11 6 1.06. Peak Reynoldsnumbers for all cases were between 0.816 0.01 and 10.6 6 0.59. Peak Womers-ley numbers were less than 1. Peak vor-ticity increased monotonically from2,576.11 6 283.79 at HH17 to 20,679.66 4,579.13 1/s at HH30. Pressure dropthrough the AV canal increased from0.0146 0.004 to 0.716 0.024mmHg.
HH17 Simulations
At this stage, the embryonic heartresembled a looped tube with an atrialbulge not yet containing defined leftand right segments. CFD simulationsdetermined that velocity streamlineswere essentially parallel through theAV canal during the entire cardiaccycle, demonstrating unidirectionallaminar flow (Fig. 4A). Spatially aver-aged WSS on the inner curvature wascompared with that of the outer curva-ture throughout cardiac cycle (Fig. 4B,see Fig. 9 for traced regions). Simula-tions determined a peakWSS of 13.463.74 dynes/cm2 on inner curvature and7.76 6 3.17 dynes/cm2 on outer curva-
ture. Both of these peak stressesoccurred at peak velocity.
HH23 Simulations
At HH23, the AV canal is now rotated90� to the right such that the cushionsare now in a ventral/dorsal configura-tion. The left and right atrial cavitiesare now well formed but not septatedand the AV cushions protrude signifi-cantly into the canal, creating a ‘‘dog-bone’’-like lumen shape when viewedfrom the atria. In addition, the primi-tive left and right ventricular seg-ments have expanded into respectivecavities. Endocardial trabeculationshave formed and the interventricularseptum has begun to advance crani-ally through the heart. The ventricu-lar cavities expand below the AV cush-ions creating sinus-like spaces.Ultrasound measurements and CFDsimulations show that blood flowdiverges away from the midline of thecanal and concentrates through thelarger ‘‘head’’ regions on the right andleft sides (Fig. 5A). Pulsatile flow sim-ulations show the early inflow velocitystreams in HH23 hearts are laminar.During this diastolic filling phase,blood flow is diverted heterogeneouslyinto the left and right ventricular seg-ments. Simulations showed that pro-portions of blood from the left andright atria were delivered to the ven-tricular segment of the opposite side.This phenomenon was dependent onthe phase of the cardiac cycle. Duringpassive filling (P wave), proportions ofblood from the left atrial segment werediverted into the right ventricular seg-ment, but in active filling (Awave) thistrend was reversed (right into left).Shortly after peak inflow velocity isreached, vortices develop in the sinuscavities about axes perpendicular tothe inflow direction. The locations of
Fig. 3. Change in pressure across the AV canal region.
TABLE 1. CFD Simulation Resultsa
Stage
(HH)
Peak WSS,
(Dynes/cm2)
Spatially Averaged
WSS at Peak
Velocity
(Dynes/cm2)
Spatially and
Temporally
Averaged WSS
(Dynes/cm2)
Peak Reynolds
Number
Peak
Womersley
Number
Peak
Vorticity
(1/s)
Peak Dp
(mmHg)
17 19.34 (4.45) 9.17 (3.2) 3.62 (0.32) 0.81 (0.01) 0.23 (0.005) 2576.11 (283.79) 0.014 (0.004)23 78.33 (37.09) 33.59 (16.84) 6.79 (3.22) 10.60 (0.59) 0.34 (0.001) 9737.44 (2911.19) 0.38 (0.21)27 250.09 (51.49) 59.7 (4.6) 6.1 (0.52) 7.74 (0.37) 0.42 (0.008) 18171.84 (4034.86) 0.61 (0.027)30 287.18 (67.45) 86.27 (8.6) 9.11 (1.061) 10.42 (0.78) 0.41 (0.008) 20679.6 (4579.13) 0.71 (0.024)
aValues in parentheses are standard deviations.
HEMODYNAMICS OF AV CANAL MORPHOGENESIS 27
Dev
elop
men
tal D
ynam
ics

these vortices correlate with the mor-phogenesis of the outflow (ventricula-ris) surface of the AV cushions (shownwith arrows on Fig. 5A). At HH23, theretrograde flow in these vorticesappears to create a downward(towards the ventricle) pointing lip inthese cushions, which becomes morepronounced as development advances.These vortices persist throughout theremainder of the cardiac cycle. Spa-tially averaged WSS on the right andleft mural surfaces and ventral anddorsal midlines were comparedthroughout the cardiac cycle (Fig. 5B;see Fig. 9 for traced regions). Valuesfor ventral and dorsal inflow were notsignificantly different and, therefore,averaged and plotted together. Simi-larly, ventral and dorsal outflow val-ues are plotted together. CFD simula-tions determined that the peak WSSexists on the right mural surface(47.74 dynes/cm2), or where the mus-cular flap valve will develop. At thisstage, however, there are no cushionmasses present. For the left mural sur-face, peakWSS value was 23.12 dynes/cm2. Similarly, for ventral/dorsalinflow surfaces, peak value was 35.75dynes/cm2 and for ventral/dorsal out-flow 27.78 dynes/cm2. Peak stressesoccurred at peak velocity.
HH27 Simulations
At this stage, the two cushions havefused together. While the centralregion of this mass forms a fibrousseptum that joins with the dorsalmesenchymal protrusion and the ven-tricular septum, the lateral edgesbecome remodeled into valves. From3D Micro-CT, the septal cushionextended around the inlet orifice fromabout 7 o’clock on an anterior-poste-rior axis to about 2 o’clock. The septal
Fig. 5.
Fig. 4.
Fig. 4. A: 3D hemodynamic environment inthe AV region, Stage HH 17. B: Spatially aver-aged WSS on the inner curvature versus outercurvature throughout the cardiac cycle. A,atria; V, ventricle.
Fig. 5. A: 3D hemodynamic environment inthe AV region, Stage HH 23. Arrows at latecycle representation show location of vortices.B: Spatially averaged WSS on the right andleft mural surfaces and ventral and dorsalmidlines throughout cardiac cycle. RA, rightatria; LA, left atria; RV, right ventricle; LV, leftventricle.
28 YALCIN ET AL.
Dev
elop
men
tal D
ynam
ics

cushion overlaid the upper left ventri-cle whereas the left mural cushionoccupied the remainder of the annu-lus. The septal cushion was approxi-mately three times larger than themural cushion. CFD simulationsshowed a strong jet through the AVinlet, causing high shear stresses onthe inflow cushion surfaces with flowseparation from the outflow surfaceand myocardial walls (Fig. 6A). Thecushions are shaped so that this jet isslightly ‘‘C’’ shaped, and impacts thefree wall of the left ventricle with alarge degree of vorticity. The bloodrebounds off this wall and spiralsback towards the inlet. Flow in theopposite direction as the originalinjection bolus is, thus, experiencedby the cushion surfaces facing theventricle (represented as negativenumbers). Spatially averaged WSS onthe septal and mural cushion surfaceswere compared throughout the car-diac cycle (Fig. 6B; see Fig. 9 fortraced regions). Values for septal andmural inflow as well as septal andmural outflow were not significantlydifferent, therefore averaged and plot-ted together. We found peak WSS of99.62 dynes/cm2 on the inflow surface,and 19.62 dynes/cm2 on the outflow.Peak shear stresses occurred at peakinflow velocity. After peak velocity,spiraling flow occurs at the outflowsurfaces of the cushions and persiststhroughout the rest of the cardiaccycle. This results in a ‘‘negative’’shear stress that is opposite the origi-nal inflow direction.
HH30 Simulations
The AV cushions have condensed sig-nificantly but not completely, closer toresembling leaflets. The ‘‘C’’ shapeand downward pointing of the freeedge of the septal leaflet was morepronounced. The left ventricular
Fig. 6.
Fig. 7.
Fig. 6. A: 3D hemodynamic environment inthe AV region, Stage HH 27. B: Spatially aver-aged WSS on the inflow and outflow surfacesthroughout cardiac cycle. LA, left atria; LV, leftventricle.
Fig. 7. A: 3D hemodynamic environment inthe AV region,Stage HH 30. B: Spatially aver-aged WSS on the inflow and outflow surfacesthroughout cardiac cycle. LA, left atria; LV, leftventricle.
HEMODYNAMICS OF AV CANAL MORPHOGENESIS 29
Dev
elop
men
tal D
ynam
ics

outlet is now contiguous with the leftventricle, extending from underneaththe septal/anterior leaflet. Unlike pre-vious stages where the ventriclelumen shape was wider at the bottom,the ventricle at HH30 was wider atthe top, which is typical of the matureshape. The orifice area between theleaflets was significantly larger thanat HH27, but the inflow velocity wasalso much greater. The more pro-nounced ‘‘C’’ shape of the septal leafletat this stage created a similarlyshaped jet of blood during the activephase of inflow that strikes the leftfree wall of the left ventricle (Fig. 7A).This again caused blood to spiral backtowards the top of the ventricle. Spa-tially averaged shear stresses on theseptal and mural cushions were com-pared throughout the cardiac cycle(Fig. 7B; see Fig. 9 for traced regions).We found peak WSS 148.25 dynes/cm2
on the inflow surface, and 24.3 dynes/cm2 on the outflow, which are bothhigher than values at HH27. Peakstresses occurred at peak velocity. Af-ter peak velocity, spiraling flow alongthe outflow surface of the cushionsresults in a ‘‘negative’’ shear stresswith respect to the inflow direction.This flow pattern persists throughoutthe rest of the cardiac cycle.
DISCUSSION
Hemodynamics is an important epige-netic factor driving cardiogenesis andalterations in normal blood flow arepostulated as a major source for con-genital heart defects (CHD). ManyCHD arise relatively late in cardiogen-esis, predominantly through malfor-mation of the valvuloseptal structures(Combs and Yutzey, 2009). Fetal car-diac intervention in utero has thepotential to alleviate altered hemody-namic signaling to potentially rescueserious defects at birth (Kohl, 2002;Tworetzky et al., 2004). Recent studieshave suggested that embryonic endo-cardial and endothelial phenotype issensitive to hemodynamic changes invivo (Groenendijk et al., 2005; Vermotet al., 2009), but without a rigorousquantification of local changes inmechanobiologically relevant hemody-namic indices (e.g., wall shear stress)our ability to translate these observa-tions into deeper understanding andclinical therapies remains limited.
Direct measurement of shear stressinside extremely small, rapidly mov-ing embryonic hearts is currentlyimpossible for much of cardiac devel-opment. CFD simulation is a powerfulalternative strategy to estimate localhemodynamic parameters and predicttheir changes to altered loads, but ne-cessitate anatomically accurate geo-metries, physiological blood rheology,and dynamic flow boundary condi-tions. Before the current study, simu-lations were conducted on either sim-plified 2D wall geometries (Biechleret al., 2010) or reconstructions fromthin sections and animal hearts(DeGroff et al., 2003; Groenendijket al., 2005; Liu et al., 2007). Theseapproaches lack the ability to rendercomplex tortuous anatomy often pres-ent in the embryonic valve regions,and as a result the hemodynamic pre-dictions in critically important loca-tions can be far different from thenative state. More direct analysis ofshear stress in early embryonic heartsis possible via obtaining flow profileswith PIV techniques (Vennemannet al., 2006). Flow and stress fieldswere quantified in the outflow tract ofan HH17 embryo in a recent study(Poelma et al., 2010). However, opticalinaccessibility prevents extension ofthis technique to older embryos. We pi-oneered the use of Micro-CT to createhigh-resolution (�10 mm) anatomical3D geometries in chick (Butcher et al.,2007b). This technique was recentlyadapted in a CFD study on aortic archmorphogenesis of chick embryos(Wang et al., 2009) and was also usedin the current study. Similar to theseprior CFD simulation studies, weapproximated the ventricular inflow(diastolic) phase of the cardiac cyclewith static (non-moving) wall geome-try. Blood velocity is near zero foralmost all of the cardiac cycle outsideof the initial inflow jet, which we deter-mined was simultaneous with mini-mal change in AV lumen diameter, to-gether suggesting moving boundariesare not a major factor for this case. Ingeneral, anatomical CFD simulationscreate a conservative upper bound ofthe true hemodynamic flow because‘‘solid’’ walls and no-slip boundariesthat tend to increase wall shearstresses don’t exist naturally. Moreadvanced Fluid-Structure Interaction(FSI) simulation would be able to han-
dle more complexity, but requiresdetailed quantification of the wall ge-ometry and local tissue mechanics.New techniques are coming online toenable these pursuits (Degenhardtet al., 2010; Butcher et al., 2007b),but to date these dynamic featureshave not been measured. In this study,however, we rigorously iterated oursimulations with respect to direct invivo flow measurements, whichresulted in closely matching solutionswhere comparable that justify theseapproximations.Viscosity is an important parameter
for CFD models on blood flow. Forearly stages of development (beforeHH17 for chick embryos), effect of redblood cells on viscosity is negligibleand blood can be accepted as Newto-nian. For later stages, however, viscos-ity will depend on the shear rate andblood needs to be taken as Non-Newto-nian (Hierck et al., 2008). In the cur-rent study, Non-Newtonian blood flowassumption is incorporated by formu-lating the blood flow viscosity withshear rate (Fig. 8) based on previousstudies on avian blood viscosity(Rychter et al., 1955; Usami et al.,1970). Peak Reynolds Numbers for allthe stages were less than 11 (Table 1),which confirms laminar flow with sig-nificant contribution of viscous effects(Stokes behavior). Peak WomersleyNumbers were less than 1.A critically important and often
neglected final step in biological CFDsimulations is to validate model pre-dictions with measured data. In thisstudy, we compared CFD WSS valueswith values calculated from direct invivo flowmeasurements.We comparedthe standard Poiseuille flow assump-tion with various Plug Flow boundarylayer approximations (Fig. 2). For allthe analyzed stages, CFD simulatedresults are quantitatively similar tomore directly calculated stresses. AtHH17, simulation results are closer toPoiseuille values whereas in otherstages they are closer to Plug Flow val-ues. AV orifice flow profile at HH17resembled the parabolic Poiseuilleprofile (consistent with Newtonianbehavior) whereas in later stages theprofile resembled Plug Flow profiles.We also compared pressure drops inAV canal from simulations with directmeasurements and values calculatedfrom ultrasound-generated velocities
30 YALCIN ET AL.
Dev
elop
men
tal D
ynam
ics

(Fig. 3). All 3 values compare well forlater stages but not for earlier stages.One potential explanation for the dis-crepancy at HH17 may be that an ele-vated hydrostatic pressure exists frominterstitial tissue motions and flows(Forouhar et al., 2006; Butcher et al.,2007a), but this is very challenging toindependently calculate and experi-mentally decouple. Nevertheless, webelieve this innovative combination of
anatomically precise wall geometries,stage-dependent blood rheology, anditerative feedback with in vivo mea-surement create the best representa-tion of physiological embryonic AVhemodynamics to date.
Our results show that for HH17 flowis unidirectional and laminar and theinner curvature is exposed to largerstresses than outer curvaturethroughout the cycle (Fig. 4). This
result is consistent with previous stud-ies (Hierck et al., 2008). The inner andouter curvature zones are importantmorphogenetic regions, the inner forcardiac jelly expansion and cushionremodeling, while the outer is for ven-tricular trabeculation. These resultssuggest that low wall shear stress mayhelp promote regression of cardiacjelly and the formation of myocardialtrabeculations. Higher wall shearstress, on the other hand, may pro-mote cardiac jelly expansion and EMT.A mechanistic link between hemody-namics and EMT so far has been diffi-cult to test experimentally. Theexcised avian embryonic heart canloop without blood flow (Manning andMcLachlan, 1990), and we haveobserved in similar experiments in-vaded mesenchyme in the AV and out-flow valvulogenic regions (J.T.Butcher, unpublished results). Recentstudies in zebrafish show that revers-ing flows through temperature orheart rate modification promote endo-cardial ring formation and invagina-tion, while embryo culture with dosesof myocardial toxins inhibit (Vermotet al., 2009). Mechanistic understand-ing will require in vitro experimenta-tion where hemodynamic parameterscan be isolated from myocardial sig-naling. While outside the scope of thisstudy, our data provides a quantitativefoundation for these experiments.AV cushion expansion at HH23
results in both elevated inflow endo-cardial surface shear stress and recir-culating flow inferior to the cushions(Fig. 5). Shear stresses on the ventric-ular walls are now significantly less
Fig. 8. Stage-dependent blood rheology. A: Hematocrit amounts for stages (adapted from Rychter et al., 1955). B: Hematocrit-dependent blooddensity (adapted from Usami et al., 1970). C: Nonlinear power law relationship for shear rate–dependent viscosity. Dots represent correlations gen-erated based on hematocrit amounts and lines are based on embryonic stages.
Fig. 9. Cushion regions where the WSS were traced (shown with dotted lines). Inflow segmentsare blue, outflow are red for separated regions. Trace colors match with plot colors for regionsin Figures 4–7. At HH24, dorsal cushion is on the other side of the geometry. A, atria; V, ventri-cle; L, left; R, right.
HEMODYNAMICS OF AV CANAL MORPHOGENESIS 31
Dev
elop
men
tal D
ynam
ics

than the cushion surface. Interest-ingly, the right mural cushion surfaceis exposed to the highest stresses andthe leftmural surface the lowest. Sincethe right side becomes a muscular flapvalve while the left remodels into a fi-brous leaflet, these results suggestshear stress thresholds may precedeand in part specify this change. Inter-estingly, Sedmera et al. using a leftatrial ligation (LAL) model showedthat restricting inflow creates thick-ened, poorly remodeled cushions inboth the left and right AV valves, whileconotruncal banding (CTB) producedhypercontracted left AV valves (Sed-mera et al., 1999). Our results suggestthat LAL would reduce AV shearstress on the left side and increase onthe right side, while CTB wouldincrease wall shear stress on bothsides of the AV canal. Furthermore,alterations in preload and/or afterloadhemodynamics will give differentshear stress profiles difficult to predicta priori, though they can be easilysimulated computationally. Well-con-trolled in vitro experimental systemsthat can isolate and test individual he-modynamic parameters on embryonicheart explants will be required toprove causality (Goodwin et al., 2005;Butcher and Nerem, 2006). The spira-ling vortex zones initiated at HH23and persisting through HH30 precede,and magnitudes correlate with, ven-tricular lumen expansion, which sug-gests that this hemodynamic indexmay independently regulate this mor-phogenic process. The inflow surface ofthe AV cushion is consistently exposedto significantly higher shear stressthan the outflow surface fromHH23 toHH30, and the flow patterns are con-sistent but different. They suggestthat high unidirectional shear stressmay help promote cushion extensionin the direction of flow (down into theventricle), while lower recirculatingflows encourage a sculpting processthat separates the primitive valvefrom the junctional myocardium. Asimilar process was suggested over 25years ago by Colvee and Hurle (1983)for the outflow cushions, but until thisstudy, had not been quantified for anyembryonic valve. Complementing thisflow pattern was the ‘‘C’’-shaped AVorifice shape we identified, whichhelps promote asymmetric filling ofthe ventricle. Our simulations suggest
that the ricochet of blood off the freeLV wall during diastolic filling helpsconserve fluid momentum and cardiacefficiency because the direction of spi-raling is such that fluid mass is al-ready moving in the direction it needsto go to reach the outflow tract of theheart. A similar process has been iden-tified in human heart function (Kilneret al., 2000), but this is the first identi-fication and measurement in an em-bryonic system. The increasing AVcanal asymmetry over developmentreported in this study (HH23–HH30)suggests that this is a previouslyunrecognized and important aspect ofcardiac functional maturation.
In conclusion, this study estab-lishes quantitative 3D mappings ofbiologically important hemodynamicindices within the developing avianatrioventricular canal. We identifyseveral previously unrecognized cor-relations between shear stress, vortic-ity, and cardiac morphogenesis thatsuggest they may be important guid-ing factors. It is, therefore, likely thatslight alterations in these valuescould have profound effects on mor-phogenesis. Similarly, restoring nor-mal hemodynamic signaling may be apromising strategy for rescuing con-genital malformations. It will beessential to develop animal model sys-tems that can precisely alter local he-modynamic signaling and comple-mentary in vitro test systems to morefully study these new research direc-tions. Our results establish normalhemodynamic benchmarks that cannow be used in bioreactor studies tosimulate AV inflow conditions to con-nect hemodynamic and molecularchanges or to drive the maturation ofengineered embryonic cardiac tissues.
EXPERIMENTAL
PROCEDURES
Microfil Cast Creation
We created casts of embryonic heartsby perfusing Microfil (Flow-Tech, Car-ver, MA) into microvascular lumensthrough drawn glass capillary micro-needles (Butcher et al., 2007b). In thistechnique, Microfil solution polymer-izes into a cast, preserving the cardiacchambers at physiologically dilatedvolume condition with open valves.
In Vivo Hemodynamic
Measurements
Wemeasured the inflow velocity to theAV canal using B-mode-guided Dopp-ler ultrasound (Vevo770, Visualsonics,Inc., Toronto, Candad). B-mode imag-ing was also used to simultaneouslymeasure the time varying diameter ofthe AV canal at the midline of the clo-sure region (Butcher et al., 2007a;McQuinn et al., 2007). Embryos cul-tured outside their egg shells wereused for these measurements. Thisculture technique is based on incubat-ing embryos for approximately 2.5days (HH16–17), and cracking eggsinto an ex-ovo culture system slightlymodified from those previouslydescribed (Auerbach et al., 1974;Butcher et al., 2007a; McQuinn et al.,2007). Eggs were aseptically trans-ferred to a polyurethane membrane(Saran Wrap) affixed circumferen-tially inside a plastic cup partiallyfilled with sterile water. Three-quar-ters filled 9-oz plastic cups with a topdiameter of 8 cm were used. Embryoswere cultured outside of the shell forup to 4 additional days (HH30) ina modified portable environmentalchamber (1602N Thermal Air, GQFManufacturing Co, Savannah, GA).The culturing technique can be seen ina video article (Yalcin et al., 2010).Shell-less cultured embryos weretransferred to the ultrasound systemand a small meniscus of warmedTyrode’s solution provided aqueouscontact between the ultrasound probeand the embryo. The probe (30 or 55MHz) was positioned in 3D spaceusing micromanipulators and clampedat the appropriate angle for imaging.After imaging, the embryos weretransferred back to the incubator andallowed to recover. In this fashion, wewere able to serially image theembryos for up to 6.5 days.
Blood Rheology
The density and shear thinning behav-ior of blood are significantly dependenton hematocrit, which varies betweenstages of embryonic development andinvalidates Newtonian flow assump-tions. Previous studies have quanti-fied the rheology of avian blood (Usamiet al., 1970) and embryonic chick blood(Rychter et al., 1955) cell content,respectively. We used this data to
32 YALCIN ET AL.
Dev
elop
men
tal D
ynam
ics

formulate a Non-Newtonian powerlaw representation of blood viscosity,with the coefficients determined foreach stage of interest (Fig. 8). We usedthe viscosity of water (0.001 Pa-s) as alower limit and (10 Pa-s) as an upperlimit.
Micro-CT Imaging and
Reconstruction
Microfil perfused embryonic bodieswere dissected away from the vitellinenetwork and placed in 3 ml tubes filledwith PBS. The embryos were thenscanned via Micro-CT (Scanco, Inc.,Wayne, PA) at 10 mm voxel resolution(approximately 400 slices/embryo). Aninitial scout image was generated atlow resolution to confine the high-reso-lution scan to just the heart region.The datasets were reconstructed into3D geometry using internal Scancosoftware and the cardiac anatomy seg-mented as previously described andexported as STL files (Butcher et al.,2007b). Reconstructions were thendown-sampled and smoothed to 5,000faces using AMIRA, which created amanageable file size (<10MB) withoutsacrificing anatomical precision. Fileswere then converted to IGES usingGeomagic (Geomagic, Inc., ResearchTriangle Park, NC) and imported intoGAMBIT (ANSYS Inc., Canonsburg,PA). The atrium, ventricle, and AVcanal lumen regions were isolated withthe left side chosen for post-septatedstages (HH27 onwards). The atriumwas virtually sectioned approximately50% through its height to simulateinflow conditions. The apex region ofthe ventricle was also sectioned to sim-ulate filling. For HH23, both left andright inlets and outlets were createdfrom the anatomies.
Simulations
The geometries were then meshedusing GAMBIT varying both surfaceand volume grids resulting in den-sities between 50,000 and 500,000 tet-rahedral elements. Meshed AV anato-mies were then imported into a CFDsolver developed for second-order dou-ble precision 3D pressure driven flowsusing complex subject specific flows(ANSYS 12 FLUENT, ANSYS Inc.).Auxiliary simulations were conductedto determine Mesh-independent solu-
tions, which were obtained with atmost 300,000 elements for all stagesprocessed, henceforth all simulationswere conducted with 300,000 tetrahe-dral elements. Pulsatile CFD simula-tions were then initiated using inletflow conditions from the Dopplermeasurements and stage-dependentblood rheology. Between 30 and 50time steps were used for each simula-tion and up to 1,000 iterations pertime step were utilized. Convergencewas enforced by reducing the residualof the continuity equation, as well asx-, y-, and z-momentum to 10-6 for alltime steps. Simulations were contin-ued through multiple cardiac cyclesuntil solutions were periodic for eachtime step. Solutions completed in up to48 hr (earlier stages converged in lessthan 2 hr) on a dual-core (3 GHz) work-station with 3 GB ram.
In Vivo WSS and Pressure
Drop Approximation
Boundary layer flow fields in rapidlymoving walls in conditions such asearly chick heart are extremely chal-lenging to determine. CFD simula-tions of AV inflow with non-movingboundaries were compared to in vivoresults using Doppler and B-modegenerated velocity profiles and dy-namic 2D wall geometry, respectively.At each phase of the cardiac cycle, AVcanal diameter and blood velocitywere obtained at the center of thecushion apposition zone. We then gen-erated WSS approximations usingstandard Poiseuille Flow assumptionsas well as boundary layer models(Plug Flow) (Wilcox, 1997).
For Plug Flow, the following shearstress formula was used;
t ¼ mdu
dyðWilcox;1997Þ (1)
where t is shear stress, m is viscosity,and du/dy is differentiation of the axialflow velocity at the wall with respect tothe axis pointing channel center. Toobtain boundary layer thicknesses, weanalyzed the shape of the flow profilesat the mid-valve surface at peak veloc-ity in our CFD simulations andassumed that this profile is not chang-ing throughout the cycle. Non-Newto-nian viscosity was applied using thepower law generated from the rheol-ogy curves (Fig. 8).
For Poiseuille Flow, the followingshear stress formula was used;
t ¼ 4:m:um
dðWilcox; 1997Þ (2)
Here um is the mean flow velocity(from Doppler recordings) and d isthe diameter (from B mode record-ings). Viscosity here was taken as0.001 Pa-s.To calculate pressure difference
across the channel, the following for-mula was used;
dP ¼ r
2ðu2
2 � u12Þ ðDeGroff ;2002Þ
(3)
where P is pressure, r is density, andu is velocity. Here u2 is the Dopplermeasured velocity and u1 is bloodvelocity downstream, which wasassumed to be 0.
Regions to Trace Wall
Shear Stress
Figure 9 shows representative geome-tries where we traced WSS at eachtime point in the cardiac cycle. AtHH17, shear stress was traced in theinner curvature and outer curvature.At HH23, we traced right mural sur-face, leftmural surface, midline of ven-tral endocardial cushion, and midlineof dorsal endocardial cushion. Mid-lines of endocardial cushions were di-vided into inflow and outflow segmentswhere outflow region is where thecushion bends back towards the ven-tricular wall. At HH27 and HH30, wetraced left mural and left septal cush-ion surfaces. These cushions were sep-arated into inflow and outflow seg-ments where inflow surfaces wereexposed to jet-like flows and outflowsurfaces to circulatory flows.
Endpoints and Statistical
Analysis
Morphological changes and blood flowstreams were compared qualitativelyand quantified where appropriate.Data were summarized in both cycle-averaged and peak values for eachstage. Standard deviations were givenin reporting results. Hemodynamicvariables (WSS, Reynolds Number,Womersley Number, pressure, etc.)for each simulation were comparedusing Analysis of Variance (ANOVA)
HEMODYNAMICS OF AV CANAL MORPHOGENESIS 33
Dev
elop
men
tal D
ynam
ics

followed by modified t-test with P <0.05 denoting significance.
ACKNOWLEDGMENTSThis work is dedicated to the memoryof Joshua Spruill (1971–2008), whosecreativity and technical assistance (inaddition to Tom Trusk) was instru-mental in initiating this project at theMedical University of South Carolina.The research was supported in part bya grant from the AmericanHeart Asso-ciation (0830384N, to J.T.B).
REFERENCES
Auerbach R, Kubai L, Knighton D, Folk-man J. 1974. A simple procedure forthe long-term cultivation of chickenembryos. Dev Biol 41:391–394.
Biechler SV, Potts JD, Yost MJ, Junor L,Goodwin RL, Weidner JW. 2010. Mathe-matical modeling of flow-generatedforces in an in vitro system of cardiacvalve development. Ann Biomed Eng38:109–117.
Birchall D, Zaman A, Hacker J, Davies G,Mendelow D. 2006. Analysis of haemo-dynamic disturbance in the atheroscler-otic carotid artery using computationalfluid dynamics. Eur Radiol 16:1074–1083.
Butcher JT, Markwald RR. 2007. Valvulo-genesis: the moving target. Phil TransR Soc Lond B Biol Sci 362:1489–1503.
Butcher JT, Nerem RM. 2006. Valvularendothelial cells regulate the phenotypeof interstitial cells in co-culture: effectsof steady shear stress. Tissue Eng 12:905–915.
Butcher JT, Tressel S, Johnson T, TurnerD, Sorescu G, Jo H, Nerem RM. 2006.Transcriptional profiles of valvular andvascular endothelial cells reveal pheno-typic differences: Influence of shearstress. Arterioscler Thromb Vasc Biol26:69–77.
Butcher JT, McQuinn TC, Sedmera D,Turner D, Markwald RR. 2007a. Transi-tions in early embryonic atrioventricu-lar valvular function correspond withchanges in cushion biomechanics thatare predictable by tissue composition.Circ Res 100:1503–1511.
Butcher JT, Sedmera D, Guldberg RE,Markwald RR. 2007b. Quantitative vol-umetric analysis of cardiac morphogen-esis assessed through micro-computedtomography. Dev Dyn 236:802–809.
Clark EB, Hu N. 1982. Developmental he-modynamic changes in the chickembryo from stage 18 to 27. Circ Res51:810–815.
Colvee E, Hurle JM. 1983. Malformationsof the semilunar valves produced inchick embryos by mechanical interfer-ence with cardiogenesis. An experimen-tal approach to the role of hemodynamicsin valvular development. Anat Embryol(Berl) 168:59–71.
Combs MD, Yutzey KE. 2009. Heart valvedevelopment: Regulatory networks indevelopment and disease. Circ Res 105:408–421.
Cruz MD, Markward R, editors. 1998.Living morphogenesis of the heart. Bos-ton: Birkhauser.
Culver JC, Dickinson ME. 2010. Theeffects of hemodynamic force on embry-onic development. Microcirculation 17:164–178.
Degenhardt K, Wright AC, Horng D, Pad-manabhan A, Epstein JA. 2010. Rapid3D phenotyping of cardiovascular devel-opment in mouse embryos by micro-CTwith iodine staining. Circ CardiovascImag 3:314–322.
DeGroff CG. 2002. Doppler echocardiogra-phy. Pediatr Cardiol 23:307–333.
DeGroff CG, Thornburg BL, PentecostJO, Thornburg KL, Gharib M, SahnDJ, Baptista A. 2003. Flow in the earlyembryonic human heart: a numericalstudy. Pediatr Cardiol 24:375–380.
Farcas MA, Rouleau L, Fraser R, LeaskRL. 2009. The development of 3-D, invitro, endothelial culture models for thestudy of coronary artery disease.Biomed Eng Online 8:30.
Forouhar AS, Liebling M, Hickerson A,Nasiraei-Moghaddam A, Tsai HJ, HoveJR, Fraser SE, Dickinson ME, GharibM. 2006. The embryonic vertebrateheart tube is a dynamic suction pump.Science 312:751–753.
Girard PR, Nerem RM. 1993. Endothelialcell signaling and cytoskeletal changesin response to shear stress. Front MedBiol Eng 5:31–36.
Goodwin RL, Nesbitt T, Price RL, WellsJC, Yost MJ, Potts JD. 2005. Three-dimensional model system of valvulo-genesis. Dev Dyn 233:122–129.
Groenendijk BC, Hierck BP, Vrolijk J,Baiker M, Pourquie MJ, Gittenberger-de Groot AC, Poelmann RE. 2005.Changes in shear stress-related geneexpression after experimentally alteredvenous return in the chicken embryo.Circ Res 96:1291–1298.
Hierck BP, Van der Heiden K, Poelma C,Westerweel J, Poelmann RE. 2008. Fluidshear stress and inner curvature remod-eling of the embryonic heart. choosingthe right lane!. SciWorld J 8:212–222.
Hogers B, DeRuiter MC, Baasten AM, Git-tenberger-de Groot AC, Poelmann RE.1995. Intracardiac blood flow patternsrelated to the yolk sac circulation of thechick embryo. Circ Res 76:871–877.
Hove JR, Koster RW, Forouhar AS, Ace-vedo-Bolton G, Fraser SE, Gharib M.2003. Intracardiac fluid forces are anessential epigenetic factor for embry-onic cardiogenesis. Nature 421:172–177.
Hu N, Clark EB. 1989. Hemodynamics ofthe stage 12 to stage 29 chick embryo.Circ Res 65:1665–1670.
Hu N, Christensen DA, Agrawal AK,Beaumont C, Clark EB, Hawkins JA.2009. Dependence of aortic arch mor-phogenesis on intracardiac blood flow inthe left atrial ligated chick embryo.Anat Rec (Hoboken) 292:652–660.
Jaffee OC. 1965. Hemodynamic factors inthe development of the chick embryoheart. Anat Rec 151:69–75.
Jenkins MW, Chughtai OQ, BasavanhallyAN, Watanabe M, Rollins AM. 2007. Invivo gated 4D imaging of the embryonicheart using optical coherence tomogra-phy. J Biomed Opt 12:030505.
Kilner PJ, Yang GZ, Wilkes AJ, Mohiad-din RH, Firmin DN, Yacoub MH. 2000.Asymmetric redirection of flow throughthe heart. Nature 404:759–761.
Kohl T. 2002. Fetal echocardiography:New grounds to explore during fetalcardiac intervention. Pediatr Cardiol23:334–346.
Liebling M, Forouhar AS, WolleschenskyR, Zimmermann B, Ankerhold R,Fraser SE, Gharib M, Dickinson ME.2006. Rapid three-dimensional imagingand analysis of the beating embryonicheart reveals functional changes duringdevelopment. Dev Dyn 235:2940–2948.
Liu A, Rugonyia S, Pentecostb. J.O., Thorn-burgb KL. 2007. Finite element modelingof blood flow-induced mechanical forcesin the outflow tract of chick embryonichearts. Comput Struct 85:727–738.
Manning A, McLachian JC. 1990. Loopingof chick embryo hearts in vitro. J Anat168:257–263.
McQuinn TC, Bratoeva M, Dealmeida A,Remond M, Thompson RP, Sedmera D.2007. High-frequency ultrasonographicimaging of avian cardiovascular devel-opment. Dev Dyn 236:3503–3513.
Miller CE, Vanni MA, Taber LA, KellerBB. 1997. Passive stress-strain meas-urements in the stage-16 and stage-18embryonic chick heart. J Biomech Eng119:445–451.
Patten BM, Kramer TC, Barry A. 1948.Valvular action in the embryonic chickheart by localized apposition of endocar-dial masses. Anat Rec 102:299–311.
Phoon CK, Ji RP, Aristizabal O, WorradDM, Zhou B, Baldwin HS, TurnbullDH. 2004. Embryonic heart failure inNFATc1-/- mice: novel mechanisticinsights from in utero ultrasound bio-microscopy. Circ Res 95:92–99.
Poelma C, Van der Heiden K, Hierck BP,Poelmann RE, Westerweel J. 2010.Measurements of the wall shear stressdistribution in the outflow tract of anembryonic chicken heart. J R Soc Inter-face 7:91–103.
Reckova M, Rosengarten C, deAlmeida A,Stanley CP, Wessels A, Gourdie RG,Thompson RP, Sedmera D. 2003. Hemo-dynamics is a key epigenetic factor indevelopment of the cardiac conductionsystem. Circ Res 93:77–85.
Rychter Z, Kopecky M, Lemez L. 1955. Amicromethod for determination of thecirculating blood volume in chickembryos. Nature 175:1126–1127.
Savard M, Swan HJC, Kirklin JW, WoodEW. 1960. Hemodynamic alterations asso-ciated with ventricular septal defects.Congenital Heart Disease. Bass AD, MoeGK, editors. American Association for theAdvancement of Science publication num-ber 63.
34 YALCIN ET AL.
Dev
elop
men
tal D
ynam
ics

Sedmera D, Pexieder T, Rychterova V, HuN, Clark EB. 1999. Remodeling of chickembryonic ventricular myoarchitectureunder experimentally changed loadingconditions. Anat Rec 254:238–252.
Taber LA, Hu N, Pexieder T, Clark EB,Keller BB. 1993. Residual strain in theventricle of the stage 16–24 chickembryo. Circ Res 72:455–462.
Tworetzky W, Wilkins-Haug L, JenningsRW, van der Velde ME, Marshall AC,Marx GR, Colan SD, Benson CB, LockJE, Perry SB. 2004. Balloon dilation ofsevere aortic stenosis in the fetus:Potential for prevention of hypoplasticleft heart syndrome: Candidate selec-tion, technique, and results of successfulintervention. Circulation 110:2125–2131.
Usami S, Magazinovic V, Chien S, Gre-gersen MI. 1970. Viscosity of turkeyblood: rheology of nucleated erythro-cytes. Microvasc Res 2:489–499.
Vennemann P, Kiger KT, Lindken R,Groenendijk BC, Stekelenburg-de VosS, ten Hagen TL, Ursem NT, PoelmannRE, Westerweel J, Hierck BP. 2006. Invivo micro particle image velocimetrymeasurements of blood-plasma in theembryonic avian heart. J Biomech 39:1191–1200.
Vermot J, Forouhar AS, Liebling M, WuD, Plummer D, Gharib M, Fraser SE.2009. Reversing blood flows act throughklf2a to ensure normal valvulogenesisin the developing heart. PLoS Biol 7:e1000246.
Wang Y, Dur O, Patrick MJ, Tinney JP,Tobita K, Keller BB, Pekkan K. 2009.Aortic arch morphogenesis and flowmodeling in the chick embryo. AnnBiomed Eng 37:1069–1081.
Wilcox DC. 1997. Basic fluid mechanics.La Caftada, CA: DCW Industries, Inc.
Yalcin H, Shekhar A, Rane AA, ButcherJT. 2010. An ex-ovo chicken embryoculture system suitable for imaging andmicrosurgery applications. J Vis Exp 44,URL: http://www.jove.com/index/Details.stp?ID=2154 [Accessed 30 November2010].
Yoshida H, Manasek F, Arcilla RA. 1983.Intracardiac flow patterns in early em-bryonic life. A reexamination. Circ Res53:363–371.
HEMODYNAMICS OF AV CANAL MORPHOGENESIS 35
Dev
elop
men
tal D
ynam
ics