heizer om10 ch06-managing quality
DESCRIPTION
TRANSCRIPT

10/16/2010
1
66 Managing QualityManaging Quality
6 - 1© 2011 Pearson Education, Inc. publishing as Prentice Hall
PowerPoint presentation to accompany PowerPoint presentation to accompany Heizer and Render Heizer and Render Operations Management, 10e Operations Management, 10e Principles of Operations Management, 8ePrinciples of Operations Management, 8e
PowerPoint slides by Jeff Heyl
OutlineOutlineGlobal Company Profile: Arnold Palmer HospitalQuality and StrategyDefining Quality
6 - 2© 2011 Pearson Education, Inc. publishing as Prentice Hall
g Q yImplications of QualityMalcolm Baldrige National Quality AwardCost of Quality (COQ)Ethics and Quality Management
Outline Outline –– ContinuedContinued
International Quality StandardsISO 9000ISO14000
6 - 3© 2011 Pearson Education, Inc. publishing as Prentice Hall
Outline Outline –– ContinuedContinued
Total Quality ManagementContinuous ImprovementSix Sigma
6 - 4© 2011 Pearson Education, Inc. publishing as Prentice Hall
Employee EmpowermentBenchmarkingJust-in-Time (JIT)Taguchi ConceptsKnowledge of TQM Tools
Outline Outline –– ContinuedContinued
Tools of TQMCheck SheetsScatter Diagrams
6 - 5© 2011 Pearson Education, Inc. publishing as Prentice Hall
Cause-and-Effect DiagramsPareto ChartsFlowchartsHistogramsStatistical Process Control (SPC)
Outline Outline –– ContinuedContinued
The Role of InspectionWhen and Where to InspectSource Inspection
6 - 6© 2011 Pearson Education, Inc. publishing as Prentice Hall
pService Industry InspectionInspection of Attributes versus Variables
TQM in Services

10/16/2010
2
Learning ObjectivesLearning ObjectivesWhen you complete this chapter you When you complete this chapter you should be able to:should be able to:
1. Define quality and TQM2. Describe the ISO international
quality standards
6 - 7© 2011 Pearson Education, Inc. publishing as Prentice Hall
quality standards3. Explain Six Sigma4. Explain how benchmarking is used 5. Explain quality robust products and
Taguchi concepts6. Use the seven tools of TQM
Managing Quality Provides a Managing Quality Provides a Competitive AdvantageCompetitive Advantage
Arnold Palmer HospitalDeliver over 16,000 babies annuallyVirtually every type of quality tool is
6 - 8© 2011 Pearson Education, Inc. publishing as Prentice Hall
Virtually every type of quality tool is employed
Continuous improvementEmployee empowermentBenchmarkingJust-in-timeQuality tools
Quality and StrategyQuality and Strategy
An operations manager’s objective An operations manager’s objective is to build a total quality is to build a total quality
management system that identifies management system that identifies
6 - 9© 2011 Pearson Education, Inc. publishing as Prentice Hall
g yg yand satisfies customer needsand satisfies customer needs
Quality and StrategyQuality and Strategy
Managing quality supports differentiation, low cost, and response strategies
6 - 10© 2011 Pearson Education, Inc. publishing as Prentice Hall
Quality helps firms increase sales and reduce costsBuilding a quality organization is a demanding task
Two Ways Quality Two Ways Quality Improves ProfitabilityImproves Profitability
Improved responseFlexible pricing
Sales Gains via
6 - 11© 2011 Pearson Education, Inc. publishing as Prentice Hall
Improved Quality
Increased Profits
Increased productivityLower rework and scrap costsLower warranty costs
Reduced Costs via
Improved reputation
Figure 6.1
The Flow of ActivitiesThe Flow of ActivitiesOrganizational Practices
Leadership, Mission statement, Effective operating procedures, Staff support, TrainingYields: What is important and what is to be
accomplishedQuality Principles
Customer focus, Continuous improvement, Benchmarking, Just in time Tools of TQM
6 - 12© 2011 Pearson Education, Inc. publishing as Prentice Hall
Just-in-time, Tools of TQMYields: How to do what is important and to be
accomplishedEmployee Fulfillment
Empowerment, Organizational commitmentYields: Employee attitudes that can accomplish
what is importantCustomer Satisfaction
Winning orders, Repeat customersYields: An effective organization with
a competitive advantageFigure 6.2

10/16/2010
3
Defining QualityDefining Quality
The totality of features and characteristics of a product or
6 - 13© 2011 Pearson Education, Inc. publishing as Prentice Hall
service that bears on its ability to satisfy stated or implied needs
American Society for Quality
Different ViewsDifferent Views
UserUser--basedbased: better performance, more featuresManufacturingManufacturing--basedbased:
f t t d d
6 - 14© 2011 Pearson Education, Inc. publishing as Prentice Hall
conformance to standards, making it right the first timeProductProduct--basedbased: specific and measurable attributes of the product
Implications of QualityImplications of Quality1. Company reputation
Perception of new productsEmployment practices
6 - 15© 2011 Pearson Education, Inc. publishing as Prentice Hall
Supplier relations2. Product liability
Reduce risk3. Global implications
Improved ability to compete
Key Dimensions of QualityKey Dimensions of QualityKey Dimensions of QualityKey Dimensions of Quality
PerformanceFeatures
DurabilityServiceability
6 - 16© 2011 Pearson Education, Inc. publishing as Prentice Hall
ReliabilityConformance
AestheticsPerceived qualityValue
Malcolm Baldrige National Malcolm Baldrige National Quality AwardQuality Award
Established in 1988 by the U.S. governmentDesigned to promote TQM practices
6 - 17© 2011 Pearson Education, Inc. publishing as Prentice Hall
Recent winners includeHoneywell Federal, Midway USA,AtlantiCare, Heartland Health, Cargill Corn Milling, PRO-TEC Coating Co., City of Coral Springs, Premier Inc., Sunny Fresh Foods, Park Place Lexus, Richland College
Baldrige CriteriaBaldrige CriteriaApplicants are evaluated on:
Categories PointsLeadership 120Strategic Planning 85
6 - 18© 2011 Pearson Education, Inc. publishing as Prentice Hall
Customer & Market Focus 85Measurement, Analysis, and Knowledge Management 90Workforce Focus 85Process Management 85Results 450

10/16/2010
4
TakumiTakumi
A Japanese character that symbolizes a broader dimension
6 - 19© 2011 Pearson Education, Inc. publishing as Prentice Hall
than quality, a deeper process than education, and a more perfect method than persistence
Costs of QualityCosts of Quality
Prevention costsPrevention costs - reducing the potential for defectsAppraisal costsAppraisal costs - evaluating
6 - 20© 2011 Pearson Education, Inc. publishing as Prentice Hall
products, parts, and servicesInternal failureInternal failure - producing defective parts or service before deliveryExternal costsExternal costs - defects discovered after delivery
External Failure
Costs of QualityCosts of Quality
Total Cost
Total Cost
6 - 21© 2011 Pearson Education, Inc. publishing as Prentice Hall
Internal Failure
Prevention
Appraisal
Quality Improvement
Leaders in QualityLeaders in QualityLeader Philosophy/ContributionW. Edwards Deming 14 Points for
ManagementJoseph M. Juran Top management
6 - 22© 2011 Pearson Education, Inc. publishing as Prentice HallTable 6.1
p p gcommitment, fitness for use
Armand Feigenbaum Total Quality ControlPhilip B. Crosby Quality is Free, zero
defects
Ethics and Quality Ethics and Quality ManagementManagement
Operations managers must deliver healthy, safe, quality products and services
6 - 23© 2011 Pearson Education, Inc. publishing as Prentice Hall
Poor quality risks injuries, lawsuits, recalls, and regulationOrganizations are judged by how they respond to problemsAll stakeholders much be considered
International Quality International Quality StandardsStandards
ISO 9000 series (Europe/EC)Common quality standards for products sold in Europe (even if made in U S )
6 - 24© 2011 Pearson Education, Inc. publishing as Prentice Hall
sold in Europe (even if made in U.S.)2008 update places greater emphasis on leadership and customer requirements and satisfaction
ISO 14000 series (Europe/EC)

10/16/2010
5
ISO 14000ISO 14000Environmental StandardEnvironmental Standard
Core Elements:
Environmental management
6 - 25© 2011 Pearson Education, Inc. publishing as Prentice Hall
gAuditingPerformance evaluationLabelingLife cycle assessment
ISO 14000ISO 14000Environmental StandardEnvironmental Standard
Advantages:Positive public image and reduced exposure to liability
6 - 26© 2011 Pearson Education, Inc. publishing as Prentice Hall
p ySystematic approach to pollution preventionCompliance with regulatory requirements and opportunities for competitive advantageReduction in multiple audits
TQMTQM
Encompasses entire organization, from supplier to customer
Stresses a commitment by
6 - 27© 2011 Pearson Education, Inc. publishing as Prentice Hall
ymanagement to have a continuing,
companywide drive toward excellence in all aspects of products and services that are important to the
customer
Deming’s Fourteen PointsDeming’s Fourteen Points1. Create consistency of purpose 2. Lead to promote change3. Build quality into the product; stop
depending on inspections
6 - 28© 2011 Pearson Education, Inc. publishing as Prentice HallTable 6.2
depe d g o spect o s4. Build long-term relationships based on
performance instead of awarding business on price
5. Continuously improve product, quality, and service
Deming’s Fourteen PointsDeming’s Fourteen Points6. Start training7. Emphasize leadership8. Drive out fear9 B k d b i b t
6 - 29© 2011 Pearson Education, Inc. publishing as Prentice HallTable 6.2
9. Break down barriers between departments
10. Stop haranguing workers11. Support, help, and improve
Deming’s Fourteen PointsDeming’s Fourteen Points12. Remove barriers to pride in work13. Institute education and self-
improvement14. Put everyone to work on the
6 - 30© 2011 Pearson Education, Inc. publishing as Prentice HallTable 6.2
14. Put everyone to work on the transformation

10/16/2010
6
Seven Concepts of TQMSeven Concepts of TQM1. Continuous improvement2. Six Sigma3. Employee empowerment
6 - 31© 2011 Pearson Education, Inc. publishing as Prentice Hall
4. Benchmarking5. Just-in-time (JIT)6. Taguchi concepts7. Knowledge of TQM tools
Continuous ImprovementContinuous Improvement
Represents continual improvement of all processes Involves all operations and work
6 - 32© 2011 Pearson Education, Inc. publishing as Prentice Hall
Involves all operations and work centers including suppliers and customers
People, Equipment, Materials, Procedures
4. ActImplement
the plan document
1.PlanIdentify the pattern and make a plan
Shewhart’s PDCA ModelShewhart’s PDCA Model
6 - 33© 2011 Pearson Education, Inc. publishing as Prentice Hall
2. DoTest the
plan
3. CheckIs the plan working?
Figure 6.3
Six SigmaSix Sigma
Two meaningsStatistical definition of a process that is 99.9997% capable, 3.4 defects per million opportunities (DPMO)
6 - 34© 2011 Pearson Education, Inc. publishing as Prentice Hall
million opportunities (DPMO)A program designed to reduce defects, lower costs, and improve customer satisfaction
Two meaningsTwo meaningsStatistical definition of a process that Statistical definition of a process that is 99.9997% capable, 3.4 defects per is 99.9997% capable, 3.4 defects per million opportunities (DPMO)million opportunities (DPMO)
Six SigmaSix SigmaLower limits Upper limits
3.4 defects/million
2,700 defects/million
6 - 35© 2011 Pearson Education, Inc. publishing as Prentice Hall
million opportunities (DPMO)million opportunities (DPMO)A program designed to reduce A program designed to reduce defects, lower costs, and improve defects, lower costs, and improve customer satisfactioncustomer satisfaction
Mean
±6σ
±3σ
Figure 6.4
Six Sigma ProgramSix Sigma ProgramOriginally developed by Motorola, adopted and enhanced by Honeywell and GEHighly structured approach to
6 - 36© 2011 Pearson Education, Inc. publishing as Prentice Hall
Highly structured approach to process improvement
A strategyA discipline - DMAIC 6σ6σ

10/16/2010
7
Six SigmaSix Sigma1. Define critical outputs
and identify gaps for improvement
2. Measure the work and collect process data
DMAIC Approach
6 - 37© 2011 Pearson Education, Inc. publishing as Prentice Hall
collect process data3. Analyze the data4. Improve the process5. Control the new process to
make sure new performance is maintained
Six Sigma ImplementationSix Sigma ImplementationEmphasize defects per million opportunities as a standard metricProvide extensive trainingFocus on corporate sponsor support
6 - 38© 2011 Pearson Education, Inc. publishing as Prentice Hall
(Champions)Create qualified process improvement experts (Black Belts, Green Belts, etc.)Set stretch objectivesThis cannot be accomplished without a major
commitment from top level management
Employee EmpowermentEmployee EmpowermentGetting employees involved in product and process improvements
85% of quality problems are due to process and material
Techniques
6 - 39© 2011 Pearson Education, Inc. publishing as Prentice Hall
TechniquesBuild communication networks that include employeesDevelop open, supportive supervisorsMove responsibility to employeesBuild a high-morale organizationCreate formal team structures
Quality CirclesQuality Circles
Group of employees who meet regularly to solve problemsTrained in planning, problem
l i d t ti ti l th d
6 - 40© 2011 Pearson Education, Inc. publishing as Prentice Hall
solving, and statistical methodsOften led by a facilitatorVery effective when done properly
BenchmarkingBenchmarkingSelecting best practices to use as a standard for performance
1. Determine what to benchmark
6 - 41© 2011 Pearson Education, Inc. publishing as Prentice Hall
2. Form a benchmark team3. Identify benchmarking partners4. Collect and analyze benchmarking
information5. Take action to match or exceed the
benchmark
Best Practices for Resolving Best Practices for Resolving Customer ComplaintsCustomer Complaints
Best Practice Justification
Make it easy for clients to complain
It is free market research
Respond quickly to It adds customers and loyalty
6 - 42© 2011 Pearson Education, Inc. publishing as Prentice Hall
Respond quickly to complaints
It adds customers and loyalty
Resolve complaints on first contact
It reduces cost
Use computers to manage complaints
Discover trends, share them, and align your services
Recruit the best for customer service jobs
It should be part of formal training and career advancement
Table 6.3

10/16/2010
8
JustJust--inin--Time (JIT)Time (JIT)
Relationship to quality:
JIT cuts the cost of qualityJIT i lit
6 - 43© 2011 Pearson Education, Inc. publishing as Prentice Hall
JIT improves qualityBetter quality means less inventory and better, easier-to-employ JIT system
JustJust--inin--Time (JIT)Time (JIT)
‘Pull’ system of production scheduling including supply management
Production only when signaled
6 - 44© 2011 Pearson Education, Inc. publishing as Prentice Hall
Allows reduced inventory levelsInventory costs money and hides process and material problems
Encourages improved process and product quality
JustJust--InIn--Time (JIT) ExampleTime (JIT) Example
Work in process
6 - 45© 2011 Pearson Education, Inc. publishing as Prentice Hall
ScrapUnreliable Vendors
Capacity Imbalances
Work in process inventory level
(hides problems)
JustJust--InIn--Time (JIT) ExampleTime (JIT) Example
Reducing inventory revealsproblems so they can be solved
6 - 46© 2011 Pearson Education, Inc. publishing as Prentice Hall
ScrapUnreliable Vendors
Capacity Imbalances
Taguchi ConceptsTaguchi ConceptsEngineering and experimental design methods to improve product and process design
Identify key component and process i bl ff ti d t i ti
6 - 47© 2011 Pearson Education, Inc. publishing as Prentice Hall
variables affecting product variationTaguchi Concepts
Quality robustnessQuality loss functionTarget-oriented quality
Quality RobustnessQuality Robustness
Ability to produce products uniformly in adverse manufacturing and environmental conditions
6 - 48© 2011 Pearson Education, Inc. publishing as Prentice Hall
Remove the effects of adverse conditionsSmall variations in materials and process do not destroy product quality

10/16/2010
9
Quality Loss FunctionQuality Loss FunctionShows that costs increase as the product moves away from what the customer wantsCosts include customer
6 - 49© 2011 Pearson Education, Inc. publishing as Prentice Hall
dissatisfaction, warranty and service, internal scrap and repair, and costs to societyTraditional conformance specifications are too simplistic
Unacceptable
Poor
GoodBest
Fair
Quality Loss FunctionQuality Loss FunctionHigh loss
Loss (to producing organization, customer, and society)
Low loss T t i t d lit
L = D2Cwhere
L = loss to societyD = distance from
target valueC = cost of deviation
6 - 50© 2011 Pearson Education, Inc. publishing as Prentice Hall
Low loss
Frequency
Lower Target UpperSpecification
Target-oriented quality yields more product in the “best” category
Target-oriented quality brings product toward the target valueConformance-oriented quality keeps products within 3 standard deviations
Figure 6.5
Tools of TQMTools of TQM
Tools for Generating IdeasCheck sheetsScatter diagrams
6 - 51© 2011 Pearson Education, Inc. publishing as Prentice Hall
Cause-and-effect diagramsTools to Organize the Data
Pareto chartsFlowcharts
Tools of TQMTools of TQMTools for Identifying Problems
HistogramStatistical process control chart
6 - 52© 2011 Pearson Education, Inc. publishing as Prentice Hall
HourD f t 1 2 3 4 5 6 7 8
Seven Tools of TQMSeven Tools of TQM(a) Check Sheet: An organized method of
recording data
6 - 53© 2011 Pearson Education, Inc. publishing as Prentice Hall
//
/ / /// /// ///// ////
//////
Defect 1 2 3 4 5 6 7 8ABC
////
/
Figure 6.6
Seven Tools of TQMSeven Tools of TQM(b) Scatter Diagram: A graph of the value
of one variable vs. another variable
6 - 54© 2011 Pearson Education, Inc. publishing as Prentice Hall
Absenteeism
Prod
uctiv
ity
Figure 6.6

10/16/2010
10
Seven Tools of TQMSeven Tools of TQM(c) Cause-and-Effect Diagram: A tool that
identifies process elements (causes) that might effect an outcome
Cause
6 - 55© 2011 Pearson Education, Inc. publishing as Prentice Hall
Figure 6.6
Materials Methods
Manpower Machinery
Effect
Seven Tools of TQMSeven Tools of TQM(d) Pareto Chart: A graph to identify and plot
problems or defects in descending order of frequency
6 - 56© 2011 Pearson Education, Inc. publishing as Prentice Hall
Figure 6.6
Freq
uenc
y
Perc
ent
A B C D E
Seven Tools of TQMSeven Tools of TQM(e) Flowchart (Process Diagram): A chart that
describes the steps in a process
6 - 57© 2011 Pearson Education, Inc. publishing as Prentice Hall
Figure 6.6
Seven Tools of TQMSeven Tools of TQM(f) Histogram: A distribution showing the
frequency of occurrences of a variableDistribution
cy
6 - 58© 2011 Pearson Education, Inc. publishing as Prentice Hall
Figure 6.6Repair time (minutes)
Freq
uen
Seven Tools of TQMSeven Tools of TQM(g) Statistical Process Control Chart: A chart with
time on the horizontal axis to plot values of a statistic
6 - 59© 2011 Pearson Education, Inc. publishing as Prentice Hall
Figure 6.6
Upper control limit
Target value
Lower control limit
Time
CauseCause--andand--Effect DiagramsEffect DiagramsMaterial
(ball)Method
(shooting process)
Hand position
Aiming point
Bend knees
Balance
Size of ball
L id d
Grain/Feel (grip)
Air pressure
6 - 60© 2011 Pearson Education, Inc. publishing as Prentice Hall
Machine(hoop &
backboard)Manpower(shooter)
Missed free-throws
Figure 6.7
Rim alignment
Rim size
Backboard stability
Rim height
Follow-throughLopsidedness
Training
Conditioning Motivation
Concentration
Consistency

10/16/2010
11
Pareto ChartsPareto Charts
54
– 100– 93– 88
– 72
70 –
60 –
50 –mbe
r)
rcen
t
Data for October
6 - 61© 2011 Pearson Education, Inc. publishing as Prentice Hall
Number of occurrences
Room svc Check-in Pool hours Minibar Misc.72% 16% 5% 4% 3%
124 3 2
40 –
30 –
20 –
10 –
0 –
Freq
uenc
y (n
u
Causes and percent of the total
Cum
ulat
ive
per
Flow ChartsFlow Charts
MRI Flowchart1. Physician schedules MRI2. Patient taken to MRI3. Patient signs in4. Patient is prepped
7. If unsatisfactory, repeat8. Patient taken back to room9. MRI read by radiologist10. MRI report transferred to
6 - 62© 2011 Pearson Education, Inc. publishing as Prentice Hall
p pp5. Technician carries out MRI6. Technician inspects film
pphysician
11. Patient and physician discuss
11
10
20%
9
880%
1 2 3 4 5 6 7
Statistical Process Control Statistical Process Control (SPC)(SPC)
Uses statistics and control charts to tell when to take corrective actionDrives process improvement
6 - 63© 2011 Pearson Education, Inc. publishing as Prentice Hall
p pFour key steps
Measure the processWhen a change is indicated, find the assignable causeEliminate or incorporate the causeRestart the revised process
An SPC ChartAn SPC Chart
Upper control limit20%
Plots the percent of free throws missed
6 - 64© 2011 Pearson Education, Inc. publishing as Prentice Hall
Coach’s target value
Lower control limit
Game number
| | | | | | | | |1 2 3 4 5 6 7 8 9
10%
0%
Figure 6.8
InspectionInspectionInvolves examining items to see if an item is good or defectiveDetect a defective product
Does not correct deficiencies in
6 - 65© 2011 Pearson Education, Inc. publishing as Prentice Hall
process or productIt is expensive
IssuesWhen to inspectWhere in process to inspect
When and Where to InspectWhen and Where to Inspect1. At the supplier’s plant while the supplier is
producing2. At your facility upon receipt of goods from
the supplier3. Before costly or irreversible processes
6 - 66© 2011 Pearson Education, Inc. publishing as Prentice Hall
3. Before costly or irreversible processes4. During the step-by-step production
process5. When production or service is complete6. Before delivery to your customer7. At the point of customer contact

10/16/2010
12
InspectionInspectionMany problems
Worker fatigueMeasurement errorProcess variability
6 - 67© 2011 Pearson Education, Inc. publishing as Prentice Hall
Process variabilityCannot inspect quality into a productRobust design, empowered employees, and sound processes are better solutions
Source InspectionSource Inspection
Also known as source controlThe next step in the process is your customer
6 - 68© 2011 Pearson Education, Inc. publishing as Prentice Hall
Ensure perfect product to your customer
Poka-yoke is the concept of foolproof devices or techniques designed to pass only
acceptable product
Service Industry InspectionService Industry Inspection
Organization What is Inspected Standard
Jones Law Office Receptionist performanceBilli
Is phone answered by the second ringA i l d
6 - 69© 2011 Pearson Education, Inc. publishing as Prentice Hall
Billing
Attorney
Accurate, timely, and correct formatPromptness in returning calls
Table 6.4
Service Industry InspectionService Industry Inspection
Organization What is Inspected Standard
Hard Rock Hotel Reception deskD
Use customer’s name
G i l h 30
6 - 70© 2011 Pearson Education, Inc. publishing as Prentice Hall
Doorman
Room
Minibar
Greet guest in less than 30 secondsAll lights working, spotless bathroomRestocked and charges accurately posted to bill
Table 6.4
Service Industry InspectionService Industry Inspection
Organization What is Inspected Standard
Arnold Palmer Hospital
Billing
Ph
Accurate, timely, and correct formatP i i
6 - 71© 2011 Pearson Education, Inc. publishing as Prentice Hall
Pharmacy
LabNurses
Admissions
Prescription accuracy, inventory accuracyAudit for lab-test accuracyCharts immediately updatedData entered correctly and completely
Table 6.4
Service Industry InspectionService Industry Inspection
Organization What is Inspected Standard
Olive Garden Restaurant
Busboy
B b
Serves water and bread within 1 minuteCl ll é i d
6 - 72© 2011 Pearson Education, Inc. publishing as Prentice Hall
Busboy
Waiter
Clears all entrée items and crumbs prior to dessertKnows and suggest specials, desserts
Table 6.4
10/16/2010
13
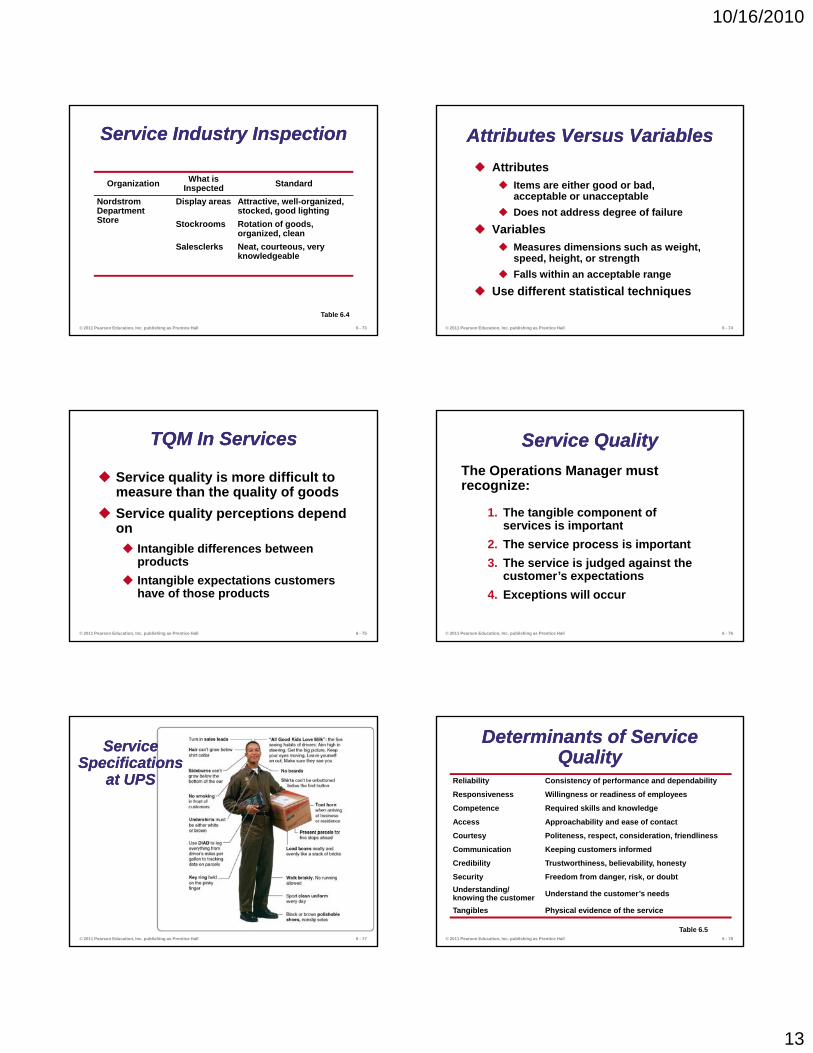
Service Industry InspectionService Industry Inspection
Organization What is Inspected Standard
Nordstrom Department Store
Display areas
S k
Attractive, well-organized, stocked, good lightingR i f d
6 - 73© 2011 Pearson Education, Inc. publishing as Prentice Hall
Store Stockrooms
Salesclerks
Rotation of goods, organized, cleanNeat, courteous, very knowledgeable
Table 6.4
Attributes Versus VariablesAttributes Versus VariablesAttributes
Items are either good or bad, acceptable or unacceptableDoes not address degree of failure
6 - 74© 2011 Pearson Education, Inc. publishing as Prentice Hall
VariablesMeasures dimensions such as weight, speed, height, or strengthFalls within an acceptable range
Use different statistical techniques
TQM In ServicesTQM In Services
Service quality is more difficult to measure than the quality of goodsService quality perceptions depend on
6 - 75© 2011 Pearson Education, Inc. publishing as Prentice Hall
on Intangible differences between productsIntangible expectations customers have of those products
Service QualityService QualityThe Operations Manager must recognize:
1. The tangible component of services is important
6 - 76© 2011 Pearson Education, Inc. publishing as Prentice Hall
services is important2. The service process is important3. The service is judged against the
customer’s expectations4. Exceptions will occur
ServiceServiceSpecificationsSpecifications
at UPSat UPS
6 - 77© 2011 Pearson Education, Inc. publishing as Prentice Hall
Determinants of Service Determinants of Service QualityQuality
Reliability Consistency of performance and dependability
Responsiveness Willingness or readiness of employees
Competence Required skills and knowledge
Access Approachability and ease of contact
6 - 78© 2011 Pearson Education, Inc. publishing as Prentice Hall
Courtesy Politeness, respect, consideration, friendliness
Communication Keeping customers informed
Credibility Trustworthiness, believability, honesty
Security Freedom from danger, risk, or doubtUnderstanding/ knowing the customer Understand the customer’s needs
Tangibles Physical evidence of the service
Table 6.5

10/16/2010
14
Service Recovery StrategyService Recovery Strategy
Managers should have a plan for when services failMarriott’s LEARN routine
6 - 79© 2011 Pearson Education, Inc. publishing as Prentice Hall
ListenEmpathizeApologizeReactNotify
6 - 80© 2011 Pearson Education, Inc. publishing as Prentice Hall
All rights reserved. No part of this publication may be reproduced, stored in a retrieval system, or transmitted, in any form or by any means, electronic, mechanical, photocopying,
recording, or otherwise, without the prior written permission of the publisher. Printed in the United States of America.