heike hevekerl and jerker widengren* file3 1. introduction for many functional units, including...
TRANSCRIPT
1
Determination of molecular stoichiometry without reference samples by analyzing
fluorescence blinking with and without excitation synchronization
Heike Hevekerl and Jerker Widengren*
Experimental Biomolecular Physics, Department of Applied Physics, Royal Institute of
Technology, Stockholm, Sweden
* to whom correspondence should be addressed.
email: [email protected]
phone: +46-8-5537 8030
Abstract
Stoichiometry of molecular complexes plays a crucial role in biology. Moreover, for
quantitative fluorescence studies, it is often useful to know the number of fluorophores
labeled onto the molecules studied. In this work, we propose an approach to determine the
number of independent fluorescence emitters on fluorescent molecules based on fluorescence
blinking caused by photo-induced triplet state formation, photo-isomerization or charge
transfer. The fluorescence blinking is measured under two different excitation regimes, on the
2
same setup, and in one and the same sample. By comparing the fluorescence fluctuations
under continuous excitation using Fluorescence Correlation Spectroscopy (FCS), when all the
fluorophores are blinking independently of each other, with those occurring under square-
pulsed excitation using Transient State (TRAST) spectroscopy, when all fluorophores are
blinking in a synchronized manner, the number of fluorophores per molecule can be
determined. No calibration sample is needed and the approach is independent of experimental
conditions and of the specific environment of the molecules under study.
The approach was experimentally validated by labeling double stranded DNA (dsDNA)
with different concentrations of the intercalating dye YOYO-1 Iodide. The sample was then
measured consecutively by TRAST and FCS and the number of fluorophores per molecule
was calculated. The determined numbers were found to agree well with the number of
fluorophores per dsDNA, as determined from FCS measurements using additional calibration
samples.
3
1. Introduction
For many functional units, including membrane receptors, ion channels, molecular motors
and enzymatic complexes, stoichiometry of molecular complexes plays a crucial role in
biology. Also, for quantitative fluorescence studies, it is often useful to know the number of
fluorophores labeled onto the molecules studied. Fluorescence methods offer several ways to
determine the stoichiometry of such complexes. Fluorescence correlation spectroscopy (FCS)
and other fluorescence fluctuation methods allow diffusion and interaction properties of
fluorescent molecules to be addressed in e.g. live cells, without the need to physically separate
the molecules or molecular interaction complexes of interest1. Likewise, average fluorescence
brightness values for the independently moving fluorescent entities can be obtained, often
referred to as the detected fluorescence count rate per molecule (CPM). By analyzing
distributions of detected fluorescence photons over time by so-called Fluorescence Intensity
Distribution Analysis (FIDA)2, or Photon Counting Histograms (PCH)
3 it is possible to
determine average fluorescence brightness values, or even distributions of brightness values,
for the analyzed molecules or molecular complexes. However, to be properly translated into
absolute molecular stoichiometry, the measured brightness values must be calibrated against a
corresponding sample with pure monomers. In the calibration, any differences in the
brightness per dye upon complex formation of the molecules to which they are labeled need to
be considered. The brightness can depend not only on the experimental conditions (e.g.
excitation intensity, alignment), but also on the specific fluorophore microenvironment (e.g.
viscosity, pH, ionic strength) and on presence of quenchers.
As an alternative to a CPM-based assessment, molecular stoichiometry can also be obtained
from fluorescence measurements by exploiting the antibunching effect4. This effect states that
4
a single fluorophore unit can only emit one fluorescence photon at a time. Following photon
emission, the probability to detect yet another fluorescence photon from the same fluorophore
recovers from zero within a characteristic lag time, which is typically in the nanosecond time
range, and which is determined by the fluorescence lifetime of the molecule5 and the
excitation rate6. However, if fluorescence photons from several independent emitters are
analyzed, the coincidence probability at zero lag times is no longer zero, but determined from
the exact number of emitters within the detection volume7. Based on this effect, the number of
independently emitting molecules within molecular complexes on immobilized8 as well as on
freely diffusing molecules9 can be determined.
In contrast to the molecular brightness assessments above, the anti-bunching approach
offers a calibration-free determination of molecular stoichiometry. However, photostable,
bright fluorophores with high count rates and/or long measurement times are needed to obtain
good antibunching data. Moreover, detector after-pulsing effects and photo-physical
relaxation involving photo-induced transient states of the fluorophores complicate the
analysis.
Similar to fluorescence anti-bunching, fluorescence blinking caused by photo-induced
triplet state formation, photo-isomerization or charge transfer can reflect the number of
independent emitters present in the detection volume. Since transitions to and from these
states take place on a much longer time scale, they can be properly characterized by FCS
within much shorter measurement times, and detector after-pulsing effects are of lesser
importance. In FCS measurements, these blinking events result in relaxation processes in the
FCS curves, where for a sample with freely diffusing single emitters the relative amplitude of
the relaxation processes corresponds to the average fraction of the emitters that are in the dark
transient state(s) involved10,11
. For a sample with several independent fluorescence emitters
per diffusing unit however, this amplitude will decrease in proportion to the number of
5
emitters per diffusing unit. This effect has been proposed as a measure of the length and
amount of DNA labeled with intercalated dyes12
, and can be used as a control of the extent of
fluorophore labeling onto biomolecules13
. However, the transient states can be strongly
influenced by the microenvironment. The absolute value of the relative amplitude of the
transient state relaxation process in the FCS curves is therefore by its own not a fully reliable
measure of molecular stoichiometry. For quantitative use, calibration measurements on
separate reference samples would then typically be required.
In this work, we show that this can be overcome by comparing the relative amplitude of the
transient state relaxation, as measured with two different excitation regimes on the same
setup, and in one and the same sample. First, when measured with continuous excitation by
FCS, all fluorophores are blinking independently of each other and the relative amplitude
depends on the number of independent emitters per diffusing unit. Second, when measured
with square-pulsed excitation by Transient State (TRAST) spectroscopy14
, all fluorophores
are blinking in a synchronized manner, and the relative amplitude of the transient state
relaxation is not influenced by the number of emitters. By comparing the transient state
amplitudes, measured consecutively by FCS and TRAST, the number of
fluorophores/molecule can be determined from a single sample, making the approach
independent of experimental conditions and the specific environment of the molecules under
study. The approach was validated by labeling double stranded DNA (dsDNA) with different
concentrations of the intercalating dye YOYO. The sample was then measured consecutively
by TRAST and FCS and the number of fluorophores/molecule was calculated. The result was
compared to the number of fluorophores calculated from the brightness of the sample
obtained from the corresponding FCS measurements.
6
2. Theory
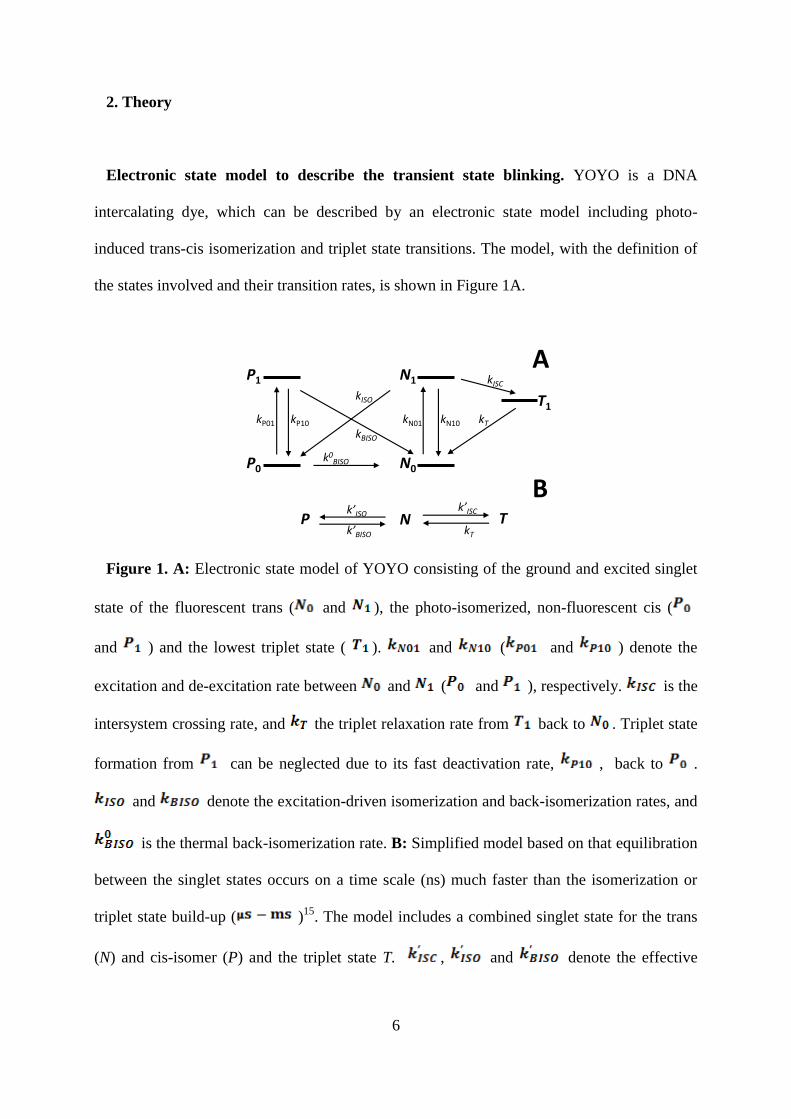
Electronic state model to describe the transient state blinking. YOYO is a DNA
intercalating dye, which can be described by an electronic state model including photo-
induced trans-cis isomerization and triplet state transitions. The model, with the definition of
the states involved and their transition rates, is shown in Figure 1A.
P0
N1
T1
kISC
kTkN01 kN10
kISO
kBISO
P1
k0BISO
N Tk’ISC
kT
N0
kP01 kP10
Pk’ISO
k’BISO
A
B
Figure 1. A: Electronic state model of YOYO consisting of the ground and excited singlet
state of the fluorescent trans ( and ), the photo-isomerized, non-fluorescent cis (
and ) and the lowest triplet state ( ). and ( and ) denote the
excitation and de-excitation rate between and ( and ), respectively. is the
intersystem crossing rate, and the triplet relaxation rate from back to . Triplet state
formation from can be neglected due to its fast deactivation rate, , back to .
and denote the excitation-driven isomerization and back-isomerization rates, and
is the thermal back-isomerization rate. B: Simplified model based on that equilibration
between the singlet states occurs on a time scale (ns) much faster than the isomerization or
triplet state build-up ( )15
. The model includes a combined singlet state for the trans
(N) and cis-isomer (P) and the triplet state T. , and denote the effective
7
rates for intersystem crossing, isomerization rate and back-isomerization (see main text for
further details).
In the model, and for the excitation intensities applied in this study, excitation into higher
excited singlet and triplet states can be neglected. Further, equilibration between / , and
/ , can be expected to occur within ns, i.e. on a time scale much faster than the transitions
to and from the triplet state or the isomerization processes (µs−ms). The electronic state
model of Figure 1A can then be simplified into that of Figure 1B, by assuming combined
singlet states for the trans and photo-isomerized cis state, and , the triplet state T, and
with the following effective rates of intersystem crossing, isomerization and back-
isomerization:
,
,
. (1)
Applying the model of Figure 1B to analyze the transient state relaxation processes in the
FCS and TRAST experiments, the analysis was further simplified by assuming a spatially
uniform excitation, with a constant excitation rate in each point of the detection
volume10,16
. The resulting average populations of the states at steady-state, , , ,
and their relaxation times can then be determined from the corresponding set of differential
equations and their eigenvalues λ1, λ2, and λ3, as described in the supplementary part.
8
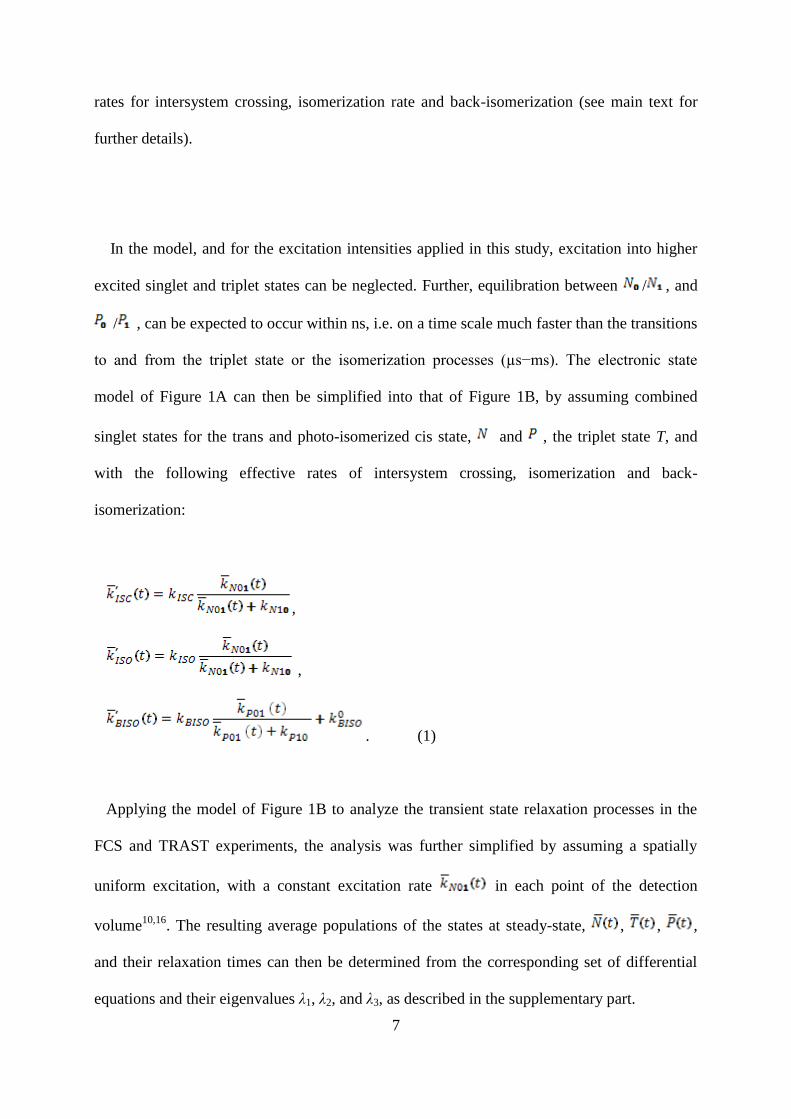
Fluorescence Correlation Spectroscopy. In FCS fluorescence intensity fluctuations from
molecules in a confocal detection volume under continuous wave excitation are analyzed. The
detected fluorescence intensity is given by:
,t)dVr(N)krCEF(ΦcΦF(t) DF 110 ,t)dVr(N
k)r(k
)r(k)krCEF(ΦcΦ
NN
NDF
1001
0110 (2)
Here, c is the concentration of fluorescent molecules, assumed to remain constant under the
conditions and measurement times used in this study. CEF is the collection efficiency
function of the confocal setup, and and denote the fluorescence and the detection
quantum yields, respectively. The fluorescence fluctuations are caused by changes in the
excited singlet state population and changes in concentration due to translational motion of
the fluorescent molecules in and out of the confocal detection volume. If fluorescence
fluctuations arise only from translational diffusion, assuming a 3-dimensional Gaussian
distribution of the detected fluorescence, the time-dependent part of the correlation function
takes the form
2/122
121 /41/41
1)(
DD
NG
mD (3)
Here, ω1 and ω2 are the distances from the center of the laser beam focus in the radial and
axial direction respectively at which the collected fluorescence intensity has dropped by a
factor of 1/e2 compared to its peak value. Nm is the mean number of fluorescent molecules
within the effective volume of observation 3/21
22 (the detection volume), and D is the
translational diffusion coefficient of the fluorescent molecules.
9
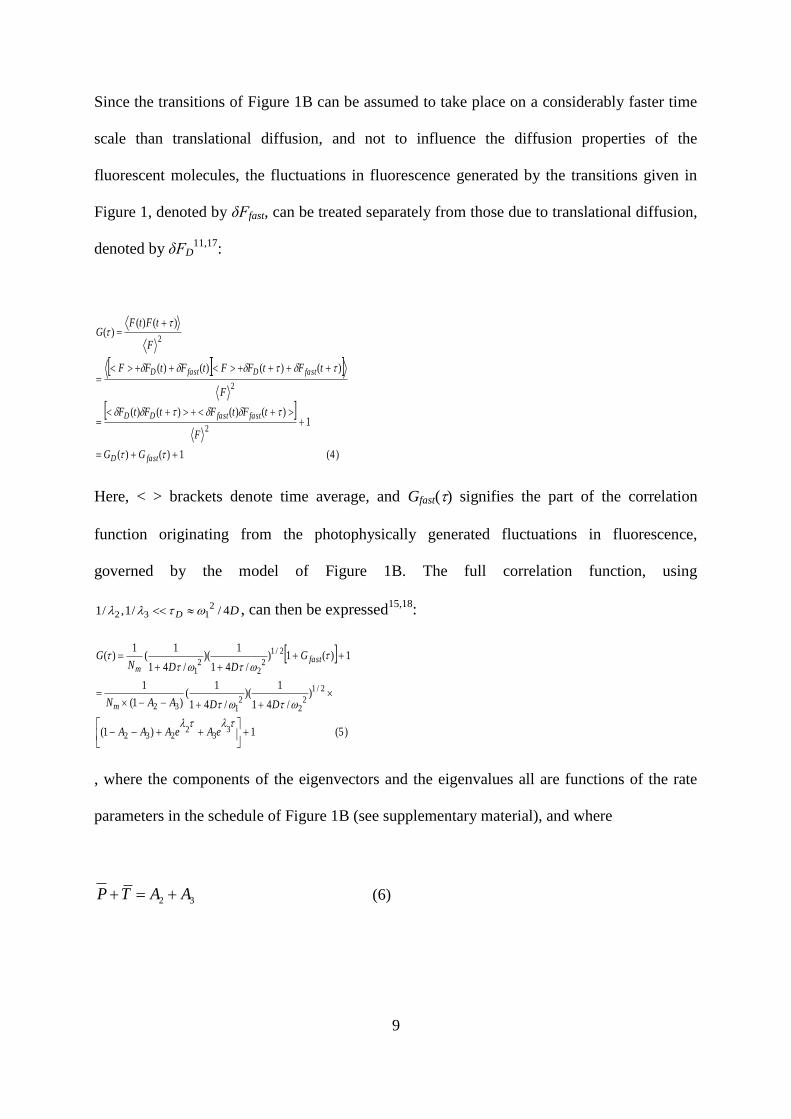
Since the transitions of Figure 1B can be assumed to take place on a considerably faster time
scale than translational diffusion, and not to influence the diffusion properties of the
fluorescent molecules, the fluctuations in fluorescence generated by the transitions given in
Figure 1, denoted by δFfast, can be treated separately from those due to translational diffusion,
denoted by δFD11,17
:
)4(1)()(
1)()()()(
)()()()(
)()()(
2
2
2
fastD
fastfastDD
fastDfastD
GG
F
tFtFtFtF
F
tFtFFtFtFF
F
tFtFG
Here, < > brackets denote time average, and Gfast() signifies the part of the correlation
function originating from the photophysically generated fluctuations in fluorescence,
governed by the model of Figure 1B. The full correlation function, using
DD 4//1 ,/12
132 , can then be expressed15,18
:
)5(1)1(
)/41
1)(
/41
1(
)1(
1
1)(1)/41
1)(
/41
1(
1)(
33
2232
2/1
22
2132
2/1
22
21
eAeAAA
DDAAN
GDDN
G
m
fastm
, where the components of the eigenvectors and the eigenvalues all are functions of the rate
parameters in the schedule of Figure 1B (see supplementary material), and where
32 AATP (6)
10
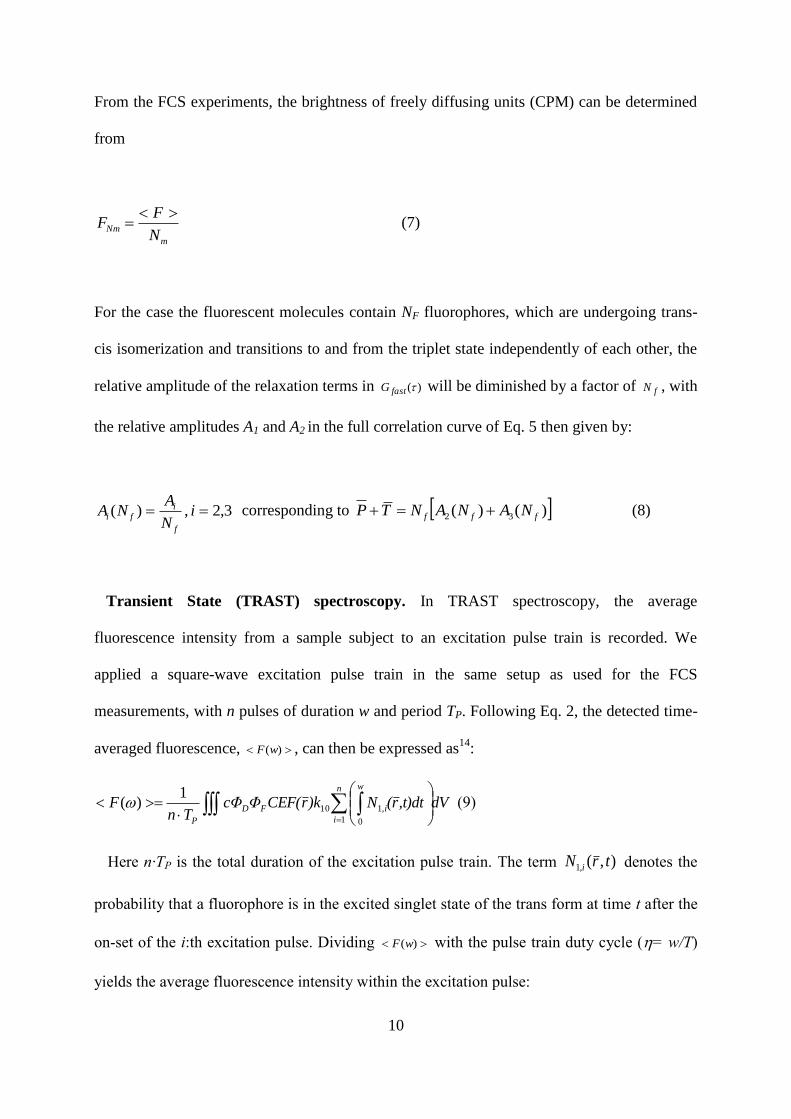
From the FCS experiments, the brightness of freely diffusing units (CPM) can be determined
from
m
NmN
FF
(7)
For the case the fluorescent molecules contain NF fluorophores, which are undergoing trans-
cis isomerization and transitions to and from the triplet state independently of each other, the
relative amplitude of the relaxation terms in )(fastG will be diminished by a factor of fN , with
the relative amplitudes A1 and A2 in the full correlation curve of Eq. 5 then given by:
3,2,)( iN
ANA
f
ifi
corresponding to )()( 32 fff NANANTP (8)
Transient State (TRAST) spectroscopy. In TRAST spectroscopy, the average
fluorescence intensity from a sample subject to an excitation pulse train is recorded. We
applied a square-wave excitation pulse train in the same setup as used for the FCS
measurements, with n pulses of duration w and period TP. Following Eq. 2, the detected time-
averaged fluorescence, )(wF , can then be expressed as14
:
dV,t)dtr(N)krCEF(ΦcΦ
TnF
n
i
w
,iFD
P 1 0
110
1)( (9)
Here n·TP is the total duration of the excitation pulse train. The term ),(,1 trN i denotes the
probability that a fluorophore is in the excited singlet state of the trans form at time t after the
on-set of the i:th excitation pulse. Dividing )(wF with the pulse train duty cycle (= w/T)
yields the average fluorescence intensity within the excitation pulse:
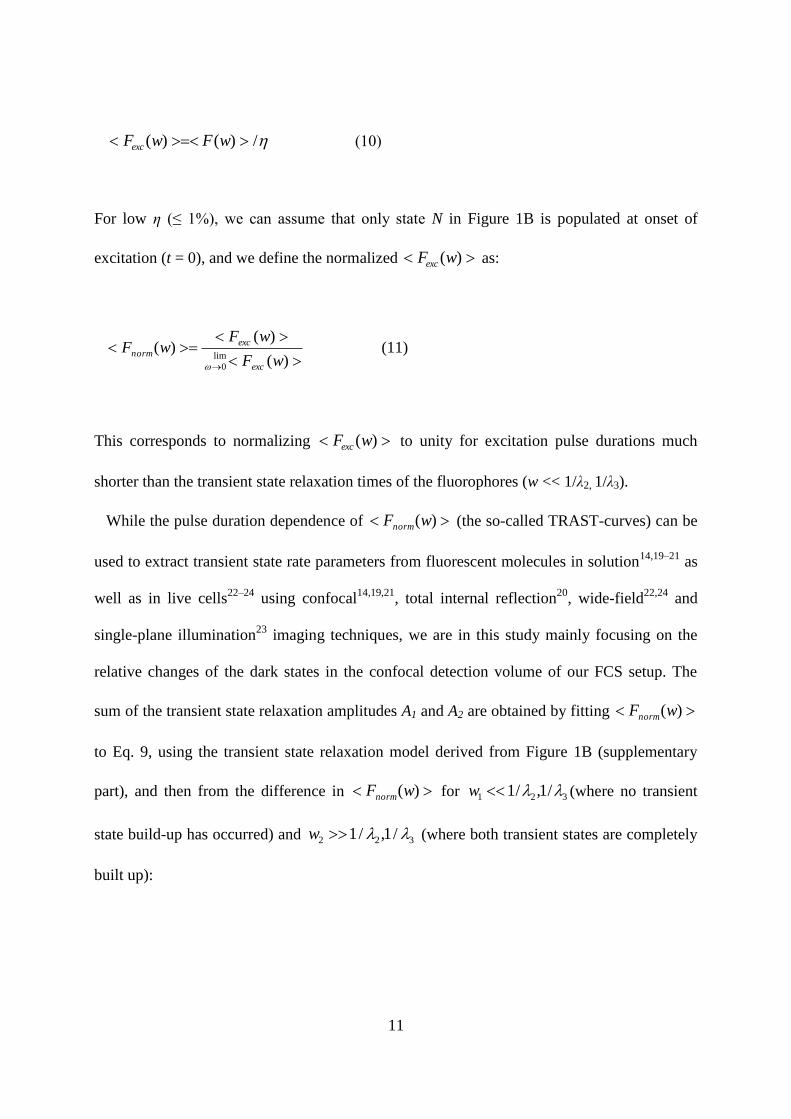
11
/)()( wFwFexc (10)
For low η (≤ 1%), we can assume that only state N in Figure 1B is populated at onset of
excitation (t = 0), and we define the normalized )(wFexc as:
)(
)()(
lim
0 wF
wFwF
exc
exc
norm
(11)
This corresponds to normalizing )(wFexc to unity for excitation pulse durations much
shorter than the transient state relaxation times of the fluorophores (w << 1/λ2, 1/λ3).
While the pulse duration dependence of )(wFnorm (the so-called TRAST-curves) can be
used to extract transient state rate parameters from fluorescent molecules in solution14,19–21
as
well as in live cells22–24
using confocal14,19,21
, total internal reflection20
, wide-field22,24
and
single-plane illumination23
imaging techniques, we are in this study mainly focusing on the
relative changes of the dark states in the confocal detection volume of our FCS setup. The
sum of the transient state relaxation amplitudes A1 and A2 are obtained by fitting )(wFnorm
to Eq. 9, using the transient state relaxation model derived from Figure 1B (supplementary
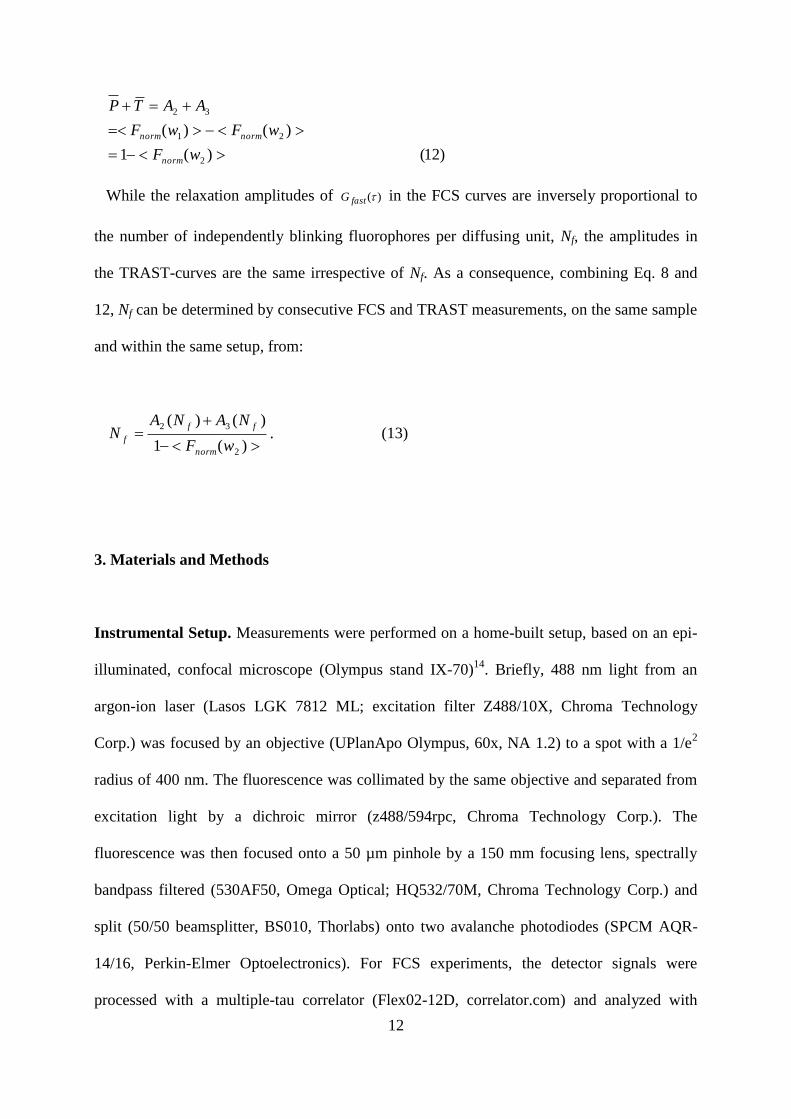
part), and then from the difference in )(wFnorm for 321 /1,/1 w (where no transient
state build-up has occurred) and 322 /1,/1 w (where both transient states are completely
built up):
12
)12()(1
)()(
2
21
32
wF
wFwF
AATP
norm
normnorm
While the relaxation amplitudes of )(fastG in the FCS curves are inversely proportional to
the number of independently blinking fluorophores per diffusing unit, Nf, the amplitudes in
the TRAST-curves are the same irrespective of Nf. As a consequence, combining Eq. 8 and
12, Nf can be determined by consecutive FCS and TRAST measurements, on the same sample
and within the same setup, from:
)(1
)()(
2
32
wF
NANAN
norm
ff
f . (13)
3. Materials and Methods
Instrumental Setup. Measurements were performed on a home-built setup, based on an epi-
illuminated, confocal microscope (Olympus stand IX-70)14
. Briefly, 488 nm light from an
argon-ion laser (Lasos LGK 7812 ML; excitation filter Z488/10X, Chroma Technology
Corp.) was focused by an objective (UPlanApo Olympus, 60x, NA 1.2) to a spot with a 1/e2
radius of 400 nm. The fluorescence was collimated by the same objective and separated from
excitation light by a dichroic mirror (z488/594rpc, Chroma Technology Corp.). The
fluorescence was then focused onto a 50 µm pinhole by a 150 mm focusing lens, spectrally
bandpass filtered (530AF50, Omega Optical; HQ532/70M, Chroma Technology Corp.) and
split (50/50 beamsplitter, BS010, Thorlabs) onto two avalanche photodiodes (SPCM AQR-
14/16, Perkin-Elmer Optoelectronics). For FCS experiments, the detector signals were
processed with a multiple-tau correlator (Flex02-12D, correlator.com) and analyzed with
13
Matlab-based software (The MathWorks, Inc.) developed in house. For TRAST experiments,
the excitation light was modulated in an on-off fashion by an acousto-optic modulator (AOM;
AA.MT.200/A0,5-VIS, AA Opto-Electronic) in the excitation beam path. The AOM was
controlled by a PCI-6602 counter/timer card (National Instruments Corp.) that also
simultaneously managed the data acquisition. The data was analyzed with customized Matlab
software20,21
.
Sample Preparation. Rhodamine 110 (Life Technologies) was diluted in double-distilled
water to nM concentration and used for setup calibration and reference measurements.
YOYO®-1 Iodide was purchased from Life Technologies and diluted in buffer (20 mM Tris,
50 mM NaCl, 10 mM MgCl2, pH 7.5) to 1 µM concentration. To achieve different labeling
ratios of YOYO/DNA, YOYO was added in concentrations of 1-1000 nM to dsDNA (~10
nM, 356 base pair, random sequence) and incubated at 23ºC for 20 min directly on a cover
slip. Then, FCS and TRAST measurements were performed consecutively.
Measurement settings.
TRAST. TRAST curves were obtained by recording )(wF for approximately 35 pulse
trains with pulse widths w varying from 500 ns to 1 ms. The pulse height, i.e. the excitation
irradiance ( = 40 kW/cm2), and the total illumination time per pulse train (~ 2 – 8 s) were
kept constant during the recording of the TRAST curves. In the pulse trains, each excitation
pulse was followed by a dark period ( = 0 kW/cm2) 100 times longer than the excitation
pulse (η = 1 %) to ensure completely relaxed fluorophores at the onset of the next excitation
pulse. After every third measurement, a reference measurement was taken with the smallest
w, which was used to correct for concentration changes in the sample. Unbound YOYO is
weakly fluorescent in solution. Therefore, an additional measurement of YOYO without
14
dsDNA was performed and subtracted from each YOYO/DNA measurement before further
analyzing the data. The measurement time of a sample, recorded from 35 pulse trains with
different , varied from 2 – 8 minutes.
FCS. Measurements were performed with the same excitation irradiance as for the TRAST
measurements. The fluorescence intensity of unbound YOYO is very weak and does not
contribute to the correlation function. However, due to the high concentration of unbound
YOYO ( 1 µM), the total fluorescence contributes in the form of a constant background
signal , which was determined from measurements of aqueous solution samples with
YOYO only at the corresponding concentrations as for the free dye in the DNA-YOYO
samples). This background signal was subtracted from the fluorescence intensity of the
YOYO/DNA sample, and the number of molecules in the observation volume,
, as well as the molecular brightness were recalculated. FCS
curves were acquired within 1− 2 minutes.
4. Results and Discussion
In essence, from the theory part we can conclude that for TRAST measurements, in contrast
to FCS measurements, the amplitude(s) of the transient state relaxation term(s) shall not be
expected to be influenced by the number of fluorophores per diffusing unit. Following Eq. 13,
the number of independently blinking fluorophores per diffusing unit, Nf, can then be
determined by comparing the dark state amplitudes obtained from TRAST and FCS
measurements, performed consecutively on the same sample and under the same conditions.
15
To test this approach experimentally, we labeled double-stranded DNA with different
concentrations of the fluorescent dye YOYO, in order to obtain samples with dsDNA
molecules with the average number of fluorophores (YOYO/dsDNA) varying from less than
one up to several fluorophores per dsDNA molecule. Within this range of YOYO/dsDNA,
and given the length of the dsDNA used in this study (356 bp 130 nm), dye-dye
interactions by e.g. energy transfer between single YOYO fluorophores intercalated into the
dsDNA molecules can be assumed to be negligible.
FCS and TRAST were measured consecutively on the samples with different
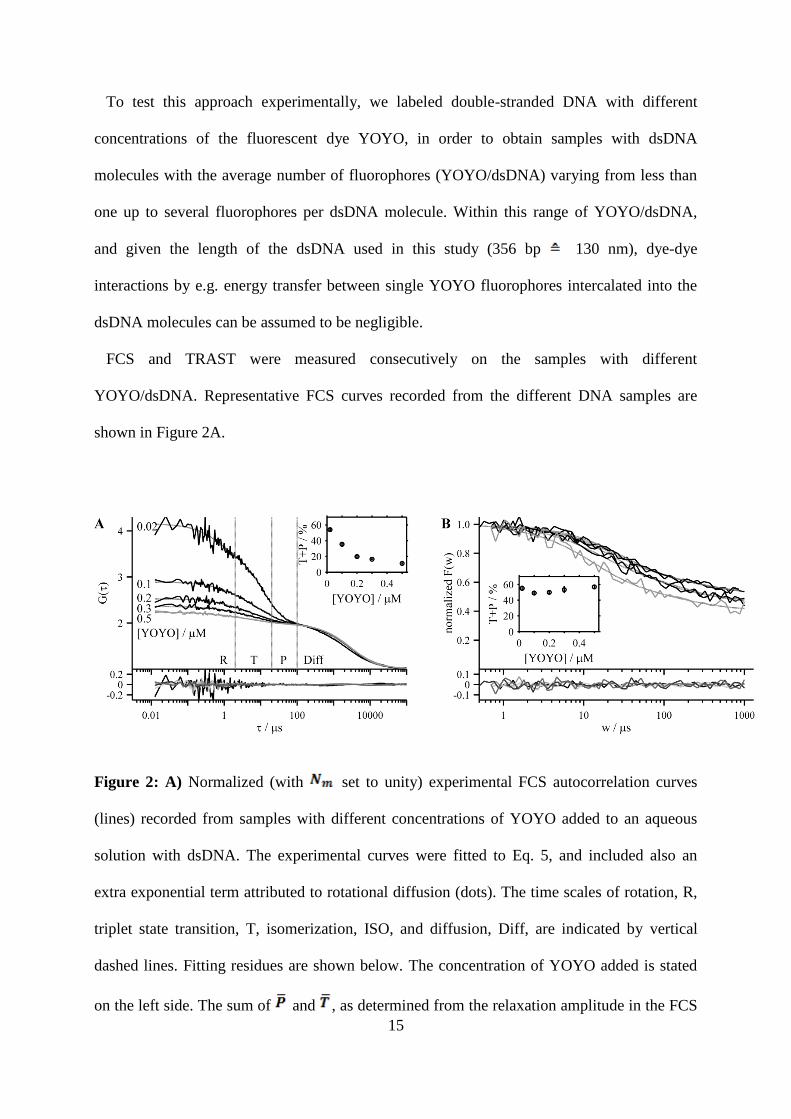
YOYO/dsDNA. Representative FCS curves recorded from the different DNA samples are
shown in Figure 2A.
Figure 2: A) Normalized (with set to unity) experimental FCS autocorrelation curves
(lines) recorded from samples with different concentrations of YOYO added to an aqueous
solution with dsDNA. The experimental curves were fitted to Eq. 5, and included also an
extra exponential term attributed to rotational diffusion (dots). The time scales of rotation, R,
triplet state transition, T, isomerization, ISO, and diffusion, Diff, are indicated by vertical
dashed lines. Fitting residues are shown below. The concentration of YOYO added is stated
on the left side. The sum of and , as determined from the relaxation amplitude in the FCS
16
curves using Eqs. 5 and 6, decreases with increasing YOYO concentrations. The determined
+ is also plotted in the inset with error bars representing the standard deviation of five
measurements. B) Normalized experimental TRAST curves of the same samples (lines), fitted
to Eq. 9 using the relaxation model derived from Figure 1B (grey dots). Fitting residues are
shown below. With increasing excitation pulse widths w, the normalized fluorescence
<Fnorm(w)> decays with a similar amplitude for all samples (inset; error bars represent the
standard deviation of five measurements).
In the FCS curves, four decay terms could be observed: The slowest decay term in the
millisecond time range corresponded to the diffusion of the molecule through the observation
volume ( ). The other decay terms had relaxation times in the range of 500 ns, 8
µs and 50 µs. To confirm the dynamic processes underlying these relaxation terms, their
excitation irradiance dependence was investigated by varying over a range of 4 to 163
kW/cm2. For the fastest decay term, no obvious dependence was found, and we attribute
this decay term to rotational diffusion. The decay time is in agreement with the expected
rotational correlation time for a molecule with a comparable size to the dsDNA molecules25
,
and indicates that the YOYO fluorophores indeed are intercalated in the dsDNA, and hindered
to rotate freely around their site of labeling. In the FCS curves of Figure 2A, we can also note
that the amplitude of the rotational diffusion decay term decreases with higher
YOYO/dsDNA. This can be explained by an expected decrease in the overall anisotropy,
when summing the contributions of the excitation and emission dipoles from several YOYO
dyes with different orientations within the dsDNA molecules.
17
For the other two decay terms (with 8 µs and 50 µs relaxation times), we could observe an
dependence characteristic for triplet state formation (increased amplitudes and
moderately reduced relaxation times with higher ) and trans-cis isomerization (small
changes in the amplitudes and the relaxation times inversely proportional to ),
respectively, as described by the relaxation terms A2 and A3 in Eq. 5. Since we are in this
study mainly interested in the total amplitude of these transient state decay terms, and since
the interpretation of the relaxation times and amplitudes of these terms are complicated by the
fact that they are coupled in the kinetic model of Figure 1B, we did not determine the
underlying rate parameter values any further. We note that the recorded FCS curves could be
fitted to Eq. 14, with an added exponential term in the fast time range attributed to rotational
diffusion, that the amplitudes, A2 and A3, most likely correspond to T and P under our
experimental conditions, and we hereinafter focus on their sum, referred to as the transient
state relaxation amplitude, AFCS.
With increasing YOYO/dsDNA, the amplitudes of the transient state decay terms were
clearly reduced. In the FCS curves recorded from the higher YOYO/dsDNA samples the
small amplitudes made it difficult to resolve the triplet and isomerization state decay terms
from each other. These FCS curves were therefore analyzed with the two exponential terms of
A2 and A3 in Eq. 5 combined into a common term. The dependence of AFCS with increasing
concentrations of YOYO is shown in the inset Figure 2A.
In direct conjunction to the recording of the FCS curves, TRAST measurements were
performed, on the same samples and with the same setup, by applying excitation modulation
with varying w (Fig. 2B). The recorded TRAST curves showed an overall decay, with decay
times well in agreement with those of AFCS in the FCS curves, and for the highest
YOYO/dsDNA samples, a faster decay could also be observed. In contrast to the FCS
measurements, the overall decay amplitude in the TRAST curves showed no significant
18
concentration dependence (inset, Fig. 2B), and was for all YOYO/dsDNA samples found to
correspond well to that of AFCS for FCS curves recorded from the lowest YOYO/dsDNA
sample. Taken together, the observed decay in the TRAST curves agrees with the predicted
behavior, and the decay amplitude can be attributed to photo-isomerization and triplet state
formation, corresponding to A2 and A3 in Eq. 5. For w > 400 ns, no additional decay term was
observed in the TRAST curves. This is well in line with the assignment of the fast decay term
in the FCS curves to rotational diffusion, which is not a photo-induced process and is thus not
expected to be observed in the TRAST curves.
The clear decay of AFCS with higher YOYO/dsDNA, put in relation to the essentially
constant decay amplitudes )(1 2wFnorm in the corresponding TRAST curves indicate that Nf
indeed can be determined as predicted by Eq. 13. To further verify this, we compared the
calculated Nf values to the number of fluorophores per dsDNA, as estimated from the relative
fluorescence brightness of the monitored DNA molecules. Here, the same FCS measurements
were used to calculate the brightness FNm of the monitored DNA molecules (Eq. 7). The
calculated FNm was then compared to the molecular brightness determined from a reference
sample (FNm(ref)), in which the monitored DNA molecules were only labeled with a single
YOYO fluorophore. The number of fluorophores per molecule in the DNA molecules where
then obtained from:
)(refF
FN
Nm
NmCPM (14)
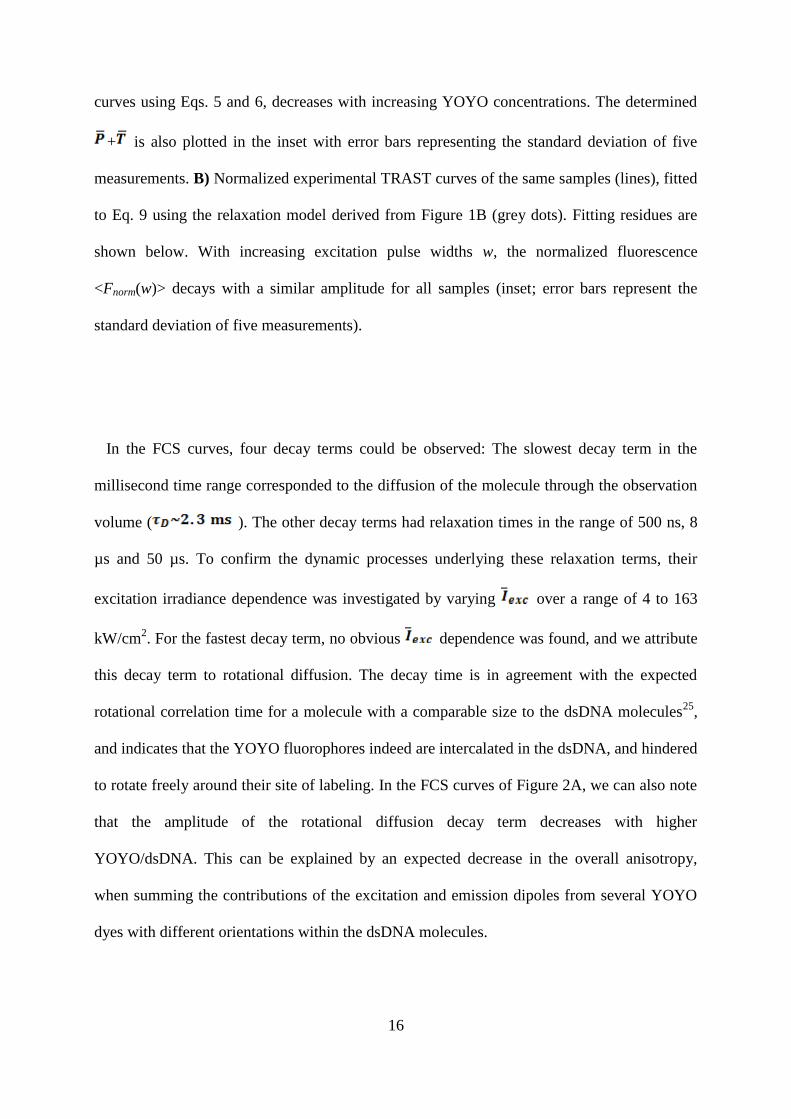
The numbers of YOYO/dsDNA in the investigated samples, as obtained from Eq. 14, were
then compared to the number of YOYO/DNA, as calculated by Eq. 13 from TRAST/FCS, Nf
(Fig. 3). For a sample with a single YOYO/dsDNA, the amplitudes for the triplet and
isomerization state decays, as obtained from TRAST and FCS measurements, were identical,
19
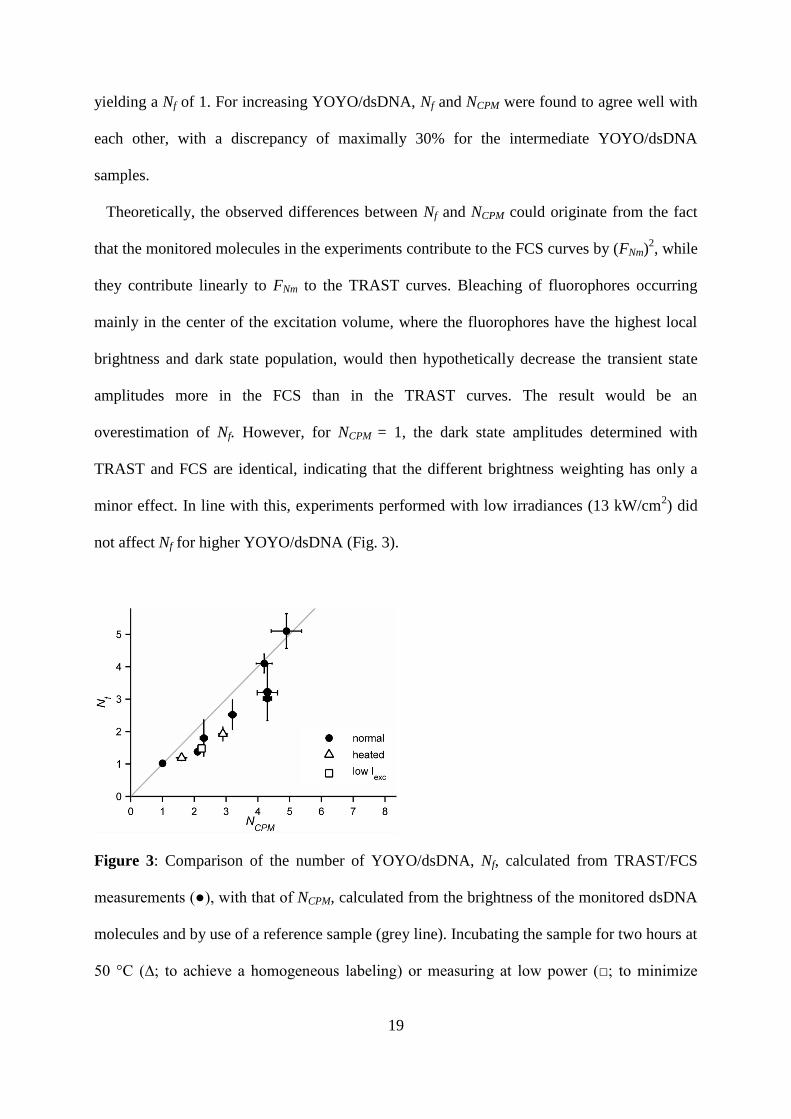
yielding a Nf of 1. For increasing YOYO/dsDNA, Nf and NCPM were found to agree well with
each other, with a discrepancy of maximally 30% for the intermediate YOYO/dsDNA
samples.
Theoretically, the observed differences between Nf and NCPM could originate from the fact
that the monitored molecules in the experiments contribute to the FCS curves by (FNm)2, while
they contribute linearly to FNm to the TRAST curves. Bleaching of fluorophores occurring
mainly in the center of the excitation volume, where the fluorophores have the highest local
brightness and dark state population, would then hypothetically decrease the transient state
amplitudes more in the FCS than in the TRAST curves. The result would be an
overestimation of Nf. However, for NCPM = 1, the dark state amplitudes determined with
TRAST and FCS are identical, indicating that the different brightness weighting has only a
minor effect. In line with this, experiments performed with low irradiances (13 kW/cm2) did
not affect Nf for higher YOYO/dsDNA (Fig. 3).
Figure 3: Comparison of the number of YOYO/dsDNA, Nf, calculated from TRAST/FCS
measurements (●), with that of NCPM, calculated from the brightness of the monitored dsDNA
molecules and by use of a reference sample (grey line). Incubating the sample for two hours at
50 °C (∆; to achieve a homogeneous labeling) or measuring at low power (□; to minimize
20
bleaching) had no influence on the estimated parameter values. Error bars represent the
standard deviation of five measurements.
For the same reason, a strong non-uniform distribution of YOYO dyes among the dsDNA
molecules could also influence the determined average dark state amplitudes. In FCS, the
(FNm)2-weighting would lead to a decrease in the amplitude AFCS in a non-uniform, labeled
sample compared to in a homogenously labeled sample, while TRAST would detect the same
decay amplitude for both samples. As a result, the estimated Nf would increase.
Inhomogeneous labeling of DNA with YOYO has been observed before, and could then be
circumvented by incubation of the sample for 2 hours at 50 ºC 26
. However, upon such
incubation, we did not observe changes in Nf (Fig. 3), and any major effects due to
inhomogeneous labeling in our experiments are therefore unlikely.
For the sample with the highest YOYO/dsDNA (Nf and NCPM ~ 5) a smaller transient state
relaxation time was observed in both the TRAST and the FCS curves. A decreased relaxation
time could originate from e.g. - annihilation between two YOYO dyes. However, the
consequent reduction in A2 was not observed in the TRAST curves. Instead, A2 increased
slightly.
An increase in A2 and a simultaneous decrease in its relaxation can indicate that the
formerly independently blinking fluorophores would interact with each other, with their dark
state transitions, to some extent, coupled. As a consequence, AFCS would decrease less than
indicated by Eq. 8, leading to a simultaneous decrease in Nf. Coupling of the electronic states
might also occur e.g. for fluorophores in physical contact or for fluorophores exchanging
electrons. Electron exchange via guanosine bases is a well-known mechanism27,28
, and cannot

21
be excluded to occur for YOYO intercalated in DNA. Förster Resonance Energy Transfer
(FRET) between a donor and a red-shifted acceptor is also known to influence the dark state
properties of fluorophores21,29
and can lead to a coupled blinking behavior of the
fluorophores30,31
. However, for FRET between two identical fluorophores f1 and f2 (homo-
FRET), the total brightness of f2 should not change, because a reduction in FRET from f1 to f2
due to triplet state transitions of f1 will be compensated for by a simultaneous reduction in
FRET from f2 to f1. Hence, FRET-mediated coupling of transient states between identical
fluorophores can be expected to be minor.
Quenching often occurs in highly concentrated fluorophore environments as a result of the
formation of non-fluorescent dimers and exciplexes. In this study, YOYO is tightly
intercalated in the DNA and no formation of complexes is expected between the bound
fluorophores. However, self-quenching with the almost non-fluorescent, unbound YOYO in
solution cannot be fully excluded for higher YOYO concentrations. This could potentially
influence the estimation of Nf and NCPM , at least for the higher YOYO concentrations used in
this study.
YOYO is a homo-dimer consisting of two Oxazole Yellow (YO) units connected with a
biscationic linker that can undergo individual triplet state and isomerization transitions.
Nevertheless, theoretically, YOYO can be described as a single emitting fluorophore with
triplet state and isomerization transitions, because both units are coupled by ultrafast
excitation energy hopping ( ) due to their short intermolecular distance and
similar dipole orientations32
. To test whether interactions between the single monomer units
YO could influence the experiments, we also performed measurements with SYTOX green, a
DNA intercalating dye that has, in contrast to the homo-dimer YOYO, only one fluorescing
unit. SYTOX green showed a similar behavior: For increasing concentrations of SYTOX
green, the FCS transient state amplitude decreased while the TRAST transient state
22
amplitudes remained constant. For closely spaced SYTOX green on the DNA, the triplet
relaxation time became faster and T increased slightly (data not shown). No difference
between the monomer SYTOX green and the homo-dimer YOYO was detected.
5. Concluding remarks
We propose a methodology to measure molecular stoichiometry and the number of
fluorophore labels on biomolecules that offer clear selective advantages compared to
previously introduced fluorescence-based approaches. While the major concern with our
approach is dye-dye interactions that may lead to coupled blinking behavior of the
fluorophores, it is for fluorescence brightness measurements, e.g. FIDA/PCH/CPM, crucial to
avoid any differences in the environment that in any way can change their photo-physical
properties and hence their brightness, both in the sample itself and in the reference sample..
Our approach does not need to compare the dark state of the sample with a known reference.
It rather uses two methods consecutively, on the same sample, and on the same setup,
exploiting the main difference between the methods, that FCS measures the spontaneous
transient state blinking, while TRAST measures the blinking properties with the blinking of
the fluorophores being full synchronized. In contrast to fluorescence anti-bunching
experiments, the relaxation times of the transient states studied with our approach are much
longer, thus far lower time resolution is required, and considerably shorter measurement times
are typically required. In this study, the TRAST curves were generated from pulse train
excitation measurements with 35 different pulse widths, , applied, and typically requiring
2-8 min measurement time. However, for determining the decay amplitude of the TRAST
curves, (Eq. 11), as few as two measurements with different are sufficient.
23
The required measurement time for the TRAST measurements in order to determine can
therefore be made well within a minute. Here, we used the triplet state and isomerization to
determine the number of fluorophores/molecule. However, in principle any non-fluorescent
photo-induced state of a fluorophore (e.g. triplet state, isomerization, ionization) can be used.
By combining multiple dark states, the resolution, which is proportional to the total dark state
population, can be improved, and since the vast majority of all fluorophores display photo-
induced transient state blinking behavior, there are good opportunities to optimize the
approach for different sample conditions by choosing appropriate transient states to monitor,
as well as suitable fluorophores. Both FCS and TRAST can be readily applied for a range of
biomolecular studies, including live cell measurements. The combined use of FCS/TRAST in
our approach can be expected to have an equally broad application range, as a useful tool to
determine molecular stoichiometry or fluorophores per diffusing units.
Acknowledgements
This study was supported by means from the Swedish National Research Council (VR-NT,
2012-3045). The dsDNA was a kind gift from Dr. Prof. J. Johansson (Karolinska Institute,
Sweden).
24
References
(1) Elson, E. L. 2011 Fluorescence correlation spectroscopy: past, present, future. Biophys.
J., 101, 2855.
(2) Kask, P.; Palo, K.; Ullmann, D.; Gall, K. 1999 Fluorescence-intensity distribution
analysis and its application in biomolecular detection technology. Proc. Natl. Acad.
Sci. U. S. A., 96, 13756.
(3) Chen, Y.; Müller, J. D.; Ruan, Q.; Gratton, E. 2002 Molecular brightness
characterization of EGFP in vivo by fluorescence fluctuation spectroscopy. Biophys. J.,
82, 133.
(4) Kimble, H.; Dagenais, M.; Mandel, L. 1977 Photon antibunching in resonance
fluorescence. Phys. Rev. Lett., 39, 691.
(5) Kask, P.; Piksarv, P.; Mets, Ü. 1985 Fluorescence correlation spectroscopy in the
nanosecond time range: Photon antibunching in dye fluorescence. Eur. Biophys. J., 12,
163.
(6) Mets, Ü.; Widengren, J.; Rigler, R. 1997 Application of the antibunching in dye
fluorescence: measuring the excitation rates in solution. Chem. Phys., 218, 191.
(7) Ambrose, W. P.; Goodwin, P. M.; Enderlein, J.; Semin, D. J.; Martin, J. C.; Keller, R.
A. 1997 Fluorescence photon antibunching from single molecules on a surface. Chem.
Phys. Lett., 269, 365.
25
(8) Weston, K. D.; Dyck, M.; Tinnefeld, P.; Müller, C.; Herten, D. P.; Sauer, M. 2002
Measuring the number of independent emitters in single-molecule fluorescence images
and trajectories using coincident photons. Anal. Chem., 74, 5342.
(9) Sýkora, J.; Kaiser, K.; Gregor, I.; Bönigk, W.; Schmalzing, G.; Enderlein, J. 2007
Exploring fluorescence antibunching in solution to determine the stoichiometry of
molecular complexes. Anal. Chem., 79, 4040.
(10) Widengren, J.; Rigler, R.; Mets, Ü. 1994 Triplet-state monitoring by fluorescence
correlation spectroscopy. J. Fluoresc., 4, 255.
(11) Widengren, J.; Mets, U.; Rigler, R. 1995 Fluorescence correlation spectroscopy of
triplet states in solution: a theoretical and experimental study. J. Phys. Chem., 99,
13368.
(12) Shimizu, M.; Sasaki, S.; Kinjo, M. 2007 Triplet fraction buildup effect of the DNA-
YOYO complex studied with fluorescence correlation spectroscopy. Anal. Biochem.,
366, 87.
(13) Strömqvist, J.; Johansson, S.; Xu, L.; Ohsugi, Y.; Andersson, K.; Muto, H.; Kinjo, M.;
Höglund, P.; Widengren, J. 2011 A modified FCCS procedure applied to Ly49A-MHC
class I cis-interaction studies in cell membranes. Biophys. J., 101, 1257.
(14) Sandén, T.; Persson, G.; Thyberg, P.; Blom, H.; Widengren, J. 2007 Monitoring
kinetics of highly environment sensitive states of fluorescent molecules by modulated
excitation and time-averaged fluorescence intensity recording. Anal. Chem., 79, 3330.
26
(15) Widengren, J.; Seidel, C. A. M. 2000 Manipulation and characterization of photo-
induced transient states of Merocyanine 540 by fluorescence correlation spectroscopy.
Phys. Chem. Chem. Phys., 2,3435.
(16) Eggeling, C.; Widengren, J.; Rigler, R.; Seidel, C. A. M. 1998 Photobleaching of
fluorescent dyes under conditions used for single-molecule detection: Evidence of two-
step photolysis. Anal. Chem., 70, 2651.
(17) Palmer, a G.; Thompson, N. L. 1987 Theory of sample translation in fluorescence
correlation spectroscopy. Biophys. J., 51, 339.
(18) Widengren, J.; Schwille, P. 2000 Characterization of photoinduced isomerization and
back-isomerization of the cyanine dye Cy5 by fluorescence correlation spectroscopy. J.
Phys. Chem. A, 104, 6416.
(19) Sandén, T.; Persson, G.; Widengren, J. 2008 Transient state imaging for
microenvironmental monitoring by laser scanning microscopy. Anal. Chem., 80, 9589.
(20) Spielmann, T.; Blom, H.; Geissbuehler, M.; Lasser, T.; Widengren, J. 2010 Transient
state monitoring by total internal reflection fluorescence microscopy. J. Phys. Chem. B,
114, 4035.
(21) Hevekerl, H.; Spielmann, T.; Chmyrov, A.; Widengren, J. 2011 Förster resonance
energy transfer beyond 10 nm: exploiting the triplet state kinetics of organic
fluorophores. J. Phys. Chem. B, 115, 13360.
(22) Spielmann, T.; Xu, L.; Gad, A. K. B.; Johansson, S.; Widengren, J. 2014 Transient
state microscopy probes patterns of altered oxygen consumption in cancer cells. FEBS
J., 281, 1317.
27
(23) Müksch, J.; Spielmann, T.; Sisamakis, E.; Widengren, J. Transient state imaging of live
cells using single plane illumination and arbitrary duty cycle excitation pulse trains. J.
Biophotonics published online, DOI: 10.1002/jbio.20140015.
(24) Geissbuehler, M.; Spielmann, T.; Formey, A.; Märki, I.; Leutenegger, M.; Hinz, B.;
Johnsson, K.; Van De Ville, D.; Lasser, T. 2010 Triplet imaging of oxygen
consumption during the contraction of a single smooth muscle cell (A7r5). Biophys. J.,
98, 339.
(25) Lakowicz, J. R. 2006 Principles of Fluorescence Spectroscopy. Springer pp. 413–441.
(26) Carlsson, C.; Jonsson, M.; Akerman, B. 1995 Double bands in DNA gel
electrophoresis caused by bis-intercalating dyes. Nucleic Acids Res., 23, 2413.
(27) Jortner, J.; Bixon, M.; Langenbacher, T.; Michel-Beyerle, M. E. 1998 Charge transfer
and transport in DNA. Proc. Natl. Acad. Sci. U. S. A., 95, 12759.
(28) Giese, B. 2000 Long-distance charge transport in DNA: the hopping mechanism. Acc.
Chem. Res., 33, 631.
(29) Widengren, J.; Schweinberger, E.; Berger, S.; Seidel, C. A. M. 2001 Two new concepts
to measure fluorescence resonance energy transfer via fluorescence correlation
spectroscopy: theory and experimental realizations. J. Phys. Chem. A, 105, 6851.
(30) Margittai, M.; Widengren, J.; Schweinberger, E.; Schröder, G. F.; Felekyan, S.;
Haustein, E.; König, M.; Fasshauer, D.; Grubmüller, H.; Jahn, R.; Seidel, C. A. M.
2003 Single-molecule fluorescence resonance energy transfer reveals a dynamic
equilibrium between closed and open conformations of syntaxin 1. Proc. Natl. Acad.
Sci. U. S. A., 100, 15516.
28
(31) Hom, E. F. Y.; Verkman, A. S. 2002 Analysis of coupled bimolecular reaction kinetics
and diffusion by two-color fluorescence correlation spectroscopy: enhanced resolution
of kinetics by resonance energy transfer. Biophys. J., 83, 533.
(32) Fürstenberg, A.; Julliard, M. D.; Deligeorgiev, T. G.; Gadjev, N. I.; Vasilev, A. A.;
Vauthey, E. 2006 Ultrafast excited-state dynamics of DNA fluorescent intercalators:
new insight into the fluorescence enhancement mechanism. J. Am. Chem. Soc., 128,
7661.
1
Supplementary Material
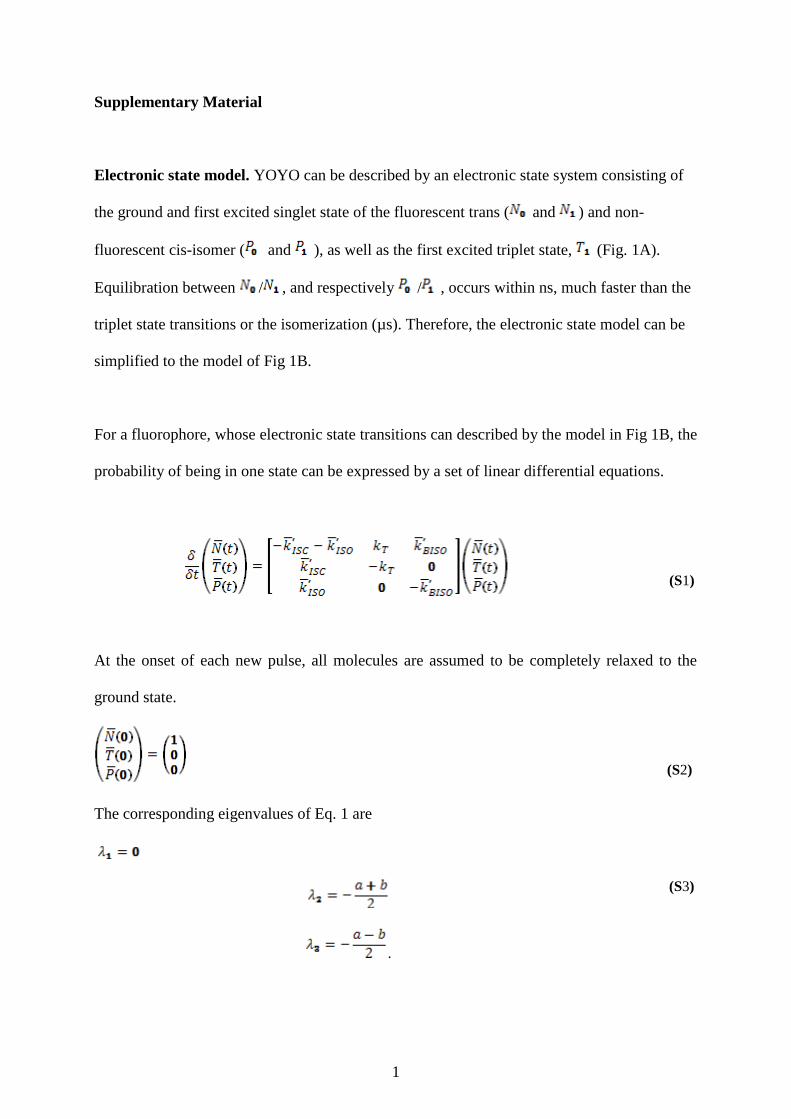
Electronic state model. YOYO can be described by an electronic state system consisting of
the ground and first excited singlet state of the fluorescent trans ( and ) and non-
fluorescent cis-isomer ( and ), as well as the first excited triplet state, (Fig. 1A).
Equilibration between / , and respectively / , occurs within ns, much faster than the
triplet state transitions or the isomerization (µs). Therefore, the electronic state model can be
simplified to the model of Fig 1B.
For a fluorophore, whose electronic state transitions can described by the model in Fig 1B, the
probability of being in one state can be expressed by a set of linear differential equations.
(S1)
At the onset of each new pulse, all molecules are assumed to be completely relaxed to the
ground state.
(S2)
The corresponding eigenvalues of Eq. 1 are
.
(S3)
2
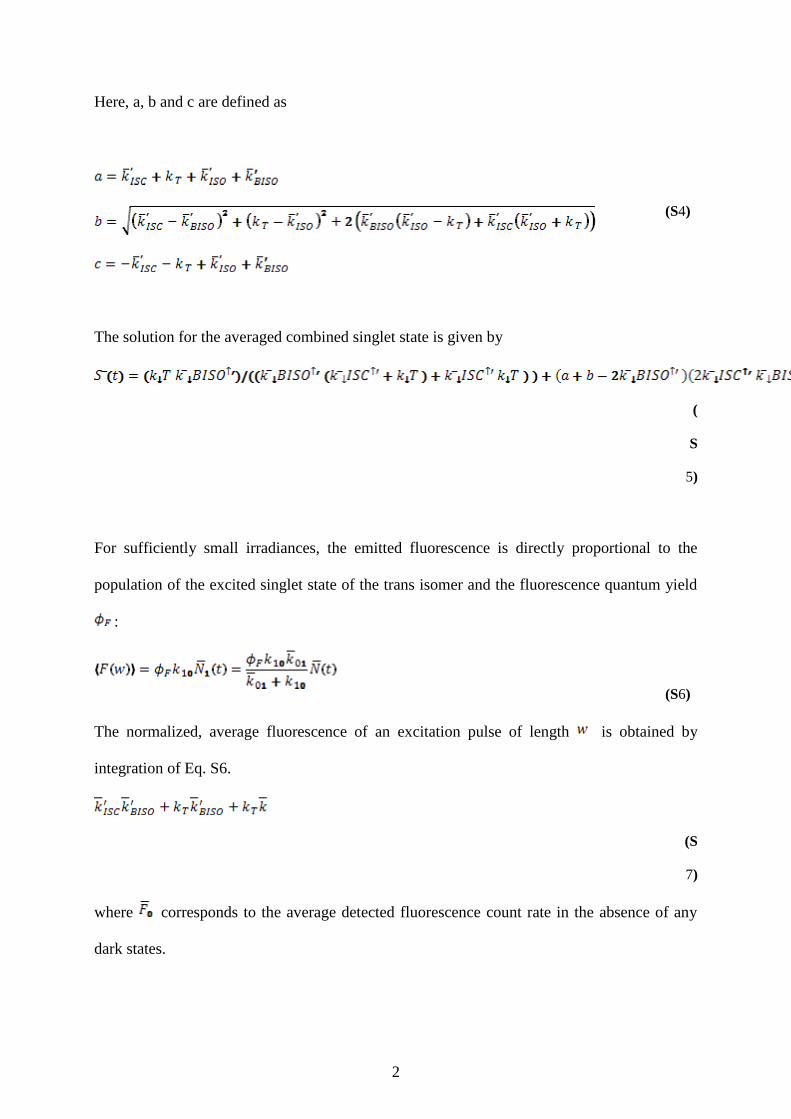
Here, a, b and c are defined as
(S4)
The solution for the averaged combined singlet state is given by
(
S
5)
For sufficiently small irradiances, the emitted fluorescence is directly proportional to the
population of the excited singlet state of the trans isomer and the fluorescence quantum yield
:
(S6)
The normalized, average fluorescence of an excitation pulse of length is obtained by
integration of Eq. S6.
(S
7)
where corresponds to the average detected fluorescence count rate in the absence of any
dark states.
3
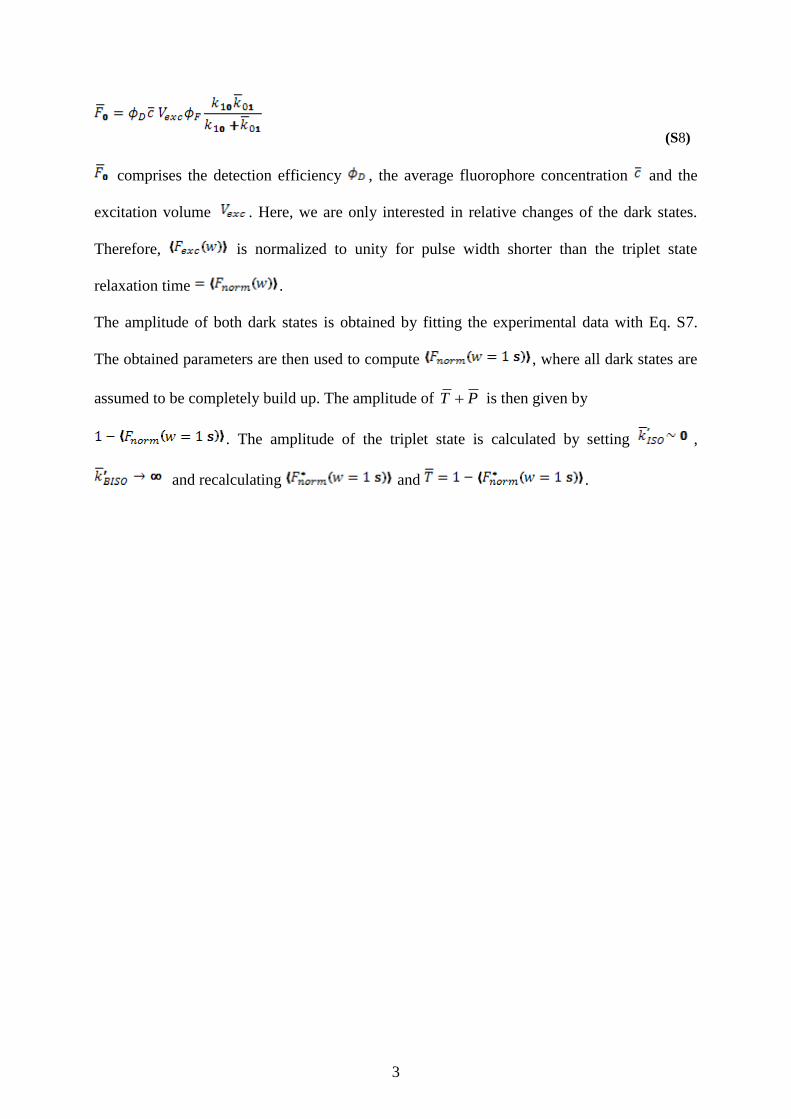
(S8)
comprises the detection efficiency , the average fluorophore concentration and the
excitation volume . Here, we are only interested in relative changes of the dark states.
Therefore, is normalized to unity for pulse width shorter than the triplet state
relaxation time .
The amplitude of both dark states is obtained by fitting the experimental data with Eq. S7.
The obtained parameters are then used to compute , where all dark states are
assumed to be completely build up. The amplitude of PT is then given by
. The amplitude of the triplet state is calculated by setting ,
and recalculating and .