hedge fund tail risk
DESCRIPTION
Hedge Fund Tail Risk. Tobias Adrian and Markus K. Brunnermeier Federal Reserve Bank of New York and Princeton University University of Arizona/Arizona State University September 27/28 th , 2007. - PowerPoint PPT PresentationTRANSCRIPT
1
Hedge Fund Tail RiskHedge Fund Tail Risk
Tobias Adrian and Markus K. BrunnermeierTobias Adrian and Markus K. Brunnermeier
Federal Reserve Bank of New York and Princeton University
University of Arizona/Arizona State UniversitySeptember 27/28th, 2007
The views expressed in this paper are those of the authors and do not necessarily represent those of the Federal Reserve Bank of New York or the Federal Reserve System
2
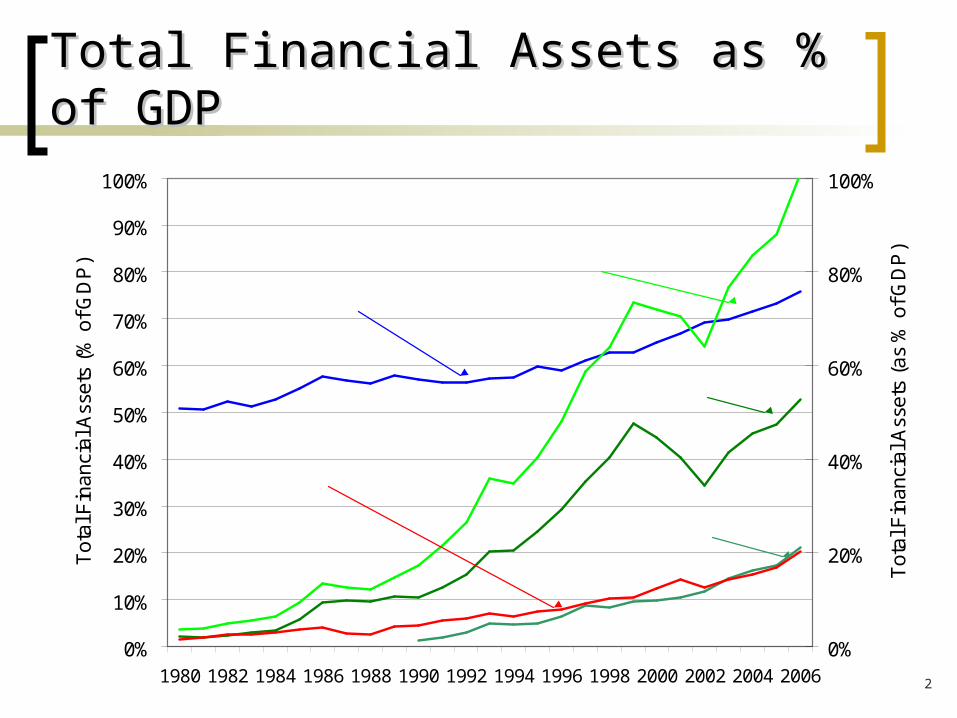
Total Financial Assets as % of GDPTotal Financial Assets as % of GDP
0%
10%
20%
30%
40%
50%
60%
70%
80%
90%
100%
1980 1982 1984 1986 1988 1990 1992 1994 1996 1998 2000 2002 2004 2006
Tot
al F
inan
cial
Ass
ets
(% o
f GD
P)
0%
20%
40%
60%
80%
100%
Tot
al F
inan
cial
Ass
ets
(as
% o
f GD
P)
Security Brokers and Dealers
Commercial Banks
Hedge Funds
Mutual Funds + Hedge Funds + Broker/Dealers
Mutual Funds
3
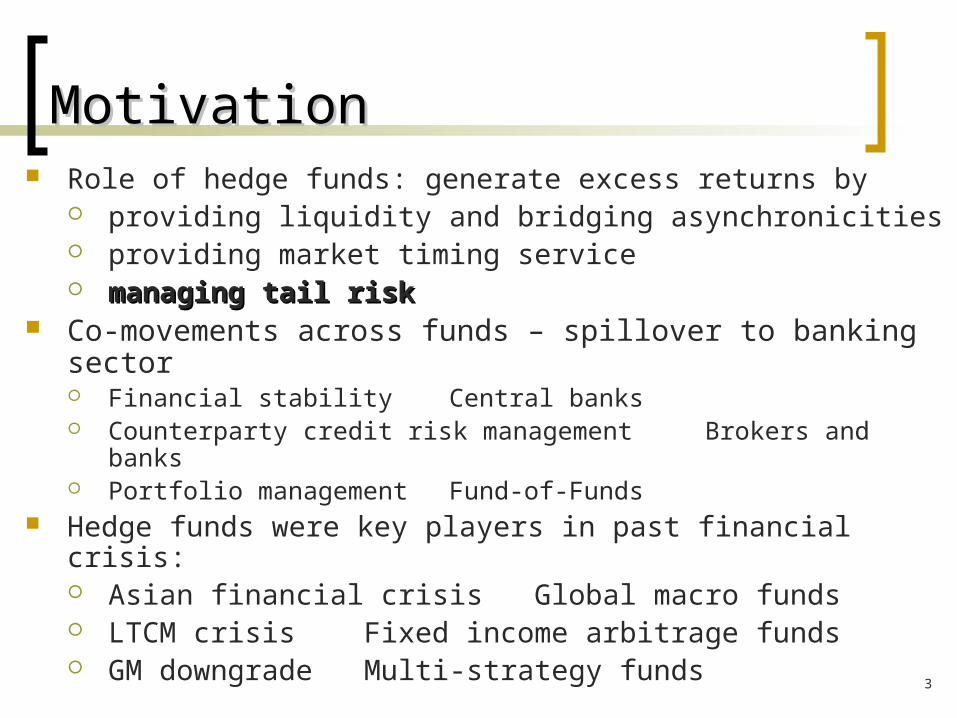
MotivationMotivation Role of hedge funds: generate excess returns by
providing liquidity and bridging asynchronicities providing market timing service managing tail riskmanaging tail risk
Co-movements across funds – spillover to banking sector Financial stability Central banks Counterparty credit risk management Brokers and banks Portfolio management Fund-of-Funds
Hedge funds were key players in past financial crisis: Asian financial crisis Global macro funds LTCM crisis Fixed income arbitrage funds GM downgrade Multi-strategy funds
4
OverviewOverview
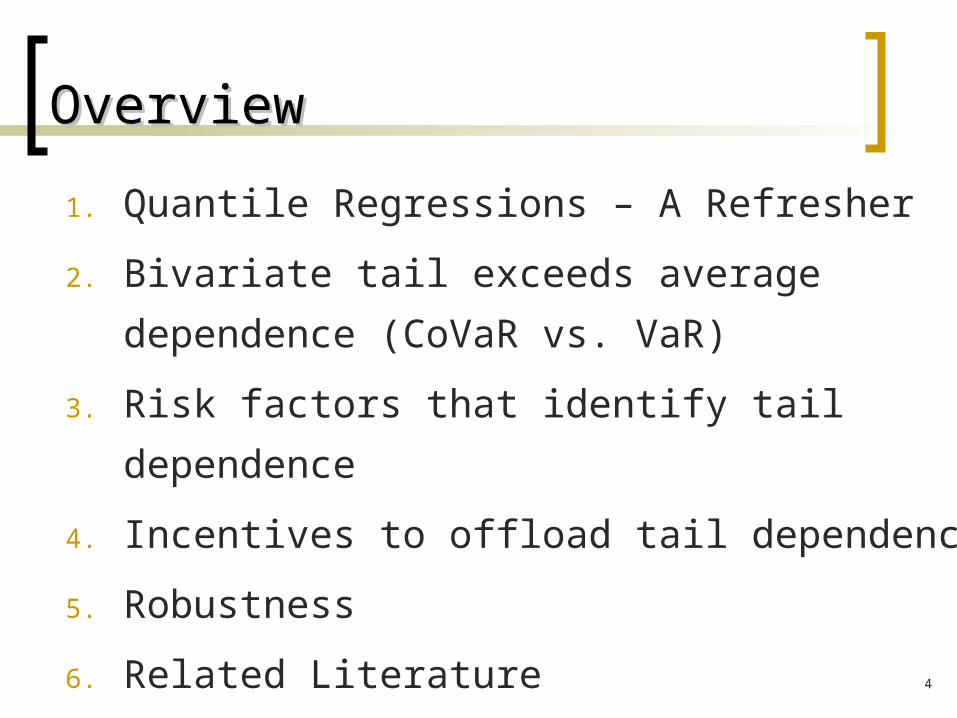
1. Quantile Regressions – A Refresher
2. Bivariate tail exceeds average dependence
(CoVaR vs. VaR)
3. Risk factors that identify tail dependence
4. Incentives to offload tail dependence
5. Robustness
6. Related Literature
5
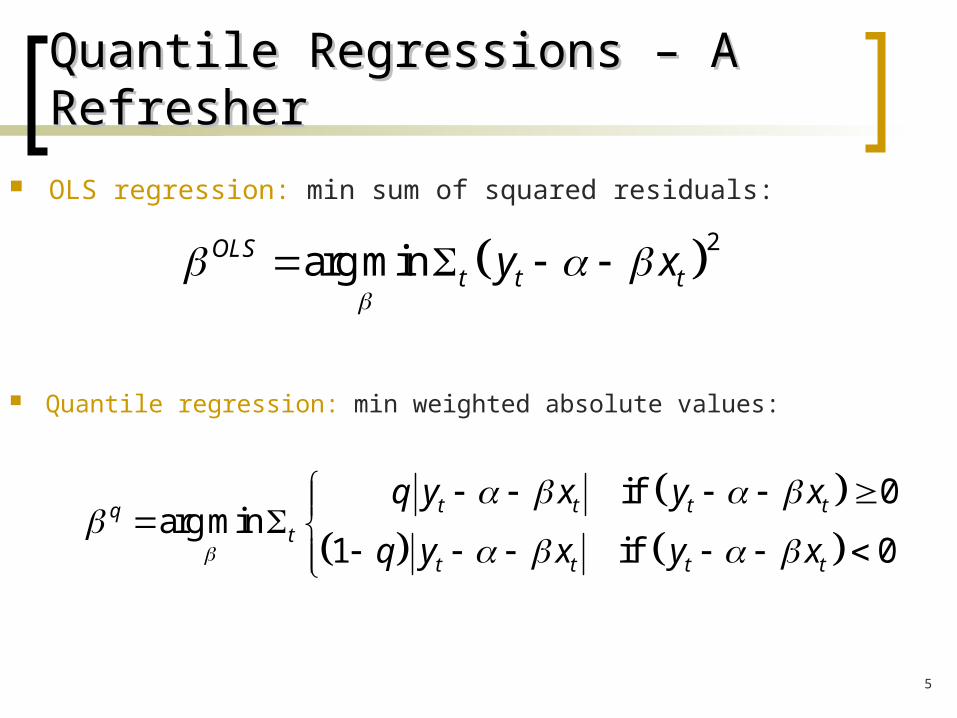
Quantile Regressions – A RefresherQuantile Regressions – A Refresher
OLS regression: min sum of squared residuals:
2arg minOLS
t t ty x
Quantile regression: min weighted absolute values:
if 0
arg min1 if 0
t t t tqt
t t t t
q y x y x
q y x y x
6
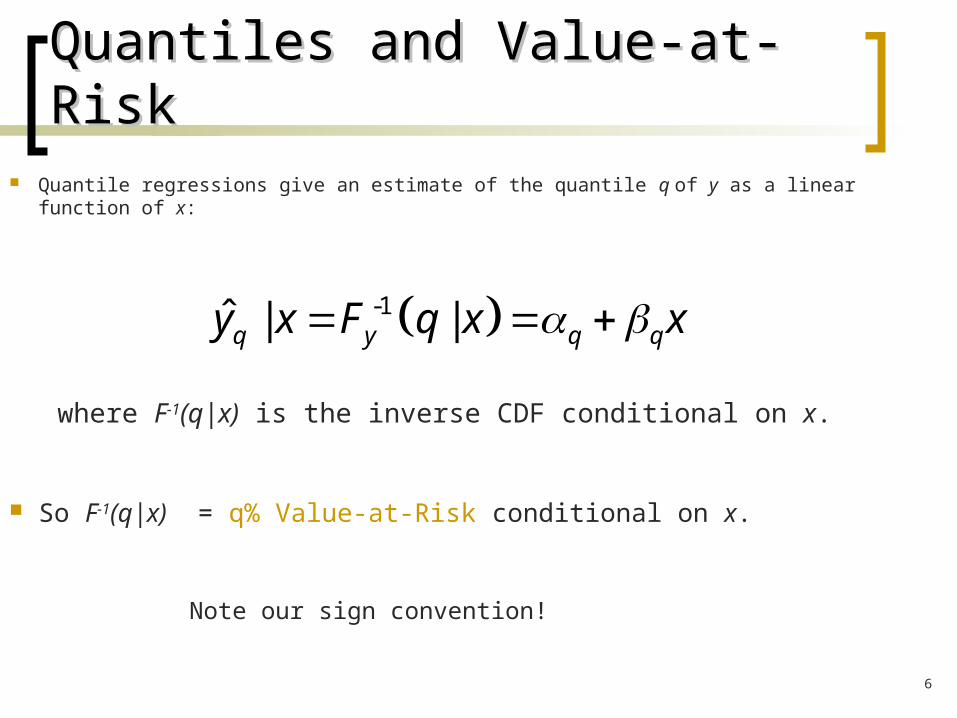
Quantiles and Value-at-RiskQuantiles and Value-at-Risk Quantile regressions give an estimate of the quantile q of y as a linear function of x:
-1ˆ | |q y q qy x F q x x
where F-1(q|x) is the inverse CDF conditional on x.
So F-1(q|x) = q% Value-at-Risk conditional on x.
Note our sign convention!
7
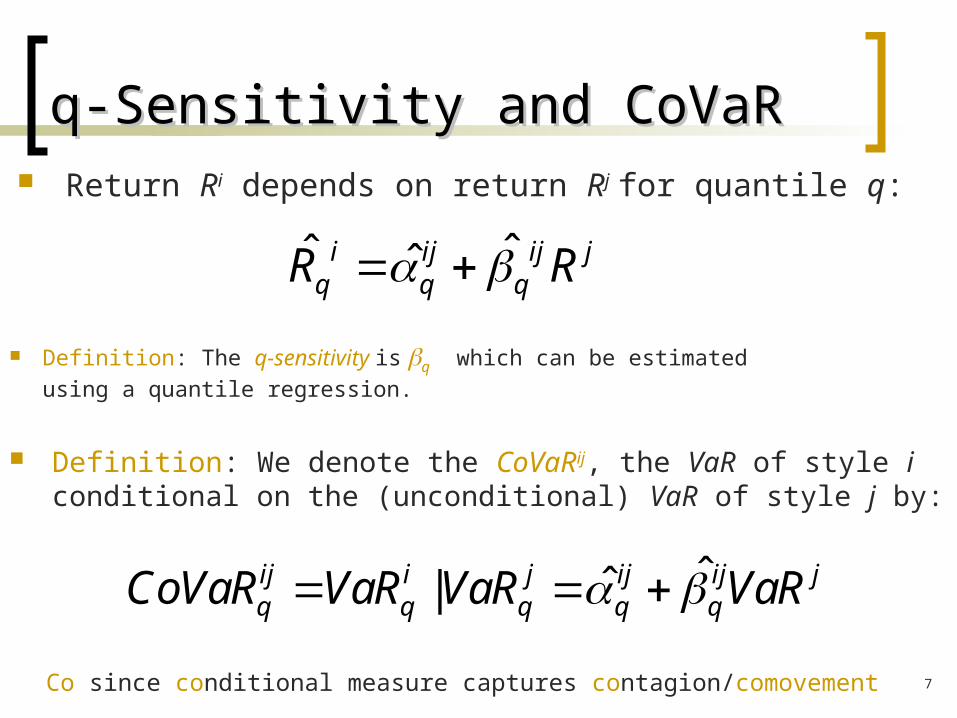
q-Sensitivity and CoVaRq-Sensitivity and CoVaR
ˆˆ ˆi ij ij jq q qR R
Return Ri depends on return Rj for quantile q:
Definition: The q-sensitivity is q which can be estimated
using a quantile regression.
Definition: We denote the CoVaRij, the VaR of style i conditional on the (unconditional) VaR of style j by:
ˆˆ|ij i j ij ij jq q q q qCoVaR VaR VaR VaR
Co since conditional measure captures contagion/comovement
8
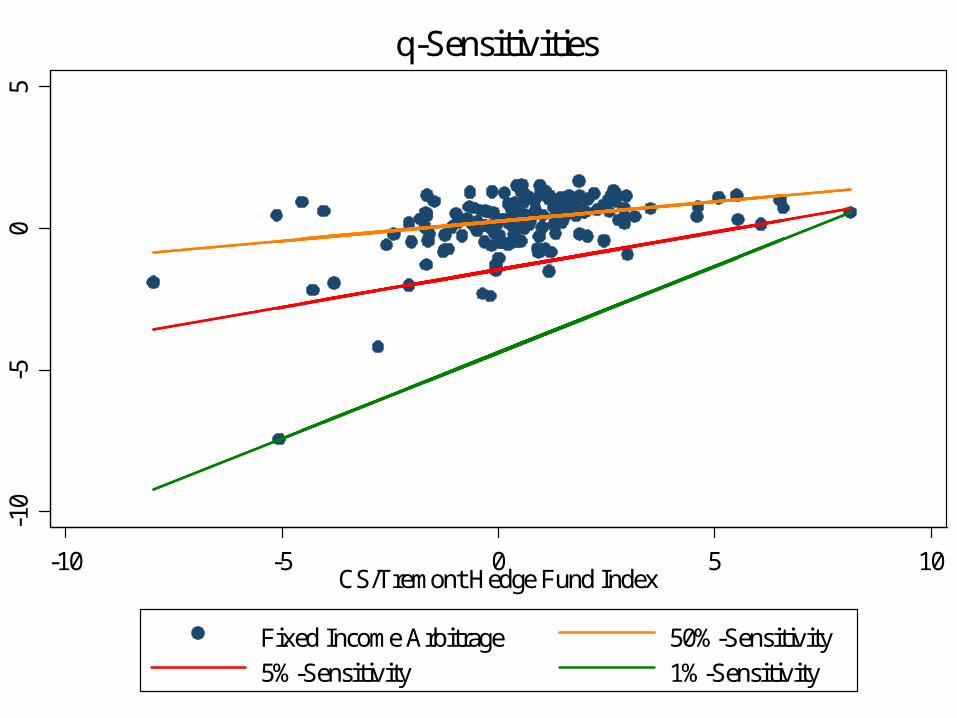
-10
-50
5
-10 -5 0 5 10CS/Tremont Hedge Fund Index
Fixed Income Arbitrage 50%-Sensitivity5%-Sensitivity 1%-Sensitivity
q-Sensitivities
9
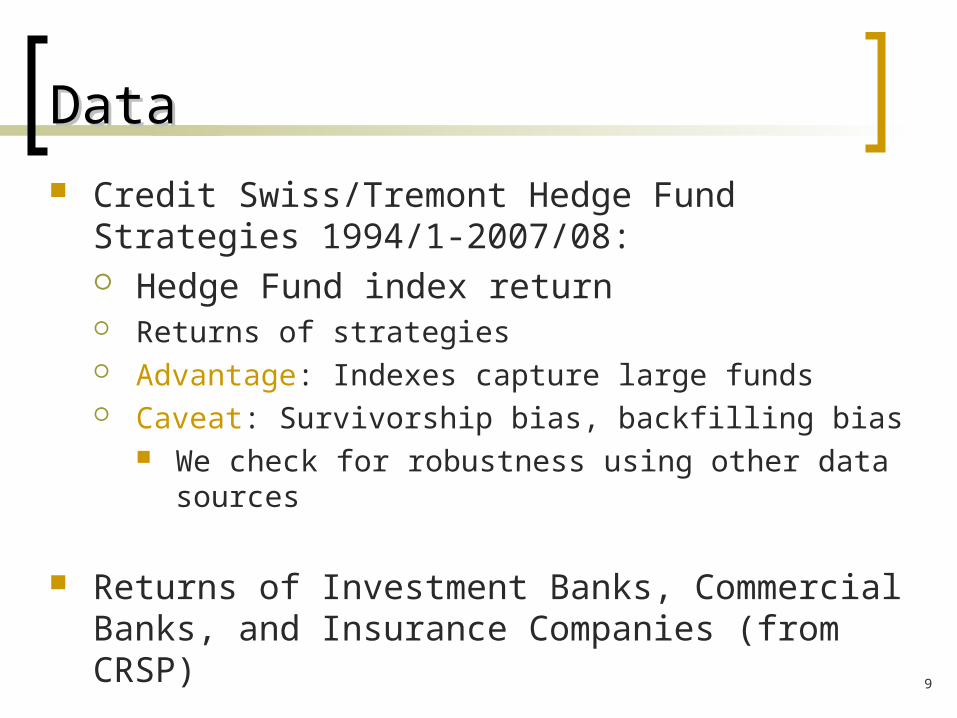
DataData
Credit Swiss/Tremont Hedge Fund Strategies 1994/1-2007/08: Hedge Fund index return Returns of strategies Advantage: Indexes capture large funds Caveat: Survivorship bias, backfilling bias
We check for robustness using other data sources
Returns of Investment Banks, Commercial Banks, and Insurance Companies (from CRSP)
10
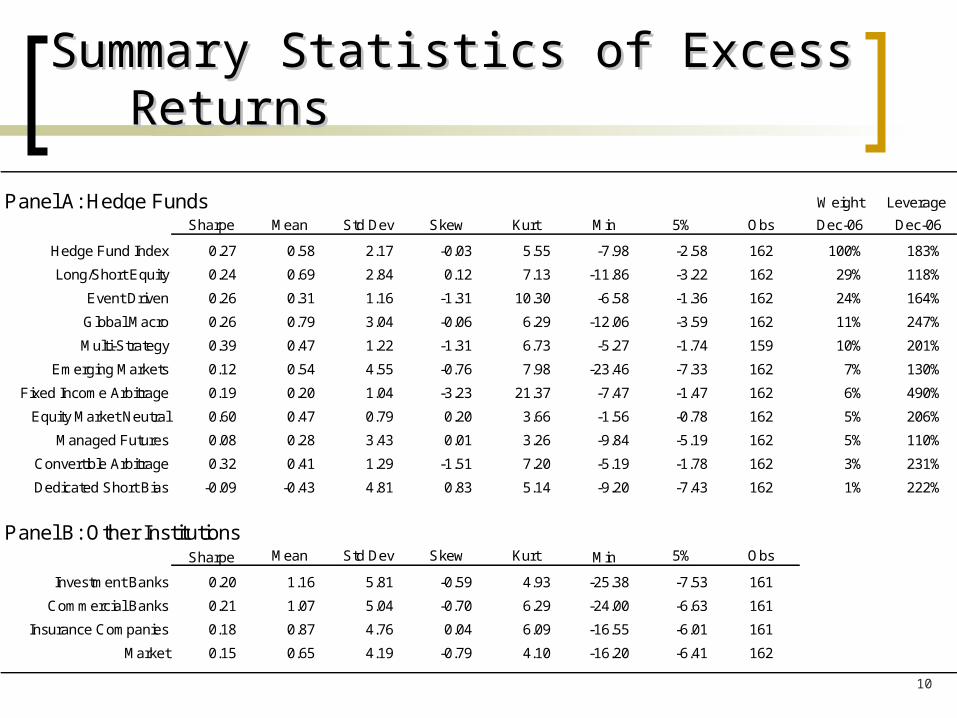
Summary Statistics of Excess ReturnsSummary Statistics of Excess Returns
Weight Leverage
Sharpe Mean Std Dev Skew Kurt Min 5% Obs Dec-06 Dec-06
Hedge Fund Index 0.27 0.58 2.17 -0.03 5.55 -7.98 -2.58 162 100% 183%
Long/Short Equity 0.24 0.69 2.84 0.12 7.13 -11.86 -3.22 162 29% 118%
Event Driven 0.26 0.31 1.16 -1.31 10.30 -6.58 -1.36 162 24% 164%
Global Macro 0.26 0.79 3.04 -0.06 6.29 -12.06 -3.59 162 11% 247%
Multi-Strategy 0.39 0.47 1.22 -1.31 6.73 -5.27 -1.74 159 10% 201%
Emerging Markets 0.12 0.54 4.55 -0.76 7.98 -23.46 -7.33 162 7% 130%
Fixed Income Arbitrage 0.19 0.20 1.04 -3.23 21.37 -7.47 -1.47 162 6% 490%
Equity Market Neutral 0.60 0.47 0.79 0.20 3.66 -1.56 -0.78 162 5% 206%
Managed Futures 0.08 0.28 3.43 0.01 3.26 -9.84 -5.19 162 5% 110%
Convertible Arbitrage 0.32 0.41 1.29 -1.51 7.20 -5.19 -1.78 162 3% 231%
Dedicated Short Bias -0.09 -0.43 4.81 0.83 5.14 -9.20 -7.43 162 1% 222%
Sharpe Mean Std Dev Skew Kurt Min 5% Obs
Investment Banks 0.20 1.16 5.81 -0.59 4.93 -25.38 -7.53 161
Commercial Banks 0.21 1.07 5.04 -0.70 6.29 -24.00 -6.63 161
Insurance Companies 0.18 0.87 4.76 0.04 6.09 -16.55 -6.01 161
Market 0.15 0.65 4.19 -0.79 4.10 -16.20 -6.41 162
Panel A: Hedge Funds
Panel B: Other Institutions
11
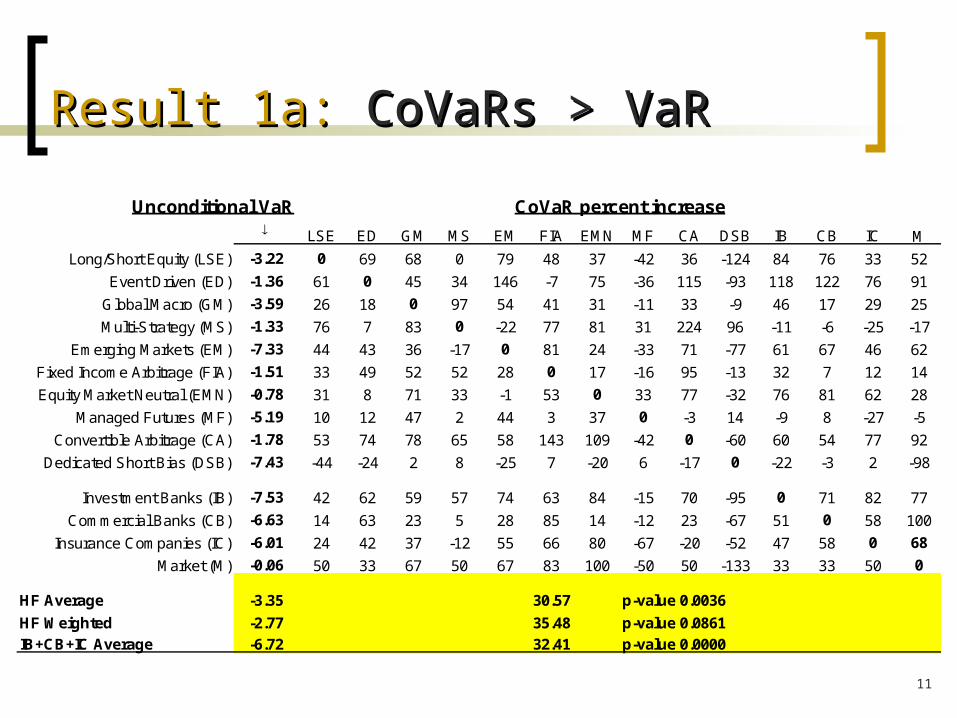
Result 1a: Result 1a: CoVaRs > VaRCoVaRs > VaR
Unconditional VaR LSE ED GM MS EM FIA EMN MF CA DSB IB CB IC M
Long/Short Equity (LSE) -3.22 0 69 68 0 79 48 37 -42 36 -124 84 76 33 52
Event Driven (ED) -1.36 61 0 45 34 146 -7 75 -36 115 -93 118 122 76 91
Global Macro (GM) -3.59 26 18 0 97 54 41 31 -11 33 -9 46 17 29 25
Multi-Strategy (MS) -1.33 76 7 83 0 -22 77 81 31 224 96 -11 -6 -25 -17
Emerging Markets (EM) -7.33 44 43 36 -17 0 81 24 -33 71 -77 61 67 46 62
Fixed Income Arbitrage (FIA) -1.51 33 49 52 52 28 0 17 -16 95 -13 32 7 12 14
Equity Market Neutral (EMN) -0.78 31 8 71 33 -1 53 0 33 77 -32 76 81 62 28
Managed Futures (MF) -5.19 10 12 47 2 44 3 37 0 -3 14 -9 8 -27 -5
Convertible Arbitrage (CA) -1.78 53 74 78 65 58 143 109 -42 0 -60 60 54 77 92
Dedicated Short Bias (DSB) -7.43 -44 -24 2 8 -25 7 -20 6 -17 0 -22 -3 2 -98
Investment Banks (IB) -7.53 42 62 59 57 74 63 84 -15 70 -95 0 71 82 77
Commercial Banks (CB) -6.63 14 63 23 5 28 85 14 -12 23 -67 51 0 58 100
Insurance Companies (IC) -6.01 24 42 37 -12 55 66 80 -67 -20 -52 47 58 0 68
Market (M) -0.06 50 33 67 50 67 83 100 -50 50 -133 33 33 50 0
HF Average -3.35 p-value 0.0036
HF Weighted -2.77 p-value 0.0861
IB+CB+IC Average -6.72 p-value 0.0000
35.48
32.41
CoVaR percent increase
30.57
12
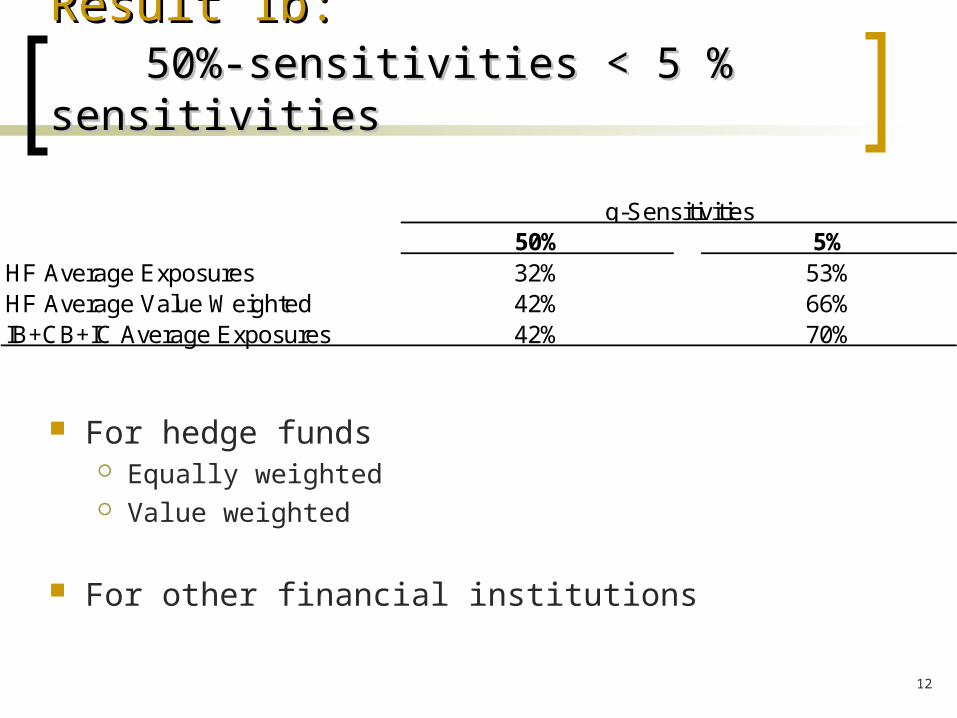
Result 1b: Result 1b: 50%-sensitivities < 5 % sensitivities50%-sensitivities < 5 % sensitivities
50% 5%HF Average Exposures 32% 53%HF Average Value Weighted 42% 66%IB+CB+IC Average Exposures 42% 70%
q-Sensitivities
For hedge funds Equally weighted Value weighted
For other financial institutions
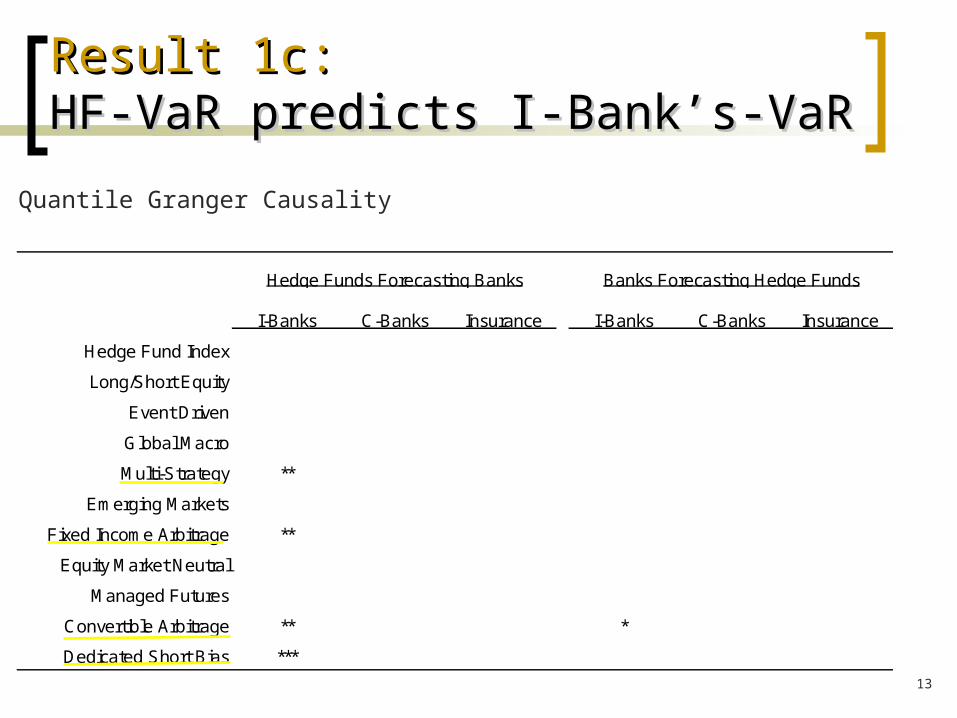
13
Result 1c:Result 1c: HF-VaR predicts I-Bank’s-VaRHF-VaR predicts I-Bank’s-VaR
I-Banks C-Banks Insurance I-Banks C-Banks Insurance
Hedge Fund Index
Long/Short Equity
Event Driven
Global Macro
Multi-Strategy **
Emerging Markets
Fixed Income Arbitrage **
Equity Market Neutral
Managed Futures
Convertible Arbitrage ** *
Dedicated Short Bias ***
Hedge Funds Forecasting Banks Banks Forecasting Hedge Funds
Quantile Granger Causality
14
OverviewOverview
1. Quantile Regressions – A Refresher
2. Bivariate tail exceeds average dependence
(CoVaR vs. VaR)
3. Risk factors that identify tail dependence
4. Incentives to offload tail dependence
5. Robustness
6. Related Literature
15
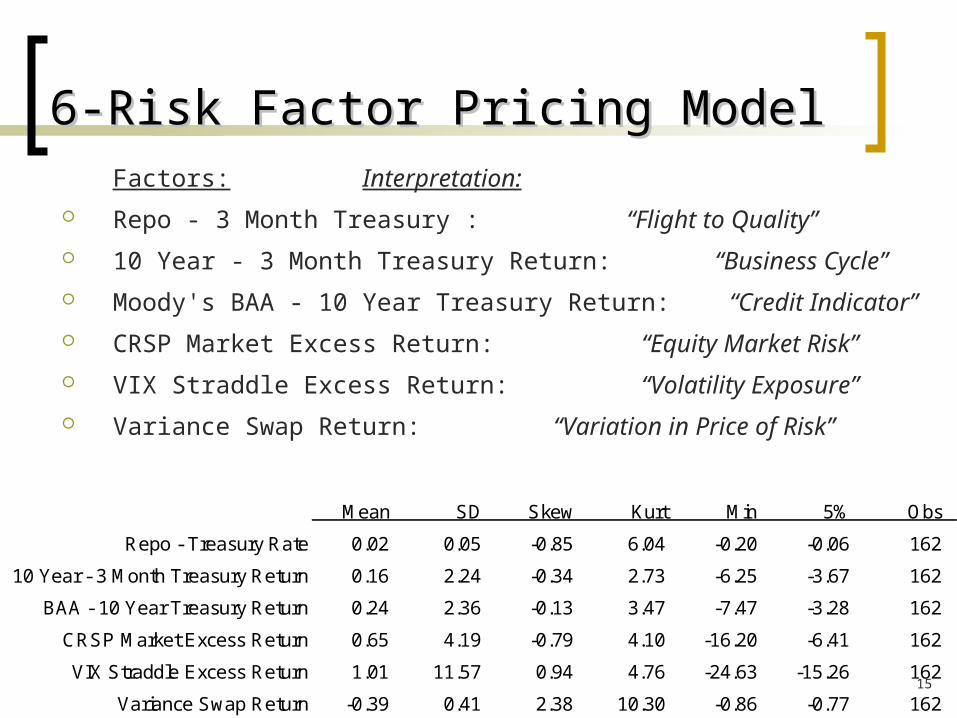
6-Risk Factor Pricing Model6-Risk Factor Pricing ModelFactors: Interpretation:
Repo - 3 Month Treasury : “Flight to Quality”
10 Year - 3 Month Treasury Return: “Business Cycle”
Moody's BAA - 10 Year Treasury Return: “Credit Indicator”
CRSP Market Excess Return: “Equity Market Risk”
VIX Straddle Excess Return: “Volatility Exposure”
Variance Swap Return: “Variation in Price of Risk”
Mean SD Skew Kurt Min 5% Obs
Repo - Treasury Rate 0.02 0.05 -0.85 6.04 -0.20 -0.06 162
10 Year - 3 Month Treasury Return 0.16 2.24 -0.34 2.73 -6.25 -3.67 162
BAA - 10 Year Treasury Return 0.24 2.36 -0.13 3.47 -7.47 -3.28 162
CRSP Market Excess Return 0.65 4.19 -0.79 4.10 -16.20 -6.41 162
VIX Straddle Excess Return 1.01 11.57 0.94 4.76 -24.63 -15.26 162
Variance Swap Return -0.39 0.41 2.38 10.30 -0.86 -0.77 162
16
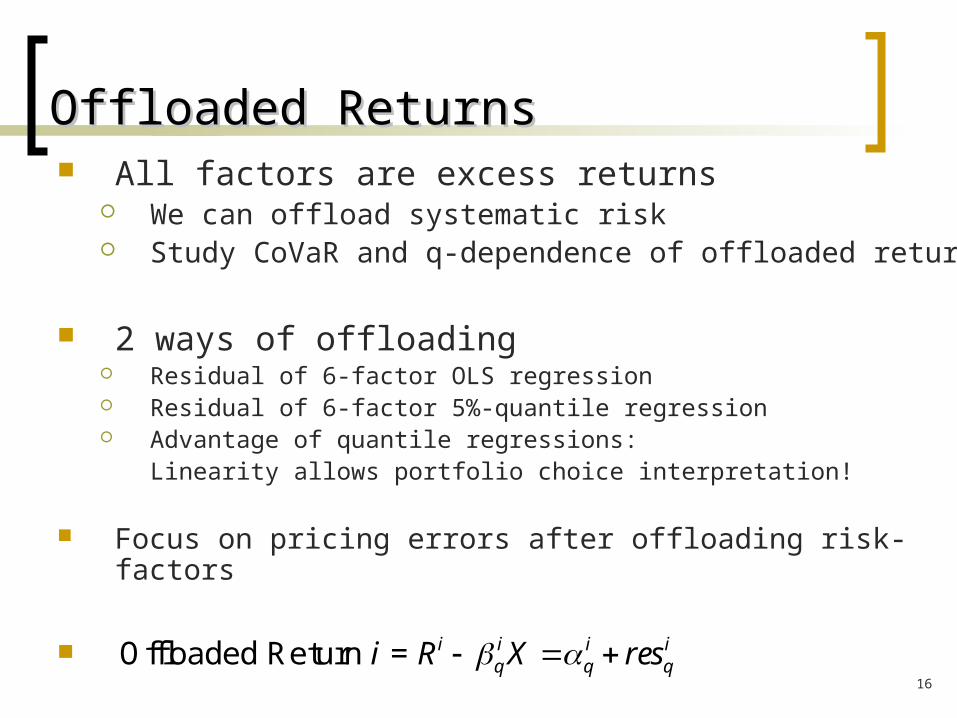
Offloaded ReturnsOffloaded Returns
Offloaded Return = i i i iq q qi R X res
All factors are excess returns We can offload systematic risk Study CoVaR and q-dependence of offloaded returns
2 ways of offloading Residual of 6-factor OLS regression Residual of 6-factor 5%-quantile regression Advantage of quantile regressions:
Linearity allows portfolio choice interpretation!
Focus on pricing errors after offloading risk-factors
17
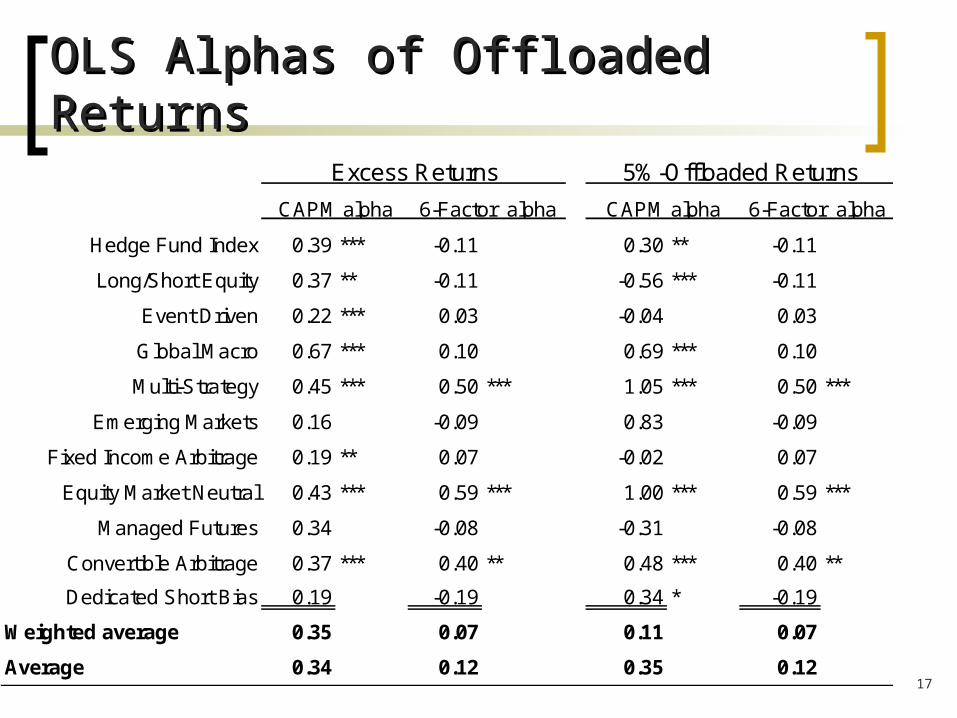
OLS Alphas of Offloaded ReturnsOLS Alphas of Offloaded Returns
Hedge Fund Index 0.39 *** -0.11 0.30 ** -0.11
Long/Short Equity 0.37 ** -0.11 -0.56 *** -0.11
Event Driven 0.22 *** 0.03 -0.04 0.03
Global Macro 0.67 *** 0.10 0.69 *** 0.10
Multi-Strategy 0.45 *** 0.50 *** 1.05 *** 0.50 ***
Emerging Markets 0.16 -0.09 0.83 -0.09
Fixed Income Arbitrage 0.19 ** 0.07 -0.02 0.07
Equity Market Neutral 0.43 *** 0.59 *** 1.00 *** 0.59 ***
Managed Futures 0.34 -0.08 -0.31 -0.08
Convertible Arbitrage 0.37 *** 0.40 ** 0.48 *** 0.40 **
Dedicated Short Bias 0.19 -0.19 0.34 * -0.19
Weighted average 0.35 0.07 0.11 0.07
Average 0.34 0.12 0.35 0.12
Excess Returns
CAPM alpha
5%-Offloaded Returns
CAPM alpha 6-Factor alpha 6-Factor alpha
18
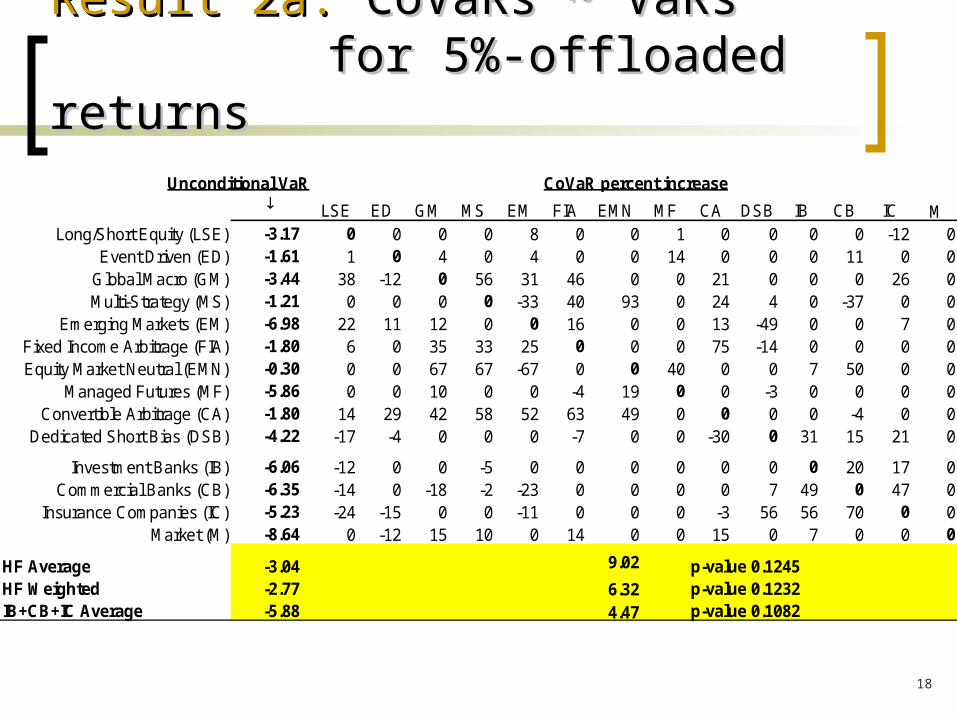
Result 2a:Result 2a: CoVaRs CoVaRs ~~ VaRs VaRs for for 5%-offloaded returns5%-offloaded returns
Unconditional VaR LSE ED GM MS EM FIA EMN MF CA DSB IB CB IC M
Long/Short Equity (LSE) -3.17 0 0 0 0 8 0 0 1 0 0 0 0 -12 0Event Driven (ED) -1.61 1 0 4 0 4 0 0 14 0 0 0 11 0 0
Global Macro (GM) -3.44 38 -12 0 56 31 46 0 0 21 0 0 0 26 0Multi-Strategy (MS) -1.21 0 0 0 0 -33 40 93 0 24 4 0 -37 0 0
Emerging Markets (EM) -6.98 22 11 12 0 0 16 0 0 13 -49 0 0 7 0Fixed Income Arbitrage (FIA) -1.80 6 0 35 33 25 0 0 0 75 -14 0 0 0 0Equity Market Neutral (EMN) -0.30 0 0 67 67 -67 0 0 40 0 0 7 50 0 0
Managed Futures (MF) -5.86 0 0 10 0 0 -4 19 0 0 -3 0 0 0 0Convertible Arbitrage (CA) -1.80 14 29 42 58 52 63 49 0 0 0 0 -4 0 0
Dedicated Short Bias (DSB) -4.22 -17 -4 0 0 0 -7 0 0 -30 0 31 15 21 0
Investment Banks (IB) -6.06 -12 0 0 -5 0 0 0 0 0 0 0 20 17 0Commercial Banks (CB) -6.35 -14 0 -18 -2 -23 0 0 0 0 7 49 0 47 0
Insurance Companies (IC) -5.23 -24 -15 0 0 -11 0 0 0 -3 56 56 70 0 0Market (M) -8.64 0 -12 15 10 0 14 0 0 15 0 7 0 0 0
HF Average -3.04 9.02 p-value 0.1245HF Weighted -2.77 6.32 p-value 0.1232IB+CB+IC Average -5.88 4.47 p-value 0.1082
CoVaR percent increase
19
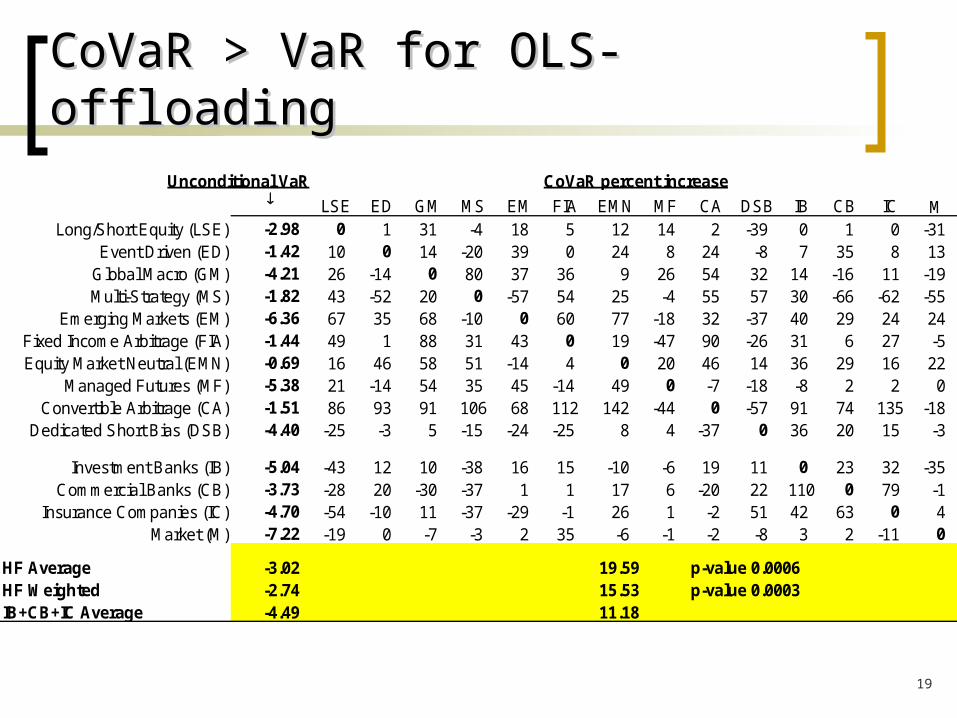
CoVaR > VaR for OLS-offloadingCoVaR > VaR for OLS-offloadingUnconditional VaR
LSE ED GM MS EM FIA EMN MF CA DSB IB CB IC MLong/Short Equity (LSE) -2.98 0 1 31 -4 18 5 12 14 2 -39 0 1 0 -31
Event Driven (ED) -1.42 10 0 14 -20 39 0 24 8 24 -8 7 35 8 13Global Macro (GM) -4.21 26 -14 0 80 37 36 9 26 54 32 14 -16 11 -19Multi-Strategy (MS) -1.82 43 -52 20 0 -57 54 25 -4 55 57 30 -66 -62 -55
Emerging Markets (EM) -6.36 67 35 68 -10 0 60 77 -18 32 -37 40 29 24 24Fixed Income Arbitrage (FIA) -1.44 49 1 88 31 43 0 19 -47 90 -26 31 6 27 -5Equity Market Neutral (EMN) -0.69 16 46 58 51 -14 4 0 20 46 14 36 29 16 22
Managed Futures (MF) -5.38 21 -14 54 35 45 -14 49 0 -7 -18 -8 2 2 0Convertible Arbitrage (CA) -1.51 86 93 91 106 68 112 142 -44 0 -57 91 74 135 -18
Dedicated Short Bias (DSB) -4.40 -25 -3 5 -15 -24 -25 8 4 -37 0 36 20 15 -3
Investment Banks (IB) -5.04 -43 12 10 -38 16 15 -10 -6 19 11 0 23 32 -35Commercial Banks (CB) -3.73 -28 20 -30 -37 1 1 17 6 -20 22 110 0 79 -1
Insurance Companies (IC) -4.70 -54 -10 11 -37 -29 -1 26 1 -2 51 42 63 0 4Market (M) -7.22 -19 0 -7 -3 2 35 -6 -1 -2 -8 3 2 -11 0
HF Average -3.02 19.59 p-value 0.0006HF Weighted -2.74 15.53 p-value 0.0003IB+CB+IC Average -4.49 11.18
CoVaR percent increase
20
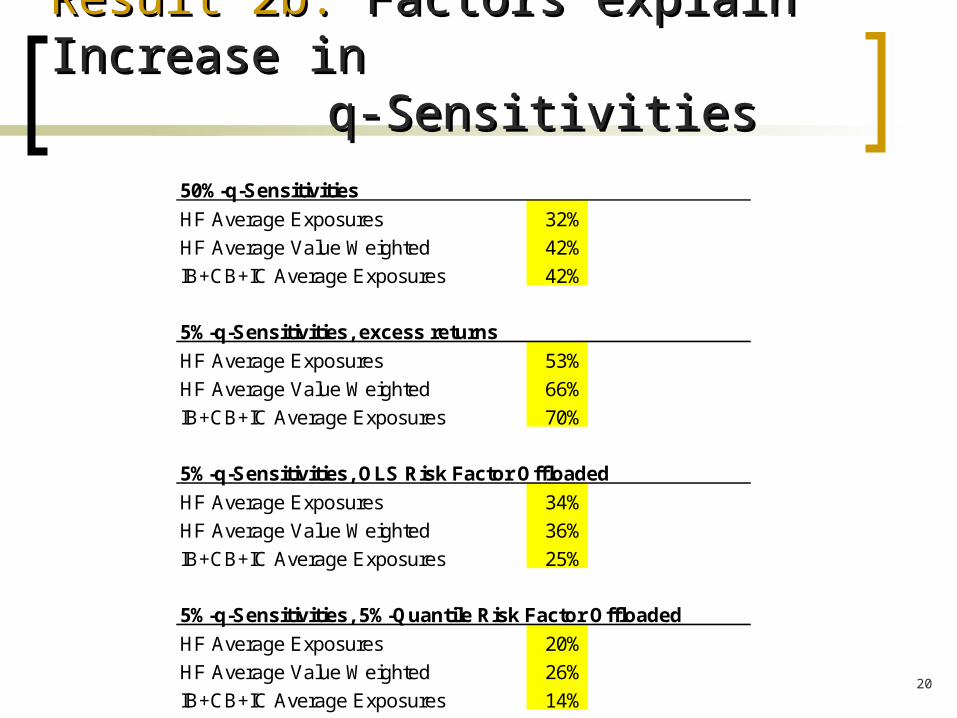
Result 2b: Result 2b: Factors explain Increase in Factors explain Increase in q-Sensitivities q-Sensitivities
50%-q-Sensitivities
HF Average Exposures 32%
HF Average Value Weighted 42%
IB+CB+IC Average Exposures 42%
5%-q-Sensitivities, excess returns
HF Average Exposures 53%
HF Average Value Weighted 66%
IB+CB+IC Average Exposures 70%
5%-q-Sensitivities, OLS Risk Factor Offloaded
HF Average Exposures 34%
HF Average Value Weighted 36%
IB+CB+IC Average Exposures 25%
5%-q-Sensitivities, 5%-Quantile Risk Factor Offloaded
HF Average Exposures 20%
HF Average Value Weighted 26%
IB+CB+IC Average Exposures 14%
21
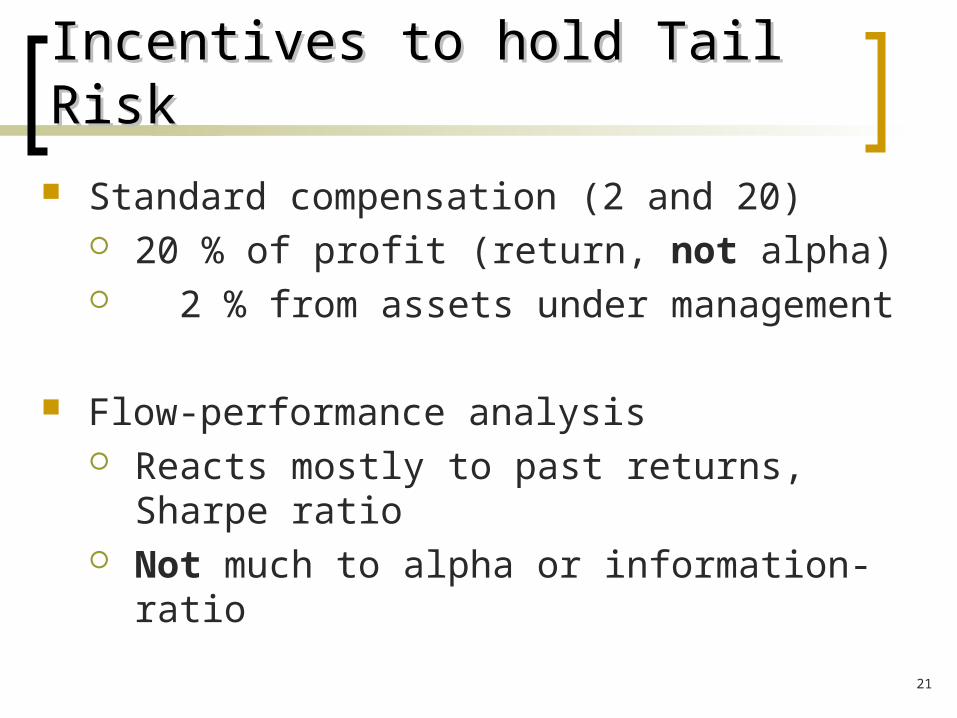
Incentives to hold Tail RiskIncentives to hold Tail Risk
Standard compensation (2 and 20) 20 % of profit (return, not alpha) 2 % from assets under management
Flow-performance analysis Reacts mostly to past returns, Sharpe ratio Not much to alpha or information-ratio
22
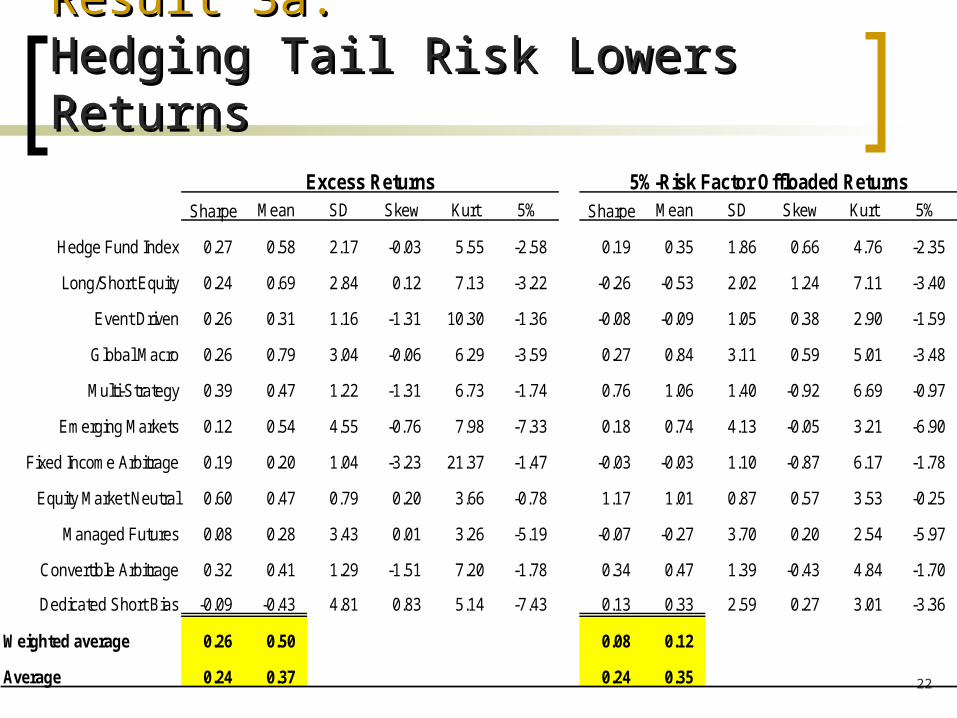
Result 3a: Result 3a: Hedging Tail Risk Lowers ReturnsHedging Tail Risk Lowers Returns
Sharpe Mean SD Skew Kurt 5% Sharpe Mean SD Skew Kurt 5%
Hedge Fund Index 0.27 0.58 2.17 -0.03 5.55 -2.58 0.19 0.35 1.86 0.66 4.76 -2.35
Long/Short Equity 0.24 0.69 2.84 0.12 7.13 -3.22 -0.26 -0.53 2.02 1.24 7.11 -3.40
Event Driven 0.26 0.31 1.16 -1.31 10.30 -1.36 -0.08 -0.09 1.05 0.38 2.90 -1.59
Global Macro 0.26 0.79 3.04 -0.06 6.29 -3.59 0.27 0.84 3.11 0.59 5.01 -3.48
Multi-Strategy 0.39 0.47 1.22 -1.31 6.73 -1.74 0.76 1.06 1.40 -0.92 6.69 -0.97
Emerging Markets 0.12 0.54 4.55 -0.76 7.98 -7.33 0.18 0.74 4.13 -0.05 3.21 -6.90
Fixed Income Arbitrage 0.19 0.20 1.04 -3.23 21.37 -1.47 -0.03 -0.03 1.10 -0.87 6.17 -1.78
Equity Market Neutral 0.60 0.47 0.79 0.20 3.66 -0.78 1.17 1.01 0.87 0.57 3.53 -0.25
Managed Futures 0.08 0.28 3.43 0.01 3.26 -5.19 -0.07 -0.27 3.70 0.20 2.54 -5.97
Convertible Arbitrage 0.32 0.41 1.29 -1.51 7.20 -1.78 0.34 0.47 1.39 -0.43 4.84 -1.70
Dedicated Short Bias -0.09 -0.43 4.81 0.83 5.14 -7.43 0.13 0.33 2.59 0.27 3.01 -3.36
Weighted average 0.26 0.50 0.08 0.12
Average 0.24 0.37 0.24 0.35
5%-Risk Factor Offloaded ReturnsExcess Returns
23
0.0
5.1
.15
.2.2
5
-10 -5 0 5 10
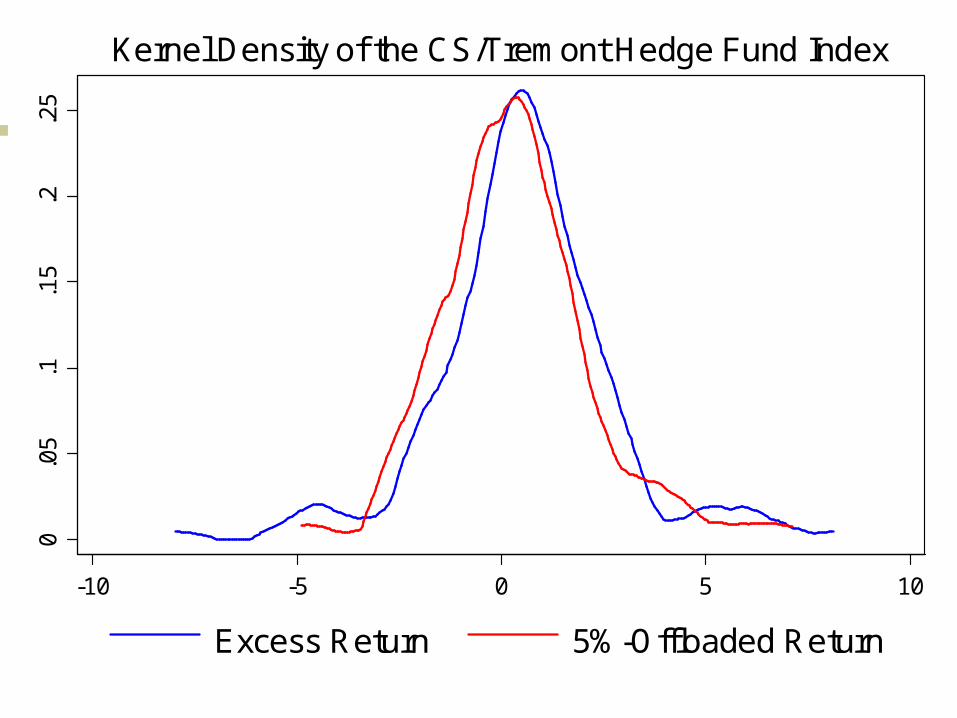
Excess Return 5%-Offloaded Return
Kernel Density of the CS/Tremont Hedge Fund Index
24
0.0
5.1
.15
.2.2
5
-10 -5 0 5 10
CS/Tremont Hedge Fund Index
0.0
5.1
.15
.2.2
5-10 -5 0 5 10 15
Long/Short Equity
0.1
.2.3
.4
-6 -4 -2 0 2 4
Event Driven
0.0
5.1
.15
.2.2
5
-10 -5 0 5 10
Global Macro
0.1
.2.3
.4
-6 -4 -2 0 2 4
Multi-Strategy
0.0
5.1
.15
-20 -10 0 10 20
Emerging Markets
0.2
.4.6
-8 -6 -4 -2 0 2
Fixed Income Arbitrage
0.2
.4.6
-2 0 2 4
Equity Market Neutral
0.0
5.1
.15
-10 -5 0 5 10
Managed Futures
0.1
.2.3
.4.5
-5 0 5
Convertible Arbitrage0
.05
.1.1
5
-10 0 10 20
Dedicated Short Bias
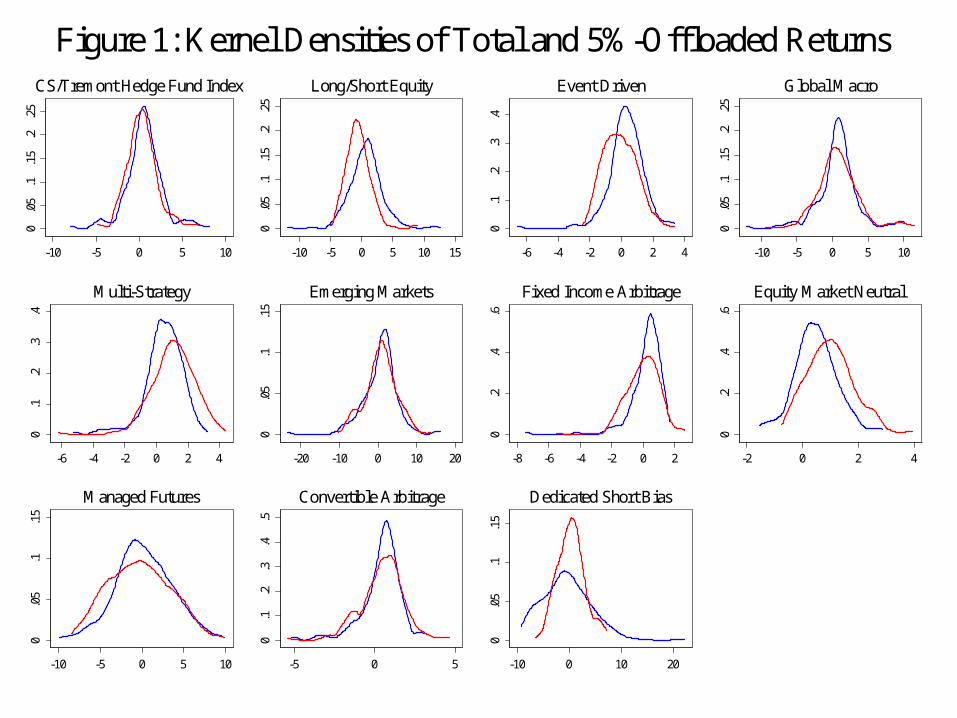
Figure 1: Kernel Densities of Total and 5%-Offloaded Returns
25
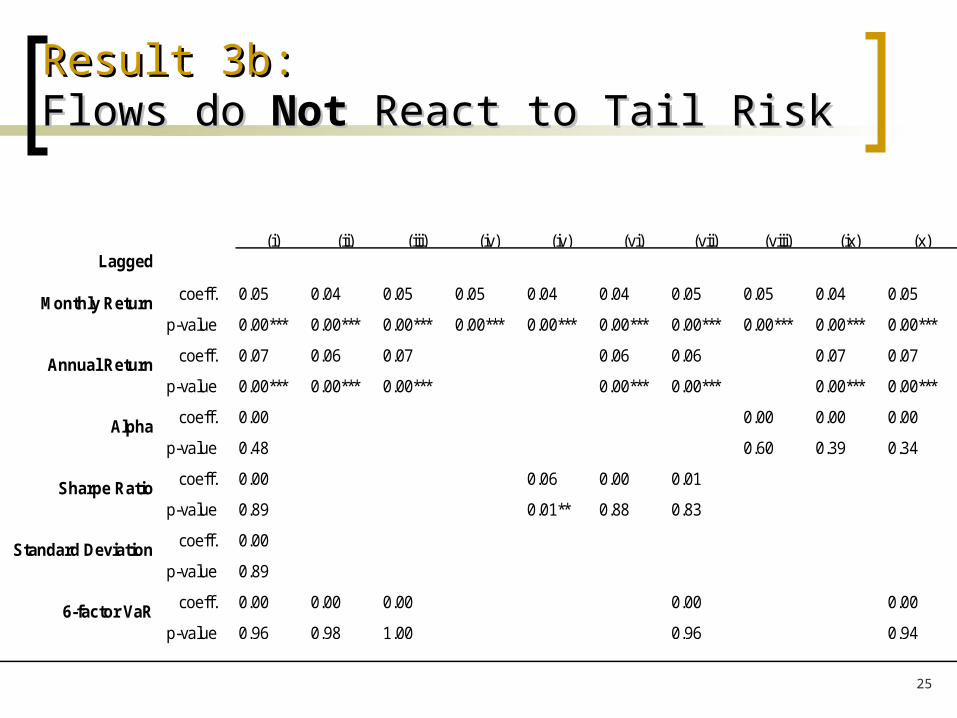
Result 3b:Result 3b:Flows do Flows do Not Not React to Tail RiskReact to Tail Risk
(i) (ii) (iii) (iv) (iv) (vi) (vii) (viii) (ix) (x)Lagged
coeff. 0.05 0.04 0.05 0.05 0.04 0.04 0.05 0.05 0.04 0.05
p-value 0.00*** 0.00*** 0.00*** 0.00*** 0.00*** 0.00*** 0.00*** 0.00*** 0.00*** 0.00***
coeff. 0.07 0.06 0.07 0.06 0.06 0.07 0.07
p-value 0.00*** 0.00*** 0.00*** 0.00*** 0.00*** 0.00*** 0.00***
coeff. 0.00 0.00 0.00 0.00
p-value 0.48 0.60 0.39 0.34
coeff. 0.00 0.06 0.00 0.01
p-value 0.89 0.01** 0.88 0.83
coeff. 0.00
p-value 0.89
coeff. 0.00 0.00 0.00 0.00 0.00
p-value 0.96 0.98 1.00 0.96 0.94
Sharpe Ratio
Standard Deviation
6-factor VaR
Monthly Return
Annual Return
Alpha
26
OverviewOverview
1. Quantile Regressions – A Refresher
2. Bivariate tail exceeds average dependence
(CoVaR vs. VaR)
3. Risk factors that identify tail dependence
4. Incentives to offload tail dependence
5. Robustness
6. Related Literature

27
Robustness AnalysisRobustness Analysis
Alternative measure of sensitivities: GARCH covariances
Alternative measure of tail risk: Expected Shortfall
Other hedge fund indices: HFR and Altvest
Other pricing factors
28
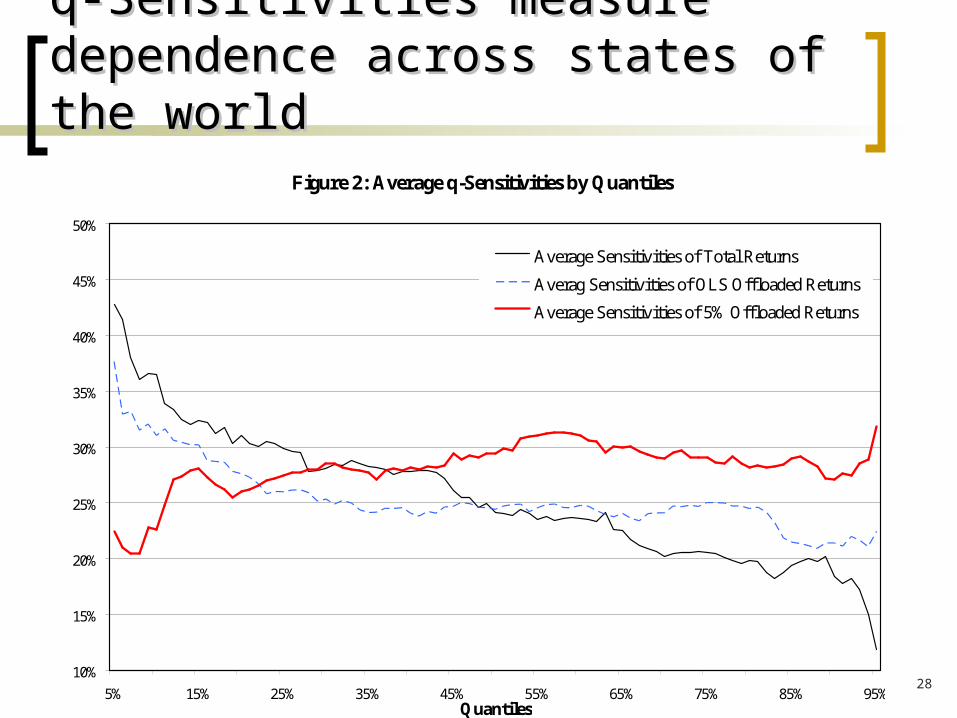
q-Sensitivities measure dependence q-Sensitivities measure dependence across states of the worldacross states of the world
Figure 2: Average q-Sensitivities by Quantiles
10%
15%
20%
25%
30%
35%
40%
45%
50%
5% 15% 25% 35% 45% 55% 65% 75% 85% 95%Quantiles
Average Sensitivities of Total Returns
Averag Sensitivities of OLS Offloaded Returns
Average Sensitivities of 5% Offloaded Returns
29
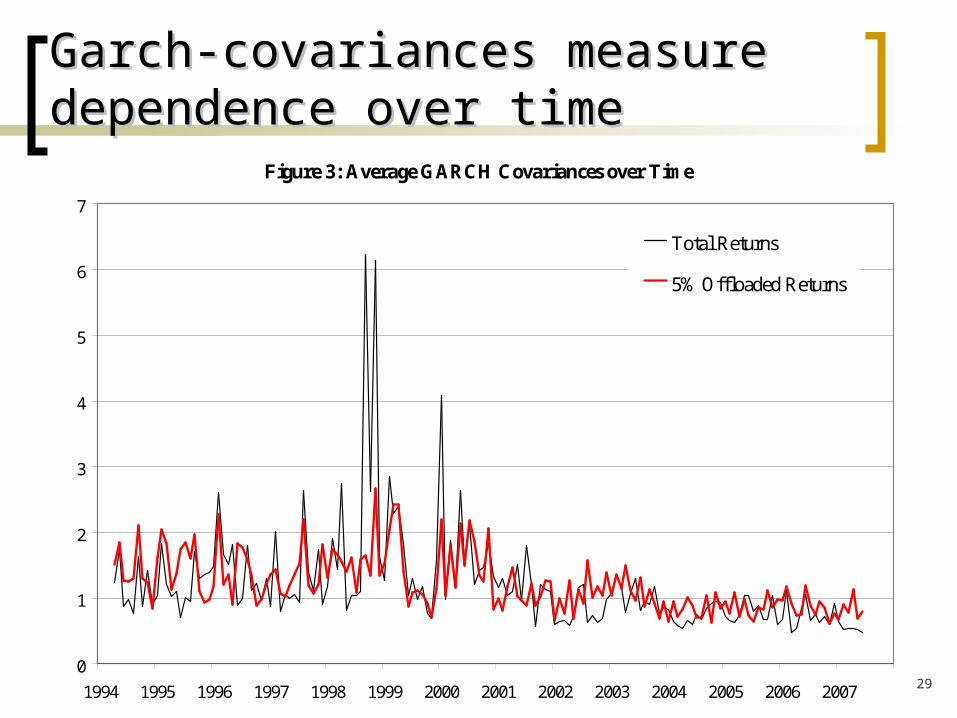
Garch-covariances measure Garch-covariances measure dependence over timedependence over time
Figure 3: Average GARCH Covariances over Time
0
1
2
3
4
5
6
7
1994 1995 1996 1997 1998 1999 2000 2001 2002 2003 2004 2005 2006 2007
Total Returns
5% Offloaded Returns
30
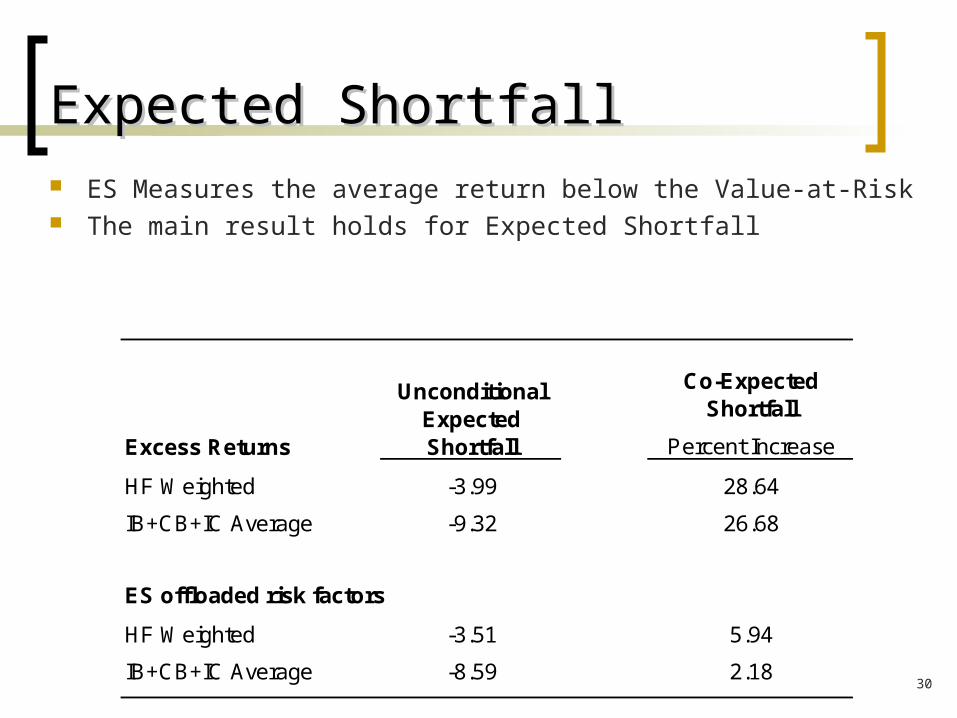
Expected ShortfallExpected Shortfall
Co-Expected Shortfall
Excess Returns Percent Increase
HF Weighted -3.99 28.64
IB+CB+IC Average -9.32 26.68
ES offloaded risk factors
HF Weighted -3.51 5.94
IB+CB+IC Average -8.59 2.18
Unconditional Expected Shortfall
ES Measures the average return below the Value-at-Risk The main result holds for Expected Shortfall
31
Other Indices and Pricing FactorsOther Indices and Pricing Factors
The main results go through with alternative hedge
fund indices (HFR and Altvest)
The key risk factors for tail risk is the Repo –
Treasury spread, and the Volatiliy Swap.
32
Related LiteratureRelated Literature Dependence / contagion:
Boyson, Stahel, Stulz (2006), Chan, Getmansky, Haas, Lo (2006), Patton (2007), Adrian (2007)
Hedge fund tail risk: Asness, Krail, Liew (2001), Agarwal & Naik (2004), Bali, Gokcan, Liang (2007), Liang & Park (2007), Bondarenko (2004)
Pricing factors: Fung and Hsieh (2001, 2002, 2003), Hasanhodzic & Lo (2007)
Finance applications of quantile regressions:
Bassett and Chen (2001), Chernozhukov and Umantsev (2001)
33
SummarySummary
Hedge funds have incentives to hold tail risk Holding tail risk increases returns and flows do
not react to tail risk
There is spillover of tail risk among hedge funds and between hedge funds and banks (contemporaneous and lagged)
The increase in CoVaR relative to VaR can be explained with liquid, tradable risk factors
34
Future ResearchFuture Research
Focus on broader set of financial institutions
Additional robustness checks: Autocorrelation, non-linear CoVaR, pricing factors
Include out of the money option factor