hedge fund and absolute return strategies · > increased allocations to hedge fund and absolute...
TRANSCRIPT
www.fitchratings.com
Fund & Asset Manager Rating Group
March 2011
Sector Update
Hedge Fund and Absolute Return Strategies
Contents Highlights.............................1
Sector Trends........................2
Performance: Good End to 2010...................2
Stronger Flows to HFs as Investors Look to Diversify Sources of Risks and Return ...........................3
Market Commentary................4
The Big Picture: Main Driving Themes in 2010 and Beyond ......4
Strategies Review...................5
Highlights > Increased allocations to hedge fund and absolute return strategies from
institutional investors have materialised in 2010 as they look to diversify sources of performance out of mainstream risk assets. In Fitch Ratings’ view, this post financial crisis change is structural, partly driven by regulation changes that push institutional investors to take active risk while satisfying regulatory de‐risking of their balance sheet.
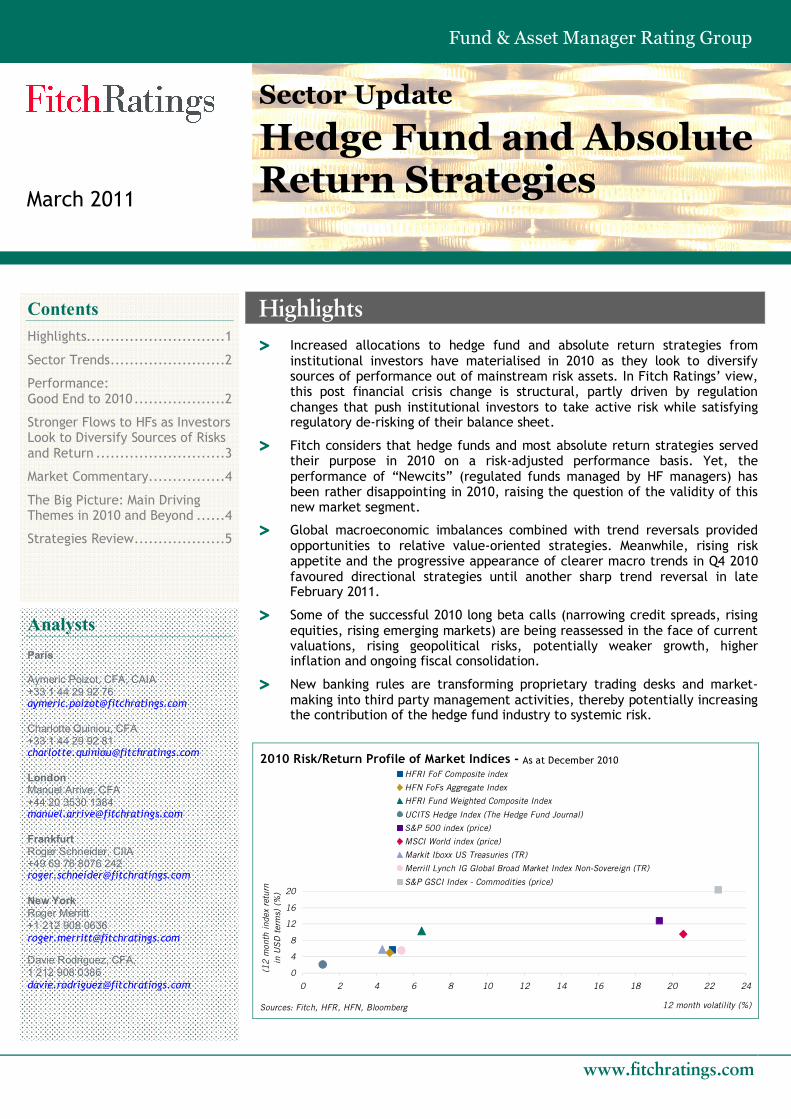
> Fitch considers that hedge funds and most absolute return strategies served their purpose in 2010 on a risk‐adjusted performance basis. Yet, the performance of “Newcits” (regulated funds managed by HF managers) has been rather disappointing in 2010, raising the question of the validity of this new market segment.
> Global macroeconomic imbalances combined with trend reversals provided opportunities to relative value‐oriented strategies. Meanwhile, rising risk appetite and the progressive appearance of clearer macro trends in Q4 2010 favoured directional strategies until another sharp trend reversal in late February 2011.
> Some of the successful 2010 long beta calls (narrowing credit spreads, rising equities, rising emerging markets) are being reassessed in the face of current valuations, rising geopolitical risks, potentially weaker growth, higher inflation and ongoing fiscal consolidation.
> New banking rules are transforming proprietary trading desks and market‐ making into third party management activities, thereby potentially increasing the contribution of the hedge fund industry to systemic risk.
0
4
8
12
16
20
0 2 4 6 8 10 12 14 16 18 20 22 24
12 month volatility (%)
(12
mon
th i
ndex
ret
urn
in U
SD
ter
ms)
(%
)
HFRI FoF Composite index
HFN FoFs Aggregate Index
HFRI Fund Weighted Composite Index
UCITS Hedge Index (The Hedge Fund Journal)
S&P 500 index (price)
MSCI World index (price)
Markit Iboxx US Treasuries (TR)
Merrill Lynch IG Global Broad Market Index Non-Sovereign (TR)
S&P GSCI Index - Commodities (price)
2010 Risk/Return Profile of Market Indices ‐ As at December 2010
Sources: Fitch, HFR, HFN, Bloomberg
Analysts Paris
Aymeric Poizot, CFA, CAIA +33 1 44 29 92 76 [email protected]
Charlotte Quiniou, CFA +33 1 44 29 92 81 [email protected]
London Manuel Arrive, CFA +44 20 3530 1384 [email protected]
Frankfurt Roger Schneider, CIIA +49 69 76 8076 242 [email protected]
New York Roger Merritt +1 212 908 0636 [email protected]
Davie Rodriguez, CFA, 1 212 908 0386 [email protected]
2
Sector Update Hedge Fund and Absolute Return Strategies
Sector Trends
Performance: Good End to 2010
Table 1 — Return Figures — Market and Alternative Investment Indices
Cur.
Jan‐Feb 2011 return
(%)
Q4 2010 return
(%)
Q3 2010 return
(%)
2010 return
(%)
2010 volatility
(%) 2010 return/risk
ratio (%)
2010 correlation with
S&P500
HFRI FoF Composite index USD 0.03 3.6 3.3 5.7 4.9 1.2 0.90 Hedge funds
HFRI Fund Weighted Composite Index
USD 0.5 5.4 5.0 10.3 6.4 1.6 0.95
UCITS Hedge Index USD ‐0.3 (Jan)
1.3 0.9 2.1 1.1 1.9 0.82 UCITS
Lipper Global Abs Retrn Med. EUR 1.54 1.0 1.0 4.0 5.9 0.2 0.79
S&P 500 index (price) USD 2.3 10.2 10.7 12.8 19.3 0.7
MSCI World index (price) USD 2.2 8.6 13.2 9.6 20.6 0.5 0.98
Markit Iboxx US Treasuries (TR)
USD 0.1 ‐2.8 2.8 5.8 4.3 1.4 ‐0.75
Merrill Lynch IG Global Broad Market Index Non‐Sovereign (TR)
USD 0.4 ‐1.0 6.0 5.5 5.3 1.0 0.46
Market indices
S&P GSCI Index ‐ Commodities (price)
USD 3.7 15.7 10.3 20.4 22.5 0.9 0.87
Source: Fitch, HFR, UCITS Hedge, Bloomberg, The Hedge Fund Journal
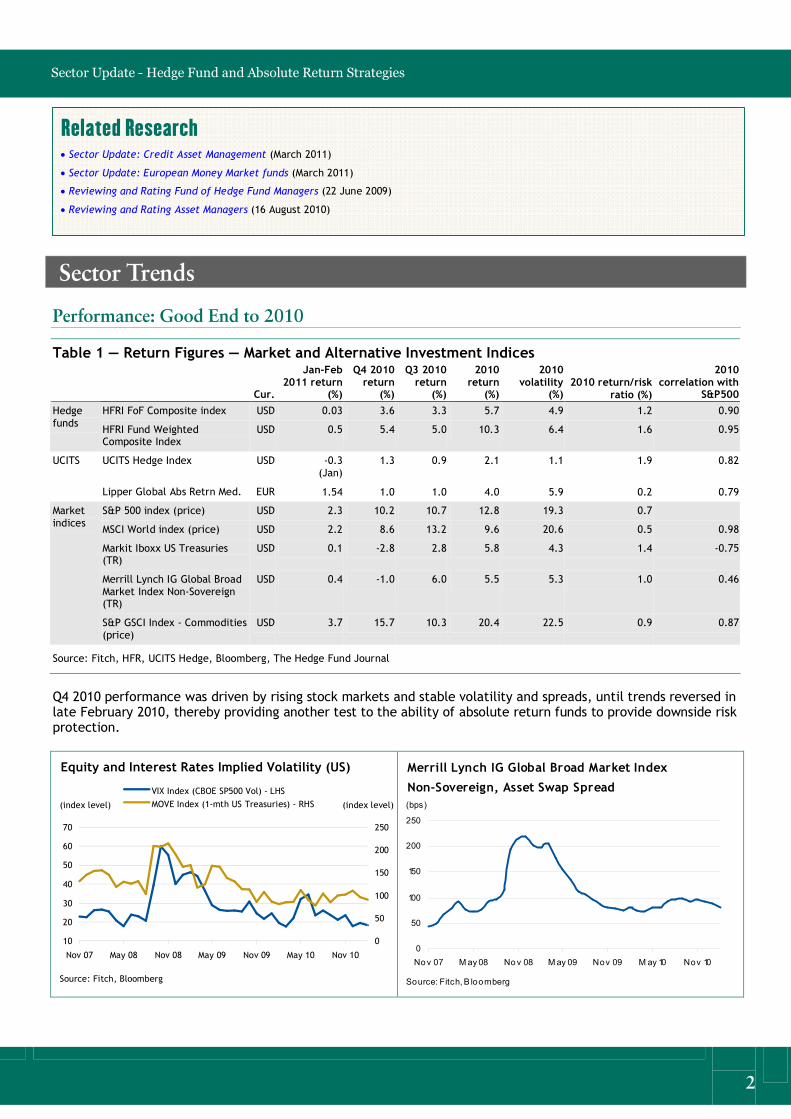
Q4 2010 performance was driven by rising stock markets and stable volatility and spreads, until trends reversed in late February 2010, thereby providing another test to the ability of absolute return funds to provide downside risk protection.
10
20
30
40
50
60
70
Nov 07 May 08 Nov 08 May 09 Nov 09 May 10 Nov 10
0
50
100
150
200
250
VIX Index (CBOE SP500 Vol) ‐ LHS MOVE Index (1‐mth US Treasuries) ‐ RHS (index level)
Equity and Interest Rates Implied Volatility (US)
Source: Fitch, Bloomberg
(index level)
0
50
100
150
200
250
Nov 07 May 08 Nov 08 May 09 Nov 09 M ay 10 Nov 10
(bps)
Merrill Lynch IG Global Broad Market Index
Non‐Sovereign, Asset Swap Spread
Source: Fitch, B loomberg
Related Research • Sector Update: Credit Asset Management (March 2011)
• Sector Update: European Money Market funds (March 2011)
• Reviewing and Rating Fund of Hedge Fund Managers (22 June 2009)
• Reviewing and Rating Asset Managers (16 August 2010)
3
Fund & Asset Manager Rating Group
30 40 50 60 70 80 90
100 110
Nov 07
Feb 08
May 08
Aug 08
Nov 08
Feb 09
May 09
Aug 09
Nov 09
Feb 10
May 10
Aug 10
Nov 10
Feb 11
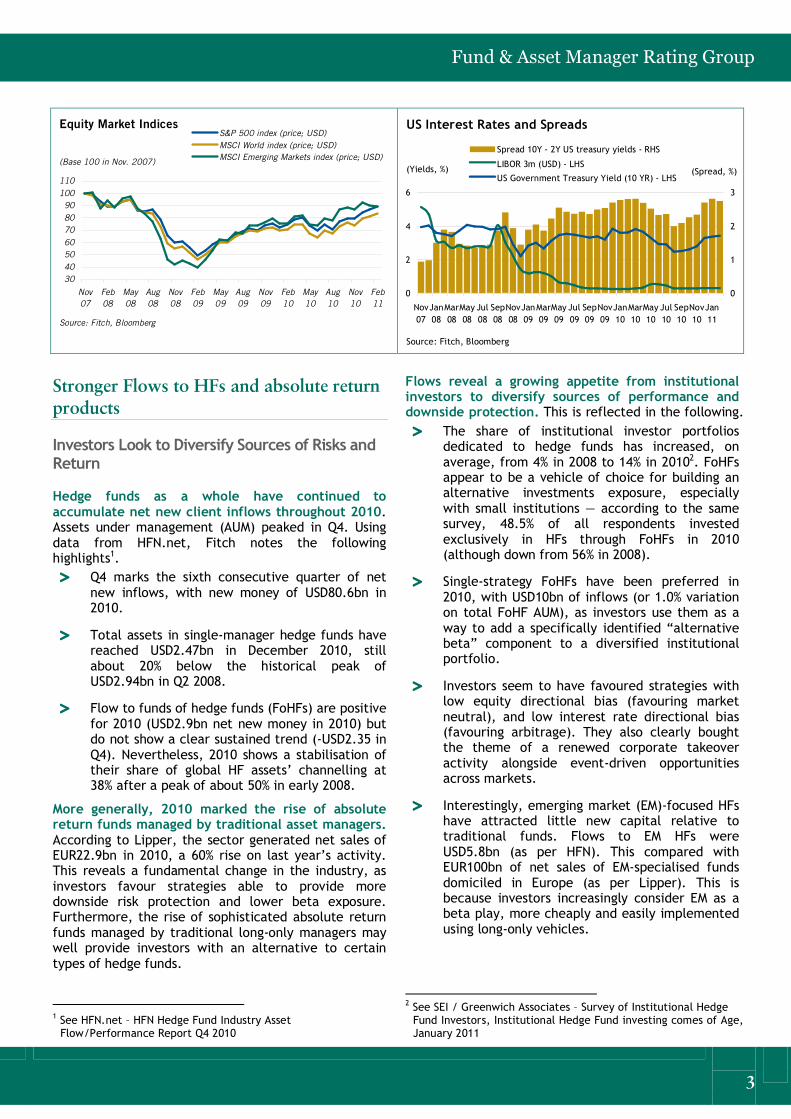
S&P 500 index (price; USD) MSCI World index (price; USD) MSCI Emerging Markets index (price; USD)
Equity Market Indices
Source: Fitch, Bloomberg
(Base 100 in Nov. 2007)
0
2
4
6
Nov 07
Jan 08
Mar 08
May 08
Jul 08
Sep 08
Nov 08
Jan 09
Mar 09
May 09
Jul 09
Sep 09
Nov 09
Jan 10
Mar 10
May 10
Jul 10
Sep 10
Nov 10
Jan 11
0
1
2
3
Spread 10Y ‐ 2Y US treasury yields ‐ RHS
LIBOR 3m (USD) ‐ LHS
US Government Treasury Yield (10 YR) ‐ LHS (Yields, %)
US Interest Rates and Spreads
Source: Fitch, Bloomberg
(Spread, %)
Stronger Flows to HFs and absolute return products
Investors Look to Diversify Sources of Risks and Return
Hedge funds as a whole have continued to accumulate net new client inflows throughout 2010. Assets under management (AUM) peaked in Q4. Using data from HFN.net, Fitch notes the following highlights 1 . > Q4 marks the sixth consecutive quarter of net
new inflows, with new money of USD80.6bn in 2010.
> Total assets in single‐manager hedge funds have reached USD2.47bn in December 2010, still about 20% below the historical peak of USD2.94bn in Q2 2008.
> Flow to funds of hedge funds (FoHFs) are positive for 2010 (USD2.9bn net new money in 2010) but do not show a clear sustained trend (‐USD2.35 in Q4). Nevertheless, 2010 shows a stabilisation of their share of global HF assets’ channelling at 38% after a peak of about 50% in early 2008.
More generally, 2010 marked the rise of absolute return funds managed by traditional asset managers. According to Lipper, the sector generated net sales of EUR22.9bn in 2010, a 60% rise on last year’s activity. This reveals a fundamental change in the industry, as investors favour strategies able to provide more downside risk protection and lower beta exposure. Furthermore, the rise of sophisticated absolute return funds managed by traditional long‐only managers may well provide investors with an alternative to certain types of hedge funds.
1 See HFN.net – HFN Hedge Fund Industry Asset Flow/Performance Report Q4 2010
Flows reveal a growing appetite from institutional investors to diversify sources of performance and downside protection. This is reflected in the following. > The share of institutional investor portfolios
dedicated to hedge funds has increased, on average, from 4% in 2008 to 14% in 2010 2 . FoHFs appear to be a vehicle of choice for building an alternative investments exposure, especially with small institutions — according to the same survey, 48.5% of all respondents invested exclusively in HFs through FoHFs in 2010 (although down from 56% in 2008).
> Single‐strategy FoHFs have been preferred in 2010, with USD10bn of inflows (or 1.0% variation on total FoHF AUM), as investors use them as a way to add a specifically identified “alternative beta” component to a diversified institutional portfolio.
> Investors seem to have favoured strategies with low equity directional bias (favouring market neutral), and low interest rate directional bias (favouring arbitrage). They also clearly bought the theme of a renewed corporate takeover activity alongside event‐driven opportunities across markets.
> Interestingly, emerging market (EM)‐focused HFs have attracted little new capital relative to traditional funds. Flows to EM HFs were USD5.8bn (as per HFN). This compared with EUR100bn of net sales of EM‐specialised funds domiciled in Europe (as per Lipper). This is because investors increasingly consider EM as a beta play, more cheaply and easily implemented using long‐only vehicles.
2 See SEI / Greenwich Associates – Survey of Institutional Hedge Fund Investors, Institutional Hedge Fund investing comes of Age, January 2011
4
Sector Update Hedge Fund and Absolute Return Strategies
Whether efficient performance providers or not, UCITS 3‐compliant hedge funds are attracting a growing share of alternative assets. Total investments in such vehicles reached USD140bn at end‐2010 and a recent survey by Deutsche Bank indicates the figure is expected to double in 2011‐2012 3 . Liquidity and regulatory oversight are most often cited as drivers of growth. However, UCITS HFs have not yet convinced investors that they can provide them with a decent level of performance given: 1) very low risk‐taking (1.1% volatility as per the UCITS Hedge Index); 2) a limited use of complex/illiquid strategies (best HF performers in 2010) for regulatory reasons; and 3) a low observed beta for downside limitation reasons 4 .
Linked to the popularity of Newcits funds, is the possible return of investments in newly‐launched HFs or smaller vehicles in 2011. This is in contrast to 2010 when the bulk of new assets went to HFs worth USD5.0bn or more. With performance back, it is expected that many large HFs could close again to new investments, paving the way for newcomers: HFR reported a growing number of fund launches globally, from 1,197 in 2007, down to 659 in 2008, then 784 in 2009 and 800+ in 2010.
Market Commentary
The Big Picture — Main Driving Themes in 2010 and Beyond
Hedge fund risk‐adjusted performance proved superior to traditional investments, from a short‐ and long‐term perspective, with volatility half that of global equities. The industry in general passed its former high watermark (HWM) — reached in October 2007 — at some point in Q4 2010 (not yet the case for FoHFs). It is estimated that 50% of HFs will be able to charge performance fees for their 2010 record 5 (vs 32% in 2009 and 16% in 2008). Performance was mainly derived from still‐improving liquidity conditions, low interest rates, generally enhanced business conditions and rising commodity prices.
General and progressive rise in risk appetite throughout 2010. HFs had started off 2010 on a low net exposure (long bias) basis (an explanation for their relative underperformance in absolute terms later in the year), which gradually increased throughout the
3 See Deutsche Bank Hedge Fund Capital Group — Survey of the UCITS 3 Industry, February 2011
4 See Fitch’s Fund of Hedge Fund Quarterly – Q110 5 See TrimTabs investment research, January 2011
year. Yet, pure fundamental trades were not strong value generation engines in 2010, as evidenced by the poor performance of market‐neutral equities.
Global macroeconomic imbalances combined with trend reversals provided opportunities to relative value‐oriented strategies. Markets remain driven by pure macro plays and the return of corporate activity, exacerbated by a macroeconomic environment that is providing ample opportunities to arbitrage markets based on themes of: > commodities rising;
> inflation differential (developed vs. EM, US vs. EU);
> investment grade vs. high yield spread narrowing;
> falling volatility;
> government yield curves steepening; and
> divergence of currencies.
While markets are expected to continue to be driven by macroeconomics and sentiment, stock picking based on bottom‐up research should play a bigger role in 2011 onwards, especially in the credit space where valuations appear less attractive. Specifically, rising idiosyncratic risk is driven by a company’s ability to refinance and its dependence on commodities and a particular country.
New regulatory framework and investors’ constraints are having a noticeable impact on product engineering and hedge fund creation trends. In the US, the enforced Dodd‐Frank Act and its Volcker Rule have prompted numerous hedge fund start‐ups from former bank proprietary traders — the corollary being that the market is now left more open to HFs to benefit from arbitrage opportunities.
In Europe, investors need to find a way to take active risk while satisfying regulatory derisking (eg Solvency 2), which calls for increased product transparency (via UCITS or managed account platforms). Institutional investors are also changing the way they deal with strategic vs. tactical asset allocation, active vs. passive investments and how they can capture the much sought “alternative beta” return streams. The consequence is the need for alternative managers to continue developing their capacities in product structuring, portfolio optimisation, reporting and marketing.
5
Fund & Asset Manager Rating Group
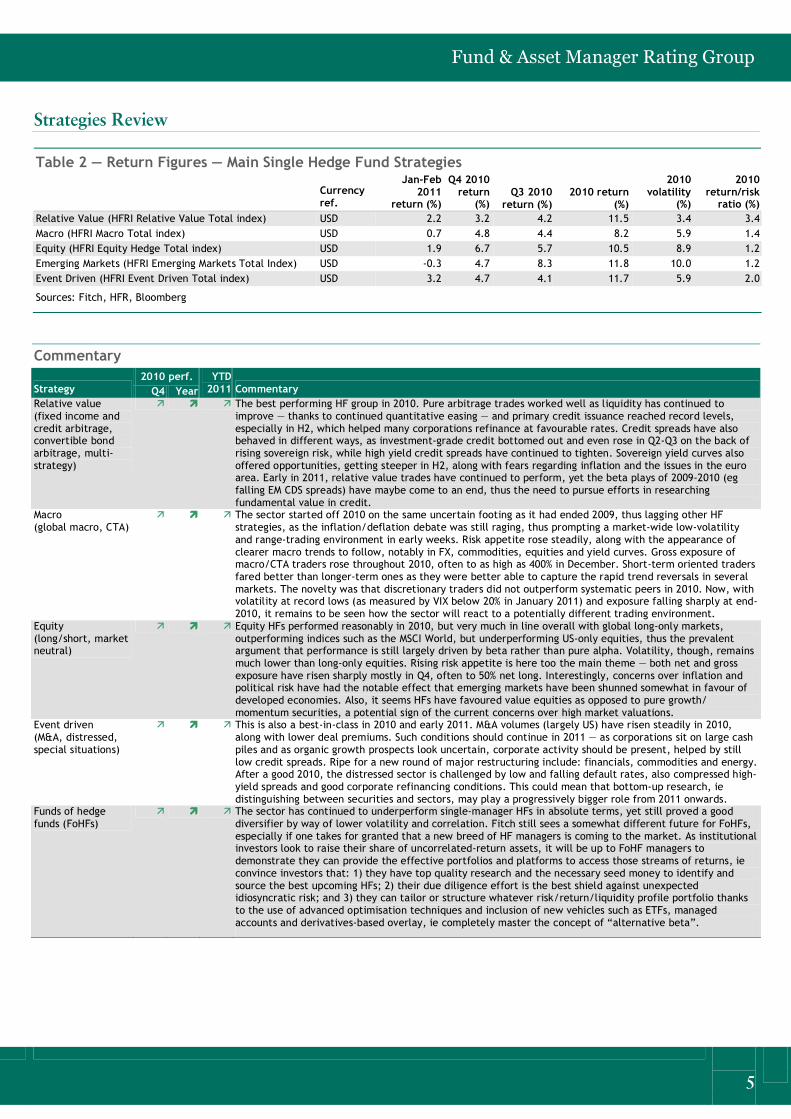
Strategies Review
Table 2 — Return Figures — Main Single Hedge Fund Strategies
Currency ref.
Jan‐Feb 2011
return (%)
Q4 2010 return
(%) Q3 2010
return (%) 2010 return
(%)
2010 volatility
(%)
2010 return/risk
ratio (%) Relative Value (HFRI Relative Value Total index) USD 2.2 3.2 4.2 11.5 3.4 3.4 Macro (HFRI Macro Total index) USD 0.7 4.8 4.4 8.2 5.9 1.4 Equity (HFRI Equity Hedge Total index) USD 1.9 6.7 5.7 10.5 8.9 1.2 Emerging Markets (HFRI Emerging Markets Total Index) USD ‐0.3 4.7 8.3 11.8 10.0 1.2 Event Driven (HFRI Event Driven Total index) USD 3.2 4.7 4.1 11.7 5.9 2.0
Sources: Fitch, HFR, Bloomberg
Commentary 2010 perf.
Strategy Q4 Year YTD
2011 Commentary Relative value (fixed income and credit arbitrage, convertible bond arbitrage, multi‐ strategy)
ä ä ä The best performing HF group in 2010. Pure arbitrage trades worked well as liquidity has continued to improve — thanks to continued quantitative easing — and primary credit issuance reached record levels, especially in H2, which helped many corporations refinance at favourable rates. Credit spreads have also behaved in different ways, as investment‐grade credit bottomed out and even rose in Q2‐Q3 on the back of rising sovereign risk, while high yield credit spreads have continued to tighten. Sovereign yield curves also offered opportunities, getting steeper in H2, along with fears regarding inflation and the issues in the euro area. Early in 2011, relative value trades have continued to perform, yet the beta plays of 2009‐2010 (eg falling EM CDS spreads) have maybe come to an end, thus the need to pursue efforts in researching fundamental value in credit.
Macro (global macro, CTA)
ä ä ä The sector started off 2010 on the same uncertain footing as it had ended 2009, thus lagging other HF strategies, as the inflation/deflation debate was still raging, thus prompting a market‐wide low‐volatility and range‐trading environment in early weeks. Risk appetite rose steadily, along with the appearance of clearer macro trends to follow, notably in FX, commodities, equities and yield curves. Gross exposure of macro/CTA traders rose throughout 2010, often to as high as 400% in December. Short‐term oriented traders fared better than longer‐term ones as they were better able to capture the rapid trend reversals in several markets. The novelty was that discretionary traders did not outperform systematic peers in 2010. Now, with volatility at record lows (as measured by VIX below 20% in January 2011) and exposure falling sharply at end‐ 2010, it remains to be seen how the sector will react to a potentially different trading environment.
Equity (long/short, market neutral)
ä ä ä Equity HFs performed reasonably in 2010, but very much in line overall with global long‐only markets, outperforming indices such as the MSCI World, but underperforming US‐only equities, thus the prevalent argument that performance is still largely driven by beta rather than pure alpha. Volatility, though, remains much lower than long‐only equities. Rising risk appetite is here too the main theme — both net and gross exposure have risen sharply mostly in Q4, often to 50% net long. Interestingly, concerns over inflation and political risk have had the notable effect that emerging markets have been shunned somewhat in favour of developed economies. Also, it seems HFs have favoured value equities as opposed to pure growth/ momentum securities, a potential sign of the current concerns over high market valuations.
Event driven (M&A, distressed, special situations)
ä ä ä This is also a best‐in‐class in 2010 and early 2011. M&A volumes (largely US) have risen steadily in 2010, along with lower deal premiums. Such conditions should continue in 2011 — as corporations sit on large cash piles and as organic growth prospects look uncertain, corporate activity should be present, helped by still low credit spreads. Ripe for a new round of major restructuring include: financials, commodities and energy. After a good 2010, the distressed sector is challenged by low and falling default rates, also compressed high‐ yield spreads and good corporate refinancing conditions. This could mean that bottom‐up research, ie distinguishing between securities and sectors, may play a progressively bigger role from 2011 onwards.
Funds of hedge funds (FoHFs)
ä ä ä The sector has continued to underperform single‐manager HFs in absolute terms, yet still proved a good diversifier by way of lower volatility and correlation. Fitch still sees a somewhat different future for FoHFs, especially if one takes for granted that a new breed of HF managers is coming to the market. As institutional investors look to raise their share of uncorrelated‐return assets, it will be up to FoHF managers to demonstrate they can provide the effective portfolios and platforms to access those streams of returns, ie convince investors that: 1) they have top quality research and the necessary seed money to identify and source the best upcoming HFs; 2) their due diligence effort is the best shield against unexpected idiosyncratic risk; and 3) they can tailor or structure whatever risk/return/liquidity profile portfolio thanks to the use of advanced optimisation techniques and inclusion of new vehicles such as ETFs, managed accounts and derivatives‐based overlay, ie completely master the concept of “alternative beta”.

6
Sector Update Hedge Fund and Absolute Return Strategies
ALL FITCH CREDIT RATINGS ARE SUBJECT TO CERTAIN LIMITATIONS AND DISCLAIMERS. PLEASE READ THESE LIMITATIONS AND DISCLAIMERS BY FOLLOWING THIS LINK: HTTP://FITCHRATINGS.COM/UNDERSTANDINGCREDITRATINGS. IN ADDITION, RATING DEFINITIONS AND THE TERMS OF USE OF SUCH RATINGS ARE AVAILABLE ON THE AGENCY'S PUBLIC WEB SITE AT WWW.FITCHRATINGS.COM. PUBLISHED RATINGS, CRITERIA, AND METHODOLOGIES ARE AVAILABLE FROM THIS SITE AT ALL TIMES. FITCH'S CODE OF CONDUCT, CONFIDENTIALITY, CONFLICTS OF INTEREST, AFFILIATE FIREWALL, COMPLIANCE, AND OTHER RELEVANT POLICIES AND PROCEDURES ARE ALSO AVAILABLE FROM THE CODE OF CONDUCT SECTION OF THIS SITE.
Copyright © 2011 by Fitch, Inc., Fitch Ratings Ltd. and its subsidiaries. One State Street Plaza, NY, NY 10004.Telephone: 1‐800‐753‐4824, (212) 908‐0500. Fax: (212) 480‐4435. Reproduction or retransmission in whole or in part is prohibited except by permission. All rights reserved. In issuing and maintaining its ratings, Fitch relies on factual information it receives from issuers and underwriters and from other sources Fitch believes to be credible. Fitch conducts a reasonable investigation of the factual information relied upon by it in accordance with its ratings methodology, and obtains reasonable verification of that information from independent sources, to the extent such sources are available for a given security or in a given jurisdiction. The manner of Fitch’s factual investigation and the scope of the third‐party verification it obtains will vary depending on the nature of the rated security and its issuer, the requirements and practices in the jurisdiction in which the rated security is offered and sold and/or the issuer is located, the availability and nature of relevant public information, access to the management of the issuer and its advisers, the availability of pre‐ existing third‐party verifications such as audit reports, agreed‐upon procedures letters, appraisals, actuarial reports, engineering reports, legal opinions and other reports provided by third parties, the availability of independent and competent third‐party verification sources with respect to the particular security or in the particular jurisdiction of the issuer, and a variety of other factors. Users of Fitch’s ratings should understand that neither an enhanced factual investigation nor any third‐party verification can ensure that all of the information Fitch relies on in connection with a rating will be accurate and complete. Ultimately, the issuer and its advisers are responsible for the accuracy of the information they provide to Fitch and to the market in offering documents and other reports. In issuing its ratings Fitch must rely on the work of experts, including independent auditors with respect to financial statements and attorneys with respect to legal and tax matters. Further, ratings are inherently forward‐looking and embody assumptions and predictions about future events that by their nature cannot be verified as facts. As a result, despite any verification of current facts, ratings can be affected by future events or conditions that were not anticipated at the time a rating was issued or affirmed.
The information in this report is provided “as is” without any representation or warranty of any kind. A Fitch rating is an opinion as to the creditworthiness of a security. This opinion is based on established criteria and methodologies that Fitch is continuously evaluating and updating. Therefore, ratings are the collective work product of Fitch and no individual, or group of individuals, is solely responsible for a rating. The rating does not address the risk of loss due to risks other than credit risk, unless such risk is specifically mentioned. Fitch is not engaged in the offer or sale of any security. All Fitch reports have shared authorship. Individuals identified in a Fitch report were involved in, but are not solely responsible for, the opinions stated therein. The individuals are named for contact purposes only. A report providing a Fitch rating is neither a prospectus nor a substitute for the information assembled, verified and presented to investors by the issuer and its agents in connection with the sale of the securities. Ratings may be changed or withdrawn at anytime for any reason in the sole discretion of Fitch. Fitch does not provide investment advice of any sort. Ratings are not a recommendation to buy, sell, or hold any security. Ratings do not comment on the adequacy of market price, the suitability of any security for a particular investor, or the tax‐exempt nature or taxability of payments made in respect to any security. Fitch receives fees from issuers, insurers, guarantors, other obligors, and underwriters for rating securities. Such fees generally vary from US$1,000 to US$750,000 (or the applicable currency equivalent) per issue. In certain cases, Fitch will rate all or a number of issues issued by a particular issuer, or insured or guaranteed by a particular insurer or guarantor, for a single annual fee. Such fees are expected to vary from US$10,000 to US$1,500,000 (or the applicable currency equivalent). The assignment, publication, or dissemination of a rating by Fitch shall not constitute a consent by Fitch to use its name as an expert in connection with any registration statement filed under the United States securities laws, the Financial Services and Markets Act of 2000 of Great Britain, or the securities laws of any particular jurisdiction. Due to the relative efficiency of electronic publishing and distribution, Fitch research may be available to electronic subscribers up to three days earlier than to print subscribers.