hedge fund activism jan14 - yale cclccl.yale.edu/sites/default/files/leo16_sepe.pdfhedge fund...
TRANSCRIPT

HEDGE FUND ACTIVISM AND LONG-TERM FIRM VALUE
K.J. Martijn Cremers, Erasmo Giambona, Simone M. Sepe, and Ye Wang
January 2016
ABSTRACT
This paper documents that the positive association between hedge fund activism and long-term firm value documented in prior studies seems driven by selection bias, as activist hedge funds tend to target poorly performing firms. Using matched samples, we find that firms targeted by activist hedge funds improve less in value than ex-ante similarly poorly performing control firms that are not subject to hedge fund activism. Their relative underperformance is driven by firms that are more engaged in innovation and where stakeholder relationships seem more important for long-term value creation, suggesting that activist hedge fund campaigns may undermine longer-term commitments.
Mendoza College of Business, University of Notre Dame. Email address: [email protected]. University of Amsterdam Business School.
Email address:: [email protected].
University of Arizona and Institute for Advanced Study in Toulouse (IAST) – Fondation Jean-Jacques Laffont – Toulouse School of Economics. Email address: [email protected]. Bocconi University. Email address: [email protected].

2
1. Introduction
Hedge fund activism has turned into a permanent force of corporate governance. Activist
campaigns targeting publicly traded firms have steadily increased in the past ten years (Coffee and Palia,
2015). The governance changes sought by activists range from modest proposals, such as separating the
positions of CEO and Board Chairman, to more radical interventions, such as firing the CEO or selling
major assets or the firm to an acquirer. This increased activism has changed the U.S. corporate landscape,
further undermining Berle and Means’ canonical account of corporate governance (Gilson and Gordon,
2013). Under that account, shareholders in large public firms are portrayed as widely dispersed and,
consequently, face collective action problems whose only remedy against managerial underperformance
is the “Wall Street Rule” (i.e., the “exit” option to sell shares). In today’s corporate environment,
however, increased institutional shareholder concentration and hedge fund activism have empowered
shareholders with the ability to exercise influential “voice” over the corporate affairs.
In this paper, we revisit the results of prior empirical studies (Brav, Jiang, Partnoy and Thomas,
2008a; Bebchuk, Brav and Jiang, 2015) suggesting that hedge fund activism is beneficial to shareholder
interests in both the short-term and the long-term. Our starting point is the result in Brav et al. (2008a)
that activist hedge funds resemble value investors, as activist hedge funds tend to target firms that have
been relatively poorly performing prior to the activists’ interventions. This suggests that selection effects
may be important. While prior studies (such as Brav, Jiang, Ma, and Tian, 2014; Cheng, Huang, and
Stanfield, 2012; and Cheng, Huang, and Li, 2015) have reported related results using matched samples,
our study is to first to focus on the long-term financial value of targeted firms versus the long-term
financial value of non-targeted firms whose prior performance was similar to that of the targeted firms.
Our main contribution is to show that the positive long-term association of hedge fund activism
and firm value documented in the prior literature is likely endogenous and on average seems unlikely to
be caused by the activist campaigns. We do so through constructing several different matched samples,
where each firm targeted by an activist hedge fund is matched to a control firm with similar

3
characteristics (especially with similar performance prior to the start of the activist hedge fund campaign).
In particular, firms targeted by activist hedge funds improve less in value subsequent to the start of an
activist hedge fund campaign than ex-ante similarly poorly performing control firms that are not subject
to hedge fund activism. In other words, our different matched-samples consistently suggest that hedge
fund activism (and especially the activism of hedge funds using hostile tactics) is associated with lower
increases in firm value in the long-term relative to non-targeted control firms with similar characteristics
as the targeted firms. This indicates that interventions other than activist hedge fund campaigns seem on
average more successful than the typical activist hedge fund campaign in turning these relatively poorly
performing firms around.
We first revisit the results in Bebchuk et al. (2015), using the database of activist hedge fund
campaigns from the (updated) Brav et al. (2008a) dataset, which Bebchuk et al. (2015) also employs. This
dataset covers the period 1995-2011 and identifies hedge fund interventions through Schedule 13D
filings, which the 1934 Security Exchange Act requires investors acquiring more than 5% percent of any
class of security of public companies to file with the Security and Exchange Commission (SEC) within 10
days of doing so. We are able to closely replicate the results of Bebchuk et al. (2015). In particular, in the
five years after the start of the activist hedge fund campaign, the Q (the widely used proxy for the firm’s
market-to-book value of assets) of targeted firms progressively increases, and more strongly so when the
hedge fund campaign is classified as hostile in the Brav et al. (2008a). Similarly, portfolios formed to
capture the stock market performance of targeted firms exhibit positive abnormal returns in the 1-year and
5-year period following the start of the activist hedge fund campaign.
Next, we confirm the result in Brav et al. (2008a) that firms targeted by hedge funds are
substantially different from other firms by predicting hedge fund activism through logit and Cox
proportional hazard models. Similar to Brav et al. (2008a), we find that firms are much more likely to
become the target of hedge fund activism if they have been performing relatively poorly in the past one to
five years—that is, hedge funds seem to primarily target firms with relatively low values. This result, in

4
turn, raises the possibility that the increase in the value of targeted firms might be attributable to market
mechanisms other than the intervention by activist hedge funds. Indeed, in competitive markets, many
different actors can intervene to turn things around at a relatively poorly performing company, including
key employees, top executive management, directors, long-term shareholders, as well as other
stakeholders like large customers or suppliers. We consider the possibility that other factors may explain
the increase in firm value following hedge fund activism by creating a variety of matched samples. In
each matched sample, for each “target” firm that is targeted by an activist hedge fund we assign a
“control” firm that has similar characteristics (using characteristics that we document matter for being
targeted) as the target firm in the year before the start of the target firm’s activist hedge fund campaign.
Using such matched samples, we consistently find that the long-term financial performance of
targeted firms improves less than the long-term financial performance of the control firms, using both
changes in Tobin’s Q and abnormal stock returns as proxies for changes in financial value. In our baseline
results, we use a matched sample where the control firms are matched using the Abadie-Imbens (2006)
nearest-neighbor matching estimator to identify the control firms with the closest match based on
industry-adjusted Tobin’s Q (lag 1 to 5), natural logarithm of market value of equity (lag 1), leverage (lag
1), ROA (lag 1), and fiscal year. While we discuss the results for this particular matched sample below,
these results are similar across many other alternative ways to assign control firms that we conducted as
robustness checks. We also report and briefly discuss the results for these alternative matched samples,
including matches on Tobin’s Q that is not industry-adjusted but where we match by industry.
Using the baseline matched sample, the long-term increase in Q of the targeted firms in the years
after the start of an activist hedge fund campaign is on average significantly below the increase in Q of
the control firms, where the differences are statistically strong and economically meaningful. Specifically,
starting with the target and controls firms having a similar value in the year before the start of the activist
campaign, the firm value of the target firms tends to be 5.5% lower than the firm value of control firms at
the end of the fiscal year in which the activist hedge funds start their campaign, and about 9.8% lower in

5
the period starting three years thereafter.1
Similarly, stocks of targeted firms have positive abnormal returns in the 3-year and 5-year period
following the start of the activist hedge fund campaign (so activist hedge funds on average seem to have
significant stock picking skills), but their control firms have even more positive abnormal stock returns.
In particular, we form a calendar-time long-short portfolio that, after the start of the activist hedge fund
campaign, buys the stocks of targeted firms and sells the stocks of the control firms. This long-short
portfolio has a negative abnormal return relative to the four-factor Fama-French-Carhart model. If the
long and short portfolios are equal-weighted, the long-short portfolio has a monthly four-factor alpha of -
0.43% (t-statistic of 3.99) in the 3-year period following the activist campaign and of -0.19% (t-statistic of
2.45) over the subsequent 60 month period. The analogous results using value-weighted portfolios are a
four-factor alpha of -011% per month (t-statistic of 0.75) and of -0.40% per month (t-statistic of 2.96)
when holdings stocks 3 and 5 years, respectively, after being targeted.
In the remainder of our paper, we further explore our main finding that the financial performance
of firms targeted by activist hedge funds improves but on average less so than the financial performance
of similarly underperforming firms. In particular, we consider whether any changes in corporate policies
induced by these campaigns, on average, contribute to improved financial performance relative to the
control firms. We first show that targeted firms tend to increase leverage, increase stock buybacks and
decrease capital expenditures in the 3 year period following the start of activist hedge fund campaigns,
relative to the sample of control firms, and decrease R&D expenditures in the period after that. This
suggests that, after being targeted, firms become riskier and less focused on long-term investments.
Next, we consider how the ability shareholders, especially activist hedge funds, to help change
1 This striking result is robust across many different matching procedures—including nearest neighbor matching and propensity score matching—but also to adding different fixed effects (including year, industry, firm, and higher dimensional effects such as year times industry fixed effects), or to incorporating the acquisition premium after firms are taken over (or more generally to incorporating the delisting price). Further, Brav et al. (2008a) also document that the ROA of targeted firms increases after the start of activist hedge fund campaigns, but we find that such increase is not statistically different from the increase in the ROA of the control firms over the same period.

6
corporate policies or firm control in the short-term complicates both managerial-decision making and the
extent to which other stakeholders want to invest in their relationship with the firm. In anticipation of
such potential policy and control changes, managers may develop myopic incentives (Stein, 1988, 1989;
Karpoff and Rice, 1989; Bradenburger and Polak, 1996) and important stakeholders might be discouraged
to invest optimally in the firm (Shleifer and Summers, 1988; Johnson, Karpoff and Yi, 2015). In both
cases, by enhancing shareholders’ ability to pressure directors and managers, hedge fund activism could
lead to a reduced focus on particularly long-term and firm-specific investments by managers and (non-
shareholder) stakeholders, possibly resulting in a reduction in long-term firm value.
In the last part of our paper, we explore whether our main finding might be explained by hedge
funds influencing a firm’s investment policy and other operational decisions to the detriment of long-term
investments and strong stakeholder relationships. Under this hypothesis, we should find that the relative
long-term underperformance of targeted versus non-targeted firms is more pronounced for firms whose
investments have a longer-term horizon or where stakeholders are more important. We first empirically
test this hypothesis by focusing on firms that are more engaged in innovation, whose investments
naturally tend to have a longer-term horizon. Using different proxies for more innovative firms (e.g., high
R&D expenses, high intangible assets, and high patent citations), we document that when the target of
hedge fund activism is an innovative firm, the decline in Q in the three years following the activist
intervention tends to be more severe, at economically and statistically significant levels.
Second, we consider firms with stronger specific relationships with other stakeholders such as
employees, suppliers, and unsecure creditors. Consistent with our hypothesis, we find that when these
long-term stakeholder relationships matter more to a hedge fund’s target, the targeted firms experience on
average a more severe decline in Q in the three years after the intervention, relative to the firm value of
the matched control firms. Also in this case, our results are economically large and statistically
significant. For example, the group of firms in the industry with the most productive labor force that are
targeted in hostile hedge fund campaigns have declined in value by 29.71% relative to the control firms in

7
the three years after first being targeted, while the other firms targeted in hostile hedge fund campaigns
declined in value by 7.75% relative to their control firms.
The rest of the paper is organized as follows. Section 2 describes our data sets and provides a
definition of our main variables. Section 3 presents our main findings on the relation between hedge fund
activism and long-term firm value. The results on the effects of hedge fund activism on firm value for
firms facing limited commitment problems are discussed in Section 4. Section 5 concludes.
2. Data and Variable Definitions
To assess the association of hedge fund activism with long-term firm value, we combine data
from several data sources. The hedge fund data is from Brav et al. (2008), and covers the period 1995 –
2011. The procedure to obtain the hedge fund data is explained in Brav et al. (2008), who use Schedule
13D filings as their main source. The 1934 Security Exchange Act requires that investors file a 13D form
with the Security and Exchange Commission within 10 days of acquiring 5% of any class of securities of
a publicly listed firm if the reason for such acquisition is to influence the management of the target firms.
The authors use information on the filer type available in Item 2 of Schedule 13D to limit the sample to
only hedge funds, filtering out other filers such as banks, brokerage companies, corporations, insurance
companies, individuals, pension funds, and trusts. Brav et al. further rely on web-searches, newswires,
and direct phone calls to help identify the filing entity as an activist hedge fund. The authors also exclude
filers who only filed one 13D Schedule during the entire sample period, those that reported that the
purpose of the acquisition is to get involved in bankruptcy reorganization or to assume an arbitrage
position in M&A activities, and filers who do not explicitly report the reason of their acquisitions. These
screenings generate a sample of 480 hedge funds and 2,684 events.2 Using newswires and other sources,
Brav et al. categorize 604 events (by 210 hedge funds) out of the 2,684 events as hostile hedge fund
interventions, i.e., where the intervention “includes a threatened or actual proxy contest, takeover, lawsuit,
or public campaign that is openly confrontational.”
2 We refer the reader to Brav et al. (2008) for additional details on the construction of the hedge fund sample.

8
In order to identify firms where stakeholders are particularly important or where the limited
commitment problem is particularly relevant, we use three different proxies: patent citation counts,
Contract Specificity, and labor productivity. We obtain data on patent citation counts at the firm level
from the NBER U.S. Patent Citations data file. Data on the fraction of inputs in an industry that are not
sold in an organized exchange or reference priced in a trade publication are from Nunn (2007) data file.
This data is available only for 1997 and is used to construct our Contract Specificity measure. Our proxy
for labor productivity, namely the output per hour of labor in the firm’s industry, comes from the Bureau
of Labor, U.S. Department of Labor.
We combine the hedge funds data and the other data sources with firm-level accounting data from
COMPUSTAT and return data and delisting information from the Center for Research in Security Prices
(CRSP). We use the return data to assess the market reaction for target and control firms around the hedge
fund targeting dates. We restrict our sample to non-financial firms (excluding firms with SIC codes 6000
– 6999).
Our dependent variable is TobinQ, which is defined as the firm’s Tobin’s Q minus the 4 digit
SIC-year median Tobin’s Q, where Tobin’s Q is measured as the ratio of the market value of total assets
(COMPUSTAT’s items at – ceq + prcc_fcsho) to the book value of total assets (at).
Our set of basic control variables includes the following measures. LnSize is the natural
logarithm of the book value of total assets (COMPUSTAT’s item at). Leverage is defined as the ratio of
total debt (COMPUSTAT’s items dltt + dlc) to the book value of total assets. CAPX is the ratio of capital
expenditures (COMPUSTAT’s item capx) to the book value of total assets. Intangibility is one minus the
ratio of property, plant, & equipment (COMPUSTAT’s item ppent) to the book value of total assets. ROA
is the ratio of operating income before depreciation (COMPUSTAT’s item oibdp) to the book value of
total assets. Ln Market Value of Equity is the natural logarithm of market value of equity
(COMPUSTAT’s items prcc_f × csho). To avoid undue influence of outliers, we winsorize all continuous

9
variables at the 1st and 99th percentiles of their full sample distributions. We have confirmed that our
results are robust to winsorizing Tobin’s Q at the 5th and 95th percentiles as well.
Panel A of Table 1 provides a brief description of all of the variables used in our study, while
Panel B of Table 1 reports the basic descriptive statistics. The average TobinQ in our sample is 2.939.
The 25th and 75th percentiles are respectively -0.365 and 0.860, which suggests that there is significant
heterogeneity in firm value in the sample.
To mitigate the concern that our main results could be biased by differences between hedge fund
targets and non-target firms in the COMPUSTAT population, we perform our main regression analysis
after carefully matching each target firm to its closest control firm from COMPUSTAT. As it will be
discussed later in Table 4, this matching procedure generates samples of target and control firms that are
very similar in terms of the Tobin’s Q and other key firm characteristics in the year before the targeted
firms received their first 13D filing from an activist hedge fund. The reported standard errors are robust
and clustered by firm throughout the paper.
3. Hedge Funds and Firm Value
3.1. Replicating the Results in Bebchuk et al. (2015)
Our focus is on the association of hedge fund activism with long-term firm value. We start by
replicating Table 4 in Bebchuck et al. (2015), regressing the firm’s annual Tobin’s Q at the end of the
fiscal year on time dummies, the log of market value (COMPUSTAT’s prcc_f × csho), the log of firm
age (measured as the number of years since the firm first appeared in COMPUSTAT) at the end of the
fiscal year, and either industry (3-digit SIC) and year fixed effects, or firm and year fixed effects. The
time dummies are defined as follows:
- “t: Event year” is an indicator equal to one for firms first targeted by an activist hedge
fund sometime during the fiscal year, and zero for every other year before or after that year. The “t: Event

10
year”-dummy is always equal to zero for firms not targeted by an activist hedge fund during our sample
period;
- “t+1” is an indicator variable equal to 1 for firms first targeted by an activist hedge fund
in the previous fiscal year, and zero otherwise;
- “t+2” to “t+5” dummies are defined similarly to the “t+1” indicator, capturing the fiscal
years 2 to 5 years after the year the firm was initially targeted.
- “(t to t+3)” is an indicator variable equal to 1 for firms targeted by a hedge fund in that
fiscal year or one of the previous 3 fiscal years, and zero otherwise.
- “Post t+3” dummy is equal to 1 for firms targeted by a hedge fund at least 4 (or more)
fiscal years later, and zero otherwise.
Table 2 reports results from these estimations, which generally replicate the results in Bebchuk et
al. (2015). Columns (1) – (4) show the results considering all activist hedge funds, while columns (5) –
(8) only consider firms targeted in a hostile manner by an activist hedge fund. The results in column (1)
shows that firms targeted by an activist hedge fund tend to have a substantially lower value than other
firms in the industry at the end of the year in which they are first targeted (i.e., the event year), but that
this value discount has disappeared five years after the event year. Indeed, column (2) shows that in the
period starting at least three years after the event year, firm value tends to be significantly higher
compared to other firms in the same industry (as shown by the coefficient of 0.191 (t-statistic of 4.01) of
the “Post t+3” variable).
In columns (3) and (4), we add firm fixed effects rather than industry fixed effects, effectively
comparing how firm value changes over time before versus after a firm is targeted by an activist hedge
fund. Similar to the results in Bebchuk et al. (2015), we find that firm value increases in the years after a
firm is targeted by an activist hedge fund. Economically, being targeted by an activist hedge fund is
associated with an increase in firm value by about 9% three years afterwards (i.e., the coefficient of 0.265
of “Post t+3” in column 4, divided by the sample mean of 2.939). Finally, columns (5) – (8) indicate that

11
the increase in firm value is more pronounced for firms targeted in a hostile campaign of an activist hedge
fund.
3.2. The Ex-Ante Probability of Becoming a Hedge Fund Target
The results in Table 2 show that firm value tends to improve in the years after a firm is targeted
by an activist hedge fund. However, this result needs to be interpreted with great caution, as the decision
to target a particular firm at a particular time is an entirely discretionary choice by the activist hedge fund.
Hence, firms being targeted by hedge funds could potentially be substantially different from other firms.
Because of this possibility, it seems important to understand what type of firms tend to be targeted by
activist hedge funds, and then to compare the performance of the firms being targeted (the “target” firms)
to other firms that have similar characteristics but have not (yet) been targeted by an activist hedge fund
(the “control” firms).
We consider what firm characteristics are associated with becoming a target in the next fiscal
year by estimating a logit model (see Panel A of Table 3) and a Cox proportional hazard model (see Panel
B of Table 3). These estimations allow us to assess which lagged variables help predict the probability
that a firm will be targeted by a hedge fund in the next fiscal year, or how close a firm is to becoming a
hedge fund target. In our discussion, we will focus on the logit model results shown in Panel A of Table
3, although we obtain similar results for the analogous Cox proportional hazard model (shown in Panel B
of Table 3).
As shown in Panel A of Table 3, firms that are targeted by activist hedge funds tend to have
relatively low valuations before they are being targeted. They also tend to be larger in size and, depending
on the specification, tend to be more likely to be involved in research and development or have more
intangible assets. Column (1) shows that the coefficient on the industry median-adjusted Tobin’s Q at t-5
is negative and statistically significant at the 1% level, suggesting that firms with a high valuation in their
industry are significantly less likely to become a target. We find similar effects for lagging the Tobin’s Q
variables by four to one years in columns (2) to (5). If we include all of the industry median-adjusted Q

12
variables together in column (6), all of the coefficients on the lags of Q become smaller in absolute value,
while several coefficients also become statistically insignificant. This suggests that although it is
primarily the most recent lagged Q that matters for future hedge fund interventions, the longer history of
lagged valuations is also helpful for predicting which firms are more likely to become a target. LnSize is
statistically significant across all specifications, while the other control variables are statistically
significant in certain specifications but not in others. For example, this is the case for ROA, which is
positively significant in column (1), but insignificant in the other specifications in Panel A.
3.3. Matched Sample
In order to control for firm heterogeneity, we create a matched sample of ‘target’ firms that are
targeted by an activist hedge funds and their “control” firms, which have similar characteristics as the
target firms in the year before the first activist hedge funds files a 13D. In particular, we match target
firms to control firms using the nearest-neighbor Abadie-Imbens (2006) matching estimator, where
control firms are a subset of the non-target firms selected as the closest match based on firm
characteristics. To guide our selection of the matching variables, we consider the variables in our logit or
Cox model estimations that showed up as statistically significant in at least one of the specifications in
Panels A and B of Table 3. We drop (add) the statistically significant (insignificant) variables from (to)
the set of matching variables if including (excluding) them leads to statistical differences between target
and control firms after the matching has taken place.
Our final Matched Sample is based on the following matching variables include the industry
median-adjusted Tobin’s Q (lags 1 to 5), leverage (lag 1), ROA (lag 1), the log of market value (lag 1),
and the fiscal year. Table 4 shows that target firms (with the results for all hedge fund targets in Panel A
and for hostile hedge fund targets only in Panel B) and control firms are similar both in terms of the
matching variables and other important firm characteristics that were not included in the matching. For
example, the industry median-adjusted Tobin’s Q for target and control firms are never statistically
different in the five to one years prior to the targeting year. Similarly, target and control firms are very

13
similar in terms of their market value, leverage, ROA, log of market capitalization, CAPX, R&D, and
Intangibility in the year prior to the targeting event. The similarity in these characteristics means that
using the matched sample, differences between the two groups of firms in the years prior to the targeting
event are unlikely to be the reason for any divergence in the value of the target and control firms in the
years following a hedge fund targeting event.
For robustness, we also use several other matching procedures, obtaining additional, alternative
matched samples. For the Alternative Matched Sample 1, we use the nearest-neighbor Abadie-Imbens
(2006) matching estimator based on the following alternative set of matching variables: non-industry-
adjusted Tobin’s Q (lags 1 to 5), log market value (lag 1), and two-digit SIC code. In the Alternative
Matched Sample 2, we use the matching procedure based on firm’s propensity score (rather than using the
nearest-neighbor Abadie-Imbens matching estimator), including as covariates variables that we document
matter for being targeted in our logit proportional hazard model (see section 3.2. above): industry median-
adjusted Tobin’s Q (lags 1 to 5), log Size (lag 1), Intangibility (lag 1), and ROA (lag 1). In the Alternative
Matched Sample 3, we use an alternative specification of the propensity score, including as covariates the
variables that we document matter for being targeted in our Cox proportional hazard model (see section
3.2. above): industry median-adjusted Tobin’s Q (from lag 1 to 5), log Size (lag 1), R&D (lag 1), and
ROA (lag 1). The reason we decided to use the Final Matched Sample over these alternative matching
samples is because the Final Matched Sample minimizes the economic and statistical differences between
the covariates of the treated and control groups before the hedge fund intervention (as shown in Table 4)
and, therefore, yields a set of control firms whose characteristics are statistically closer to those of the
targeted firms.
We use our Final Matched Sample throughout our following analysis. In our main tests, we
regress the industry median-adjusted Tobin’s Q on time dummies, the interaction of these time dummies
with the HF_Target indicator (which equals one for firms targeted by a hedge fund, and zero for their

14
matched control pairs), control variables, and various combinations of industry (4-digit SIC), firm, and
year fixed effects.
The time dummies are defined as follows:
- “t” is an indicator equal to one for the fiscal year in which a firm is targeted by a hedge
fund, and zero for every other year before or after the targeting event year. This indicator is also equal to
one for the matched control firm;
- “t-5” is an indicator equal to one (for both target and control firms) five years before a
firm is targeted by a hedge fund, and zero for every year before t-5 or after t-5;
- “t-4” to “t+5” are defined similarly to “t-5”;
- “Post t+5” is an indicator equal to one (for both target and control firms) in the years
from t+6 onwards, and zero for every year before t+6.; and
- “Post t+3” is defined similarly to “Post t+5”.
- “HF_Target × t” is an indicator equal to one for firms targeted by a hedge fund in the
year of the targeting event, and zero for every year before or after the targeting event year. “HF_Target ×
t” is always equal to zero for the matched-control pairs (i.e., firms not targeted by a hedge fund);
- “HF_Target × t+1” is an indicator equal to one for firms targeted by a hedge fund one
year after the event year t, and zero for every year before t+1 or after t+1. “HF_Target × t+1” is always
equal to zero for the matched-control pairs (firms not targeted by a hedge fund).
- “HF_Target × t+2” to “HF_Target × t+5” dummies are defined similarly to the
“HF_Target × t+1” indicator.
- “(t-4 to t-1)” is an indicator equal to one (for both target and control firms) for the period
from four years to one year before a firm is targeted by a hedge fund, and zero for every year before t-4 or
after t-1.
- “(t to t+3)” is defined similarly to “(t-4 to t-1)”.

15
- “HF_Target × t-4 to t-1” is an indicator equal to one for firms targeted by a hedge fund
for the period from four years to one year before the targeting event, and zero for every year before t-4 or
after t-1. “HF_Target × t-4 to t-1” is always equal to zero for the matched-control pairs (firms not
targeted by a hedge fund); and finally
- “HF_Target × t to t+3” and “HF_Target × Post t+3” are defined similarly to
“HF_Target × t-4 to t-1”.
3.4. The Long-term Association between Firm Value and Becoming a Hedge Fund Target in a
Matched Sample
In Table 5, we use our matched sample to reconsider the evidence in Bebchuk et al. (2015) that
firms targeted by activist hedge funds tend to increase in value. The interactions of our event-time
dummies (“t-5” through “t+5”) with “HF_Target” indicate whether the firm value of targeted firms is
different from those of non-targeted firms, while the event-time dummies without the interaction consider
whether there is a more general pattern in the firm value that is shared by both target and control firms.
The specification in column (1) of Table 5 includes 4-digit SIC industry fixed effects as well as
year fixed effects, plus a set of firm characteristics as controls, while column (2) uses firm rather than
industry fixed effects. The results indicate that once one incorporates firm heterogeneity, firms targeted
by activist hedge funds seem to have very different characteristics than the population of publicly traded
firms. This significantly changes the results from Table 2. In particular, the time dummies that are not
interacted with “HF_Target” and thus capture changes in firm value that are common to target and
control firms, exhibit the general pattern of increasing in value over time. For example, the coefficient on
“t” in column (2) equals -0.193 (with a t-statistic of 2.88) and the coefficient on “t+3” equals 0.025 (with
a t-statistic of 0.29), suggesting that both target and control firms significantly increase in firm value in
the three years after the target firm is first targeted by an activist hedge fund. Results in column (1) with
industry fixed effects are similar.

16
In contrast, the coefficients on the interactions of the event-time dummies with “HF_Target”,
which capture how the firm value of target firms differs from the firm value of control firms, indicate that
the target firms tend to decrease in firm value after being targeted, relative to the firm value of the control
firms. Note that the control firm sample is constructed—as shown in Table 4—to have a very similar firm
value to the target firm sample in the year before the target firms are targeted. This allows a
straightforward interpretation of the “HF_Target” interactions. For example, the coefficient of
“HF_Target × t” in column (2) equals -0.162 (with a t-statistic of 2.84), and the coefficient of
“HF_Target × t+3” equals -0.288 (with a t-statistic of 3.57). Economically, this means that the firm value
of the target firms tend to be 5.5% (=-0.162 divided by the average Q in the target firm sample of 2.939)
lower than the firm value of control firms at the end of the fiscal year in which the activist hedge funds
start their campaign, and about 9.8% (=-0.288/2.939) lower three years thereafter.
These results do not appear to be driven by the particular matching procedure we selected.
Indeed, when we use the three alternative matched samples based on the different matching procedures
described in section 3.3 above, we obtain the same qualitative result, namely that target firms tend to
increase less in value after being targeted, relative to the control firms. Using the Alternative Matched
Sample 1, the statistical and economic results we obtain are on average stronger than the results we obtain
using the Final Matched Sample (see Appendix Table A.1). Similarly, using the Alternative Matched
Samples 2 and 3 (based on propensity score matching), the estimate coefficients always remain negative
and statistically significant until the fourth year after the hedge fund intervention (see Appendix Table
A.2, and A3, respectively).
Our findings suggest that the main result in Brav et al. (2015)—that firm value tends to go up
after activist hedge funds commence their campaign—cannot be ascribed to the activist hedge fund
campaign itself. The control firms, which are not targeted by an activist hedge fund, tend to increase in
firm value around the same time, and controlling for that, the target firms that are targeted by activist
hedge funds actually perform worse. These findings thus seem to suggest that sample selection drives the

17
results in Bebchuk et al. (2015). Activist hedge funds tend to target firms that have been relatively poorly
performing in the past one to five years, as we documented in Table 3. However, in generally competitive
markets, many different actors can intervene to turn things around at a relatively poorly performing
company, including management, directors, long-term shareholders, other stakeholders like large
customers or suppliers, and also, naturally, activist hedge funds. The increases in firm value of the firms
in our control sample suggest that mechanisms other than activist hedge funds have been on average more
successful than the typical activist hedge fund campaign in turning these relatively poorly performing
firms around.
Our results are also robust to verifying that the firm value of target and control firms is similar
before the activist campaign. To this end, in columns (3) and (4) of Table 5, we first group together the
four years leading up to the target event (“t-4 to t-1”), the four years following the target event (“t to
t+3”) as well as the period after that (“Post t+3”). The results in columns (3) and (4) are quite similar to
the results in columns (1) and (2), respectively. Next, in columns (5) and (6), we add the interaction
between “HF_Target” and “t-4 to t-1” in order to verify that target firms tend indeed to have a similar
firm value to the control firms in the period leading up to the activist hedge fund campaign. This is a basic
robustness check of our comparison between target and control firms in our matched sample as done in
Table 4. We find that this interaction is statistically insignificant in both column (5) with industry fixed
effects and in column (6) with firm fixed effects, indicating that our matching procedure has successfully
matched target firms with similarly (typically poorly) performing control firms, while adding this
interaction does not change any of the other results.
Panel A of Figure 1 plots the annual averages of the industry median-adjusted Tobin’s Q for both
the target and control firms in the five years before to five years after the target firm is targeted by an
activist hedge fund. The figure further confirms that target and control firms have very similar firm values
before the target firm is targeted during fiscal year t, that the firm value of the target firms declines

18
substantially from the end of the fiscal year t-1 to the end of fiscal year t (during which year the firm is
targeted), and then tends to increase in the three years after that in a similar way as the control firms.
Table 6 shows results analogous to those in Table 5, but then only including target firms and their
controls for target firms involved in hostile activist hedge fund campaigns. Results for this sample are
quite similar, as we again find that firm value tends to be significantly lower for the target firms in the
years following the (hostile) activist hedge fund campaign. The main exception is for the interaction
between being targeted by in a hostile hedge fund campaign (“HHF_Target”) and the period starting three
years after the event (“Post t+3”). While this interaction is generally negative and statistically significant
in Table 5, for the hostile hedge fund sample the results are much weaker, especially if we include
industry fixed effects. For firm fixed effects, this interaction has a coefficient of -0.202 in column (4) with
a t-statistic of 1.42 and a coefficient of -0.268 with a t-statistic of 1.68, both of which have p-values close
to 10%. The results using hostile hedge fund campaigns using the alternative matching samples are
reported in Appendix Tables 4, 5 and 6, and show generally similar results.
Panel B of Figure 1 plots the annual averages of the industry median-adjusted Tobin’s Q for both
the target and control firms in the five years before to five years after the target firm is targeted by an
activist hedge fund, but now only considering hostile campaigns. The figure shows that target and control
firms have very similar firm values before the target firm is targeted during fiscal year t, that the firm
value of the target firms remains relatively low during the year the firm is targeted and hardly changes
thereafter, while the value of the control firms tend to increase in the three years after the targeting year.
3.4. Incorporating Delisting Prices
So far, we have exclusively used firm information at the end of the fiscal year, as is typical in the
literature that uses annual Compustat information to analyze variation in Tobin’s Q. However, using fiscal
year-end information means not incorporating changes in firm value happening during years in which the
firm delists from a stock exchange. This is especially relevant for firms targeted by activist hedge funds,
which are fairly likely to delist in our sample. In particular, we find that these firms are frequently taken

19
over. As a result, the generally large takeover premia received by target shareholders have not been
incorporated in our analysis so far, which could potentially change our inference (see Greenwood and
Schor, 2009). In this subsection, we incorporate the delisting price information into the Tobin’s Q at the
end of the fiscal year before the firm delists, and show that our main results are robust to doing so.
Appendix Table A.7 shows the number of firms delisting in our matched sample. In Panel A, we
consider all hedge fund targets. Out of the 2,648 events (which constitute 2,009 unique firms), 397 target
firms delist because they are taken over, 187 delist due to the firm violating a stock exchange requirement
(e.g., the stock price fell below the exchange acceptable level, the firm has insufficient equity, or is
delinquent in the payment of the listing fee), 13 firms delist but effectively retain securities that are traded
is a different stock market that is not included in CRSP, and 1 firm delists due to liquidation. Compared to
the 352 (227+125) firms in the control sample, target firms seem more likely to delist due to M&A and
exchange requirement violations.
In Panel B, we consider the sample targeted in hostile hedge fund campaigns only, where the
relative propensity of target firms to become a takeover target is even larger relative to the propensity of
control firms. Specifically, 121 out of 313 target firms in this sample are taken over, as compared to only
64 out of 302 control firms. This is consistent with the evidence in Boyson, Gantchev and Shivdasani
(2015) that activist campaigns make targeted firms more likely to be taken over.
In Appendix Tables A.8 and A.9, we adjust the Tobin’s Q at the end of the firm’s last fiscal year
before delisting for the delisting price that is reported in CRSP. Appendix Table A.8 shows the results
using the delisted-price adjusted Tobin’s Q for the sample of all activist hedge fund campaigns, analogous
to the results in Table 5. Appendix Table A.9 shows the results using the delisted-price adjusted Tobin’s
Q for the sample of only hostile activist hedge fund campaigns, analogous to the results in Table 6. In
both cases, we find that our main result, namely that the value of firms targeted by activist hedge funds
tends to decrease afterwards relative to control firms, is robust to incorporating the delisting price. For
example in column (4) of Table A.8 with firm fixed effects, we find that the coefficient on the interaction

20
“HF_Target × t to t+3” equals -0.195 (with a t-statistic of 3.51) and the coefficient on the interaction
“HF_Target × Post t+3” equals -0.217 (with a t-statistic of 2.45), which are quite close to the analogous
coefficients in column (4) of Table 5.
3.5. Adding time-varying industry fixed effects
Another important robustness check is to control for time-varying industry effects. For example,
we do not match target and control firms by industry. Also, it is possible that activist hedge fund
campaigns targeting a firm in a particular industry may have an effect on other firms in that industry,
especially if the activist hedge fund is perceived as likely to target other firms operating in the same
industry as prior firms it has targeted, as documented by Gantchev, Gredil and Jotiskasthira (2015).
We verify the robustness of our main result by adding 3-digit SIC industry fixed effects that
change every year to our pooled panel specifications. Given that the 1,932 firms in our matched sample of
all hedge fund targets come from 346 different industries and our sample consists of 17 years, that means
adding about 5,882 annual industry dummies. The results with time-varying industry fixed effects for the
matched sample of all hedge fund campaigns are reported in Appendix Table A.10, and for the sample of
hostile hedge fund campaigns only in Appendix Table A.11. In both cases, we find that our results remain
robust to adding these industry fixed effects.
3.6 Abnormal Stock Returns for Targeted and Control Firms
Brav et al. (2008a) and Bebchuk, Brav and Jiang (2015) also show that firms targeted by activist
hedge funds exhibit positive abnormal stock returns in the period following the start of the activist
campaign. In this section, we compare the abnormal stock returns of the targeted firms to those of their
control firms. In our empirical design, we closely follow Bebchuk, Brav and Jiang (2015), and for
example use the four-factor Fama-French-Carhart model to calculate abnormal returns (i.e., alphas). Our
main extension is to consider the abnormal returns of the firms targeted by the hedge funds, but also the
abnormal returns of their controls. The abnormal returns of the stocks of the control firms indicate

21
whether the activist hedge funds on average have skills for picking stocks based on characteristics that
indicate good future performance.
We first consider the target and control firm samples separately. In Table 7, we report the results
for calendar-time portfolios that invest in stocks of the target or control firms in a particular window
around the date that an activist hedge fund files its first 13D for a target firm. We consider three different
periods: (i) the 36 months preceding the start of the activist hedge fund campaign, ending one month
before the first 13D filing, [-36, -1], (ii) the 36 months following the start of the campaign, starting one
month after the 13D filing by the activist hedge fund, [+1, +36], and (iii) the 60 months following the
start of the campaign, [+1, +60]. For each period, we create equal- and value-weighted portfolios for all
stocks that were target or control firms in that period. When we calculate abnormal returns, we follow
Bebchuk, Brav and Jiang (2015) and employ weighted-least squares regressions, weighting the monthly
excess portfolio returns by the number of stocks included in the portfolio. We further only consider the
returns in calendar months where the portfolio includes at least 10 firms.
Panel A-1 of Table 7 replicates the results in Bebchuk, Brav and Jiang (2015), finding positive
abnormal returns for targeted firms in the three and five years after the start of the activist hedge fund
campaign using equal-weighted portfolios. We also find that the portfolio of target firms has a relatively
low market beta, strongly positive exposure to the size and book-to-market factors and negative exposure
to momentum. However, the abnormal returns of the control firms, reported in Panel A-2 of Table 7, are
also positive, of similar economic magnitude and with similar exposures to market risk, size, book-to-
market and momentum. Panels B-1 and B-2 report the results for value-weighted portfolios for the target
and control firms, respectively, where all alphas are insignificant, again similar to Bebchuk, Brav and
Jiang (2015). This indicates that the positive abnormal returns were driven by the smaller targeted (and
thus control) firms, possibly because small firms have a less efficient information environment.
In Table 8, we report the results for long-short calendar-time portfolios where we buy the
portfolio of target firms and sell the portfolio of control firms, again in the three different time periods

22
around the time the activist hedge funds file their first 13D for a stock. Using equal-weighted portfolios in
Panel A, we find that the long-short portfolios have a negative and statistically significant four-factor
alpha in each of the three time periods considered. For example, over the 36 month period, [+1, +36], the
long-short portfolio has a monthly four-factor alpha of -0.43% (t-statistic of 3.99), and over the 60 month
period, [+1, +60], the alpha equals -0.19% per month (t-statistic of 2.45). Using value-weighted portfolios
in Panel B, the abnormal returns remain negative but we only find a statistically significant result for the
60 month period, [+1, +60]. As an aside, the long-short portfolio abnormal returns in Table 8 cannot be
directly inferred from the abnormal returns of the separate long and short portfolios in Table 7, for two
reasons. This is primarily because, in Table 8, the factor exposures are constrained to be identical across
the long and short portfolios (as is typical in the literature when calculating abnormal returns for long-
short portfolios).
The long-short portfolio results indicate that the stocks of the control firms outperformed the
stocks of the target firms in the period around the start of the activist hedge fund campaigns. Therefore,
while both targets and control firms on average had positive abnormal stock returns, investors would have
been better off buying the stocks of the control firms rather than the stocks of the target firms. In turn, this
suggests that while activist hedge funds appear to have stock picking skills on average, it seems unlikely
that the positive abnormal stock returns can be attributed to the activist hedge funds themselves.
4. Activist Hedge Funds and the Limited Commitment Problem
In this section, we consider whether the association between becoming a target in an activist
hedge fund campaign and long-term firm value is different for firms where it is more important that
shareholders have a strong commitment to longer-term value creation and strong stakeholder
relationships. A lack of such shareholder commitment may create what Cremers et al. (2015) label a
‘limited commitment problem,’ which arises out of the separation of shareholder ownership and
managerial control in the context of asymmetric information and limited contracting or where stakeholder
investments have a long-term, firm-specific nature. In these cases, the strong exit rights of shareholders,

23
combined with asset pricing inefficiencies, may make shareholders unable to commit to the longer-term
horizon. This is because upon observing a disappointing short-term firm outcome, shareholders will
generally be unable to tell whether such an outcome is the result of managerial opportunism or an
investment whose value will only materialize in the long term. As a result, fearing that managerial
opportunism might be the source of such an outcome and in the attempt to protect their interests,
shareholders may rationally ask the board to change top management and corporate policies, or decide to
sell their shares in a takeover attempt or agree to change the board of directors in a proxy contest, all of
which may lead to changes in the corporate strategy. Anticipating these circumstances, directors and
managers may develop myopic incentives to appease shareholders (Stein, 1988, 1989; Karpoff and Rice,
1988, Bradenburger and Polak, 1996) and other stakeholders may become less willing (or demand higher
compensation) to offer their cooperation for longer-term investments (Shleifer and Summers, 1988;
Johnson et al., 2015). In both cases, the result is a reduction in long-term firm value.
Activist hedge funds are naturally more empowered than other shareholder to challenge the board
of directors to change corporate policies or even corporate strategy, promoting the adoption of decisions
to fire the existing management, increase leverage, reduce cash, or sell the firm to a prospective acquirer.
All of such interventions—or even just their threat—may increase costs to incumbents, who risk losing
their jobs, as well as to other stakeholders, especially those who are required to make longer-term, firm-
specific investments in their relationships with the firm. This suggests that hedge fund activism may
exacerbate a firms’ limited commitment problem, with potentially detrimental effects on long-term firm
value creation.
If our explanation about the possible transmission channel through which hedge fund activism is
negatively associated to firm value is correct, we would expect to find that activist hedge fund
campaigns—and hostile campaigns especially—are more negatively related to longer-term firm value for
firms where the limited commitment problem is more relevant. In order to test this hypothesis, we will
consider two different ways to identify such firms. We first focus on firms whose corporate strategy

24
seems to intrinsically make the limited commitment problem more prominent, namely firms involved in
longer-term research and development projects or firms with significant intangible assets that may be
harder for outside shareholders to value. Second, we consider different proxies for firms where specific
stakeholders have to make more firm-specific and long-term investments in their relationship with the
firm.
4.1. Innovative Firms
To identify firms whose corporate strategies are likely to make the limited commitment problem
particularly relevant, we employ three different proxies. First, we focus on firms that have high research
and development expenses, as measured by a ratio of R&D expenses to sales that is above the 75th
percentile in the sample (setting missing R&D expenses to zero). Second, we consider firms where
intangible assets—such as goodwill, patents and trademarks—are relatively important, as measured by the
ratio of book value of the firm’s intangible assets over the book value of total assets being above the 75th
percentile in the sample (setting missing intangible asset values to zero). Third and finally, we identify
firms with significant patents directly using the NBER U.S. Patent Citations data file, focusing on firms
with a patent citation count above the overall sample’s 75th percentile.
In firm sharing the above characteristics it seems more likely that currently observable firm
outcomes may not be fully informative about managerial performance (especially towards long-term
value creation). This is because investments in R&D and intangible assets (including patents) naturally
tend to be affected by a higher level of asymmetric information (Mizik and Jacobson, 2007, Edmans,
2011; Popadak, 2015). On the one hand, information about these investments is typically “soft” or non-
verifiable. Moreover, these long-term investments tend to require large capital expenditures up-front,
which is a kind of hard information that current market prices can more easily incorporate. As a result,
shareholders are more likely to rationally interpret poor observed short-term outcomes that tend to
accompany these investments as evidence of poor managerial performance (Eberhart, Maxwell, and
Siddique, 2004).

25
In Table 9, we add the interaction of the above three limited commitment proxies to the
specification in column (4) of Table 6, namely the specification with firm fixed effects that groups
together event-times “t-4 to t-1,” “t to t+3,” and “Post t+3” dummies for the matched sample of hostile
hedge fund campaigns. Our main interest is in the triple interaction of each limited commitment proxy,
the dummy variable “HHF_Target” indicating that the firm was targeted by a hostile activist hedge fund,
and finally the event-time dummies. We also include the double interactions of the limited commitment
proxies and the event-time dummies to control for any time-variation in the valuation of these
characteristics that changes over time similarly for target and control firms.
Consistent with our hypothesis, Table 9 documents that firms in which the limited commitment
problem seems more relevant decrease more in value after hostile activist hedge fund campaigns than
other targeted firms. The results are striking in their significance. For example, the triple interaction of the
“High R&D” dummy with “HHF_Target” and “t to t+3” equals -0.818 with a t-statistic of 2.15, while the
double interaction of “HHF_Target” with “t to t+3” equals -0.144 with a t-statistic of 1.78. These results
suggest that research-intensive firms tend to decrease in value substantially more than other targeted firms
(both relative to their respective control firms), or more than five times as much. Economically, the
coefficients indicate that the group of research intensive firms targeted in hostile activist hedge fund
campaigns have declined in value by 50.05% (=-0.818-0.144, divided by the average Q of this sample of
1.922) in the three years after first being targeted, while the other firms declined in value by 7.49%% (=-
0.144 divided by the average Q of this sample of 1.922). The results for firms with a high patent citation
count in column (3) are similar, and likewise the results in column (2) suggest that firms with significant
intangible assets decline more in value than other targeted firms.
At the same time, we note that the triple interaction between the limited commitment proxies,
“HF_Target” and “t-4 to t-1” are all statistically insignificant. This indicates that our matching procedure
has matched control firms with a similar value to the group of firms where the limited commitment

26
problem is more severe, i.e., to firms with more R&D, more intangible assets and more high patent
citation counts.
4.2. Firms with Important Stakeholder Relationships
In order to identify firms where specific stakeholders have to make more specific and longer-term
investments in their relationship with the firm, we consider three different proxies, respectively capturing
the importance of suppliers, employees, and unsecured borrowers. Our first proxy, High Contract
Specificity, captures firms in industries where suppliers have to make more firm-specific investments in
their relationship with the firms in that industry, as measured by Contract Specificity, which is the
fraction of inputs in the industry that is not sold in an organized exchange (or reference priced in a trade
publication). This variable comes from Nunn (2007), who makes this data available on his website. High
Contract Specificity equals one for firms in industries where Contract Specificity is above its 75th
percentile in the sample.
The second proxy is also at the industry level, focusing on firms in industries where the labor
productivity is above the 75th percentile in the sample. Labor productivity data comes from the Bureau of
Labor Statistics at the U.S. Department of Labor. The third and final proxy is at the firm-level rather than
the industry-level, and captures firms with high unsecured borrowing, i.e., firms where the ratio of the
book value of unsecured debt (COMPUSTAT’s items dlc+dltt-dm) to the book value of total debt
(dlc+dltt) and the ratio of total debt to assets are both above their sample medians (which is the case for
about 25% of the sample, capturing firms that have relatively high debt, a relatively large fraction of
which consists of unsecured loans).
As shown in Table 10 and similar to the case of more innovative firms, for each of these three
proxies, we find that firm value tends to decrease more after an hostile activist hedge fund campaign for
firms where stakeholder participation seems especially relevant relative to firms where stakeholder
participation is not as important. For example, the coefficient on the triple interaction of “High Labor
Productivity” with “HHF_Target” and “t to t+3” equals -0.422 with a t-statistic of 2.16, while the double

27
interaction of “HHF_Target” and “t to t+3” has a coefficient of -0.149 with a t-statistic of 1.41. This
suggests that the decline in firm value for firms where employees are relatively more productive is
substantially larger in the years following a hostile hedge fund campaign, potentially because such
campaign may disrupt the firm’s relationship with these productive employees. For example, the most
valuable employees will likely have the best outside options and may choose to leave the firm rather than
experiencing a continued threat of further disruption to their work environment arising from the hostile
activist hedge fund campaign.
Economically, the coefficients suggest that the group of firms where employees are relatively
more productive that are targeted in hostile activist hedge fund campaigns have declined in value by
29.71% (=-0.422-0.149, divided by the average Q of this sample of 1.922) in the three years after first
being targeted, while the other firms declined in value by 7.75% (=-0.149 divided by the average Q of this
sample of 1.922). The results for the other two proxies for firms with more important stakeholder
relationships are similar.
5. Conclusion
This paper considers the role of hedge fund activism on firm value. Previous research has
emphasized that hedge fund activism can increase firm value by more effectively monitoring corporate
executives. As a matter of theory, however, hedge fund intervention may likewise exacerbate the limited
commitment problem arising in publicly traded corporation, thereby undermining the ability of corporate
managers to pursue value-increasing long-term investments and complicating (or making more costly) the
cooperation of other stakeholders towards such long-term value creation.
To verify these conflicting theoretical hypotheses about the long-term association between hedge
fund activism and firm value, we carefully match firms targeted by hedge fund activists to non-targeted
control firms. Consistent with the limited commitment hypothesis, our findings reveals that in the years
following the intervention of activist hedge funds, the firm value of hedge fund targets deteriorates
(sizably) compared to control firms. These results are robust to accounting for the potentially higher

28
premium that hedge fund targets receive in follow-up mergers and to incorporating time-varying industry
fixed effects. Most importantly, we find the decrease in firm value for target firms (compared to control
firms) to be particularly sizable for firms that are more likely to be affected by the limited commitment
problems, such as firms that rely more intensively on R&D investments, intangible assets, and patents, or
firms in industries characterized by high contract specificity, high labor productivity, and intensive use of
unsecured debt.
Our paper contributes to the current academic and policy debate on the association between hedge
fund intervention and firm value. Incorporating firm heterogeneity in a matching approach—and
especially that firms targeted by activist hedge funds tend to have performed poorly in the period before
they were targeted—we document a large decrease in firm value for target firms compared to control
firms with a similarly poor ex-ante performance. Importantly, our study identifies the channel—namely
the aggravation of the limited commitment problem—to help explain why firm value tends to decrease in
the years after an activist hedge fund has started its campaign. Future research could consider additional
channels through which hedge fund interventions can affect firm value, as well as investigate whether
alternative governance solutions might be better suited at solving the trade-off between addressing both
managerial moral hazard and the limited commitment problems that arise in the public corporation.

29
References
Abadie, A., and G. Inbens, (2006), Large sample properties of matching estimators for average
treatment effects, Econometrica, Vol. 74: 235–267.
Bebchuk, L.A., (2005), The case for increasing shareholder power, Harvard Law Review, Vol.
118: 833-914.
Bebchuk, L.A., (2007), The myth of the shareholder franchise, Virginia Law Review, Vol. 93:
675-732.
Bebchuk, L.A., (2013), The myth that insulating boards serve long-term firm value, Columbia
Law Review, Vol. 113: 1637-1694.
Bebchuk, L.A., J. Fried and D. Walker, (2002), Managerial Power and rent extraction in the
design of executive compensation, The University of Chicago Law Review, Vol. 69: 751-846.
Bebchuk, L.A. and J. Fried, (2004), Pay without performance: The unfulfilled promise of
executive compensation, Harvard University Press, Cambridge, MA.
Bebchuk, L.A., A. Brav, and W. Jiang, (2015), The long-term effects of hedge fund activism,
Columbia Law Review, Vol. 115: 1085-1156.
Boyson, N.M., Gantchev, N., and A. Shivdasani, (2015), Activism mergers, working paper.
Brandenburger, A. and B. Polak, 1996, When managers cover their posteriors: Making the
decisions the market wants to see, RAND Journal of Economics, Vol. 27: 523-541.
Brav, A., W. Jiang, F. Partnoy and R. Thomas, (2008a), Hedge fund activism, corporate
governance, and firm performance, Journal of Finance, Vol. 63: 1729-1775.
Brav, A., W. Jiang, F. Partnoy, and R. Thomas (2008b), The returns to hedge fund activism,
Financial Analyst Journal, Vol. 64: 45–61.
Brav, A., W. Jiang and H. Kim, (2009), Hedge fund activism: A review, Foundation & Trends in
Finance, Vol. 4: 185-246.
Brav, A., W. Jiang, S. Ma, and X. Tian, (2014), Shareholder Power and Corporate Innovation:
Evidence from Hedge Fund Activism, Working paper
Cheng, C., H. Huang, Y. Li, and J. Stanfield, (2012), The Effect of Hedge Fund Activism on
Corporate Tax Avoidance, The Accounting Review, 87(5), 1493-1526.
Cheng, C., H. Huang, and Y. Li, (2015), Hedge Fund Intervention and Accounting Conservatism,
forthcoming in Contemporary Accounting Research.
Coffee, J.C., Jr. and D. Palia (2015), The wolf at the door: The impact of hedge fund activism on
firm value, working paper.
Cremers, K.J.M., L. Litov, and S.M. Sepe, (2015), Staggered boards and firm value revisited,

30
working paper.
Eberhart, A.C., W.F. Maxwell, and A.R. Siddique, 2004, An examination of long-term abnormal
stock returns and operating performance following R&D increases, Journal of Finance Vol. 59: 623–650.
Edmans A., (2011), Does the stock market fully value intangibles? Employee satisfaction and
equity prices, Journal of Financial Economics, Vol. 101: 621-640.
Gantchev, N., O. Gredil, and C. Jotikasthira, (2015), Governance under the gun: spillover effects
of hedge fund activism, working paper.
Gilson, R.J. and J.N. Gordon, (2013), The agency costs of agency capitalism: activist investors
and the revaluation of governance rights, Columbia Law Review, Vol. 113: 863-928.
Greenwood, R. and M. Schor (2009), Hedge fund investor activism and takeovers, Journal of
Financial Economics, Vol. 92: 362–375.
Jacobs, J.B., (2011), Patient capital: Can Delaware corporate law help revive it?, Washington &
Lee Law Review, Vol. 68: 1645-1664.
Johnson, W.C, J.M. Karpoff, and S. Yi, (2015), The bonding hypothesis of takeover defenses:
Evidence from IPO firms, Journal of Financial Economics, Vol. 117: 307-332.
Kahan, M. and E.B. Rock, (2007), Hedge funds in corporate governance and corporate control,
155 University of Pennsylvania Law Review, Vol. 155: 1021-1093.
Karpoff, J., and E. Rice, (1989), Organizational form, share transferability, and firm performance,
Journal of Financial Economics, Vol. 24: 69–105.
Klein, A. and E. Zur, (2009), Entrepreneurial shareholder activism: Hedge funds and other private
investors, Journal of Finance, Vol. 64: 187–229.
Lipton, M. Bite the apple; poison the apple; paralyze the company; wreck the economy, The
Harvard Law Sch. Forum on Corporate Governance & Fin. Regulation (Feb. 26, 2013, 9:22 AM),
http://blogs.law.harvard.edu/corpgov/2013/02/26/bite- the-apple-poison-the-apple-paralyze-the-company-
wreck-the-economy.
Mizik, N. and R. Jacobson, 2007, The cost of myopic management, Harvard Business Review,
July-August, 22-24.
Popadak, J., (2015), A corporate culture channel: How increased shareholder governance reduces
firm value, working paper.
Shleifer, A. and L. Summers, 1988, Breach of trust in hostile takeovers, in A.J. Auerbach (ed.),.
Corporate takeovers: Causes and consequences.
Stein, J., (1988), Takeover threats and managerial myopia, Journal of Political Economy, Vol.
96(1): 61–80.
Stein, J. C., (1989), Efficient capital markets, inefficient firms: A model of myopic corporate

31
behavior, The Quarterly Journal of Economics, Vol. 104: 655–669.
Strine, L.E., Jr., (2010), One fundamental corporate governance question we face: Can
corporations be managed for the long term unless their powerful electorates also act and think long term?,
Business Lawyer, Vol. 66: 1-26.

32
Table 1 – Variable Definitions – Panel A
Table 1 provides a definition of the main variables used in the paper.
Dependent Variable:
TobinQ
TobinQ is the industry-median adjusted Tobin's Q, calculated as the firm’s Tobin’s Q minus the 4-digit SIC-year median Tobin’s Q (where Tobin’s Q is the ratio of market value of total assets (COMPUSTAT’s items at–ceq+prcc_fcsho) to book value of assets (at)). Sample period 1995 – 2011.
Control Variables:
LnSize LnSize is the natural logarithm of the book value of total
assets (COMPUSTAT’s item at). Sample period 1995 – 2011.
Leverage
Leverage is the ratio of the book value of total debt (COMPUSTAT’s items dltt + dlc) to the book value of assets. Sample period 1995 – 2011.
CAPX
CAPX is the ratio of capital expenditures (COMPUSTAT’s item capx) to the book value of total assets. Sample period 1995 – 2011.
R&D
R&D is the ratio of R&D expenses (COMPUSTAT’s item xrd) to the book value of total assets. Sample period 1995 – 2011.
Intangibility
Intangibility is one minus the ratio of property, plants, & equipments (COMPUSTAT’s item ppent) to the book value of total assets. Sample period 1995 – 2011.
ROA
ROA is the ratio of operating income before depreciation (COMPUSTAT’s item oibdp) to the book value of total assets. Sample period 1995 – 2011.
Ln Market Value of Equity
LnSize is the natural logarithm of market value of equity (COMPUSTAT’s items prcc_f × csho). Sample period 1995 – 2011.
Hedge Funds and Limited Commitment Variables
Used in Matched-Sample Analysis Only: Table 4 and onward
HF_Target
HF_Target is an indicator equal to 1 for firms targeted by an activist hedge fund during our sample. The hedge fund data is from Brav et al. (2008) (and subsequently updated by those authors) and cover the period 1995 – 2011.

33
HHF_Target
HHF_Target is an indicator equal to 1 for firms targeted by an activist hedge fund in a hostile campaign as coded by Brav et al. (2008) (and subsequently updated by those authors), covering the period 1995 – 2011.
High R&D
High R&D is an indicator equal to 1 if the ratio of R&D expenses (COMPUSTAT’s item xrd) to total sales (sale) for the firm is above the overall sample 75th percentile on the year before the targeting event. Sample period 1995 – 2011.
High Intangibility
High Intangibility is an indicator equal to 1 if Intangibility (COMPUSTAT’s items: 1 – ppent/at) for the firm is above the overall sample 75th percentile on the year before the targeting event. Sample period 1995 – 2011.
High Patent Citation
High Patent Citation is an indicator equal to 1 for firms with a number of patent citation counts above the overall sample 75th percentile on the year before the targeting event. The patent citation count data is from the NBER U.S. Patent Citations data file. Sample period 1995 – 2010.
High Contract Specificity
High Contract Specificity is an indicator equal to 1 if the firm operates in an industry in which the percentage of inputs that are not sold in an organized exchange (or reference priced in a trade publication in the Nunn (2007) data file) is above the overall sample mean on the year before the targeting event. Data is available only for 1997.
High Labor Productivity
High Labor Productivity is an indicator equal to 1 if labor productivity (output per hour of labor) in the firm’s industry is above the overall sample 75th percentile on the year before the targeting event. The labor productivity data are from Bureau of Labor Statistics (U.S. Department of Labor). Sample period 1995 – 2011.
High Unsecured Borrowing
High Unsecured Borrowing is an indicator equal to 1 for firms for which the ratio of unsecured debt (COMPUSTAT’s items dlc+dltt-dm) to total debt (dlc+dltt) and the ratio of total debt to assets are both above their sample medians on the year before the targeting event. Sample period 1995 – 2011.

34
Table 1 - Descriptive Statistics – Panel B
This table reports descriptive statistics for the main variables used in the paper. The sample includes all non-financial firms from COMPUSTAT for the period 1995 – 2011. See Table 1, Panel A for detailed variable definitions.
Variables Mean St. Dev. 25th PCTLE 75th PCTLE Obs.
Dependent Variable:
TobinQ 2.939 14.314 -0.365 0.860 91,466 Control Variables:
LnSize 4.631 2.681 2.929 6.508 106,073 Leverage 0.369 0.741 0.021 0.414 105,689 CAPX 0.060 0.074 0.015 0.072 104,594 R&D 0.081 0.197 0.000 0.069 106,073 Intangibility 0.729 0.249 0.588 0.929 105,888 ROA -0.235 1.284 -0.084 0.151 105,148 Ln Market Value of Equity 4.651 2.493 2.923 6.411 91,972

35
Table 2 – Evolution of Tobin’s Q over Time as in Table 4 of Bebchuk et al. (2015)
This table presents the coefficient estimates from OLS regressions where the dependent variable is Tobin’s Q. The hedge fund data is from the (updated) dataset used in Brav. et al. (2008) and covers the period 1995 to 2011. The sample includes all non-financial firms from COMPUSTAT for the period 1995 – 2011. We follow Bebchuk et al. (2015) in the definition of variables and model specification. In particular, “t: Event year” is an indicator equal to one for firms targeted by a hedge fund in the year of the targeting event, and zero for every other year before or after the targeting event year. The t-dummy is always equal to zero for firms not targeted by a hedge fund. The other time dummies are defined similarly (see text for further details). See Table 1 for the description of all the variables. In all regressions, we include dummy variables representing the year of intervention as well as each of subsequent five years. In the table, t-statistics in brackets are based on robust standard errors clustered by firm.
All Hedge Funds Hostile Hedge Funds
Dependent variable: (1)
Tobin’s Q (2)
Tobin’s Q (3)
Tobin’s Q (4)
Tobin’s Q
(5) Tobin’s Q
(6) Tobin’s Q
(7) Tobin’s Q
(8) Tobin’s Q
t: Event year -0.361*** -0.155*** -0.617*** -0.323*** [-7.564] [-3.063] [-7.963] [-4.029]
t+1 -0.283*** -0.022 -0.425*** -0.073 [-5.887] [-0.409] [-4.828] [-0.720]
t+2 -0.254*** 0.006 -0.348*** 0.012 [-5.415] [0.120] [-3.996] [0.114]
t+3 -0.124** 0.128** -0.228** 0.122 [-2.402] [2.374] [-2.184] [1.053]
(t to t+3) -0.129** 0.052 -0.274*** -0.013
[-2.475] [0.973] [-3.064] [-0.141]
Post t+3 0.191*** 0.265*** 0.202*** 0.411***
[4.011] [4.101] [2.593] [3.821]
t+4 -0.094* 0.164*** -0.129 0.225** [-1.679] [2.792] [-1.174] [2.018]
t+5 -0.067 0.174*** -0.093 0.254** [-1.053] [2.800] [-0.695] [2.061]
LnMV 0.228*** 0.228*** 0.733*** 0.734*** 0.228*** 0.228*** 0.733*** 0.733*** [38.133] [38.185] [63.870] [63.877] [38.138] [38.143] [63.862] [63.866]
LnAge -0.384*** -0.384*** -0.482*** -0.477*** -0.386*** -0.386*** -0.482*** -0.479*** [-29.814] [-29.823] [-19.164] [-18.938] [-29.966] [-29.949] [-19.142] [-19.007]
Year-Fixed Effect Yes Yes Yes Yes Yes Yes Yes Yes
SIC3-Fixed Effect Yes Yes Yes Yes
Firm-Fixed Effect Yes Yes Yes Yes
Pre-event dummies Yes Yes Yes Yes Yes Yes Yes
Obs. 131,163 131,163 131,163 131,163 131,163 131,163 131,163 131,163
R-2 (within) 0.077 0.077 0.170 0.170 0.077 0.077 0.170 0.170
F-Tests: [t+3] - t 17.03 25.11 11.09 13.55
p - val 0.00% 0.00% 0.09% 0.02%
[t+4] - t 16.58 23.01 21.80 26.13
p - val 0.00% 0.00% 0.00% 0.00%
[t+5] - t 16.44 20.44 12.92 16.46
p - val 0.01% 0.00% 0.03% 0.00% Note: ***, ** and * indicate statistical significance at the 1%, 5%, and 10% (two-tail) test levels, respectively.

36
Table 3 – The Ex-ante Probability of Becoming a Hedge Fund Target
This table presents the marginal effects estimates from logit (Panel A) and Cox proportional hazard model (Panel B) regressions. The hedge fund data is from the (updated) dataset used in Brav. et al. (2008) and covers the period 1995 to 2011. The sample includes all non-financial firms from COMPUSTAT for the period 1995 – 2011. In Panel A, the dependent variable is an indicator equal to 1 if the firm is targeted by a hedge fund in a given year, and zero otherwise. In Panel B, we categorize as “failure” an event year in which a firm is targeted by a hedge fund. To construct our sample, we use all firms that have not been targeted by a hedge fund in the past five years. If a firm is targeted by a hedge fund, we drop it from our sample. We allow the firm to re-enter the sample if it has not been targeted by a hedge fund for at least five years. See Table 1 for detailed variable definitions. In the table, t-statistics appear in brackets and are based on robust standard errors clustered by firm.
Panel A: Logit Hedge Fund Target Dummy (1) (2) (3) (4) (5) (6) TobinQ at t=-5 -0.001*** -0.000 [-3.437] [-1.472]
TobinQ at t=-4 -0.002*** -0.001** [-5.922] [-2.477]
TobinQ at t=-3 -0.002*** -0.000 [-2.579] [-0.341]
TobinQ at t=-2 -0.001** -0.000 [-2.437] [-0.009]
TobinQ at t=-1 -0.002*** -0.002* [-3.664] [-1.738]
LnSize at t=-1 0.001*** 0.001*** 0.001*** 0.001*** 0.001*** 0.001*** [3.176] [3.401] [3.412] [4.271] [5.165] [2.697]
Leverage at t=-1 -0.001 0.000 0.000 0.000 0.002 0.002 [-0.858] [0.256] [0.277] [0.127] [1.441] [1.027]
CAPX at t=-1 0.004 0.011 0.012 0.010 0.008 0.012 [0.355] [1.072] [1.214] [1.078] [0.954] [1.063]
R&D at t=-1 0.004 0.003 0.005 0.005 0.007** 0.004 [1.106] [0.757] [1.609] [1.558] [2.082] [1.043] Intangibility at t=-1 0.004 0.005* 0.004 0.005* 0.005* 0.006**
[1.536] [1.690] [1.399] [1.767] [1.944] [2.002]
ROA at t=-1 0.003* 0.002 0.002 0.001 -0.001 -0.002 [1.715] [1.428] [1.542] [1.072] [-0.654] [-0.902]
Year FE Yes Yes Yes Yes Yes Yes Obs. 61,527 66,387 71,698 77,461 83,789 59,904 Pseudo-R2 0.031 0.032 0.032 0.033 0.037 0.035 Note: ***, ** and * indicate statistical significance at the 1%, 5%, and 10% (two-tail) test levels, respectively.

37
Panel B: Cox model Failure Event: Hedge Fund Target Dummy (1) (2) (3) (4) (5) (6) TobinQ at t=-5 -0.123*** -0.064** [-3.598] [-2.416]
TobinQ at t=-4 -0.165*** -0.064* [-3.957] [-1.956]
TobinQ at t=-3 -0.117** -0.005 [-1.983] [-0.157]
TobinQ at t=-2 -0.124* 0.004 [-1.762] [0.193]
TobinQ at t=-1 -0.267** -0.155 [-2.294] [-1.363]
LnSize at t=-1 0.051** 0.059** 0.056** 0.058** 0.062** 0.052** [2.253] [2.455] [2.366] [2.375] [2.356] [2.091]
Leverage at t=-1 -0.125 -0.043 -0.032 -0.016 0.166 0.077 [-1.151] [-0.378] [-0.278] [-0.128] [0.941] [0.457]
CAPX at t=-1 -0.435 -0.541 -0.344 -0.569 -0.584 0.152 [-0.549] [-0.702] [-0.440] [-0.733] [-0.741] [0.155]
R&D at t=-1 0.373 0.431 0.514* 0.578* 0.687* 0.422 [1.262] [1.402] [1.679] [1.777] [1.808] [1.088]
Intangibility at t=-1 0.073 0.093 0.115 0.162 0.184 0.210 [0.304] [0.382] [0.469] [0.628] [0.687] [0.715]
ROA at t=-1 0.258* 0.295* 0.354* 0.352* 0.228 -0.004 [1.731] [1.790] [1.951] [1.851] [0.990] [-0.025]
Obs. 38,764 41,063 42,725 43,617 44,427 38,065 Wald-chi2 69.52*** 82.88*** 51.47*** 47.25*** 36.47*** 62.03*** Note: ***, ** and * indicate statistical significance at the 1%, 5%, and 10% (two-tail) test levels, respectively.

38
Table 4 – Hedge Funds Targets and Matched-Control Firms
This table reports mean difference tests of firm characteristics for firms targeted by hedge funds and control firms (Panel A) and for firms targeted by hostile hedge funds and control firms (Panel B). The hedge fund data is from the (updated) dataset used in Brav. et al. (2008) and covers the period 1995 to 2011. The sample includes non-financial firms from COMPUSTAT for the period 1995 – 2011. Control firms are a subsample of the non-targeted firms selected as the closest match based on Tobin’s Q (lag 1 to 5), natural logarithm of market value of equity (lag 1), leverage (lag 1), ROA (lag 1), and fiscal year. We use the Abadie-Imbens matching estimator to identify the control firms (Abadie and Imbens, 2006). Refer to Table 1 for detailed variable definitions.
Panel A: All Hedge Funds Target Control Difference Difference t-test
p-value
TobinQ at t-1 0.158 0.211 -0.053 0.736 TobinQ at t-2 0.302 0.230 0.072 0.640 TobinQ at t-3 0.298 0.249 0.049 0.728 TobinQ at t-4 0.291 0.429 -0.138 0.381 TobinQ at t-5 0.400 0.341 0.059 0.550 Log Market Value at t-1 5.094 5.103 -0.009 0.909 Leverage at t-1 0.253 0.249 0.004 0.761 ROA at t-1 0.017 0.019 -0.001 0.944 Log Size at t-1 5.439 5.396 0.043 0.595 CAPX at t-1 0.051 0.048 0.002 0.380 R&D at t-1 0.060 0.050 0.010 0.109 Intangibility at t-1 0.744 0.733 0.011 0.264
Panel B: Hostile Hedge Funds Treated Control Difference Difference t-test
p-value
TobinQ at t-1 -0.209 -0.146 0.177 0.342 TobinQ at t-2 -0.082 0.014 -0.096 0.198 TobinQ at t-3 0.347 0.033 0.314 0.405 TobinQ at t-4 0.196 0.096 0.100 0.343 TobinQ at t-5 0.313 0.247 0.066 0.598 Log Market Value at t-1 5.311 5.310 0.002 0.991 Leverage at t-1 0.231 0.228 0.003 0.895 ROA at t-1 0.072 0.074 -0.002 0.863 Log Size at t-1 5.736 5.585 0.150 0.267 CAPX at t-1 0.053 0.051 0.002 0.643 R&D at t-1 0.050 0.038 0.012 0.113 Intangibility at t-1 0.743 0.729 0.014 0.465

39
Table 5 – Hedge Funds and Firm Value: All Hedge Funds
This table presents the coefficient estimates from OLS regressions. The dependent variable is Tobin Q, the industry median-adjusted Tobin’s Q. The hedge fund data is from the (updated) dataset used in Brav et al. (2008) and covers the period 1995 to 2011. Firm-level data are from COMPUSTAT for the period 1995 – 2011.The sample includes firms targeted by hedge funds and control firms (identified using the Abadie-Imbens matching estimator described in Table 4). “t” is an indicator equal to one for the year in which a firm is targeted by a hedge fund, and zero for every other year before or after the targeting event year. This indicator is also equal to one for the matched control firm. “HF_Target × t” is an indicator equal to one for firms targeted by a hedge fund in the year of the targeting event, and zero for every year before or after the targeting event year. “HF_Target × t” is always equal to zero for the matched-control pairs (firms not targeted by a hedge fund). The other time dummies are defined similarly (see text for further details). We restrict the sample to non-financial firms. Refer to Table 1 for detailed variable definitions. In the table, t-statistics appear in brackets and are based on robust standard errors clustered by firm.
Dep. Var.: TobinQ (1) (2) (3) (4) (5) (6)
t-5 -0.206*** -0.139***
[-5.063] [-3.212]
t-4 -0.259*** -0.169***
[-6.515] [-3.744]
t-3 -0.290*** -0.187***
[-7.341] [-3.907]
t-2 -0.323*** -0.213***
[-7.465] [-4.032]
t-1 -0.397*** -0.283***
[-8.751] [-4.858]
t-4 to t-1 -0.300*** -0.171*** -0.282*** -0.160***
[-8.187] [-4.789] [-6.978] [-3.745]
t -0.295*** -0.193***
[-5.462] [-2.876]
t+1 -0.246*** -0.143**
[-4.254] [-2.089]
t+2 -0.216*** -0.090
[-3.484] [-1.137]
t+3 -0.094 0.025
[-1.359] [0.286]
t to t+3 -0.204*** -0.063 -0.207*** -0.060
[-3.767] [-1.128] [-3.856] [-1.050]
Post t+3 -0.028 0.126 -0.030 0.128
[-0.322] [1.544] [-0.352] [1.571]
t+4 -0.126* 0.007
[-1.659] [0.079]
t+5 -0.090 0.079
[-1.037] [0.821]
Post t+5 -0.034 0.071
[-0.310] [0.593]
HF_Target × t-4 to t-1 -0.043 -0.028
[-0.900] [-0.448]
HF_Target × t -0.177*** -0.162***

40
[-3.012] [-2.840]
HF_Target × t+1 -0.184*** -0.187***
[-2.772] [-2.960]
HF_Target × t+2 -0.088 -0.133*
[-1.197] [-1.743]
HF_Target × t+3 -0.255*** -0.288***
[-3.112] [-3.568]
HF_Target × t to t+3 -0.153*** -0.178*** -0.152*** -0.191***
[-2.726] [-3.221] [-2.727] [-2.713]
HF_Target × Post t+3 -0.170* -0.257*** -0.169* -0.270***
[-1.839] [-2.898] [-1.831] [-2.807]
HF_Target × t+4 -0.200** -0.282***
[-2.216] [-3.157]
HF_Target × t+5 -0.198* -0.276***
[-1.844] [-2.718]
HF_Target × Post t+5 -0.140 -0.232**
[-1.171] [-1.968]
LnSize -0.141*** -0.538*** -0.141*** -0.540*** -0.141*** -0.540*** [-6.963] [-13.313] [-6.943] [-13.306] [-6.930] [-13.318]
Leverage 0.874*** 0.521*** 0.875*** 0.523*** 0.875*** 0.522*** [5.578] [3.916] [5.563] [3.919] [5.565] [3.918]
CAPX 3.677*** 2.689*** 3.713*** 2.719*** 3.715*** 2.719*** [8.831] [7.110] [8.917] [7.198] [8.920] [7.200]
R&D 5.408*** 2.594*** 5.410*** 2.588*** 5.413*** 2.589*** [13.437] [6.058] [13.425] [6.041] [13.435] [6.043]
Intangibility 0.948*** 1.117*** 0.957*** 1.130*** 0.959*** 1.130***
[5.854] [4.844] [5.905] [4.911] [5.914] [4.910]
4-digit SIC Industry-FE Yes No Yes No Yes No
Firm-FE No Yes No Yes No Yes
Year-FE Yes Yes Yes Yes Yes Yes
Obs. 25,634 25,634 25,634 25,634 25,634 25,634
R-2 0.172 0.121 0.170 0.119 0.170 0.119 Note: ***, ** and * indicate statistical significance at the 1%, 5%, and 10% (two-tail) test levels, respectively.

41
Table 6 – Hedge Funds and Firm Value: Hostile Hedge Funds
This table presents the coefficient estimates from OLS regressions. The dependent variable is TobinQ, the industry median-adjusted Tobin’s Q. The hedge fund data is from the (updated) dataset used in Brav et al. (2008) and covers the period 1995 to 2011. Firm-level data are from COMPUSTAT for the period 1995 – 2011. The sample includes firms targeted by hostile hedge funds and control firms (identified using the Abadie-Imbens matching estimator described in Table 4). “t” is an indicator equal to one for the year in which a firm is targeted by a hedge fund, and zero for every other year before or after the targeting event year. This indicator is also equal to one for the matched control firm. “HHF_Target × t” is an indicator equal to one for firms targeted by a hostile hedge fund in the year of the targeting event, and zero for every year before or after the targeting event year. “HHF_Target × t” is always equal to zero for the matched-control pairs (firms not targeted by a hostile hedge fund). The other time dummies are defined similarly (see text for further details). We restrict the sample to non-financial firms. Refer to Table 1 for detailed variable definitions. In the table, t-statistics appear in brackets and are based on robust standard errors clustered by firm.
Dep. Var.: TobinQ (1) (2) (3) (4) (5) (6)
t-5 -0.081 -0.077
[-1.187] [-1.101]
t-4 -0.175** -0.148*
[-2.562] [-1.879]
t-3 -0.287*** -0.231***
[-4.106] [-2.600]
t-2 -0.346*** -0.277***
[-4.830] [-2.744]
t-1 -0.479*** -0.406***
[-5.694] [-3.463]
t-4 to t-1 -0.294*** -0.232*** -0.282*** -0.170**
[-5.030] [-3.872] [-4.165] [-2.292]
t -0.335*** -0.211
[-3.549] [-1.611]
t+1 -0.294*** -0.160
[-2.980] [-1.140]
t+2 -0.212* -0.071
[-1.961] [-0.448]
t+3 -0.180 -0.060
[-1.455] [-0.336]
t to t+3 -0.227** -0.088 -0.227** -0.064
[-2.559] [-0.872] [-2.547] [-0.602]
Post t+3 -0.142 0.081 -0.142 0.105
[-1.118] [0.534] [-1.118] [0.680]
t+4 -0.154 0.014
[-1.111] [0.075]
t+5 -0.111 0.118
[-0.725] [0.574]
Post t+5 -0.265* -0.048
[-1.773] [-0.202]
HHF_Target × t-4 to t-1 -0.026 -0.130 [-0.377] [-1.438]
HHF_Target × t -0.167** -0.274***

42
[-2.378] [-3.524]
HHF_Target × t+1 -0.128 -0.278***
[-1.583] [-3.013]
HHF_Target × t+2 -0.095 -0.285***
[-1.019] [-2.702]
HHF_Target × t+3 -0.100 -0.267**
[-0.870] [-2.081]
HHF_Target × t to t+3 -0.123* -0.277*** -0.126* -0.337***
[-1.769] [-3.311] [-1.725] [-3.063]
HHF_Target × Post t+3 -0.005 -0.202 -0.007 -0.268*
[-0.036] [-1.420] [-0.055] [-1.683]
HHF_Target × t+4 -0.140 -0.356**
[-1.091] [-2.459]
HHF_Target × t+5 -0.192 -0.400**
[-1.247] [-2.412]
HHF_Target × Post t+5 0.166 0.025
[0.879] [0.138]
LnSize -0.072*** -0.338*** -0.072*** -0.337*** -0.072*** -0.340***
[-2.651] [-6.120] [-2.638] [-6.104] [-2.611] [-6.148]
Leverage 0.226 0.159 0.227 0.165 0.228 0.166
[1.338] [0.829] [1.343] [0.862] [1.348] [0.871]
CAPX 3.054*** 1.812*** 3.062*** 1.835*** 3.061*** 1.850***
[6.110] [3.943] [6.090] [3.973] [6.088] [4.008]
R&D 3.329*** 0.963 3.348*** 0.983 3.351*** 0.979
[5.880] [1.359] [5.910] [1.385] [5.916] [1.382]
Intangibility 0.621*** 0.468* 0.633*** 0.487* 0.634*** 0.491*
[3.292] [1.755] [3.347] [1.830] [3.353] [1.852]
4-digit SIC Industry-FE Yes No Yes No Yes No
Firm-FE No Yes No Yes No Yes
Year-FE Yes Yes Yes Yes Yes Yes
Obs. 8,353 8,353 8,353 8,353 8,353 8,353
R-2 0.085 0.089 0.081 0.084 0.081 0.085
Note: ***, ** and * indicate statistical significance at the 1%, 5%, and 10% (two-tail) test levels, respectively.

43
Table 7 – Abnormal Returns from Calendar Time Portfolio Regressions for Firms Targeted by Hedge Funds and Control Firms
This table reports abnormal returns from calendar time portfolio regressions (equal weighted in Panel A and value weighted in Panel B) for firms targeted by hedge funds and their controls. Regression coefficients are estimated using weighted least squares regression and the number of firm-event in a given month as weights. We restrict our analysis to the calendar months with at least 10 target firms. See text for further details on the methodology. ***, ** and * indicate statistical significance at the 1%, 5%, and 10% (two-tail) test levels, respectively.
Panel A: Equal-weighted Four Factor Model
Panel A-1: Target Firms
Window Alpha Beta SMB HML MOM N R-squared
[-36, -1] -0.19 0.93*** 0.86*** 0.29*** -0.24*** 200 85.84%
(-0.99) (17.80) (12.07) (3.86) (-4.37)
[+1, +36] 0.48** 0.87*** 0.90*** 0.25*** -0.21*** 229 83.83%
(2.34) (15.00) (15.73) (2.96) (-3.03)
[+1,+60] 0.37** 0.93*** 0.82*** 0.28*** -0.22*** 233 87.11%
(2.14) (17.30) (15.50) (3.77) (-4.31)
Panel A-2: Control Firms
Window Alpha Beta SMB HML MOM N R-squared
[-36, -1] 0.37** 0.97*** 0.82*** 0.35*** -0.22*** 200 86.38%
(2.14) (19.14) (11.04) (4.91) (-5.03)
[+1, +36] 0.36** 0.93*** 0.86*** 0.37*** -0.24*** 230 88.33%
(2.15) (19.03) (11.97) (4.76) (-5.25)
[+1,+60] 0.34** 0.94*** 0.81*** 0.28*** -0.24*** 233 91.02%
(2.03) (20.04) (11.59) (3.35) (-6.06)
Panel B: Value-weight Four Factor Model
Panel B-1: Target Firms
Window Alpha Beta SMB HML MOM N R-squared
[-36, -1] -0.87*** 0.95*** 0.45*** 0.22*** -0.14*** 200 81.51%
(-5.32) (18.79) (5.49) (2.83) (-3.85)
[+1, +36] -0.05 1.05*** 0.51*** 0.05 -0.05 229 84.81%
(-0.21) (12.80) (7.14) (0.39) (-1.24)
[+1, +60] 0.19 1.19*** 0.36*** -0.26* -0.04 233 91.21%
(0.51) (12.66) (2.83) (-1.79) (-0.97)
Panel B-2: Control Firms
Window Alpha Beta SMB HML MOM N R-squared
[-36, -1] -0.36** 1.03*** 0.46*** 0.03 -0.00 200 85.20%
(-2.18) (19.95) (7.37) (0.42) (-0.09)
[+1, +36] 0.02 0.91*** 0.31*** 0.24*** -0.02 230 85.74%
(0.13) (27.66) (4.87) (4.13) (-0.84)
[+1, +60] 0.05 0.97*** 0.23*** 0.07 -0.00 233 94.92%
(0.39) (36.28) (4.65) (1.13) (-0.03)

44
Table 8 – Abnormal Returns from Calendar Time Portfolio Regressions for Long-Short Stock Portfolios Being Long Target Firms and Short Control Firms
This table reports abnormal returns from calendar time portfolio regressions (equal-weighted and value-weighted using the four factor model) for a portfolio consisting of being long stocks of firms targeted by hedge funds and short stocks of control firms over the period 1995 – 2011. Regression coefficients are estimated using weighted least squares regression and the number of firm-event in a given month as weights. We restrict our analysis to the calendar months with at least 10 target firms. See text for further details on the methodology. ***, ** and * indicate statistical significance at the 1%, 5%, and 10% (two-tail) test levels, respectively.
Panel A: Long Target and Short Control: All Hedge Funds
Panel A-1: Equal-weight Four Factor Model
Window Alpha Beta SMB HML MOM N R-squared
[-36, -1] -0.52*** 0.02 0.06** -0.01 -0.02 202 8.29%
(-6.85) (1.30) (2.47) (-0.38) (-1.49)
[+1, +36] -0.43*** 0.02 0.04 -0.08 -0.03 234 8.73%
(-3.99) (0.66) (1.01) (-0.90) (-1.04)
[+1,+60] -0.19** 0.04* 0.00 -0.05 -0.03* 236 14.17%
(-2.45) (1.88) (0.00) (-1.24) (-1.71)
Panel A-2: Value-weight Four Factor Model
Window Alpha Beta SMB HML MOM N R-squared
[-36, -1] -0.23* 0.05 0.15*** 0.10* -0.06** 202 31.27%
(-1.66) (1.51) (3.01) (1.78) (-2.26)
[+1, +36] -0.11 -0.03 -0.25*** -0.20*** -0.06** 234 75.26%
(-0.75) (-0.44) (-4.37) (-4.24) (-2.52)
[+1,+60] -0.40*** -0.08** -0.16** -0.03 0.28*** 236 72.97%
(-2.96) (-2.02) (-2.44) (-0.49) (2.90)

45
Table 9 – The Limited Commitment Channel in Innovative Firms
This table presents the coefficient estimates from OLS regressions. The dependent variable is TobinQ, the industry median-adjusted Tobin’s Q. The hedge fund data is from the (updated) dataset used in Brav et al. (2008) and covers the period 1995 to 2011. Firm-level data are from COMPUSTAT for the period 1995 – 2011. The sample includes firms targeted by hostile hedge funds and control firms (identified using the Abadie-Imbens matching estimator described in Table 4). “LimitedCommitment” is an indicator for firms facing limited commitment problems. We use three limited commitment proxies, “High R&D,” “High Intangibility,” and “High Patent Citation”. The patent citation count data is from the NBER U.S. Patent Citations data file. “HHF_Target” is an indicator equal to 1 for firms targeted by a hostile hedge fund. “(t to t+3)” is an indicator for the years t (the year in which a firms is targeted by a hostile hedge fund) to t+3. “(t-4 to t-1)” is an indicator for the years from four years prior to one year prior the firm is targeted by a hostile hedge fund. We restrict the sample to non-financial firms. Refer to Table 1 for detailed variable definitions. In the table, t-statistics appear in brackets and are based on robust standard errors clustered by firm.
Limited Commitment Proxy:
High R&D
(1)
High Intangibility
(2)
High Patent Citation
(3) LimitedCommitment × HHF_Target × (t to t+3) -0.818** -0.434* -0.841** [-2.153] [-1.816] [-2.312] LimitedCommitment × HHF_Target × (t-4 to t-1) -0.387 -0.019 -0.125
[-1.187] [-0.090] [-0.360] LimitedCommitment × (t-4 to t-1) -0.247 -0.422*** -0.270
[-1.055] [-2.753] [-1.081] LimitedCommitment × (t to t+3) -0.054 -0.242 0.420
[-0.211] [-1.491] [1.570] HHF_Target × (t to t+3) -0.144* -0.151* -0.205**
[-1.776] [-1.742] [-2.294] (t to t+3) -0.081 -0.036 -0.096
[-1.340] [-0.579] [-1.594] HHF_Target × (t-4 to t-1) 0.000 -0.057 -0.052
[0.002] [-0.726] [-0.649] (t-4 to t-1) -0.163*** -0.090 -0.174*** [-2.910] [-1.580] [-3.047] LnSize -0.334*** -0.340*** -0.332***
[-6.240] [-6.356] [-6.158] Leverage 0.196 0.173 0.167
[1.037] [0.916] [0.872] CAPX 1.836*** 1.950*** 1.789***
[3.967] [4.254] [3.881] R&D 0.924 0.985 1.012
[1.300] [1.371] [1.425] Intangibility 0.489* 0.570** 0.476*
[1.846] [2.230] [1.787] Firm-FE Yes Yes Yes Year-FE Yes Yes Yes Obs. 8,353 8,353 8,353 R-2 0.092 0.093 0.087 Note: ***, ** and * indicate statistical significance at the 1%, 5%, and 10% (two-tail) test levels, respectively.

46
Table 10 – The Limited Commitment Channel in Firms with Important Stakeholders
This table presents the coefficient estimates from OLS regressions. The dependent variable is TobinQ, the industry median-adjusted Tobin’s Q. The hedge fund data is from the (updated) dataset used in Brav et al. (2008) and covers the period 1995 to 2011. Firm-level data are from COMPUSTAT for the period 1995. The sample includes firms targeted by hostile hedge funds and control firms (identified using the Abadie-Imbens matching estimator described in Table 4). StakeholderProxy is an indicator for firms with important stakeholders. We use three proxies for important stakeholders: “High Contract Specificity,” “High Labor Productivity,” and “High Unsecured Borrowing”. “HHF_Target” is an indicator equal to 1 for firms targeted by a hostile hedge fund. “(t to t+3)” is an indicator for the years t (the year in which a firms is targeted by a hostile hedge fund) to t+3. “(t-4 to t-1)” is an indicator for the years from four years prior to one year prior the firm is targeted by a hostile hedge fund. We restrict the sample to non-financial firms. Refer to Table 1 for detailed variable definitions. In the table, t-statistics appear in brackets and are based on robust standard errors clustered by firm.
Important Stakeholder Proxy:
High Contract Specificity
(1)
High Labor Productivity
(2)
High Unsecured Borrowing
(3) StakeholderProxy × HHF Target × (t to t+3) -0.652* -0.422** -0.441** [-1.718] [-2.156] [-1.973]StakeholderProxy × HHF Target × (t-4 to t-1) -0.693** -0.294* -0.144
[-2.164] [-1.784] [-0.755]StakeholderProxy × (t-4 to t-1) 0.327 0.160 0.031
[1.236] [1.468] [0.276]StakeholderProxy × (t to t+3) 0.253 0.353*** 0.261**
[0.776] [2.796] [2.123]HHF Target × (t to t+3) -0.010 -0.149 -0.176*
[-0.035] [-1.414] [-1.824](t to t+3) -0.082 -0.167** -0.132*
[-0.297] [-2.276] [-1.922]HHF Target × (t-4 to t-1) 0.367 0.007 -0.045
[1.469] [0.067] [-0.500](t-4 to t-1) -0.429* -0.231*** -0.193*** [-1.838] [-3.248] [-2.954]LnSize -0.142 -0.335*** -0.332***
[-1.089] [-6.137] [-6.207]Leverage -0.097 0.041 0.167
[-0.216] [0.227] [0.885]CAPX 1.298 1.767*** 1.839***
[0.835] [3.825] [3.974]R&D 2.011 0.754 0.994
[1.182] [1.158] [1.404]Intangibility 1.165** 0.486* 0.469*
[2.200] [1.816] [1.764]Firm-FE Yes Yes YesYear-FE Yes Yes YesObs. 2,055 8,004 8,353R-2 0.101 0.086 0.085Note: ***, ** and * indicate statistical significance at the 1%, 5%, and 10% (two-tail) test levels, respectively.

47
Figure 1 – Industry Median-Adjusted Tobin’s Q for Hedge Funds Targets and their Matched-Control Firms in the Period from 5 Years before the Targeting Event to 5 Years After
This figure reports industry median-adjusted Tobin’s Q for firms targeted by hedge funds (Panel A), firms targeted by hostile hedge funds (Panel B), and their matched control firms (identified using the Abadie-Imbens matching estimator described in Table 4) in the period from t-5 to t+5 (where t is the targeting year). The hedge fund data is from the (updated) dataset used in Brav. et al. (2008) and covers the period 1995 to 2011. Firm-level data are from COMPUSTAT for the period 1995. Refer to Table 1 for detailed variable definitions.
0.000
0.050
0.100
0.150
0.200
0.250
0.300
0.350
0.400
0.450
0.500
t-5 t-4 t-3 t-2 t-1 t t+1 t+2 t+3 t+4 t+5
Panel A: Tobin's Q around the start of activist hedge fund campaigns (sample of all hedge funds campaigns)
Target Control
-0.300
-0.200
-0.100
0.000
0.100
0.200
0.300
0.400
0.500
0.600
t-5 t-4 t-3 t-2 t-1 t t+1 t+2 t+3 t+4 t+5
Panel B: Tobin's Q around the start of hostile activist hedge fund campaigns (sample of hostile hedge fund campaigns only)
Target Control

48
APPENDIX TO
HEDGE FUNDS AND LONG-TERM FIRM VALUE

49
Table A.1 – Hedge Funds and Firm Value for All Hedge Funds (Alternative Matched Sample 1: NNMATCH using different matching variables)
This table presents the coefficient estimates from OLS regressions. The dependent variable is TobinQ, the industry median-adjusted Tobin’s Q. The hedge fund data is from the (updated) dataset used in Brav et al. (2008) and covers the period 1995 to 2011. Firm-level data are from COMPUSTAT for the period 1995 – 2011. The sample includes firms targeted by hedge funds and control firms (identified using the Abadie-Imbens matching estimator with the following matching variables Tobin’s Q (lag 1 to 5), log of market value (lag 1), and exact matching on fiscal year and 2 digit SIC code. “t” is an indicator equal to one for the year in which a firm is targeted by a hedge fund, and zero for every other year before or after the targeting event year. This indicator is also equal to one for the matched control firm. “HF_Target × t” is an indicator equal to one for firms targeted by a hedge fund in the year of the targeting event, and zero for every year before or after the targeting event year. “HF_Target × t” is always equal to zero for the matched-control pairs (firms not targeted by a hedge fund). The other time dummies are defined similarly (see text for further details). We restrict the sample to non-financial firms. Refer to Table 1 for detailed variable definitions. In the table, t-statistics appear in brackets and are based on robust standard errors clustered by firm.
Dep. Var.: TobinQ (1) (2) (3) (4) (5) (6)
t-5 -0.148*** -0.084**
[-4.179] [-2.418]
t-4 -0.186*** -0.106***
[-5.120] [-2.667]
t-3 -0.268*** -0.163***
[-7.758] [-4.009]
t-2 -0.296*** -0.193***
[-7.828] [-4.217]
t-1 -0.343*** -0.234***
[-8.589] [-4.734]
t-4 to t-1 -0.279*** -0 174***
-0.272*** -0.146***
[-8.405] [-5.534] [-7.348] [-3.801]
t -0.254*** -0.124**
[-5.988] [-2.265]
t+1 -0.159*** -0.023
[-3.353] [-0.369]
t+2 -0.143*** -0.005
[-2.709] [-0.082]
t+3 -0.043 0.084
[-0.706] [1.126]
t to t+3 -0.161*** -0.020 -0.162*** -0.013
[-3.578] [-0.413] [-3.633] [-0.268]
Post t+3 -0.080 0.152** -0.081 0.158**
[-1.048] [2.043] [-1.058] [2.128]
t+4 -0.070 0.082
[-1.048] [1.032]
t+5 -0.043 0.149
[-0.548] [1.630]
Post t+5 -0.132 0.162
[-1.479] [1.516]
HF_Target × t-4 to t-1 -0.016 -0.068

50
[-0.364] [-1.162]
HF_Target × t -0.145*** -0.175***
[-2.746] [-3.422]
HF_Target × t+1 -0.196*** -0.247***
[-3.187] [-3.986]
HF_Target × t+2 -0.100 -0.164**
[-1.460] [-2.322]
HF_Target × t+3 -0.237*** -0.289***
[-3.184] [-3.641]
HF_Target × t to t+3 -0.146*** -0 215***
-0.146*** -0.245***
[-2.826] [-4.020] [-2.839] [-3.647]
HF_Target × Post t+3 -0.089 -0 269***
-0.089 -0.302***
[-1.112] [-3.334] [-1.110] [-3.397]
HF_Target × t+4 -0.183** -0.277***
[-2.320] [-3.437]
HF_Target × t+5 -0.185* -0.271***
[-1.889] [-2.786]
HF_Target × Post t+5 -0.007 -0.239**
[-0.069] [-2.299]
LnSize -0.118*** -0.448*** -0.118*** -***
-0.118*** -0.449*** [-6.489] [-12.836] [-6.477] [-12.910] [-6.473] [-12.924]
Leverage 0.746*** 0.388*** 0.747*** 0.390*** 0.748*** 0.390*** [5.376] [3.184] [5.375] [3.207] [5.380] [3.201]
CAPX 4.131*** 3.009*** 4.147*** 3.037*** 4.148*** 3.039*** [11.819] [9.267] [11.873] [9.344] [11.875] [9.354]
R&D 4.894*** 2.606*** 4.897*** 2.606*** 4.899*** 2.608*** [13.342] [6.700] [13.356] [6.704] [13.358] [6.715]
Intangibility 1.058*** 1.188*** 1.069*** 1.198*** 1.070*** 1.199***
[8.014] [5.549] [8.101] [5.601] [8.110] [5.600]
4-digit SIC Industry-FE Yes No Yes No Yes No
Firm-FE No Yes No Yes No Yes
Year-FE Yes Yes Yes Yes Yes Yes
Obs. 25,350 25,350 25,350 25,350 25,350 25,350
R-2 0.164 0.110 0.162 0.109 0.162 0.109 Note: ***, ** and * indicate statistical significance at the 1%, 5%, and 10% (two-tail) test levels, respectively.
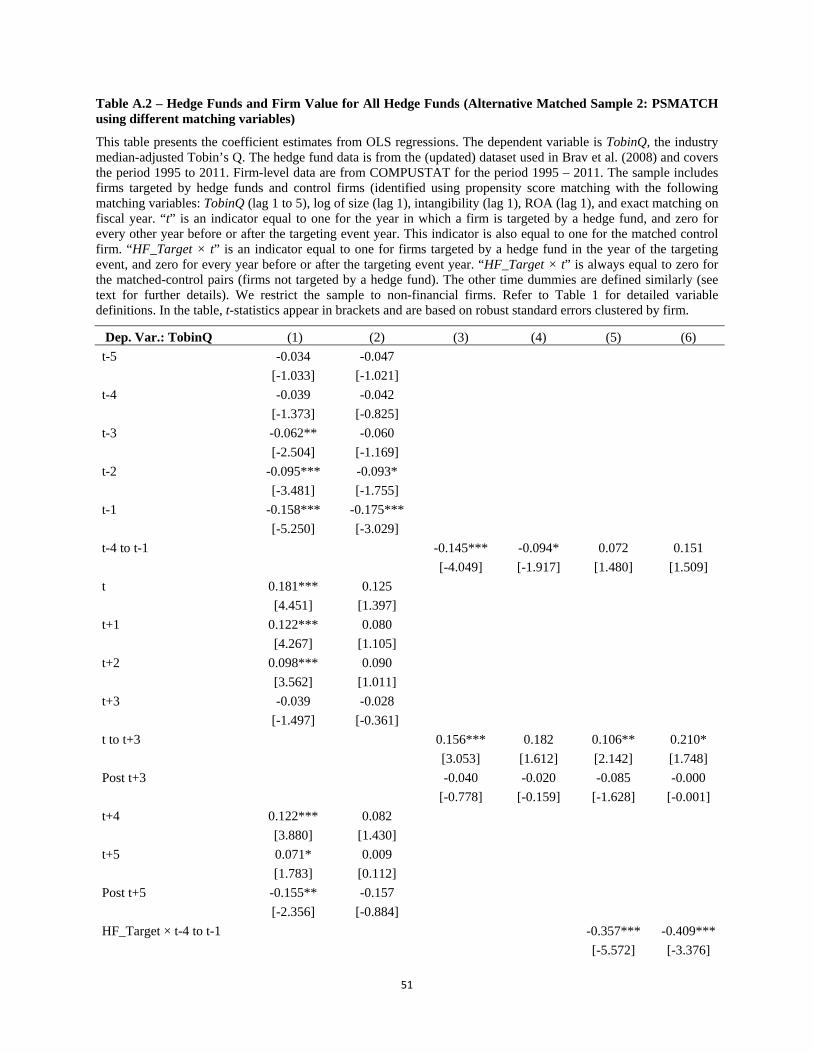
51
Table A.2 – Hedge Funds and Firm Value for All Hedge Funds (Alternative Matched Sample 2: PSMATCH using different matching variables)
This table presents the coefficient estimates from OLS regressions. The dependent variable is TobinQ, the industry median-adjusted Tobin’s Q. The hedge fund data is from the (updated) dataset used in Brav et al. (2008) and covers the period 1995 to 2011. Firm-level data are from COMPUSTAT for the period 1995 – 2011. The sample includes firms targeted by hedge funds and control firms (identified using propensity score matching with the following matching variables: TobinQ (lag 1 to 5), log of size (lag 1), intangibility (lag 1), ROA (lag 1), and exact matching on fiscal year. “t” is an indicator equal to one for the year in which a firm is targeted by a hedge fund, and zero for every other year before or after the targeting event year. This indicator is also equal to one for the matched control firm. “HF_Target × t” is an indicator equal to one for firms targeted by a hedge fund in the year of the targeting event, and zero for every year before or after the targeting event year. “HF_Target × t” is always equal to zero for the matched-control pairs (firms not targeted by a hedge fund). The other time dummies are defined similarly (see text for further details). We restrict the sample to non-financial firms. Refer to Table 1 for detailed variable definitions. In the table, t-statistics appear in brackets and are based on robust standard errors clustered by firm.
Dep. Var.: TobinQ (1) (2) (3) (4) (5) (6)
t-5 -0.034 -0.047
[-1.033] [-1.021]
t-4 -0.039 -0.042
[-1.373] [-0.825]
t-3 -0.062** -0.060
[-2.504] [-1.169]
t-2 -0.095*** -0.093*
[-3.481] [-1.755]
t-1 -0.158*** -0.175***
[-5.250] [-3.029]
t-4 to t-1 -0.145*** -0.094* 0.072 0.151
[-4.049] [-1.917] [1.480] [1.509]
t 0.181*** 0.125
[4.451] [1.397]
t+1 0.122*** 0.080
[4.267] [1.105]
t+2 0.098*** 0.090
[3.562] [1.011]
t+3 -0.039 -0.028
[-1.497] [-0.361]
t to t+3 0.156*** 0.182 0.106** 0.210*
[3.053] [1.612] [2.142] [1.748]
Post t+3 -0.040 -0.020 -0.085 -0.000
[-0.778] [-0.159] [-1.628] [-0.001]
t+4 0.122*** 0.082
[3.880] [1.430]
t+5 0.071* 0.009
[1.783] [0.112]
Post t+5 -0.155** -0.157
[-2.356] [-0.884]
HF_Target × t-4 to t-1 -0.357*** -0.409***
[-5.572] [-3.376]

52
HF_Target × t -0.505*** -0.441***
[-7.482] [-4.365]
HF_Target × t+1 -0.404*** -0.370***
[-6.175] [-3.985]
HF_Target × t+2 -0.270*** -0.293**
[-3.930] [-2.468]
HF_Target × t+3 -0.151** -0.200*
[-2.192] [-1.893]
HF_Target × t to t+3 -0.432*** -0.423*** -0.435*** -0.563***
[-6.190] [-3.483] [-6.217] [-3.820]
HF_Target × Post t+3 -0.093 -0.123 -0.101 -0.277
[-1.018] [-0.760] [-1.106] [-1.527]
HF_Target × t+4 -0.282*** -0.310***
[-3.534] [-2.717]
HF_Target × t+5 -0.208** -0.178
[-2.211] [-1.436]
HF_Target × Post t+5 0.086 0.006
[0.806] [0.027]
LnSize -0.126*** -0.452*** -0.126*** -0.449*** -0.129*** -0.450*** [-5.513] [-7.783] [-5.504] [-7.731] [-5.617] [-7.908]
Leverage 0.937*** 0.434* 0.936*** 0.428* 0.935*** 0.439* [4.538] [1.724] [4.546] [1.713] [4.584] [1.769]
CAPX 3.641*** 2.384*** 3.638*** 2.386*** 3.634*** 2.360*** [9.706] [4.987] [9.682] [4.914] [9.670] [4.968]
R&D 5.220*** 2.621*** 5.218*** 2.625*** 5.241*** 2.620*** [9.704] [4.173] [9.709] [4.159] [9.820] [4.134]
Intangibility 0.951*** 0.818** 0.952*** 0.809** 0.989*** 0.779**
[5.911] [2.570] [5.907] [2.565] [6.082] [2.534]
4-digit SIC Industry-FE Yes No Yes No Yes No
Firm-FE No Yes No Yes No Yes
Year-FE Yes Yes Yes Yes Yes Yes
Obs. 21,029 21,029 21,029 21,029 21,029 21,029
R-2 0.176 0.104 0.176 0.103 0.179 0.108 Note: ***, ** and * indicate statistical significance at the 1%, 5%, and 10% (two-tail) test levels, respectively.

53
Table A.3 – Hedge Funds and Firm Value for All Hedge Funds (Alternative Matching Sample 3: PSMATCH using different matching variables)
This table presents the coefficient estimates from OLS regressions. The dependent variable is TobinQ, the industry median-adjusted Tobin’s Q. The hedge fund data is from the (updated) dataset used in Brav et al. (2008) and covers the period 1995 to 2011. Firm-level data are from COMPUSTAT for the period 1995 – 2011. The sample includes firms targeted by hedge funds and control firms (identified using propensity score matching with the following matching variables: TobinQ (lag 1 to 5), log of size (lag 1), R&D (lag 1), ROA (lag 1), and exact matching on fiscal year. “t” is an indicator equal to one for the year in which a firm is targeted by a hedge fund, and zero for every other year before or after the targeting event year. This indicator is also equal to one for the matched control firm. “HF_Target × t” is an indicator equal to one for firms targeted by a hedge fund in the year of the targeting event, and zero for every year before or after the targeting event year. “HF_Target × t” is always equal to zero for the matched-control pairs (firms not targeted by a hedge fund). The other time dummies are defined similarly (see text for further details). We restrict the sample to non-financial firms. Refer to Table 1 for detailed variable definitions. In the table, t-statistics appear in brackets and are based on robust standard errors clustered by firm.
Dep. Var.: TobinQ (1) (2) (3) (4) (5) (6)
t-5 -0.064 -0.039
[-1.405] [-0.906]
t-4 -0.109** -0.075
[-2.399] [-1.638]
t-3 -0.137*** -0.098**
[-2.967] [-2.065]
t-2 -0.151*** -0.127**
[-2.924] [-2.145]
t-1 -0.204*** -0.193***
[-3.667] [-3.003]
t-4 to t-1 -0.155*** -0.128*** 0.008 -0.001
[-3.557] [-3.064] [0.147] [-0.011]
t 0.054 -0.033
[0.730] [-0.392]
t+1 0.096 -0.020
[1.238] [-0.218]
t+2 0.043 -0.064
[0.549] [-0.610]
t+3 0.087 -0.022
[0.994] [-0.183]
t to t+3 0.083 -0.023 0.068 0.025
[1.181] [-0.290] [0.973] [0.305]
Post t+3 0.022 -0.127 0.002 -0.080
[0.247] [-1.132] [0.022] [-0.703]
t+4 0.059 -0.047
[0.618] [-0.370]
t+5 0.010 -0.142
[0.095] [-1.030]
Post t+5 0.011 -0.182
[0.108] [-1.104]
HF_Target × t-4 to t-1 -0.307*** -0.239***
[-5.049] [-3.408]

54
HF_Target × t -0.443*** -0.298***
[-5.709] [-4.143]
HF_Target × t+1 -0.439*** -0.300***
[-5.111] [-3.637]
HF_Target × t+2 -0.277*** -0.164*
[-3.216] [-1.832]
HF_Target × t+3 -0.360*** -0.260***
[-4.035] [-2.715]
HF_Target × t to t+3 -0.407*** -0.272*** -0.407*** -0.379***
[-5.633] [-3.696] [-5.635] [-4.260]
HF_Target × Post t+3 -0.204** -0.104 -0.194** -0.216*
[-2.247] [-0.965] [-2.146] [-1.862]
HF_Target × t+4 -0.301*** -0.234**
[-3.060] [-2.327]
HF_Target × t+5 -0.230* -0.077
[-1.949] [-0.662]
HF_Target × Post t+5 -0.153 -0.043
[-1.421] [-0.322]
LnSize -0.150*** -0.612*** -0.151*** -0.611*** -0.152*** -0.613*** [-6.935] [-11.433] [-6.951] [-11.460] [-7.023] [-11.506]
Leverage 1.189*** 0.957*** 1.191*** 0.961*** 1.194*** 0.958*** [6.589] [5.499] [6.609] [5.511] [6.635] [5.512]
CAPX 4.098*** 3.281*** 4.094*** 3.270*** 4.082*** 3.246*** [9.443] [8.624] [9.461] [8.613] [9.467] [8.558]
R&D 5.762*** 2.787*** 5.763*** 2.788*** 5.778*** 2.784*** [11.980] [5.578] [11.985] [5.585] [12.007] [5.579]
Intangibility 1.169*** 1.583*** 1.171*** 1.583*** 1.178*** 1.569***
[6.623] [5.810] [6.648] [5.820] [6.711] [5.801]
4-digit SIC Industry-FE Yes No Yes No Yes No
Firm-FE No Yes No Yes No Yes
Year-FE Yes Yes Yes Yes Yes Yes
Obs. 25,818 25,818 25,818 25,818 25,818 25,818
R-2 0.173 0.129 0.172 0.129 0.174 0.130 Note: ***, ** and * indicate statistical significance at the 1%, 5%, and 10% (two-tail) test levels, respectively.

55
Table A.4 – Hedge Funds and Firm Value for Hostile Hedge Funds (Alternative Matched Sample 1: NNMATCH using different matching variables)
This table presents the coefficient estimates from OLS regressions. The dependent variable is TobinQ, the industry median-adjusted Tobin’s Q. The hedge fund data is from the (updated) dataset used in Brav et al. (2008) and covers the period 1995 to 2011. Firm-level data are from COMPUSTAT for the period 1995 – 2011. The sample includes firms targeted by hedge funds and control firms (identified using the Abadie-Imbens matching estimator with the following matching variables Tobin’s Q (lag 1 to 5), log of market value (lag 1), and exact matching on fiscal year and 2 digit SIC code. “t” is an indicator equal to one for the year in which a firm is targeted by a hostile hedge fund, and zero for every other year before or after the targeting event year. This indicator is also equal to one for the matched control firm. “HHF_Target × t” is an indicator equal to one for firms targeted by a hostile hedge fund in the year of the targeting event, and zero for every year before or after the targeting event year. “HHF_Target × t” is always equal to zero for the matched-control pairs (firms not targeted by a hostile hedge fund). The other time dummies are defined similarly (see text for further details). We restrict the sample to non-financial firms. Refer to Table 1 for detailed variable definitions. In the table, t-statistics appear in brackets and are based on robust standard errors clustered by firm.
Dep. Var.: TobinQ (1) (2) (3) (4) (5) (6)
t-5 -0.172** -0.109
[-2.428] [-1.545]
t-4 -0.199*** -0.109
[-2.818] [-1.394]
t-3 -0.335*** -0.203**
[-4.731] [-2.396]
t-2 -0.378*** -0.227**
[-5.035] [-2.320]
t-1 -0.454*** -0.282**
[-5.472] [-2.574]
t-4 to t-1 -0.308*** -0.199*** -0.319*** -0.139**
[-5.279] [-3.711] [-4.805] [-2.053]
t -0.328*** -0.078
[-3.745] [-0.636]
t+1 -0.270*** 0.000
[-2.714] [0.001]
t+2 -0.234** 0.050
[-2.256] [0.345]
t+3 -0.132 0.190
[-1.124] [1.192]
t to t+3 -0.225*** 0.006 -0.225*** 0.027
[-2.774] [0.064] [-2.771] [0.302]
Post t+3 0.009 0.384*** 0.009 0.407***
[0.066] [2.830] [0.060] [2.970]
t+4 -0.135 0.205
[-0.988] [1.174]
t+5 0.050 0.481**
[0.308] [2.374]
Post t+5 0.007 0.547**
[0.034] [2.289]
HHF_Target × t-4 to t-1 0.021 -0.126

56
[0.312] [-1.437]
HHF_Target × t -0.154** -0.296***
[-2.276] [-3.943]
HHF_Target × t+1 -0.121 -0.309***
[-1.487] [-3.323]
HHF_Target × t+2 -0.056 -0.269***
[-0.643] [-2.794]
HHF_Target × t+3 -0.138 -0.372***
[-1.252] [-3.212]
HHF_Target × t to t+3 -0.106* -0.305*** -0.104 -0.363***
[-1.658] [-4.016] [-1.571] [-3.693]
HHF_Target × Post t+3 -0.157 -0.420*** -0.155 -0.484***
[-1.040] [-2.986] [-1.023] [-3.202]
HHF_Target × t+4 -0.151 -0.378***
[-1.243] [-2.952]
HHF_Target × t+5 -0.356** -0.612***
[-2.125] [-3.490]
HHF_Target × Post t+5 -0.100 -0.352*
[-0.447] [-1.735]
LnSize -0.060** -0.360*** -0.059** -0.360*** -0.059** -0.363*** [-2.250] [-6.812] [-2.228] [-6.772] [-2.230] [-6.875]
Leverage 0.141 0.043 0.140 0.044 0.139 0.041 [0.957] [0.251] [0.953] [0.255] [0.951] [0.240]
CAPX 2.943*** 1.856*** 2.948*** 1.902*** 2.948*** 1.911*** [6.459] [3.991] [6.455] [4.055] [6.455] [4.088]
R&D 3.524*** 1.068 3.542*** 1.113 3.539*** 1.117 [5.757] [1.400] [5.814] [1.457] [5.797] [1.469]
Intangibility 0.863*** 0.750** 0.861*** 0.763** 0.860*** 0.766**
[4.739] [2.412] [4.728] [2.458] [4.718] [2.476]
4-digit SIC Industry-FE Yes No Yes No Yes No
Firm-FE No Yes No Yes No Yes
Year-FE Yes Yes Yes Yes Yes Yes
Obs. 8,253 8,253 8,253 8,253 8,253 8,253
R-2 0.094 0.100 0.090 0.094 0.090 0.095 Note: ***, ** and * indicate statistical significance at the 1%, 5%, and 10% (two-tail) test levels, respectively.

57
Table A.5 – Hedge Funds and Firm Value for Hostile Hedge Funds (Alternative Matched Sample 2: PSMATCH using different matching variables)
This table presents the coefficient estimates from OLS regressions. The dependent variable is TobinQ, the industry median-adjusted Tobin’s Q. The hedge fund data is from the (updated) dataset used in Brav et al. (2008) and covers the period 1995 to 2011. Firm-level data are from COMPUSTAT for the period 1995 – 2011. The sample includes firms targeted by hedge funds and control firms (identified using propensity score matching with the following matching variables: TobinQ (lag 1 to 5), log of size (lag 1), intangibility (lag 1), ROA (lag 1), and exact matching on fiscal year. “t” is an indicator equal to one for the year in which a firm is targeted by a hostile hedge fund, and zero for every other year before or after the targeting event year. This indicator is also equal to one for the matched control firm. “HHF_Target × t” is an indicator equal to one for firms targeted by a hostile hedge fund in the year of the targeting event, and zero for every year before or after the targeting event year. “HHF_Target × t” is always equal to zero for the matched-control pairs (firms not targeted by a hostile hedge fund). The other time dummies are defined similarly (see text for further details). We restrict the sample to non-financial firms. Refer to Table 1 for detailed variable definitions. In the table, t-statistics appear in brackets and are based on robust standard errors clustered by firm.
Dep. Var.: TobinQ (1) (2) (3) (4) (5) (6)
t-5 -0.024 -0.033
[-0.435] [-0.571]
t-4 -0.054 -0.058
[-1.077] [-1.024]
t-3 -0.133*** -0.103**
[-2.902] [-2.086]
t-2 -0.164*** -0.131
[-3.281] [-1.410]
t-1 -0.258*** -0.213**
[-4.702] [-2.512]
t-4 to t-1 -0.284*** -0.194*** -0.143** -0.064
[-4.212] [-3.165] [-2.115] [-0.554]
t 0.098* 0.093
[1.820] [1.010]
t+1 -0.027 -0.038
[-0.543] [-0.318]
t+2 0.138*** 0.115
[2.911] [0.825]
t+3 0.057 0.040
[1.256] [0.342]
t to t+3 0.063 0.126 0.017 0.114
[0.848] [0.784] [0.229] [0.713]
Post t+3 -0.045 0.065 -0.065 0.069
[-0.408] [0.385] [-0.602] [0.402]
t+4 0.013 -0.015
[0.327] [-0.173]
t+5 -0.058 -0.112
[-1.029] [-0.761]
Post t+5 -0.085 0.074
[-0.559] [0.475]
HF_Target × t-4 to t-1 -0.246** -0.224

58
[-2.557] [-1.497]
HF_Target × t -0.505*** -0.421***
[-5.013] [-4.280]
HF_Target × t+1 -0.298*** -0.220*
[-2.793] [-1.768]
HF_Target × t+2 -0.351*** -0.271*
[-3.127] [-1.923]
HF_Target × t+3 -0.224* -0.147
[-1.877] [-1.166]
HF_Target × t to t+3 -0.444*** -0.400** -0.463*** -0.460**
[-4.193] [-2.319] [-4.148] [-2.234]
HF_Target × Post t+3 -0.101 -0.036 -0.161 -0.136
[-0.519] [-0.190] [-0.777] [-0.599]
HF_Target × t+4 -0.192 -0.086
[-1.547] [-0.657]
HF_Target × t+5 -0.097 0.089
[-0.667] [0.559]
HF_Target × Post t+5 0.155 0.200
[0.562] [1.021]
LnSize -0.107** -0.265*** -0.109** -0.263*** -0.115*** -0.266*** [-2.485] [-3.523] [-2.533] [-3.505] [-2.613] [-3.554]
Leverage 0.579 -0.220 0.584 -0.213 0.579 -0.204 [1.488] [-0.788] [1.523] [-0.749] [1.532] [-0.720]
CAPX 1.770*** 0.732 1.766*** 0.788 1.789*** 0.839 [3.523] [0.828] [3.533] [0.935] [3.651] [1.061]
R&D 3.038*** 0.627 3.015*** 0.677 3.052*** 0.678 [3.084] [0.646] [3.087] [0.685] [3.159] [0.690]
Intangibility 0.254 -0.195 0.265 -0.193 0.287 -0.190
[0.953] [-0.424] [1.004] [-0.422] [1.090] [-0.418]
4-digit SIC Industry-FE Yes No Yes No Yes No
Firm-FE No Yes No Yes No Yes
Year-FE Yes Yes Yes Yes Yes Yes
Obs. 6,176 6,176 6,176 6,176 6,176 6,176
R-2 0.090 0.081 0.090 0.079 0.092 0.081 Note: ***, ** and * indicate statistical significance at the 1%, 5%, and 10% (two-tail) test levels, respectively.

59
Table A.6 – Hedge Funds and Firm Value for Hostile Hedge Funds (Alternative Matching Sample 3: PSMATCH using different matching variables)
This table presents the coefficient estimates from OLS regressions. The dependent variable is TobinQ, the industry median-adjusted Tobin’s Q. The hedge fund data is from the (updated) dataset used in Brav et al. (2008) and covers the period 1995 to 2011. Firm-level data are from COMPUSTAT for the period 1995 – 2011. The sample includes firms targeted by hedge funds and control firms (identified using propensity score matching with the following matching variables: TobinQ (lag 1 to 5), log of size (lag 1), R&D (lag 1), ROA (lag 1), and exact matching on fiscal year. “t” is an indicator equal to one for the year in which a firm is targeted by a hostile hedge fund, and zero for every other year before or after the targeting event year. This indicator is also equal to one for the matched control firm. “HHF_Target × t” is an indicator equal to one for firms targeted by a hostile hedge fund in the year of the targeting event, and zero for every year before or after the targeting event year. “HHF_Target × t” is always equal to zero for the matched-control pairs (firms not targeted by a hostile hedge fund). The other time dummies are defined similarly (see text for further details). We restrict the sample to non-financial firms. Refer to Table 1 for detailed variable definitions. In the table, t-statistics appear in brackets and are based on robust standard errors clustered by firm.
Dep. Var.: TobinQ (1) (2) (3) (4) (5) (6)
t-5 0.009 -0.009
[0.117] [-0.132]
t-4 -0.028 -0.023
[-0.366] [-0.334]
t-3 -0.109 -0.056
[-1.462] [-0.790]
t-2 -0.186** -0.117
[-2.477] [-1.508]
t-1 -0.283*** -0.195**
[-3.485] [-2.221]
t-4 to t-1 -0.153** -0.130** -0.059 -0.010
[-2.481] [-2.246] [-0.687] [-0.128]
t -0.042 0.060
[-0.421] [0.540]
t+1 0.017 0.068
[0.138] [0.549]
t+2 -0.058 -0.003
[-0.450] [-0.026]
t+3 -0.092 0.018
[-0.656] [0.130]
t to t+3 -0.036 -0.008 -0.037 0.035
[-0.345] [-0.082] [-0.357] [0.329]
Post t+3 0.059 0.158 0.050 0.198
[0.321] [1.110] [0.273] [1.362]
t+4 0.050 0.192
[0.344] [1.283]
t+5 -0.100 0.039
[-0.601] [0.233]
Post t+5 0.109 0.342*
[0.450] [1.801]
HF_Target × t-4 to t-1 -0.171* -0.210**
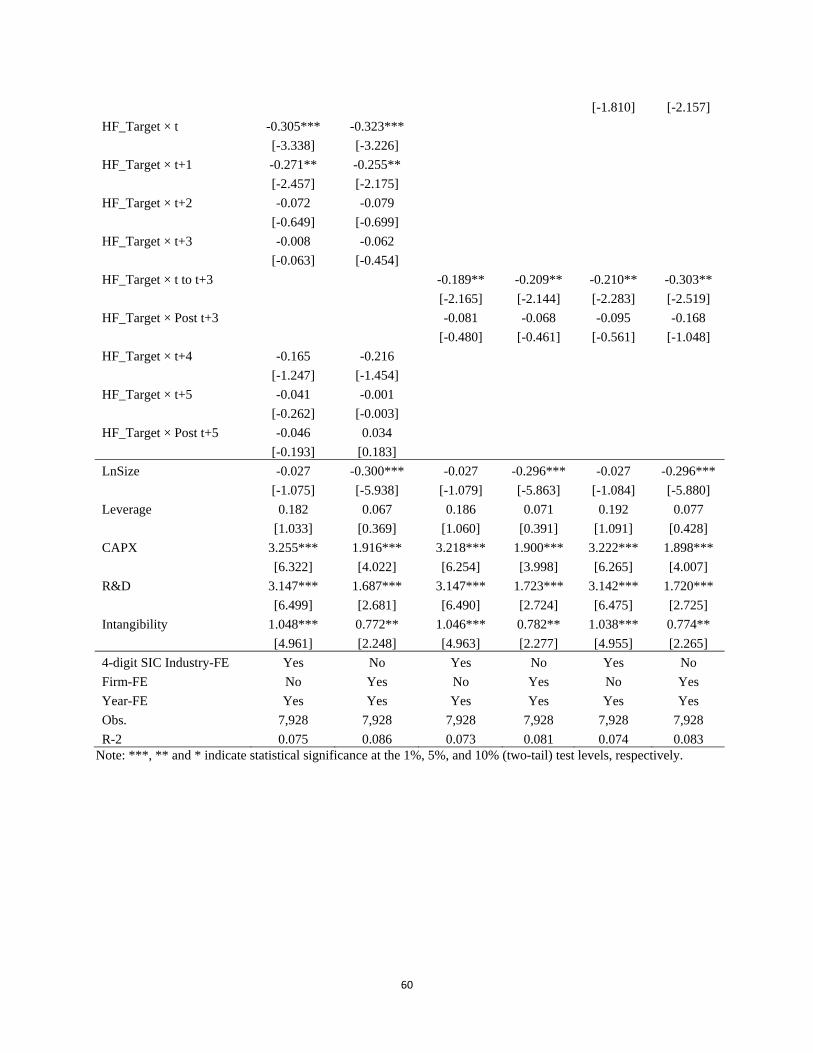
60
[-1.810] [-2.157]
HF_Target × t -0.305*** -0.323***
[-3.338] [-3.226]
HF_Target × t+1 -0.271** -0.255**
[-2.457] [-2.175]
HF_Target × t+2 -0.072 -0.079
[-0.649] [-0.699]
HF_Target × t+3 -0.008 -0.062
[-0.063] [-0.454]
HF_Target × t to t+3 -0.189** -0.209** -0.210** -0.303**
[-2.165] [-2.144] [-2.283] [-2.519]
HF_Target × Post t+3 -0.081 -0.068 -0.095 -0.168
[-0.480] [-0.461] [-0.561] [-1.048]
HF_Target × t+4 -0.165 -0.216
[-1.247] [-1.454]
HF_Target × t+5 -0.041 -0.001
[-0.262] [-0.003]
HF_Target × Post t+5 -0.046 0.034
[-0.193] [0.183]
LnSize -0.027 -0.300*** -0.027 -0.296*** -0.027 -0.296*** [-1.075] [-5.938] [-1.079] [-5.863] [-1.084] [-5.880]
Leverage 0.182 0.067 0.186 0.071 0.192 0.077 [1.033] [0.369] [1.060] [0.391] [1.091] [0.428]
CAPX 3.255*** 1.916*** 3.218*** 1.900*** 3.222*** 1.898*** [6.322] [4.022] [6.254] [3.998] [6.265] [4.007]
R&D 3.147*** 1.687*** 3.147*** 1.723*** 3.142*** 1.720*** [6.499] [2.681] [6.490] [2.724] [6.475] [2.725]
Intangibility 1.048*** 0.772** 1.046*** 0.782** 1.038*** 0.774**
[4.961] [2.248] [4.963] [2.277] [4.955] [2.265]
4-digit SIC Industry-FE Yes No Yes No Yes No
Firm-FE No Yes No Yes No Yes
Year-FE Yes Yes Yes Yes Yes Yes
Obs. 7,928 7,928 7,928 7,928 7,928 7,928
R-2 0.075 0.086 0.073 0.081 0.074 0.083 Note: ***, ** and * indicate statistical significance at the 1%, 5%, and 10% (two-tail) test levels, respectively.

61
Table A.7 – Delisting Reasons: Hedge Fund Targets and Matched-Control Firms
This table contains information on delisting reasons in the years after a firm has been targeted by a hedge fund, for either target or control firms. The delisting reasons are identified using the delisting code from CRSP. The hedge fund data is from the (updated) dataset used in Brav. et al. (2008) and covers the period 1995 to 2011.
Panel A: All Hedge Funds
Target: All Hedge Funds
Control
Combined
Delisting Reason: M&A 397 227 624 Security Exchanged for Security Trading in other Market 2 8 10 Firm's Liquidation 1 1 2 Delisted from NYSE, NYSE MKT, NASDAQ or Arca: Security Started Trading in Different Exchange 11 7 18 Security in Violation of Stock Exchange Requirement 187 125 312 Total 598 368 966
Panel B: Hostile Hedge Funds
Target: Hostile Hedge Funds
Control
Combined
Delisting Reason: M&A 121 64 185 Security Exchanged for Security Trading in other Market 1 3 4 Firm's Liquidation 0 1 1 Delisted from NYSE, NYSE MKT, NASDAQ or Arca: Security Started Trading in Different Exchange 2 2 4 Security in Violation of Stock Exchange Requirement 39 28 67 Total 163 98 261

62
Table A.8 – Controlling for Delisting Price (All Hedge Funds)
This table presents the coefficient estimates from OLS regressions. The dependent variable is Tobin Q, the industry median-adjusted Tobin’s Q. The hedge fund data is from the (updated) dataset used in Brav et al. (2008) and covers the period 1995 to 2011. Firm-level data are from COMPUSTAT for the period 1995 – 2011. The sample includes firms targeted by hedge funds and control firms (identified using the Abadie-Imbens matching estimator described in Table 4). In this table, if a target firm or its matched-control firm delist from the stock exchange after the event year, we estimate Tobin’s Q for the delisting year using the delisting price from CRSP and accounting information from COMPUSTAT (previous fiscal year). “t” is an indicator equal to one for the year in which a firm is targeted by a hedge fund, and zero for every other year before or after the targeting event year. This indicator is also equal to one for the matched control firm. “HF_Target × t” is an indicator equal to one for firms targeted by a hedge fund in the year of the targeting event, and zero for every year before or after the targeting event year. “HF_Target × t” is always equal to zero for the matched-control pairs (firms not targeted by a hedge fund). The other time dummies are defined similarly (see text for further details). We restrict the sample to non-financial firms. Refer to Table 1 for detailed variable definitions. In the table, t-statistics appear in brackets and are based on robust standard errors clustered by firm.
Dep. Var.: TobinQ (1) (2) (3) (4) (5) (6)
t-5 -0.205*** -0.135***
[-5.033] [-3.119]
t-4 -0.264*** -0.170***
[-6.618] [-3.758]
t-3 -0.281*** -0.175***
[-7.157] [-3.661]
t-2 -0.329*** -0.214***
[-7.515] [-4.025]
t-1 -0.392*** -0.273***
[-8.647] [-4.670]
t-4 to t-1 -0.299*** -0.167*** -0.278*** -0.151***
[-8.131] [-4.617] [-6.850] [-3.494]
t -0.271*** -0.170**
[-5.065] [-2.538]
t+1 -0.233*** -0.128*
[-3.974] [-1.837]
t+2 -0.208*** -0.080
[-3.377] [-1.015]
t+3 -0.068 0.051
[-0.930] [0.588]
t to t+3 -0.185*** -0.043 -0.188*** -0.039
[-3.400] [-0.769] [-3.492] [-0.680]
Post t+3 -0.056 0.090 -0.059 0.093
[-0.652] [1.098] [-0.687] [1.136]
t+4 -0.141* -0.007
[-1.856] [-0.081]
t+5 -0.110 0.058
[-1.285] [0.600]
Post t+5 -0.067 0.026
[-0.599] [0.218]
HF_Target × t-4 to t-1 -0.049 -0.038

63
[-1.041] [-0.621]
HF_Target × t -0.201*** -0.178***
[-3.401] [-3.081]
HF_Target × t+1 -0.198*** -0.198***
[-2.933] [-3.085]
HF_Target × t+2 -0.091 -0.131*
[-1.226] [-1.722]
HF_Target × t+3 -0.291*** -0.320***
[-3.433] [-3.866]
HF_Target × t to t+3 -0.173*** -0.195*** -0.173*** -0.212***
[-3.082] [-3.514] [-3.084] [-3.015]
HF_Target × Post t+3 -0.136 -0.217** -0.134 -0.235**
[-1.481] [-2.451] [-1.470] [-2.450]
HF_Target × t+4 -0.192** -0.273***
[-2.117] [-3.053]
HF_Target × t+5 -0.172 -0.246**
[-1.638] [-2.424]
HF_Target × Post t+5 -0.095 -0.173
[-0.792] [-1.440]
LnSize -0.137*** -0.533*** -0.136*** -0.535*** -0.136*** -0.535*** [-6.758] [-13.257] [-6.739] [-13.253] [-6.723] [-13.267]
Leverage 0.851*** 0.505*** 0.851*** 0.506*** 0.852*** 0.506*** [5.404] [3.744] [5.390] [3.748] [5.392] [3.747]
CAPX 3.567*** 2.579*** 3.602*** 2.606*** 3.604*** 2.606*** [8.175] [6.391] [8.253] [6.460] [8.258] [6.462]
R&D 5.295*** 2.560*** 5.297*** 2.553*** 5.301*** 2.554*** [13.156] [5.960] [13.147] [5.947] [13.160] [5.951]
Intangibility 0.938*** 1.155*** 0.947*** 1.166*** 0.949*** 1.166***
[5.589] [4.707] [5.634] [4.760] [5.644] [4.758]
4-digit SIC Industry-FE Yes No Yes No Yes No
Firm-FE No Yes No Yes No Yes
Year-FE Yes Yes Yes Yes Yes Yes
Obs. 25,635 25,635 25,635 25,635 25,635 25,635
R-2 0.166 0.120 0.164 0.118 0.164 0.118 Note: ***, ** and * indicate statistical significance at the 1%, 5%, and 10% (two-tail) test levels, respectively.

64
Table A.9 – Controlling for Delisting Price (Hostile Hedge Funds)
This table presents the coefficient estimates from OLS regressions. The dependent variable is TobinQ, the industry median-adjusted Tobin’s Q. The hedge fund data is from the (updated) dataset used in Brav et al. (2008) and covers the period 1995 to 2011. Firm-level data are from COMPUSTAT for the period 1995 – 2011. The sample includes firms targeted by hostile hedge funds and control firms (identified using the Abadie-Imbens matching estimator described in Table 4). In this table, if a target firm or its matched-control firm delist from the stock exchange after the event year, we estimate Tobin’s Q for the delisting year using the delisting price from CRSP and accounting information from COMPUSTAT (previous fiscal year). “t” is an indicator equal to one for the year in which a firm is targeted by a hedge fund, and zero for every other year before or after the targeting event year. This indicator is also equal to one for the matched control firm. “HHF_Target × t” is an indicator equal to one for firms targeted by a hostile hedge fund in the year of the targeting event, and zero for every year before or after the targeting event year. “HHF_Target × t” is always equal to zero for the matched-control pairs (firms not targeted by a hostile hedge fund). The other time dummies are defined similarly (see text for further details). Refer to Table 1 for detailed variable definitions. In the table, t-statistics appear in brackets and are based on robust standard errors clustered by firm.
Dep. Var.: TobinQ (1) (2) (3) (4) (5) (6)
t-5 -0.086 -0.077
[-1.276] [-1.106]
t-4 -0.186*** -0.151*
[-2.736] [-1.911]
t-3 -0.281*** -0.214**
[-4.067] [-2.413]
t-2 -0.349*** -0.265***
[-4.925] [-2.606]
t-1 -0.483*** -0.393***
[-5.773] [-3.336]
t-4 to t-1 -0.296*** -0.224*** -0.280*** -0.161**
[-5.099] [-3.733] [-4.149] [-2.154]
t -0.302*** -0.163
[-3.110] [-1.211]
t+1 -0.316*** -0.161
[-3.122] [-1.122]
t+2 -0.235** -0.073
[-2.187] [-0.462]
t+3 -0.182 -0.040
[-1.425] [-0.223]
t to t+3 -0.226** -0.072 -0.226** -0.048
[-2.517] [-0.706] [-2.504] [-0.444]
Post t+3 -0.178 0.065 -0.178 0.090
[-1.409] [0.437] [-1.408] [0.589]
t+4 -0.203 -0.009
[-1.430] [-0.047]
t+5 -0.129 0.127
[-0.833] [0.618]
Post t+5 -0.306** -0.059
[-2.015] [-0.250]
HHF_Target × t-4 to t-1 -0.035 -0.132
[-0.504] [-1.451]

65
HHF_Target × t -0.178** -0.276***
[-2.362] [-3.370]
HHF_Target × t+1 -0.109 -0.249***
[-1.281] [-2.611]
HHF_Target × t+2 -0.068 -0.245**
[-0.726] [-2.319]
HHF_Target × t+3 -0.131 -0.283**
[-1.132] [-2.248]
HHF_Target × t to t+3 -0.120* -0.264*** -0.124* -0.325***
[-1.699] [-3.149] [-1.670] [-2.945]
HHF_Target × Post t+3 0.037 -0.155 0.033 -0.222
[0.283] [-1.131] [0.255] [-1.438]
HHF_Target × t+4 -0.123 -0.330**
[-0.933] [-2.256]
HHF_Target × t+5 -0.187 -0.387**
[-1.207] [-2.350]
HHF_Target × Post t+5 0.233 0.101
[1.260] [0.588]
LnSize -0.069** -0.333*** -0.068** -0.330*** -0.068** -0.333*** [-2.536] [-6.109] [-2.517] [-6.073] [-2.485] [-6.124]
Leverage 0.186 0.115 0.186 0.122 0.187 0.123 [1.119] [0.614] [1.122] [0.648] [1.128] [0.657]
CAPX 2.970*** 1.724*** 2.980*** 1.750*** 2.979*** 1.765*** [5.947] [3.797] [5.938] [3.844] [5.936] [3.882]
R&D 3.342*** 0.992 3.359*** 1.017 3.363*** 1.014 [5.871] [1.405] [5.900] [1.437] [5.908] [1.433]
Intangibility 0.653*** 0.569** 0.665*** 0.586** 0.667*** 0.589**
[3.375] [2.072] [3.432] [2.134] [3.441] [2.155]
4-digit SIC Industry-FE Yes No Yes No Yes No
Firm-FE No Yes No Yes No Yes
Year-FE Yes Yes Yes Yes Yes Yes
Obs. 8,353 8,353 8,353 8,353 8,353 8,353
R-2 0.087 0.093 0.083 0.088 0.083 0.089 Note: ***, ** and * indicate statistical significance at the 1%, 5%, and 10% (two-tail) test levels, respectively.

66
Table A.10 – Controlling for 3-digit SIC Industry × Year Fixed Effects (All Hedge Funds)
This table presents the coefficient estimates from OLS regressions. The dependent variable is TobinQ, the industry median-adjusted Tobin’s Q. The hedge fund data is from the (updated) dataset used in Brav et al. (2008) and covers the period 1995 to 2011. Firm-level data are from COMPUSTAT. The sample includes firms targeted by hedge funds and control firms (identified using the Abadie-Imbens matching estimator described in Table 4). “t” is an indicator equal to one for the year in which a firm is targeted by a hedge fund, and zero for every other year before or after the targeting event year. This indicator is also equal to one for the matched control firm. “HF_Target × t” is an indicator equal to one for firms targeted by a hedge fund in the year of the targeting event, and zero for every year before or after the targeting event year. “HF_Target × t” is always equal to zero for the matched-control pairs (firms not targeted by a hedge fund). The other time dummies are defined similarly (see text for further details). We restrict the sample to non-financial firms. Refer to Table 1 for detailed variable definitions. In the table, t-statistics appear in brackets and are based on robust standard errors clustered by firm.
Dep. Var.: TobinQ (1) (2) (3) (4) (5) (6)
t-5 -0.215*** -0.141***
[-4.905] [-2.943]
t-4 -0.263*** -0.156***
[-6.429] [-3.088]
t-3 -0.273*** -0.148***
[-6.477] [-2.714]
t-2 -0.311*** -0.173***
[-7.920] [-2.841]
t-1 -0.375*** -0.236***
[-9.100] [-3.444]
t-4 to t-1 -0.297*** -0.134*** -0.268*** -0.144***
[-10.119] [-3.143] [-8.398] [-2.951]
t -0.266*** -0.160**
[-5.506] [-2.050]
t+1 -0.233*** -0.112
[-4.143] [-1.412]
t+2 -0.219*** -0.064
[-3.905] [-0.693]
t+3 -0.081 0.068
[-0.965] [0.659]
t to t+3 -0.200*** -0.031 -0.206*** -0.034
[-5.889] [-0.473] [-5.919] [-0.503]
Post t+3 0.027 0.198** 0.022 0.196**
[0.527] [2.031] [0.430] [2.013]
t+4 -0.083 0.067
[-0.976] [0.634]
t+5 -0.062 0.129
[-0.681] [1.123]
Post t+5 0.035 0.152
[0.543] [1.044]
HF_Target × t-4 to t-1 -0.064* 0.023
[-1.761] [0.338]
HF_Target × t -0.176*** -0.111

67
[-2.852] [-1.640]
HF_Target × t+1 -0.186** -0.147**
[-2.544] [-1.963]
HF_Target × t+2 -0.043 -0.043
[-0.497] [-0.473]
HF_Target × t+3 -0.220** -0.212**
[-2.105] [-2.275]
HF_Target × t to t+3 -0.132*** -0.116* -0.128*** -0.105
[-3.245] [-1.780] [-3.147] [-1.274]
HF_Target × Post t+3 -0.200*** -0.244** -0.195*** -0.233**
[-3.509] [-2.351] [-3.424] [-2.061]
HF_Target × t+4 -0.184* -0.209**
[-1.666] [-2.086]
HF_Target × t+5 -0.194 -0.222*
[-1.499] [-1.911]
HF_Target × Post t+5 -0.193** -0.262*
[-2.505] [-1.813]
LnSize -0.132*** -0.595*** -0.132*** -0.598*** -0.131*** -0.597*** [-12.309] [-13.082] [-12.248] [-13.098] [-12.188] [-13.111]
Leverage 0.942*** 0.588*** 0.945*** 0.590*** 0.945*** 0.590*** [10.147] [4.162] [10.165] [4.170] [10.160] [4.171]
CAPX 4.003*** 2.901*** 4.034*** 2.926*** 4.036*** 2.925*** [11.084] [6.918] [11.139] [6.988] [11.140] [6.988]
R&D 5.222*** 2.406*** 5.228*** 2.404*** 5.234*** 2.403*** [21.024] [5.182] [21.027] [5.172] [21.000] [5.171]
Intangibility 0.966*** 1.263*** 0.977*** 1.278*** 0.978*** 1.278***
[9.238] [4.698] [9.304] [4.767] [9.311] [4.767] 3-digit SIC Industry × Year Yes Yes Yes Yes Yes Yes
Firm-FE No Yes No Yes No Yes
Obs. 8,353 8,353 8,353 8,353 8,353 8,353
R-2 0.079 0.237 0.075 0.232 0.075 0.233 Note: ***, ** and * indicate statistical significance at the 1%, 5%, and 10% (two-tail) test levels, respectively.

68
Table A.11 –Controlling for 3-digit SIC Industry × Year Fixed Effects (Hostile Hedge Funds)
This table presents the coefficient estimates from OLS regressions. The dependent variable is TobinQ, the industry median-adjusted Tobin’s Q. The hedge fund data is from the (updated) dataset used in Brav et al. (2008) and covers the period 1995 to 2011. Firm-level data are from COMPUSTAT. The sample includes firms targeted by hostile hedge funds and control firms (identified using the Abadie-Imbens matching estimator described in Table 4). “t” is an indicator equal to one for the year in which a firm is targeted by a hedge fund, and zero for every other year before or after the targeting event year. This indicator is also equal to one for the matched control firm. “HF_Target × t” is an indicator equal to one for firms targeted by a hedge fund in the year of the targeting event, and zero for every year before or after the targeting event year. “HF_Target × t” is always equal to zero for the matched-control pairs (firms not targeted by a hedge fund). The other time dummies are defined similarly (see text for further details). We restrict the sample to non-financial firms. Refer to Table 1 for detailed variable definitions. In the table, t-statistics appear in brackets and are based on robust standard errors clustered by firm.
Dep. Var.: TobinQ (1) (2) (3) (4) (5) (6)
t-5 -0.066 -0.024
[-0.750] [-0.248]
t-4 -0.181*** -0.096
[-2.710] [-0.833]
t-3 -0.313*** -0.173
[-4.849] [-1.306]
t-2 -0.374*** -0.206
[-6.177] [-1.357]
t-1 -0.537*** -0.357**
[-7.920] [-2.033]
t-4 to t-1 -0.334*** -0.213** -0.309*** -0.144
[-7.090] [-2.217] [-5.986] [-1.248]
t -0.361*** -0.135
[-5.108] [-0.701]
t+1 -0.325*** -0.087
[-3.722] [-0.408]
t+2 -0.221** 0.032
[-2.238] [0.134]
t+3 -0.163 0.062
[-1.284] [0.224]
t to t+3 -0.262*** -0.061 -0.263*** -0.033
[-4.321] [-0.383] [-4.337] [-0.202]
Post t+3 -0.176** 0.183 -0.178** 0.208
[-2.220] [0.767] [-2.240] [0.857]
t+4 -0.084 0.225
[-0.569] [0.759]
t+5 -0.127 0.303
[-0.850] [0.996]
Post t+5 -0.337*** 0.095
[-3.806] [0.262]
HHF_Target × t-4 to t-1 -0.049 -0.140
[-0.996] [-1.070]
HHF_Target × t -0.221** -0.304***

69
[-2.377] [-2.653]
HHF_Target × t+1 -0.183* -0.303**
[-1.758] [-2.255]
HHF_Target × t+2 -0.157 -0.322**
[-1.426] [-2.103]
HHF_Target × t+3 -0.181 -0.315*
[-1.196] [-1.749]
HHF_Target × t to t+3 -0.175*** -0.306** -0.175*** -0.373**
[-3.100] [-2.577] [-3.098] [-2.374]
HHF_Target × Post t+3 -0.016 -0.256 -0.015 -0.326
[-0.200] [-1.155] [-0.182] [-1.353]
HHF_Target × t+4 -0.231 -0.464**
[-1.289] [-2.238]
HHF_Target × t+5 -0.264 -0.502**
[-1.290] [-2.114]
HHF_Target × Post t+5 0.227** 0.085
[2.046] [0.269]
LnSize -0.060*** -0.440*** -0.059*** -0.438*** -0.059*** -0.441*** [-4.143] [-5.458] [-4.075] [-5.406] [-4.028] [-5.452]
Leverage 0.354*** 0.217 0.356*** 0.232 0.356*** 0.231 [3.110] [0.873] [3.114] [0.940] [3.120] [0.935]
CAPX 3.474*** 1.931*** 3.482*** 1.975*** 3.479*** 1.983*** [7.612] [2.888] [7.513] [2.944] [7.493] [2.959]
R&D 3.404*** 0.414 3.425*** 0.421 3.432*** 0.422 [7.983] [0.518] [8.056] [0.525] [8.067] [0.528]
Intangibility 0.724*** 0.636 0.738*** 0.683 0.740*** 0.687
[4.370] [1.493] [4.458] [1.612] [4.470] [1.629] 3-digit SIC Industry × Year Yes No Yes No Yes No
Firm-FE No Yes No Yes No Yes
Obs. 8,353 8,353 8,353 8,353 8,353 8,353
R-2 0.087 0.093 0.083 0.088 0.083 0.089 Note: ***, ** and * indicate statistical significance at the 1%, 5%, and 10% (two-tail) test levels, respectively.