heavy metal contamination of urban soil in an old industrial city (shenyang) in northeast china
TRANSCRIPT

Geoderma 192 (2013) 50–58
Contents lists available at SciVerse ScienceDirect
Geoderma
j ourna l homepage: www.e lsev ie r .com/ locate /geoderma
Heavy metal contamination of urban soil in an old industrial city (Shenyang) inNortheast China
Xiaoyu Li a,b,⁎, Lijuan Liu a, Yugang Wang a, Geping Luo a, Xi Chen a, Xiaoliang Yang c, Myrna H.P. Hall c,Ruichao Guo b, Houjun Wang d, Jiehua Cui b, Xingyuan He b,⁎a State Key Laboratory of Desert and Oasis Ecology, Xinjiang Institute of Ecology and Geography, Chinese Academy of Sciences, Xinjiang, Chinab State Key Laboratory of Forest and Soil Ecology, Institute of Applied Ecology, Chinese Academy of Sciences, Liaoning, Chinac College of Environmental Science and Forestry, State University of New York, Syracuse, New York, USAd Weihai Ocean Environment Monitoring Center, Shandong, China
⁎ Corresponding author at: State Key LaboratoryXinjiang Institute of Ecology and Geography, Chinese AChina. Tel.: +86 991 7823131.
E-mail addresses: [email protected] (X. Li), hexy@iae
0016-7061/$ – see front matter © 2012 Elsevier B.V. Allhttp://dx.doi.org/10.1016/j.geoderma.2012.08.011
a b s t r a c t
a r t i c l e i n f oArticle history:Received 15 May 2011Received in revised form 1 August 2012Accepted 19 August 2012Available online 16 November 2012
Keywords:Heavy metal contaminationSpatial patternLand useUrban soilOld industrial city
The purpose of this study is to investigate the current status of heavy metal soil pollution in one of the cradlesof industry in China, the Tiexi Industrial District in the city of Shenyang, Ninety-three soil samples were col-lected from the top 15 cm of the soil layer and were analyzed for heavy metal concentrations of Pb, Cu, Cr, Zn,Mn, Cd, As and Hg. The data reveal a remarkable variation in heavy metal concentration among the sampledsoils; the mean values of all the heavy metal concentrations were higher than the background values, and themean concentrations of Pb, Cu, Cd and As were as high as 5.75, 5.08, 12.12 and 13.02 times their backgroundvalues, respectively. The results of principal component analysis (PCA) indicate that Pb, Cu, Zn, Cd, As and Hgare closely associated with the first principal component (PC1), which explained 46.7% of the total variance,while Cr and Mn are mainly distributed with the second component (PC2), which explained 22.5% of the totalvariance. Geostatistical analyses, including the calculation of semivariogram parameters and model fitting,further confirmed the results of the statistical analysis. In the estimated maps of heavy metals, severalhotspots of high metal concentrations were identified; Pb and Cu showed a very similar spatial pattern, indi-cating that they were likely from the same source. There is a clear heavy polluted hotspot of Pb, Cu, Zn, Cd andAs in the northeast part of the Tiexi Industrial District because of the Shenyang Smelting Plant, which was abackbone enterprise of China's metallurgical industry. There were also hotspots for other heavy metals inother areas. This is mainly the result of the industrial processing that occurred in the study area. All ofthese data confirm that Pb, Cu, Zn, Cd and As are a result of anthropogenic activities, especially from industrialprocesses. For Cr and Mn, the concentration patterns indicate low spatial heterogeneity, with low correlationto other metals, indicating that the concentration of Cr and Mn are mainly caused by natural factors such assoil parent materials. Although the city government of Shenyang has placed a high priority on improving theenvironment in recent years, it will require a long time to completely eliminate pollution in this area.
© 2012 Elsevier B.V. All rights reserved.
1. Introduction
There are two main sources of heavy metals in the soil (Li et al.,2009b): (i) natural background, which represents the heavy metalconcentration derived from parent rocks; (ii) anthropogenic contam-ination, including agrochemicals, organic amendments, animal manure,mineral fertilizer, sewage sludge and industrial wastes. In the last severaldecades, the natural input of several heavy metals to soils due to pedo-genesis has been exceeded by the human input, even on global andregional scales (Facchinelli et al., 2001; Nriagu and Pacyna, 1988). The
of Desert and Oasis Ecology,cademy of Sciences, Xinjiang,
.ac.cn (X. He).
rights reserved.
estimates made by Nriagu and Pacyna (1988) suggest that the two prin-cipal sources of heavy metals in soils worldwide are the disposal of ashresidues from coal combustion and general waste from commercialproducts. Urban refuse represents an important source of Cu, Hg, Pb,and Zn, with notable contributions of Cd, Pb, and V also coming via theatmosphere. Millward and Turner (2001) compared the rates of heavymetal emissions in the atmosphere from natural and anthropogenicsources to assess man's impact on the environment. The ratio, referredto as the ‘interference factor,’ is >1 for all of the metals studied (Ca, Cu,Hg, Pb and Zn), with relatively high values of Pb and Ca (27 and 5.3, re-spectively), suggesting that there is a significant anthropogenic alterationof their natural cycles.
Themobilization of heavymetals into the biosphere fromhuman ac-tivity has become an important process in the geochemical cycling ofthese metals. Soils serve as the most important sink for heavy metalcontaminants in the terrestrial ecosystem. The urban environmental
51X. Li et al. / Geoderma 192 (2013) 50–58
quality is of vital importance because themajority of people now live incities. Urban soils are therefore an important indicator of human expo-sure to heavy metals in the urban terrestrial environment (Nriagu andPacyna, 1988). Many studies have indicated that urban soils are con-taminated by heavy metals and this phenomenon has been attributedmainly to modern industries, traffic and mining activities in urbanareas (De Kimpe and Morel, 2000; Gallagher et al., 2008). The abun-dance of contamination sources in urban systems results in chemicalpressures that often manifest as high pollution concentrations or load-ings (Wong et al., 2006), which consequently have detrimental impactson human and ecosystem health (Taylor and Owens, 2009). Heavymetals reaching the soil remain present in the pedosphere for manyyears; even after removing the pollution sources, increased amountsof heavy metals in urban soils have been reported (Imperato et al.,2003; Pichtel et al., 1997). Some urban soils, in particular thoseobserved on brownfields that were previously used for industrial pro-duction, may contain large amounts of mineral pollutants that have ac-cumulated over time. Urban soils can vary widely over short distances,compared to naturally developed and anthropogenically influencedsoils. Most urban soils are relatively young, resulting from soil exchangeand mixture due to construction activities (Norra et al., 2001). Becauseurban landscapes are complex in nature and have numerous sources ofheavy metals, assessing the extent and degree of metal contaminationpresents a challenge to researchers (Yesilonis et al., 2008).
Urban land use and structure have an influence on soil contamina-tion. The urban area possesses a wide range of different land uses,such as traffic, industry, business, residential uses, gardens and publicgreen spaces, differing in their patterns of human activity and their pos-sible impacts on soil quality (Tiller, 1992). Landuse and covermay serveas an indicator of disturbance, site history, management, and the urbanenvironment; these factors result in a mosaic of soil patches (Pouyat etal., 2007). Areas consisting predominantly of man-made soils andinfluenced by anthropogenically caused emissions may exhibit thehighest pollutant values of urban land (Meuser, 2010); for example,many isolated sites with an industrial history show extremely highvalues. Yet, many potentially influential factors associated with urbanland transformation have received limited attention. The relationshipbetween land use and soil pollution needs to be explored further.
As the largest developing country in the world, China has achievedrapid economic development, averaging an annual growth rate of 10%in gross domestic product (GDP) over the past two decades. However,this success comes at a cost to the environment (Kan, 2009). Heavymetal pollution in urban soils, urban road dust and agricultural soilshas become significant with the rapid industrialization and urbaniza-tion of China over the last two decades. Wei and Yang (2010)reviewed studies of heavymetal contamination in several Chinese cit-ies over the past 10 years and found that contamination with Cr, Ni,Cu, Pb, Zn and Cd is widespread in urban soils and in urban roaddust. Beijing, the capital of China, is one of the oldest and most dense-ly populated cities in the world; the accumulation of Cu and Pb in Bei-jing was readily apparent in the soils of urban parks (Chen et al.,2005), and roadside soils had low-level contamination from Cu, Pband Zn and moderate contamination from Cd (Chen, et al., 2010). InShanghai, the biggest metropolitan area and the fastest growing Chi-nese city with a population of more than 19 million, had significantconcentrations of Pb, Zn, Cu, Cr, and Cd in urban soils. Heavy metalpollution was even more severe in roadside dust (Shi et al., 2008);the concentrations of Pb, Cr, Cd, As and Hg in urban dusts are 11.3,2.1, 10.3, 0.997 and 1.7 times the soil background values, respectively(Wang, et al., 2009). In Nanjing, another large city located in easternChina, the total Cu, Zn, Pb and Cr concentrations of urban soils were84.7 (48.1–139.7), 66.1 (12.2–869.4), 162.6 (57.7–851.6) and 107.3(36.3–472.6) mg/kg, respectively; the soils were also polluted withCu, Zn and Cr to some extent and heavily polluted with Pb (Lu et al.,2003). Xi'an, one of the biggest tourist cities in China, has graduallydeveloped into an important industrial city in China beginning in
the 1950s. The urban dust in Xi'an has elevated heavy metal concen-trations of Ag, Cr, Cu, Pb, Zn and Hg (Han et al., 2006). Urumqi, thecapital of Xinjiang Uygur Autonomous Region in northwest China,with a population of more than 2 million people, had concentrationsof Cd, Cr, Cu, Ni, Pb, Mn and Zn that were much higher in urban areasthan the background values, and the spatial distribution pattern of Cu,Pb, Cr and Zn was mainly associated with the main roads where hightraffic density was identified; Ni and Mn coincided with industrialareas (Wei et al., 2010). Urban soils were also polluted by heavymetals in many other Chinese cities, such as Baoji (Lu et al., 2009)and Guangzhou (Duzgoren-Aydin et al., 2006),.
Shenyang, the largest industrial city in Northeast China and theadministrative center of Liaoning Province is historically known asan industrial base and well-constructed city, with heavy machineryand manufacturing as the major industries. The growth of the GDPin 2009 was over 14.0% greater than that of the previous year. It is notonly a quickly developing city but also an ancient city with more than2300 years of history. In 2009, the built-up area was 310 km2 , andthe urban population was 5.12 million. With rapid economic develop-ment, environmental quality has severely deteriorated. Heavy metalpollution is one of themost serious problems. According to the ShenyangEnvironment Protection Agency, it has been estimated that 66.8 t ofmetals from the Shenyang smelters were annually deposited in the envi-ronment before 2000.
The main objectives of this study were the following: (1) to assessthe concentration and distribution patterns of heavy metals in urbansoil; and (2) to identify the relationship between urban land use andthe heavy metal contamination of urban soil.
2. Materials and methods
2.1. Study Area
This study was carried out in the Shenyang Tiexi Industrial District(Fig. 1), located in the western part of Shenyang, with a total area of3900 ha and a population of 0.8 million. It is the main industrialarea of Shenyang and is one of the cradles of industry in China. Asearly as 1905, there were industrial enterprises in this area. Afterthe founding of the People's Republic of China, the Tiexi district be-came China's largest heavy industrial area and there were morethan 300,000 workers and 1200 factories and plants in the 39 km2
built-up area by the end of 2002 (Li et al., 2009a). In the past10 years, many large factories and plants have closed or relocatedto suburban areas from the industrial zone because of serious envi-ronmental pollution.
2.2. Soil sampling and chemical analyses
Ninety-three soil samples were collected in the Tiexi IndustrialDistrict. The sampling points were randomly distributed in thestudy area based on a regular grid of 1×1 km, and each grid had atleast one sampling point (Fig. 1.). The topsoil (0–15 cm) was collect-ed. Each of the soil samples consisted of 3–5 sub-samples, obtained indifferent directions using a stainless steel hand auger. All of the sam-ple sites were recorded using a hand-held global positioning system(GPS). Related information, such as land use history, vegetation, andsoil type were also recorded in detail. The soil samples were collectedin September 2007.
The samples were oven-dried at 45 °C for 3 days, sieved through a2-mm plastic sieve to remove large debris, gravel-sized materials,plant roots and other waste materials and stored in closed plasticbags until analysis. Soil was digested with a 5:2:3 mixture of HNO3-
HClO4\HF (Li et al., 2012). The digested solutions were analyzedvia inductively coupled plasma-atomic emission spectroscopy(ICP-AES; Perkin Elmer Optima 3300 DV). All of the soil sampleswere analyzed for their total concentrations of Pb, Cu, Cr, Zn, Mn,

Liaoning Province
Shenyang City
QuickBird Image of Shengyang City
Tiexi Industrial Districtand sampling points
Fig. 1. Map of the Shenyang Tiexi Industrial District and sampling points.
52 X. Li et al. / Geoderma 192 (2013) 50–58
Cd, As and Hg. Quality control involved the following: 1) analysis of15 random samples and 6 national standard samples; and 2) a randomselection of samples to ensure that the mean deviation was less than3%.
2.3. Statistical analysis
To identify the relationship among heavy metals in urban soils andtheir possible sources, Pearson's correlation coefficient analysis andprincipal component analysis (PCA) were performed (Facchinelli etal., 2001) using the commercial statistics software package SPSS version17.0 for Windows. The correlation coefficient measures the strength ofthe inter-relationship between two heavymetals. PCA, as amultivariateanalytical tool, is used to reduce a set of original variables to extract asmall number of latent factors (principal components, PCs) and analyzerelationships among heavy metals.
2.4. Geostatistical methods
Geostatistics provides a set of statistical tools for incorporating thespatial and temporal coordinates of observations in data processing,and its increasing use in environmental applications testifies to itsutility and success (Saito and Goovaerts, 2000). A semivariogram isa basic tool of geostatistics and is the mathematical expression ofthe square of regional variables z(xi) and z(x+h i, namely the vari-ance of regional variables. Its general form is:
γ hð Þ ¼ 12N hð Þ
XN hð Þ
i¼1
z xið Þ−z xi þ hð Þ½ �2
where r(h) is the semivariogram; h is the step length, namely the spa-tial interval of sampling points used for the classification to decreasethe individual number of spatial distances of various sampling pointassemblages; N(h) is the logarithm of sampling points when the
spacing is h; and z(xi) and z(x i+h) are the values when the variableZ is at the xi and xi+h positions, respectively.
In this study, the step length was divided by 300-m intervals: 300,600, 900, 1200, … 4200 m; in total, there were 14 class intervals. Be-cause 4200 m is smaller than half of the maximum distance (8523 m)between the various sampling points, it also coincides with the re-quirements of the geostatistical analysis.
Kriging, as a geostatistical interpolation method, uses thesemivariogram to quantify the spatial variability of regionalizedvariables and provides parameters for spatial interpolation. Themaps of spatial distribution of heavy metal concentrations were generat-ed by Kriging interpolation with the support of ArcGIS-GeostatisticalAnalyst.
2.5. Mapping of land use
The land use map of the study area was obtained from high-resolution remote sensing images (QuickBird) in 2006 using ArcGIS,Erdas and field survey. Land use in the Shenyang Tiexi Industrial Dis-trict was classified into 8 types: Industrial land, New residential land(built after 1990), Old residential land (built before 1990), Commer-cial and public facilities land, Roads, Land under construction, Parksand Public Squares Land, and Railways (Fig. 3).
To analyze the impacts of land use on the heavy metal pollution ofsoils, a superposition calculation was performed using the map ofland use types and the maps of the spatial distribution of heavy metalconcentrations.
2.6. Background values of heavy metals
The heavy metal background values are from the report “TheBackground Concentrations of Soil Elements of China” at the provin-cial level (China National Environmental Monitoring Center, 1990);this was a final report of a national program “Investigations on Back-ground Data for Concentrations of Elements in Soils of Mainland

Table 1Heavy metal concentrations and background values (mg/kg) of urban top soils in the Shenyang Tiexi Industrial District.
Minimum Maximum Mean Median SD CV% Skewness Kurtosis Background value
Pb 1.90 940.00 116.76 70.10 149.37 127.93 3.15 12.97 20.30Cu 7.60 430.00 92.45 71.10 72.09 77.97 2.63 8.57 18.20Cr 4.80 207.00 67.90 65.10 25.32 37.29 2.18 10.23 54.20Zn 25.00 1140.00 234.80 182.00 172.41 73.43 2.51 8.66 59.80Mn 132.00 1030.00 635.88 657.00 139.87 21.99 −0.64 2.86 524.00Cd 0.01 9.64 1.10 0.54 1.54 139.14 3.54 15.75 0.09As 7.48 137.68 22.69 17.56 18.13 79.93 4.41 24.17 8.20Hg 0.06 1.34 0.39 0.33 0.28 72.31 1.44 2.00 0.03
53X. Li et al. / Geoderma 192 (2013) 50–58
China” started in 1986. Chen et al. (1991) described the sampling col-lection and chemical analysis in detail.
3. Results and discussion
3.1. Analysis of concentrations of heavy metals in the soil
Table 1 presents the descriptive statistics of the heavy metal con-centrations of urban topsoils and background values for Shenyangsoils. There was a remarkable change in the content of heavy metalsamong the sampled soils: the concentrations of Pb, Cu, Cr, Zn, Mn,Cd, As and Hg varied between 1.9 and 940, 7.6 and 430, 4.8 and207, 25 and 1140, 132 and 1030, 0.0098 and 9.641, 7.48 and 137.68,and 0.0605 and 1.343 mg/kg, respectively, with average concentra-tions of 116.76, 92.454, 67.895, 234.801, 635.876, 1.1032, 22.686,and 0.3897 mg/kg, respectively. All of the mean values of the heavymetal concentrations were higher than their background values; themean concentrations of Pb, Cu, Cd and As were as high as 5.75, 5.08,12.12 and 13.02 times their background values. In fact, all of themetals showed contamination in the 75th percentile, and almost allsamples of Cu, Zn, Cd, As and Hg showed above-background levels.This clearly demonstrated the anthropogenic contribution and re-vealed the significant pollution levels in the area. The distribution ofconcentrations was skewed by a small number of large values (con-tamination hotspots). For all metals, the total concentrations showed
Table 3Total variance of explained and component matrixes.
Component Initial eigenvalues Extraction
Total % of variance Cumulative % Total % o
1 4.190 52.370 52.370 4.190 52.2 1.350 16.880 69.251 1.350 16.3 0.689 8.613 77.8634 0.618 7.726 85.5905 0.522 6.522 92.1116 0.305 3.814 95.9257 0.230 2.877 98.8028 0.096 1.198 100.000
Table 2Correlations between heavy metal concentrations.
Pb Cu Cr Zn Mn Cd As Hg
Pb 1.000Cu 0.793⁎⁎ 1.000Cr 0.363⁎⁎ 0.528⁎⁎ 1.000Zn 0.730⁎⁎ 0.584⁎⁎ 0.295⁎⁎ 1.000Mn 0.197⁎ 0.284⁎⁎ 0.475⁎⁎ 0.322⁎⁎ 1.000Cd 0.835⁎⁎ 0.622⁎⁎ 0.193 0.628⁎⁎ 0.162 1.000As 0.650⁎⁎ 0.530⁎⁎ 0.119 0.420⁎⁎ 0.071 0.546⁎⁎ 1.000Hg 0.525⁎⁎ 0.361⁎⁎ 0.193 0.512⁎⁎ 0.087 0.422⁎⁎ 0.502⁎⁎ 1.000
⁎ Pb0.05.⁎⁎ Pb0.01.
a great degree of variability, indicated by the large coefficients of var-iation (CV) from 21.99% of Mn to 139.14% of Cd. The elevated coeffi-cients of variation reflected the non-homogeneous distribution ofconcentrations of anthropogenically emitted heavy metals. Largestandard deviations were found in all heavy metals except Hg. Thisalso indicated the wide variation of concentrations in urban soils.The extent of this skew was shown by the differences between themean and the median values. The difference (expressed as a percentageof the median value) was greatest for Cd (105%) and Pd (66.6%) and theleast for Cr (4.3%). The results of the K–S test (Pb0.05) showed that theconcentrations of measured metals, except Mn, were not normally dis-tributed, showing positively skewed data.
3.2. Correlation between heavy metals
Correlation analyses have been widely applied in environmentalstudies. They provide an effective way to reveal the relationships be-tween multiple variables and thus have been helpful for understandingthe influencing factors as well as the sources of chemical components.Heavy metals in soil usually have complicated relationships amongthem. The high correlations between heavy metals in soil may reflectthat the accumulated concentrations of these heavy metals come fromsimilar pollution sources. The results of the Pearson's correlation coeffi-cients and their significance levels (Pb0.01) are shown in Table 2. Theconcentration of Pb showed a high significant positive relationshipwith Cu (0.793), Cr (0.363), Zn (0.730), Cd (0.835), As (0.650), and Hg(0.525). Additionally, the correlations between Cu and Pb, Cr, Zn, Mn,Cd, As and Hg were significantly positive (Pb0.01). However, the con-centrations of Cr and Mn showed very weak correlations with Cd, Asand Hg. This indicates that Cr and Mn were from different sourcesthan Cd, As and Hg.
3.3. Principal component analysis (PCA)
In multivariate statistical analysis, PCA can be used to identify thesources of contamination (Facchinelli et al., 2001). The results of thePCA for metal concentrations in urban soils are tabulated in Table 3.According to the results of the initial eigenvalues, two principal com-ponents were considered, which account for over 69% of the total var-iance. The communalities shown by the variables, considering two
sums of squared loadings Rotation sums of squared loadings
f variance Cumulative % Total % of variance Cumulative %
370 52.370 3.735 46.693 46.693880 69.251 1.805 22.558 69.251

Table 4Matrix of the principal component analysis loadings of heavy metals.
Pb Cu Cr Zn Mn Cd As Hg
PC1 0.936 0.844 0.49 0.807 0.362 0.821 0.705 0.638PC2 −0.134 0.142 0.701 0.006 0.751 −0.222 −0.368 −0.269
54 X. Li et al. / Geoderma 192 (2013) 50–58
factors only, vary from 63.8% for Hg to 93.6% for Pb. All of the ele-ments are consequently well represented by these two principal com-ponents. The initial component matrix (Table 4) indicated that Pb, Cu,Zn, Cd, As and Hg are closely associated with the first principal com-ponent (PC1), which explained 46.7% of the total variance, while Crand Mn are mainly distributed with the second component (PC2),which explained 22.5% of the total variance. However, not all heavymetals could be distributed on one component; for example, Pb wasmainly associated with PC1, and partially with PC2. This suggestedthat all of the metals might be controlled by more factors. The metalsin the PC1 mainly come from anthropogenic sources, such as industri-al production and traffic activities. Cr and Mn in PC2 are strongly cor-related and clearly separate from the other heavy metals regardingtheir correlation coefficient analysis and PCA. This separation betweenthem and other heavy metals may suggest that Cr and Mn mainly camefrom non-anthropogenic sources, indicating that they originated fromlocal natural sources.
3.4. Spatial structure of heavy metals
Semivariogram calculation was conducted, and the experimentalsemivariogram of soil heavy metal concentrations could be fitted witha Gaussian model for Pb, Cu and As, a spherical model for Cr and Zn,and an exponential model for Mn, Cd and Hg. The theoretical variationfunction and experimental variation function exhibited a better fit.The parameters are presented in Table 4, including a nugget value(C0), sill (C0+C), ratio of nugget to sill (C0+C), range, coefficients ofdetermination (R), residual sum of squares (RSS) and the values of the Ftest. The values of R were significant at the 0.01 level by F test, whichshowed that the semivariogram models reflected the spatial structuralcharacteristics of soil heavy metals.
Geostatistical theory recognizes that the variable Z used to describethe landscape heterogeneity can be divided into two components, anautocorrelation component (SHA) and a stochastic component (SHR).SHA and SHR can be quantified through the analysis of variation func-tions. The spatial heterogeneity of SHA caused by the spatial autocorre-lation component falls in the range a, defined by the variation functionr(h), and corresponds to themediumscale. However, the spatial hetero-geneity SHR caused by the stochastic component occurs on a small scale;it may be smaller than the sum of variations of a resolution scale and canbe expressed by the nugget variance (Co). In addition, the relative contri-butionof SHA and SHR to the total spatial heterogeneity SH(Z) is negativelycorrelated.
Both the sill (CO+C) and nugget (CO) can be used to describe spa-tial heterogeneity (Cambardella et al., 1994). The sill (CO+C)
Table 5Parameters and F-test of fitted semivariogram models for heavy metals in urban soils.
Theoretical model Nugget(C0)
Sill(C0+C)
C
Pb Gaussian model 3540 25,920 0Cu Gaussian model 2848 5697 0Cr Spherical model 122 569.9 0Zn Spherical model 7660 31,100 0Mn Exponential model 11470 22,950 0Cd Exponential model 1.011 3.1 0As Gaussian model 194.6 389.3 0Hg Exponential model 0.001 0.07 0
⁎⁎ Significance at α=0.01 level of F test.
expresses the attributes of the system, or the maximum variation ofthe regional variables; the higher the sill, the larger the degree oftotal spatial heterogeneity. However, the sill (CO+C) is not effectivewhen used to make the comparison of different regional variables be-cause of the larger influence of the sill itself and the measurementunit. The nugget (CO) expresses the spatial heterogeneity of the sto-chastic component SHR. Large nugget variance shows that there isan assignable process of small scale; it cannot be used to comparethe difference of the stochastic components of different variables.However, using the ratio of nugget and sill (CO/CO+C) to reflect thetotal spatial heterogeneity in the nugget variance is very useful. Alow ratio indicates a strong spatial autocorrelation, whereas a highratio shows that the spatial heterogeneity SHR caused by the stochas-tic component plays a major role; if the ratio is approximately 1, thestudied variable has a constant variation on the whole.
The data in Table 5 indicated that the stochastic variation of SHR
was below 300 m at a small scale of Pb, Cr, Zn, Cd and Hg and washigher than the structural variation of SHA caused by the spatial auto-correlation component of 300–4200 mmedium scale; this shows thatthe industrial production and point pollution were the main sourcesof these metals, especially Hg, which was almost completely domi-nated by stochastic variation. For Cu, Mn and As, the stochastic varia-tion equaled the spatial structural variation; they made exactly thesame contribution to the variation of Cu, Mn and As, indicating thatthe variation of Cu, Mn and As were under the control of geologicaland anthropic factors at the same time.
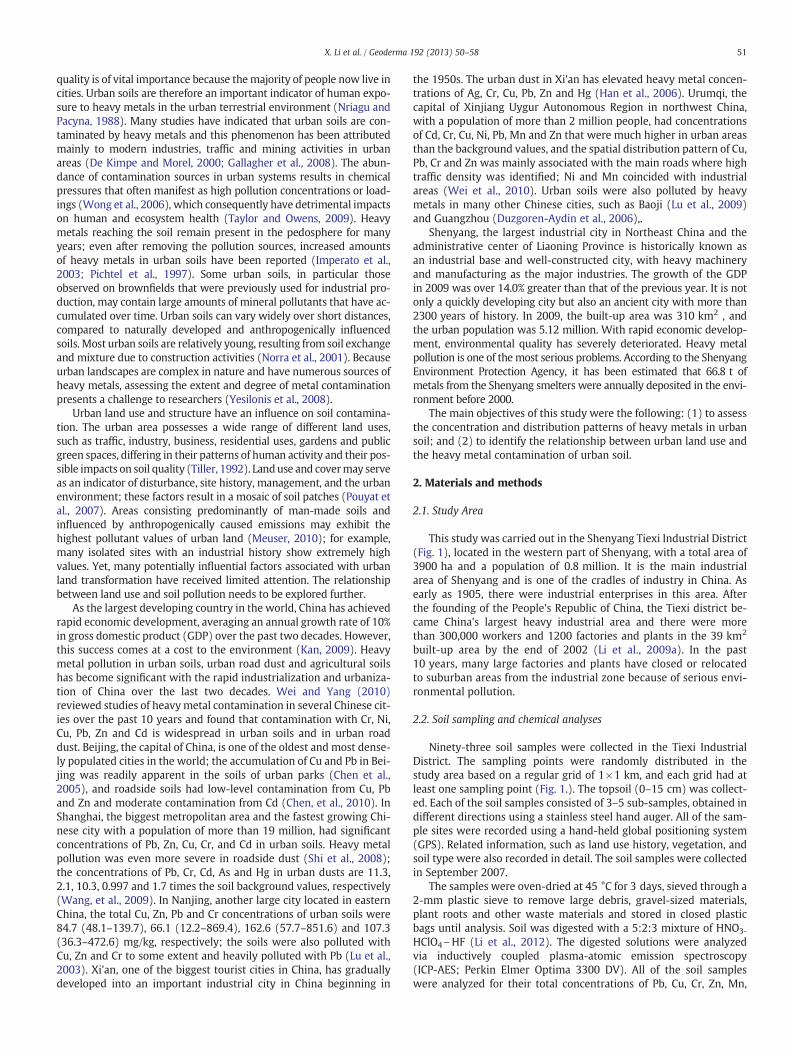
3.5. Spatial distribution of heavy metals
The spatial distribution of metal concentrations is a useful aid toassess the possible sources of enrichment and to identify hotspotswith high metal concentrations. The estimated maps of Pb, Cu, Cr,Zn, Mn, Cd, As and Hg are presented in Fig. 2; several hotspots ofhigh metal concentration were identified by the geochemical maps.In these metals, Pb and Cu showed a very similar spatial pattern,with contamination hotspots located simultaneously in the northand east of the study area, indicating that they were from the samesources. This provided a refinement and reconfirmation of the resultsof the statistical analysis, in which strong associations were found be-tween these two metals.
In urban areas, many isolated sites with an industrial history indi-cate extremely high values; these are termed hotspots. There wereobvious hotspots for Pb, Cu, Zn, Cd and As in the northeast part ofthe Shenyang Tiexi Industrial District. The highest concentration ofPb, Cu, Zn, Cd and As all appeared at this location, up to 940, 430,1140, 9.641 and 137.68 mg/kg, respectively. These concentrationsare a result of Shenyang Smelting Plant being located in this area for64 years, until it was closed down by the government because ofheavy pollution in 2000. Started in 1936, the Shenyang SmeltingPlant was one of the backbone enterprises of China's metallurgical in-dustry. In the 1980s, it was 69th out of the 500 largest state-owned
/(C0+C) Range R2 RSS F-test
.863 1484 0.677 3.15E+08 190.73⁎⁎
.500 1588 0.638 5.25E+06 160.38⁎⁎
.786 815 0.339 1.71E+05 46.67⁎⁎
.754 1083 0.426 4.43E+08 67.54⁎⁎
.500 3660 0.311 1.57E+08 41.08⁎⁎
.677 5157 0.503 3.83 92.10⁎⁎
.500 2527 0.273 1.15E+05 34.17⁎⁎
.981 360 0.147 0.0011 15.68⁎⁎
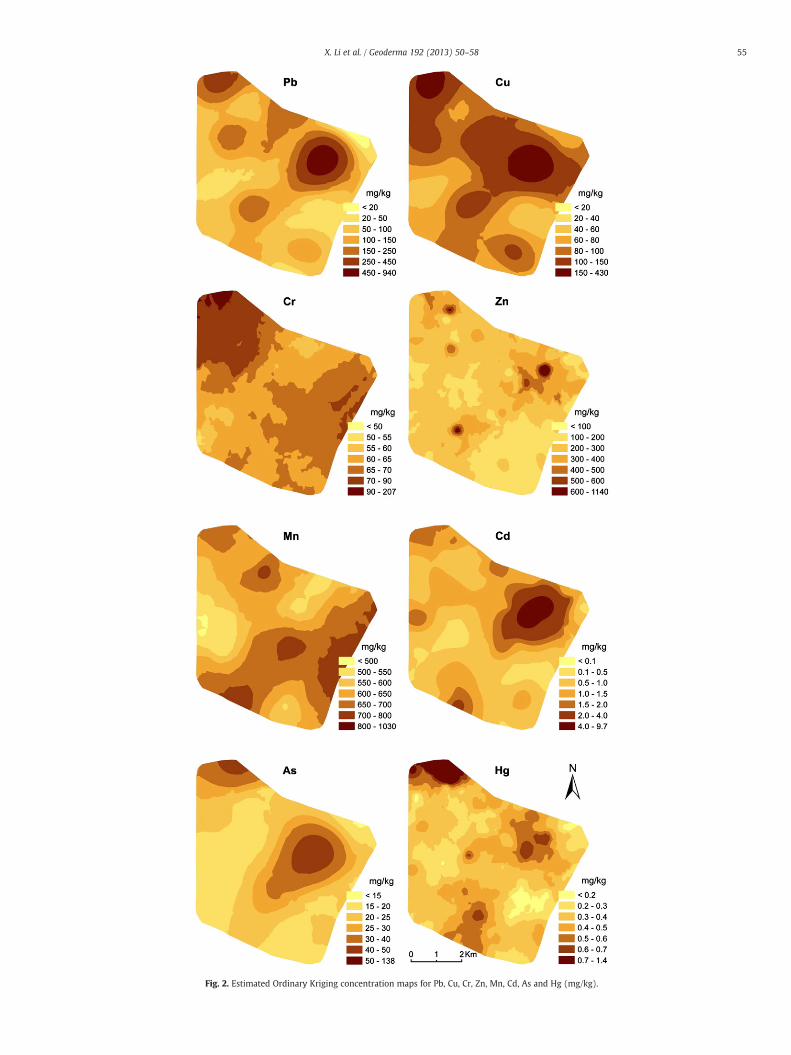
Fig. 2. Estimated Ordinary Kriging concentration maps for Pb, Cu, Cr, Zn, Mn, Cd, As and Hg (mg/kg).
55X. Li et al. / Geoderma 192 (2013) 50–58

0
200
400
600
800
1000
1200
Are
a (h
a)
1 2 3 4 5 6 7 8Land use type
(b)
(a)
Fig. 3.Maps of land use patterns (a) and the areas of different land use types (b) in theShenyang Tiexi Industrial District (1, Industrial Land; 2, New Residential Land (builtafter 1990); 3, Old Residential Land (built before 1990); 4, Commercial and PublicFacilities Land; 5, Road; 6, Land under Construction; 7, Park and Public Squares Land;8, Railway).
56 X. Li et al. / Geoderma 192 (2013) 50–58
enterprises of the country. Its gold, silver, copper, lead and zinc prod-ucts were some of the biggest industries in China, in terms of quanti-ty. According to the local environmental protection department,every year the plant discharged 66.8 t of heavy metals into the air,polluting one-fourth of the total area of Shenyang. This suggestedthat Pb, Cu, Zn, Cd and As may come from the same source to a certainextent and that industrial activities contributed greatly to the urbansoil contamination of the region. Although the Shenyang city govern-ment has prioritized the improvement of its environment in recentyears, a long time is still required to completely eliminate pollutionin this area.
There was another pollution hotspot at the northwest corner ofthe study area. This area saw the most pollution of Cr and Hg, andthe second most pollution for Cu, Pb, Zn, and As. Many industrial en-terprises, such as metal casting, nonferrous metals, the chemical in-dustry and leather-making, were located in this area. There werealso some other heavy metal hotspots. This pollution was mainlythe result of industrial processing in the study area. The difference be-tween urban areas influenced by atmospheric deposition and traffic,and the small-scale sites influenced by industrial factors, is evident.The spatial distribution of Zn and Hg were much more heterogeneousthan the other metals. This may be the result of different industrialprocesses. For Cr and Mn, the contamination hotspots were not clear-ly evident, in contrast to other metals. Their concentration patternsalso showed low spatial heterogeneity. This suggested that the con-centration of Cr and Mn may not come from point pollution, such asindustrial activities, and that natural factors such as the soil parentmaterials were also an important heavy metal source.
It was found from the concentration patterns of 8 heavy metalsstudied in the Shenyang Tiexi Industrial District that anthropogenicfactors played an important role in the heavy metal concentrationsof soil, but natural factors were not insignificant, and the effects of thesetwo factors varied.
3.6. Effects of land use on urban soil contamination
The land use pattern is presented in Fig. 3a. The total area of theShenyang Tiexi Industrial District in is 3900 ha. Almost all of thenorthern Tiexi Industrial District is occupied by industrial enterprises,and the southern part is residential. The industrial land and the resi-dential land (both built before and after 1990) were the two mostdominant land use types and occupied 26.55% and 27.29% of thetotal area, respectively (Fig. 3b). The land under construction in thenorthern part was from industrial plants and factories that closed ormoved out of the city. There are numerous ways in which the landthat was used for industrial purposes may have become contaminat-ed. In most industrial manufacturing processes, the delivery, storageand handling of raw materials, the manufacturing process itself, andthe disposal of wastes are the three main stages that may result incontamination (Syms, 2004). Contamination from industrial activitiesmay also be dispersed by air and water, resulting in contaminantsbeing spread over a much wider area than the manufacturing site it-self. Not only were most of the contaminated hotspots found in theindustrial area of the Tiexi Industrial District, but much of the residen-tial area was also heavily polluted by metals such as Pd, Cu, Zn, Cd andHg.
The Tiexi Industrial District has a well-developed road system asshown in Fig. 3(a), and the land area for roads was up to 16% of thetotal area. Because of the transportation of raw materials and indus-trial products, busy traffic is an important characteristic of industrialareas. Traffic pollution was also an important source of heavy metalsin the study area.
There were three large parks and a north–south green belt in thestudy area. The concentrations of heavy metals in this area were notvery high, partly because the park was located in the middle of thewestern edge and the green belt was built after 2000; the heavy metals
did not accumulate in the new soils for as long as in the industrial land.To some extent, the parks and green belts could have reduced the spreadand expansion of heavy metals from the source to other areas.
To quantify the effects of land use on urban soil contamination, theestimated concentration map of heavy metals was overlaid with anurban land use map; then, the distribution of different concentrationlevels of metals in different land use types were calculated as showedin Table 6. This overlay showed that 86.70% of the Tiexi Industrial Dis-trict had concentrations of Pb higher than 50 mg/kg, 91.51% of thearea had concentrations of Cu higher than 60 mg/kg, 70% of the areahad concentrations of Zn higher than 200 mg/kg, 91.5% of the areahad concentrations of Cd higher than 0.5 mg/kg, and 77.57% of thearea had concentrations of Hg higher than 0.3 mg/kg. These data indi-cate that much of the urban area was heavily contaminated by Pb, Cu,Zn, Cd and Hg.
Regarding land use contamination, industrial land was the mostcontaminated followed by construction lands and then by roads.For example, of the land area with a concentration of Pb greaterthan 250 mg/kg, 46.06% of the land was industrial, 31.99% was landunder construction, and 11.55% was roads. The high concentration

Table 6Relationship between the distribution area of different concentration levels of metals in soil and land use types.
Concentrations ofmetals (mg/kg)
Area of land use types (ha)
1 2 3 4 5 6 7 8 Total
Pb b20 4.71 8.22 9.94 1.75 4.18 4.45 0.00 9.78 43.0320–50 26.03 64.32 140.76 67.94 102.93 47.31 16.15 9.81 475.2550–100 211.41 162.52 304.97 142.77 209.84 94.24 117.45 30.08 1273.28100–150 318.03 121.18 136.97 85.37 170.27 139.58 85.47 14.70 1071.57150–250 294.58 53.41 36.39 31.36 87.11 75.98 52.86 12.56 644.25250–450 122.79 17.6 1.86 8.84 28.20 86.67 3.16 2.06 271.18>450 57.24 4.45 1.04 1.63 16.96 38.36 0.00 0.00 119.68
Cu b20 0.00 0.00 0.00 0.00 0.00 0.00 0.00 0.00 0.0020–40 0.00 0.00 0.00 0.00 0.00 0.00 0.00 0.00 0.0040–60 7.53 46.79 115.67 48.57 63.17 32.94 12.22 4.04 330.9360–80 81.07 95.44 249.38 120.79 157.34 58.89 36.86 15.76 815.5480–100 287.03 142.23 174.89 76.42 203.84 137.84 132.82 36.53 1191.60100–150 508.47 137.58 89.31 85.47 159.52 154.12 91.81 20.92 1247.20>150 150.69 9.66 2.67 8.42 35.62 102.80 1.38 1.76 313.00
Cr b50 0.00 0.00 0.00 0.00 0.00 0.00 0.00 0.00 0.0050–55 2.12 4.52 2.86 1.33 0.36 0.33 1.62 0.86 14.0055–60 41.03 25.32 46.78 13.46 29.50 25.72 6.84 2.57 191.2160–65 250.35 175.30 303.19 115.41 251.64 198.95 132.00 14.35 1441.1965–70 289.59 202.25 258.32 185.44 277.80 150.98 89.28 27.99 1481.6570–90 426.75 24.31 20.61 24.03 59.09 84.86 42.23 30.41 712.27>90 24.96 0.00 0.16 0.00 1.11 25.76 3.12 2.82 57.93
Zn b100 0.20 3.63 1.09 1.01 2.64 0.76 0.73 0.00 10.06100–200 102.76 157.87 283.70 172.86 218.82 95.27 104.01 26.48 1161.78200–300 606.97 183.72 277.49 128.72 285.07 203.99 126.90 37.16 1850.01300–400 244.60 74.89 66.60 34.14 89.99 136.99 26.28 14.49 687.98400–500 56.31 10.15 1.98 1.30 15.80 44.27 8.77 0.59 139.18500–600 16.58 1.22 0.10 0.00 3.98 2.32 4.91 0.28 29.40>600 7.38 0.20 0.96 1.63 3.19 3.01 3.49 0.00 19.86
Mn b500 0.00 5.81 9.95 1.92 7.74 5.15 9.68 0.11 40.36500–550 38.90 20.12 87.82 10.21 61.89 58.63 77.42 3.68 358.66550–600 201.51 52.75 103.57 38.55 84.47 88.76 37.42 8.19 615.21600–650 426.14 119.46 133.78 74.89 146.87 151.04 57.31 24.14 1133.63650–700 269.78 166.82 217.36 165.65 235.34 159.37 58.68 16.36 1289.35700–800 98.47 66.74 79.45 48.46 82.96 23.64 34.29 26.53 460.54>800 0.00 0.00 0.00 0.00 0.24 0.00 0.28 0.00 0.52
Cd b0.1 0.00 0.00 0.00 0.00 0.00 0.00 0.00 0.00 0.000.1–0.5 15.71 48.12 93.93 75.13 69.05 17.87 8.54 2.93 331.290.5–1.0 329.87 187.80 358.80 154.00 265.61 126.23 99.98 34.02 1556.291.0–1.5 383.63 116.06 118.92 66.99 156.22 133.85 123.96 35.72 1135.341.5–2.0 130.98 21.27 51.67 21.32 62.24 80.74 36.02 6.34 410.582.0–4.0 110.76 53.83 7.56 20.19 48.95 88.06 6.59 0.00 335.94>4.0 63.84 4.61 1.04 2.06 17.43 39.85 0.00 0.00 128.83
As b15 0.00 1.38 0.32 0.00 0.00 0.98 0.00 4.45 7.1315–20 267.94 173.56 357.32 126.61 250.44 121.13 123.19 28.66 1448.8620–25 342.85 135.81 148.13 97.55 175.74 136.33 123.67 27.74 1187.8125–30 121.80 76.02 51.02 54.31 73.05 78.26 18.34 9.03 481.8330–40 178.55 28.83 74.06 49.93 87.95 91.04 4.66 5.20 520.2140–50 118.83 16.09 1.08 11.27 31.55 58.63 5.23 3.93 246.60>50 4.83 0.00 0.00 0.00 0.77 0.23 0.00 0.00 5.83
Hg b0.2 5.24 15.95 45.35 16.90 28.68 5.21 1.97 3.40 122.70.2–0.3 187.88 69.73 146.35 76.99 137.41 61.47 53.48 18.53 751.840.3–0.4 362.90 196.41 284.76 139.06 233.28 151.98 115.57 32.43 1516.390.4–0.5 232.57 107.55 115.29 77.56 138.58 111.26 79.56 13.99 876.360.5–0.6 119.36 39.92 36.16 18.03 62.06 118.88 13.91 2.85 411.170.6–0.7 43.40 2.12 3.83 8.05 12.16 14.48 3.62 2.10 89.76>0.7 83.44 0.00 0.20 3.08 7.32 23.32 6.97 5.71 130.04
(1, Industrial Land; 2, New Residential Land (built after 1990); 3, Old Residential Land (built before 1990); 4, Commercial and Public Facilities Land; 5, Road; 6, Land underConstruction; 7, Park and Public Squares Land; 8, Railway.)
57X. Li et al. / Geoderma 192 (2013) 50–58
distribution of Cu, Zn, Cd, As and Hg also followed this trend. Althoughmany heavily polluting factories and plants had closed or moved out ofthe urban areas nearly 10 years ago, historic pollution is still a seriousissue in old industrial areas. It is a difficult process to remediate contam-inated urban soil. At the same time, the contribution of urban traffic tourban soil contamination is underestimated.
4. Conclusion
This study investigated heavy metal soil concentrations of theTiexi Industrial District, east of Shenyang in China. The results showed
high values of Pb, Cu, Zn, Cd andHg and revealed the impact of industrialand anthropogenic activities on heavy metal accumulation in the soil ofthe study area. There are many hotspots contaminated with Pb, Cu, Zn,Cd and Hg caused by nearly a hundred years of intensive uncontrolleddischarge of effluents, resulting from the abundance of industries, suchas smelting plants. The distributions of the Pb and Cu concentrationsshowed a very similar spatial pattern. Mn, Cr and As soil contaminationlevels are relatively low. The Kriging maps of metal concentration indi-cated that almost all of the areas in the Tiexi Industrial District werepolluted by heavy metals and that the high concentrations of Pb, Cu,Zn, Cd and Hg were not only distributed in industrial areas, but were

58 X. Li et al. / Geoderma 192 (2013) 50–58
also widely distributed in residential areas and parks. This study clearlyhighlights the urgent need to make a concerted effort to control indus-trial emissions and to remediate heavily polluted urban soils.
Acknowledgements
This study was financed by the National Natural Science Foundationof China (no. 40830746 and 40971272).
References
Cambardella, C.A., Moorman, T.B., Novak, J.M., Parkein, T.B., Karlen, D.L., Turco, R.F.,Konopka, A.E., 1994. Field-scale variability of soil properties in Central Iowa soils.Soil Science Society of America Journal 58, 1501–1511.
Chen, J.S., Wei, F.S., Zheng, C.J., Wu, Y.Y., Adriano, D.C., 1991. Background concentra-tions of elements in soils of China. Water, Air, and Soil Pollution 57–58, 699–712.
Chen, T., Zheng, Y., Lei, M., Huang, Z., Wu, H., Chen, H., Fan, K., Yu, K., Wu, X., Tian, Q.,2005. Assessment of heavy metal pollution in surface soils of urban parks in Beijing,China. Chemosphere 60, 542–551.
Chen, X., Xia, X.H., Zhao, Y., Zhang, P., 2010. Heavy metal concentrations in roadsidesoils and correlation with urban traffic in Beijing, China. Journal of HazardousMaterials 181, 640–646.
China National Environmental Monitoring Center, 1990. The Background Concentra-tions of Soil Elements of China. China Environmental Science Press, Beijing.
De Kimpe, C.R., Morel, J.L., 2000. Urban soil management: a growing concern. Soil Science165, 31–40.
Duzgoren-Aydin, N.S., Wong, C.S.C., Aydin, A., Song, Z., You, M., Li, X.D., 2006. Heavymetal contamination and distribution in the urban environment of Guangzhou,SE China. Environmental Geochemistry and Health 28, 375–391.
Facchinelli, A., Sacchi, E., Mallen, L., 2001. Multivariate statistical and GISbased ap-proach to identify heavy metal sources in soils. Environmental Pollution 114,313–324.
Gallagher, F.J., Pechmann, I., Bogden, J.D., Grabosky, J., Weis, P., 2008. Soil metal concen-trations and vegetative assemblage structure in an urban brownfield. Environmen-tal Pollution 153, 351–361.
Han, Y., Du, P., Cao, J., Posmentier, E.S., 2006. Multivariate analysis of heavy metal con-tamination in urban dusts of Xi'an, Central China. Science of the Total Environment355, 176–186.
Imperato, M., Adamo, P., Naimo, D., Arienzo, M., Stanzione, D., Violante, P., 2003. Spatialdistribution of heavy metals in urban soils of Naples city (Italy). EnvironmentalPollution 124, 247–256.
Kan, H.D., 2009. Environment and Health in China: Challenges and Opportunities. En-vironmental Health Perspectives 117, A530–A.
Li, F.Y., Fan, Z.P., Xiao, P.F., Oh, K., Ma, X.P., Hou, W., 2009a. Contamination, chemicalspeciation and vertical distribution of heavy metals in soils of an old and largeindustrial zone in Northeast China. Environmental Geology 57, 1815–1823.
Li, J.L., He, M., Han, W., Gu, Y.F., 2009b. Analysis and assessment on heavy metal sourcesin the coastal soils developed from alluvial deposits using multivariate statisticalmethods. Journal of Hazardous Materials 164, 976–981.
Li, X.Y., Liu, L.J., Wang, Y.G., Luo, G.P., Chen, X., Yang, X.L., Gao, B., He, X.Y., 2012. In-tegrated assessment of heavy metal contamination in sediments from a coastalindustrial basin, NE China. PLoS One 7 (6), e39690 http://dx.doi.org/10.1371/journal.pone.0039690.
Lu, Y., Gong, Z., Zhang, G., Burghardt, W., 2003. Concentrations and chemical specia-tions of Cu, Zn, Pb and Cr of urban soils in Nanjing, China. Geoderma 115, 101–111.
Lu, X.W., Wang, L.J., Lei, K., Huang, J., Zhai, Y.X., 2009. Contamination assessment ofcopper, lead, zinc, manganese and nickel in street dust of Baoji, NW China. Journalof Hazardous Materials 161, 1058–1062.
Meuser, H., 2010. Contaminated Urban Soils. Springer, pp. 17–27.Millward, G.E., Turner, A., 2001. Metal pollution. In: Steele, J.H., Turekian, K.K., Thorpe,
S.A. (Eds.), Encyclopedia of Ocean Sciences. Academic Press, pp. 1730–1737.Norra, S., Weber, A., Kramar, U., Sttiben, D., 2001. Mapping of tracemetals in urban soils: the
example o f Muhlburg/Karlsruhe, Germany. Journal of Soils and Sediments 1, 77–97.Nriagu, J.O., Pacyna, J.M., 1988. Quantitative assessment of worldwide contamination of
air, water and soils by trace metals. Nature 333, 134–139.Pichtel, J., Sawyer, H.T., Czarnowska, K., 1997. Spatial and temporal distribution of
metals in soils in Warsaw, Poland. Environmental Pollution 98, 169–174.Pouyat, R.V., Yesilonis, I.D., Russell-Anelli, J., Neerchal, N.K., 2007. Soil chemical and
physical properties that differentiate urban land-use and cover types. Soil ScienceSociety of America Journal 71, 1010–1019.
Saito, H., Goovaerts, P., 2000. Geostatistical interpolation of positively skewed and cen-sored data in a dioxin-contaminated site. Environmental Science & Technology 34,4228–4235.
Shi, G., Chen, Z., Xu, S., Zhang, J., Wang, L., Bi, C., Teng, J., 2008. Potentially toxic metalcontamination of urban soils and roadside dust in Shanghai, China. EnvironmentalPollution 156, 251–260.
Syms, P., 2004. Previously Developed Land: Industrial Activities and Contamination,2nd ed. Blackwell Publishing Ltd., Oxford.
Taylor, K.G., Owens, P.N., 2009. Sediments in urban river basins: a review of sediment–contaminant dynamics in an environmental system conditioned by human activities.Journal of Soils and Sediments 9, 281–303.
Tiller, K.G., 1992. Urban soil contamination in Australia. Australian Journal of Soil Re-search 30, 937–957.
Wang, J., Chen, Z.L., Sun, X.J., Shi, G.T., Xu, S.Y., Wang, D.Q., Wang, L., 2009. Quantitativespatial characteristics and environmental risk of toxic heavy metals in urban dustsof Shanghai, China. Environmental Earth Sciences 59, 645–654.
Wei, B.G., Yang, L.S., 2010. A review of heavy metal contaminations in urban soils, urbanroad dusts and agricultural soils from China. Microchemical Journal 94, 99–107.
Wei, B.G., Jiang, F.Q., Li, X.M., Mu, S.Y., 2010. Heavy metal induced ecological risk in thecity of Urumqi, NW China. Environmental Monitoring and Assessment 160, 33–45.
Wong, C.S.C., Li, X., Thornton, I., 2006. Urban environmental geochemistry of tracemetals. Environmental Pollution 142, 1–16.
Yesilonis, I.D., Pouyat, R.V., Neerchal, N.K., 2008. Spatial distribution of metals in soils inBaltimore, Maryland: Role of native parent material, proximity to major roads,housing age and screening guidelines. Environmental Pollution 156, 723–731.