healthy homes issues: residential assessment...esidential ssessment page i healthy homes issues:...
TRANSCRIPT
page iResidential Assessment
Healthy Homes Issues:
Residential Assessment
July 2012
U.S. Department of Housing and Urban DevelopmentOffice of Healthy Homes and Lead Hazard Control

page ii Residential Assessment
page iiiResidential Assessment
Prepared for: U.S. Department of Housing and Urban Development (HUD), Office of Healthy Homes and Lead Hazard Control (OHHLHC), Washington, DC 20410
This and previous versions of the document were prepared by:Peter Ashley, DrPH, HUD OHHLHCJ. Kofi Berko, PhD, HUD OHHLHCJill Breysse, MS, CIH, National Center for Healthy Housing Jackson Anderson, Jr., Healthy Housing Solutions, Inc.Joanna Gaitens, PhD, Healthy Housing Solutions, Inc.John R. Menkedick, MS, BattelleMaureen A. Wooton, MS, Battelle
Contracts No. C-OPC-21357, No. C-PHI-00931 and No. C-PHI-01067
Acknowledgements We thank the following individuals for their helpful comments and information used in preparation of this and previous versions of the document:
Healthy Homes Issues:
Residential AssessmentVERSION 3—July 2012
Gary Adamkiewicz, PhD Senior Research Scientist Harvard School of Public Health
Kevin Kennedy, MPH, CIEC Managing Director Center for Environmental Health, Children’s Mercy Hospitals and Clinics
John Adgate, PhD Division of Environmental Health Sciences, University of Minnesota School of Public Health
Terrance M. Allan, MPH Cuyahoga County (Ohio) Board of Health
Asa Bradman, PhD Center for Children’s Environmental Health Research, School of Public Health, University of California, Berkeley
Martin D. Chapman, PhD INDOOR Biotechnologies, Inc.
Kevin Fearn, Senior Statistics Associate Research and Statistics Department, National Safety Council
Peter Gergen, MD Department of Health and Human Services, Agency for Healthcare Research and Quality
Stuart Greenberg, Executive Director Environmental Health Watch
Murray L. Katcher, MD, PhD Department of Pediatrics, Department of Family Medicine, University of Wisconsin Medical School
J. David Miller, PhD Department of Chemistry, Carleton University
Sarah J. Olsen, MS, CHES Julie Gilchrist, MD Judy Stevens, PhD Center for Injury Prevention and Control, Centers for Disease Control and Prevention
Gurumurthy Ramachandram, PhD Division of Environmental Health Sciences, University of Minnesota School of Public Health

page iv Residential Assessment
page vResidential Assessment
PrefaceIn 1998, Congress appropriated funds and directed the U.S. Department of Housing and Urban Development (HUD) to “develop and implement a program of research and demonstration projects that would address multiple housing-related problems affecting the health of children.” In response, HUD solicited the advice of experts in several disciplines and developed a preliminary plan for the Healthy Homes Initiative (HHI). The primary goal of the HHI is to protect children from housing conditions that are responsible for multiple diseases and injuries. As part of this initiative, HUD has prepared a series of papers to provide background information to their current HHI grantees, as well as other programs considering adopting a healthy homes approach. This background paper focuses on residential hazard assessment, and provides a brief overview of the current status of knowledge on:
•• Integrated assessment of residential hazards
•• Current methods and models for assessing residential hazards
•• Research needs in the field of residential hazard assessment.
Please send all comments to: [email protected]
HUD, OHHLHC Fax: 202–755–1000

page vi Residential Assessment
page viiResidential Assessment
ContentsAcronyms and Abbreviations ............................................................................. page 1
Summary and Relevance to Healthy Homes Programs ................. page 3
1.0 Overview of Methods and Tools for Assessing Residential Hazards ............................................................................................page 7 1.1 Assessment Tools Organized by Health Outcome ................................................ page 7 1.2 Assessment Tools Organized by Physical Site Components ................................ page 10 1.3 Assessment Tools Organized by Type of Hazard .................................................. page 10 1.3.1 Biological Hazards ........................................................................................ page 10 1.3.1.1 Allergens .......................................................................................... page 10 1.3.1.2 Mold/moisture .................................................................................. page 10 1.3.1.3 Bacterial endotoxins ........................................................................ page 11 1.3.2 Chemical Hazards ......................................................................................... page 11 1.3.2.1 Combustion Gases: CO and NO2 .................................................. page 11 1.3.2.2 Formaldehyde.................................................................................. page 12 1.3.2.3 Lead ................................................................................................. page 13 1.3.2.4 Non-Biological Particulate Matter (PM) .......................................... page 14 1.3.2.5 Pesticides ......................................................................................... page 16 1.3.2.6 Radon ............................................................................................... page 16 1.3.2.7 Secondhand Smoke (SHS) ............................................................... page 17 1.3.2.8 Volatile Organic Chemicals (VOCs) ................................................. page 17 1.3.3 Structural Hazards ........................................................................................ page 18 1.3.3.1 Safety Devices .................................................................................. page 18 1.3.3.2 Heating, Ventilation, and Air Conditioning (HVAC) Systems ......... page 19
2.0 Visual Assessment Tools .............................................................................. page 20 2.1 Healthy Housing Inspection Manual (HHIM) .......................................................... page 20 2.2 Healthy Home Rating System (HHRS)..................................................................... page 24 2.3 EPA Healthy Indoor Environment Protocols for Home Energy Retrofits .............. page 25 2.4 Cincinnati Home Injury Survey ....................................................................................... page 25 2.5 American Society of Testing and Materials (ASTM) D7297-06, Standard Practice for Evaluating Residential Indoor Air Quality Concerns .......................... page 25 2.6 EPA Asthma Home Visit Checklist .......................................................................... page 26 2.7 Pediatric Environmental Home Assessment (PEHA) Survey ................................. page 26
3.0 Occupant Survey Tools .................................................................................. page 26 3.1 Healthy Housing Inspection Manual (HHIM) ................................................................. page 26 3.2 National Health Interview Survey (NHIS) ............................................................... page 26 3.3 SF-8, SF-12, and SF-36 Quality of Life Surveys (Quality Metric 2010) .................. page 29
page viii Residential Assessment
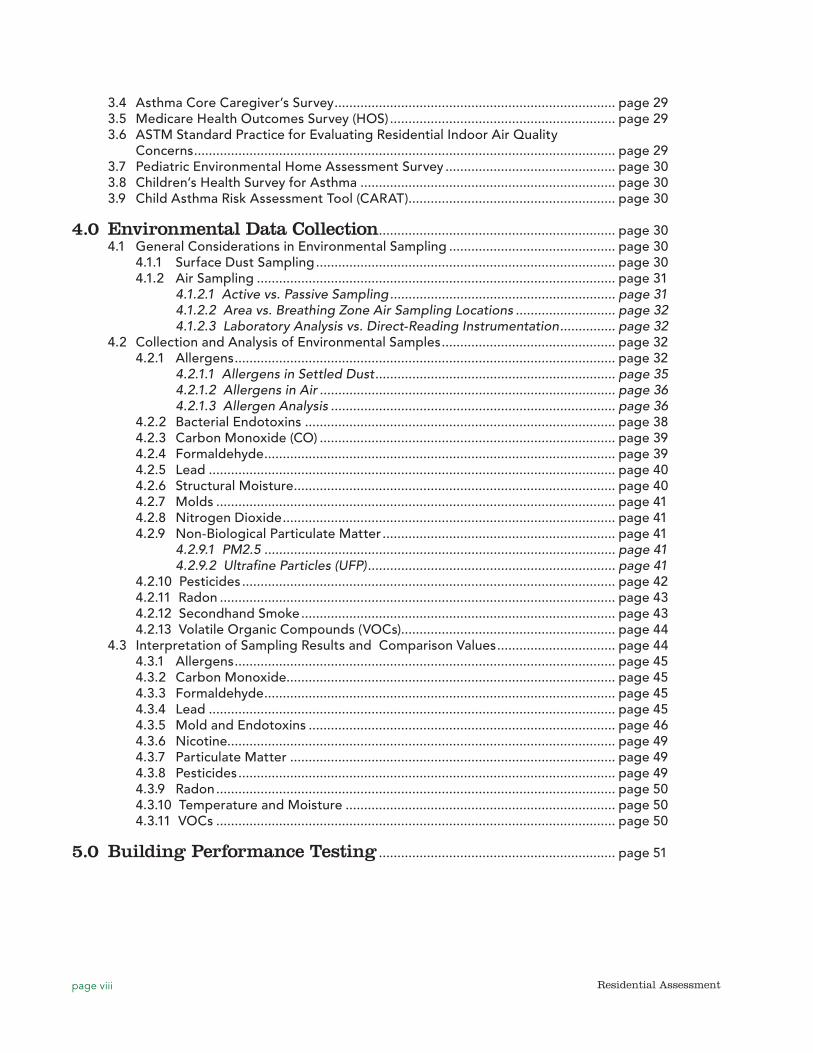
3.4 Asthma Core Caregiver’s Survey ............................................................................ page 29 3.5 Medicare Health Outcomes Survey (HOS) ............................................................. page 29 3.6 ASTM Standard Practice for Evaluating Residential Indoor Air Quality Concerns .................................................................................................................. page 29 3.7 Pediatric Environmental Home Assessment Survey .............................................. page 30 3.8 Children’s Health Survey for Asthma ..................................................................... page 30 3.9 Child Asthma Risk Assessment Tool (CARAT) ........................................................ page 30
4.0 Environmental Data Collection ................................................................ page 30 4.1 General Considerations in Environmental Sampling ............................................. page 30 4.1.1 Surface Dust Sampling ................................................................................. page 30 4.1.2 Air Sampling ................................................................................................. page 31 4.1.2.1 Active vs. Passive Sampling ............................................................. page 31 4.1.2.2 Area vs. Breathing Zone Air Sampling Locations ........................... page 32 4.1.2.3 Laboratory Analysis vs. Direct-Reading Instrumentation ............... page 32 4.2 Collection and Analysis of Environmental Samples ............................................... page 32 4.2.1 Allergens ....................................................................................................... page 32 4.2.1.1 Allergens in Settled Dust ................................................................. page 35 4.2.1.2 Allergens in Air ................................................................................ page 36 4.2.1.3 Allergen Analysis ............................................................................. page 36 4.2.2 Bacterial Endotoxins .................................................................................... page 38 4.2.3 Carbon Monoxide (CO) ................................................................................ page 39 4.2.4 Formaldehyde ............................................................................................... page 39 4.2.5 Lead .............................................................................................................. page 40 4.2.6 Structural Moisture ....................................................................................... page 40 4.2.7 Molds ............................................................................................................ page 41 4.2.8 Nitrogen Dioxide .......................................................................................... page 41 4.2.9 Non-Biological Particulate Matter ............................................................... page 41 4.2.9.1 PM2.5 ............................................................................................... page 41 4.2.9.2 Ultrafine Particles (UFP) ................................................................... page 41 4.2.10 Pesticides ..................................................................................................... page 42 4.2.11 Radon ........................................................................................................... page 43 4.2.12 Secondhand Smoke ..................................................................................... page 43 4.2.13 Volatile Organic Compounds (VOCs).......................................................... page 44 4.3 Interpretation of Sampling Results and Comparison Values ................................ page 44 4.3.1 Allergens ....................................................................................................... page 45 4.3.2 Carbon Monoxide......................................................................................... page 45 4.3.3 Formaldehyde ............................................................................................... page 45 4.3.4 Lead .............................................................................................................. page 45 4.3.5 Mold and Endotoxins ................................................................................... page 46 4.3.6 Nicotine......................................................................................................... page 49 4.3.7 Particulate Matter ........................................................................................ page 49 4.3.8 Pesticides ...................................................................................................... page 49 4.3.9 Radon ............................................................................................................ page 50 4.3.10 Temperature and Moisture ......................................................................... page 50 4.3.11 VOCs ............................................................................................................ page 50
5.0 Building Performance Testing ................................................................ page 51
page ixResidential Assessment
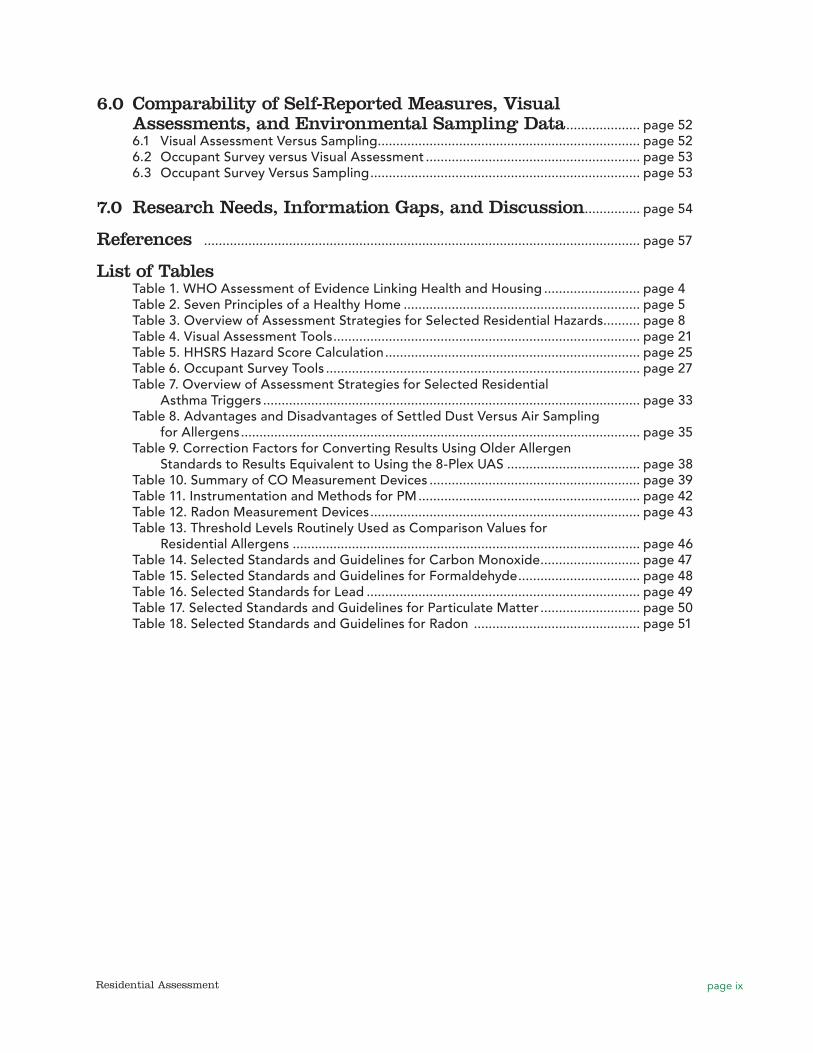
6.0 Comparability of Self-Reported Measures, Visual Assessments, and Environmental Sampling Data .................... page 52 6.1 Visual Assessment Versus Sampling ....................................................................... page 52 6.2 Occupant Survey versus Visual Assessment .......................................................... page 53 6.3 Occupant Survey Versus Sampling ......................................................................... page 53
7.0 Research Needs, Information Gaps, and Discussion............... page 54
References ...................................................................................................................... page 57
List of Tables Table 1. WHO Assessment of Evidence Linking Health and Housing .......................... page 4 Table 2. Seven Principles of a Healthy Home ................................................................ page 5 Table 3. Overview of Assessment Strategies for Selected Residential Hazards.......... page 8 Table 4. Visual Assessment Tools ................................................................................... page 21 Table 5. HHSRS Hazard Score Calculation ..................................................................... page 25 Table 6. Occupant Survey Tools ..................................................................................... page 27 Table 7. Overview of Assessment Strategies for Selected Residential Asthma Triggers ...................................................................................................... page 33 Table 8. Advantages and Disadvantages of Settled Dust Versus Air Sampling for Allergens ............................................................................................................ page 35 Table 9. Correction Factors for Converting Results Using Older Allergen Standards to Results Equivalent to Using the 8-Plex UAS .................................... page 38 Table 10. Summary of CO Measurement Devices ......................................................... page 39 Table 11. Instrumentation and Methods for PM ............................................................ page 42 Table 12. Radon Measurement Devices ......................................................................... page 43 Table 13. Threshold Levels Routinely Used as Comparison Values for Residential Allergens .............................................................................................. page 46 Table 14. Selected Standards and Guidelines for Carbon Monoxide ........................... page 47 Table 15. Selected Standards and Guidelines for Formaldehyde ................................. page 48 Table 16. Selected Standards for Lead .......................................................................... page 49 Table 17. Selected Standards and Guidelines for Particulate Matter ........................... page 50 Table 18. Selected Standards and Guidelines for Radon ............................................. page 51

page x Residential Assessment
page 1Residential Assessment
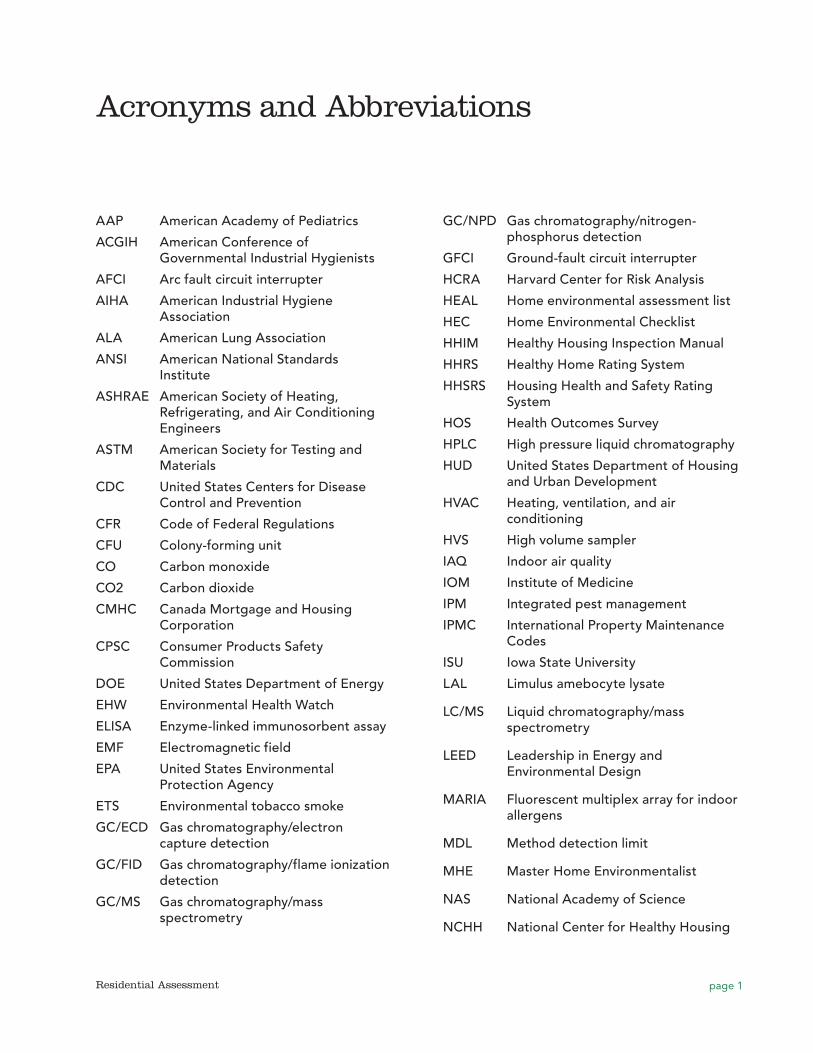
Acronyms and Abbreviations
AAP American Academy of Pediatrics
ACGIH American Conference of Governmental Industrial Hygienists
AFCI Arc fault circuit interrupter
AIHA American Industrial Hygiene Association
ALA American Lung Association
ANSI American National Standards Institute
ASHRAE American Society of Heating, Refrigerating, and Air Conditioning Engineers
ASTM American Society for Testing and Materials
CDC United States Centers for Disease Control and Prevention
CFR Code of Federal Regulations
CFU Colony-forming unit
CO Carbon monoxide
CO2 Carbon dioxide
CMHC Canada Mortgage and Housing Corporation
CPSC Consumer Products Safety Commission
DOE United States Department of Energy
EHW Environmental Health Watch
ELISA Enzyme-linked immunosorbent assay
EMF Electromagnetic field
EPA United States Environmental Protection Agency
ETS Environmental tobacco smoke
GC/ECD Gas chromatography/electron capture detection
GC/FID Gas chromatography/flame ionization detection
GC/MS Gas chromatography/mass spectrometry
GC/NPD Gas chromatography/nitrogen- phosphorus detection
GFCI Ground-fault circuit interrupter
HCRA Harvard Center for Risk Analysis
HEAL Home environmental assessment list
HEC Home Environmental Checklist
HHIM Healthy Housing Inspection Manual
HHRS Healthy Home Rating System
HHSRS Housing Health and Safety Rating System
HOS Health Outcomes Survey
HPLC High pressure liquid chromatography
HUD United States Department of Housing and Urban Development
HVAC Heating, ventilation, and air conditioning
HVS High volume sampler
IAQ Indoor air quality
IOM Institute of Medicine
IPM Integrated pest management
IPMC International Property Maintenance Codes
ISU Iowa State University
LAL Limulus amebocyte lysate
LC/MS Liquid chromatography/mass spectrometry
LEED Leadership in Energy and Environmental Design
MARIA Fluorescent multiplex array for indoor allergens
MDL Method detection limit
MHE Master Home Environmentalist
NAS National Academy of Science
NCHH National Center for Healthy Housing
page 2 Residential Assessment
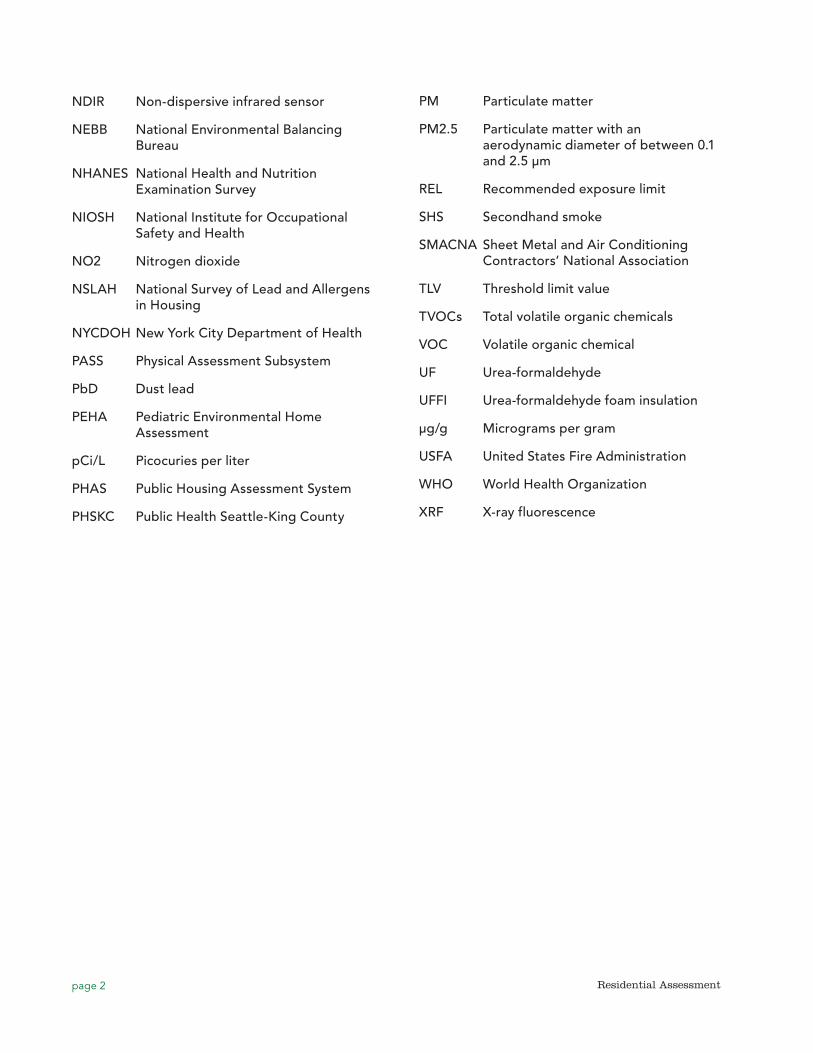
NDIR Non-dispersive infrared sensor
NEBB National Environmental Balancing Bureau
NHANES National Health and Nutrition Examination Survey
NIOSH National Institute for Occupational Safety and Health
NO2 Nitrogen dioxide
NSLAH National Survey of Lead and Allergens in Housing
NYCDOH New York City Department of Health
PASS Physical Assessment Subsystem
PbD Dust lead
PEHA Pediatric Environmental Home Assessment
pCi/L Picocuries per liter
PHAS Public Housing Assessment System
PHSKC Public Health Seattle-King County
PM Particulate matter
PM2.5 Particulate matter with an aerodynamic diameter of between 0.1 and 2.5 µm
REL Recommended exposure limit
SHS Secondhand smoke
SMACNA Sheet Metal and Air Conditioning Contractors’ National Association
TLV Threshold limit value
TVOCs Total volatile organic chemicals
VOC Volatile organic chemical
UF Urea-formaldehyde
UFFI Urea-formaldehyde foam insulation
µg/g Micrograms per gram
USFA United States Fire Administration
WHO World Health Organization
XRF X-ray fluorescence
page 3Residential Assessment
Summary and Relevance to Healthy Homes Program
•• Broadening the scope of single-issue public health and safety programs-such as childhood lead poisoning prevention, residential asthma intervention, and injury prevention-to adopt a holistic approach addressing multiple housing deficiencies that affect health and safety.
•• Building the competency among environmental public health practitioners, public health nurses, housing specialists, housing owners, housing managers, and others who work in the community so they can incorporate healthy housing activities into their professional activities.
•• Through cross-disciplinary funding, developing national health homes capacity to conduct research and demonstrate low-cost, effective home hazard assessment and intervention methods.
This “one-touch” approach to finding and correcting hazards in homes moves away from categorical approaches that may address one or more hazards in a home while ignoring or worsening other hazards. The push towards integration of weatherization and health is a prime example of this movement. Kuholski et al. (2010) noted that, without an integrated approach, many conventional energy upgrades, which “tighten” a home without considering outside air exchange, may unintentionally harm resident health by worsening indoor air quality (IAQ) and increasing respiratory risk factors. Air-sealing and changing the home’s pressure dynamics can trap harmful gases such as radon, while insulating walls and repairing window seals can disturb lead-based paint (LBP). Kuholski goes on to note that energy retrofits may overlook simple, low-cost interventions such as reducing water heater temperatures to 120 ,̊ which can reduce scalding hazards while saving energy, or fixing broken downspouts and gutters, which can address moisture and mold issues.
Programs such as the Weatherization Plus Health Program, initiated by the Opportunity Council
This background paper addresses the assessment of all types of hazards that may exist in homes, including biological, chemical, physical, structural, and behavioral. It introduces the reader to methods to assess for health and safety hazards, and discusses widely available visual assessment, resident interview, environmental data collection, and building performance testing resources that can be used alone or in concert to assess these hazards. Further, the paper captures information from key scientific papers to help the reader understand the current “state of the art” in residential assessment.
When possible, the paper will distinguish between assessment methods that are more useful to health and housing practitioners from those that are more useful to environmental researchers. The rigor involved in assessing hazards in a research setting generally surpasses that needed for public health use. Health and housing practitioners need residential assessments that are sufficient to identify home hazards but not so costly that no money is left to mitigate those hazards.
Other HUD background papers comprehensively focus on asthma, CO, green buildings, injury, mold, and pesticides (HUD 2010a-f). Therefore, where appropriate, the reader is referred to these documents for detailed discussion on these topics.
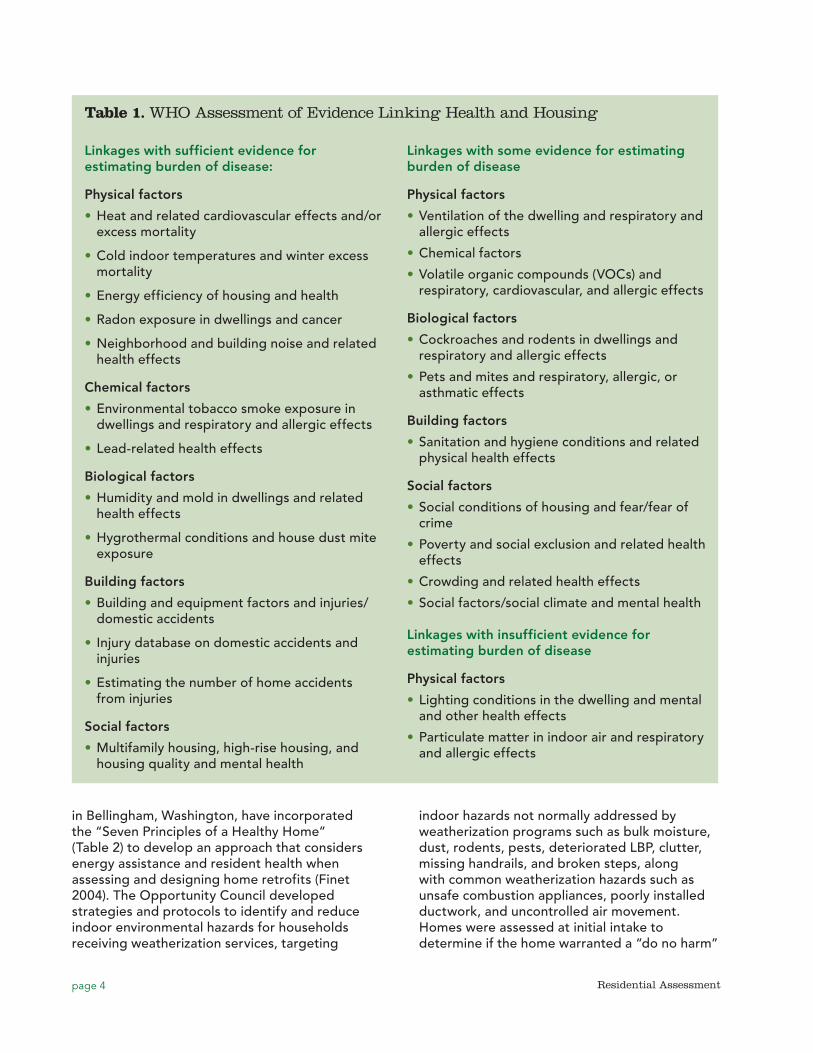
Scientific research has long established that residential hazards have a significant impact on public health (Meyer 2010). In 2006, the World Health Organization (WHO) noted 13 housing risk factors with sufficient evidence to estimate the associated disease burden, while noting that 12 other housing risk factors had some or insufficient evidence of a link with disease (Table 1) (WHO 2006 as cited in Jacobs 2009).
As noted in CDC/HUD (2008), in recent years, there has been a drive to develop a holistic approach to healthy housing based on:
page 4 Residential Assessment
Table 1. WHO Assessment of Evidence Linking Health and Housing
Linkages with sufficient evidence for estimating burden of disease:
Physical factors
•• Heat and related cardiovascular effects and/or excess mortality
•• Cold indoor temperatures and winter excess mortality
•• Energy efficiency of housing and health
•• Radon exposure in dwellings and cancer
•• Neighborhood and building noise and related health effects
Chemical factors
•• Environmental tobacco smoke exposure in dwellings and respiratory and allergic effects
•• Lead-related health effects
Biological factors
•• Humidity and mold in dwellings and related health effects
•• Hygrothermal conditions and house dust mite exposure
Building factors
•• Building and equipment factors and injuries/domestic accidents
•• Injury database on domestic accidents and injuries
•• Estimating the number of home accidents from injuries
Social factors
•• Multifamily housing, high-rise housing, and housing quality and mental health
Linkages with some evidence for estimating burden of disease
Physical factors
•• Ventilation of the dwelling and respiratory and allergic effects
•• Chemical factors
•• Volatile organic compounds (VOCs) and respiratory, cardiovascular, and allergic effects
Biological factors
•• Cockroaches and rodents in dwellings and respiratory and allergic effects
•• Pets and mites and respiratory, allergic, or asthmatic effects
Building factors
•• Sanitation and hygiene conditions and related physical health effects
Social factors
•• Social conditions of housing and fear/fear of crime
•• Poverty and social exclusion and related health effects
•• Crowding and related health effects
•• Social factors/social climate and mental health
Linkages with insufficient evidence for estimating burden of disease
Physical factors
•• Lighting conditions in the dwelling and mental and other health effects
•• Particulate matter in indoor air and respiratory and allergic effects
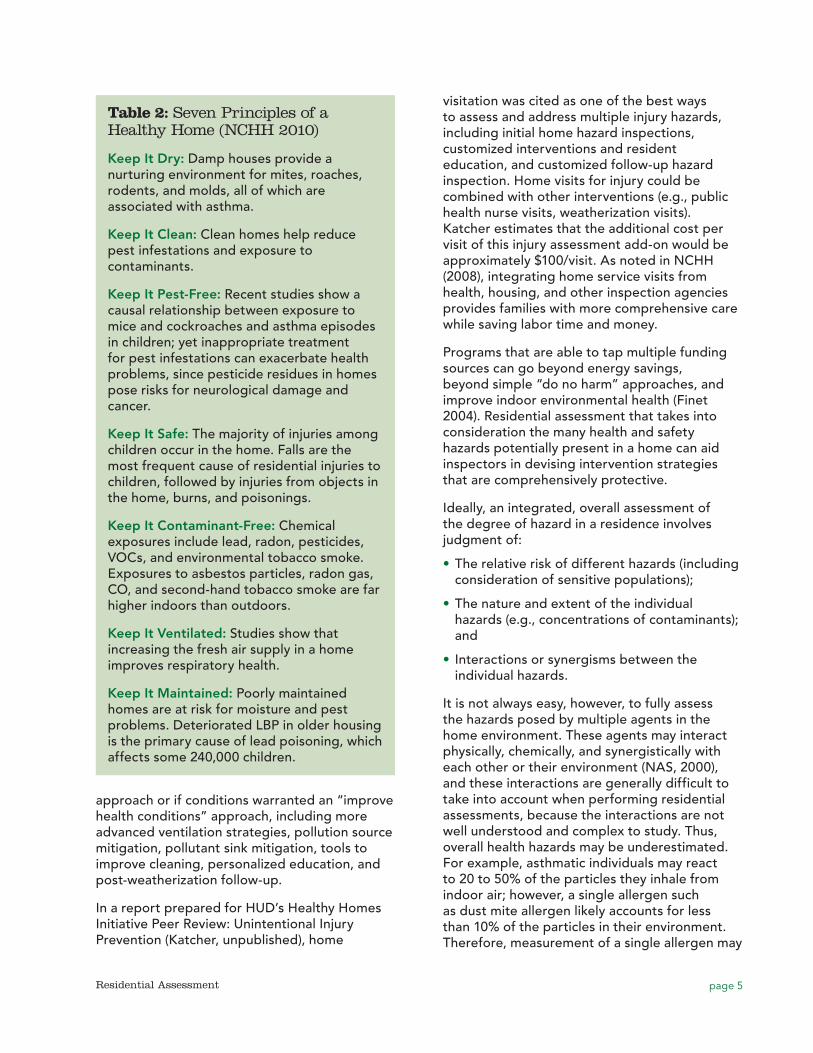
in Bellingham, Washington, have incorporated the “Seven Principles of a Healthy Home” (Table 2) to develop an approach that considers energy assistance and resident health when assessing and designing home retrofits (Finet 2004). The Opportunity Council developed strategies and protocols to identify and reduce indoor environmental hazards for households receiving weatherization services, targeting
indoor hazards not normally addressed by weatherization programs such as bulk moisture, dust, rodents, pests, deteriorated LBP, clutter, missing handrails, and broken steps, along with common weatherization hazards such as unsafe combustion appliances, poorly installed ductwork, and uncontrolled air movement. Homes were assessed at initial intake to determine if the home warranted a “do no harm”
page 5Residential Assessment
approach or if conditions warranted an “improve health conditions” approach, including more advanced ventilation strategies, pollution source mitigation, pollutant sink mitigation, tools to improve cleaning, personalized education, and post-weatherization follow-up.
In a report prepared for HUD’s Healthy Homes Initiative Peer Review: Unintentional Injury Prevention (Katcher, unpublished), home
Table 2: Seven Principles of a Healthy Home (NCHH 2010)
Keep It Dry: Damp houses provide a nurturing environment for mites, roaches, rodents, and molds, all of which are associated with asthma.
Keep It Clean: Clean homes help reduce pest infestations and exposure to contaminants.
Keep It Pest-Free: Recent studies show a causal relationship between exposure to mice and cockroaches and asthma episodes in children; yet inappropriate treatment for pest infestations can exacerbate health problems, since pesticide residues in homes pose risks for neurological damage and cancer.
Keep It Safe: The majority of injuries among children occur in the home. Falls are the most frequent cause of residential injuries to children, followed by injuries from objects in the home, burns, and poisonings.
Keep It Contaminant-Free: Chemical exposures include lead, radon, pesticides, VOCs, and environmental tobacco smoke. Exposures to asbestos particles, radon gas, CO, and second-hand tobacco smoke are far higher indoors than outdoors.
Keep It Ventilated: Studies show that increasing the fresh air supply in a home improves respiratory health.
Keep It Maintained: Poorly maintained homes are at risk for moisture and pest problems. Deteriorated LBP in older housing is the primary cause of lead poisoning, which affects some 240,000 children.
visitation was cited as one of the best ways to assess and address multiple injury hazards, including initial home hazard inspections, customized interventions and resident education, and customized follow-up hazard inspection. Home visits for injury could be combined with other interventions (e.g., public health nurse visits, weatherization visits). Katcher estimates that the additional cost per visit of this injury assessment add-on would be approximately $100/visit. As noted in NCHH (2008), integrating home service visits from health, housing, and other inspection agencies provides families with more comprehensive care while saving labor time and money.
Programs that are able to tap multiple funding sources can go beyond energy savings, beyond simple “do no harm” approaches, and improve indoor environmental health (Finet 2004). Residential assessment that takes into consideration the many health and safety hazards potentially present in a home can aid inspectors in devising intervention strategies that are comprehensively protective.
Ideally, an integrated, overall assessment of the degree of hazard in a residence involves judgment of:
•• The relative risk of different hazards (including consideration of sensitive populations);
•• The nature and extent of the individual hazards (e.g., concentrations of contaminants); and
•• Interactions or synergisms between the individual hazards.
It is not always easy, however, to fully assess the hazards posed by multiple agents in the home environment. These agents may interact physically, chemically, and synergistically with each other or their environment (NAS, 2000), and these interactions are generally difficult to take into account when performing residential assessments, because the interactions are not well understood and complex to study. Thus, overall health hazards may be underestimated. For example, asthmatic individuals may react to 20 to 50% of the particles they inhale from indoor air; however, a single allergen such as dust mite allergen likely accounts for less than 10% of the particles in their environment. Therefore, measurement of a single allergen may
page 6 Residential Assessment
underestimate the total allergen load by two- to five-fold (O’Meara and Tovey, 2000).
There have been efforts to characterize the relative importance of individual home hazards in an overall residential assessment. In a 1998 study that focused on model approaches for ranking relative risk in the home, researchers at the Harvard Center for Risk Analysis (HCRA) comparatively ranked ten home hazards covered in the popular media at the time of the study on the basis of the weight of scientific evidence, the number of Americans who might die each year (assuming the hazard is real), and the annual chance of premature fatality for highly susceptible populations (HCRA 1998). Nonfatal effects were not considered, and mold was not one of the top 10 because it was not prominent in the media at the time, and mold generally does not pose mortality hazards. The resulting ranking, from highest to lowest perceived risk, was:
1. Radon gas
2. Falling
3. Poisoning
4. Fires and burns
5. Suffocation
6. Firearms
7. Secondhand smoke
8. Formaldehyde gas
9. Insulation fibers
10. Electric and magnetic fields from power lines
The researchers noted that public perceptions of home risks often differ significantly from what evidence suggests are the true home risks, emphasizing the importance of strong educational interventions for residents. However, a severe limitation of this study, as acknowledged by the researchers, was the exclusion of non-fatal effects, which would have provided a more complete understanding of overall risks.
More recently, Logue et al. (2010) compiled results from 77 published studies that reported chemical air contaminants for over 260 pollutants in US residences and in countries with
similar lifestyles. Based on the “robustness of measured concentration data and the fraction of residences that appeared to be impacted,” the authors identified nine pollutants as “priority hazards” based on chronic health effects:
•• Acetaldehyde (non-cancer and cancer chronic hazards);
•• Acrolein (non-cancer hazard);
•• Benzene (cancer hazard);
•• 1,3-butadiene (cancer hazard);
•• 1,4-dichlorobenzene (cancer hazard);
•• Formaldehyde (cancer hazard);
•• Naphthalene (cancer and non-cancer hazards);
•• Nitrogen dioxide (NO2) (non-cancer hazard); and
•• Particulate Matter 2.5 µm or less (PM2.5) (non-cancer hazard).
Six other pollutants (bromomethane, chlorine, carbon monoxide (CO), 1,2-dichloroethane, trichloroethene, and propanal) were found to be chronic hazards in fewer than 5% of residences; however, six chemicals (acrolein, formaldehyde, CO, PM2.5, NO2 and chloroform) were found to be priority acute health hazards.
This review did not include radon or SHS because the hazards of these contaminants have already been well-established and have been recently and extensively reviewed elsewhere (Al-Zoughool and Krewski 2009; Surgeon General 2006, Ashley et al., 2005; as cited in Logue et al. 2010).
Jones (1998) assessed the potential usefulness of the “Hazard Analysis-Critical Control Point” risk analysis technique, which had previously proven effective in the food industry, to define hazards and rank microbiological risks in the home. In assessing and ranking risks, it was observed that adjustment for an individual’s sensitivity to that risk was necessary (e.g., the elderly and young children might be considered to be at higher risk than healthy adults), and also depended, in part, on an individual’s knowledge (e.g., awareness of the hazard and threat posed to health) and habits.
page 7Residential Assessment
1.0 Overview of Methods and Tools for Assessing Residential HazardsResidential assessment generally involves one or more of the following strategies:
1. Visual assessment to observe housing conditions, such as water damage or structural deficiencies, that indicate a potential health hazard;
2. Occupant surveys to identify self-reported symptoms or behavioral patterns indicative of health and/or safety hazards;
3. Environmental sampling and analysis of the amount of compound(s) of concern in the sample, and comparison of analytical results to threshold levels or standards;
4. Building performance testing to determine the tightness of the building and the rate of exchange between indoor and outdoor air.
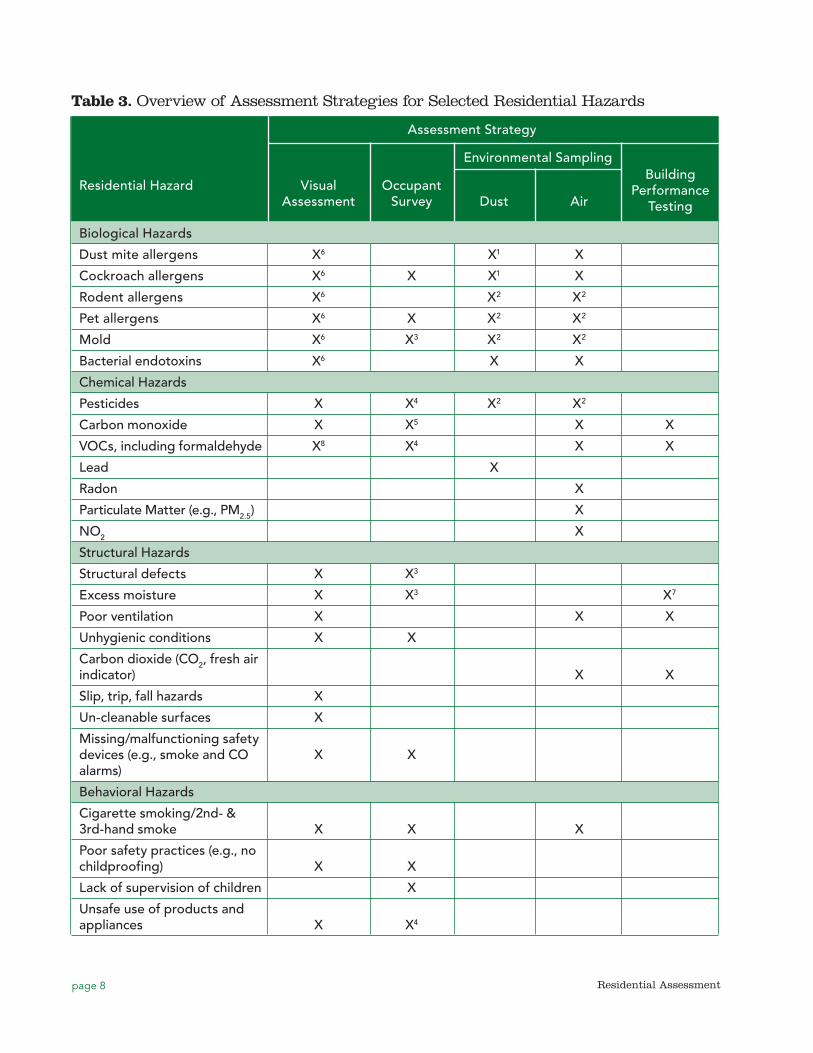
Table 3 summarizes how these four assessment strategies can be used to evaluate biological, chemical, structural, behavioral, and other home hazards. Comparability of visual assessment results, self-reported measures from occupant surveys, and environmental sampling data is discussed in Section 6.
In general, fully comprehensive methods and associated residential assessment tools are not well-developed or widely available. Because conditions and requirements of various programs and research studies vary, there is no single best strategy or associated tool that can be universally used, and each tool has its own strengths and weaknesses (HUD 2010). Program and study designers need to evaluate the strategies and choose tools that best fit their needs. Existing tools can be adapted to fit a particular program or study need; however, adaptation of a tool that has been widely used and/or validated may compromise the tool’s effectiveness and limit the ability to compare findings with other programs or studies.
Residential assessment tools can be organized in various ways, depending on their purpose:
•• By Health Outcome. Some assessment tools focus solely on hazards potentially associated with a specific health problem, e.g., asthma/respiratory hazards or slip/trip/fall safety hazards, etc.
•• By Physical Site Components. Some assessment tools are organized by the physical areas of the building as a systematic way to ensure that all parts of the building (interior rooms, exterior building, common interior areas, etc.) are evaluated.
•• By Type of Hazard. Some assessment tools are organized by the type of hazard (e.g., chemical, biological, structural) or are developed solely for a specific type of hazard (e.g., combustion appliances).
1.1 Assessment Tools Organized By Health OutcomeSome tools have been developed for assessing hazards of concern to people with specific health issues. An example is the Home Environmental Assessment List (HEAL), developed as part of the Master Home Environmentalist (MHE) Program of the American Lung Association of Washington State (ALA Mountain Pacific 2009). This program targets home where asthmatic children live. It trains volunteers to provide free home assessments to educate residents about health risks from indoor air pollutants, hazardous chemicals, and lead in order to decrease the effects of indoor pollution, especially for people with asthma or allergies. Items assessed in the HEAL include condition of ventilation systems and ducts, furnace filters, general cleaning habits, refrigerator drip pans, carpeting, and bedding covers. In an assessment of the program, which was based on occupant surveys, results showed that 75% of families felt that MHE program improved their child’s asthma (Primomo 2000).
Residential Assessment
page 8 Residential Assessment
Building Performance
Testing
Table 3. Overview of Assessment Strategies for Selected Residential Hazards
Assessment Strategy
Environmental Sampling
Residential Hazard Visual Occupant Assessment Survey Dust Air Biological Hazards
Dust mite allergens X6 X1 X
Cockroach allergens X6 X X1 X
Rodent allergens X6 X2 X2
Pet allergens X6 X X2 X2
Mold X6 X3 X2 X2
Bacterial endotoxins X6 X X
Chemical Hazards
Pesticides X X4 X2 X2
Carbon monoxide X X5 X X
VOCs, including formaldehyde X8 X4 X X
Lead X
Radon X
Particulate Matter (e.g., PM2.5) X
NO2 X
Structural Hazards
Structural defects X X3
Excess moisture X X3 X7
Poor ventilation X X X
Unhygienic conditions X X
Carbon dioxide (CO2, fresh air indicator) X X
Slip, trip, fall hazards X
Un-cleanable surfaces X
Missing/malfunctioning safety devices (e.g., smoke and CO X X alarms)
Behavioral Hazards
Cigarette smoking/2nd- & 3rd-hand smoke X X X
Poor safety practices (e.g., no childproofing) X X
Lack of supervision of children X
Unsafe use of products and appliances X X4
page 9Residential Assessment
Building Performance
Testing
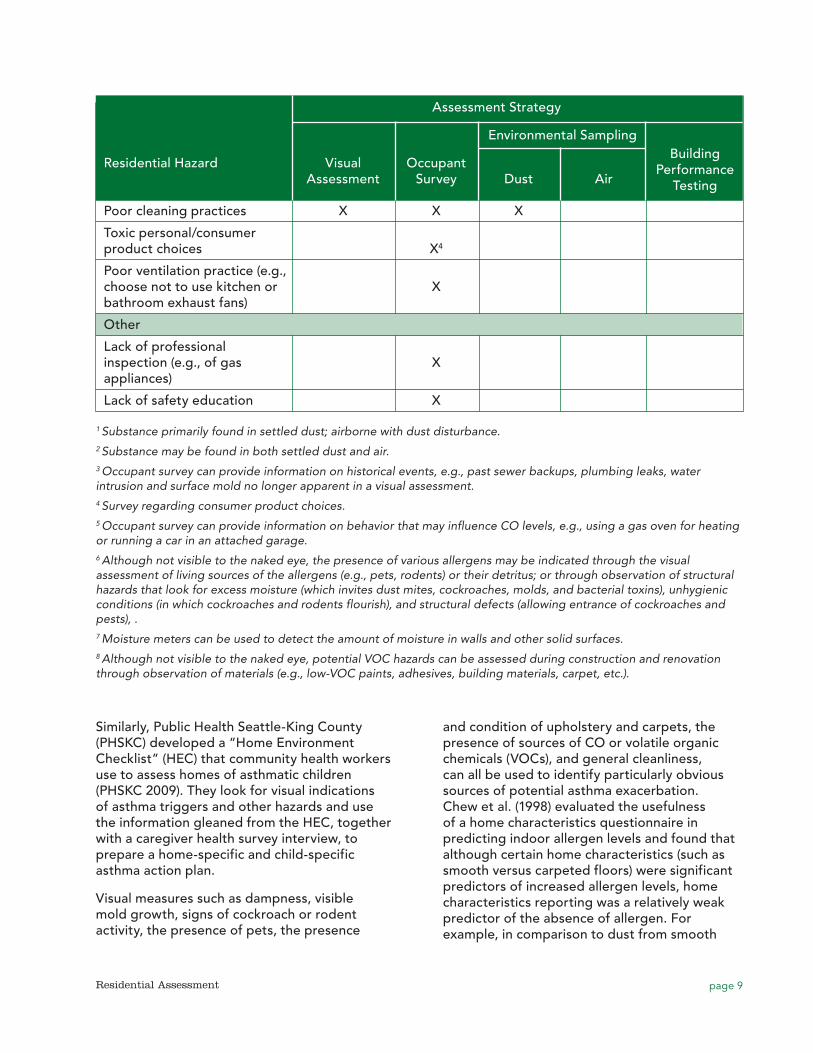
Similarly, Public Health Seattle-King County (PHSKC) developed a “Home Environment Checklist” (HEC) that community health workers use to assess homes of asthmatic children (PHSKC 2009). They look for visual indications of asthma triggers and other hazards and use the information gleaned from the HEC, together with a caregiver health survey interview, to prepare a home-specific and child-specific asthma action plan.
Visual measures such as dampness, visible mold growth, signs of cockroach or rodent activity, the presence of pets, the presence
and condition of upholstery and carpets, the presence of sources of CO or volatile organic chemicals (VOCs), and general cleanliness, can all be used to identify particularly obvious sources of potential asthma exacerbation. Chew et al. (1998) evaluated the usefulness of a home characteristics questionnaire in predicting indoor allergen levels and found that although certain home characteristics (such as smooth versus carpeted floors) were significant predictors of increased allergen levels, home characteristics reporting was a relatively weak predictor of the absence of allergen. For example, in comparison to dust from smooth
Assessment Strategy
Environmental Sampling
Residential Hazard Visual Occupant Assessment Survey Dust Air Poor cleaning practices X X X
Toxic personal/consumer product choices X4
Poor ventilation practice (e.g., choose not to use kitchen or X bathroom exhaust fans)
Other
Lack of professional inspection (e.g., of gas X appliances)
Lack of safety education X
1 Substance primarily found in settled dust; airborne with dust disturbance.2 Substance may be found in both settled dust and air.3 Occupant survey can provide information on historical events, e.g., past sewer backups, plumbing leaks, water intrusion and surface mold no longer apparent in a visual assessment. 4 Survey regarding consumer product choices.5 Occupant survey can provide information on behavior that may influence CO levels, e.g., using a gas oven for heating or running a car in an attached garage.6 Although not visible to the naked eye, the presence of various allergens may be indicated through the visual assessment of living sources of the allergens (e.g., pets, rodents) or their detritus; or through observation of structural hazards that look for excess moisture (which invites dust mites, cockroaches, molds, and bacterial toxins), unhygienic conditions (in which cockroaches and rodents flourish), and structural defects (allowing entrance of cockroaches and pests), .7 Moisture meters can be used to detect the amount of moisture in walls and other solid surfaces. 8 Although not visible to the naked eye, potential VOC hazards can be assessed during construction and renovation through observation of materials (e.g., low-VOC paints, adhesives, building materials, carpet, etc.).
page 10 Residential Assessment
floors, dust from carpeted bedroom floors had 2.1 times the risk of having dust mite allergen at levels ≥10 μg/g; however, high levels of allergen were also measured in situations where no carpets were present. The authors noted that relatively high levels of allergens can be present even in situations where general home characteristic would suggest otherwise (e.g., where beds were encased in plastic, no cats were present, no carpets were present, and no sign of cockroaches had been reported).
1.2 Assessment Tools Organized by Physical Site Components
Visual assessment tools are often organized by the physical components of the inspected building and surrounding area. For example, the Healthy Homes Inspection Manual (HHIM), CDC/HUD 2008) organizes its visual assessment form by site, exterior of building, common areas, and units. Within each of these physical component categories, the user is asked to look for visual indications that biological, chemical, structural and behavioral hazards are present. The authors felt that organization by physical site components made an easy-to-follow flow for the person conducting the visual assessment, reducing the chance of missing a vital observation.
1.3 Assessment Tools Organized by Type of Hazard
Many tools are organized by the types of hazard or cover only specific types of hazards, for example, HUD’s Healthy Homes Rating System (HHRS), which is based on the British Housing Health and Safety Rating System (Great Britain Department of the Environment, Transport and the Regions, 1998). The HHRS is organized around 29 hazards and is designed to quantitatively rank home health (HUD 2011). The residential assessor examines the 29 hazards and weights the risk to the occupant by likelihood of occurrence and severity of possible outcomes. These 29 risk factors include four exposure categories: physiological (e.g., LBP, radiation, CO), psychological (e.g., crowding, lighting), infection (e.g., food safety, personal hygiene), and safety (e.g., electrical hazards, ergonomics). Section 2.2 provides more details on this tool.
1.3.1 Biological hazards
Biological hazards are substances derived from animal products that can adversely impact human health through contact, ingestion, or inhalation. For residences, the primary biological hazards of concern include allergens and mold/moisture.
1.3.1.1 Allergens
Allergens are not typically included in a stand-alone assessment but rather are usually part of more general assessment tools focusing on respiratory health outcomes such as asthma. Visual assessment, occupant surveys, dust sampling, and/or air sampling can be used to assess allergen exposure. There is ongoing debate about the best way to assess allergens in the home. For example, some people favor visual assessment and questionnaires over sampling because sampling can be quite expensive (HUD 2011). For example, an assessor can assume the presence of dust mites if the home is damp, warm, no dust mite covers are on the bedding, and upholstered furniture is present. An assessor can surmise cockroach, rodent, and pet allergen presence based on interviews with residents and/or visual evidence (e.g., live or dead cockroaches, rodent droppings, pet food or litter boxes, etc.).
1.3.1.2 Mold/moisture
High humidity levels and excess dampness have clearly been associated with mold growth, as well as increased levels of some environmental allergens, such dust mite allergen. Visual inspection for dampness and mold growth and detection of musty odors noted through occupant surveys are the most frequently used methods to assess indoor mold exposure. Direct observation of visible fungal growth is usually sufficient to warrant a recommendation for mitigation, and current guidance generally discourages collecting and analysis of environmental samples for mold analysis in most situations (USEPA, 2001b; CDC, 2005) due to high analysis costs, wide spatial and temporal variability in mold sampling results. For example, in their study of bacterial and fungal distribution in 15 U.S. homes, Nasir and Colbeck (2010) found a wide variation in total concentration and size of bioaerosols in different residential
page 11Residential Assessment
settings, due to variable airborne behavior and resulting in different estimates of respiratory exposure risk.
Assessors can usually identify significant residential mold problems from visual observation and/or the presence of moldy/musty odors, and mold remediation decisions can generally be made without costly sample analysis (NYCDOH 2000). HUD (2011) does not recommend mold sampling because a visual examination and odor detection is usually adequate to determine a mold problem. Testing procedures do exist to determine the species of mold that are present in a house, yet most healthy homes programs and others involved in mold remediation have come to the conclusion that such speciation does not yield the kind of information needed to determine remediation (AIHA 2008). Similarly, measuring the mold spore concentrations in air is not generally recommended because results can be very variable and difficult to interpret.
A variety of protocols exist for assessing water damage in homes; for example, the Cuyahoga County Board of Health developed a visual assessment tool for inspecting homes for evidence of mold and moisture for Cleveland, Ohio in HUD-sponsored research (Dillon et al., 1999; EHW, 2004). Since 2010, the National Institute for Occupational Safety and Health (NIOSH) has been developing an observational checklist, called the NIOSH Dampness and Mold Assessment Form to grade dampness and mold in buildings, primarily large buildings such as schools (NIOSH 2010). In studies of a community college and a health care facility, NIOSH showed that its tool’s dampness and mold scores were associated with respiratory health outcomes in building occupants (Park et al. 2004; Cox-Ganser et al. 2009). The goal of the NIOSH tool is to provide information for motivating remediation, prioritizing intervention, and evaluating remediation effectiveness. In 2010, NIOSH partnered with the various programs in Maine and Connecticut to pilot the use of the checklist. Limitations include that the tool is designed for schools, it relies solely on observation (although NIOSH encourages the use of moisture measurement devices as supplementary tools), and it cannot be used to detect hidden mold or hazards associated with mold such as mycotoxins.
An overview of additional techniques and issues of concern in conducting visual assessments of homes for mold contamination is presented in ACGIH 1999 or the New York City Department of Health Guidelines on Assessment and Remediation of Fungi in Indoor Environments (NYCDOH 2008). Chapter 3 of the Institute of Medicine (IOM) report, Damp Indoor Spaces and Health, provides a list of questions used to define dampness used in 25 epidemiological studies (IOM, 2004). Detailed information concerning housing features and structural deficiencies that can increase moisture levels and mold growth is provided in the Healthy Homes Issues background paper on Mold (HUD 2010f).
1.3.1.3 Bacterial endotoxins
In residential indoor environments, bacterial endotoxins, cell wall components of gram-negative bacteria, contribute to asthma and respiratory allergies. They are usually assessed through environmental sampling and analysis (Section 4.2.2).
1.3.2 Chemical hazards
Chemical hazards are non-biological substances that harm humans through contact, inhalation, or ingestion. Chemicals of all kinds are stored, used, or produced in residences and can result in serious illness or injury if not handled properly. For residences, the primary chemical hazards of concern produced through various processes in the home include combustion gases (CO and NO2), SHS, formaldehyde, lead, PM (including nanoparticles, also known as ultrafine particles), pesticides, radon, and VOCs.
1.3.2.1 Combustion gases: CO and NO2
Inadequately vented, malfunctioning, or improperly operated combustion appliances and engines in or around the home can increase levels of numerous substances of health concern in indoor air, including toxic gases (e.g., nitrogen oxides, sulfur oxides, VOCs, and CO) and airborne particulate matter (PM, discussed separately in Section 1.3.2.4). Unintentional, non-fire-related CO poisoning is a leading
page 12 Residential Assessment
cause of unintentional poisoning deaths in the US, responsible for approximately 15,000 trips to the emergency room and nearly 500 deaths annually, with most exposures occurring in the home (CDC 2011). Indoor NO2 exposure from gas appliances is common, and higher, indoor NO2 concentrations have been associated with increased asthma symptoms in preschool inner-city children (Hansel et al., 2008).
Unvented combustion sources that can pose hazards include gas and electric cooking ranges, charcoal grills, hibachis, gasoline-powered engines or tools (e.g., portable generators, pumps, or power washers) used in enclosed or partially enclosed environments, or gasoline-powered vehicles started or left idling in attached garages. Even if the garage doors are open, combustion gases can seep into the house, particularly in backdraft situations. Backdrafting occurs when the air pressure within a home is lower than the air pressure outside the home (e.g., in the attached garage), causing house depressurization which causes combustion gas flow to reverse direction and spill into living areas instead of staying outside or traveling up a vent or chimney. According to the Environmental Protection Agency (EPA), unvented gas cooking ranges and ovens should not yield substantial increases in CO over long periods of time, except possibly in households where they are improperly used as a primary or secondary source of heat (USEPA, 2000). Certain behaviors may increase exposure to combustion gases, including using gas stoves in small, unventilated spaces, or using stoves for supplemental heating.
Preventing combustion-related exposure requires residents to operate combustion appliances responsibly, ensure that areas around appliances are properly vented outside, and ensure that local ventilation systems are properly maintained. HUD (2012b) lists items that the Consumer Products Safety Commission (CPSC) says should be included in yearly inspections of homes by professional heating contractors or gas companies (CPSC 2008). A list of guidance documents with suggested protocols for assessing combustion hazards and conducting safety testing of combustion appliances, including spillage and CO emissions, is provided in HUD 2010b. If a backdrafting problem is suspected, a professional heat
contractor should check the house and heating systems. Small temperature-sensitive strips called “Backdraft Indicators” can be attached to the draft diverter (which regulates the flow of air in HVAC systems) to detect backdrafting of exhaust gases (ISU 1996). A chimney flow test may also be conducted by holding a smoke indicator (such as an incense stick) near the draft hood of a gas furnace or water heater, and watching the direction of smoke movement at the draft hood or damper, both with and without exhaust fans and other exhaust equipment in the house turned on (CMHC, Combustion Gases in Your Home online 2010). If the smoke moves into the house, there may be a seepage problem.
Along with regular inspection of combustion appliances, assessment of the presence and operation of CO alarms is important to ensure that home occupants will be warned when indoor CO levels reach dangerous levels. Details concerning the relationship between CO alarms and prevention of death and injury are provided in HUD 2010b.
1.3.2.2 Formaldehyde
As noted in Section 1.3.2.8, although formaldehyde is technically a VOC, it is commonly considered separately from other VOCs because it is widely used by industry to manufacture building materials and many household products and is a human carcinogen (IOM 2001; EPA 2010). Formaldehyde is one of the top ten organic chemical feedstocks in the U.S. (Godish 2001). Sources in the home include pressed wood products made using adhesives containing urea-formaldehyde (UF) resins (e.g., subflooring, shelving, cabinetry, and furniture); hardwood plywood paneling, and medium density fiberboard, and oriented strand board. Formaldehyde is also a by-product of combustion from combustion appliances, wood fires, and tobacco smoke. Formaldehyde can irritate the eye, nose and throat and cause nausea and difficulty in breathing in some people exposed to higher concentrations. High concentrations can trigger asthma attacks (IOM 2001). Average concentrations in older homes without urea-formaldehyde foam insulation (UFFI) are generally below 0.1 ppm, while homes
page 13Residential Assessment
with a number of new pressed wood products can have levels exceeding 3 ppm (EPA 2010). Although more commonly considered a hazard in newer or newly renovated homes, it has been found to persist in older homes, possibly due the long-term release of formaldehyde from aging pressed-wood materials with UF resins (Hun et al. 2010).
Visible evidence of formaldehyde can include the presence of pressed wood products, especially new ones; however, air sampling is the more common method to assess for the presence of formaldehyde in new and old residences (see Section 4.2.4).
1.3.2.3 Lead
Lead is one of the most-studied toxic substances (Sandel 2010), adversely affecting the brain, neurodevelopment processes, and many other organ systems, sometimes irreversibly (Commission on Life Sciences 1993; ATSDR 2007). No safe level of lead exposure has been identified (Bellinger and Needleman 2003; Canfield et al. 2003; Lanphear et al. 2005; CDC 1991; CDC 2007). Over the past several decades, children’s blood lead levels have declined, yet about 250,000 US children younger than 6 years old have elevated blood lead levels, defined by CDC as levels at or above 10 μg/dL (EPA 2010). Low-income children and black and Hispanic children are at higher risk (CDC 2005). The National Survey of Lead and Allergens in Housing (NSLAH) found that approximately 40% of U.S. housing units (38 million) contain LBP (Clickner et al. 2001). Of those, 24 million have significant LBP hazards, such as deteriorated LBP and lead-contaminated house dust and bare soil (Clickner et al. 2001; Jacobs et al. 2002).
In their recent analysis of data from the 1999–2004 National Health and Nutrition Examination Survey (NHANES), Dixon et al. (2009) identified many factors that influence childhood blood lead levels, including:
•• Age of child;
•• Race/ethnicity;
•• Serum cotinine concentration (an indicator of exposure to SHS);
•• Poverty-to-income ratio;
•• County of birth;
•• Year of building construction,
•• Floor dust lead loading by floor surface and condition;
•• Windowsill dust lead loading;
•• Presence of deteriorated paint;
•• Home-apartment type;
•• Smoking in the home; and
•• Recent renovation.
Assessors can evaluate many of these factors through visual assessment and residential interview; however, floor and window dust lead loadings can be assessed only through sampling (see Section 4.2.5). The rate of change in blood lead levels with respect to floor dust lead loadings observed in Dixon et al. 2009 is similar to that found in the National Evaluation, the Risk Assessment Study and the Rochester Study (Galke et al., 2001; HUD 2004c; Wilson 2007; Lanphear 1996a; Lanphear 1996b).The current 40 μg/ft2 floor standard was based on the Rochester Study, which estimated that 95.3% of children 6 to 36 months old would be protected from having a blood lead level at or above 15 μg/dL using a floor dust lead loading of 40 μg/ft2. However, more recent research has shown significant lead-related IQ decrements in children at blood lead levels less than 10 μg/dL (Canfield et al. 2003; Lanphear et al. 2005); therefore, Dixon et al. (2009) concluded that lowering the floor dust lead loading standard below the current standard of 40 μg/ft2 would protect a greater number of children from lead poisoning. Most houses with children have lead dust (PbD) levels that comply with federal standards but may put children at risk. Factors associated with PbD in population-based models are primarily the same as factors identified in smaller at-risk cohorts. PbD on floors and windowsills should be kept as low as possible to protect children. (Gaitens et al. 2009). Gaitens et al. analyzed NHANES data to explore the feasibility of lowering the current dust lead standards. It is widely accepted that dust lead loadings on floors and windowsills should be kept as low as possible to protect children from lead exposure. As noted in Gaitens et al. (2009), the current standards for floor and windowsill PbD were set in 1999–2001 to protect 95% of children from developing a PbB level >15 μg/dL (the environmental intervention level established
page 14 Residential Assessment
by the CDC [2005]), in light of feasibility and measurement limitations. However, in their evaluation of NHANES data from 1999 through 2004, Gaitens et al. (2009) showed that in most children’s homes, the average level of PbD is well below the current standards, making it feasible to lower the current standards and thus afford more protection for more children.
Lead exposure can occur through a variety of sources, including air, bare soil, home remedies, drinking water, toy jewelry, and others (Levin et al. 2008), but the main source inside the home is deteriorated LBP and associated contaminated dust, which young children ingest through normal hand-to-mouth behavior. LBP cannot be identified through visual assessment, although the presence of deteriorated paint in a house constructed before 1978 (when LBP was banned in the U.S.) is considered indicative of a possible LBP hazard (DOE 2009).The most common method of assessing residences for LBP hazards is through XRF testing and dust wipe sampling, both of which are described in detail in Section 4.2.5. Dust wipe sampling on floors is particularly important since studies have shown that floor dust lead loadings have a direct effect on children’s blood lead levels (HUD 2004).
For example, HUD and EPA have many resources concerning how to assess and treat homes for lead hazards (HUD 1995, EPA/HUD 2008; EPA 2000; HUD 2001) therefore, lead hazard assessment, although touched upon in this paper, will not be discussed in detail.
1.3.2.4 Non-biological particulate matter (PM)
Biological PM (e.g., molds, allergens) was discussed in Section 1.3.1. Non-biological PM is a term for solid and liquid particles that can remain in air for a long time (McDonald and Ouyang 2001). PM is commonly classified according to particle size, or diameter. In residences, the sizes of primary concern are fine particulate matter, i.e., those particles between 0.1 and 2.5 micrometers (µm) (commonly termed PM2.5), and ultrafine particulate matter (UFP), i.e., those particles less than 0.1 µm, also known as nanoparticles.
PM2.5. The primary sources of non-biological PM2.5 inside homes are combustion sources and tobacco smoke. Unvented or poorly vented
combustion appliances, especially wood-burning stoves and fireplaces, can contribute substantial amounts of PM indoors. As stated in IOM (2000), “studies consistently report an association between exposure to high outdoor levels of air pollutants, including PM, and adverse respiratory health effects. Fine particles, defined as those with aerodynamic diameters less than 2.5 µm (PM2.5), easily enter indoor air from the outside. The literature suggests an association between PM exposure and asthma exacerbation.”
Particulate matter is a major component of secondhand and thirdhand smoke, and PM is often measured as a marker of SHS; however, this marker is non-specific since PM is emitted from many other non-SHS sources. SHS is discussed in detail in Section 1.3.2.7, and sampling methods for PM2.5 is discussed in Section 4.2.8.
Combustion sources and SHS are also sources of UFP inside homes. There are currently only limited workplace exposure data for engineered nanoparticles (Curwin and Bertke 2011) and virtually none for residential environments. According to Wallace and Ott (2011), major personal exposure sources of UFP include can occur while people are cooking on gas or electric stoves, smoking, burning candles, or operating small appliances such as hair dryers, curling irons, air popcorn poppers, mixers, steam irons, and electric toaster ovens. Examples of UFPs found in the residential environment are textile fibers, skin particles, spores, dust mite droppings, chemicals and smoke (Buzea, 2007). UFP concentrations within the home may be further increased through infiltration from outdoor sources such as traffic-related fuel combustion if the home is located close to a major highway (Lwebuga-Mukasa 2004, 2005; Buzea 2007; Brugge 2007; Wallace and Ott 2011). Using electric and gas burners during cooking hours increases UFPs levels up to ten times compared to non-cooking hours. Once generated, UFPs may stay suspended in ambient air for three or more hours before settling (Buzea, 2007; Lwebuga-Mukasa, 2009).
Inhalation is the primary route of exposure for UFP, with particles of this size depositing predominantly in the alveolar region of the lungs. It has been hypothesized but not proven that, due to their small size and great surface
page 15Residential Assessment
in diameter, thus having a large surface area even at low mass concentrations. They are polydispersed, soluble or poorly soluble, have high pulmonary system deposition ability, are able to evade destruction (through macrophage phagocytosis) and stick to the airway walls of the lungs when inhaled (Chalupa 2004; Frampton 2004; Peters 2005; Lubick 2009; Li 2010; Win-Shwe 2011). Studies have shown that UFPs can also enter the body through the skin. Once in the body, they enter the circulatory and lymphatic systems and can be deposited in the nervous system, tissues and organs like the liver and kidney and sometimes in the brain depending on genetic susceptibility and health status. They have also been shown to compromise the immune system’s ability to fight infections (Buzea 2007; Win-Shwe 2011). They have the ability to transport large amounts of redox-active organic chemicals to their deposition sites which induce pulmonary inflammation or oxidative stress in the lungs (Chalupa 2004; Lubick 2009; Li 2010). Several studies have associated UFPs with asthma, exacerbation of respiratory or airway inflammations, pneumonia, chronic obstructive lung disease and cardiovascular illnesses (Buzea 2007; Mühlfeld 2008; Lwebuga-Mukasa 2009; Yarris 2010; Li 2010; Air Quality Sciences 2011).
Chalupa et. al. (2004) in their studies showed that UFP deposition in lungs was greater than larger particulate matter and the quantity retained in the lungs were higher in asthmatic than non-asthmatic subjects, thus contributing to airway inflammations. Lwebuga-Mukasa et al (2005), in investigating the role of home environmental and local ecological factors in the prevalence of asthma in Buffalo, NY neighborhoods, monitored UFPs and showed that asthma prevalence in the west side was influenced by UFP concentrations mostly from traffic-related fossil-fuel combustion. A study by Brugge et. al. (2007) on near-highway pollutants in motor vehicle exhaust and cardiac and pulmonary health risks of area residents concluded that there is elevated risk for the development of asthma and lung function reduction in children. In their study of the impacts of ambient UFP on traffic-related asthma flares from a Los Angeles, CA highway, Li et. al. (2010), found out that UFP provides a strong adjuvant effect in secondary immune response, thus ambient UFPs heightens allergic inflammation
UFP. According to the Federal Government’s National Nanotechnology Initiative (NNI 2011), over 800 everyday consumer products that rely on nanoscale materials and processes currently exist:
•• Nanoscale additives in polymer composite materials for baseball bats, tennis rackets, motorcycle helmets, automobile bumpers, luggage, and power tool housings;
•• Nanoscale additives to or surface treatments of fabrics help them resist wrinkling, staining, and bacterial growth;
•• Nanoscale thin films on eyeglasses, computer and camera displays, windows, and other surfaces can make them water-repellent, antireflective, self-cleaning, resistant to ultraviolet or infrared light, antifog, antimicrobial, scratch-resistant, or electrically conductive;
•• Nanoscale materials in cosmetic products provide greater clarity or coverage; cleansing; absorption; personalization; and antioxidant, anti-microbial, and other health properties in sunscreens, cleansers, complexion treatments, creams and lotions, shampoos, and specialized makeup;
•• Nano-engineered materials in the food industry include nanocomposites in food containers to minimize carbon dioxide (CO2) leakage out of carbonated beverages, or reduce oxygen inflow, moisture outflow, or the growth of bacteria in order to keep food fresher and safer, longer; and
•• Nano-engineered materials in household products such as degreasers and stain removers; environmental sensors, alert systems, air purifiers and filters; antibacterial cleansers; and specialized paints and sealing products.
area to mass ratio, UFP may penetrate the epithelial lining and lung interstitial spaces, more readily enter cells, and cause greater lung issues than larger particles (Curwin and Burtke 2011). The potency of UFPs is basically due to their small size, normally between 10–700 nm
page 16 Residential Assessment
in asthmatics. Another study by researchers at Lawrence Berkeley National Laboratory, CA showed that ozone reacts with nicotine to create a UFP which is more potent than nicotine and can cause more serious problems for asthmatics (Yarris 2010).
PM2.5 and UFP cannot be seen and are most easily discerned through visual assessment of combustion appliances and associated local ventilation. It is not possible to tell by observation whether or not the various materials listed above contain UFP. Interviews asking about smoking practices may also be useful for SHS. Neither visual assessment nor sampling methods currently exist to assess the presence and magnitude of UFP in residential environments. Sampling and analysis for PM2.5 and SHS is usually only conducted for research purposes, while the methods to sample and analyze for UFP are currently in their infancy.
1.3.2.5 Pesticides
Pesticides may be found in airborne vapor form or adsorbed to particulates such as household dust on floors and other surfaces. Pesticides measured in residences include chlordane, heptachlor, aldrin, dieldrin, diazinon, naphthalene, dichlorobenzene, pentachlorophenol, chlorpyrifos, malathion, and carbaryl (NAS, 2000). Because they are persistent in the environment, pesticide residues may be present in a home long after their original use. People are exposed to pesticides through ingestion, dermal absorption, and inhalation of airborne material either as aerosols or adsorbed onto airborne dust particles (IOM 2000). According to EPA, in 2000, 75% of US households used at least one pesticide indoors during the past year, and 80% of most people’s exposure to pesticides occurred indoors (EPA 2004a as cited in Sandel et al. 2010). Children can be acutely poisoned by pesticides if products are not stored safely (EPA 2005). The health effects of chronic pesticide exposure are not well understood, but most pesticides affect the central nervous system, and exposure to multiple pesticides may pose a cumulative risk (Bradman et al. 2005; Eskenazi et al. 2008; Chanda et al. 1996; Rice and Barone Jr. 2000, as cited in Sandel et al. 2010). IOM (2000) found inadequate evidence of an association
between residential pesticide exposure and the development or exacerbation of asthma.
From a public health program perspective, simple, non-invasive methods to assess home pesticide exposures include surveys of pesticides stored in homes and garages and recall questionnaires about pesticide use and application frequency (Adgate et al., 2000). These methods are lower in cost than conventional sampling and analyses and indicate the general prevalence of pesticides use in and around the home, and thus the potential for exposure. However, inventories will miss a product that has been used up with no remaining container. In addition, personal recall of pesticide use has low validity generally, and recall of specific product use is poor (Gordon et al., 1999) due to the fact that use of readily available pesticide products is sporadic and rapid. In addition, individual activity factors for the applicator, adult and child residents, and even pets, can dramatically impact exposure. An individual’s attitude and perception of risk related to pesticide use can influence information obtained in questionnaires and potentially result in underreporting, especially when questions are limited in scope (Nieuwenhuijsen et al., 2005).
1.3.2.6 Radon
Exposure to radon gas is the leading cause of lung cancer among nonsmokers and the second leading cause of lung cancer overall, causing 21,000 deaths annually in the United States (EPA 2003). A decay product of uranium, radon is a colorless, odorless radioactive gas that occurs naturally in soil and rock. It moves through fractures and porous substrates in the foundations of buildings and can collect in high concentrations in certain areas. Radon may also enter a house through water systems in communities where groundwater is the main water supply, most commonly in small public systems and private wells, i.e., closed systems that do not allow radon to escape (Sandel 2010). Housing with high radon concentrations is more prevalent in certain regions of the country, but any house, regardless of region, can contain dangerous or unhealthy levels of radon. The EPA has mapped high-risk radon areas (EPA 1992) but recommends that all homes, regardless of geographic location, be tested for radon. Because it is odorless and colorless, the only way to assess homes for
page 17Residential Assessment
radon gas is to either assume it is present based on EPA’s map of radon zones (EPA 2010), or to conduct tests (see Section 4.2.10).
1.3.2.7 Secondhand smoke (SHS)
In the past, SHS (i.e., tobacco smoke that is unintentionally inhaled by people who do not smoke) was also referred to as environmental tobacco smoke (ETS); however, SHS is the term more frequently used today. As noted in Sandel et al. (2010), SHS causes approximately 3,000 lung cancer deaths in nonsmokers each year and is associated with prematurity, low birth weight, low Apgar scores, poor early growth of infants, and dysfunctional behavior in infants. SHS exposure and cognitive abilities among U.S. children and adolescents aged 6 to 16 years have been found to be inversely associated, even at extremely low levels of exposure (Yolton et al., 2005). The IOM found sufficient evidence for a causal relationship between SHS exposure and the exacerbation of asthma in preschool-aged children and an association between SHS exposure and the development of asthma in younger children (IOM 2000. As cited in Sandel et al. (2010), in 2006, the U.S. Surgeon General concluded that the scientific evidence indicates that there is no risk-free level of exposure to SHS and found that the home is the major setting where children are exposed to SHS. A 2009 IOM report concluded that the evidence is consistent with a causal relationship between SHS exposure and acute coronary events, including myocardial infarctions.
Thirdhand smoke is defined as residual tobacco smoke contamination that remains after the cigarette is extinguished (Winickoff 2009). Johansson et al. (2004) noted that smokers generally take steps to prevent non-smokers from being exposed to SHS, including opening windows, smoking in other rooms or outdoors, or turning on fans. However, Winickoff notes that high levels of tobacco toxins persist in the home well after active smoking ends, usually in the form of particulate matter that gets deposited on every surface in the home, in loose household dust, and as volatile airborne chemicals that can be detected for days, weeks, or months when no active smoking is ongoing. Children are uniquely susceptible to thirdhand smoke exposure (Winickoff 2009).
Residential assessors can look for evidence of smoking indoors, such as seeing smoking product remains in ashtrays or other containers or packs of tobacco products, or by smelling the odor of tobacco smoke. Sampling methods to detect evidence of secondhand and thirdhand smoke are becoming more common (see Section 4.2.11).
1.3.2.8 Volatile organic chemicals (VOCs)
VOCs are some of the most common indoor air pollutants, particularly in new homes, and can originate from a variety of sources, including paints, varnish, building materials, carpeting, furniture, cabinetry, wax, cleaning agents, disinfectants, cosmetics, adhesives, products containing particle board and plywood, air fresheners, hobby products, and degreasers. Levels of VOCs in many of these products may decrease over time due to off-gassing, but may remain at harmful levels (Sandel et al. 2010). The term “VOC” originally referred to a class of carbon-containing chemicals that participate in photochemical reactions in outdoor air; however, the definition has become much less rigorously defined over time (Tucker, 2001). EPA bases its regulatory definition of VOCs primarily by specified sampling and analytical test methods and excludes certain VOCs such as formaldehyde, CO, CO2, and other chemicals that EPA states need to be considered separately from VOCs, and also excludes other VOCs such as methane, ethane, acetone, etc. which have negligible photochemical reactivity.
Some VOCs pose primarily acute hazards (e.g., eye and upper respiratory irritants), while others such as benzene may pose more serious chronic health hazards such as cancer. As noted in Section 1.1, six of the nine indoor air pollutants that Logue et al (2010) identified as priority hazards were VOCs, including acetaldehyde, acrolein, benzene, 1,3-butadiene, 1,4-dichlorobenzene, and formaldehyde, while naphthalene is a semi-volatile organic compound. According to Tucker (2001), indoor concentrations of total VOCs (TVOCs) typically range from 50 to 1,000 μg/m3 over long periods, and can be in the mg/m3 range for periods of minutes to hours (e.g., immediately following construction or the use of personal care products or cleaning agents). IOM (2000) found insufficient evidence of an association
page 18 Residential Assessment
between indoor residential VOC exposure and the development or exacerbation of asthma; however, higher levels increase the risk of asthma sensitization, cancer, neurological effects, respiratory effects, or other problems.
Residential assessment for VOCs is generally done by occupant survey to identify product usage in the home, visual assessment during construction to determine if low- or no-VOC products are used, and/or air sampling (see Section 4.2.12).
1.3.3 Structural hazards
As shown in Table 3, structural hazards include structural defects; excess moisture; poor ventilation (including lack of fresh air); slip, trip, and fall hazards; un-cleanable surfaces; and missing/malfunctioning safety devices.
In 2003, one-third of all injury-related deaths were from home injuries, with unintentional home injury death rates highest for young children and the elderly (DiGuiseppi et al., 2010). Structural defects (e.g., stair disrepair, inadequate or missing handrails, missing grab bars and non-slip surfaces in bathrooms, slip/trip hazards, and inadequate lighting) commonly cause home injuries and therefore are common points for home inspection regarding structure-related fall injuries (DiGuiseppi et al. 2010). In addition, as discussed in Section 1.3.1.2, structural deficiencies may be tied to moisture-related indoor health hazards, such as mold or certain allergen exposures, because many moisture problems in homes are due to structural problems. Poor ventilation may increase chemical and biological hazards in the home, while the lack of fresh air leads to discomfort and respiratory issues. Mobile homes and substandard housing yield increased risk or fire-related injuries. Structural deterioration may also lead to access points for pests to enter the home. Crowded neighborhoods and substandard/poorly designed homes are associated with increased residential noise, which may result in sleep disturbance, cardiovascular, and psychological problems, performance reduction, and hearing loss at high levels. Safety devices are designed to prevent hazards from occurring or to allow quick responses when they occur.
Home inspections are used to check for structural hazards that may cause fire-related injuries, scald-related injuries, drowning, CO poisoning, heat-related injuries, and excessive noise. Visual assessments also include a check for the presence and use of recommended safety devices to prevent burns and deaths associated with fire and electrocution, devices to prevent falls, poisoning prevention devices, and gun safety devices, all of which can be included when conducting visual assessments. Finally, ventilation system checks, or building performance testing, can be used to identify and correct ventilation deficiencies.
1.3.3.1 Safety devices
Safety devices are defined as instruments, monitors, and alarms that can be used in the home to prevent or protect against various safety issues in the home. Visual assessment is the most common strategy used to evaluate these devices.
Fire Prevention and Suppression Devices. According to the CPSC, two-thirds of home fire deaths occurred in homes with either no smoke detector or no working smoke detector (CPSC 2008). Common causes for non-functioning smoke alarms include a disconnected power source, a dead or missing battery, improper installation, or improper placement of the alarm. Residential assessors should look for at least one smoke alarm high on the walls or ceilings of every floor in a home, including the basement, and outside each sleeping area away from windows, doors, or forced-air registers where drafts could interfere with their operation. Fire extinguishers must be checked periodically to ensure they are properly charged, and occupants must be trained on how to use a fire extinguisher effectively. Home fire sprinkler system installation is advocated by both the U.S. Fire Administration (USFA 2010) and the National Fire Protection Association but is often overlooked as an effective strategy for preventing deaths in house fires.
Water Safety Devices. In the late 1980s, water heater manufacturers voluntarily agreed to
page 19Residential Assessment
preset all electric water-heater thermometers to 120°F (Dowd, 1999). However, because thermostats in water heaters can sometimes be inaccurate (especially in the case of older water heaters), residential assessors should measure hot water temperatures using a thermometer, and if necessary, lower the temperature so that it does not exceed 125°F to 130°F, where the likelihood of scald injury increases (Dowd, 1999; Schieber et al., 2000).
Electrical Safety Devices. Electrical safety devices include outlet safety covers, Ground fault circuit interrupters (GFCIs), and arc fault circuit interrupters (AFCIs). According to CPSC, an estimated 1,300 injuries associated with electrical receptacle outlets are treated in emergency rooms each year as a result of children inserting metal objects into outlets (CPSC Document 524). Outlet safety covers that are difficult for children to remove and large enough not to become a choking hazard help protect children from injury. GFCIs are designed to sense disruptions in electrical current, turn off power to the affected circuit, and prevent the delivery of a lethal dose of electricity. Local building codes generally require the installation of GFCIs in rooms with water sources, such as kitchens and bathrooms. AFCIs work by responding to early arcing and sparking conditions in home wiring to prohibit or reduce potential electrical fires. The National Electrical Code, a widely adopted model code for electrical wiring, has required AFCIs for bedroom circuits in all new residential construction since January 2002.
Fall Prevention Devices. These include grab bars and non-slip surfaces in the bathroom, non-slip backing on rugs, safety gates to block stairs and dangerous areas, and window guards to prevent children from falling from windows.
Poisoning Prevention Devices. These include safety locks on poison storage cabinets and CO alarms. In addition to checking for the presence of functioning smoke and CO alarms, home assessments should evaluate the working condition and placement of these devices.
Gun Safety Devices. CDC reported that 64.5% of unintentional firearm deaths in 2007 took place in houses or apartments (CDC 2010). One-third of these unintentional injuries occurred while children were playing with a gun (29.9%),
hunting (24.7%), showing the gun to others (14.3%) or loading/unloading the gun (10.4%). Circumstances surrounding these unintentional gun fatalities included thinking that the gun was unloaded, unintentionally pulling the trigger, and experiencing a gun malfunction. Residential assessors can check for gun safety devices, including lockable gun storage safes and gun locks and separate storage locations of guns from ammunition.
1.3.3.2 Heating, ventilation, and air conditioning (HVAC) systems
Residential ventilation is the movement or circulation of fresh air in the home, either through natural or mechanical means. Homes are ventilated to:
•• Provide outdoor air for the health and comfort of residents. While some US multi-family buildings have a planned fresh air supply, most single-family dwellings rely on outside air delivered through building leakage, open windows and doors, or, in some cases, “whole house mechanical ventilation” such as a heat or energy recovery system. As building envelopes are tightened for energy conservation purposes and building leakage declines, it is important that a system for an adequate supply of fresh air be planned and installed.
•• Remove internally generated contaminants (e.g., combustion gases). Local exhaust ventilation is designed to move a relatively small amount of air to remove a contaminant at the point it is generated before it can enter the indoor air at large. Examples include kitchen and bathroom exhaust fans, chimneys, clothes dryers, vented combustion appliances (furnaces, water heaters) and range hoods over gas ovens and ranges.
•• Maintain specific pressures between certain indoor spaces and between these spaces and the outdoors (Persily 2001). Regulating pressure differentials so that air moves as intended is essential for good building design.
Failure to regulate these pressure differentials can have serious consequences. For example, if a new exhaust system is added without balancing air pressure, air that would normally rise through a chimney or fireplace can actually reverse direction and enter the living area, bringing in CO
page 20 Residential Assessment
and other contaminants with it. Poor ventilation may cause the buildup of chemical and biological hazards in the home, while lack of proper heating or air conditioning systems may lead to resident injuries. DiGuiseppi et al (2010) noted that residents unable to stay cool during severely hot weather may become ill or die. Older, socially isolated, and people living in homes without air conditioning are at increased mortality risk during heat waves, while the same people may be at increased risk if heating systems do not perform adequately in the winter months.
Adequate ventilation can help to keep exposures to contaminants, odors, moisture, and other substances low. However, controlling the source of the contaminant is always the primary approach because ventilation cannot always be expected to keep exposures low. If a contaminant exists in a home, its source should be investigated and determined. A source reduction strategy should be implemented before a ventilation system is installed or otherwise improved.
Most residential assessors will most likely identify ventilation problems through visual assessment; however, they may use more complex building performance test procedures such as blower door tests and pressure diagnostics during and after major renovations and new construction to verify that the system is working as designed. Section 5 discusses building performance testing techniques.
2.0 Visual Assessment ToolsVisual assessment tools are designed to look for structural or physical deficiencies in a residence that may lead to injury, acute health risks, pest infestations or moisture problems. Visual assessments must be designed to provide a strong basis for policy development, compliance monitoring, and research on housing quality, and to help residents and rental property owners make informed judgments about maintaining housing (Keall et al 2010).
There are many visual assessment tools that have been used by researchers and housing and public health programs; however, this section focuses on national tools likely to be
updated and remain available over the course of time. Many of the tools used more locally were derived from one or more of these national tools. For example, HUD Healthy Homes Initiative grantees have used modified versions of the Healthy Housing Inspection Manual (HHIM) to create visual assessment tools that fit the needs of their particular demonstration projects or technical studies.
Table 4 lists seven visual assessment tools, where each may be accessed online, topics covered by each (e.g., types of hazards), and its original purpose. These tools are voluntary tools and do not set new regulatory standards, establish legal and/or complete compliance with local, state, federal or other applicable housing, building, health, safety or other applicable policies, codes, regulations, statutes and laws. When selecting tools for a particular project or program, Keall et al (2010) stress the importance of selecting tools that exclusively assess the dwelling itself, not the occupant’s behavior in relation to the dwelling because (1) the assessment “stays relevant to the dwelling even if residents move; (2) if the assessment shows that the dwelling is safe for a vulnerable group, then the dwelling is safe for all potential occupants; and (3) unoccupied dwellings can be assessed. The tools discussed below all focus on the structure itself, not on occupant behavior.
2.1 Healthy Housing Inspection Manual (HHIM)
The visual assessment tool of the HHIM (CDC/HUD 2008, Section 2.1) is used to collect information that can be determined without asking questions of a resident. The HHIM was adapted from the HUD Public Housing Assessment System (PHAS) and its Physical Assessment Subsystem (PASS), as well as from inspection protocols used by various Healthy Homes grantees. The HHIM also includes a Healthy Homes Model Resident Questionnaire, which CDC/HUD recommends conducting prior to the visual assessment (see Section 3.1). This tool is organized by physical site components to help guide the inspector and ensure that all aspects of the building and surrounding site property are inspected in a particular order (Table 4). Each possible answer includes explanatory text to help guide the inspector and decrease confusion. Appendix 1 of the HHIM
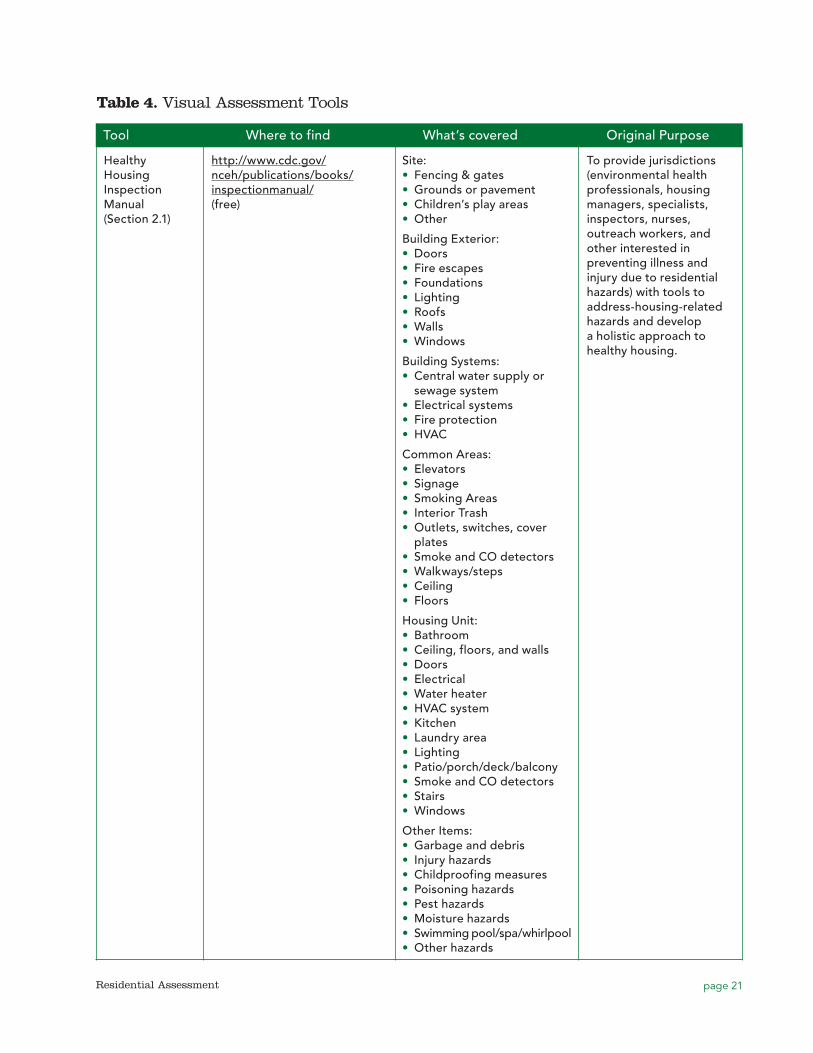
page 21Residential Assessment
Table 4. Visual Assessment Tools
Tool Where to find What’s covered Original Purpose
Healthy Housing Inspection Manual (Section 2.1)
http://www.cdc.gov/nceh/publications/books/inspectionmanual/(free)
Site:•• Fencing & gates•• Grounds or pavement•• Children’s play areas•• Other
Building Exterior:•• Doors•• Fire escapes•• Foundations•• Lighting•• Roofs•• Walls•• Windows
Building Systems:•• Central water supply or sewage system•• Electrical systems•• Fire protection•• HVAC
Common Areas:•• Elevators•• Signage•• Smoking Areas•• Interior Trash•• Outlets, switches, cover plates•• Smoke and CO detectors•• Walkways/steps•• Ceiling•• Floors
Housing Unit:•• Bathroom•• Ceiling, floors, and walls•• Doors•• Electrical•• Water heater•• HVAC system•• Kitchen•• Laundry area•• Lighting•• Patio/porch/deck/balcony•• Smoke and CO detectors•• Stairs•• Windows
Other Items:•• Garbage and debris•• Injury hazards•• Childproofing measures•• Poisoning hazards•• Pest hazards•• Moisture hazards•• Swimming pool/spa/whirlpool•• Other hazards
To provide jurisdictions (environmental health professionals, housing managers, specialists, inspectors, nurses, outreach workers, and other interested in preventing illness and injury due to residential hazards) with tools to address-housing-related hazards and develop a holistic approach to healthy housing.
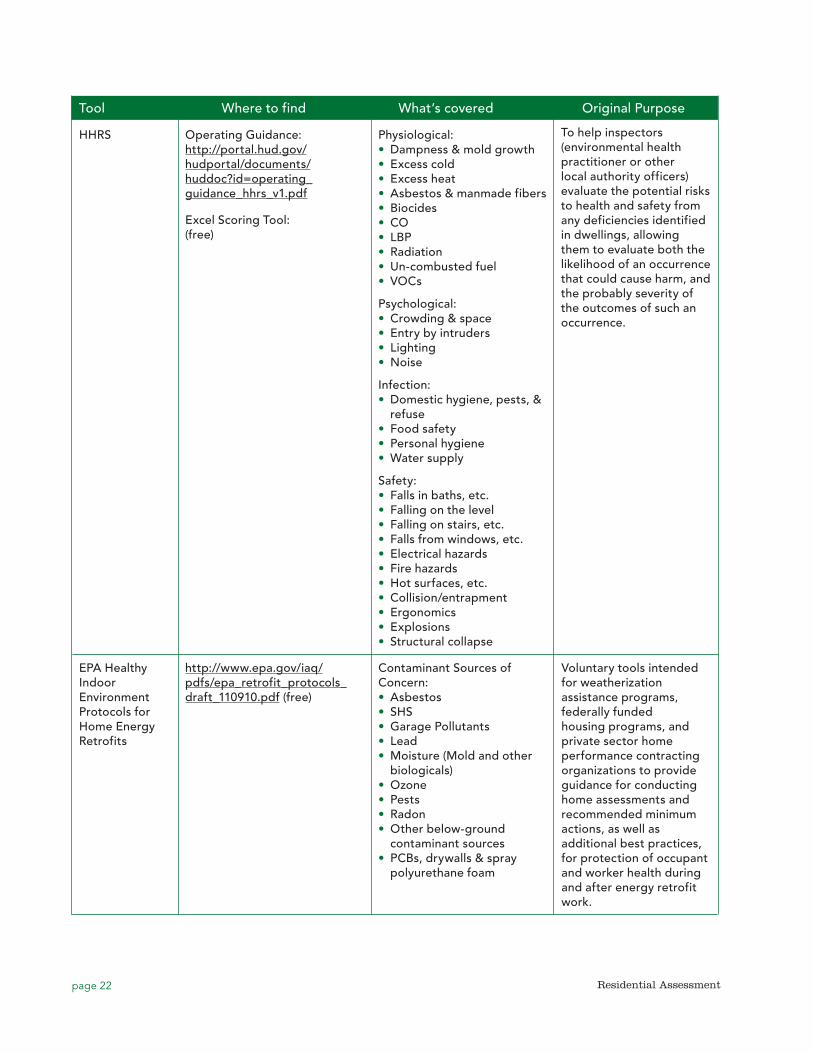
page 22 Residential Assessment
Tool Where to find What’s covered Original Purpose
HHRS Operating Guidance: http://portal.hud.gov/hudportal/documents/huddoc?id=operating_guidance_hhrs_v1.pdf
Excel Scoring Tool: (free)
Physiological:•• Dampness & mold growth•• Excess cold•• Excess heat•• Asbestos & manmade fibers•• Biocides•• CO•• LBP•• Radiation•• Un-combusted fuel•• VOCs
Psychological:•• Crowding & space•• Entry by intruders•• Lighting•• Noise
Infection:•• Domestic hygiene, pests, & refuse•• Food safety•• Personal hygiene•• Water supply
Safety:•• Falls in baths, etc.•• Falling on the level•• Falling on stairs, etc.•• Falls from windows, etc.•• Electrical hazards•• Fire hazards•• Hot surfaces, etc.•• Collision/entrapment•• Ergonomics•• Explosions•• Structural collapse
To help inspectors (environmental health practitioner or other local authority officers) evaluate the potential risks to health and safety from any deficiencies identified in dwellings, allowing them to evaluate both the likelihood of an occurrence that could cause harm, and the probably severity of the outcomes of such an occurrence.
EPA Healthy Indoor Environment Protocols for Home Energy Retrofits
http://www.epa.gov/iaq/pdfs/epa_retrofit_protocols_draft_110910.pdf (free)
Voluntary tools intended for weatherization assistance programs, federally funded housing programs, and private sector home performance contracting organizations to provide guidance for conducting home assessments and recommended minimum actions, as well as additional best practices, for protection of occupant and worker health during and after energy retrofit work.
Contaminant Sources of Concern: •• Asbestos•• SHS•• Garage Pollutants•• Lead•• Moisture (Mold and other biologicals)•• Ozone•• Pests•• Radon•• Other below-ground contaminant sources•• PCBs, drywalls & spray polyurethane foam
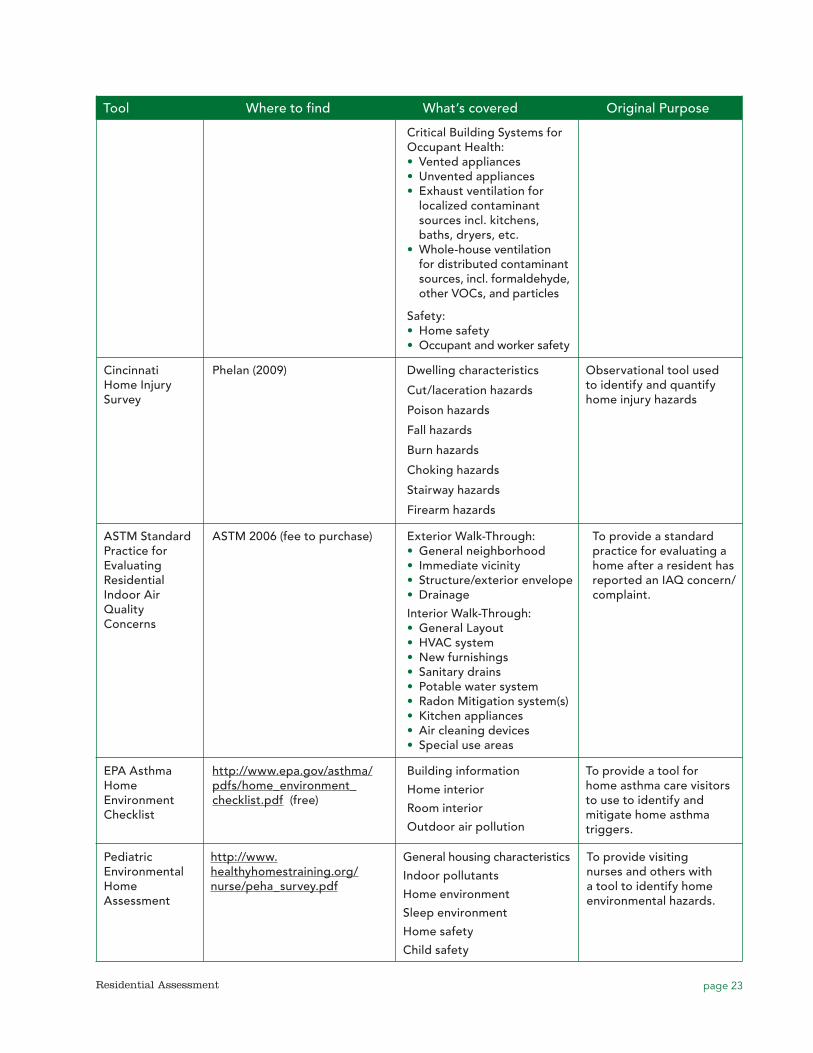
page 23Residential Assessment
Tool Where to find What’s covered Original Purpose
Critical Building Systems for Occupant Health:•• Vented appliances•• Unvented appliances•• Exhaust ventilation for localized contaminant sources incl. kitchens, baths, dryers, etc.
•• Whole-house ventilation for distributed contaminant sources, incl. formaldehyde, other VOCs, and particles
Safety:•• Home safety•• Occupant and worker safety
Cincinnati Home Injury Survey
Phelan (2009) Dwelling characteristics
Cut/laceration hazards
Poison hazards
Fall hazards
Burn hazards
Choking hazards
Stairway hazards
Firearm hazards
Observational tool used to identify and quantify home injury hazards
ASTM Standard Practice for Evaluating Residential Indoor Air Quality Concerns
ASTM 2006 (fee to purchase) Exterior Walk-Through:•• General neighborhood•• Immediate vicinity•• Structure/exterior envelope•• Drainage
Interior Walk-Through:•• General Layout•• HVAC system•• New furnishings•• Sanitary drains•• Potable water system•• Radon Mitigation system(s)•• Kitchen appliances•• Air cleaning devices•• Special use areas
To provide a standard practice for evaluating a home after a resident has reported an IAQ concern/complaint.
EPA Asthma Home Environment Checklist
http://www.epa.gov/asthma/pdfs/home_environment_checklist.pdf (free)
Building information
Home interior
Room interior
Outdoor air pollution
To provide a tool for home asthma care visitors to use to identify and mitigate home asthma triggers.
Pediatric Environmental Home Assessment
http://www.healthyhomestraining.org/nurse/peha_survey.pdf
General housing characteristics
Indoor pollutants
Home environment
Sleep environment
Home safety
Child safety
To provide visiting nurses and others with a tool to identify home environmental hazards.
page 24 Residential Assessment
includes a data dictionary that provides detailed definitions of each item included in the visual assessment, by physical component category. This appendix cross-references International Property Maintenance Codes (IPMC), with the IPMC code provisions listed in Appendix 2 of the HHIM. Finally, Appendix 3 lists links to optional environmental sampling methods on the internet and selected web references for Healthy Homes Issues.
As noted in its preface, the HHIM was designed to be used “as is” or modified by local jurisdictions. Jurisdictions choosing to use the HHIM should carefully review it to ensure that each question addresses the situations inspectors are likely to encounter. Some questions only allow an inspector to document deficiencies, not to record that a home is not designed to have the component in question. For example, a fire escape question allows the inspector to document that no fire escape is present, but this is considered a deficiency. Because many homes are not designed to have fire escapes, jurisdictions may need to add a “not designed to have fire escape” option. In other questions, the inspector is unable to record that he/she was unable to observe a particular component. For example, some inspectors may not be able to observe the roofs of tall buildings, or observe electrical wiring insulation hidden inside walls, but these types of questions do not include a “not observed” option.
2.2 Healthy Home Rating System (HHRS)
HUD’s HHRS is based on the same approach to identifying health and safety hazards in the home as successfully implemented in the British Housing Health and Safety Rating System (HHSRS) (Office of the Deputy Prime Minister, 2004). Using the HHRS, the residential assessor examines 29 hazards and determines the risk to the occupant (i.e., the likelihood of each hazard causing harm and the severity of the harm should it occur). A priority ranking of hazards is generated based on the estimated risks of potential harm to the most vulnerable occupants. Although it admittedly depends on professional judgment to determine the severity of dangers in a dwelling, the HHRS is evidence-based, supported by “extensive reviews of the literature and by detailed analyses of statistical
data on the impact of housing conditions on health.” Users of this tool base their conclusions on the condition of the whole dwelling after carrying out an in-depth visual inspection. Because potential housing hazards have a wide range of characteristics, the HHRS uses a formula to calculate a numerical score, to allow comparison of the both major and minor health and safety hazards. The HHRS does not take into consideration the feasibility, cost, or extent of any remedial action that may be considered once the hazards are assessed. In addition to the dwelling itself, residential assessors inspect paths, yards, gardens, and outbuildings associated with the dwelling, and in multi-unit buildings, the assessors inspect rooms, passageways, circulation areas, and facilities that are shared or used in common with others and common structural elements such as the roof, walls, and foundations. For each hazard, assessors judge “the likelihood, over the next twelve months, of an occurrence that could results in harm to a member of the vulnerable group; and the range of potential outcomes from such an occurrence.” Using these two judgments, assessors calculate a numerical hazard score for each of the 29 hazards (see Table 4).
The inspector uses three sets of figures to generate a hazard score:
•• Weighting for each of four Classes of Harm (extreme, weighting 10,000; severe, weighting 1,000; serious, weighting 300; and moderate, weighting 10) reflecting the degree of incapacity to the victim resulting from the occurrence;
•• Likelihood of an occurrence involving a member of a vulnerable group, expressed as a ratio (determined by informed professional judgment); and
•• The spread of possible harms resulting from an occurrence, expressed by percentage for each of the four classes of harm (determined by informed professional judgment).
Therefore, the HHRS Formula is calculated as the sum of the products of the weightings for each Class of Harm that could result from the particular hazard, multiplied by the likelihood of an occurrence, and multiplied by the set of percentages showing the spread of Harms (see Table 5).
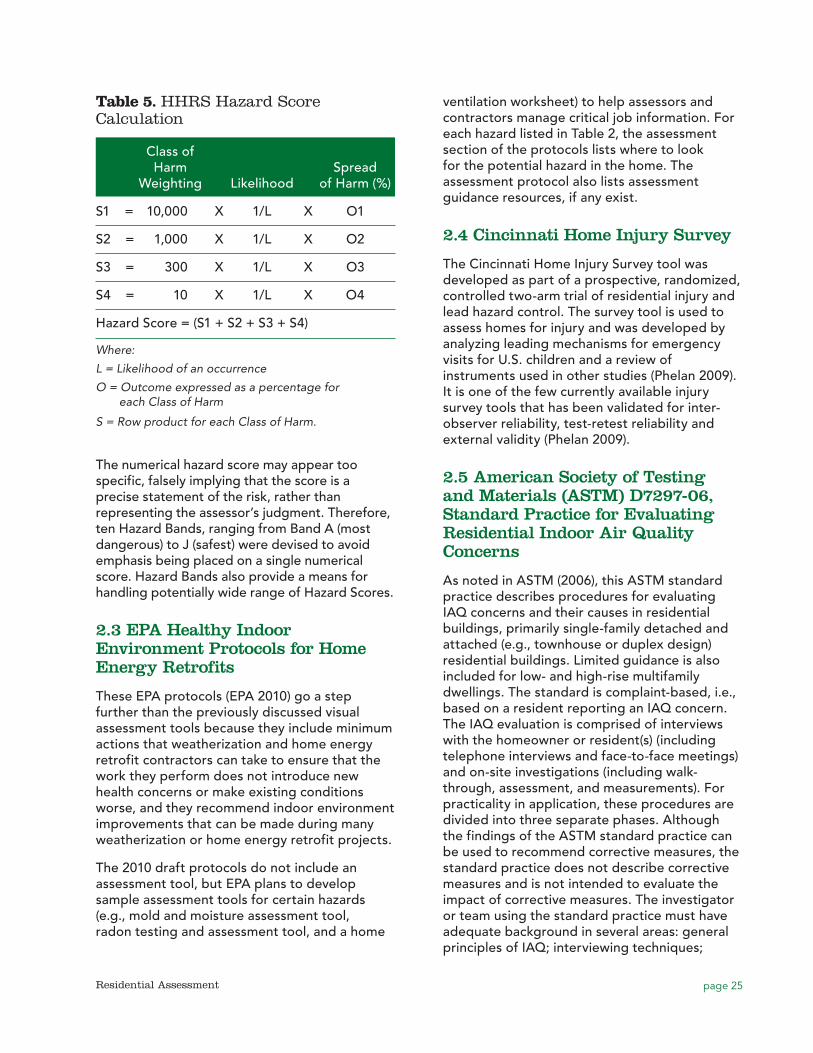
page 25Residential Assessment
ventilation worksheet) to help assessors and contractors manage critical job information. For each hazard listed in Table 2, the assessment section of the protocols lists where to look for the potential hazard in the home. The assessment protocol also lists assessment guidance resources, if any exist.
2.4 Cincinnati Home Injury Survey
The Cincinnati Home Injury Survey tool was developed as part of a prospective, randomized, controlled two-arm trial of residential injury and lead hazard control. The survey tool is used to assess homes for injury and was developed by analyzing leading mechanisms for emergency visits for U.S. children and a review of instruments used in other studies (Phelan 2009). It is one of the few currently available injury survey tools that has been validated for inter-observer reliability, test-retest reliability and external validity (Phelan 2009).
2.5 American Society of Testing and Materials (ASTM) D7297-06, Standard Practice for Evaluating Residential Indoor Air Quality Concerns
As noted in ASTM (2006), this ASTM standard practice describes procedures for evaluating IAQ concerns and their causes in residential buildings, primarily single-family detached and attached (e.g., townhouse or duplex design) residential buildings. Limited guidance is also included for low- and high-rise multifamily dwellings. The standard is complaint-based, i.e., based on a resident reporting an IAQ concern. The IAQ evaluation is comprised of interviews with the homeowner or resident(s) (including telephone interviews and face-to-face meetings) and on-site investigations (including walk-through, assessment, and measurements). For practicality in application, these procedures are divided into three separate phases. Although the findings of the ASTM standard practice can be used to recommend corrective measures, the standard practice does not describe corrective measures and is not intended to evaluate the impact of corrective measures. The investigator or team using the standard practice must have adequate background in several areas: general principles of IAQ; interviewing techniques;
The numerical hazard score may appear too specific, falsely implying that the score is a precise statement of the risk, rather than representing the assessor’s judgment. Therefore, ten Hazard Bands, ranging from Band A (most dangerous) to J (safest) were devised to avoid emphasis being placed on a single numerical score. Hazard Bands also provide a means for handling potentially wide range of Hazard Scores.
2.3 EPA Healthy Indoor Environment Protocols for Home Energy Retrofits
These EPA protocols (EPA 2010) go a step further than the previously discussed visual assessment tools because they include minimum actions that weatherization and home energy retrofit contractors can take to ensure that the work they perform does not introduce new health concerns or make existing conditions worse, and they recommend indoor environment improvements that can be made during many weatherization or home energy retrofit projects.
The 2010 draft protocols do not include an assessment tool, but EPA plans to develop sample assessment tools for certain hazards (e.g., mold and moisture assessment tool, radon testing and assessment tool, and a home
Table 5. HHRS Hazard Score Calculation
Class of Harm Spread Weighting Likelihood of Harm (%)
S1 = 10,000 X 1/L X O1
S2 = 1,000 X 1/L X O2
S3 = 300 X 1/L X O3
S4 = 10 X 1/L X O4
Hazard Score = (S1 + S2 + S3 + S4)
Where:
L = Likelihood of an occurrence
O = Outcome expressed as a percentage for each Class of Harm
S = Row product for each Class of Harm.
page 26 Residential Assessment
building design and construction practices; basic understanding of heating and cooling systems and appliances; use of IAQ measurement equipment; interpretation of IAQ data; and technical report writing. Issues covered by the standard include building air tightness and airflows, water and moisture damage, soil gas entry, potable water supply, and sanitary drains. The visual survey section of the ASTM standard practice is not designed to be a stand-alone tool. Rather, it is the second in a series of steps that ASTM notes are necessary to perform a comprehensive IAQ evaluation, including interviewing the building owner or occupant; having an on-site meeting and conducting a walk-through visual survey; developing hypotheses on potential causes of complaints; determining measurement parameters and instrumentation; determining the need and feasibility of monitoring, and if appropriate, conducting monitoring; analyzing data and evaluating hypotheses; and developing a report on findings. Critical purposes underlying these steps and procedures involved are described. The relationships among the steps are illustrated through a flow diagram. An example format of the exterior/interior walk-through investigation tool is provided in an appendix to the standard.
2.6 EPA Asthma Home Visit Checklist
This checklist (EPA 2004b) was designed for use by home care visitors to identify and mitigate environmental asthma triggers commonly found in and around the home, so that the home care visitors can better educate and equip asthma patients with the tools to manage their disease in coordination with their physician’s care. Asthma triggers covered by the checklist include dust mites, pests (cockroaches and rodents), warm-blooded pets (e.g., cats and dogs), mold, secondhand smoke, and nitrogen dioxide.
2.7 Pediatric Environmental Home Assessment (PEHA) Survey
The PEHA survey (NCHH 2012) was designed to help nurses and others who conduct home visit identify potential home environmental hazards. The PEHA survey contains one page of resident-reported information and two pages of nurse-observed information. It is designed to be used
with a second form, the PEHA Nursing Care Plan, which uses the information gleaned from the PEHA survey to identify actions to be taken in the home to mitigate hazards.
3.0 Occupant Survey ToolsMany survey tools have been used by housing programs, public health programs, and researchers; however, this section focuses on national tools that are likely to be updated and remain available over the course of time. Many of the locally used tools were derived from one or more of these national tools. For example, HUD Healthy Homes Initiative grantees have used modified versions of the National Health Interview Survey (NHIS) to create questionnaires that fit the needs of their particular demonstration projects or technical studies.
Table 6 lists six occupant survey tools, where they may be accessed online, topics covered by each (e.g., types of hazards), and the original purpose of each. These are voluntary tools and do not set new regulatory standards, establish legal and/or complete compliance with local, state, federal or other applicable housing, building, health, safety or other applicable policies, codes, regulations, statutes and laws.
3.1 Healthy Housing Inspection Manual (HHIM)
The voluntary resident questionnaire tool of the HHIM (Section 1 of CDC/HUD 2008) is used to collect information that cannot be determined visually. CDC/HUD recommends conducting the questionnaire prior to the visual assessment to obtain clues that may point to housing deficiencies that the inspector can then use when conducting the visual assessment (see Section 2.1). Table 6 lists the 5 major sections of the questionnaire.
3.2 National Health Interview Survey (NHIS)
CDC’s NHIS has been used to monitor the health of the U.S. since 1957. As shown in Table 6, the NHIS covers a broad range of health topics, including cardiovascular, respiratory, and mental health, as well as questions related to joint pain/
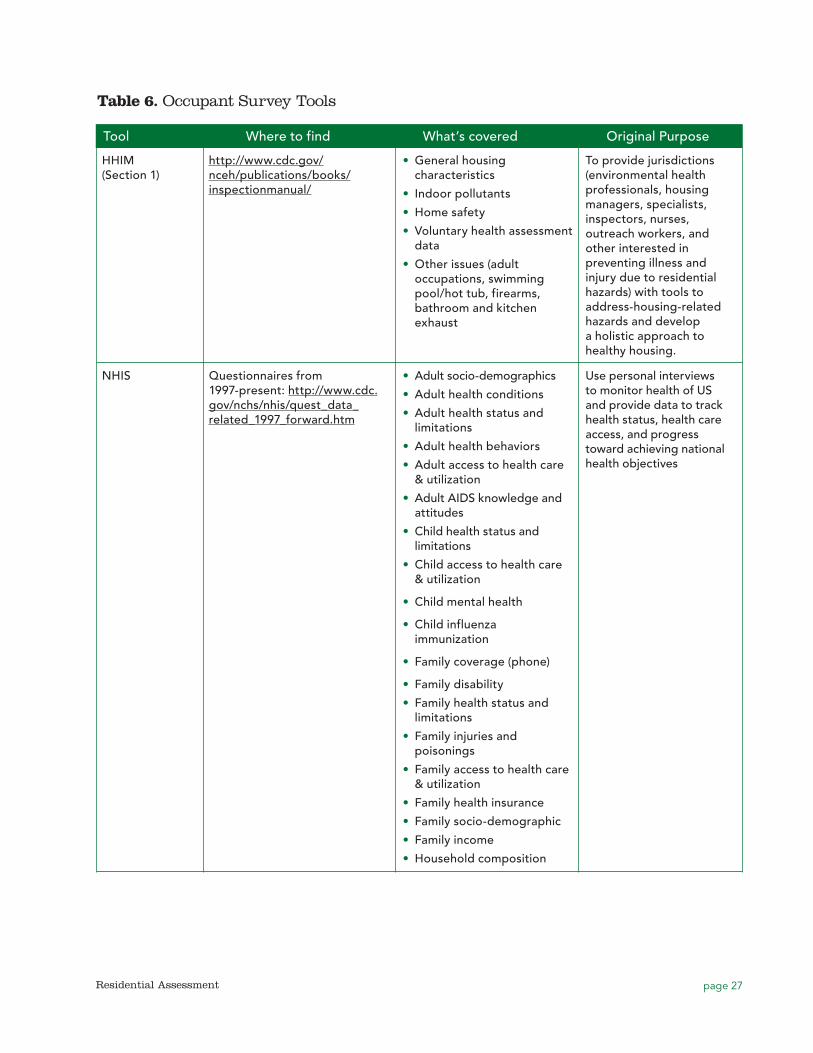
page 27Residential Assessment
Table 6. Occupant Survey Tools
HHIM (Section 1)
Tool Where to find What’s covered Original Purpose
http://www.cdc.gov/nceh/publications/books/inspectionmanual/
•• General housing characteristics
•• Indoor pollutants
•• Home safety
•• Voluntary health assessment data
•• Other issues (adult occupations, swimming pool/hot tub, firearms, bathroom and kitchen exhaust
To provide jurisdictions (environmental health professionals, housing managers, specialists, inspectors, nurses, outreach workers, and other interested in preventing illness and injury due to residential hazards) with tools to address-housing-related hazards and develop a holistic approach to healthy housing.
NHIS Questionnaires from 1997-present: http://www.cdc.gov/nchs/nhis/quest_data_related_1997_forward.htm
•• Adult socio-demographics
•• Adult health conditions
•• Adult health status and limitations
•• Adult health behaviors
•• Adult access to health care & utilization
•• Adult AIDS knowledge and attitudes
•• Child health status and limitations
•• Child access to health care & utilization
•• Child mental health
•• Child influenza immunization
•• Family coverage (phone)
•• Family disability
•• Family health status and limitations
•• Family injuries and poisonings
•• Family access to health care & utilization
•• Family health insurance
•• Family socio-demographic
•• Family income
•• Household composition
Use personal interviews to monitor health of US and provide data to track health status, health care access, and progress toward achieving national health objectives
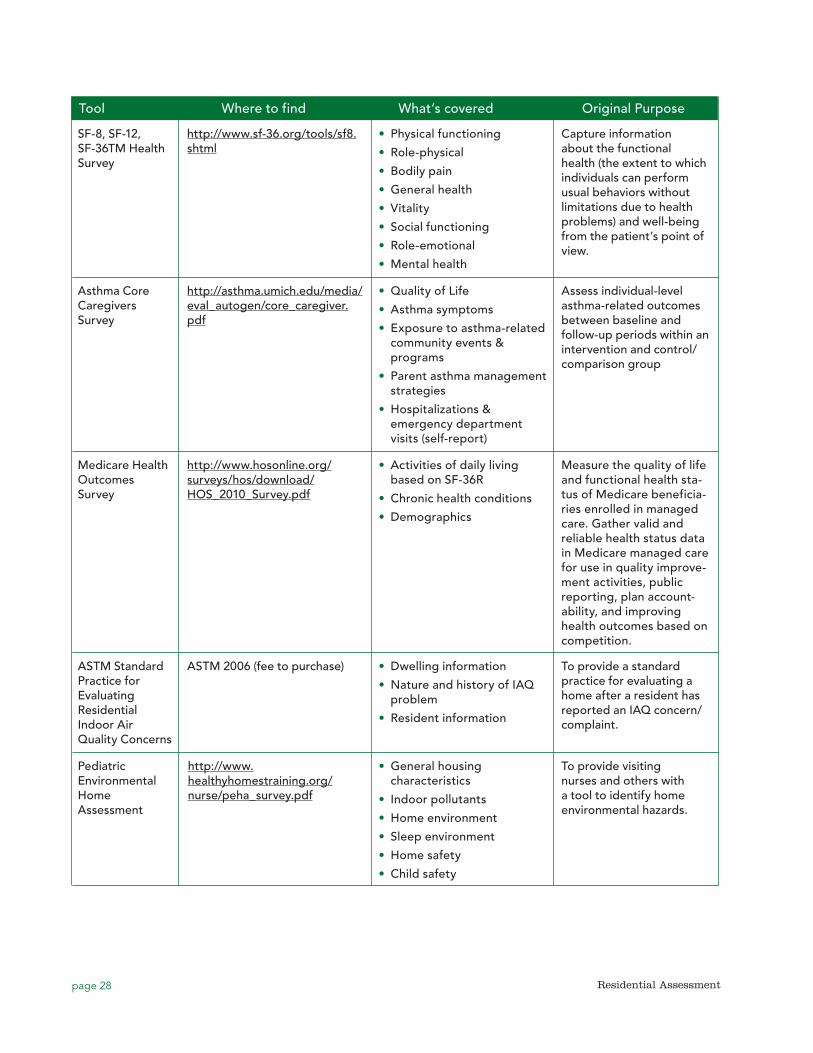
page 28 Residential Assessment
Tool Where to find What’s covered Original Purpose
SF-8, SF-12, SF-36TM Health Survey
http://www.sf-36.org/tools/sf8.shtml
•• Physical functioning
•• Role-physical
•• Bodily pain
•• General health
•• Vitality
•• Social functioning
•• Role-emotional
•• Mental health
Capture information about the functional health (the extent to which individuals can perform usual behaviors without limitations due to health problems) and well-being from the patient’s point of view.
Asthma Core Caregivers Survey
http://asthma.umich.edu/media/eval_autogen/core_caregiver.pdf
•• Quality of Life
•• Asthma symptoms
•• Exposure to asthma-related community events & programs
•• Parent asthma management strategies
•• Hospitalizations & emergency department visits (self-report)
Assess individual-level asthma-related outcomes between baseline and follow-up periods within an intervention and control/comparison group
Medicare Health Outcomes Survey
http://www.hosonline.org/surveys/hos/download/HOS_2010_Survey.pdf
•• Activities of daily living based on SF-36R
•• Chronic health conditions
•• Demographics
Measure the quality of life and functional health sta-tus of Medicare beneficia-ries enrolled in managed care. Gather valid and reliable health status data in Medicare managed care for use in quality improve-ment activities, public reporting, plan account-ability, and improving health outcomes based on competition.
ASTM Standard Practice for Evaluating Residential Indoor Air Quality Concerns
ASTM 2006 (fee to purchase) •• Dwelling information
•• Nature and history of IAQ problem
•• Resident information
To provide a standard practice for evaluating a home after a resident has reported an IAQ concern/complaint.
Pediatric Environmental Home Assessment
http://www.healthyhomestraining.org/nurse/peha_survey.pdf
•• General housing characteristics
•• Indoor pollutants
•• Home environment
•• Sleep environment
•• Home safety
•• Child safety
To provide visiting nurses and others with a tool to identify home environmental hazards.
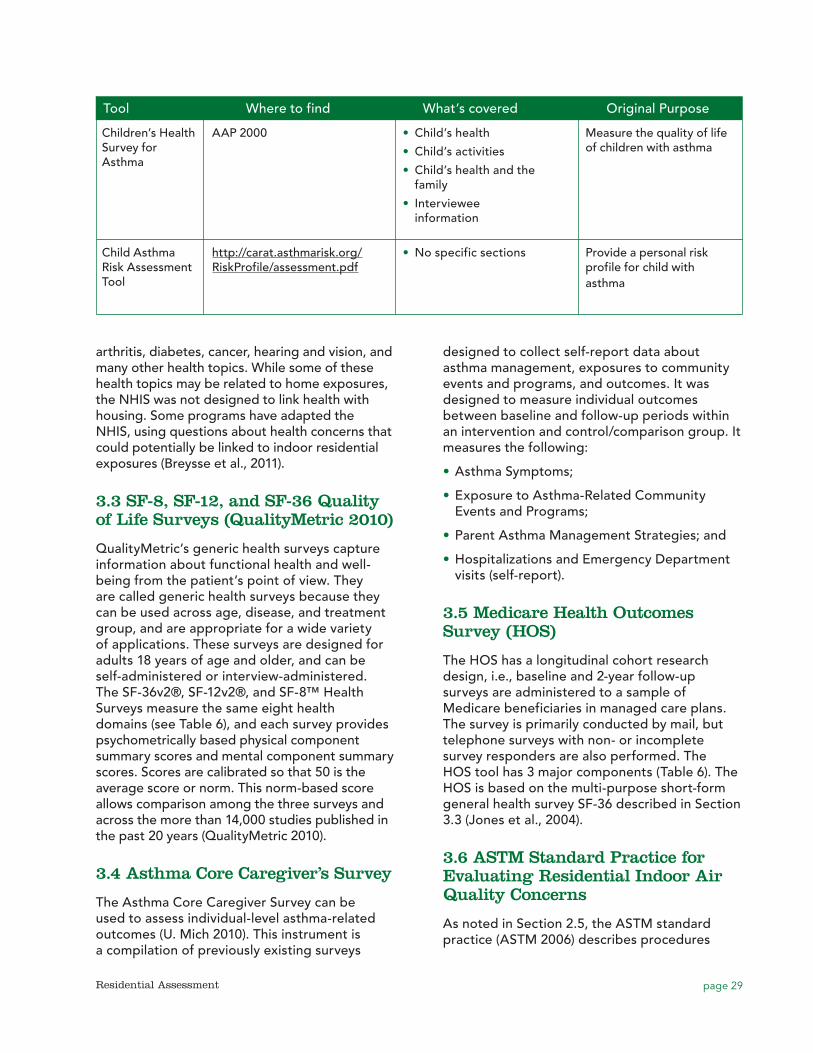
page 29Residential Assessment
Tool Where to find What’s covered Original Purpose
Children’s Health Survey for Asthma
AAP 2000 •• Child’s health
•• Child’s activities
•• Child’s health and the family
•• Interviewee information
Measure the quality of life of children with asthma
Child Asthma Risk Assessment Tool
http://carat.asthmarisk.org/RiskProfile/assessment.pdf
•• No specific sections Provide a personal risk profile for child with asthma
arthritis, diabetes, cancer, hearing and vision, and many other health topics. While some of these health topics may be related to home exposures, the NHIS was not designed to link health with housing. Some programs have adapted the NHIS, using questions about health concerns that could potentially be linked to indoor residential exposures (Breysse et al., 2011).
3.3 SF-8, SF-12, and SF-36 Quality of Life Surveys (QualityMetric 2010)
QualityMetric’s generic health surveys capture information about functional health and well-being from the patient’s point of view. They are called generic health surveys because they can be used across age, disease, and treatment group, and are appropriate for a wide variety of applications. These surveys are designed for adults 18 years of age and older, and can be self-administered or interview-administered. The SF-36v2®, SF-12v2®, and SF-8™ Health Surveys measure the same eight health domains (see Table 6), and each survey provides psychometrically based physical component summary scores and mental component summary scores. Scores are calibrated so that 50 is the average score or norm. This norm-based score allows comparison among the three surveys and across the more than 14,000 studies published in the past 20 years (QualityMetric 2010).
3.4 Asthma Core Caregiver’s Survey
The Asthma Core Caregiver Survey can be used to assess individual-level asthma-related outcomes (U. Mich 2010). This instrument is a compilation of previously existing surveys
designed to collect self-report data about asthma management, exposures to community events and programs, and outcomes. It was designed to measure individual outcomes between baseline and follow-up periods within an intervention and control/comparison group. It measures the following:
•• Asthma Symptoms;
•• Exposure to Asthma-Related Community Events and Programs;
•• Parent Asthma Management Strategies; and
•• Hospitalizations and Emergency Department visits (self-report).
3.5 Medicare Health Outcomes Survey (HOS)
The HOS has a longitudinal cohort research design, i.e., baseline and 2-year follow-up surveys are administered to a sample of Medicare beneficiaries in managed care plans. The survey is primarily conducted by mail, but telephone surveys with non- or incomplete survey responders are also performed. The HOS tool has 3 major components (Table 6). The HOS is based on the multi-purpose short-form general health survey SF-36 described in Section 3.3 (Jones et al., 2004).
3.6 ASTM Standard Practice for Evaluating Residential Indoor Air Quality Concerns
As noted in Section 2.5, the ASTM standard practice (ASTM 2006) describes procedures
page 30 Residential Assessment
for responding to resident IAQ concerns and complaints, to identify the cause of the IAQ concern in primarily single-family detached and attached (e.g., townhouse or duplex design) residential buildings. The first step of the standard practice is to conduct an initial interview, most likely by telephone, to gather information concerning the dwelling, nature and history of the problem, and resident contact information. An example format of the telephone questionnaire is included in an appendix to the standard practice.
3.7 Pediatric Environmental Home Assessment Survey
As noted in Section 2.7, the PEHA survey (NCHH 2012) includes a resident interview component to gather data on general housing characteristics and indoor pollutants, including mold, pets, pests, lead paint, asbestos, radon, health and safety alarms, tobacco smoke, other irritants, and cleaning practices.
3.8 Children’s Health Survey for Asthma
The American Academy of Pediatrics (AAP) Children’s Health Survey for Asthma (AAP 2000) was designed to measure the quality of life of children with asthma. The instrument includes a broad spectrum of child- and family-focused items divided into five scales (physical health, 15 items; activity [child], 5 items; activity [family], 6 items; emotional health [child], 5 items; and emotional health [family], 17 items) as well as questions about health care utilization, asthma triggers, and family demographics. All scale items require subjects to respond on a 5-point Likert-type scale, with higher scores indicating better or more positive outcomes. Two-, 4-, and 8-week recall versions have been tested. The reading level of the CHSA has been reviewed professionally and assessed to be at the sixth grade level. It has been shown to display high reliability and validity (Asmussen 2000).
3.9 Child Asthma Risk Assessment Tool (CARAT)
The CARAT (AHRQ 2008) provides a personal risk profile for a child with asthma. A detailed questionnaire looks at a variety of potential risks
for a child and then reports on those factors affecting that child. It is designed to help clinicians, asthma counselors, and parents determine potential risks for children with asthma. It asks several questions about home asthma triggers, including questions about pillow and mattress covers, humidifiers, carpeting, gas appliances, mold in the home, pets, pests, and smoking.
4.0 Environmental Data CollectionCollection of environmental samples in dust, air, and bulk building materials allows direct, quantitative measurement of a wide range of hazard indicators such as allergens, molds, pesticides and other toxic substances. However, as can be seen from the history of lead risk assessment, appropriate interpretation of these quantitative measures in terms of exposure and risk is quite difficult, because for many substances, significant questions remain concerning risk factors and levels of concern.
4.1 General Considerations in Environmental Sampling
4.1.1 Surface dust sampling
Surface, or settled, dust sampling is commonly used to estimate environmental levels and hazard potential for allergens, lead, and various other toxic substances associated with settled particulate matter. Results are typically expressed as either concentration (units of weight of substance per weight of dust) or loading (units of weight of substance per unit of area sampled). Many toxic substances found in settled dust are primarily inhalation hazards and therefore pose hazards to residents only when the dust is disturbed (e.g., through walking on floors) and becomes airborne. Because many toxic substances in settled dust are either larger particles themselves or adhere to larger particles that settle quickly from the air, settled dust samples may not be highly representative of inhalation exposure hazards; however, dust sampling is much simpler and less expensive than air sampling; therefore, settled dust sample results are often used as a surrogate of exposure.
Dust samples are collected using either a suction device or wipe sampling. In residential
page 31Residential Assessment
et al., 1995; NAS, 2000). For example, Wang et al. (1995) observed that when collecting dust with a vacuum sampler from a shag carpet surface, lower relative humidity (e.g., around 20 percent, as would be encountered during a dry, cold season) increased the intensity of the electrostatic field on the carpet and thus significantly decreased the collection efficiency of the vacuum. However, few people who collect such samples for non-research purposes will be concerned with this level of detail.
Arbes et al. (2005) evaluated the feasibility of having subjects collect their own home dust samples. Results of the study, which compared allergen concentrations between subject- and technician-collected samples (n=102), indicated that correlations between subject- and technician-collected samples were strong for concentrations of cat allergen and dust mite allergen, although subjects collected lighter dust weight samples. The authors concluded that, with some limitations, subject-collected dust sampling appears to be a valid and practical option for epidemiologic and clinical studies that report allergen concentration as a measure of exposure.
4.1.2 Air sampling
Air sampling may be used to estimate resident exposure to both particulate materials (e.g., allergens, mold spores, and SHS), as well as gases and vapors (e.g., nitrogen oxides, sulfur oxides, CO, radon, formaldehyde, and VOCs). When designing air sampling plans, resident assessors must consider the advantages and disadvantages of active vs. passive sampling methods, area vs. breathing zone sample locations, and lab analysis versus direct-reading instrumentation.
4.1.2.1 Active versus passive sampling
Since people breathe generally low concentrations of airborne contaminants, active sampling, in which a pump pulls contaminated air into the sampling device (e.g., filter) for a fixed amount of time, is the most frequently used method. Active methods yield samples with enough mass to allow reliable lab analysis
investigations, hand-held vacuums with special dust collection filters are typically used. For example, HUD has developed a recommended “Vacuum Dust Sample Collection Protocol for Allergens” for use by HUD Healthy Homes Initiative grantees (HUD 2008). The protocol is adapted from sampling methods used in the National Survey of Lead and Allergens in Housing (NSLAH) and the Inner-City Asthma Study, and it is supported by a companion HUD document, “Background and Justification for a Vacuum Sampling Protocol for Allergens in Household Dust” (HUD, 2004). A hand-held portable electric-powered vacuum cleaner with a dust collection device (e.g., filter, sleeve, or thimble) is recommended. Most electric-powered canister vacuum cleaners are essentially equivalent in their measurement of indoor allergens, but it is necessary to choose a model that can accommodate the dust collection device (HUD 2008).
Another type of dust vacuum sampling device is the High Volume Sampler (HVS3 and HVS4) developed by Envirometrics for EPA to collect surface dust for measurement of lead, pesticides, allergens, and other contaminants. In general, it collects more dust in a sample than hand-held vacuums and maintains uniform sampling conditions by measuring and controlling air flow and pressure drop across the sampling nozzle. ASTM has developed Standard D-5438-94 for the HVS3.
A 2001 study compared three different vacuum methods for sampling allergens in settled dust: hand-held vacuum, cyclone HVS3 sampler, and canister vacuum (Mansour et al. 2001). Researchers were unable to identify the “best” vacuum method based on study results. Cat allergen results from HVS3 cyclone and canister vacuum samples were more significantly associated with serum-specific IgE levels in resident children than cat allergen results from the hand-held vacuum samples. For dust mites, however, the HVS3 and the hand-held vacuum methods correlated with IgE, but the canister vacuum did not.
Various factors, including design of the vacuum device, characteristics of the surface sampled (e.g., carpet vs. smooth floor, type of carpet), and other environmental characteristics (e.g., relative humidity) have all been shown to affect the efficiency of vacuum dust collection (Wang
page 32 Residential Assessment
(Lippmann 2009). For airborne particulates, collection media may run through impactors or cyclones that can limit particle sizes reaching the filter. For gases and vapors, dry collection media, such as carbon, silica gel, or other adsorptive surfaces are far more common than liquid-based samplers (e.g., impingers) (Lippmann 2009). Both high-volume (60 to 1100 L/min) and low-volume (4 to 20 L/min) filter samplers can be used, although low-volume samplers may better approximate breathing volumes of humans and thus better represent exposure. Sampler design and flow rate may affect the quantity and size of airborne particles sampled and thus can affect the apparent measured levels of a given airborne substance (O’Meara and Tovey, 2000). Active air sampling is more expensive than passive sampling because it has more specialized equipment and requires expertise to collect the sample (Lippmann 2009).
Passive static samplers, normally kept in a fixed location, rely on normal airflow or particle deposition to collect contaminants on a filter or settling plate. Passive methods are more commonly used for gases and vapors than for particulate matter and need longer sampling periods than active sampling to obtain enough mass. Gravitation or settling techniques are used to collect passive longer-term airborne allergen dust and mold spore samples that settle on a Petri dish or microscope slide placed in an open location for 7 to 14 days, described in units of ng/m3/day (O’Meara and Tovey, 2000). Settling techniques are non-volumetric and, due to large temporal and spatial variations, samples cannot be readily compared to one another or to active samples (Martyny, 1999; O’Meara and Tovey, 2000).
4.1.2.2 Area versus breathing zone air sampling locations
Assessors may collect air samples from fixed area locations in a home or the breathing zone of a person wearing the sampler. Area samplers provide a less accurate measure of personal exposure. Breathing zone samplers often yield higher levels of collected allergens than static samplers, likely due to the varying levels of dust that are re-suspended in the personal breathing zone as a result of human activity; however, only minor differences are observed during high levels of dust disturbance (O’Meara and Tovey, 2000).
4.1.2.3 Laboratory analysis versus direct-reading instrumentation
Air sample results can be obtained through laboratory analysis, read from direct-reading instruments onsite, or collected from dataloggers. Lab analysis must be designed to separate the contaminants of concern from other chemicals in the sample that may interfere with analysis. Air sampling with subsequent laboratory analysis is generally more accurate and precise for inhalation hazard assessment but is expensive and limited by the time delay between sample collection and the lab analysis (Lippmann 2009). Direct-reading instruments may be more useful when assessing acute exposures or immediately dangerous situations since they provide data on peak concentrations (e.g., CO asphyxiation hazards posed by a poorly operating stove) and can be used to pinpoint exposure sources in a home. However, direct-reading instruments are generally limited to relatively few gaseous air contaminants and general particulate matter (Lippmann 2009) and may have a higher detection limit than sampling with lab analysis. Real-time instruments provide a reading on digital display panels; therefore, no laboratory analysis is needed. A third type of instrument, a datalogger, while not a direct-reading instrument, also does not require lab analysis; however, their data cannot be seen while in the field unless their data are downloaded to a field computer using a tool called a shuttle.
4.2 Collection and Analysis of Environmental Samples
4.2.1 Allergens
Allergen exposure is typically measured by sampling either settled dust or air. Table 7 provides an overview of sampling strategies for selected residential allergen asthma triggers, while Table 8 summarizes the pros and cons of these strategies. These tables do not include various sampling devices primarily intended for the consumer since these are not routinely used in residential assessment by either programs or researchers.
Research indicates that season may not be a critical factor when collecting allergen samples. Although seasonal changes in temperature and
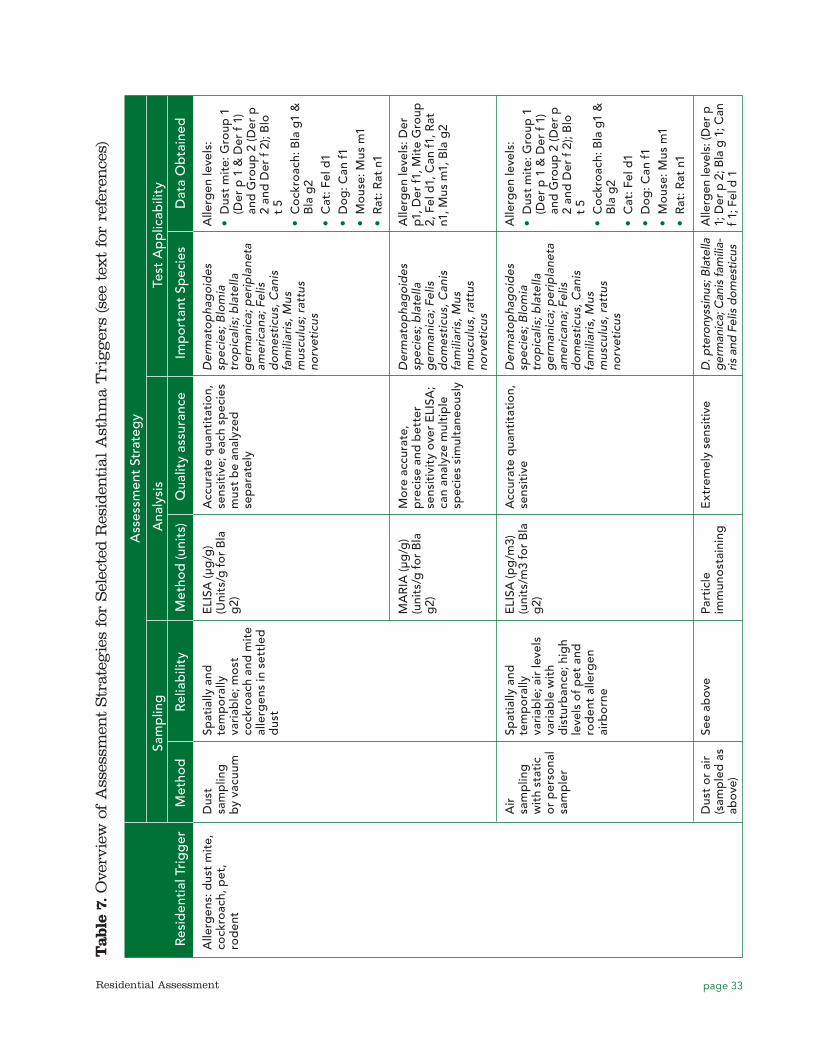
page 33Residential Assessment
Tab
le 7
. Ove
rvie
w o
f A
sses
smen
t Str
ateg
ies
for
Sel
ecte
d R
esid
enti
al A
sth
ma
Tri
gg
ers
(see
tex
t fo
r re
fere
nce
s)
A
sses
smen
t St
rate
gy
Sa
mp
ling
A
naly
sis
Test
Ap
plic
abili
ty
R
esid
enti
al T
rig
ger
M
etho
d
R
elia
bili
ty
Met
hod
(uni
ts)
Qua
lity
assu
ranc
e Im
po
rtan
t Sp
ecie
s D
ata
Ob
tain
ed
Alle
rgen
s: d
ust
mit
e,
cock
roac
h, p
et,
rod
ent
Dus
t sa
mp
ling
b
y va
cuum
Spat
ially
and
te
mp
ora
lly
vari
able
; mo
st
cock
roac
h an
d m
ite
alle
rgen
s in
set
tled
d
ust
ELI
SA (μ
g/g
) (U
nits
/g f
or
Bla
g
2)
Acc
urat
e q
uant
itat
ion,
se
nsit
ive;
eac
h sp
ecie
s m
ust
be
anal
yzed
se
par
atel
y
Der
mat
op
hag
oid
es
spec
ies;
Blo
mia
tr
op
ical
is; b
late
lla
ger
man
ica;
per
ipla
neta
am
eric
ana;
Fel
is
do
mes
ticu
s, C
anis
fa
mili
aris
, Mus
m
uscu
lus;
rat
tus
norv
etic
us
Alle
rgen
leve
ls:
••D
ust
mit
e: G
roup
1
(Der
p 1
& D
er f
1)
and
Gro
up 2
(Der
p
2 an
d D
er f
2);
Blo
t
5••C
ock
roac
h: B
la g
1 &
B
la g
2••C
at: F
el d
1••D
og
: Can
f1••M
ous
e: M
us m
1••R
at: R
at n
1
MA
RIA
(μg
/g)
(uni
ts/g
fo
r B
la
g2)
Mo
re a
ccur
ate,
p
reci
se a
nd b
ette
r se
nsit
ivit
y ov
er E
LISA
; ca
n an
alyz
e m
ulti
ple
sp
ecie
s si
mul
tane
ous
ly
Der
mat
op
hag
oid
es
spec
ies;
bla
tella
g
erm
anic
a; F
elis
d
om
esti
cus,
Can
is
fam
iliar
is, M
us
mus
culu
s, r
attu
s no
rvet
icus
Alle
rgen
leve
ls: D
er
p1, D
er f1
, Mit
e G
roup
2,
Fel
d1,
Can
f1, R
at
n1, M
us m
1, B
la g
2
Air
sa
mp
ling
w
ith
stat
ic
or
per
sona
l sa
mp
ler
Spat
ially
and
te
mp
ora
lly
vari
able
; air
leve
ls
vari
able
wit
h d
istu
rban
ce; h
igh
leve
ls o
f p
et a
nd
rod
ent
alle
rgen
ai
rbo
rne
ELI
SA (p
g/m
3)
(uni
ts/m
3 fo
r B
la
g2)
Acc
urat
e q
uant
itat
ion,
se
nsit
ive
Der
mat
op
hag
oid
es
spec
ies;
Blo
mia
tr
op
ical
is; b
late
lla
ger
man
ica;
per
ipla
neta
am
eric
ana;
Fel
is
do
mes
ticu
s, C
anis
fa
mili
aris
, Mus
m
uscu
lus,
rat
tus
norv
etic
us
Alle
rgen
leve
ls:
••D
ust
mit
e: G
roup
1
(Der
p 1
& D
er f
1)
and
Gro
up 2
(Der
p
2 an
d D
er f
2);
Blo
t
5••C
ock
roac
h: B
la g
1 &
B
la g
2••C
at: F
el d
1••D
og
: Can
f1••M
ous
e: M
us m
1••R
at: R
at n
1
Dus
t o
r ai
r (s
amp
led
as
abov
e)
See
abov
ePa
rtic
le
imm
uno
stai
ning
Ext
rem
ely
sens
itiv
eD
. pte
rony
ssin
us; B
late
lla
ger
man
ica;
Can
is fa
mili
a-ris
and
Fel
is d
omes
ticus
Alle
rgen
leve
ls: (
Der
p
1; D
er p
2; B
la g
1; C
an
f 1; F
el d
1
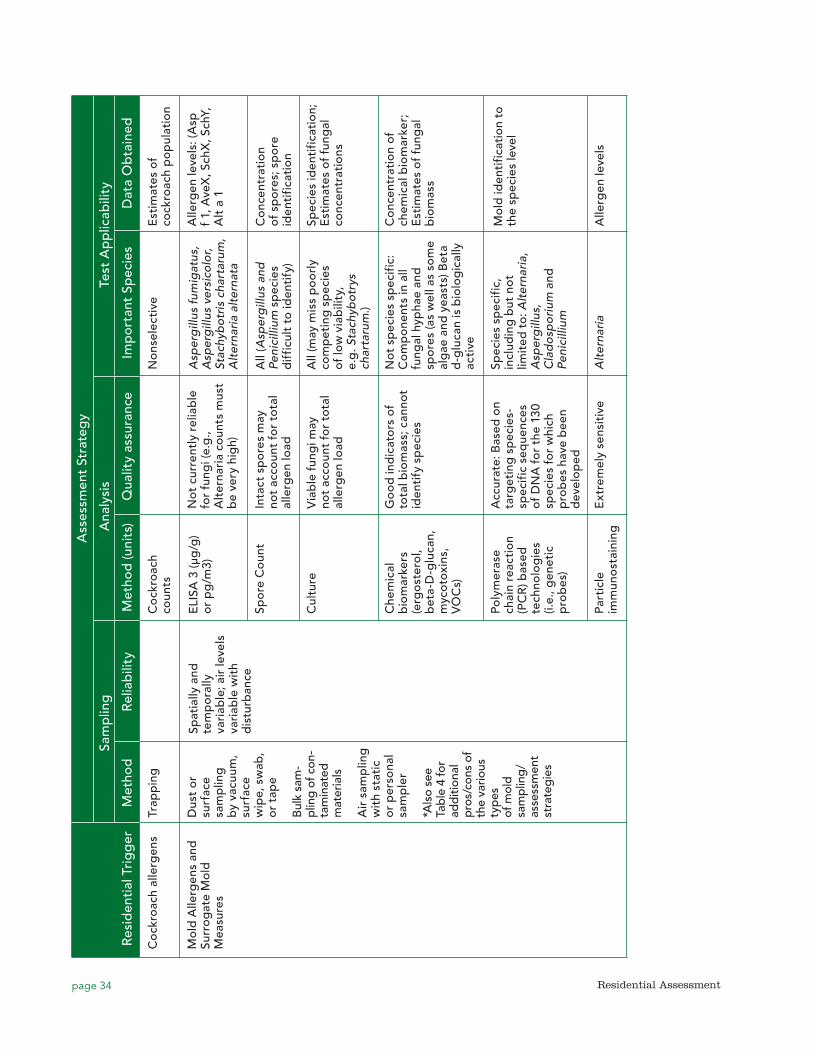
page 34 Residential Assessment
A
sses
smen
t St
rate
gy
Sa
mp
ling
A
naly
sis
Test
Ap
plic
abili
ty
R
esid
enti
al T
rig
ger
M
etho
d
R
elia
bili
ty
Met
hod
(uni
ts)
Qua
lity
assu
ranc
e Im
po
rtan
t Sp
ecie
s D
ata
Ob
tain
ed
Co
ckro
ach
alle
rgen
sTr
app
ing
Co
ckro
ach
coun
tsN
ons
elec
tive
Est
imat
es o
f co
ckro
ach
po
pul
atio
n
Mo
ld A
llerg
ens
and
Su
rro
gat
e M
old
M
easu
res
Dus
t o
r su
rfac
e sa
mp
ling
b
y va
cuum
, su
rfac
e w
ipe,
sw
ab,
or
tap
e
Bul
k sa
m-
plin
g of
con
-ta
min
ated
m
ater
ials
Air
sam
plin
g
wit
h st
atic
o
r p
erso
nal
sam
ple
r
*Als
o se
e Ta
ble
4 fo
r ad
diti
onal
p
ros/
cons
of
the
vario
us
typ
es
of m
old
sa
mp
ling
/ as
sess
men
t st
rate
gie
s
Spat
ially
and
te
mp
ora
lly
vari
able
; air
leve
ls
vari
able
wit
h d
istu
rban
ce
ELI
SA 3
(μg
/g)
or
pg
/m3)
N
ot
curr
entl
y re
liab
le
for
fung
i (e.
g.,
Alt
erna
ria
coun
ts m
ust
be
very
hig
h)
Asp
erg
illus
fum
igat
us,
Asp
erg
illus
ver
sico
lor,
Stac
hyb
otri
s ch
arta
rum
, A
lter
nari
a al
tern
ata
Alle
rgen
leve
ls: (
Asp
f
1, A
veX
, Sch
X, S
chY,
A
lt a
1
Spo
re C
oun
tIn
tact
sp
ore
s m
ay
not
acco
unt
for
tota
l al
lerg
en lo
ad
All
(Asp
erg
illus
and
Pe
nici
llium
sp
ecie
s d
iffi
cult
to
iden
tify
)
Co
ncen
trat
ion
of
spo
res;
sp
ore
id
enti
fica
tio
n
Cul
ture
Via
ble
fun
gi m
ay
not
acco
unt
for
tota
l al
lerg
en lo
ad
All
(may
mis
s p
oo
rly
com
pet
ing
sp
ecie
s o
f lo
w v
iab
ility
, e.
g. S
tach
ybot
rys
char
taru
m.)
Spec
ies
iden
tifi
cati
on;
E
stim
ates
of
fung
al
conc
entr
atio
ns
Che
mic
al
bio
mar
kers
(e
rgo
ster
ol,
bet
a-D
-glu
can,
m
yco
toxi
ns,
VO
Cs)
Go
od
ind
icat
ors
of
tota
l bio
mas
s; c
anno
t id
enti
fy s
pec
ies
No
t sp
ecie
s sp
ecif
ic:
Co
mp
one
nts
in a
ll fu
ngal
hyp
hae
and
sp
ore
s (a
s w
ell a
s so
me
alg
ae a
nd y
east
s) B
eta
d-g
luca
n is
bio
log
ical
ly
acti
ve
Co
ncen
trat
ion
of
chem
ical
bio
mar
ker;
E
stim
ates
of
fung
al
bio
mas
s
Poly
mer
ase
chai
n re
acti
on
(PC
R) b
ased
te
chno
log
ies
(i.e.
, gen
etic
p
rob
es)
Acc
urat
e: B
ased
on
targ
etin
g s
pec
ies-
spec
ific
seq
uenc
es
of
DN
A f
or
the
130
spec
ies
for
whi
ch
pro
bes
hav
e b
een
dev
elo
ped
Spec
ies
spec
ific
, in
clud
ing
but
no
t lim
ited
to:
Alt
erna
ria,
A
sper
gill
us,
Cla
do
spo
rium
and
Pe
nici
llium
Mo
ld id
enti
fica
tio
n to
th
e sp
ecie
s le
vel
Part
icle
im
mun
ost
aini
ngE
xtre
mel
y se
nsit
ive
Alt
erna
ria
Alle
rgen
leve
ls
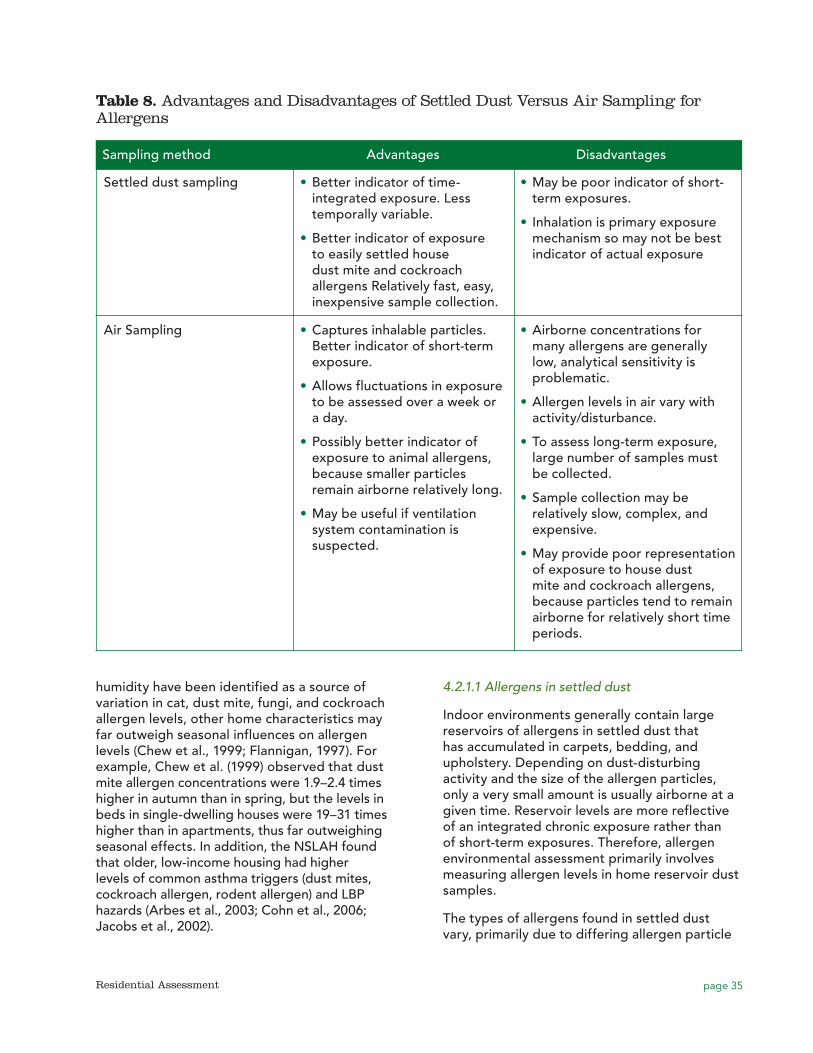
page 35Residential Assessment
humidity have been identified as a source of variation in cat, dust mite, fungi, and cockroach allergen levels, other home characteristics may far outweigh seasonal influences on allergen levels (Chew et al., 1999; Flannigan, 1997). For example, Chew et al. (1999) observed that dust mite allergen concentrations were 1.9–2.4 times higher in autumn than in spring, but the levels in beds in single-dwelling houses were 19–31 times higher than in apartments, thus far outweighing seasonal effects. In addition, the NSLAH found that older, low-income housing had higher levels of common asthma triggers (dust mites, cockroach allergen, rodent allergen) and LBP hazards (Arbes et al., 2003; Cohn et al., 2006; Jacobs et al., 2002).
4.2.1.1 Allergens in settled dust
Indoor environments generally contain large reservoirs of allergens in settled dust that has accumulated in carpets, bedding, and upholstery. Depending on dust-disturbing activity and the size of the allergen particles, only a very small amount is usually airborne at a given time. Reservoir levels are more reflective of an integrated chronic exposure rather than of short-term exposures. Therefore, allergen environmental assessment primarily involves measuring allergen levels in home reservoir dust samples.
The types of allergens found in settled dust vary, primarily due to differing allergen particle
Table 8. Advantages and Disadvantages of Settled Dust Versus Air Sampling for Allergens
Sampling method Advantages Disadvantages
Settled dust sampling •• Better indicator of time-integrated exposure. Less temporally variable.
•• Better indicator of exposure to easily settled house dust mite and cockroach allergens Relatively fast, easy, inexpensive sample collection.
•• May be poor indicator of short-term exposures.
•• Inhalation is primary exposure mechanism so may not be best indicator of actual exposure
Air Sampling •• Captures inhalable particles. Better indicator of short-term exposure.
•• Allows fluctuations in exposure to be assessed over a week or a day.
•• Possibly better indicator of exposure to animal allergens, because smaller particles remain airborne relatively long.
•• May be useful if ventilation system contamination is suspected.
•• Airborne concentrations for many allergens are generally low, analytical sensitivity is problematic.
•• Allergen levels in air vary with activity/disturbance.
•• To assess long-term exposure, large number of samples must be collected.
•• Sample collection may be relatively slow, complex, and expensive.
•• May provide poor representation of exposure to house dust mite and cockroach allergens, because particles tend to remain airborne for relatively short time periods.
page 36 Residential Assessment
sizes. Large allergen particles (10 to 25 μm) such as house dust mite and cockroach are more likely to be found in settled dust rather than air, making vacuumed settled dust a common sampling method. Beds, bedroom floors, upholstered furniture, and floors below upholstered furniture are common sample locations for dust mites, while kitchen and bathroom floors are more common locations for cockroach allergen sampling.
Because animal allergens (cat, dog, mouse, rat) are carried on smaller airborne particulates that remain suspended in the air for long periods of time, air sampling is often used to assess these allergen levels; however, they are also commonly found in dust reservoirs and are often included in settled dust analyses because of the relative simplicity and lower expense of dust sampling. Cat and dog allergen sample locations vary but mostly focus on living rooms and bedrooms, while mouse and rat allergen samples tend to be collected from kitchens and bathrooms where these pests are more likely found.
Repeated sampling of dust over time gives better information about long-term exposures of the individual (Hirsch et al., 1998) but is costly. In addition, because concentrations of dust allergens can vary significantly over short distances within a room, by convention, the sample with the highest allergen concentration is typically used as the measure of exposure (O’Meara and Tovey, 2000). Surfaces vary widely in amount of total dust from room to room or home to home; therefore, the length and width of the settled dust area sampled should be recorded so that allergen loading (e.g., ng/m2) can be calculated.
4.2.1.2 Allergens in air
Generally, the amount of airborne allergens collected (nanograms) is far less (on the order of millionths) than the total in dust reservoirs (micrograms). The level of dust disturbance in a room, as well as the particle size, has a large effect on the amount of allergens that are airborne at any given time (O’Meara and Tovey, 2000). Although Platts-Mills et al. (1997) reported that, in epidemiological studies through
1997, exposure to cat allergen was reported as the concentration per gram of reservoir dust, airborne cat and dog allergens have been collected and measured at relatively high levels in undisturbed conditions (O’Meara and Tovey, 2000) because they are carried on smaller airborne particulates that remain suspended in the air for long periods of time.
4.2.1.3 Allergen analysis
Immunoassays
At the lab, allergen dust samples are typically sieved to obtain the fine dust fraction (i.e., using a 50-mesh metal sieve to obtain particles that have diameters of 300 μm or less). Sieved samples are extracted with a buffer solution, serially diluted, and then applied to the appropriate quantitation test. As shown in Table 7, laboratories currently use two primary methods to measure allergen levels, enzyme-linked immunosorbent assays (ELISAs) and fluorescent multiplex array for indoor allergens (MARIA). Immunoassays use the specific binding between the antigen associated with an allergen and its homologous antibody to identify and quantify a substance in a sample. They generally provide very accurate quantitation (Chapman et al., 2000); however, although immunoassays for numerous dust, animal, and mold allergens have been developed, only relatively few are readily available from commercial laboratories (Table 7). Immunoassay technology for molds is not as highly developed or well-standardized as that for house dust mite, animal, or cockroach allergens (Bush and Portnoy, 2001), with standard for only a few mold allergens available (Table 7).
ELISA is the “gold standard” for indoor allergen analysis because the antibodies used in the method have been well-defined and used for many years (Earle et al., 2007). For example, ELISA was used to measure indoor allergen concentrations for the NSLAH and the National Institutes of Health Inner City Asthma Study (Vojta et al., 2002; Morgan et al., 2004). However, because it requires separate tests for each allergen in a sample, it is labor-intensive, time-consuming, and expensive, particularly for large-scale studies or studies involving multiple allergens. The MARIA technology combines multiple analytes in a single test. Currently, a
page 37Residential Assessment
single quantitative test that can simultaneously analyze for Der p1, Der F1, Der p2, Der f2, Fel d1, and Can f1 has been validated (Earle et al., 2007). MARIA uses antibody combinations equivalent to those used in ELISA but is quicker, less labor-intensive, and less expensive.
Recently, concerns have arisen about the need for validation of assays for allergen measurements. Allergen sampling and analysis have begun moving out of the research area and becoming more commonly performed in routine indoor environmental quality studies, particularly in homes of asthmatic children. More laboratories now offer allergen analyses; however, few standard protocols for field sampling and analysis exist (Codina and Lockey 2007). Hamilton (2005) notes that as household dust analyses become more routine, there is an increased need for quality control procedures and lab proficiency programs to minimize intralaboratory and interlaboratory variability. There is considerable variability associated with the determination of allergen-specific concentrations in dust samples using ELISA. HUD found large inter-laboratory and intra-laboratory variability when comparing ELISA results obtained from several commercial, academic, and municipal laboratories (Pate et al., 2005). The study results indicated that analytical results could generally be used to determine if allergen-specific concentrations exceeded thresholds of interest with reasonable certainty; however, the authors emphasized the need to standardize laboratory procedures for processing and analyzing samples for allergens using ELISA methods. In contrast, a study evaluating intra- and inter-laboratory reproducibility of MARIA analyses found that results between laboratories were highly correlated for all tested allergens (approximately 95%) (King et al. 2009). Intra-laboratory correlation was also good.
While microbiological labs can participate in proficiency programs that monitor the quality of their microbiological analyses, no such program currently exists for allergen analysis. HUD has developed a standard sampling protocol for use by its grantees (HUD 2008), but few if any standard laboratory operating procedures for sample preparation, analysis, and quality assurance exist. For example, the formulation of allergen standards (used to develop
calibration curves and measure allergen sample concentrations) has changed over time.
As allergen standards have changed, there is concern that different assays measure allergen levels differently, and results obtained using different allergen standards may not be comparable (van Ree 2007). When ELISA was the primary analytical method available, calibration curves were standardized using individual ELISA allergen standards. After the MARIA method was developed, allergen standards that contained either 5 (called “5-plex) or 8 allergens (called “8-plex or Universal Allergen Standard (UAS); Table 7) were developed. When allergen concentration values obtained using individual ELISA allergen standards were compared with those obtained using the MARIA 5-plex or 8-plex, considerable differences were found, meaning that allergen data generated using different standards are not directly comparable and must be corrected for known differences between the standards (HUD 2009). HUD recommended that persons sending samples to a lab ensure that the lab identifies the type of standard is used (i.e., individual, 5-plex, or 8-plex). HUD also recommended that all data generated using individual ELISA standards and 5-plex standards be converted to a result equivalent to using the 8-plex standard by dividing ELISA-based and 5-plex-based results by correction factors shown in Table 9.
Particle immunostaining
Particle immunostaining involves a protein-binding membrane, immunostaining of bound allergens, and examination of stained samples under a microscope where the density of staining is determined using image analysis (O’Meara and Tovey, 2000). This technique has been used in research settings to measure airborne dust mite (Der p 1 and Der p 2), cockroach (Bla g 1), cat (Fel d 1), dog (Can f 1) and Alternaria allergens in undisturbed indoor environments (Poulos et al., 1998; De Lucca et al., 1998; Tovey et al., 1998; and O’Meara et al., 1998, as cited in O’Meara and Tovey, 2000). It is extremely sensitive (on the order of sub picograms of allergen) and appears to have high repeatability in combination with nasal air samples (O’Meara and Tovey, 2000).
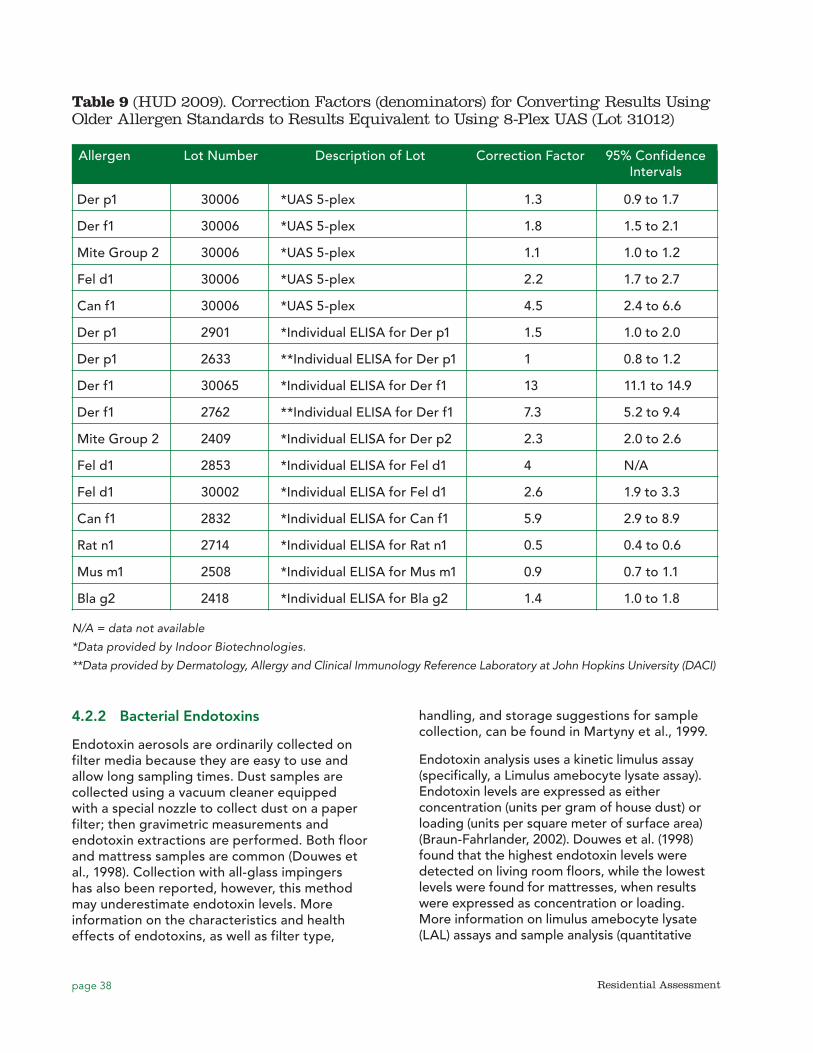
page 38 Residential Assessment
4.2.2 Bacterial Endotoxins
Endotoxin aerosols are ordinarily collected on filter media because they are easy to use and allow long sampling times. Dust samples are collected using a vacuum cleaner equipped with a special nozzle to collect dust on a paper filter; then gravimetric measurements and endotoxin extractions are performed. Both floor and mattress samples are common (Douwes et al., 1998). Collection with all-glass impingers has also been reported, however, this method may underestimate endotoxin levels. More information on the characteristics and health effects of endotoxins, as well as filter type,
handling, and storage suggestions for sample collection, can be found in Martyny et al., 1999.
Endotoxin analysis uses a kinetic limulus assay (specifically, a Limulus amebocyte lysate assay). Endotoxin levels are expressed as either concentration (units per gram of house dust) or loading (units per square meter of surface area) (Braun-Fahrlander, 2002). Douwes et al. (1998) found that the highest endotoxin levels were detected on living room floors, while the lowest levels were found for mattresses, when results were expressed as concentration or loading. More information on limulus amebocyte lysate (LAL) assays and sample analysis (quantitative
Table 9 (HUD 2009). Correction Factors (denominators) for Converting Results Using Older Allergen Standards to Results Equivalent to Using 8-Plex UAS (Lot 31012)
Allergen Lot Number Description of Lot Correction Factor 95% Confidence Intervals
Der p1 30006 *UAS 5-plex 1.3 0.9 to 1.7
Der f1 30006 *UAS 5-plex 1.8 1.5 to 2.1
Mite Group 2 30006 *UAS 5-plex 1.1 1.0 to 1.2
Fel d1 30006 *UAS 5-plex 2.2 1.7 to 2.7
Can f1 30006 *UAS 5-plex 4.5 2.4 to 6.6
Der p1 2901 *Individual ELISA for Der p1 1.5 1.0 to 2.0
Der p1 2633 **Individual ELISA for Der p1 1 0.8 to 1.2
Der f1 30065 *Individual ELISA for Der f1 13 11.1 to 14.9
Der f1 2762 **Individual ELISA for Der f1 7.3 5.2 to 9.4
Mite Group 2 2409 *Individual ELISA for Der p2 2.3 2.0 to 2.6
Fel d1 2853 *Individual ELISA for Fel d1 4 N/A
Fel d1 30002 *Individual ELISA for Fel d1 2.6 1.9 to 3.3
Can f1 2832 *Individual ELISA for Can f1 5.9 2.9 to 8.9
Rat n1 2714 *Individual ELISA for Rat n1 0.5 0.4 to 0.6
Mus m1 2508 *Individual ELISA for Mus m1 0.9 0.7 to 1.1
Bla g2 2418 *Individual ELISA for Bla g2 1.4 1.0 to 1.8
N/A = data not available
*Data provided by Indoor Biotechnologies.
**Data provided by Dermatology, Allergy and Clinical Immunology Reference Laboratory at John Hopkins University (DACI)
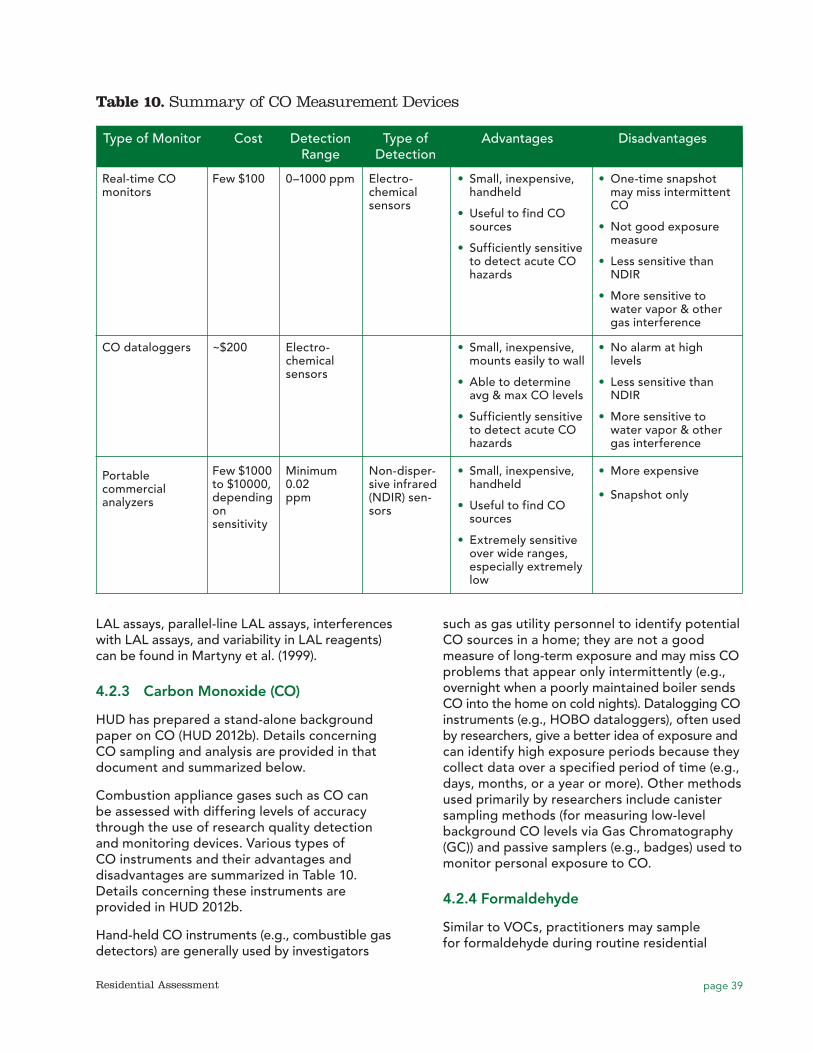
page 39Residential Assessment
LAL assays, parallel-line LAL assays, interferences with LAL assays, and variability in LAL reagents) can be found in Martyny et al. (1999).
4.2.3 Carbon Monoxide (CO)
HUD has prepared a stand-alone background paper on CO (HUD 2012b). Details concerning CO sampling and analysis are provided in that document and summarized below.
Combustion appliance gases such as CO can be assessed with differing levels of accuracy through the use of research quality detection and monitoring devices. Various types of CO instruments and their advantages and disadvantages are summarized in Table 10. Details concerning these instruments are provided in HUD 2012b.
Hand-held CO instruments (e.g., combustible gas detectors) are generally used by investigators
such as gas utility personnel to identify potential CO sources in a home; they are not a good measure of long-term exposure and may miss CO problems that appear only intermittently (e.g., overnight when a poorly maintained boiler sends CO into the home on cold nights). Datalogging CO instruments (e.g., HOBO dataloggers), often used by researchers, give a better idea of exposure and can identify high exposure periods because they collect data over a specified period of time (e.g., days, months, or a year or more). Other methods used primarily by researchers include canister sampling methods (for measuring low-level background CO levels via Gas Chromatography (GC)) and passive samplers (e.g., badges) used to monitor personal exposure to CO.
4.2.4 Formaldehyde
Similar to VOCs, practitioners may sample for formaldehyde during routine residential
Table 10. Summary of CO Measurement Devices
Type of Monitor Cost Detection Type of Advantages Disadvantages Range Detection
Real-time CO monitors
Few $100 0–1000 ppm Electro-chemical sensors
•• Small, inexpensive, handheld
•• Useful to find CO sources
•• Sufficiently sensitive to detect acute CO hazards
•• One-time snapshot may miss intermittent CO
•• Not good exposure measure
•• Less sensitive than NDIR
•• More sensitive to water vapor & other gas interference
CO dataloggers ~$200
Electro-chemical sensors
•• Small, inexpensive, mounts easily to wall
•• Able to determine avg & max CO levels
•• Sufficiently sensitive to detect acute CO hazards
•• No alarm at high levels
•• Less sensitive than NDIR
•• More sensitive to water vapor & other gas interference
Portable commercial analyzers
Few $1000 to $10000, depending on sensitivity
Minimum 0.02 ppm
Non-disper-sive infrared (NDIR) sen-sors
•• Small, inexpensive, handheld
•• Useful to find CO sources
•• Extremely sensitive over wide ranges, especially extremely low
•• More expensive
•• Snapshot only
page 40 Residential Assessment
assessments if they suspect a source may be present, especially after new construction or renovation. However, due to the intermittent nature of formaldehyde releases and wide temporal and spatial variability, selection of formaldehyde-free building materials before construction and visual survey of building materials during new construction or renovation may yield more accurate information.
Widely used methods to sample and analyze for formaldehyde include NIOSH method 3500, an impinger/colorimetric method (NIOSH 1994); EPA Method IP-6C, a passive sampler/high pressure liquid chromatography (HPLC) method (EPA 1989); and EPA Method TO-11A, a 2,4-dinitrophenylhydrazine (DNPH) cartridge/HPLC method (EPA 1999). The passive sampling method is sensitive enough to measure formaldehyde levels over just a few hours. Longer sampling periods may dry out the collection media, making it impossible to analyze. The impinger method is not commonly used because of the difficulty in dealing with liquid sampling methods in the field. The impinger/colorimetric method is also subject to many negative interferences, including phenol, ethanol, higher molecular weight alcohols, and olefins (Godish 2001). The DNPH/HPLC analytical methods are the most widely used sampling and analytical method for formaldehyde because they are highly specific and sensitive with low quantification limits. The DNPH/HPLC method has also been adapted for passive sampling. One major limitation is that ozone is a substantial negative interference (Godish 2001).
Chiappini et al. (2009) tested four different sampling techniques for measuring formaldehyde in air: passive sampling based on the reaction of DNPH with formaldehyde; two online continuous monitoring systems based on fluorescence and UV measurements and a portable commercialized analyzer based on electrochemical titration. Chiappini et al. found “general good agreement” between each technique, but noted that the passive sampling methods were subject to high blank levels possible due to contamination during storage of unused passive devices, and that wind speed may also adversely impact passive sampling results.
4.2.5 Lead
EPA regulations require sampling during LBP hazard risk assessments of residential environments (EPA 2001a), and regulatory protocols for lead dust wipe sampling using moist towelettes are well documented (EPA 2001a; HUD, 1995). Dust wipe samples of floors and window surfaces provide information on lead loadings per unit area, but not on lead concentrations per unit dust. For residential risk assessment, EPA regulations (EPA 2004d) state that dust wipe samples must be collected from the interior window sill(s) and floor in all living areas where one or more children aged 6 or less, are most likely to contact dust. HUD guidelines state that dust wipe samples are typically collected in the entryway, common spaces, kitchen, living room and a child’s bedroom and playroom, with samples collected from the floors, interior window sills, window troughs, and other surfaces suspected of contamination. HUD states that one floor sample and one window trough or sill sample should be collected in each main room or area.
4.2.6 Structural Moisture
Portable, hand-held moisture meters may be useful in qualitative home assessments to aid in pinpointing areas of potential biological growth not otherwise obvious during a visual inspection (ACGIH, 1999; Dillon et al., 2005). Moisture meters are useful in identifying damp spots and tracing leak pathways (IOM 2004). They have a digital display and so provide real-time measurements of moisture presence in building materials. However, they may miss moisture if the leakage source is intermittent and not occurring at the time of an assessment. The presence of a metal can interfere and give false positive readings.
There are two main methods of moisture content measurement. One type of moisture meter is called electromagnetic wave technology, or EMW meters, which are pinless and gauge surface moisture to a depth of 0.75 to 1 inch by emitting electrical waves through a sensor pressed against the building material and translates electrical information on capacitance, power loss, and impedance to percent moisture content. This type of meter is non-destructive to the building material. The
page 41Residential Assessment
second type of moisture meter has two pins that can be inserted into building materials to measure moisture content or water activity; this type can make small holes in the tested materials. Dry material allows little current to pass, while damper material allows more. The pin instruments can assess moisture at different depths, while electromagnetic field (EMF)-based instruments have a depth range of 0.5 to a few inches (IOM 2004). Most moisture meters are calibrated to a specific species of wood at a particular temperature and are accompanied by charts that have adjustment factors for different types of wood and different temperatures. If the adjustments are not made properly, false conclusions from the reading of the meter are likely.
Another method of identifying moisture problems behind walls and other building cavities is thermography (HUD 2011). A special camera is used to photograph infrared spectra. Because building components with higher water content are “cooler” than those without water, components with higher water content appear bluer than those with lower water content. These instruments are often quite costly (thousands of dollars).
4.2.7 Molds
HUD has prepared a stand-alone background paper on mold (HUD 2012f). Details concerning mold sampling and analysis are provided in that document. As noted in Section 1.3.1.2, the paper contains a detailed discussion of mold sampling and analysis options that may be conducted (1) as part of research studies (i.e., for documentation purposes and to record the types of fungi that predominate (Burge and Otten, 1999)); (2) when needed to identify the source of mold; or (3) to support litigation.
4.2.8 Nitrogen Dioxide
Similar to VOCs, practitioners may sample for NO2 during routine residential assessments if they suspect a source may be present; however, such sampling is more often performed for research purposes. Passive sampling methods, using triethanolamine-impregnated sorbent tubes, are most commonly used to sample and analyze for NO2, including NIOSH Method 6014 (NIOSH 1994b) and OSHA Method ID-182.
Samples are generally collected over a period of one day to up to two weeks, depending on the concentration expected (Ogawa 2012). Samples are desorbed from the solid sorbent and analysis is performed by ion chromatography or visible absorption spectrophotometry.
4.2.9 Non-Biological Particulate Matter
As noted in Section 1.3.2.4, sampling and analysis for non-biological PM is usually conducted solely for research purposes.
4.2.9.1 PM2.5
Sampling methods for PM2.5 include gravimetric samplers that must be analyzed in a lab, as well as direct-reading continuous sampling based on optical properties and other effects. Continuous monitors give time series data that allow field personnel to observe the immediate impacts of indoor PM2.5 sources. Nagda and Rector (2001) caution that “direct-reading analyzers for PM that rely on optical properties are calibrated in the laboratory by using a size distribution that is characteristic to the calibration material. Unless the size distribution relates to that which prevails in the monitoring scene, misleading or even erroneous results are likely.” High-volume sampling methods originally designed for outdoor ambient air quality monitoring should not be used indoors because the equipment is too large and noisy for occupied spaces, and sample collection rates are high enough that particle removal could affect representativeness-the sampler could act more as an air cleaner than a sampler. Table 11 lists the instrumentation and methods to sample and analyze for PM2.5.
4.2.9.2 Ultrafine Particles (UFP)
No standard methods exist to sample and analyze exposure to UFP in residential environments. Due to their size and nature, no visual methods exit to identify UFPs and are usually not part of a residential assessment. However, they have been detected and measured for research purposes through the use of Condensation Particle Counters (CPC) (Wallace and Ott 2011). The technology involves the use of condensation (using water or alcohol as the fluid) to form a supersaturated vapor that condensed around the UFP and enlarged the UFP to a size detectable by a laser. Since they
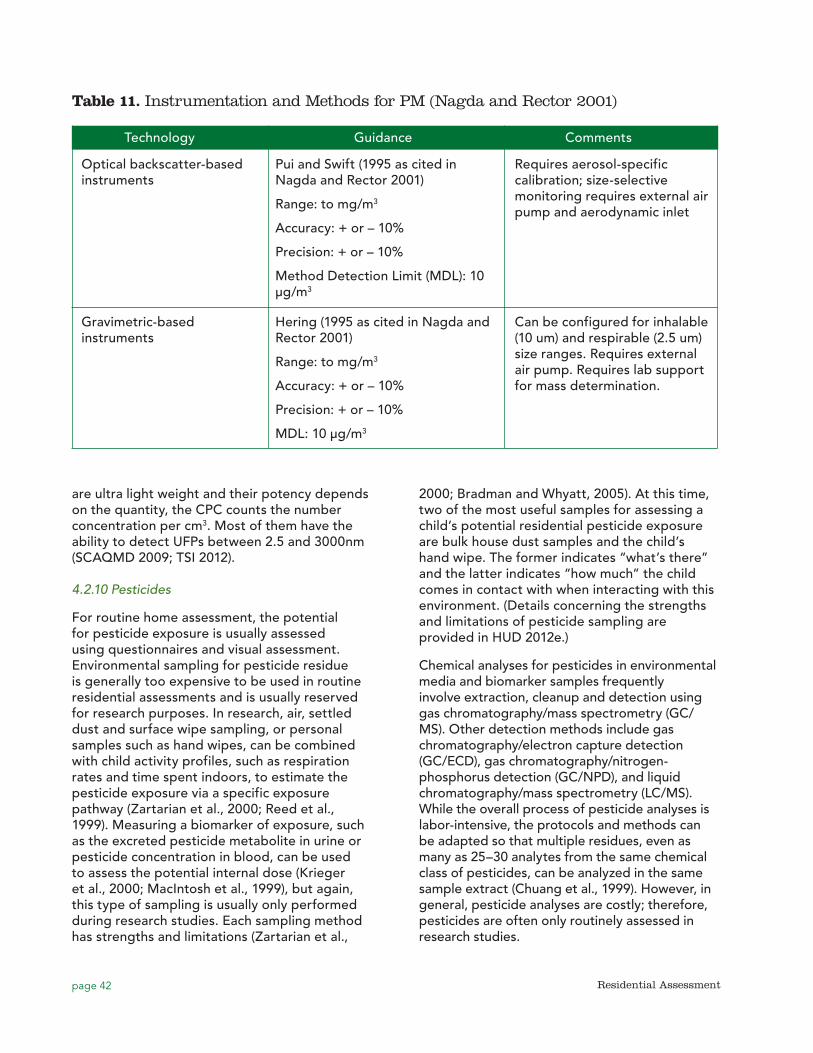
page 42 Residential Assessment
are ultra light weight and their potency depends on the quantity, the CPC counts the number concentration per cm3. Most of them have the ability to detect UFPs between 2.5 and 3000nm (SCAQMD 2009; TSI 2012).
4.2.10 Pesticides
For routine home assessment, the potential for pesticide exposure is usually assessed using questionnaires and visual assessment. Environmental sampling for pesticide residue is generally too expensive to be used in routine residential assessments and is usually reserved for research purposes. In research, air, settled dust and surface wipe sampling, or personal samples such as hand wipes, can be combined with child activity profiles, such as respiration rates and time spent indoors, to estimate the pesticide exposure via a specific exposure pathway (Zartarian et al., 2000; Reed et al., 1999). Measuring a biomarker of exposure, such as the excreted pesticide metabolite in urine or pesticide concentration in blood, can be used to assess the potential internal dose (Krieger et al., 2000; MacIntosh et al., 1999), but again, this type of sampling is usually only performed during research studies. Each sampling method has strengths and limitations (Zartarian et al.,
2000; Bradman and Whyatt, 2005). At this time, two of the most useful samples for assessing a child’s potential residential pesticide exposure are bulk house dust samples and the child’s hand wipe. The former indicates “what’s there” and the latter indicates “how much” the child comes in contact with when interacting with this environment. (Details concerning the strengths and limitations of pesticide sampling are provided in HUD 2012e.)
Chemical analyses for pesticides in environmental media and biomarker samples frequently involve extraction, cleanup and detection using gas chromatography/mass spectrometry (GC/MS). Other detection methods include gas chromatography/electron capture detection (GC/ECD), gas chromatography/nitrogen-phosphorus detection (GC/NPD), and liquid chromatography/mass spectrometry (LC/MS). While the overall process of pesticide analyses is labor-intensive, the protocols and methods can be adapted so that multiple residues, even as many as 25–30 analytes from the same chemical class of pesticides, can be analyzed in the same sample extract (Chuang et al., 1999). However, in general, pesticide analyses are costly; therefore, pesticides are often only routinely assessed in research studies.
Table 11. Instrumentation and Methods for PM (Nagda and Rector 2001)
Technology Guidance Comments
Optical backscatter-based instruments
Pui and Swift (1995 as cited in Nagda and Rector 2001)
Range: to mg/m3
Accuracy: + or – 10%
Precision: + or – 10%
Method Detection Limit (MDL): 10 μg/m3
Requires aerosol-specific calibration; size-selective monitoring requires external air pump and aerodynamic inlet
Gravimetric-based instruments
Hering (1995 as cited in Nagda and Rector 2001)
Range: to mg/m3
Accuracy: + or – 10%
Precision: + or – 10%
MDL: 10 μg/m3
Can be configured for inhalable (10 um) and respirable (2.5 um) size ranges. Requires external air pump. Requires lab support for mass determination.
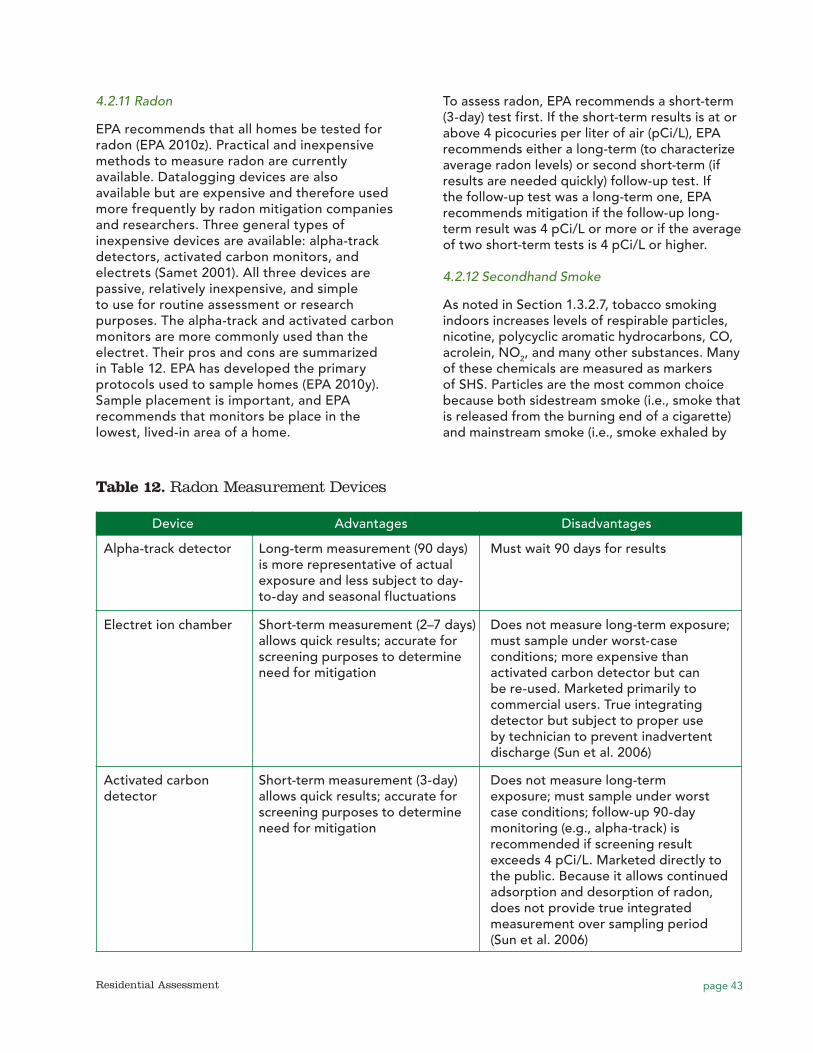
page 43Residential Assessment
4.2.11 Radon
EPA recommends that all homes be tested for radon (EPA 2010z). Practical and inexpensive methods to measure radon are currently available. Datalogging devices are also available but are expensive and therefore used more frequently by radon mitigation companies and researchers. Three general types of inexpensive devices are available: alpha-track detectors, activated carbon monitors, and electrets (Samet 2001). All three devices are passive, relatively inexpensive, and simple to use for routine assessment or research purposes. The alpha-track and activated carbon monitors are more commonly used than the electret. Their pros and cons are summarized in Table 12. EPA has developed the primary protocols used to sample homes (EPA 2010y). Sample placement is important, and EPA recommends that monitors be place in the lowest, lived-in area of a home.
To assess radon, EPA recommends a short-term (3-day) test first. If the short-term results is at or above 4 picocuries per liter of air (pCi/L), EPA recommends either a long-term (to characterize average radon levels) or second short-term (if results are needed quickly) follow-up test. If the follow-up test was a long-term one, EPA recommends mitigation if the follow-up long-term result was 4 pCi/L or more or if the average of two short-term tests is 4 pCi/L or higher.
4.2.12 Secondhand Smoke
As noted in Section 1.3.2.7, tobacco smoking indoors increases levels of respirable particles, nicotine, polycyclic aromatic hydrocarbons, CO, acrolein, NO2, and many other substances. Many of these chemicals are measured as markers of SHS. Particles are the most common choice because both sidestream smoke (i.e., smoke that is released from the burning end of a cigarette) and mainstream smoke (i.e., smoke exhaled by
Table 12. Radon Measurement Devices
Device Advantages Disadvantages
Alpha-track detector Long-term measurement (90 days) is more representative of actual exposure and less subject to day-to-day and seasonal fluctuations
Must wait 90 days for results
Electret ion chamber Short-term measurement (2–7 days) allows quick results; accurate for screening purposes to determine need for mitigation
Does not measure long-term exposure; must sample under worst-case conditions; more expensive than activated carbon detector but can be re-used. Marketed primarily to commercial users. True integrating detector but subject to proper use by technician to prevent inadvertent discharge (Sun et al. 2006)
Activated carbon detector
Short-term measurement (3-day) allows quick results; accurate for screening purposes to determine need for mitigation
Does not measure long-term exposure; must sample under worst case conditions; follow-up 90-day monitoring (e.g., alpha-track) is recommended if screening result exceeds 4 pCi/L. Marketed directly to the public. Because it allows continued adsorption and desorption of radon, does not provide true integrated measurement over sampling period (Sun et al. 2006)
page 44 Residential Assessment
the active smoker) contain high concentrations of particles in the respirable size range. Particles are a non-specific marker of SHS because PM is emitted from many other non-SHS sources.
At present, the most sensitive and specific biomarkers for SHS exposure are nicotine and its metabolite, cotinine, both of which are rarely present in body fluids unless someone is exposed to SHS (Nagda and Rector 2001). Because it stays in nonsmokers for a relatively long time (20 hours), cotinine is more frequently used as a biomarker than nicotine (half life <2 hours). Cotinine can be measured in plasma, saliva, and urine using either radioimmunoassay or chromatography. Because cotinine is more strongly associated with asthma symptoms than environmental measures of SHS exposure and is independent of the site of exposure, it is becoming more frequently used in SHS exposure assessment for children with asthma (Butz et al., 2010).
Nicotine is a highly specific marker present in the vapor phase of SHS and can be measured in the air with both active sampling methods and passive diffusion badges (Nagda and Rector 2001). Kraev et al. (2009) placed passive diffusion monitors with sodium bisulfate-treated filters in living areas of low-income multi-family units for 6 to 7 days to assess exposure in smoking and non-smoking units of low-income multifamily buildings. Badges were desorbed in water and analyzed by gas chromatography, with a detection limit of 0.021 µg/m3.
4.2.13 Volatile Organic Compounds (VOCs)
Practitioners may sample for VOCs during routine residential assessments if they suspect a source may be present. For example, if a home recently underwent a “green” renovation, an investigator may want to collect VOC samples to verify that low- or no-VOC building materials, paints, and adhesives were used. However, due to the intermittent nature of VOC releases and difficulties with temporal and spatial variability, an easier way to assess VOC hazards is to do a visual assessment of building materials lists during new construction or renovation or to interview resident about product usage.
The most common method to sample for VOCs is to collect VOCs on some type of solid sorbent using active or passive sampling methods, followed by thermal desorption or
solvent extraction and analysis by GC/MS or GC/flame ionization detection (FID) (Wallace 2001). Several agencies and organizations have standard methods for VOC sampling and analysis, including ASTM (2007, 2009), EPA (1999), and NIOSH (2003). There are also several EPA and NIOSH methods for individual VOCs or specific groups of VOCs (e.g., halogenated hydrocarbons). EPA also has a method for canister sampling for VOCs (EPA 1999).
Once collected, samples can be analyzed for either TVOCs or individual VOCs, or both. Personnel conducting routine residential assessments often analyze only for TVOCs (i.e., the sum of all VOCs measured in a particular sample without identifying specific VOCs comprising that sum). This analysis is relatively inexpensive, and TVOC results can be used to surmise that VOCs are generally present in indoor air, possibly indicating poor IAQ. Because TVOCs are a mix of VOCs of widely varying health effects, TVOC results cannot be used to evaluate the potential health impact of exposure (Black 2010).
Analysis of samples for individual VOCs by GC/MS or GC/FID provides a more complete picture of health hazards potentially present; however, this type of analysis is much more expensive, and it may be difficult to determine which individual VOCs to include in a particular analysis. For example, Wallace (2001) notes that hundreds of VOCs have been identified in SHS, several of which are human carcinogens. The Wallace article (2001), “Assessing Human Exposure to Volatile Organic Compounds,” may be useful when determining VOC sampling plans for particular studies since it contains a detailed discussion of studies that have measured VOCs in personal air, indoor air, drinking water, food, beverages, dust and soil from various geographic areas around the world.
4.3 Interpretation of Sampling Results and Comparison Values
Environmental sampling results must be evaluated to determine how well the results represent human exposure. For example, as noted in Section 6.1, there is wide spatial and
page 45Residential Assessment
temporal variability in contaminant levels, and sampling results may or may not represent actual exposure levels. The lack of standardized protocols for data collection and analysis adds uncertainty when interpreting results. Residential assessors often compare sampling results with standards or guidance values to quantify the potential hazard. However, as noted by Krieger and Higgins (2002), national unified guidelines or standards are lacking for many of the factors known to influence healthy housing. Existing comparison values for allergens, fungi, and many indoor environmental contaminants lack human dose/response data, and there is uncertainty regarding the relative importance of different risk factors and exposure pathways and their interactions. In particular, the development of standards or guidelines protective of children poses a large challenge in public health. Because of the unique patterns of exposure and special vulnerabilities of children, home risk assessment approaches that move beyond consideration of average levels of exposure for adults are needed (Landrigan et al., 2004).
An extensive discussion of the issues associated with exposure and risk for multiple health endpoints associated with residential hazards is beyond the scope of this paper; however, this section summarizes the major issues involved in interpreting residential assessment results and comparing results with available guidance and standards.
Many comparison values presented below are occupational standards or guidance values. Occupational values are not appropriate to compare with residential levels because occupational standards are often set for healthy, young male workers. The residential setting contains a more diverse population, including children and the elderly who may be more vulnerable to indoor hazards. In addition, exposure times in homes can differ greatly from those in occupational settings. Finally, occupational settings may include engineering controls to reduce exposure, but these controls may not exist in homes (CDC 2010).
4.3.1 Allergens
Table 13 presents comparison values that have been used in the literature to determine the level of potential hazard posed by allergen
sampling results obtained in various studies. These comparison values are estimated threshold of settled dust concentration levels for (1) the level representing a risk of becoming sensitized to an allergen (allergic sensitization) and (2) the level at which asthmatic individuals may begin to experience symptoms (e.g., asthma exacerbation). Except for dust mites, these threshold levels are not well established.
4.3.2 Carbon monoxide
Issues involved in the interpretation of CO results and comparison with various standards and guidelines are discussed in detail in HUD 2012b and are summarized below.
Table 14 presents selected standards for CO, most of which were developed for occupational or outdoor purposes. There are no EPA standards for residential exposure to CO in indoor air; however, alarms must meet the Underwriter Laboratories standards listed in Table 6. Details concerning these standards are provided in HUD 2012b. Listed CO alarm criteria are consistent with the use of CO alarms to warn residents of serious, life threatening CO levels. These criteria, however, are not designed to warn of unhealthy ambient conditions addressed by EPA’s Air Hazard Index or compliance with occupational standards and ceiling recommendations.
4.3.3 Formaldehyde
There is no generally agreed upon U.S. standard for residential formaldehyde concentrations (CDC 2010). Standards established by various US agencies and organizations, presented in Table 15, focus on occupational settings, with regulatory occupational levels differing between agencies. On its website, EPA notes that the formaldehyde level expected in older homes without urea formaldehyde foam insulation (UFFI) is 0.1 ppm, while homes with new formaldehyde emission sources such as pressed wood products may be 0.3 ppm.
4.3.4 Lead
Regulatory standards for risk assessment and clearance are shown in Table 16. Most residential assessors use one of these two sets of standards as comparison values when interpreting the results of home dust wipe sampling. As noted
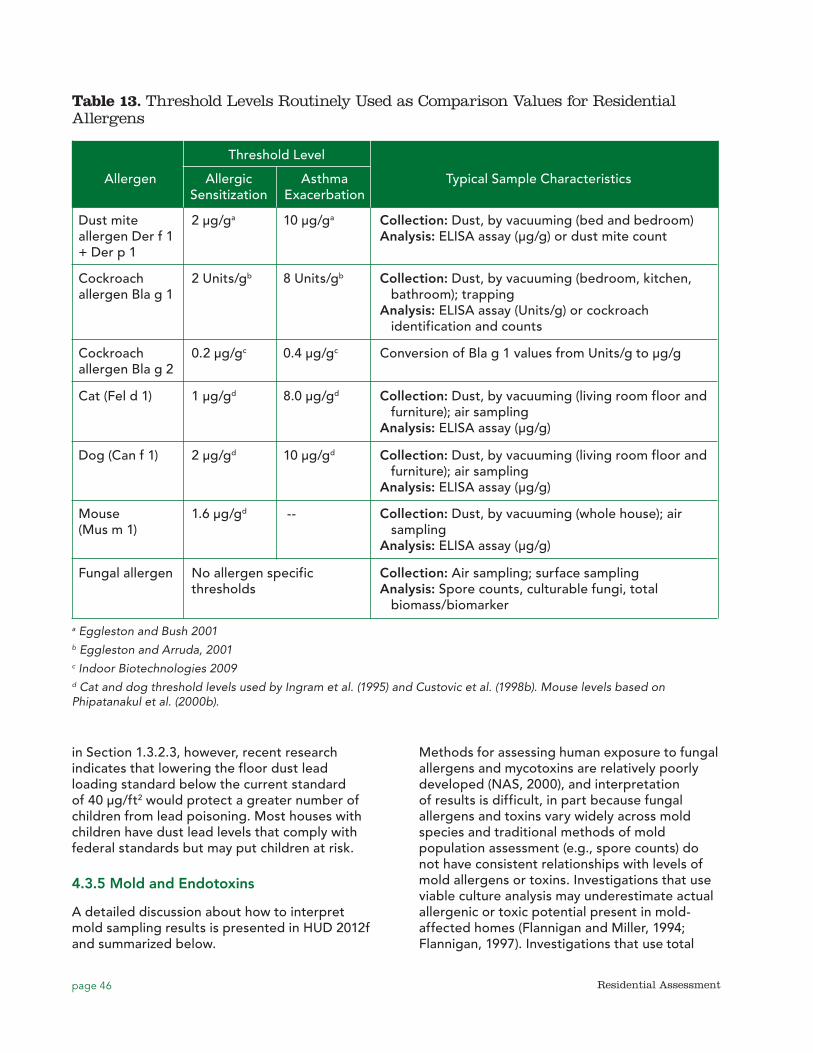
page 46 Residential Assessment
Table 13. Threshold Levels Routinely Used as Comparison Values for Residential Allergens
Threshold Level
Allergen Allergic Asthma Typical Sample Characteristics Sensitization Exacerbation
Dust mite allergen Der f 1 + Der p 1
2 μg/ga 10 μg/ga Collection: Dust, by vacuuming (bed and bedroom) Analysis: ELISA assay (μg/g) or dust mite count
Cockroach allergen Bla g 1
2 Units/gb 8 Units/gb Collection: Dust, by vacuuming (bedroom, kitchen, bathroom); trapping Analysis: ELISA assay (Units/g) or cockroach identification and counts
Cockroach allergen Bla g 2
0.2 μg/gc 0.4 μg/gc Conversion of Bla g 1 values from Units/g to μg/g
Cat (Fel d 1) 1 µg/gd 8.0 µg/gd
Collection: Dust, by vacuuming (living room floor and furniture); air sampling Analysis: ELISA assay (μg/g)
Dog (Can f 1) 2 µg/gd 10 µg/gd Collection: Dust, by vacuuming (living room floor and furniture); air sampling Analysis: ELISA assay (μg/g)
Mouse (Mus m 1)
1.6 µg/gd -- Collection: Dust, by vacuuming (whole house); air sampling Analysis: ELISA assay (μg/g)
Fungal allergen No allergen specific thresholds
Collection: Air sampling; surface sampling Analysis: Spore counts, culturable fungi, total biomass/biomarker
a Eggleston and Bush 2001 b Eggleston and Arruda, 2001c Indoor Biotechnologies 2009d Cat and dog threshold levels used by Ingram et al. (1995) and Custovic et al. (1998b). Mouse levels based on Phipatanakul et al. (2000b).
in Section 1.3.2.3, however, recent research indicates that lowering the floor dust lead loading standard below the current standard of 40 µg/ft2 would protect a greater number of children from lead poisoning. Most houses with children have dust lead levels that comply with federal standards but may put children at risk.
4.3.5 Mold and Endotoxins
A detailed discussion about how to interpret mold sampling results is presented in HUD 2012f and summarized below.
Methods for assessing human exposure to fungal allergens and mycotoxins are relatively poorly developed (NAS, 2000), and interpretation of results is difficult, in part because fungal allergens and toxins vary widely across mold species and traditional methods of mold population assessment (e.g., spore counts) do not have consistent relationships with levels of mold allergens or toxins. Investigations that use viable culture analysis may underestimate actual allergenic or toxic potential present in mold-affected homes (Flannigan and Miller, 1994; Flannigan, 1997). Investigations that use total
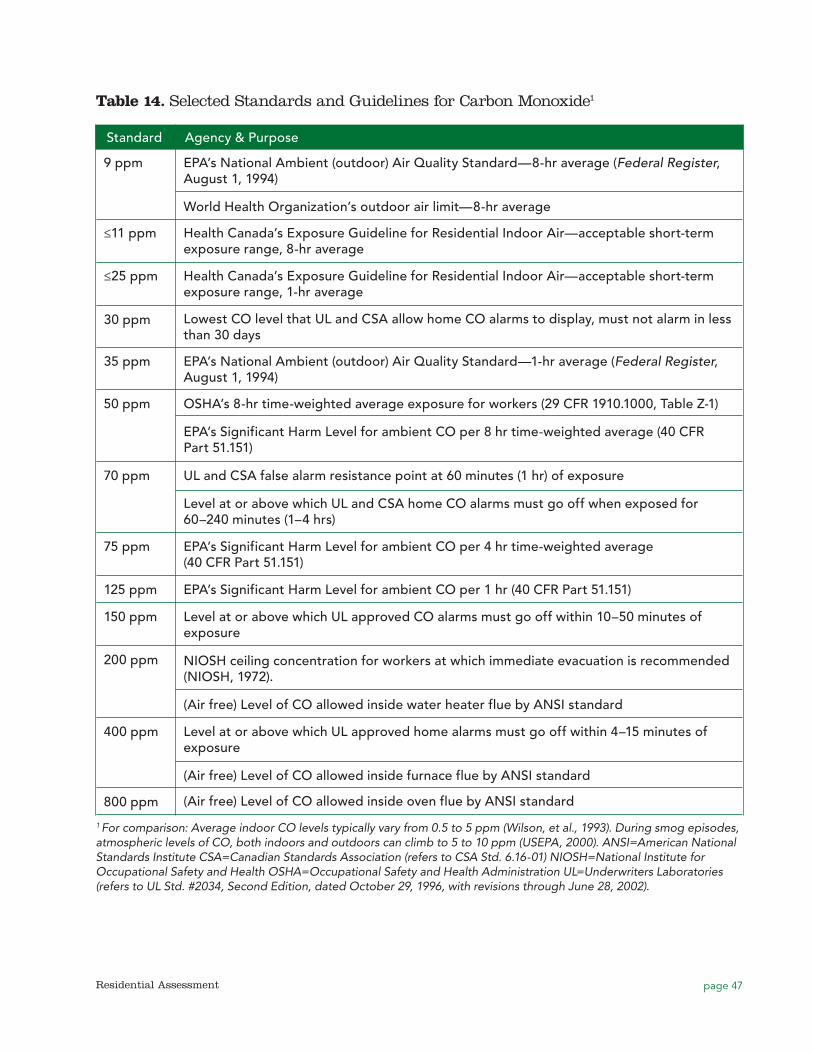
page 47Residential Assessment
Table 14. Selected Standards and Guidelines for Carbon Monoxide1
Standard Agency & Purpose
9 ppm EPA’s National Ambient (outdoor) Air Quality Standard—8-hr average (Federal Register, August 1, 1994)
World Health Organization’s outdoor air limit—8-hr average
≤11 ppm Health Canada’s Exposure Guideline for Residential Indoor Air—acceptable short-term exposure range, 8-hr average
≤25 ppm Health Canada’s Exposure Guideline for Residential Indoor Air—acceptable short-term exposure range, 1-hr average
30 ppm Lowest CO level that UL and CSA allow home CO alarms to display, must not alarm in less than 30 days
35 ppm EPA’s National Ambient (outdoor) Air Quality Standard—1-hr average (Federal Register, August 1, 1994)
50 ppm OSHA’s 8-hr time-weighted average exposure for workers (29 CFR 1910.1000, Table Z-1)
EPA’s Significant Harm Level for ambient CO per 8 hr time-weighted average (40 CFR Part 51.151)
70 ppm UL and CSA false alarm resistance point at 60 minutes (1 hr) of exposure
Level at or above which UL and CSA home CO alarms must go off when exposed for 60–240 minutes (1–4 hrs)
75 ppm EPA’s Significant Harm Level for ambient CO per 4 hr time-weighted average (40 CFR Part 51.151)
125 ppm EPA’s Significant Harm Level for ambient CO per 1 hr (40 CFR Part 51.151)
150 ppm Level at or above which UL approved CO alarms must go off within 10–50 minutes of exposure
200 ppm NIOSH ceiling concentration for workers at which immediate evacuation is recommended (NIOSH, 1972).
(Air free) Level of CO allowed inside water heater flue by ANSI standard
400 ppm Level at or above which UL approved home alarms must go off within 4–15 minutes of exposure
(Air free) Level of CO allowed inside furnace flue by ANSI standard
800 ppm (Air free) Level of CO allowed inside oven flue by ANSI standard
1 For comparison: Average indoor CO levels typically vary from 0.5 to 5 ppm (Wilson, et al., 1993). During smog episodes, atmospheric levels of CO, both indoors and outdoors can climb to 5 to 10 ppm (USEPA, 2000). ANSI=American National Standards Institute CSA=Canadian Standards Association (refers to CSA Std. 6.16-01) NIOSH=National Institute for Occupational Safety and Health OSHA=Occupational Safety and Health Administration UL=Underwriters Laboratories (refers to UL Std. #2034, Second Edition, dated October 29, 1996, with revisions through June 28, 2002).
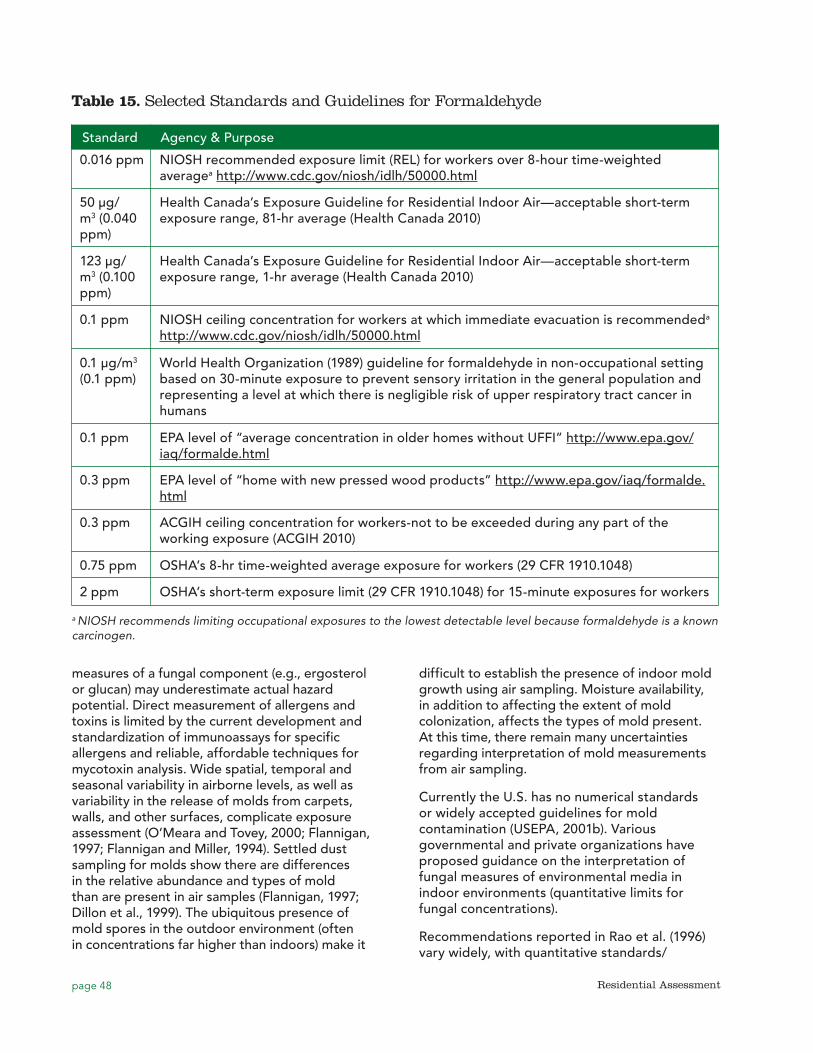
page 48 Residential Assessment
0.016 ppm
Table 15. Selected Standards and Guidelines for Formaldehyde
Standard Agency & Purpose
NIOSH recommended exposure limit (REL) for workers over 8-hour time-weighted averagea http://www.cdc.gov/niosh/idlh/50000.html
50 μg/m3 (0.040 ppm)
Health Canada’s Exposure Guideline for Residential Indoor Air—acceptable short-term exposure range, 81-hr average (Health Canada 2010)
123 μg/m3 (0.100 ppm)
Health Canada’s Exposure Guideline for Residential Indoor Air—acceptable short-term exposure range, 1-hr average (Health Canada 2010)
0.1 ppm NIOSH ceiling concentration for workers at which immediate evacuation is recommendeda http://www.cdc.gov/niosh/idlh/50000.html
0.1 μg/m3
(0.1 ppm)World Health Organization (1989) guideline for formaldehyde in non-occupational setting based on 30-minute exposure to prevent sensory irritation in the general population and representing a level at which there is negligible risk of upper respiratory tract cancer in humans
0.1 ppm EPA level of “average concentration in older homes without UFFI” http://www.epa.gov/iaq/formalde.html
0.3 ppm EPA level of “home with new pressed wood products” http://www.epa.gov/iaq/formalde.html
0.3 ppm ACGIH ceiling concentration for workers-not to be exceeded during any part of the working exposure (ACGIH 2010)
0.75 ppm OSHA’s 8-hr time-weighted average exposure for workers (29 CFR 1910.1048)
2 ppm OSHA’s short-term exposure limit (29 CFR 1910.1048) for 15-minute exposures for workers
a NIOSH recommends limiting occupational exposures to the lowest detectable level because formaldehyde is a known carcinogen.
measures of a fungal component (e.g., ergosterol or glucan) may underestimate actual hazard potential. Direct measurement of allergens and toxins is limited by the current development and standardization of immunoassays for specific allergens and reliable, affordable techniques for mycotoxin analysis. Wide spatial, temporal and seasonal variability in airborne levels, as well as variability in the release of molds from carpets, walls, and other surfaces, complicate exposure assessment (O’Meara and Tovey, 2000; Flannigan, 1997; Flannigan and Miller, 1994). Settled dust sampling for molds show there are differences in the relative abundance and types of mold than are present in air samples (Flannigan, 1997; Dillon et al., 1999). The ubiquitous presence of mold spores in the outdoor environment (often in concentrations far higher than indoors) make it
difficult to establish the presence of indoor mold growth using air sampling. Moisture availability, in addition to affecting the extent of mold colonization, affects the types of mold present. At this time, there remain many uncertainties regarding interpretation of mold measurements from air sampling.
Currently the U.S. has no numerical standards or widely accepted guidelines for mold contamination (USEPA, 2001b). Various governmental and private organizations have proposed guidance on the interpretation of fungal measures of environmental media in indoor environments (quantitative limits for fungal concentrations).
Recommendations reported in Rao et al. (1996) vary widely, with quantitative standards/
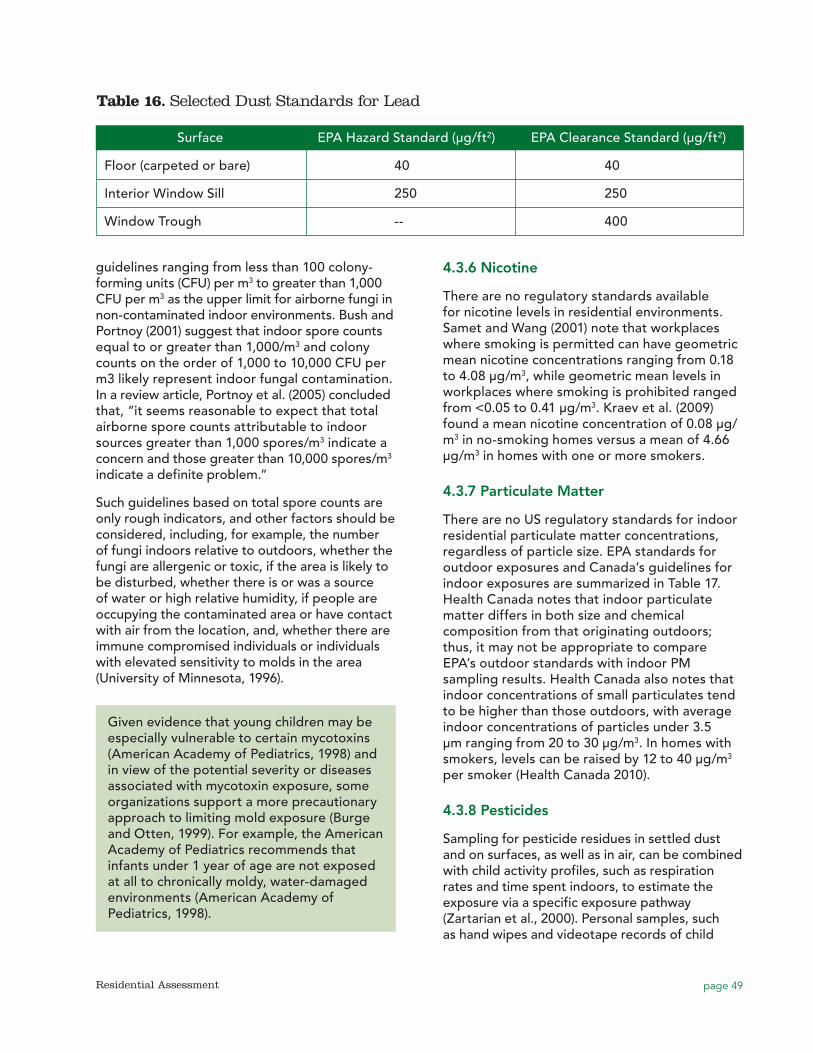
page 49Residential Assessment
guidelines ranging from less than 100 colony-forming units (CFU) per m3 to greater than 1,000 CFU per m3 as the upper limit for airborne fungi in non-contaminated indoor environments. Bush and Portnoy (2001) suggest that indoor spore counts equal to or greater than 1,000/m3 and colony counts on the order of 1,000 to 10,000 CFU per m3 likely represent indoor fungal contamination. In a review article, Portnoy et al. (2005) concluded that, “it seems reasonable to expect that total airborne spore counts attributable to indoor sources greater than 1,000 spores/m3 indicate a concern and those greater than 10,000 spores/m3 indicate a definite problem.”
Such guidelines based on total spore counts are only rough indicators, and other factors should be considered, including, for example, the number of fungi indoors relative to outdoors, whether the fungi are allergenic or toxic, if the area is likely to be disturbed, whether there is or was a source of water or high relative humidity, if people are occupying the contaminated area or have contact with air from the location, and, whether there are immune compromised individuals or individuals with elevated sensitivity to molds in the area (University of Minnesota, 1996).
Given evidence that young children may be especially vulnerable to certain mycotoxins (American Academy of Pediatrics, 1998) and in view of the potential severity or diseases associated with mycotoxin exposure, some organizations support a more precautionary approach to limiting mold exposure (Burge and Otten, 1999). For example, the American Academy of Pediatrics recommends that infants under 1 year of age are not exposed at all to chronically moldy, water-damaged environments (American Academy of Pediatrics, 1998).
4.3.6 Nicotine
There are no regulatory standards available for nicotine levels in residential environments. Samet and Wang (2001) note that workplaces where smoking is permitted can have geometric mean nicotine concentrations ranging from 0.18 to 4.08 μg/m3, while geometric mean levels in workplaces where smoking is prohibited ranged from <0.05 to 0.41 μg/m3. Kraev et al. (2009) found a mean nicotine concentration of 0.08 μg/m3 in no-smoking homes versus a mean of 4.66 μg/m3 in homes with one or more smokers.
4.3.7 Particulate Matter
There are no US regulatory standards for indoor residential particulate matter concentrations, regardless of particle size. EPA standards for outdoor exposures and Canada’s guidelines for indoor exposures are summarized in Table 17. Health Canada notes that indoor particulate matter differs in both size and chemical composition from that originating outdoors; thus, it may not be appropriate to compare EPA’s outdoor standards with indoor PM sampling results. Health Canada also notes that indoor concentrations of small particulates tend to be higher than those outdoors, with average indoor concentrations of particles under 3.5 µm ranging from 20 to 30 μg/m3. In homes with smokers, levels can be raised by 12 to 40 μg/m3 per smoker (Health Canada 2010).
4.3.8 Pesticides
Sampling for pesticide residues in settled dust and on surfaces, as well as in air, can be combined with child activity profiles, such as respiration rates and time spent indoors, to estimate the exposure via a specific exposure pathway (Zartarian et al., 2000). Personal samples, such as hand wipes and videotape records of child
Table 16. Selected Dust Standards for Lead
Surface EPA Hazard Standard (μg/ft2) EPA Clearance Standard (μg/ft2)
Floor (carpeted or bare) 40 40
Interior Window Sill 250 250
Window Trough -- 400
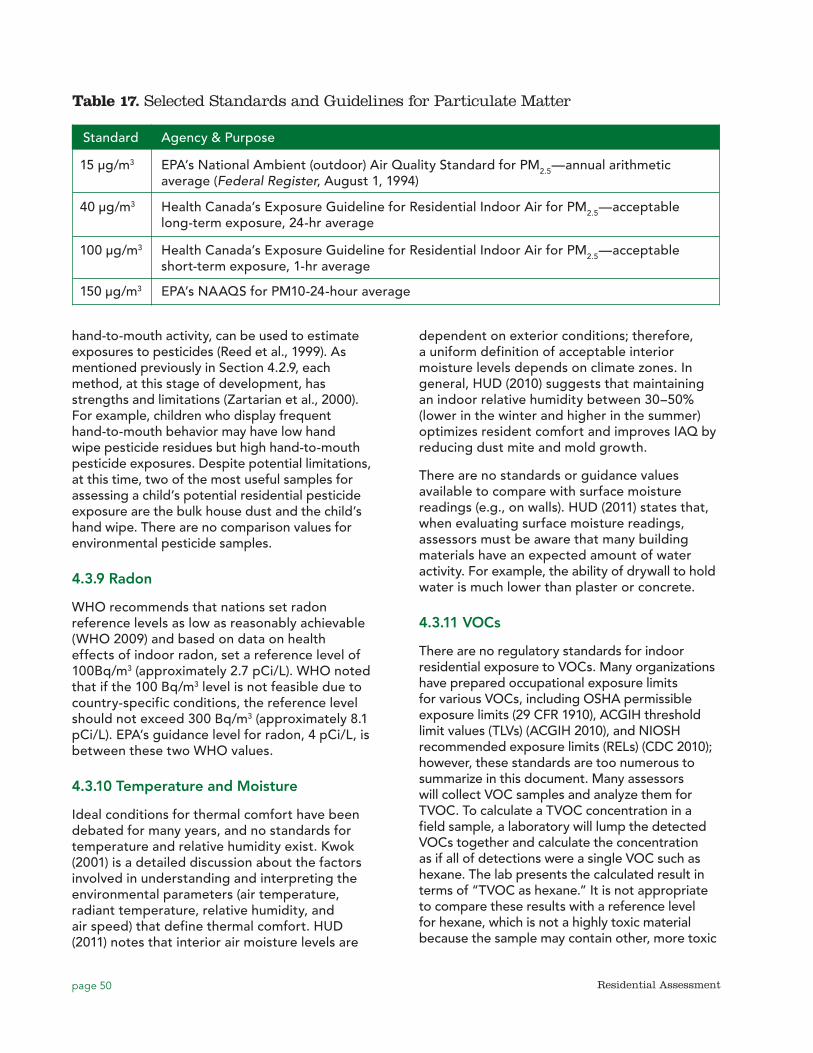
page 50 Residential Assessment
hand-to-mouth activity, can be used to estimate exposures to pesticides (Reed et al., 1999). As mentioned previously in Section 4.2.9, each method, at this stage of development, has strengths and limitations (Zartarian et al., 2000). For example, children who display frequent hand-to-mouth behavior may have low hand wipe pesticide residues but high hand-to-mouth pesticide exposures. Despite potential limitations, at this time, two of the most useful samples for assessing a child’s potential residential pesticide exposure are the bulk house dust and the child’s hand wipe. There are no comparison values for environmental pesticide samples.
4.3.9 Radon
WHO recommends that nations set radon reference levels as low as reasonably achievable (WHO 2009) and based on data on health effects of indoor radon, set a reference level of 100Bq/m3 (approximately 2.7 pCi/L). WHO noted that if the 100 Bq/m3 level is not feasible due to country-specific conditions, the reference level should not exceed 300 Bq/m3 (approximately 8.1 pCi/L). EPA’s guidance level for radon, 4 pCi/L, is between these two WHO values.
4.3.10 Temperature and Moisture
Ideal conditions for thermal comfort have been debated for many years, and no standards for temperature and relative humidity exist. Kwok (2001) is a detailed discussion about the factors involved in understanding and interpreting the environmental parameters (air temperature, radiant temperature, relative humidity, and air speed) that define thermal comfort. HUD (2011) notes that interior air moisture levels are
dependent on exterior conditions; therefore, a uniform definition of acceptable interior moisture levels depends on climate zones. In general, HUD (2010) suggests that maintaining an indoor relative humidity between 30–50% (lower in the winter and higher in the summer) optimizes resident comfort and improves IAQ by reducing dust mite and mold growth.
There are no standards or guidance values available to compare with surface moisture readings (e.g., on walls). HUD (2011) states that, when evaluating surface moisture readings, assessors must be aware that many building materials have an expected amount of water activity. For example, the ability of drywall to hold water is much lower than plaster or concrete.
4.3.11 VOCs
There are no regulatory standards for indoor residential exposure to VOCs. Many organizations have prepared occupational exposure limits for various VOCs, including OSHA permissible exposure limits (29 CFR 1910), ACGIH threshold limit values (TLVs) (ACGIH 2010), and NIOSH recommended exposure limits (RELs) (CDC 2010); however, these standards are too numerous to summarize in this document. Many assessors will collect VOC samples and analyze them for TVOC. To calculate a TVOC concentration in a field sample, a laboratory will lump the detected VOCs together and calculate the concentration as if all of detections were a single VOC such as hexane. The lab presents the calculated result in terms of “TVOC as hexane.” It is not appropriate to compare these results with a reference level for hexane, which is not a highly toxic material because the sample may contain other, more toxic
15 μg/m3
Table 17. Selected Standards and Guidelines for Particulate Matter
Standard Agency & Purpose
EPA’s National Ambient (outdoor) Air Quality Standard for PM2.5—annual arithmetic average (Federal Register, August 1, 1994)
40 μg/m3 Health Canada’s Exposure Guideline for Residential Indoor Air for PM2.5—acceptable long-term exposure, 24-hr average
100 μg/m3 Health Canada’s Exposure Guideline for Residential Indoor Air for PM2.5—acceptable short-term exposure, 1-hr average
150 μg/m3 EPA’s NAAQS for PM10-24-hour average
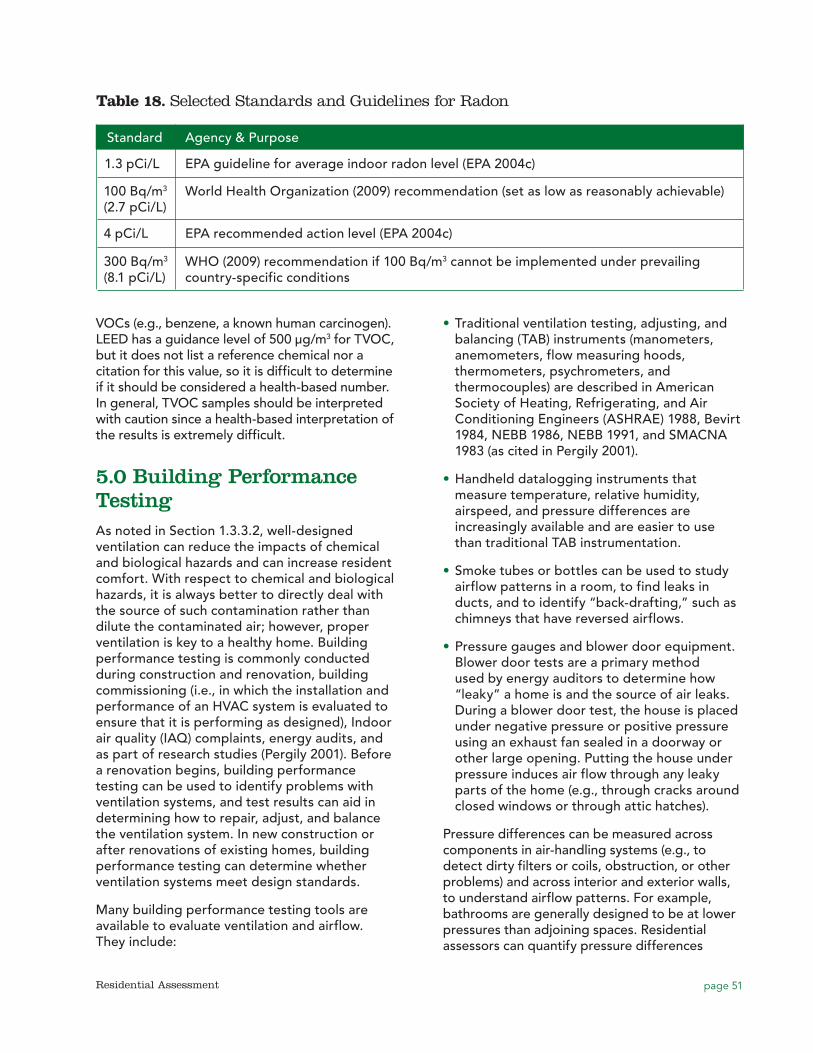
page 51Residential Assessment
VOCs (e.g., benzene, a known human carcinogen). LEED has a guidance level of 500 μg/m3 for TVOC, but it does not list a reference chemical nor a citation for this value, so it is difficult to determine if it should be considered a health-based number. In general, TVOC samples should be interpreted with caution since a health-based interpretation of the results is extremely difficult.
5.0 Building Performance TestingAs noted in Section 1.3.3.2, well-designed ventilation can reduce the impacts of chemical and biological hazards and can increase resident comfort. With respect to chemical and biological hazards, it is always better to directly deal with the source of such contamination rather than dilute the contaminated air; however, proper ventilation is key to a healthy home. Building performance testing is commonly conducted during construction and renovation, building commissioning (i.e., in which the installation and performance of an HVAC system is evaluated to ensure that it is performing as designed), Indoor air quality (IAQ) complaints, energy audits, and as part of research studies (Pergily 2001). Before a renovation begins, building performance testing can be used to identify problems with ventilation systems, and test results can aid in determining how to repair, adjust, and balance the ventilation system. In new construction or after renovations of existing homes, building performance testing can determine whether ventilation systems meet design standards.
Many building performance testing tools are available to evaluate ventilation and airflow. They include:
•• Traditional ventilation testing, adjusting, and balancing (TAB) instruments (manometers, anemometers, flow measuring hoods, thermometers, psychrometers, and thermocouples) are described in American Society of Heating, Refrigerating, and Air Conditioning Engineers (ASHRAE) 1988, Bevirt 1984, NEBB 1986, NEBB 1991, and SMACNA 1983 (as cited in Pergily 2001).
•• Handheld datalogging instruments that measure temperature, relative humidity, airspeed, and pressure differences are increasingly available and are easier to use than traditional TAB instrumentation.
•• Smoke tubes or bottles can be used to study airflow patterns in a room, to find leaks in ducts, and to identify “back-drafting,” such as chimneys that have reversed airflows.
•• Pressure gauges and blower door equipment. Blower door tests are a primary method used by energy auditors to determine how “leaky” a home is and the source of air leaks. During a blower door test, the house is placed under negative pressure or positive pressure using an exhaust fan sealed in a doorway or other large opening. Putting the house under pressure induces air flow through any leaky parts of the home (e.g., through cracks around closed windows or through attic hatches).
Pressure differences can be measured across components in air-handling systems (e.g., to detect dirty filters or coils, obstruction, or other problems) and across interior and exterior walls, to understand airflow patterns. For example, bathrooms are generally designed to be at lower pressures than adjoining spaces. Residential assessors can quantify pressure differences
Table 18. Selected Standards and Guidelines for Radon
Standard Agency & Purpose
1.3 pCi/L EPA guideline for average indoor radon level (EPA 2004c)
100 Bq/m3 (2.7 pCi/L)
World Health Organization (2009) recommendation (set as low as reasonably achievable)
4 pCi/L EPA recommended action level (EPA 2004c)
300 Bq/m3 (8.1 pCi/L)
WHO (2009) recommendation if 100 Bq/m3 cannot be implemented under prevailing country-specific conditions
page 52 Residential Assessment
across exterior walls to evaluate the potential for moisture transport. Residential assessors can also use pressure difference measurements between units in multifamily buildings, for example, to determine if secondhand smoke can travel from apartments of smokers to apartments of nonsmokers (Kraev et al., 2009). To measure pressure differences, the two sides of a pressure gauge are connected to tubes that run underneath doorways or through other openings.
Airflow patterns can be complex and flow in unexpected directions if properly designed entry and exhausts (“holes”) are not included (HUD 2011), making building performance testing difficult. Generally, air moves from higher- to lower- pressure areas, and warm air rises while cold air settles. The buoyancy of warm air rising creates a “stack effect” in the building, just like in a chimney. For example, hot air flows up through a chimney. In tall buildings, this can sometimes cause lower-floor apartments to be colder than upper-floor apartments.
6.0 Comparability of Self-Reported Measures, Visual Assessments, and Environmental Sampling Data As noted throughout this background paper, the determination of what type of assessment or combinations of assessments to perform depends on whether it is being conducted for program or research purposes and depends on the specific objectives and goals of that program and/or research study. This section summarizes various studies that have been done comparing self-reported measures (i.e., occupant survey results) with visual assessment results and environmental sampling data.
6.1 Visual Assessment Versus Sampling
Klitzman et al. (2005a) conducted a pilot study designed to determine the prevalence of LBP, vermin, mold, and safety conditions and hazards in homes and to validate observations and self-reports against environmental sampling data (70 dwellings, convenience sample, in a low-income, urban neighborhood in Brooklyn, New York). Results of the pilot showed that 96% of
residences contained multiple conditions and/or hazards. Frequencies of specific hazards were: LBP (80%), vermin (79%), elevated levels of airborne mold (39%), and safety hazards (100%). Comparisons of the self-reports and visual surveys to the environmental sampling data indicated that, in general, the more proximate an observed condition was to an actual hazard, the more likely it was to be associated with environmental sampling results (e.g., peeling LBP was associated with windowsill dust lead levels, and cockroach sightings by tenants were associated with Bla g 1 allergen levels). Conversely, the more distal an observed condition was to an actual hazard, the less likely it was to be associated with environmental sampling results (e.g., water damage, alone, was not statistically associated with elevated levels of airborne mold). In a follow-on to this study, Klitzman et al. (2005b) conducted a multi-hazard, multi-method intervention, addressing deteriorated LBP and lead dust, vermin, mold, and safety hazards in these 70 dwellings. Dwellings received paint stabilization, dust lead cleaning, integrated pest management (IPM), mold cleaning, and safety devices, as needed. The median remediation cost for labor and materials was $864.66 (range: $120.00–$5,235.33) per dwelling. Environmental conditions were evaluated prior to, immediately following, and an average of 5 months after remediation. The authors reported that the study results indicated a comprehensive approach to hazard remediation can be highly effective and cost efficient, and that overall improvement can be maintained, but noted that further research is needed to clarify the most effective sampling strategies, educational and behavioral interventions, and optimal intervention frequency.
Bradman et al. (2005) conducted a study to assess the association between multiple housing disrepair indicators and cockroach and rodent infestations in the homes of 644 pregnant Latina women. Results from a visual inspection revealed that 58% of the homes had peeling paint, 43% had mold, 25% percent had water damage, and 11% had rotting wood. The researchers also rated the level of cleanliness of each home and conducted inspections for cockroach and rodent infestations. Cockroach allergen concentrations, measured in a subset of homes, were found to be significantly higher in homes with evidence of cockroach infestations than in homes without
page 53Residential Assessment
observed cockroach infestations. The presence of cockroaches was also associated with multiple housing hazards including peeling paint, water damage and lack of cleanliness. The results suggest that a visual inspection of overall housing disrepair indicators provides useful information regarding other hazards such as pest infestations.
Ren et al. (2001) observed that surrogate measures of fungal presence in the home, such as damp spots, water damage, or leakage, as reported by household questionnaires, were not significantly and consistently related to the presence of culturable fungi measured in indoor air. Others, however, have had more success (Park et al., 2004; Mahooti-Brooks et al., 2004). In a study comparing visible mold damage, moldy odor, and qPCR/ERMI analytical results for 36 mold species, Reponen et al (2010) found that “microbial concentrations were not consistently associated with visible mold damage categories but were consistently higher in homes with moldy odor and in homes that had high ERMI. Low correlations between results in air and dust samples indicate different types or durations of potential microbial exposures from dust versus air.
In their study of SHS exposure, Kraev et al (2009) did not control for the location of smoking in the residence in relation to the sampling area. Additional information on the smoking locale (that is, kitchen, bedroom, patio, etc) may improve the observed relation between nicotine sampling results and the source strength in the home. More research is needed to determine whether SHS exposure is best characterized by the nicotine level in the main living area, bedroom, highest level in the home or an average of all of the rooms. Kraev et al. (2009) noted that recent studies highlight the potential for deposited or adsorbed particulates or gases to contribute to household exposure to toxic compounds originating from smoking (‘‘thirdhand smoke exposure’’). Owing to the complicated behavior of many semivolatile compounds, including nicotine, in indoor environments, Kraev et al. stated that mechanistic models must be developed to correctly identify dominant exposure pathways and estimate health risks from SHS exposures.
6.2 Occupant Survey Versus Visual Assessment
In a randomized study on the validity of self-reported responses to questions about home safety, Hatfield et al. (2005) compared questionnaires answered by Head Start families to home inspections (n=259). The authors found that self-reported use of safety devices and practices by parents of preschool aged children was generally reliable. Answers about the presence or absence of certain safety devices (e.g., CO detectors) were generally more accurate than those about safety practices (e.g., safe medicine storage). Reliability increased when the interview was conducted in the home, although the authors hypothesized that this may have been because parents were more prepared to answer the survey questions because they had previously agreed to a home visit for solely that purpose. In addition, the parents receiving the interview at home had been told they would receive help injury proofing their homes, which may have provided additional motivation to report unsafe conditions. In a similar study, Robertson et al. (2005) evaluated the validity of parents’ self-reported home safety practices concerning smoke detectors, bike helmets, car seats, and water heater temperature. The results suggest that parent self report practice of certain injury prevention behaviors (e.g., owning a car seat, hot water temperatures) is reliable, whereas self reports on other practices (e.g., working smoke detectors, properly fitting bike helmets) may be overstated.
According to Kraev et al. (2009), there are limitations when using a questionnaire to evaluate the respondents’ SHS exposure. In occupant surveys, exposures may be misclassified due to the respondents’ lack of awareness of cigarette exposure, inadequate recall, or possible deception in reporting smoking status. Visual assessments, however, can help validate the smoking information provided by the respondents.
6.3 Occupant Survey Versus Sampling
Leaderer (2004) assessed the accuracy of questionnaire reports of cat and dog ownership and presence of cockroaches in predicting
page 54 Residential Assessment
measured allergen concentrations in house dust. In the study, questionnaire results were compared to measured allergen levels collected dust samples in 932 homes of newborns living in New England. The dust analysis results were grouped into either “low” or “high” level allergen categories according to the following cut points (low first, then high): 1.0 µg/g and 8.0 µg/g for cat, 2.0 µg/g and 10.0 µg/g for dog, and 2 U/g and 8 U/g for cockroach allergen. The comparison showed that questionnaire-reported pet ownership and presence of cockroaches predicted allergen levels when in the “high” allergen level category, but was a relatively poor measure of allergen exposure at lower levels (i.e., when measured levels were near the limit of detection and the lower cut point). The authors concluded that, for epidemiologic purposes, measured concentrations of allergens are necessary.
Limited information is available on how well pesticide exposure data from questionnaires corresponds with data collected from home environmental samples. Sexton et al. (2003) found that telephone screening and questionnaires were inadequate predictors of households exposed to higher levels of target pesticides, possibly due to incongruity between the general questions asked on the survey and the far more specific pesticide measurements from samples. However, Colt et al. (2004) found information gathered from detailed questionnaires that included visual aids and focused on the types of pests treated, who applied the pesticide, how often the pesticide was applied, and longer time frames of interest, correlated well with the types of pesticides found in vacuum bag samples. In addition, authors suggest that detailed questionnaires can be useful in capturing pesticides used in the home prior to the installation of carpets. When used in conjunction with environmental sampling, questionnaires can provide additional useful information that may not otherwise be captured.
Both occupant surveys and visual inspections can be used to evaluate combustion-related residential hazards. Surveys and inspections
may be used to identify inappropriate use of equipment by occupants or problems with equipment, chimneys, flues, vents, or ventilation. Due to the intermittent nature of many combustion appliance problems, occupant surveys and visual inspections are an extremely important tool in evaluating combustion gas hazards because many hazards may not readily be apparent from direct sampling and analysis of indoor air on a one-time or limited sampling schedule. For example, although air sampling at the time of investigation may not show any air toxics at a level of concern, observed housing conditions such as the presence of an attached garage, an improperly installed furnace ventilation system, or visual evidence of backdrafting (e.g., soot, scorched surfaces, and melted fittings near the vent) may indicate the potential for or periodic build-up of combustion gases to dangerous levels (CMHC 1998). Visual inspection should include exhaust ventilation on gas, oil, and wood-burning appliances and unvented appliances such as space heaters, cooking ranges, and ovens.
7.0 Research Needs, Information Gaps, and DiscussionThere are tremendous research needs and information gaps related to the assessment of residential hazards. To those involved in lead hazard control programs, this will not come as a surprise given the effort that has been required to understand and improve lead risk assessment. In many ways, creating effective assessment protocols for an overall residential hazard assessment would appear to be an order of magnitude more difficult than creating protocols only for lead exposure. Less is known about causal relationships and pathways of exposure for many of the residential hazards discussed in this paper—allergens, molds, and toxicants—than is known for lead. This understanding is crucial for selection of the most appropriate targets for assessment. In some cases, standard methods of laboratory analysis, and standards for interpretation and comparison of those analyses are lacking.
Beyond individual hazards are the many unanswered questions concerning multiple
page 55Residential Assessment
hazards and how multiple hazards interact physically or chemically to create an overall hazard in a home. And, of course, there is the issue of which hazards should receive the most focus in an assessment. For example, how do frequent, well-characterized, non-fatal injuries rank, compared to less frequent but potentially serious toxic exposures? Therefore, research is needed to assess the hierarchy of individual risks, as well as assess the overall risk associated with a home, including:
General Assessment Issues
•• Relation of environmental concentration levels (vacuum dust, etc.) to actual exposure—risk assessment.
•• Characterizing (and validating) the relationships between visual surveys (readily observable conditions), occupant reports, and environmental sampling data, and to determine how each of these can be used to assess the cumulative impact on human health.
•• Better understanding of the causal relationships and pathways of exposure for health effects associated with allergens, molds, pesticides, VOCs, and other indoor toxins.
•• Characterizing the extent and severity of individual residential hazards.
•• Understanding interactions between risk factors for the different health endpoints associated with residential hazards.
Methodological Issues
•• Characterization of sources of variability in analytical results and development of quality control samples.
•• Determination of performance criteria for analytic methods (e.g., detection limits, etc.).
•• Developing standards for laboratory analyses and comparison of laboratory analyses. The Environmental Law Institute (1998), in a 1998 workshop held on IAQ, identified the following standards as most in need of further development: biologicals, VOCs, NO2, testing protocols for mold, aldehydes, particulates, CO, ventilation, and off-gassing of building materials and products.
•• Accreditation of proficiency testing programs.
•• Mold assessment issues:
•�Standard methods for mold sampling.
•�Standard methods for analysis of mold toxins.
•�Standardized methods for analysis of mold allergens.
•�Further research on fungal measurement using indicators of fungal growth (e.g., microbial VOCs).
•• Allergen assessment issues:
•�Research on accuracy of home allergen tests and development of better sampling and quantitation techniques.
•�Greater standardization of assays for measuring allergen levels to allow for comparison.
•• Pesticide assessment issues:
•�Standardized sample collection methods for house dust to be analyzed for pesticides from floors and surfaces.
•�Relation of environmental samples/pesticide surface loadings (vacuum dust, etc.) to actual exposure (e.g., information on exposure pathways and activity patterns of children).
•• Injury assessment and control issues:
•� Identification and characterization of residential injury risk factors for different types of injuries.
•�Better understanding of parental knowledge and practices and how they relate to childhood injury.
•�Longitudinal epidemiological studies of the efficacy of low cost residential interventions in preventing childhood injuries.
•• Understanding effective indicators of exposure to biological agents (e.g., whether microbial VOCs can be used as indicators of moisture problems or toxic molds).
•• Developing and verifying cost-effective, quick tests for allergens and toxins.
Issues Related to Housing Structure
•• Data to quantify which aspects of household water damage are related to respiratory illness.
page 56 Residential Assessment
•• Areas of potential impact in building code and design to improve the indoor environment for asthmatics.
•• Improved labeling of “healthy” building materials and home furnishings (e.g., reduced VOC emissions, resistance to microbial growth).
While the research and information needs are undeniably formidable, the advantage of taking a holistic approach to the assessment of residential hazards is that commonalities may emerge, such as those related to a structural characteristic of the home, a common pathway of exposure, or a common means of assessment resulting in identification of obvious, efficient targets for reducing the overall hazard in a home. These commonalities may emerge even while considerable uncertainty remains concerning many details of the individual hazards. In this way, the effect of the whole—in terms of an integrated residential hazard assessment—may actually be greater than the sum of its parts.
page 57Residential Assessment
References
Adgate, J.L., Kukowski, A., Stroebel, C., Shubat, P.J., Morrell, S., Quackenboss, J.J., Whitmore, R.W., and K. Sexton. 2000. Pesticide Storage and Use Patterns in Minnesota Households with Children. Journal of Exposure Analysis and Environmental Epidemiology. 10:159–167.
Agency for Toxic Substances and Disease Registry. Toxicological Profile: Lead. Atlanta, GA: U.S. Department of Health and Human Services; 2007.
Air Quality Sciences. 2011. Ultrafine Particles Why All The Concern About Something So Small? Air Quality Sciences, Inc., Atlanta, GA.
American Academy of Pediatrics, Committee on Environmental Health. 1998. Toxic effects of indoor molds. Pediatrics. 101:712–714.
ACGIH. 1999. Bioaerosols: Assessment and Control. (J. Macher, ed.). American Conference of Governmental and Industrial Hygienists, Cincinnati, Ohio.
AIHA, 2001. Report of Microbial Growth Task Force. American Industrial Hygiene Association Press, Fairfax, Virginia.
AIHA. 2003. The Facts about Mold: For the Professional. American Industrial Hygiene Association Fact Sheet. Available online at http://www.aiha.org/GovernmentAffairs-PR/html/mold-professional.htm (last updated September 2003).
AIHA 2008. Recognition, Evaluation, and Control of Indoor Mold. 2008. American Industrial Hygiene Association. Edited by Bradley Prezant, Donald M. Weekes, and J. David Miller. AIHA Product IMOM08–679. https://webportal.aiha.org/Purchase/ProductDetail.aspx?Product_code=3f9e0a5a-4778-de11-96b0-0050568361fd
AIHA 2010a. Environmental Microbiology Proficiency Analytical Testing (EMPAT) Program. http://www.aihaaccreditedlabs.org/AccredPrograms/EMLAP/Pages/default.aspx. Accessed: November 30, 2010.
AIHA 2010b. Environmental Microbiology Laboratory Accreditation Program (EMLAP). http://www.aihaaccreditedlabs.org/AccredPrograms/EMLAP/Pages/default.aspx Accessed November 30, 2010.
American Lung Association of the Mountain Pacific. MHE Program Introduction. September 2009.
Agency for Health Care Research and Quality (AHRQ) 2008. Child Asthma Risk Assessment Tool. http://carat.asthmarisk.org/RiskProfile/assessment.pdf
ASTM 2006. D7297-06: Standard Practice for Evaluating Residential Indoor Air Quality Concerns. Philadelphia: American Society for Testing and Materials.
ASTM 2007. D5466-01: Standard Test Method for Determination of Volatile Organic Compounds in Atmospheres (Canister Sampling methodology). Philadelphia: American Society for Testing and Materials.
ASTM 2009. D6196-03: Standard Practice for Selection of Sorbents, Sampling, and Thermal Desorption analysis Procedures for Volatile Organic Compounds in Air. Philadelphia: American Society for Testing and Materials.
Ammann, H.M. 1999. Microbial volatile organic compounds. In: Bioaerosols: Assessment and Control. (J. Macher, ed.). American Conference of Governmental and Industrial Hygienists, Cincinnati, Ohio.
Arbes, S.J., Jr., Sever, M., Vaughn, B., Mehta, J., Lynch, J.T., Mitchell, H., Hoppin, J.A., Spencer, H.L., Sandler, D.P., and D.C. Zeldin. 2005. Feasibility of using subject-collected dust samples in epidemiologic and clinical studies of indoor allergens. Environmental Health Perspectives. 113(6):665–9.
Arbes, S.J., Cohn, R.D., Yin, M., Muilenberg, M.L., Burge, H.A., Friedman, W., and D.C. Zeldin. 2003. House dust mite allergen in US beds: results from the First National Survey of Lead and Allergens in Housing. Journal of Allergy and Clinical Immunology, 111(2):408–414.
Asmussen L., Olson LM, Grant EM, Fagan J, and Weiss, KB. 1999. Reliability and validity of the Children’s Health Survey for Asthma. Pediatrics, 104 (6): e71.
Baker S.P., O’Neill B., Ginsburg M.J., and G. Li. 1992. The Injury Fact Book, Second Edition. Oxford University Press, USA. 368 pp.
page 58 Residential Assessment
Bellinger DC, Needleman HL. Intellectual impairment and blood lead levels. N Engl J Med. 2003; 349(5):500–502.
Birch ME, Pearce TA, Coffey CC. 2009 Direct-Reading Instruments for Gas and Vapor Detection. 2009. ACGIH, Cincinnati, OH
Black M. The complete picture: Indentifying VOCs is a key step in IAQ studies. The Synergist, August 2010. Pg 27–28.
Bradman, A., Chevrier, J., Tager, I., Lipsett, M., Sedgwick, J., Macher, J., Vargas, A.B., Cabrera, E.B., Camacho, J.M., Weldon, R., Kogut, K., Jewell, N.P., and Eskenazi, B. 2005. Association of housing disrepair indicators with cockroach and rodent infestations in a cohort of pregnant Latina women and their children. Environmental Health Perspectives. 113(12):1795–1801.
Bradman, A. and R.M. Whyatt. 2005. Characterizing exposures to nonpersistent pesticides during pregnancy and early childhood in the National Children’s Study: A review of monitoring and measurement methodologies. Environmental Health Perspectives. 113(8):1092–1099.
Braun-Fahrlander, C., Riedler, J., Herz, U., Eder, W., Waser, M., Grize, L., Maisch, S., Carr, D., Gerlach, F., Bufe, A., Lauener, R.P., Schierl, R., Renz, H., Nowak, D., and von Mutius, E. 2002. Environmental exposure to endotoxin and its relation to asthma in school-age children. New England Journal of Medicine. 347(12):869–877.
Breysse JV, Jacob DE, Weber W, Dixon S, Kawecki C, Aceti S, Lopez J. Health Outcomes and Green Renovation of Affordable Housing. Public Health Reports 2011 Supplement 126; 64–75
Brugge Doug, John L. Durant and Christine Rioux. 2007. Near-highway pollutants in motor vehicle exhaust: A review of epidemiologic evidence of cardiac and pulmonary health risks. Environmental Health. 6(23).
Building Performance Institute 2005. Building Analyst Professional Standard: Combustion Safety and Carbon Monoxide Protection. http://www.bpi.org/Web%20Download/BPI%20Standards/Building%20Analyst%20Professional_2-28-05nNC-newCO.pdf.
Burge, H.A. and H.A. Ammann. 1999. Fungal Toxins and b (13)-D-Glucans. In: Bioaerosols: Assessment and Control. (J. Macher, ed.). American Conference of Governmental and Industrial Hygienists, Cincinnati, Ohio.
Burge, H.A. and J.A. Otten. 1999. Fungi. In: Bioaerosols: Assessment and Control. (J. Macher, ed.). American Conference of Governmental and Industrial Hygienists, Cincinnati, Ohio.
Bush, R.K. and Portnoy, J.M. 2001. The role and abatement of fungal allergens in allergic diseases. Journal of Allergy and Clinical Immunology (Supplement). 107(3, part 2): 430.
Butz am, Breysse P, Rand C, Curtin-Brosnan J, Eggleston P, Diette GB, Williams D, Bernert JT, Matsui EC. Household smoking behavior: effects on indoor air quality and health of urban children with asthma. Matern Child Health J. 2010 April 18 (epub ahead of print). http://www.springerlink.com.proxy.cc.uic.edu/content/h188h88118728446/fulltext.pdf. Accessed 12/7/2010.
Buzea Cristina, Ivan I. Pacheco and Kevin Robbie. 2007. Nanomaterials and nanoparticles: Sources and toxicity. Biointerphases 2(4).MR 17–71
Canada Mortgage and Housing Corporation (CMHC) 2010. Combustion Gases in Your Home-Things You Should Know About Combustion Spillage. http://www.cmhc-schl.gc.ca/
Canfield RL, Henderson CR Jr, Cory-Slechta DA, Cox C, Jusko TA, Lanphear BP. Intellectual impairment in children with blood lead concentrations below 10 microgram per deciliter. N Engl J Med. 2003; 348(16):1517–1526.
CDC (Centers for Disease Control and Prevention). 2005. Blood lead levels, United States, 1999–2002. MMWR Morb Mortal Wkly Rep 54(20):513–516.
CDC. 2005. Centers for Disease Control and Prevention, National Center for Environmental Health, National Center for Infectious Diseases, National Institute for Occupational Safety and Health, “Mold: Prevention Strategies and Possible Health Effects in the Aftermath of Hurricanes Katrina and Rita,” Department of Health and Human Services, October 2005.
page 59Residential Assessment
CDC 2010. Formaldehyde exposure in homes: A reference for state officials to use in decision-making. Available at: http://www.cdc.gov/nceh/ehhe/trailerstudy/pdfs/08_118152_Compendium%20for%20States.pdf. Accessed 12/9/2010
CDC 2010. NIOSH Pocket Guide to Chemical Hazards. NIOSH, Cincinnati, Ohio. Available at http://www.cdc.gov/niosh/npg/. Accessed 12/9/10
Care and Repair England. Safer Homes, Healthier Lives. Self-Training Toolkit Highlighting the connections between Housing Conditions and Health. January 2006. http://www.careandrepair-england-hhhl.org.uk/hhsrstoolkit.htm. Accessed October 4, 2010.
Centers for Disease Control and Prevention. Preventing Lead Poisoning in Young Children: A Statement by the Centers for Disease Control and Prevention. Atlanta, GA: US Department of Health and Human Services; 1991.
Centers for Disease Control and Prevention. Blood lead levels—United States, 1999–2002. MMWR Morb Mortal Wkly Rep. 2005;54(20): 513–516.
Centers for Disease Control and Prevention. Interpreting and managing blood lead levels <10 μg/dL in children and reducing childhood exposures to lead: recommendations of CDC’s Advisory Committee on Childhood Lead Poisoning Prevention. MMWR Recomm Rep. 2007; 56:1–14.
Centers for Disease Control and Prevention and U.S. Department of Housing and Urban Development. HUD Healthy Housing Inspection Manual. Atlanta: US Department of Health and Human Services; 2008. http://www.cdc.gov/nceh/publications/books/inspectionmanual/Healthy_Housing_Inspection_Manual.pdf
CDC 2010. MMWR, May 14, 2010/59(SS04);1–50) Surveillance for Violent Deaths—National Violent Death Reporting System, 16 States, 2007
CEC, 1993. Biological Particles on Indoor Environments. Commission of the European Communities, European Collaborative Action, Report No. 12 Luxemburg.
Chalupa David C., Paul E. Morrow, Günter Oberdörster, Mark J. Utell and Mark W. Frampton. 2004. Ultrafine particle deposition in subjects with asthma. Environmental Health Perspectives. 112 (8); 879–882.
Chanda SM, Pope CN. Neurochemical and neurobehavioral effects of repeated gestational exposure to chlorpyrifos in maternal and developing rats. Pharmacol Biochem Behav. 1996; 53(4):771–776.
Chapman, M.D., Vailes, L.D., and K. Ichikawa. 2000. Immunoassays for Indoor Allergens. Clinical Reviews in Allergy & Immunology 18(3): 285–300.
Chen D, Pui DYH. 2009 Direct-Reading Instruments for Analyzing Airborne Particles. ACGIH, Cincinnati, OH
Chew, G.L. 2005. Comments on December 2005 review draft of HUD background paper, Healthy Homes Issues: Mold.
Chew, G.L., Perzanowski, M.S., Miller, R.L., Correa, J.C., Hoepner, L.A., Jusino, C.M., Becker, M.G., and Kinney, P.L. 2003. Distribution and determinants of mouse allergen exposure in low-income New York City apartments. Environmental Health Perspectives. 110(10): 1348–1351.
Chew, G., Doekes, G., Douwes, J., Higgins, K.M., van Strien, R., Spithoven, J., and Brunekreef, B. 2001. Fungal extracellular polysaccharides, beta(13) glucans and culturable fungi in repeated sampling of house dust. Indoor Air. 11: 171–178.
Chew, G. L., Higgins, K. M., Gold, D. R., Muilenberg, M. L., and H. A. Burge. 1999. Monthly measurements of indoor allergens and the influence of housing type in a northeastern US city. Allergy 54:1058–1066.
Chew, G.L., Burge, H.A., Dockery, D.W., Muilenberg, M.L., Weiss, S.T. and Gold, D.R. 1998. Limitations of a home characteristics questionnaire as a predictor of indoor allergen levels. American Journal of Respiratory and Critical Care Medicine. 157:1536–1541.
page 60 Residential Assessment
Chuang, J.C., Lyu, C.W., Chou, Y-L., Callahan, P.J., Nishioka, M., Andrews, K., Pollard, M.A., Brackney, L., Hines, C., Davis, D.B., and R.G. Menton. 1999. Evaluation and Application of Methods for Estimating Children’s Exposure to Persistent Organic Pollutants in Multiple Media. EPA/600/R-98/164 a, b, and c (Volume I, II, and III).
CMHC, 1993. Clean-up Procedures for Mold in Houses. Canada Mortgage and Housing Corporation. Ottawa, Canada.
CMHC. 1998. The Clean Air Guide: How to Identify and Correct Indoor Air Problems in Your Home. Canada Mortgage and Housing Corporation.
Multi-tool formaldehyde measurement in simulated and real atmospheres for indoor air survey and concentration change monitoring. Laura Chiappini, Romain Dagnelie, Maria Sassine, Faustina Fuvel and Sebastien Fable, et al. Air Quality, Atmosphere & Health, Online First™, 20 October 2010.
Clickner RP, Marker D, Viet SM, Rogers J, Broene P. National Survey of Lead and Allergens in Housing, Final Report; Volume I: Analysis of Lead Hazards. Washington, DC: US Department of Housing and Urban Development; 2001.
Codina R and Lockey RF. Indoor allergen measurements: A call for universal standards. J Allergy Clin Immunol 2007;119(2):518
Cohn, R.D., Arbes, S.J., Jaramillo, R., Reid, L.H., and D.C. Zeldin. 2006. National prevalence and exposure risk for cockroach allergen in U.S. households. Environmental Health Perspectives. 114(4):522–526.
Colome, S.D., Wilson, A.L. and T. Yian. 1994. California residential indoor air quality study. Volume 2. Carbon monoxide and air exchange rate: an univariate and multivariate analysis. Chicago, Il. Gas Research Institute. GRI-93/0224.3.
Colt, J.S., Lubin, J., Camann, D., Davis, S., Cerhan, J., Severson, R. K., Cozen, W., and P. Hartge. 2004. Comparison of pesticide levels in carpet dust and self-reported pest treatment practices in four U.S. sites. Journal of Exposure Analysis and Environmental Epidemiology. 14:74–83.
Custovic, A., Fletcher, A., Pickering, C.A., Francis, H.C., Green, R., Smith, A., et al. 1998b. Domestic allergens in public places III: house dust mite, cat, dog and cockroach allergens in British hospitals. Clinical and Experimental Allergy. 28:53–9.
Consumer Product Safety Commission 2002. Responding to Residential Carbon Monoxide Incidents: Guidelines for Fire and Other Emergency Response Personnel. July 2002. http://www.cpsc.gov/CPSCPUB/PUBS/coguide.pdf.
CPSC. 2003. Responding to Residential Carbon Monoxide Incidents: Guidelines for Fire and Other Emergency Response Personnel. U.S. Consumer Product Safety Commission, November 2003. Access: www.cpsc.gov/library/foia/foia04/os/resident.pdf
CPSC. 2004a. CPSC Cautions Caregivers about Hidden Hazards for Babies on Adult Beds. U.S. Consumer Products Safety Commission. Retrieved January 7, 2004 from http://www.cpsc.gov/cpscpub/pubs/5091.htm.
CPSC. 2004b. Crib Sheets (CPSC Document #5137). U.S. Consumer Products Safety Commission. Retrieved January 7, 2004 from http://www.cpsc.gov/cpscpub/pubs/5137.htm.
CPSC. 2004c. Soft Bedding May be Hazardous to Babies. U.S. Consumer Products Safety Commission. Retrieved January 7, 2004 from http://www.cpsc.gov/cpscpub/pubs/5049.htm.
CPSC. 2004d. Crib Safety Tips: Use Your Crib Safely (CPSC Document #5030). U.S. Consumer Products Safety Commission. Retrieved January 7, 2004 from http://www.cpsc.gov/cpscpub/pubs/5030.htm.
CPSC Document 524 (no year). Electrical Receptacle Outlets. http://www.cpsc.gov/cpscpub/pubs/524.html. Accessed 11/17/2010
CPSC Document 559. Smoke Alarms: Why, Where, and Which. March 6, 2008. http://www.cpsc.gov/CPSCPUB/PUBS/smokealarms.pdf- 117.4KB Accessed 10/28/2010.
page 61Residential Assessment
Cox-Ganser JM; Rao CY; Park J-H; Schumpert JC; Kreiss K. Asthma and respiratory symptoms in hospital workers related to dampness and biological contaminants. Indoor Air 2009;19:280–290.
Comparison of home assessment and self-report measures of environmental tobacco smoke in children with asthma Journal of Allergy and Clinical Immunology, Volume 111, Issue 1, Supplement 2, February 2003, Page S134 J.M. Curtin-Brosnan, P.A. Eggleston, S. Kanchanaraksa, R.A. Wood, C.S. Rand, G.B. Diette.
Curwin B and Bertke S 2011. Exposure characterization of metal oxide nanoparticles in the workplace. J Occup Environ Hygiene 8(10); 580–587.
De Lucca, S. et al. 1998. Mite allergen (Der p 1) is not only carried on feces. Journal of Allergy and Clinical Immunology. 101:S168.
DOE 2009. Weatherization Program Notice 09-6. Lead Safe Weatherization (LSW)-Additional Materials and Information. DOE, Washington, DC. http://www.waptac.org/data/files/website_docs/government/guidance/2009/wpn%2009-6%20final%20guidance%20document.pdf. Accessed 10/28/2010.
DiGuiseppi C, Jacobs DE, Phelan KJ, Mickalide AD, Ormandy D. Housing interventions and control of injury-related structural deficiencies: A review of the evidence. J Public Health Management Practice 2010; 16(5) E-Supp: S34–S43.
Dillon, H.K., Heinsohn, P.A., Miller, J.D. 2005. Field Guide for the Determination of Biological Contaminants in Environmental Samples, 2nd ed. Fairfax VA: American Industrial Hygiene Association.
Dillon, H.K., J.D. Miller, W.G. Sorenson, J Douwes and R.R. Jacobs. 1999. Review of methods applicable to the assessment of mold exposure to children. Environmental Health Perspectives. 107:473–480.
Dixon S, Gaitens JM, Jacobs DE, Strauss W, Nagaraja J, Pivetz T, Wilson JW, Ashley, PJ. Exposure of U.S. children to residential dust lead, 1999–2004: II. The contribution of lead-contaminated dust to children’s blood lead levels. Environ Health Perspectives 2009; 117(3): 468–473.
Douwes, J., van der Sluis, B., Doekes, G., van Leusden, F., Wijnands, L., van Strien, R., Verhoeff, A., and Brunekreef, B. 1999. Fungal extracellular polysaccharides in house dust as a marker for exposure to fungi: Relations with culturable fungi, reported home dampness, and respiratory symptoms. Journal of Allergy and Clinical Immunology. 103:494–500.
Douwes, J., Doekes, G., Heinrich, J., Koch, A., Bischof, W., and B. Brunekreef. 1998. Endotoxin and beta(13)-Glucan in House Dust and the Relation with Home Characteristics: A Pilot Study in 25 German Houses. Indoor Air. 8:255–263
Dowd, M.D. 1999. Childhood injury prevention at home and play. Current Opinions in Pediatrics. 11(6):578–582.
Edwards, R.D. and P.J. Lioy. 1999. The EL Sampler: A press sampler for the quantitative estimation of dermal exposure to pesticides in house dust. Journal of Exposure Analysis and Environmental Epidemiology. 9:521–529.
Eggleston PA and Bush RK, “Environmental allergen avoidance: An overview,” Supplement to the Journal of Allergy and Clinical Immunology. 2001; 107(3):S403–405.
Eggleston, P.A. 2003. Control of environmental allergens as a therapeutic approach. Immunology and Allergy Clinics of North America. 23:533–547.
Eggleston, P.A. and L.K. Arruda. 2001. Ecology and elimination of cockroaches and allergens in the home. Journal of Allergy and Clinical Immunology (Supplement). 107(3, part 2): 422.
EHW. 2004. Environmental Health Watch. Home Moisture Audit. Available at http://www.ehw.org/Healthy_House/HH_Moist_Audit.htm.
page 62 Residential Assessment
The Environmental Law Institute. 1998. Indoor Air Quality Workshops for State and Local Officials Meeting Report. Washington, D.C.
Eskenazi B, Rosas LG, Marks AR, et al. Pesticide toxicity and the developing brain. Basic Clin Pharmacol Toxicol. 2008; 102(2):228–236.
Etzel R.A. and S.J. Balk, eds. (1999). Handbook of Pediatric Environmental Health (The Green Book). Elk Grove Village IL: American Academy of Pediatrics.
Finet, D. Restoring indoor health, one house at a time. Home Energy 2004; Jan/Feb:24–27
Flannigan, B. 1997. Air sampling for fungi in indoor environments. J. Aerosol Sci. 28(3):381–392.
Flannigan, B. and Miller, J.D. 1994. Health implications of fungi in indoor environments—an overview. In: Health Implications of Fungi in Indoor Environments. (ed. R. Samson, B. Flannigan, M.E. Flannigan, & S. Graveson). p. 3–28. Elsevier, Amsterdam.
Frampton MW, Utell MJ, Zareba W, Oberdörster G, Cox C., Huang LS, Morrow PE, Lee FE, Chalupa D, Frasier LM, Speers DM and Stewart J. 2004. Effects of exposure to ultrafine carbon particles in healthy subjects and subjects with asthma. Res. Rep. Health Eff. Inst. (126):1–47.
Gaitens JM, Dixon SL, Jacobs DE, Nagaraja J, Strauss W, Wilson, JW, Ashley PJ. Exposure of U.S. Children to Residential Dust Lead, 1999–2004: I. Housing and Demographic Factors. Environ Health Perspectives 2009; 117(3):461–467.
Galke W., Clark C.S., Wilson, J., Jacobs, D., Succop, P., Dixon, S, et al. Evaluation of the HUD Lead Hazard Control Grant Program: early overall findings. Environ Res 86(2); 149–156.
Gordon, S.M., Callahan, P.J., Nishioka, M.G., Brinkman, M.C., O’Rourke, M.K., Lebowitz, M.D., and D.J. Moschandreas. 1999. Residential Environmental Measurements in the National Human Exposure Assessment Survey (NHEXAS) Pilot Study in Arizona: Preliminary Results for Pesticides and VOCs. Journal of Exposure Analysis and Environmental Epidemiology. 9:456–470.
Gorny, R.L., Reponen, T., Willeke, K., Schmechel, D., Robine, E., Boissier, M., and Grinshpun, S.A. 2002. Fungal fragments as indoor air biocontaminants. Applied Environmental Microbiology. 68(7):3522–3531.
Gots, R.E., Layton, N.J., and Pirages, S.W. 2003. Indoor health: background levels of fungi. AIHA Journal. 64:427–438.
Gravesen, S. 1999. Microfungal contamination of damp buildings: Examples of risk construction and risk materials. Environmental Health Perspectives. 107(3):505–508.
Green, B.J., Sercombe, J.K., and Tovey, E.R. 2005. Fungal fragments and undocumented conidia function as new aeroallergen sources. Journal of Allergy and Clinical Immunology. 115(5):1043–1048.
Greiner, T.H. and C.V. Schwab. 2000. Approaches to Dealing with Carbon Monoxide in the Living Environment. In: Carbon Monoxide Toxicity (D.G. Penney, ed.). CRC Press, Boca Raton, FL.
Halsey, John F. Personal communication. 1/14/04. IBT Reference Laboratory. Lenexa, KS.
Assessment of indoor allergen exposure. Robert G. Hamilton. Current Allergy and Asthma Reports, 2005, Volume 5, Number 5, Pages 394–401
Hansel N.N., Breysse, P.N., McCormick, M.C., Matsui, E.C., Curtin-Brosnan, J., Williams, D., Moore, J.L., Cuhran, J.L., Diette, G.B. A longitudinal study of indoor nitrogen dioxide levels and respiratory symptoms in inner-city children with asthma. Environ Health Perspect 116:1428–1432 (2008).
Harvard Center for Risk Analysis. 1996. Ranking Risks in the Home. Risks in Perspective. 5(4):1–4. Harvard School of Public Health.
Hatfield, P.M., Anthony G. Staresinic, Christine A. Sorkness, Nanette M. Peterson, Joseph Schirmer, Murray L. Katcher. Validated self-reported home safety practices in a culturally diverse non-inner city population. Injury Prevention, submitted for publication 2005.
page 63Residential Assessment
Health Canada 2010. Residential Indoor Air Quality Guidelines. Available at http://www.hc-sc.gc.ca/ewh-semt/air/in/res-in/index-eng.php Accessed 12/9/10.
Hirsch, T., Kuhlisch, E., Soldan, W., and W. Leupold. 1998. Variability of House Dust Mite Allergen Exposure in Dwellings. Environmental Health Perspectives. 106(10):659.
Horner, W.E. 2003. Assessment of the indoor environment: evaluation of mold growth indoors. Immunology and Allergy Clinics of North America. 23(3):519–31.
Horner, W.E., Worthan, A.G., and Morey, P.R. 2004. Air- and dust-borne mycoflora in houses free of water damage and fungal growth. Applied and Environmental Microbiology. 70(11): 6394–6400.
Horner, W.E. 2006. Comments on December 2005 review draft of HUD background paper, “Healthy Homes Issues: Mold.”
HUD 1995. Guidelines for the Evaluation and Control of Lead-Based Paint Hazards in Housing. June 1995. U.S. Department of HUD, OHHLHC. Available at http://www.hud.gov/offices/lead/lbp/hudguidelines/index.cfm. Accessed 7 September 2010.
HUD 2001. Lead Paint Safety: A Field Guide for Painting, Home Maintenance, and Renovation Work. March 2001. HUD-1779-LHC. http://www.epa.gov/lead/pubs/leadsafetybk.pdf. Accessed 7 September 2010.
HUD. 2004a. HUD Office of Healthy Homes and Lead Hazard Control, “Vacuum Dust Sample Collection Protocol for Allergens,” April 30, 2004. Access: http://www.hud.gov/offices/lead/techstudies/Allergen_Dust_Sample_Protocol.doc
HUD. 2004b. HUD Office of Healthy Homes and Lead Hazard Control, “Background and Justification for a Vacuum Sampling Protocol for Allergens in Household Dust,” April 30, 2004.
HUD 2004c. Evaluation of the HUD Lead-Based Paint Hazard Control Grant Program: Final Report. Washington, DC: U.S. Department of Housing and Urban Development. Available: http://nchh.org/LinkClick.aspx?fileticket=1jFfxfohcig%3d&tabid=273 (Accessed October 2011).
HUD Office of Healthy Homes and Lead Hazard Control. Vacuum Dust Sample Collection Protocol for Allergens. Prepared by QuanTech for HUD OHHLHC. May 2008.
HUD 2009. Technical Bulletin 2009-1: Updated Information on standard Used for the Analysis of Allergen Samples. Issued March 17, 2009. Office of Healthy Homes and Lead Hazard Control. Washington, DC
HUD 2012a. “Healthy Homes Issues: Asthma.” (in development)
HUD 2012b. “Healthy Homes Issues: Carbon Monoxide.” (in development)
HUD 2012c. “Healthy Homes Issues: Green Building.” (in development)
HUD 2012d. “Healthy Homes Issues: Injury.” (in development)
HUD 2012e. “Healthy Homes Issues: Integrated Pest Management.” (in development)
HUD 2012f. “Healthy Homes Issues: Mold.” (in development)
HUD 2011. Healthy Homes Program Guidance Manual. Access: http://portal.hud.gov/hudportal/HUD?mode=disppage&id=HHGUIDANCEMANUAL
Hun DE, Corsi, RL, Morandi MT, Siegel JA. Formaldehyde in residences: long-term indoor concentrations and influencing factors. Indoor Air 2010;20:196–203.
Indoor Biotechnologies 2009. Template for allergen analysis report.
Ingram, J.M., Sporik, R., Rose, G., Honsinger, R., Chapman, M.D., and Platts-Mills T.A.E. 1995. Quantitative assessment of exposure to dog (Can f 1) and cat (Fel d 1) allergens: relationship to sensitization and asthma among children living in Los Alamos, New Mexico. Journal of Allergy and Clinical Immunology. 96:449–456.
IOM. 2004. Damp Indoor Spaces and Health. Institute of Medicine of the National Academies, Board on Health Promotion and Disease, Committee on Damp Indoor Spaces and Health. The National Academies Press, Washington, DC.
page 64 Residential Assessment
Institute of Medicine. Secondhand Smoke Exposure and Cardiovascular Effects: Making Sense of the Evidence. Washington, DC: National Academies Press; 2009.
ISU Extension. 1996. Carbon Monoxide Poisoning: Downdrafting (Backdrafting). Iowa State University Extension Publication # AEN-165. Author: Dr. T. Greiner, Dept. of Agricultural and Biosystems Engineering. Access: http://www.abe.iastate.edu/human_house/aen165.asp
Jacob, B., Ritz, B., Gehring, U., Koch, A., Bischof, W., Wichmann, H.E., and Heinrich, J. for the INGA-Study Group. 2002. Indoor exposure to molds and allergic sensitization. Environmental Health Perspectives. 110:647–653.
Jacobs DE, Clickner RP, Zhou JY, Viet, S.M., Marker, D.A., Rogers, J.W., Zeldin, D.C., Broene, P., and W. Friedman. 2002. The prevalence of lead-based paint hazards in US housing. Environ Health Perspect. 2002; 110(10):A599–A606.
Jacobs DE, Nevin R. 2006. Validation of a twenty-year forecast of U.S. childhood lead poisoning: updated prospects for 2010. Environ Res 102(3): 352–364.
Jacobs DE, Wilson J, Dixon SL, Smith J, Evens A. The Relationship of Housing and Population Health: A 30-Year Retrospective Analysis. Environmental Health Perspectives 117(4):597–604, 2009.
Johansson A, Hermansson G, Ludvigsson J. How should parents protect their children from environmental tobacco-smoke exposure in the home? Pediatrics. 2004;113(4). Available at: www.pediatrics.org/cgi/content/full/113/4/e291
Jones, A. P. 1998. Asthma and domestic air quality. Social Science Medicine. 47:755–64.
Jones III N, Jones SL, and Miller NA. The Medicare Health Outcomes Survey program: Overview, context, and near-term prospects. Health and Quality of Life Outcomes 2004; 2:33; p 1–10.
Karlsson A.S. et al., Comparison of four allergen-sampling methods in conventional and allergy prevention classrooms. Clin Exp Allergy 2002 Dec; 32 (12):1776–81
Katcher, M.L. Unpublished. HUD Healthy Homes Initiative Report: Unintentional Injury (including fire) Prevention Section.
Keall M, Baker MG, Howden-Chapman P, Cunningham M, Ormandy D. Assessing housing quality and its impact on health, safety and sustainability. J Epidemiol. Community Health 2010; doi:10.1136/jech.2009.100.701:1–7.
King EM, Filep S, Smith B, Thorne P, van Ree R, Arbes S, Calatroni A, Mitchell H, and Chapman MD. A multi-center ring trial of allergen exposure assessment using Fluorescent Multiplex array technology. Poster Presentation, European Academy of Allergy and Clinical Immunology, Warsaw, Poland, June 6–10, 2009.
Klitzman S, Caravanos J, Deitcher D, Rothenberg L, Belanoff C, Kramer R, Cohen L. 2005a. Prevalence and predictors of residential health hazards: a pilot study. Journal of Occupational and Environmental Hygiene. 2005 Jun; 2(6):293–301.
Klitzman S, Caravanos J, Belanoff C, Rothenberg L. 2005b. A multihazard, multistrategy approach to home remediation: Results of a pilot study. Environmental Research. 2005 Sep 8; 99:294–306.
Kraev TA, Adamkiewicz G, Hammond SK, and Spengler JD. Indoor concentrations of nicotine in low-income, multi-unit housing: associations with smoking behaviors and housing characteristics. Tobacco Control 2009; 18:438–444.
Krieger, J. and D.L. Higgins. 2002. Housing and Health: Time Again for Public Health Action. American Journal of Public Health. 92:758–768.
Krieger J, Jacobs DE, Ashley PJ, Baeder A, Chew GL, Dearborn D, Hynes HP, Miller JD, Morley R, Rabito F, and Zeldin DC. Housing Interventions and Control of Asthma-related indoor biologic agents: A review of the evidence. J Public Health Management Practice 2010; 16(5) E-Supp:S11–S20
Krieger, R.I., Bernard, C.E., Dinoff, T.M., Fell, L., Osimitz, T.G., Ross, J.H., and T. Thongsinthusak. 2000. Biomonitoring and Whole Body Cotton Dosimetry to Estimate Potential Human Dermal Exposure to Semivolatile Chemicals. Journal of Exposure Analysis and Environmental Epidemiology. 10:50–57.
page 65Residential Assessment
Kuholski K, Tohn E, and Morley R. Healthy energy-efficient housing: Using a one-touch approach to maximize public health, energy, and housing programs and policies. J Public Health Management Practice, 2010;16 (5) E-Supp: S68–74.
Kwor, R. 2000. Carbon Monoxide Detectors. In: Carbon Monoxide Toxicity (D.G. Penney, ed.). CRC Press, Boca Raton, FL.
Landrigan, P.J., Kimmel, C.A., Correa, A., and B. Eskenazi. 2004. Children’s Health and the Environment: Public Health Issues and Challenges for Risk Assessment. Environmental Health Perspectives. 112(2):257–265.
Lanphear BP, Hornung R, Khoury J, et al. Low-level environmental lead exposure and children’s intellectual function: an international pooled analysis. Environ Health Perspect. 2005;113(7):894-899. Commission on Life Sciences. Measuring Lead Exposure in Infants, Children, and Other Sensitive Populations. Washington, DC: National Academies Press; 1993.
Lanphear, BP, Weitzman M, Eberly S. 1996a. Racial differences in urban children’s environmental exposures to lead. Am J Public Health 86:1460–1463.
Lanphear BP, Weitzman M, Winter NL, Eberly S, Yakir B, Tanner M, et al. 1996b. Lead-contaminated house dust and urban children’s blood lead levels. Am J Public Health 86(1); 1416–1421.
Lawton, M.D., Dales, R.E., and White, J. 1998. The influence of house characteristics in a Canadian community on microbiological contamination. Indoor Air. 8:2–11.
Leaderer, Brian P. 2004. Prediction of Residential Pet and Cockroach Allergen Levels Using Questionnaire Information. Environmental Health Perspectives, 112:834–839.
Levin R, Brown MJ, Kashtock ME, Jacobs DE, Whelan EA, Rodman J, et al. 2008. U.S. children’s lead exposures, 2008: implications for prevention. Environ Health Perspect 116: 1285–1293.
Li, D. and Kendrick, B. 1995. Indoor aeromycota in relation to residential characteristics and allergic symptoms. Mycopathologia. 131:149–157.
Li Ning, Jack R. Harkema, Ryan P. Lewandowski, Meiying Wang, Lori A. Bramble, Glenn R. Gookin, Zhi Ning, Michael T. Kleinman, Constantinos Sioutas and Andree E. Nei. 2010. Ambient ultrafine particles provide a strong adjuvant effect in the secondary immune response: Implication for traffic-related asthma flares. Am. J. Physiol. Lung Cell Mol. Physiol. 299:L374–83.
Lippmann M. 2009 An Overview of Air Sampling Methodologies: Instrumentation and Analytical Techniques for Evaluation of Atmospheric Contaminants. ACGIH, Cincinnati, OH
Logue JM, McKone TE, Sherman MH, Singer BC. Hazard assessment of chemical air contaminants measured in residences. Indoor Air 2010; in press. Published online 20 July 2010. MacIntosh, D.L., Needham, L.L., Hammerstrom, K.A., and P.B. Ryan. 1999. A longitudinal investigation of selected pesticide metabolites in urine. Journal of Exposure Analysis and Environmental Epidemiology. 9:494–501.
Lubick Naomi. 2009. Environmental News: Breathing less easily with ultrafine particles. Environmental Science & Technology. July 4615–7.
Lwebuga-Mukasa Jamson, S., Tonny J. Oyana and Paulette Wydro. 2004. Risk factors for asthma prevalence and chronic respiratory illness among residents of different neighborhoods in Buffalo, New York. J. Epidemiol Community Health; 58:951–7.
Lwebuga-Mukasa JS, Oyana TJ and Johnson C. 2005. Local ecological factors, ultrafine particulate concentrations, and asthma prevalence rates in Buffalo, New York, neighborhoods. J. Asthma. Jun;42(5):337–48
Lwebuga-Mukasa Jamison. 2009. Is asthma an ultrafine particle disease?—A hypothesis. 2009. At http://thecaee.wordpress.com/
Mahooti-Brooks, N., Storey, E., Yang, C., Simcox, N.J., Turner, W., and Hodgson, M. 2004. Characterization of mold and moisture indicators in the home. Journal of Occupational and Environmental Hygiene. 1(12):826–39.
page 66 Residential Assessment
Mansour M., et al. A side-by-side comparison of sampling methods for settled, indoor allergens, Env. Research Section A 87, 37–46 (2001)
Martyny, J., Martinez, K.F. and P.R. Morey. 1999. Source Sampling. In: Bioaerosols: Assessment and Control. (J. Macher, ed.). American Conference of Governmental and Industrial Hygienists, Cincinnati, Ohio.
McDonald B and Ouyang M, Air Cleaning-Particles. Chapter 9 in Indoor Air Quality Handbook. J Spengler, JM Smaet, JF McCarthy. McGraw-Hill, NY, 2001.
Meklin, T., Haugland, R.A., Reponen, T., Varma, M., Lummus, Z., Bernstein, D., Wymer, L.J., and Vesper, S.J. 2004. Quantitative PCR analysis of house dust can reveal abnormal mold conditions. Journal of Environmental Monitoring. 6(7):615–20.
Meyer PA. Healthier Homes for a Healthier Nation. J Public Health Management Practice, 2010; 16(5) E-Supp: S1–S2.
Morgan WJ, Crain EF, Gruchalla RS, O’Connor GT, Kattan M, Evans R 3rd, et al, Inner-City Asthma Study Group. Results of a home-based environmental intervention among urban children with asthma. N Engl J Med 2004; 351: 1068–80.
Muhlfeld C, Rothen-Rutishauser B, Blank F, Vanhecke D, Ochs M, and Gehr P. Interactions of nanoparticles with pulmonary structures and cellular responses. Am J Physiol Lung Cell Mol Physiol, 2008; 294:L817–L829.
Muilenberg ML. 2009 Bioaerosol Sampling and analytical Techniques. ACGIH, Cincinnati, OH
Nagda NL and Rector HE. Instruments and methods for Measuring Indoor Air Quality. Chapter 51 in Indoor Air Quality Handbook. J Spengler, JM Smaet, JF McCarthy. McGraw-Hill, NY, 2001.
Assessment of Bacterial and Fungal Aerosol in Different Residential Settings. Zaheer Ahmad Nasir and Ian Colbeck. Water, Air, & Soil Pollution, 2010, Volume 211, Numbers 1–4, Pages 367–377. Mold section .
NAS. 2000. Clearing the Air: Asthma and Indoor Air Exposures. National Academy of Sciences Institute of Medicine, Division of Health Promotion and Disease Prevention. National Academy Press, Washington, D.C. 438 pp.
NCHH (2008). Boston One Touch: Action Steps for Healthier and Greener Homes for Boston Families. NCHH, Columbia, MD.
NCHH 2010. Seven Principles for a Healthy Home. http://www.nchh.org/What-We-Do/Healthy-Homes-Principles.aspx
NCHH 2012. Pediatric Environmental Home Assessment. http://www.healthyhomestraining.org/nurse/peha_survey.pdf
National Institute for Occupational Safety and Health (NIOSH) 1994a. NIOSH Method 3500: Formaldehyde. http://www.cdc.gov/niosh/docs/2003-154/pdfs/3500.pdf
NIOSH 1994b. NIOSH Method 6014: Nitric Oxide and Nitrogen Dioxide. http://www.cdc.gov/niosh/docs/2003-154/pdfs/6014-1.pdf.
NIOSH 2003. NIOSH Method 1501: Hydrocarbons, Aromatic. http://www.cdc.gov/niosh/docs/2003-154/pdfs/1501.pdf.
NIOSH 2010. NIOSH Indoor Dampness and Mold Assessment Tool. In preparation.
National Nanotechnology Initiative (NNI) 2011. Nanotechnology and You: Benefits and Applications. http://www.nano.gov/you/nanotechnology-benefits. Accessed November 3, 2011.
New York City Department of Health 2008. Guidelines on Assessment and Remediation of Fungi in Indoor Environments. Access: http://www.ci.nyc.ny.us/html/doh/html/epi/moldrpt1.shtml
Nieuwenhuijsen, M.J., Grey, C.N.B., Golding, J., and the ALSPAC Group. 2005. Exposure misclassification of household pesticides and risk perception and behaviour. Annals of Occupational Hygiene. (Accepted June 20, 2005).
page 67Residential Assessment
Nishioka, M.G., Burkholder, H.M., Brinkman, M.C., Gordon, S.M., and Lewis, R.G. 1996. Measuring transport of lawn-applied herbicide acids from turf to home: correlation of dislodgeable residues with carpet dust and carpet surface residues. Environmental Science and Technology. 30:3313–3320.
Nishioka, M.G., Burkholder, H.M., Brinkman, M.C., and R.G. Lewis. 1999. Distribution of 2,4-D in floor dust throughout homes following homeowner and commercial lawn applications: Quantitative effects of children, pets, and shoes. Environmental Science and Technology. 33:1359–1365.
Office of the Deputy Prime Minister. 2000. Development of the Housing Health and Safety Rating System. United Kingdom. www.odpm.gov.uk/stellent/groups/odpm_housing/documents/page/odpm_house_603899.hcsp
Office of the Deputy Prime Minister, London. Housing Health and Safety Rating System: Operating Guidance. Housing Act 2004 Guidance about inspections and assessment of hazards given under Section 9. http://www.communities.gov.uk/documents/housing/pdf/142631.pdf. Accessed September 20, 2010.
O’Meara, T. and E. Tovey. 2000. Monitoring personal allergen exposure. Clinical Reviews in Allergy & Immunology. 18(3):341–395.
Park J-H; Schleiff PL; Attfield MD; Cox-Ganser JM; Kreiss K. Building-related respiratory symptoms can be predicted with semi-quantitative indices of exposure to dampness and mold. Indoor Air 2004; 14(6):425–433.
Pate, A.D., Hamilton, R.G., Ashley, P.J., Zeldin, D.C., and Halsey, J.F. 2005. Proficiency testing of allergen measurements in residential dust. Journal of Allergy and Clinical Immunology. 116: 844–50.
Peters Annette. 2005. Effects of ultrafine carbon particles in healthy subjects and subjects with asthma. At http://www.klinikundforschung.de/sup/heft9/effects_of_ultrafine_carbon_part.htm
Phelan, KJ, Khoury J, Xu Y, Lanphear B. Validation of a HOME Injury Survey. Injury Prevention 2009; 15(5):300–306.
Phipatanakul, W., Eggleston, P.A., Wright, E.C., Wood, R.A., and National Cooperative Inner-City Asthma Study. 2000b. Mouse allergen. II. The relationship of mouse allergen exposure to mouse sensitization and asthma morbidity in inner-city children with asthma. Journal of Allergy and Clinical Immunology. 106(6):1075–1080.
Pinchin Environmental. 2002. Pinchin Environmental Newsletter—10. Mississauga, Ontario: Pinchin Environmental Ltd. Available online at: http://www.pinchin.com/newsletters/microlab10.htm.
Platts-Mills, T.A., Sporik, R.B., Wheatley, L.M., and Haymann, P.W. 1995. Is there a dose-response relationship between exposure to indoor allergens and symptoms of asthma? Journal of Allergy and Clinical Immunology. 96(4):435–440.
Platts-Mills, T.A. E., Vervloet, D., Thomas, W.R., Aalberse, R.C., and M.D. Chapman. 1997. Indoor Allergens and Asthma: Report of the Third International Workshop. Journal of Allergy and Clinical Immunology. 100(6, Part 1):S1–S23.
Portnoy, J.M., Kwak, K., Dowling, P., VanOsdol, T., Barnes, C. 2005. Health effects of indoor fungi. Annals of Allergy, Asthma and Immunology, 94:313–320.
Poulos, L. et al. 1998. Detection of inhaled Der p 1 and Fel d 1. Journal of Allergy and Clinical Immunology. 101:S158.
Primomo, J. 2000. Perceived effectiveness of home environmental assessments. The 128th Annual Meeting of APHA.
Public Health Seattle-King County. 2009 Highline Community Healthy Homes Program Home Visit Baseline Questionnaire. April 2009.
Public Health Seattle-King County 2009. Highline Community Healthy Homes Program Home Environment Checklist. April 2009.
QualityMetric 2010. Generic health surveys. Available at http://www.qualitymetric.com/WhatWeDo/GenericHealthSurveys/tabid/184/Default.aspx. Accessed 11/17/2010
page 68 Residential Assessment
Rabin, R.C. A new cigarette hazard: “third-hand smoke.” New York Times, January 2, 2009. http://www.nytimes.com/2009/01/03/health/research/03smoke.html
Rao, C.Y., Burge, H.A., and Chang, J.C.S. 1996. Review of quantitative standards and guidelines for fungi in indoor air. Journal of Air Waste Management Association. 46(9):899–908.
Reed, K.J., Jimenez, M., Freeman, N.C.G., and P.J. Lioy. 1999. Quantification of Children’s Hand and Mouthing Activities through a Videotaping Methodology. Journal of Exposure Analysis and Environ Epidemiology. 9:513–520.
Ren, P., Jankun, T.M., and Leaderer, B.P. 1999. Comparisons of seasonal fungal prevalence in indoor and outdoor air and in house dusts of dwellings in one Northeast American county. Journal of Exposure Analysis and Environmental Epidemiology. 9(6):560–568.
Ren, P., Jankun, T.M., Belanger, K., Bracken, M.B., and Leaderer, B.P. 2001. The relation between fungal propagules in indoor air and home characteristics. Allergy. 56:419–424.
Visually observed mold and moldy odor versus quantitatively measured microbial exposure in homes Science of The Total Environment, Volume 408, Issue 22, 15 October 2010, Pages 5565–5574 Tiina Reponen, Umesh Singh, Chris Schaffer, Stephen Vesper, Elisabet Johansson, Atin Adhikari, Sergey A. Grinshpun, Reshmi Indugula, Patrick Ryan, Linda Levin, Grace LeMasters.
Rice D, Barone S Jr. Critical periods of vulnerability for the developing nervous system: evidence from humans and animal models. Environ Health Perspect. 2000; 108(suppl 3): 511–533.
Robertson, A.S., Rivara, F.P., Ebel, B.E., Lymp, J.F. and D.A. Christakis. 2005. Validation of parent self reported home safety practices. Injury Prevention. 2005; 11:209–212.
Ross, J., Fong, H.R., Thongsinthusak, T., et al. 1991. Measuring potential dermal transfer of surface pesticide residue generated from indoor fogger use: Using the CDFA Roller Method, interim report II. Chemosphere 22:975–984.
Samet JM and Wang SS. Environmental Tobacco Smoke. Chapter 30 in Indoor Air Quality Handbook. J Spengler, JM Smaet, JF McCarthy. McGraw-Hill, NY, 2001.
Sandel M, Baeder A, Bradman A, Hughes J, Mitchell C, Shaughnessy R, Takaro TK, Jacobs DE. Housing Interventions and Control of Health-Related Chemical Agents: A Review of the Evidence. J Public health management Practice 2010; 16(5) E-Supp:S24–S33.
Santer, L.J. and Stocking, C.B. 1991. Safety practices and living conditions of low-income urban families. Pediatrics. 88(6):1112–1118.
SCAQMD. 2009. Pilot Study of High Performance Air Filtration for Classrooms Applications. IQAir North America, Santa Fe Springs, CA.
Schieber, R.A., Gilchrist, J., and Sleet, D.A. 2000. Legislative and regulatory strategies to reduce childhood unintentional injuries. The Future of Children. 10(1):111–136.
Sexton, K., Adgate, J.L., Eberly, L.E., Clayton, C.A., Whitmore, R.W., Pellizzari, E.D., Lioy, P.J., Quackenboss, J.J. 2003. Predicting children’s short-term exposure to pesticides: Results of a questionnaire screening approach. Environmental Health Perspectives. 111(1):23–128.
Solomon, W.R. 1975. Assessing fungus prevalence in domestic interiors. Journal of Allergy and Clinical Immunology. 56(3):235–242.
Su, H.J., Wu, P.C., Chen, H.L., Lee, F.C., and Fin, L.L. 2001. Exposure assessment of indoor allergens, endotoxin, and airborne fungi for homes in southern Taiwan. Environmental Research. 85:135–144.
Sun K, Majdan M, Field DW, Field RW. 2006. Field comparison of commercially available short-term radon detectors. Health Phys. 91(3):221–226;
Takaro, T.K., Krieger, J.W., and Song, L. 2004. Effect of environmental interventions to reduce exposure to asthma triggers in homes of low-income children in Seattle. Journal of Exposure Analysis and Environmental Epidemiology. 14 Suppl 1:S133–43.
page 69Residential Assessment
Tsay, A., Williams, L., Chandler, J., and Chapman, M.D. 1999. Rapid test for mite allergen detection in the home. Journal of Allergy and Clinical Immunology. 103:S235.
UL. 2002. (Update). Underwriters Laboratories (UL) 2034 Standard for Single and Multiple Station Carbon Monoxide Alarms, Second Edition, October, 1996. ISBN 0-7629-274-9 [First Edition April 1992, Second Edition October 29, 1996, revised October 15, 1997 and June 28, 2002]. Underwriters Laboratory, Inc. Northbrook, IL.
TSI. 2012. Condensation Particle Counters. At http://www.tsi.com/CategoryView.aspx?id=21875&terms=condensation%20particle%20counters
University of Minnesota, Department of Environmental Health and Safety. 1996. Mycological Aspects of Indoor Air Quality: Fungal interpretation. Access online (8/2001): http://www.dehs.umn.edu/iaq/fungus/mycoglos.html
U.S. Centers for Disease Control and Prevention. Carbon Monoxide Exposures-United States, 2000–2009. Morbidity and Mortality Weekly Report (MMWR) 60(30);1014-1017. http://www.cdc.gov/mmwr/preview/mmwrhtml/mm6030a2.htm?s_cid=mm6030a2_w
U.S. Environmental Protection Agency. A Citizen’s Guide to Radon. Washington, DC: US Environmental Protection Agency, Office of Air and Radiation, Indoor Environments Division; 1992.
U.S. Environmental Protection Agency 1999. Compendium of Methods for the Determination of Toxic Organic Compounds in Ambient Air-Second Edition. EPA/625/R-96/010b. January 1999.
U.S. Environmental Protection Agency 2000. Air Quality Criteria for Carbon Monoxide. U.S. Environmental Protection Agency, National Center for Environmental Assessment. June, 2000. EPA 600/P-99/001F.
U.S. Environmental Protection Agency 2000. Testing Your Home for Lead In Paint, Dust, and Soil. EPA Office of Pollution Prevention and Toxics. EPA 747-K-00-001. http://www.epa.gov/lead/pubs/leadtest.pdf. Accessed September 7, 2010.
U.S. Environmental Protection Agency 2001a. Lead-Based Paint Hazards. 40 CFR Part 745 Subpart D. 66 Federal Register. 1237, Washington D.C., U.S. Environmental Protection Agency, January 5, 2001.
U.S. Environmental Protection Agency 2001b. Mold Remediation in Schools and Commercial Buildings. (EPA 402-K-01-001). Indoor Environments Division, Office of Air and Radiation (OAR), U.S. Environmental Protection Agency. March 2001.
U.S. Environmental Protection Agency. Assessment of Risks From Radon in Homes. Washington, DC: U.S. Environmental Protection Agency, Office of Air and Radiation, Indoor Environments Division; 2003.
U.S. Environmental Protection Agency 2004a. Pesticide Industry Sales and Usage: 2000 and 2001 Market Estimates. Washington, DC: U.S. Environmental Protection Agency, Office of Prevention; 2004. http://www.epa.gov/oppbead1/pestsales/index.htm.
U.S. Environmental Protection Agency 2004b. Asthma Home Environment Checklist. EPA 402-F-03-030. February 2004. http://www.epa.gov/asthma/pdfs/home_environment_checklist.pdf
U.S. Environmental Protection Agency 2004c. A citizen’s guide to Radon. EPA 402-K02-006, revised May 2004.
U.S. Environmental Protection Agency 2004d. 40 CFR 745.227. Lead: Work practice standards for conducting lead-based paint activities: target housing and child-occupied facilities. Final Rule. 40 CFR Part 745.227. 69 Federal Register 18496, April 8, 2004.
U.S. Environmental Protection Agency 2005. Citizen’s Guide to Pest Control and Pesticide Safety. USEPA Office of Prevention, Pesticides, and Toxic Substances. EPA 735-K-34-002, March 2005.
U.S. Environmental Protection Agency/U.S. Department of Housing and Urban Development. 2008. Renovate Right: Important Lead Hazard Information for Families, Child Care Providers, and Schools. http://www.epa.gov/lead/pubs/rrpamph.pdf.
page 70 Residential Assessment
U.S. Environmental Protection Agency. Children’s health protection: fast facts on children’s environmental health. http://yosemite.epa.gov/ochp/ochpweb.nsf/content/fastfacts.htm. Accessed February 19, 2010.
U.S. Environmental Protection Agency 2010. EPA Technology for Mold Identification and Enumeration. http://www.epa.gov/microbes/moldtech.htm Accessed December 1, 2010.
U.S. Environmental Protection Agency 2010. An introduction to indoor air quality: Formaldehyde. http://www.epa.gov/iaq/formalde.html Last updated April 23, 2010. Accessed December 2, 2010.
U.S. Environmental Protection Agency 2010. Healthy Indoor Environment Protocols for Home Energy Upgrades. http://www.epa.gov/iaq/pdfs/epa_retrofit_protocols_draft_110910.pdf.
U.S. Environmental Protection Agency 2010z. EPA map of radon zones. http://www.epa.gov/radon/zonemap.html.
U.S. Environmental Protection Agency 2010y. A Citizen’s Guide to Radon. http://www.epa.gov/radon/pubs/citguide.html. Accessed November 2011.
U.S. Fire Administration 1997. Home Fire Protection: Residential Fire Sprinkler Systems. Federal Emergency Management Agency, U.S. Fire Administration. FA 43, Revised April 1997 (Supersedes FA 43 dated July, 1986).
U.S. Fire Administration, FEMA. Residential Sprinkler Systems. http://www.usfa.dhs.gov/citizens/home_fire_prev/sprinklers/. Accessed 11/17/20410
University of Michigan. Asthma Core Caregiver Survey. http://asthma.umich.edu/media/eval_autogen/core_caregiver.pdf. Accessed 11/17/2010
Vailes, L., Sridhara, S., Cromwell, O., Weber, B., Breitenbach, M., and Chapman, M. 2001. Quantitation of the major fungal allergens, Alt a 1 and Asp f 1, in commercial allergenic products. Journal of Allergy and Clinical Immunology. 104(4):641.
Van Ree, R. Indoor allergens: Relevance of major allergen measurements and standardization. J Allergy Clin Immunol 2007; 119(2):270–277
Vesper, S.J., Varma, M., Wymer, L.J., Dearborn, D.G., Sobolewski, J., and Haugland, R.A. 2004. Quantitative polymerase chain reaction analysis of fungi in dust from homes of infants who developed idiopathic pulmonary hemorrhaging. Journal of Occupational and Environmental Medicine. 46(6):596–601.
Vesper, S.J., McKinstry, C., Yang, C., Haugland, R., Kercsmar, C.M., Yike, I., Schluchter, M.D., Kirchner, H.L., Sobolewski, J., Allan, T.M., and Dearborn, D.G. 2005. Are specific molds associated with asthma in water-damaged homes? Submitted to American Journal of Epidemiology.
Vesper, S., Dearborn, D.G., Yike, I., Allan, T., Sobolewski, J., Hinkley, S.F., Jarvis, B.B., and Haugland, R.A. 2000. Evaluation of Stachybotrys chartarum in the house of an infant with pulmonary hemorrhage: quantitative assessment before, during, and after remediation. Journal of Urban Health: Bulletin of the New York Academy of Medicine. 77(1):68–85.
Vojta PJ, Friedman W, Marker DA, Clickner R, Rogers JW, Viet SM, et al. First National Survey of Lead and Allergens in Housing: survey design and methods for the allergen and endotoxin components. Environ Health Perspect 2002; 110: 527–32.
Wallace Lance A. Assessing Human Exposure to Volatile Organic Compounds. Chapter 33 in Indoor Air Quality Handbook. McGraw-Hill, NY. 2001. Edited by J Spengler, J Samet, and J McCarthy.
Wallace L and Ott W. 2011. Personal exposure to ultrafine particles. J Exp Sci and Environ Epidemiol 21(1);20–30.
Wang, E., Rhoads, G., Wainman, T., and P.J. Lioy. 1995. Effects of Environmental and Carpet Variables on Vacuum Sampler Collection Efficiency. Applied Occupational and Environmental Hygiene. 10(2):111–119.
page 71Residential Assessment
WHO. 2006. World Health Organization, European Centre for Environment and Health, Bonn (Germany) Office, Report of the WHO Technical Meeting on Quantifying Disease from Inadequate Housing (November 28–30, 2005), April 2006. Available: http://www.euro.who.int/Document/HOH/
EBD_Bonn_Report.pdf [accessed 7 September 2010].
WHO 2009. WHO Handbook on Indoor Radon: A Public Health Perspective. WHO, Geneva, Switzerland.
Whyatt, R.M., Camann, D.E., Kinney, P.L., Reyes, A., Ramirez, J., Dietrich, J., Diaz, D., Holmes, D., Perera, F.P. 2002. Residential pesticide use during pregnancy among a cohort of urban minority women. Environmental Health Perspectives. 110(5):507–514.
Wilson, A.L., Colome, S.D., and Y. Tian. 1993. California residential indoor air quality study. Volume I: methodology and descriptive statistics. Appendices. Chicago, Il. Gas Research Institute. GRI-93/-224.2.
Wilson, J., Pivetz, T., Ashley, P., Jacobs, D., Strauss, W., Menkedick, J., et al. 2006. Evaluation of HUD-funded lead hazard control treatments at 6 years post-intervention. Environ Res 102:237–248.
Wilson J, Dixon S, Galke W, McLaine P. 2007. An investigation of dust lead sampling locations and children’s blood lead levels J Expo Sci Environ Epidemiol 17:2–12.
Winickoff JP, Friebely J, Tanski SE, Sherrod C, Matt GE, Hovell MF, McMillen RC. Beliefs about the health effects of “thirdhand” smoke and home smoking bans. Pediatrics 2009 123(1): e75–e79. January 2009.
Win-Shwe Tin-Tin and Hidekazu Fujimaki. 2011. Nanoparticles and Neurotoxicity. Int. J. Mol. Sci. (12):6267–80
Yarris Lynn. 2010. Berkeley study shows ozone and nicotine a bad combination for asthma. At http://newscenter.lbl.gov/news-releases/2010/08/16/ozone-and-nicotine-a-bad-combination-for-asthma/
Yolton K., Dietrich K., Auinger P., Lanphear B.P., Hornung R. Exposure to environmental tobacco smoke and cognitive abilities among US children and adolescents. Environ Health Perspect. 2005;113(1):98–103.
Yoon, S., Macdonald, S., Parrish, G. 1998. Deaths from unintentional carbon monoxide poisoning and potential for prevention with carbon monoxide detectors. JAMA. 279(9):685–687.
Zartarian, V.G., Ozkaynak, H., Burke, J.M., Zufall, M.J., Rigas, M.L., and E.J. Furtaw. 2000. A Modeling Framework for Estimating Children’s Residential Exposure and Dose to Chlorpyrifos via Dermal Residue Contact and Non-Dietary Ingestion. Environmental Health Perspectives. 108:505–514.

page 72 Residential Assessment
Notes