healthcare staffing |education & training...
TRANSCRIPT

HEALTHCARE STAFFING | EDUCATION & TRAINING | SEARCH
May 2007
This presentation contains forward-looking statements. Statements that are predictive in nature, that depend upon or refer to future events or conditions or that include words such as “expects”, “anticipates”, “intends”, “plans”, “believes”, “estimates”, and similar expressions are forward-looking statements. These statements involve known and unknown risks, uncertainties and other factors that may cause our actual results and performance to be materially different from any future results or performance expressed or implied by these forward-looking statements. These factors include the following: our ability to attract and retain qualified nurses and other healthcare personnel; costs and availability of short-term leases for our travel nurses; demand for the healthcare services we provide, both nationally and in the regions in which we operate; the functioning of our information systems; the effect of existing or future government regulation and federal and state legislative and enforcement initiatives on our business; our clients' ability to pay us for our services; our ability to successfully implement our acquisition and development strategies; the effect of liabilities and other claims asserted against us; the effect of competition in the markets we serve, and other factors set forth under the caption “Risk Factors” in the Company's 10-K for the year ended December 31, 2006, as well as in its 10-Q for the period ended March 31, 2007. In addition, any guidance with respect to future financial performance provided by the Company during its quarterly earnings conference calls expressly states that such management expectations are forward-looking statements and do not include the potential impact of any future mergers, acquisitions and other business combinations, the repurchase of its Common Stock, or pending legal matters. Although we believe that these statements are based upon reasonable assumptions, we cannot guarantee future results. Given these uncertainties, the forward-looking statements discussed on this presentation might not occur. Specifically, while it is Cross Country Healthcare’s intention to update its financial guidance quarterly, it should not be assumed that our silence over time means that actual events are occurring as expressed or implied in such forward-looking statements.
Build the nation’s leading provider of Staffing and Other Human Capital Management services to theHealthcare Industry.
Our Mission
� Demographic Story: Long-term demand for healthcare
services at a time of an unprecedented nursing shortage
� Trend toward outsourced labor in healthcare
� Strong revenue visibility
� Strong cash flow and low CapEx
� No direct third party or government reimbursement risk
� Proven record of financial performance
� Strong, experienced management team
Investment Highlights
Cross Country Overview
� Leading national healthcare staffing provider
– 20 years of history in the industry
– National client base of approximately 4,000 hospitals, pharmaceutical companies and other healthcare providers
– A vast majority of “Honor Roll” hospitals in annual ranking by US News & World Report
– Certified JCAHO healthcare staffing company
� Approximately 93% of revenue from healthcare staffing and 7% from non-staffing businesses
– 70% of total revenue from travel nurse staffing
� Strong and Diverse Client Relationships
– No client represents more than 4% of revenue
Industry Growth Drivers
� Fundamental growth drivers
– Continued scarcity and aging of nursing professionals
– Aging population demanding more hospital services
– State and Federal legislation re: nurse staffing levels and mandatory overtime
– Hospitals desire for outsourcing to provide variable cost structure
– Nursing professionals desire for job flexibility and better working conditions
� Current market environment
– Improved labor dynamics
– Continued pricing power
– Strengthening supply environment
– Sluggish hospital admission trends
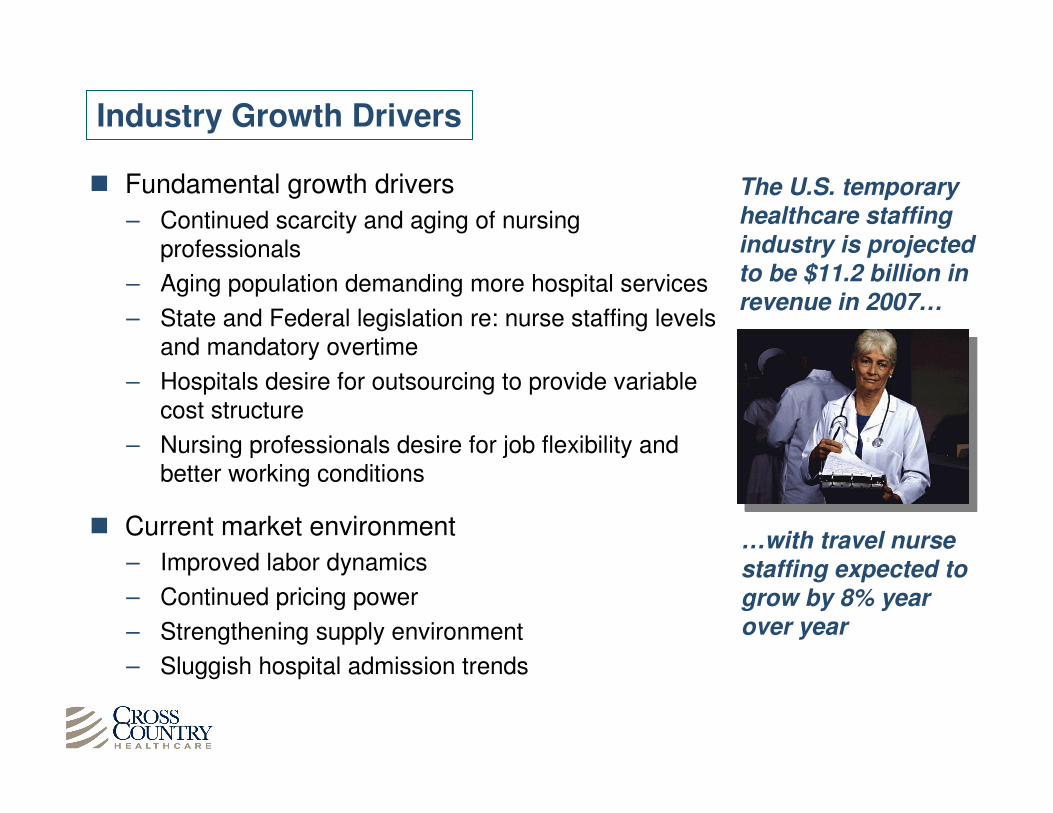
The U.S. temporary healthcare staffing industry is projected to be $11.2 billion in revenue in 2007…
…with travel nurse staffing expected to grow by 8% year over year
Sources: Staffing Industry Analysts, Inc. and HCFA.
Demand for Healthcare Staffing
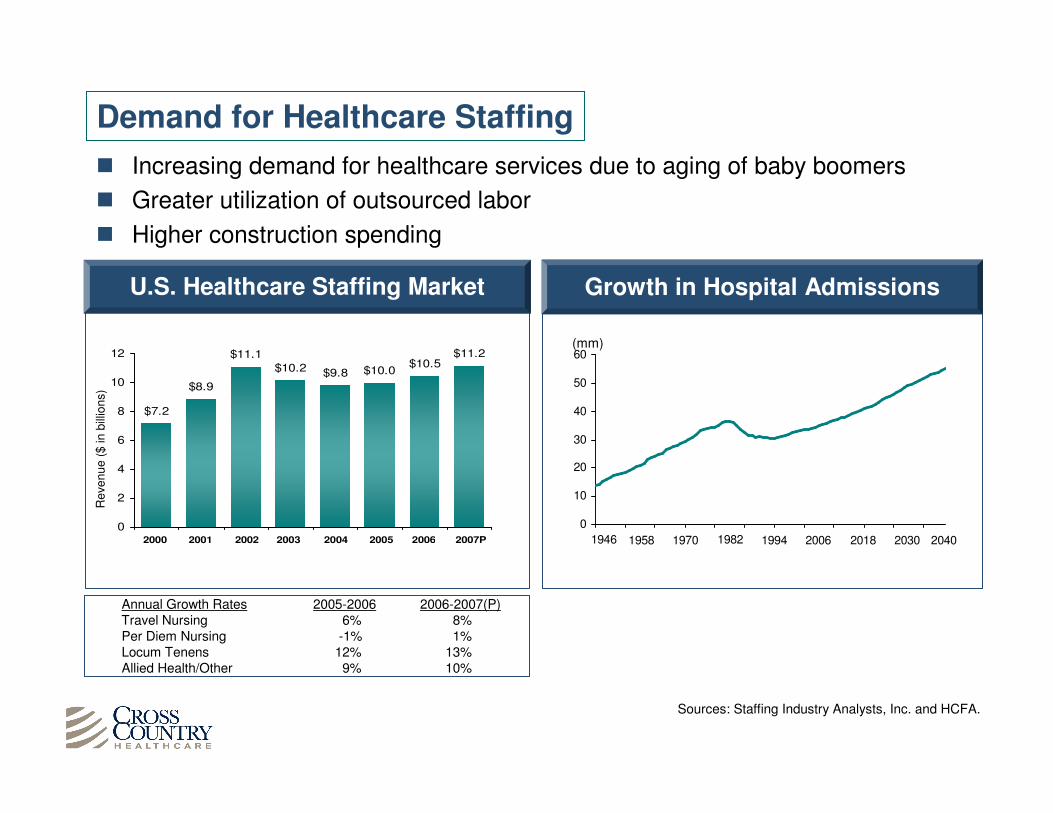
� Increasing demand for healthcare services due to aging of baby boomers
� Greater utilization of outsourced labor
� Higher construction spending
Growth in Hospital Admissions
(mm)
0
10
20
30
40
50
60
1946 1958 1970 1982 1994 2006 2018 2030 2040
$10.5$11.2
$10.0$9.8$10.2
$11.1
$8.9
$7.2
0
2
4
6
8
10
12
2000 2001 2002 2003 2004 2005 2006 2007P
U.S. Healthcare Staffing Market
Re
ven
ue
($
in b
illio
ns)
Annual Growth Rates 2005-2006 2006-2007(P)Travel Nursing 6% 8%Per Diem Nursing -1% 1%Locum Tenens 12% 13%Allied Health/Other 9% 10%
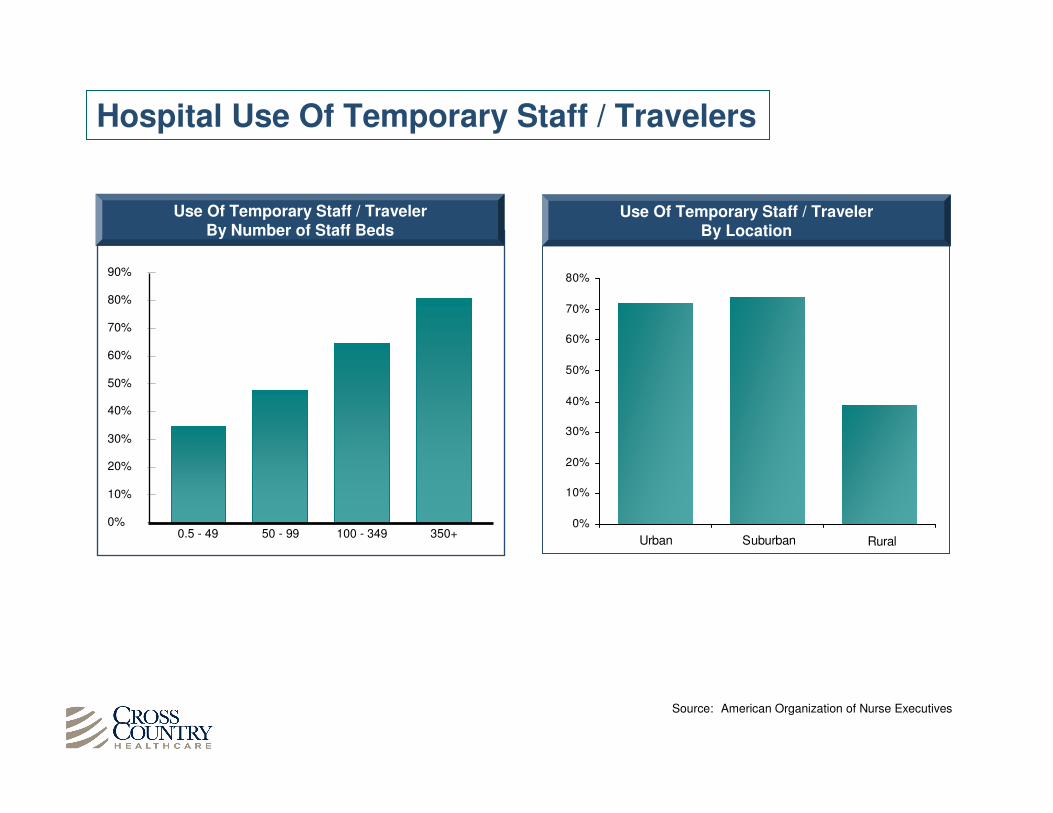
Source: American Organization of Nurse Executives
Hospital Use Of Temporary Staff / Travelers
0%
10%
20%
30%
40%
50%
60%
70%
80%
90%
0.5 - 49 50 - 99 100 - 349 350+
Use Of Temporary Staff / Traveler By Number of Staff Beds
0%
10%
20%
30%
40%
50%
60%
70%
80%
Urban Suburban Rural
Use Of Temporary Staff / Traveler By Location
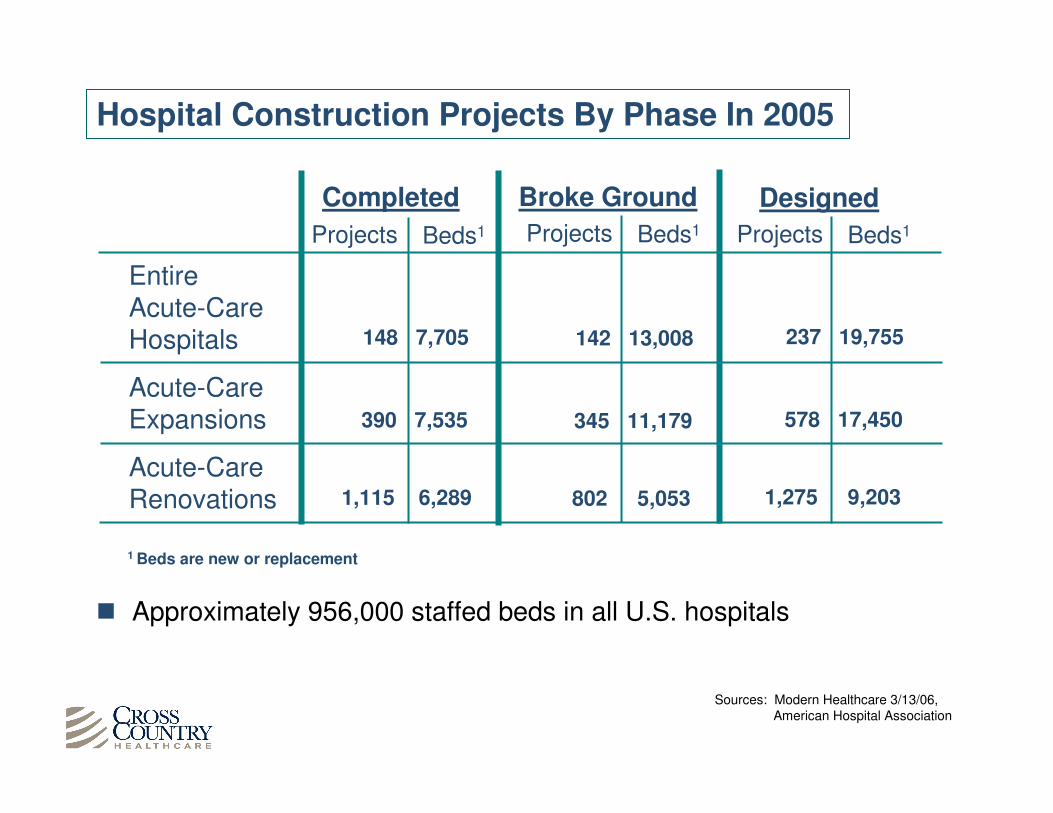
Hospital Construction Projects By Phase In 2005
Sources: Modern Healthcare 3/13/06,American Hospital Association
Entire Acute-Care Hospitals
Acute-Care Expansions
Acute-Care Renovations
Completed
Projects Beds1
148 7,705
390 7,535
1,115 6,289
Broke Ground
Projects Beds1
Designed
Projects Beds1
1 Beds are new or replacement
142 13,008
345 11,179
802 5,053
237 19,755
578 17,450
1,275 9,203
� Approximately 956,000 staffed beds in all U.S. hospitals
63,000
74,000
114,000
124,000
136,000
202,000
287,000
325,000
350,000
0 100,000 200,000 300,000 400,000 500,000 600,000 700,000
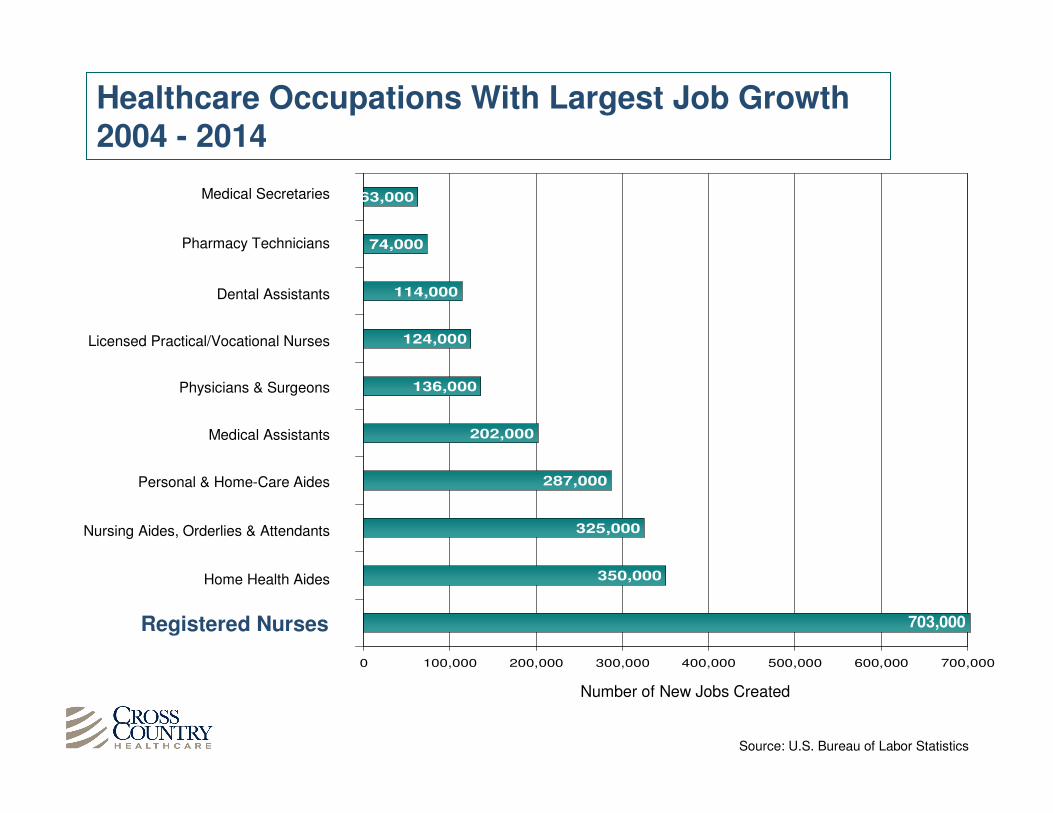
Source: U.S. Bureau of Labor Statistics
Healthcare Occupations With Largest Job Growth 2004 - 2014
Number of New Jobs Created
703,000Registered Nurses
Home Health Aides
Nursing Aides, Orderlies & Attendants
Personal & Home-Care Aides
Medical Assistants
Physicians & Surgeons
Licensed Practical/Vocational Nurses
Pharmacy Technicians
Medical Secretaries
Dental Assistants
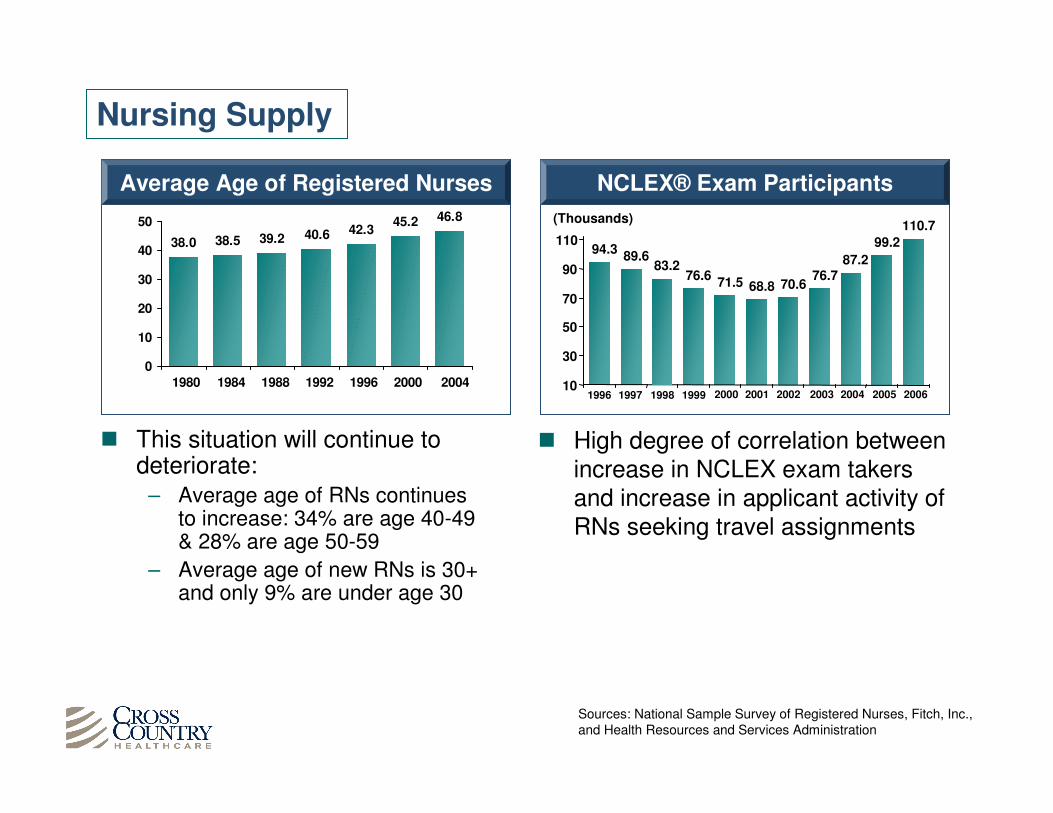
� High degree of correlation between increase in NCLEX exam takers and increase in applicant activity of RNs seeking travel assignments
Nursing Supply
� This situation will continue to deteriorate:
– Average age of RNs continues to increase: 34% are age 40-49 & 28% are age 50-59
– Average age of new RNs is 30+ and only 9% are under age 30
Sources: National Sample Survey of Registered Nurses, Fitch, Inc., and Health Resources and Services Administration
46.845.242.340.639.238.538.0
0
10
20
30
40
50
1980 1984 1988 1992 1996 2000
0
2004
Average Age of Registered Nurses
20061996 1997 1998 1999 2000 2001 2002 2003 2004 2005
NCLEX® Exam Participants
(Thousands)
70.676.7
87.2
99.2
110.7
94.389.6
83.276.6
71.5 68.8
10
30
50
70
90
110
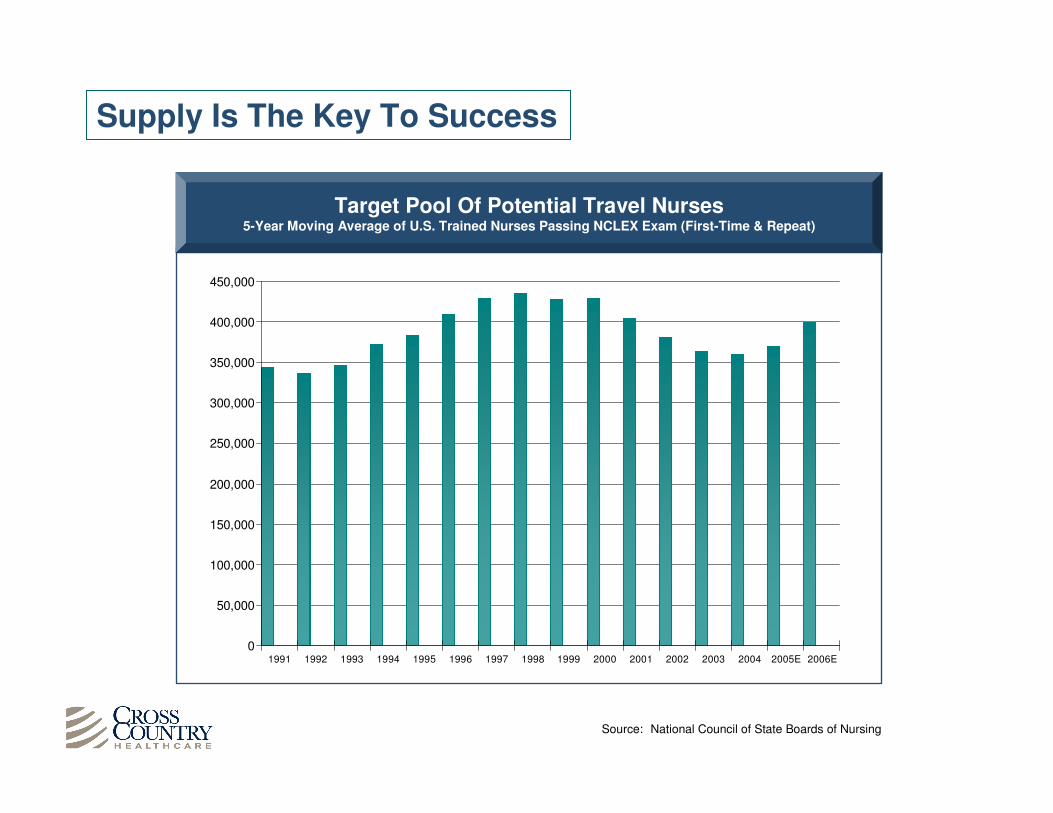
Supply Is The Key To Success
Target Pool Of Potential Travel Nurses5-Year Moving Average of U.S. Trained Nurses Passing NCLEX Exam (First-Time & Repeat)
0
50,000
100,000
150,000
200,000
250,000
300,000
350,000
400,000
450,000
1991 1992 1993 1994 1995 1996 1997 1998 1999 2000 2001 2002 2003 2004 2005E 2006E
Source: National Council of State Boards of Nursing
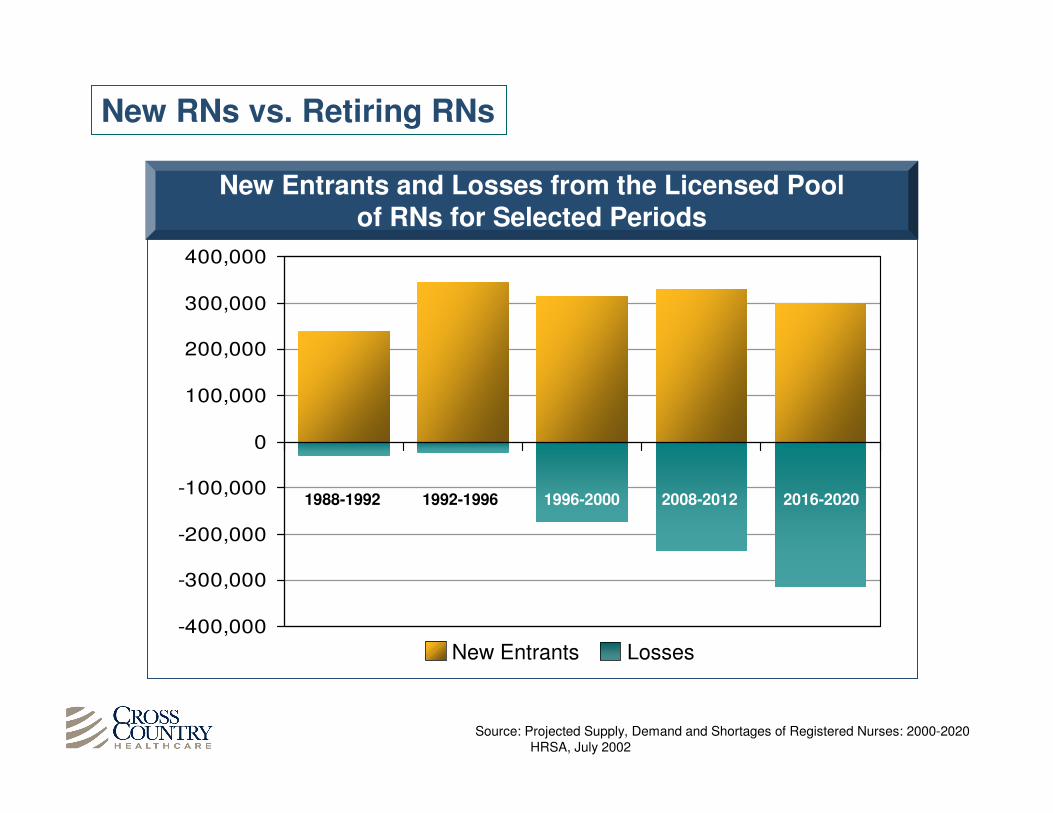
New RNs vs. Retiring RNs
Source: Projected Supply, Demand and Shortages of Registered Nurses: 2000-2020HRSA, July 2002
New Entrants and Losses from the Licensed Pool of RNs for Selected Periods
-400,000
-300,000
-200,000
-100,000
0
100,000
200,000
300,000
400,000
New Entrants Losses
1988-1992 1992-1996 1996-2000 2008-2012 2016-2020
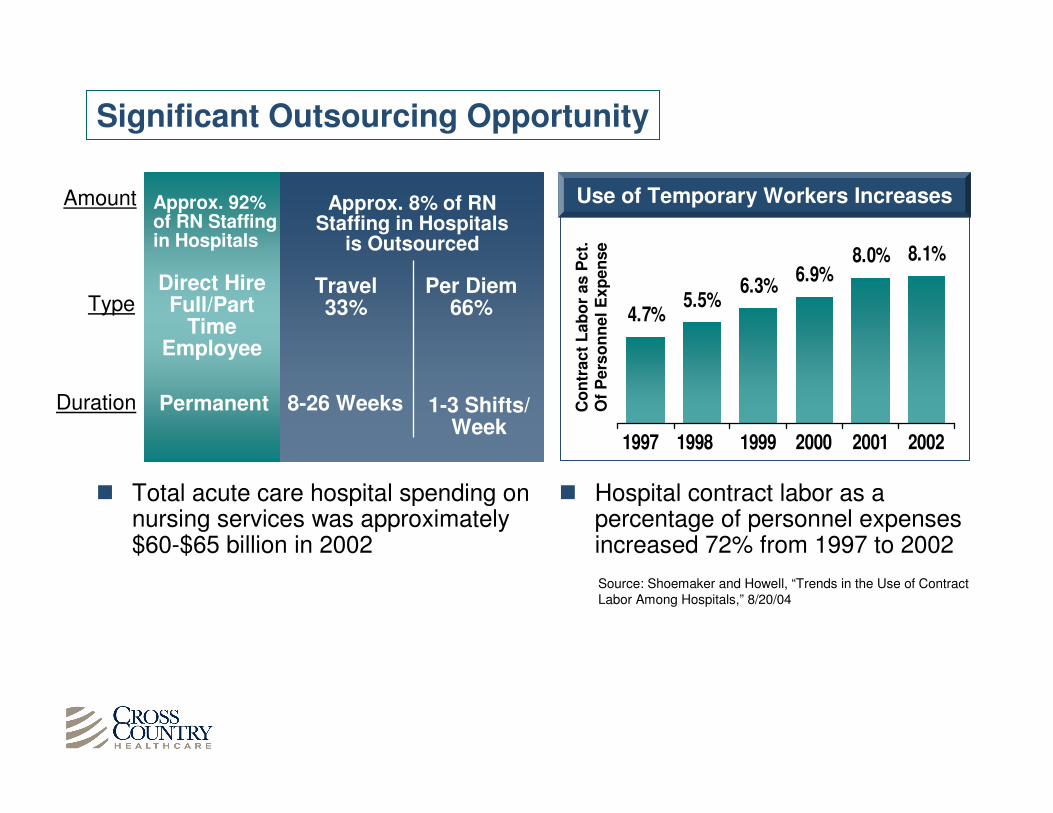
Significant Outsourcing Opportunity
� Total acute care hospital spending on nursing services was approximately $60-$65 billion in 2002
4.7%5.5%
6.3%6.9%
8.0% 8.1%
1997 1998 1999 2000 2001 2002
0
Use of Temporary Workers Increases
Co
ntr
ac
t L
ab
or
as
Pct.
O
f P
ers
on
ne
l E
xp
en
se
Source: Shoemaker and Howell, “Trends in the Use of Contract Labor Among Hospitals,” 8/20/04
� Hospital contract labor as a percentage of personnel expenses increased 72% from 1997 to 2002
Travel33%
Per Diem66%TypeType
Permanent 8-26 Weeks 1-3 Shifts/Week
DurationDuration
Direct HireFull/Part
Time Employee
Approx. 92% of RN Staffing in Hospitals
Approx. 8% of RN Staffing in Hospitals
is Outsourced
AmountAmount
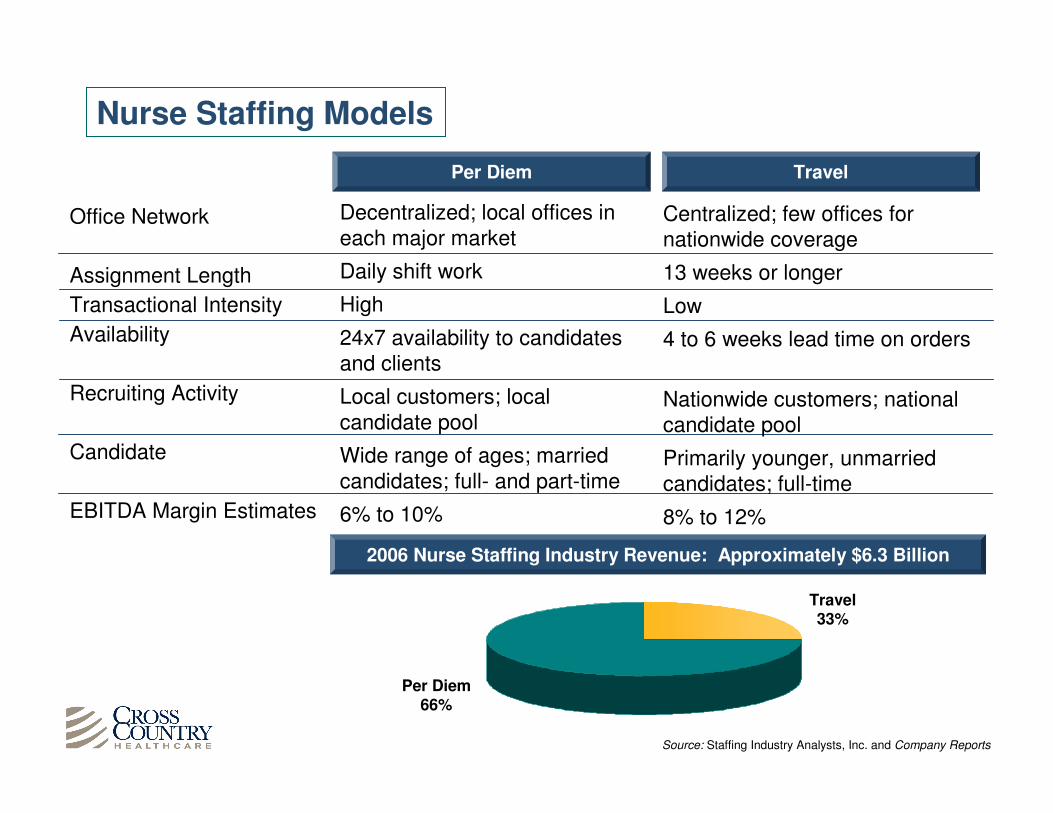
Nurse Staffing Models
Source: Staffing Industry Analysts, Inc. and Company Reports
Per Diem Travel
Office Network
Assignment Length
Transactional Intensity
Availability
Recruiting Activity
Candidate
EBITDA Margin Estimates
Decentralized; local offices in each major market
Daily shift work
High
24x7 availability to candidates and clients
Local customers; local candidate pool
Wide range of ages; married candidates; full- and part-time
6% to 10%
Centralized; few offices for nationwide coverage
13 weeks or longer
Low
4 to 6 weeks lead time on orders
Nationwide customers; national candidate pool
Primarily younger, unmarried candidates; full-time
8% to 12%
2006 Nurse Staffing Industry Revenue: Approximately $6.3 Billion
Per Diem66%
Travel33%
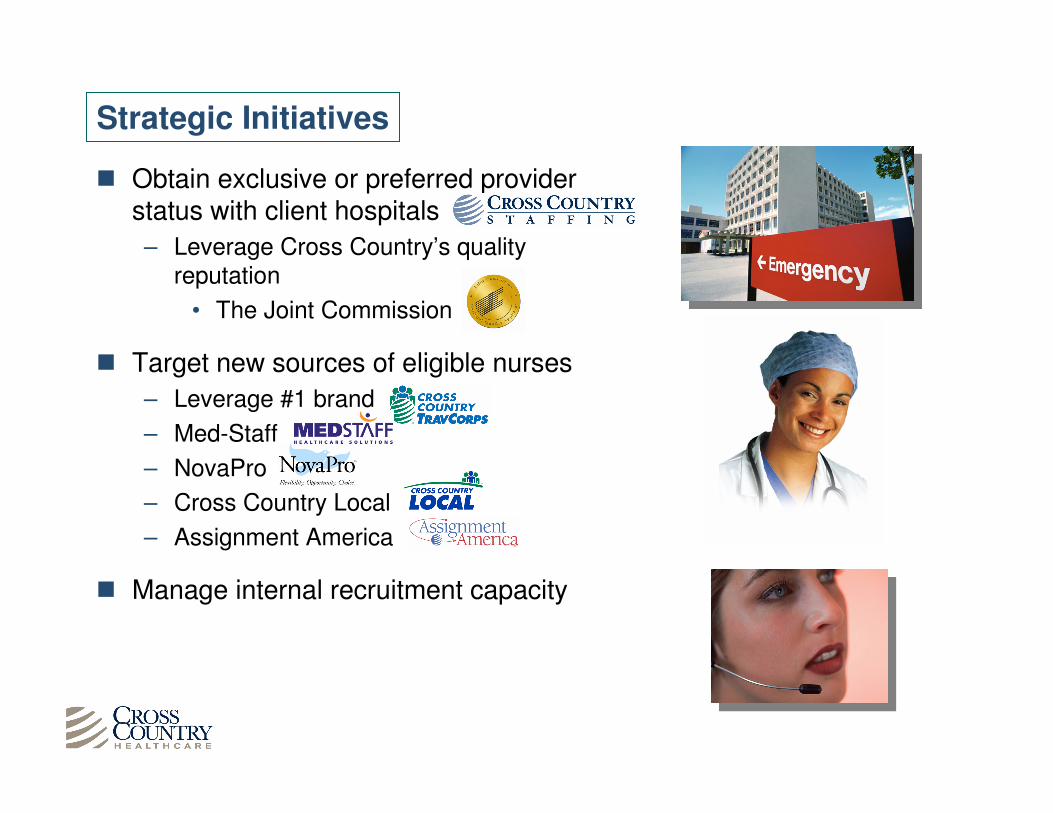
� Obtain exclusive or preferred provider status with client hospitals
– Leverage Cross Country’s quality reputation
• The Joint Commission
� Target new sources of eligible nurses
– Leverage #1 brand
– Med-Staff
– NovaPro
– Cross Country Local
– Assignment America
� Manage internal recruitment capacity
Strategic Initiatives
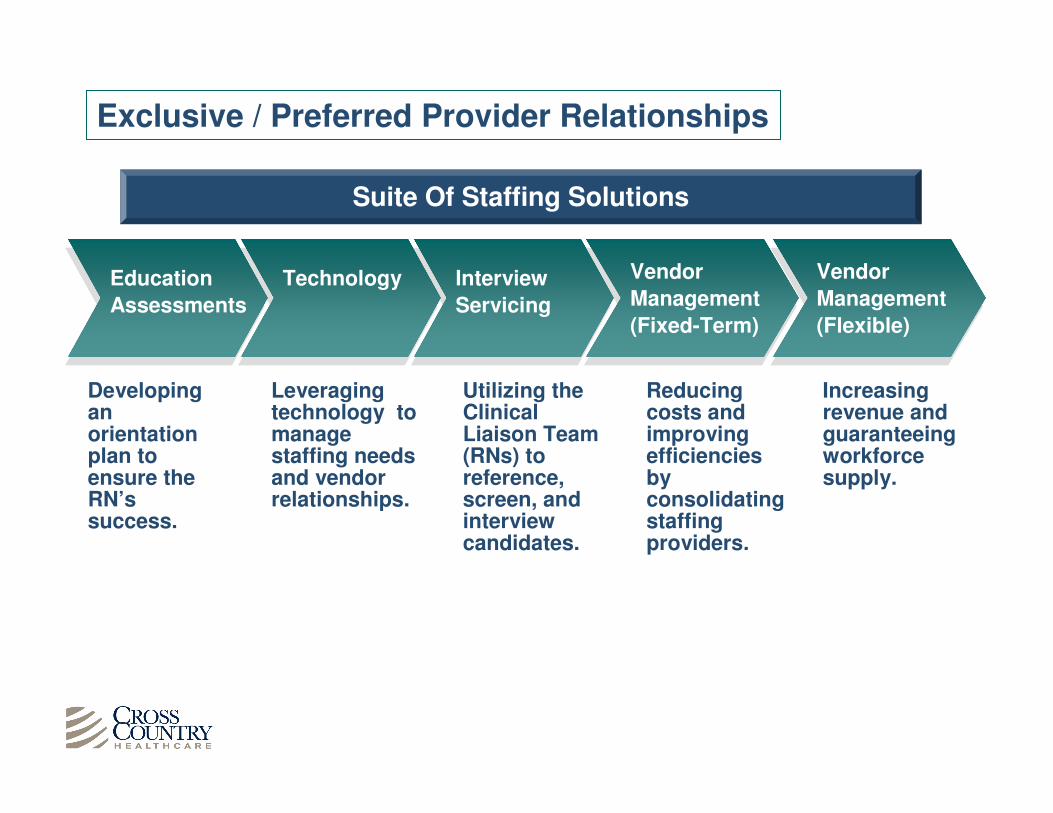
Increasing revenue and guaranteeing workforce supply.
Leveraging technology to manage staffing needs and vendor relationships.
Utilizing the Clinical Liaison Team (RNs) to reference, screen, and interview candidates.
Reducing costs and improving efficiencies by consolidating staffing providers.
Vendor
Management
(Flexible)
Education
Assessments
Technology Interview
Servicing
Vendor
Management
(Fixed-Term)
Developing an orientation plan to ensure the RN’s success.
Exclusive / Preferred Provider Relationships
Suite Of Staffing Solutions
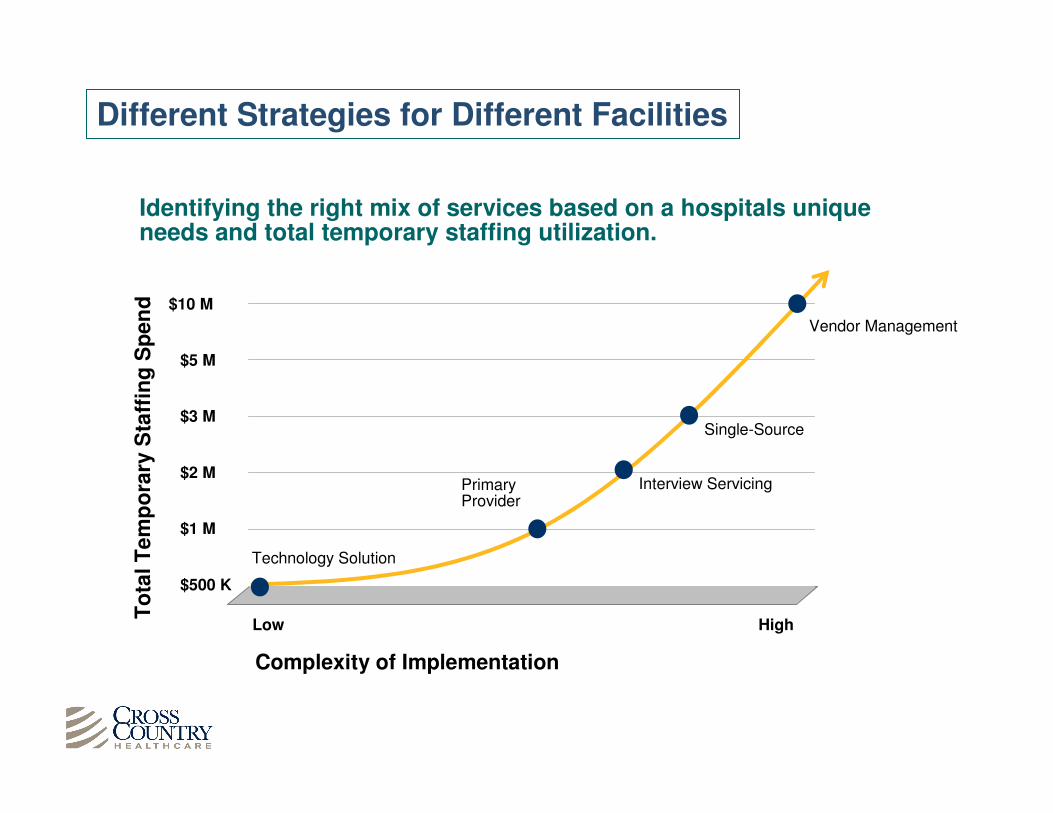
Identifying the right mix of services based on a hospitals unique needs and total temporary staffing utilization.
$10 M
Low
Technology Solution
Primary Provider
High
To
tal T
em
po
rary
Sta
ffin
g S
pen
d
$5 M
$3 M
$2 M
$1 M
$500 K
Interview Servicing
Vendor Management
Complexity of Implementation
Single-Source
Different Strategies for Different Facilities
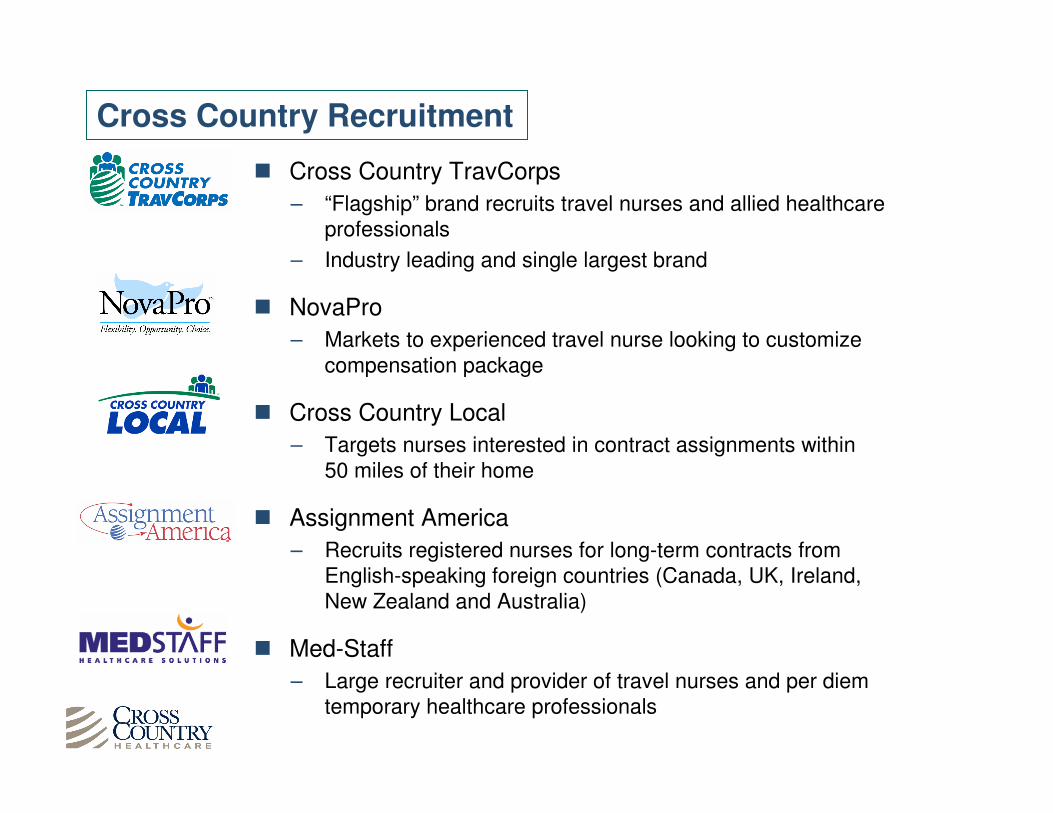
Cross Country Recruitment
� Cross Country TravCorps
– “Flagship” brand recruits travel nurses and allied healthcare professionals
– Industry leading and single largest brand
� NovaPro
– Markets to experienced travel nurse looking to customize compensation package
� Cross Country Local
– Targets nurses interested in contract assignments within 50 miles of their home
� Assignment America
– Recruits registered nurses for long-term contracts from English-speaking foreign countries (Canada, UK, Ireland, New Zealand and Australia)
� Med-Staff
– Large recruiter and provider of travel nurses and per diem temporary healthcare professionals
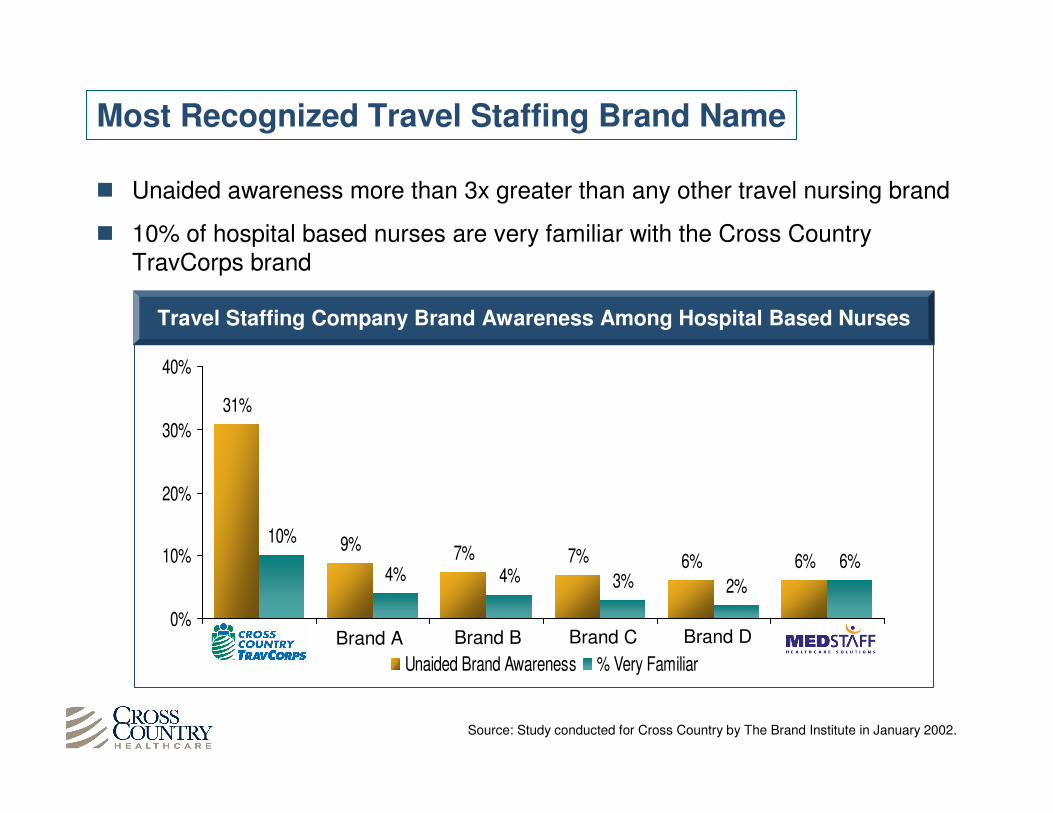
Most Recognized Travel Staffing Brand Name
� Unaided awareness more than 3x greater than any other travel nursing brand
� 10% of hospital based nurses are very familiar with the Cross Country TravCorps brand
Source: Study conducted for Cross Country by The Brand Institute in January 2002.
6%
31%
9% 7% 7% 6% 6%
10%
4% 4% 3% 2%
0%
10%
20%
30%
40%
Unaided Brand Awareness % Very Familiar
Brand A Brand B Brand C Brand D
Travel Staffing Company Brand Awareness Among Hospital Based Nurses
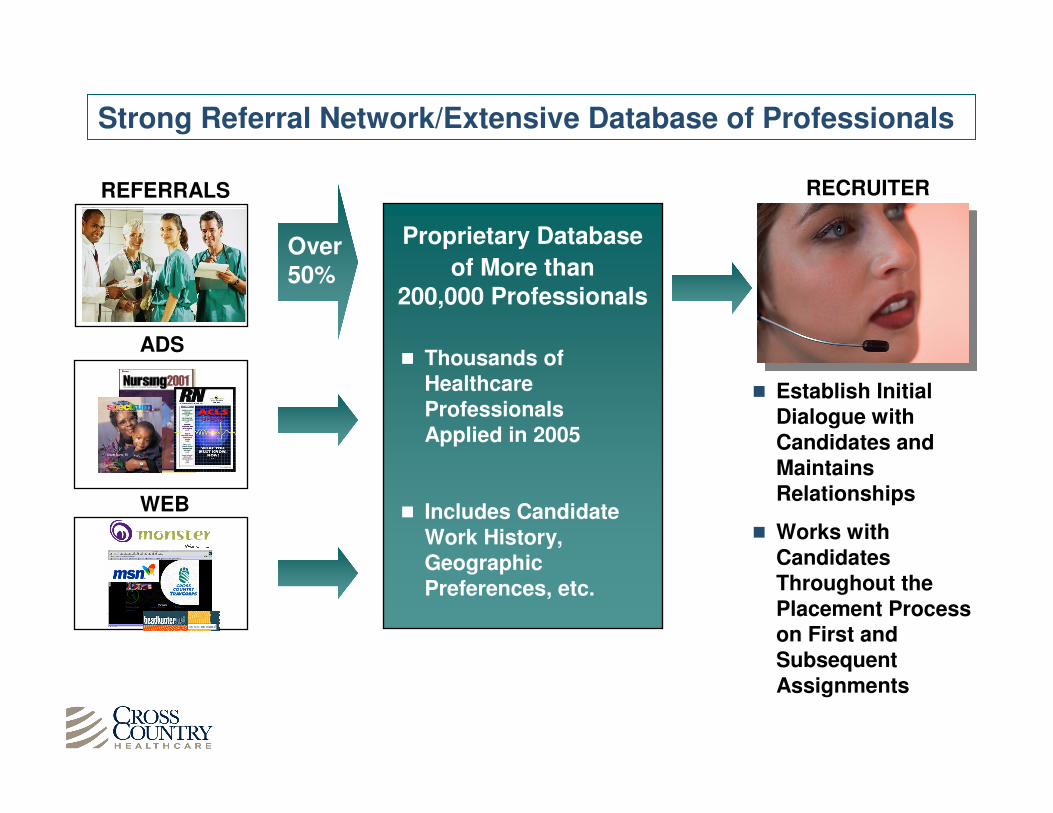
Strong Referral Network/Extensive Database of Professionals
ADSADS
REFERRALSREFERRALS
WEBWEB
� Establish Initial Dialogue with Candidates and Maintains Relationships
� Works with Candidates Throughout the Placement Process on First and Subsequent Assignments
RECRUITERRECRUITER
Proprietary Database
of More than200,000 Professionals
Proprietary Database
of More than200,000 Professionals
� Thousands of Healthcare Professionals Applied in 2005
� Includes Candidate Work History, Geographic Preferences, etc.
Over 50%
Financial Highlights
� Strong operating and free cash flow
� Conservative balance sheet
� High revenue and earnings visibility
� Minimal capital investment requirements
� Proven record of successfully integrating acquisitions
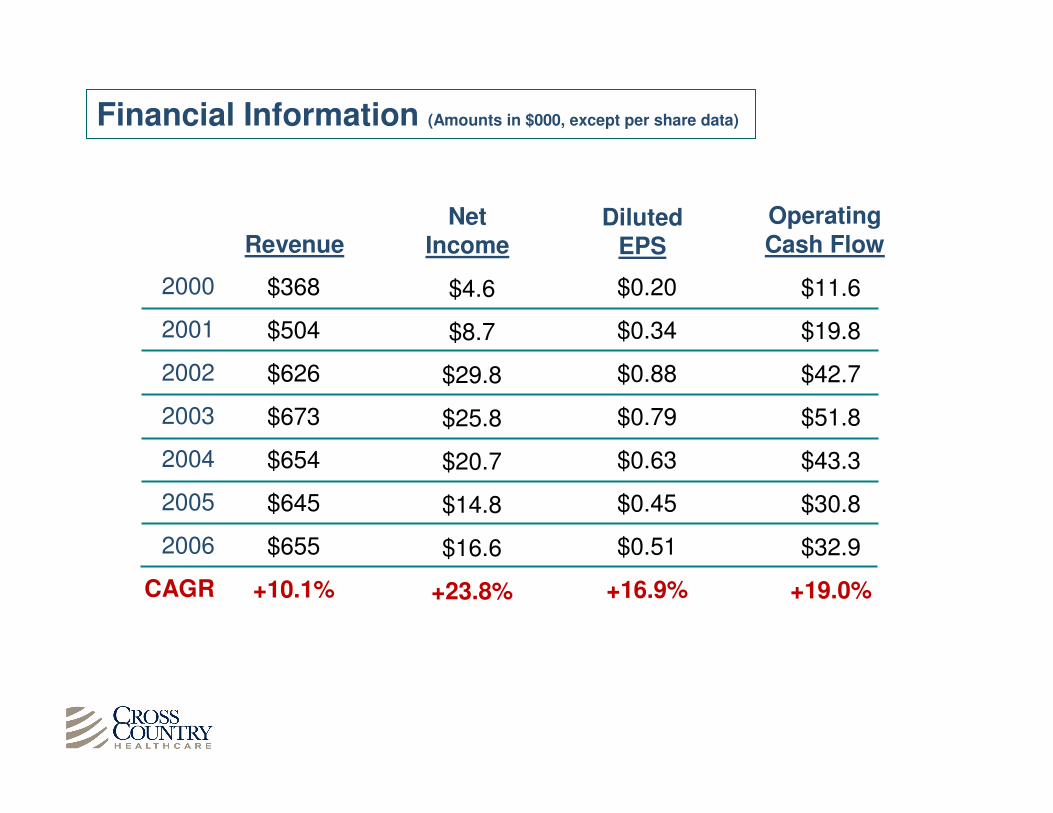
Financial Information (Amounts in $000, except per share data)
2000
2001
2002
2003
2004
2005
2006
CAGR
$368
$504
$626
$673
$654
$645
$655
+10.1%
Revenue
$11.6
$19.8
$42.7
$51.8
$43.3
$30.8
$32.9
+19.0%
OperatingCash Flow
$4.6
$8.7
$29.8
$25.8
$20.7
$14.8
$16.6
+23.8%
NetIncome
$0.20
$0.34
$0.88
$0.79
$0.63
$0.45
$0.51
+16.9%
DilutedEPS
$127.8
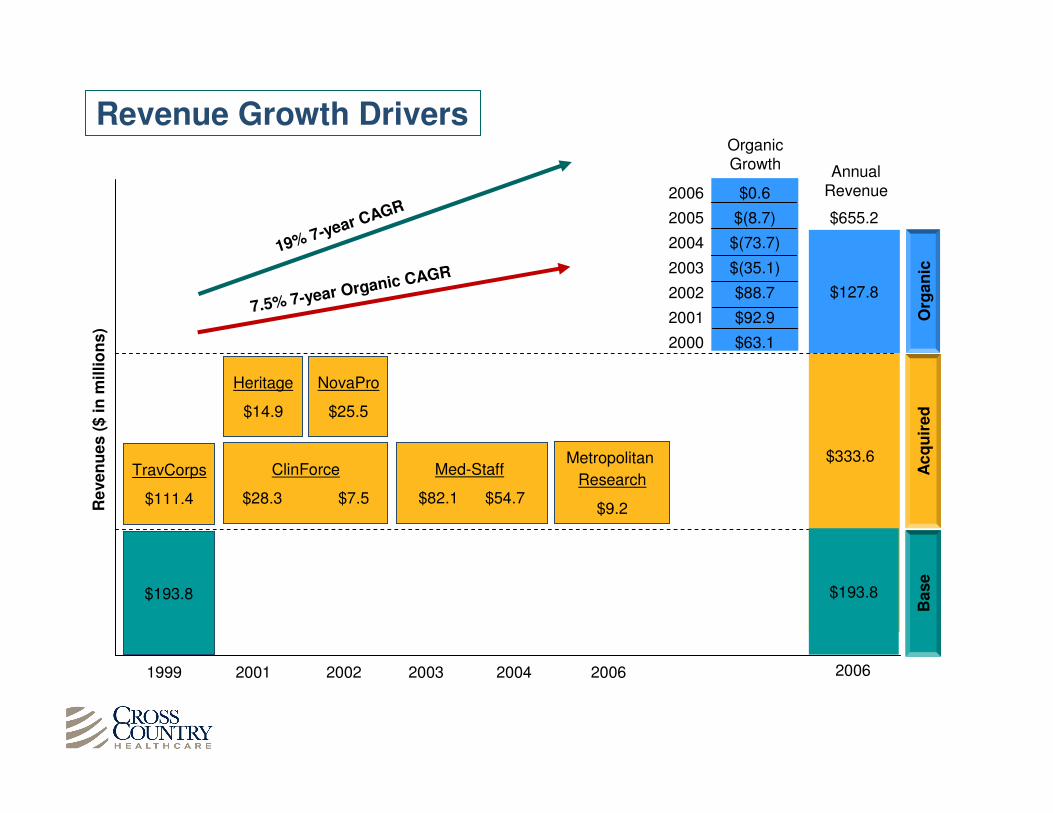
Revenue Growth Drivers
19% 7-year CAGR
7.5% 7-year Organic CAGR
20021999 20062001 2003 2004
TravCorps
$111.4
Heritage
$14.9
$193.8
Re
ve
nu
es
($
in
mil
lio
ns
)
ClinForce
$28.3 $7.5
Med-Staff
$82.1 $54.7
NovaPro
$25.5
Ac
qu
ire
dO
rga
nic
Base
$655.2
$193.8
$333.6
OrganicGrowth
2006
2005
2004
2003
2002
2001
2000
$0.6
$(8.7)
$(73.7)
$(35.1)
$88.7
$92.9
$63.1
2006
Metropolitan
Research
$9.2
AnnualRevenue
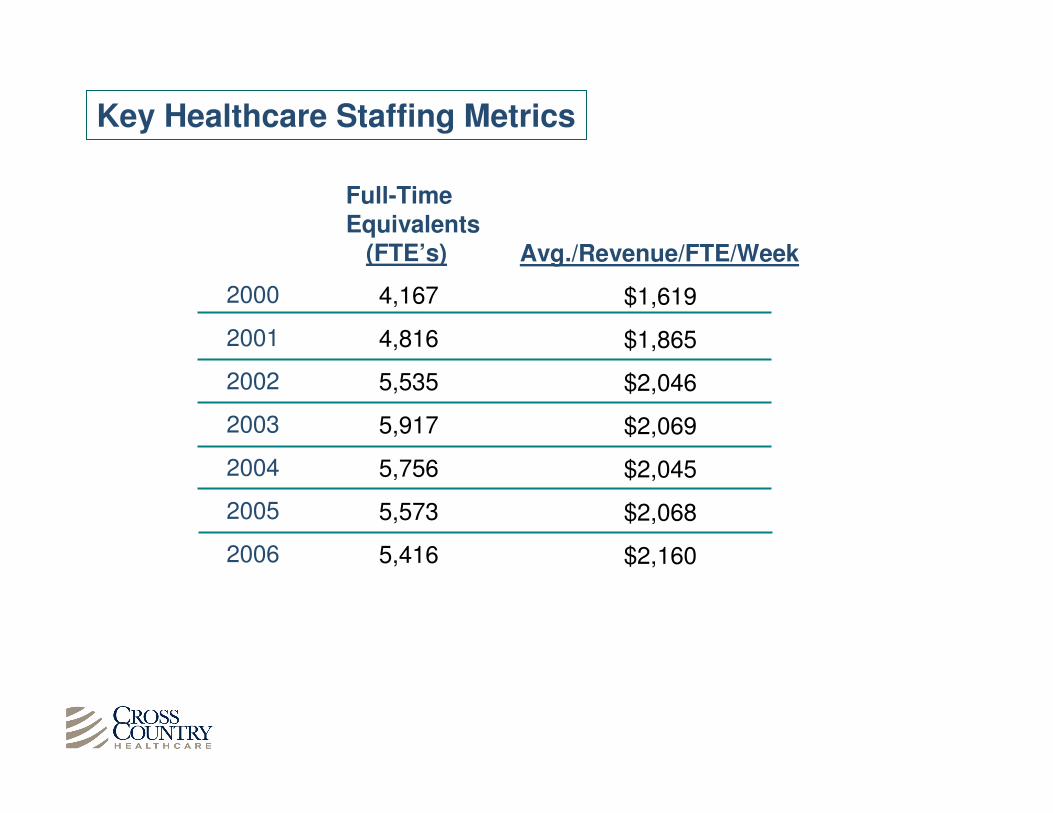
Key Healthcare Staffing Metrics
2000
2001
2002
2003
2004
2005
2006
4,167
4,816
5,535
5,917
5,756
5,573
5,416
Full-TimeEquivalents
(FTE’s)
$1,619
$1,865
$2,046
$2,069
$2,045
$2,068
$2,160
Avg./Revenue/FTE/Week