health wealth career high yield and distressed debt - mercer · health wealth career high yield and...
TRANSCRIPT

H E A LT H W E A LT H C A R E E R
H I G H Y I E L D A N D D I S T R E S S E D D E B T W H E R E A R E W E , W H E R E A R E W E G O I N G , A N D H O W D O W E G E T T H E R E ?
A P R I L 2 0 1 6
2
The year 2015 was one that most corporate credit investors would like to forget. Marked by severe volatility, deterioration in credit quality, and quite possibly a new paradigm for the price of liquidity, all US-based leveraged credit indices finished in the red, posting the worst returns since the 2008 crisis. Selling momentum was strong, and a second consecutive year of outflows from the asset class has left spreads on the edge of pricing in a global recession.
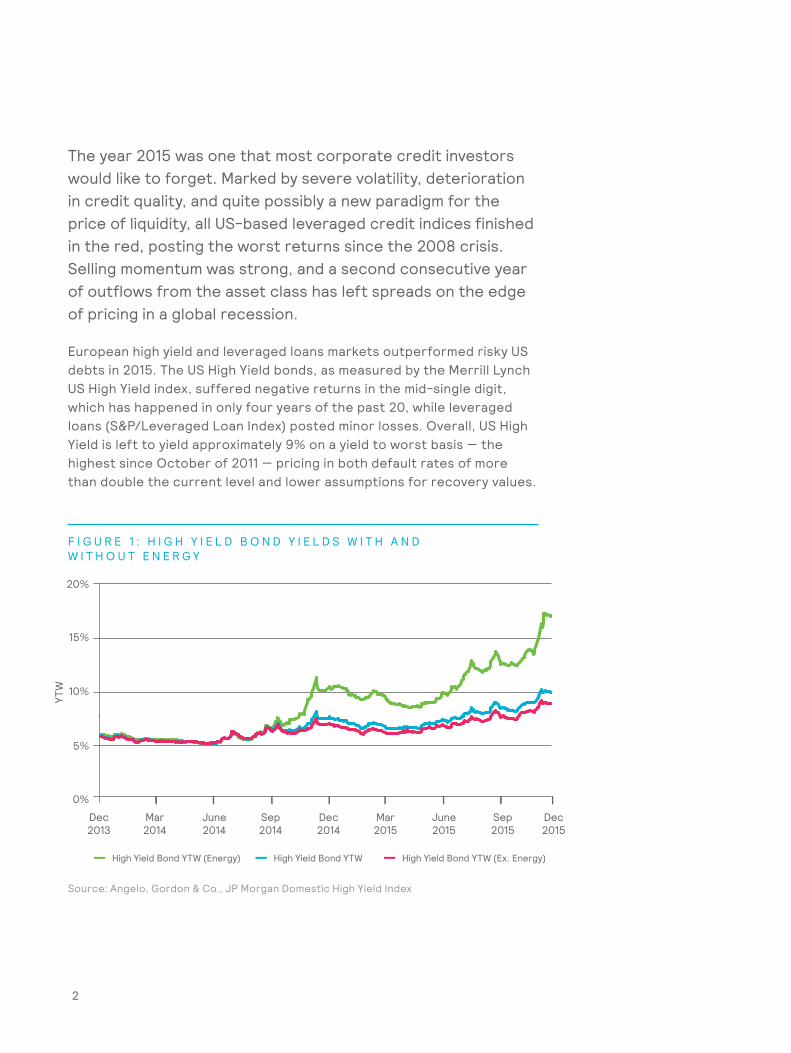
European high yield and leveraged loans markets outperformed risky US debts in 2015. The US High Yield bonds, as measured by the Merrill Lynch US High Yield index, suffered negative returns in the mid-single digit, which has happened in only four years of the past 20, while leveraged loans (S&P/Leveraged Loan Index) posted minor losses. Overall, US High Yield is left to yield approximately 9% on a yield to worst basis — the highest since October of 2011 — pricing in both default rates of more than double the current level and lower assumptions for recovery values.
F I G U R E 1 : H I G H Y I E L D B O N D Y I E L D S W I T H A N D W I T H O U T E N E R G Y
Source: Angelo, Gordon & Co., JP Morgan Domestic High Yield Index
0%
5%
10%
15%
20%
Dec2013
YTW
Mar2014
June2014
Sep2014
Dec2014
Mar2015
June2015
Dec2015
High Yield Bond YTW (Energy) High Yield Bond YTW High Yield Bond YTW (Ex. Energy)
Sep2015
W H AT H A P P E N E D ? F U N D A M E N TA L A N D T E C H N I C A L H E A D W I N D S
As Figure 1 illustrates, much of the underperformance of corporate credit was due to losses in the energy sector. It is true that energy and commodity-related issuers led the way down and suffered the most as weaker worldwide demand and excess supply sent oil prices plunging 30% in 2015 (as measured by one-month forward crude), natural gas down almost 25%, and copper, often considered a leading indicator of economic activity, also down almost 25%. Energy-related issuers make up approximately 15% of the US High Yield Index and metals/mining are another 10% of the index (five times and three times larger, respectively, than their place was in the index in 2007). As compared to a weight of 18% of such issuers in the S&P 500, this overweight explains some of the underperformance of credit. But it is only a small part of the overall picture.
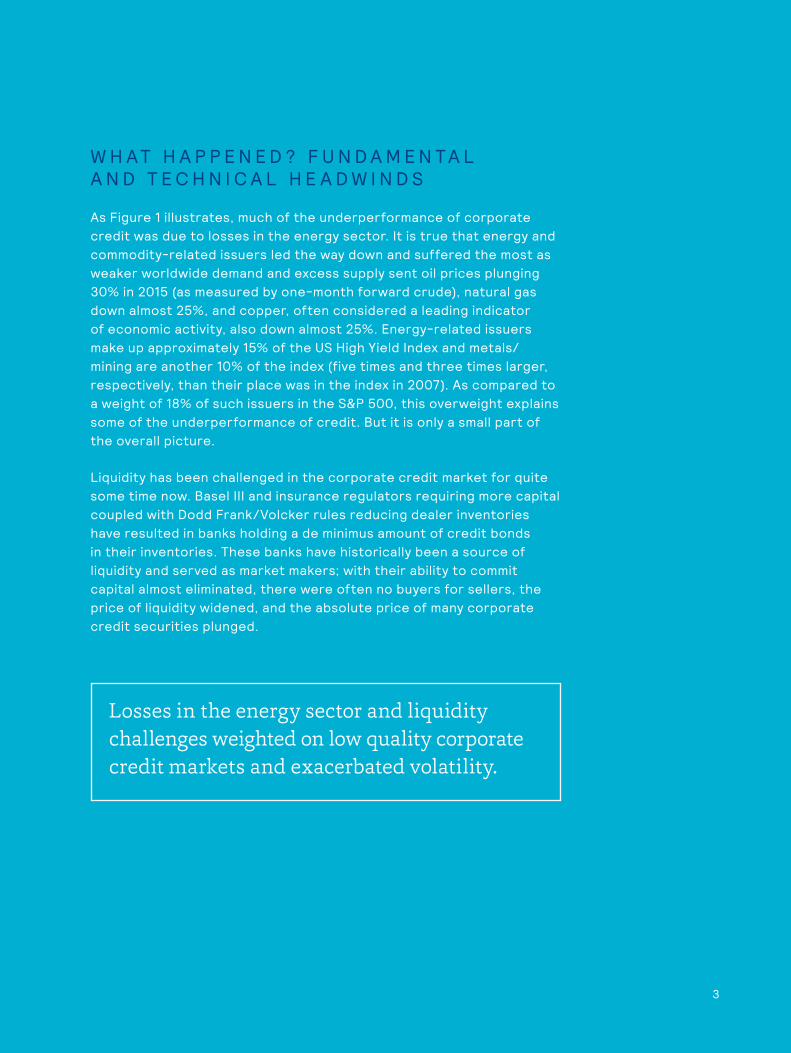
Liquidity has been challenged in the corporate credit market for quite some time now. Basel III and insurance regulators requiring more capital coupled with Dodd Frank/Volcker rules reducing dealer inventories have resulted in banks holding a de minimus amount of credit bonds in their inventories. These banks have historically been a source of liquidity and served as market makers; with their ability to commit capital almost eliminated, there were often no buyers for sellers, the price of liquidity widened, and the absolute price of many corporate credit securities plunged.
Losses in the energy sector and liquidity challenges weighted on low quality corporate credit markets and exacerbated volatility.
3
4
$1,000
$2,000
$3,000
$5,000
$6,000
$4,000
2002 20042003 20062005 20082007 20102009 20122011 20142013 2015
Primary Dealer Daily Average Trading (LHS) Barclays US Aggregate Credit MV (RHS)
Bill
ion
300
250
200
150
100
50
F I G U R E 2 : H I G H Y I E L D D E A L E R I N V E N T O R Y A S A P E R C E N T A G E O F T H E H I G H Y I E L D M A R K E T
F I G U R E 3 : P R I M A R Y D E A L E R D A I L Y A V E R A G E T R A D I N G A N D O U T S T A N D I N G C O R P O R A T E D E B T
Source: Marathon Asset Management, Bloomberg
Source: Mercer, Bloomberg
0%
1%
2%
3%
4%
5%
July2001
2003 2005 2007 2009 2011 20152013 Feb 2016
2002 2002 2006 2008 2010 2012 2014 2015
5
0 0%Jan
2013April2013
July 2013
Oct2013
Jan2014
April2014
July 2014
Oct 2014
Jan 2015
April 2015
July 2015
Oct2015
Jan2016
Inde
x co
mpo
und
retu
rn
High yield bonds ex mining and energy (LHS)
High yield bonds mining and energy (LHS)
BAML US HY index (RHS)
50
100
200
250
150
300
350
2%
4%
8%
12%
10%
6%
14%
16%
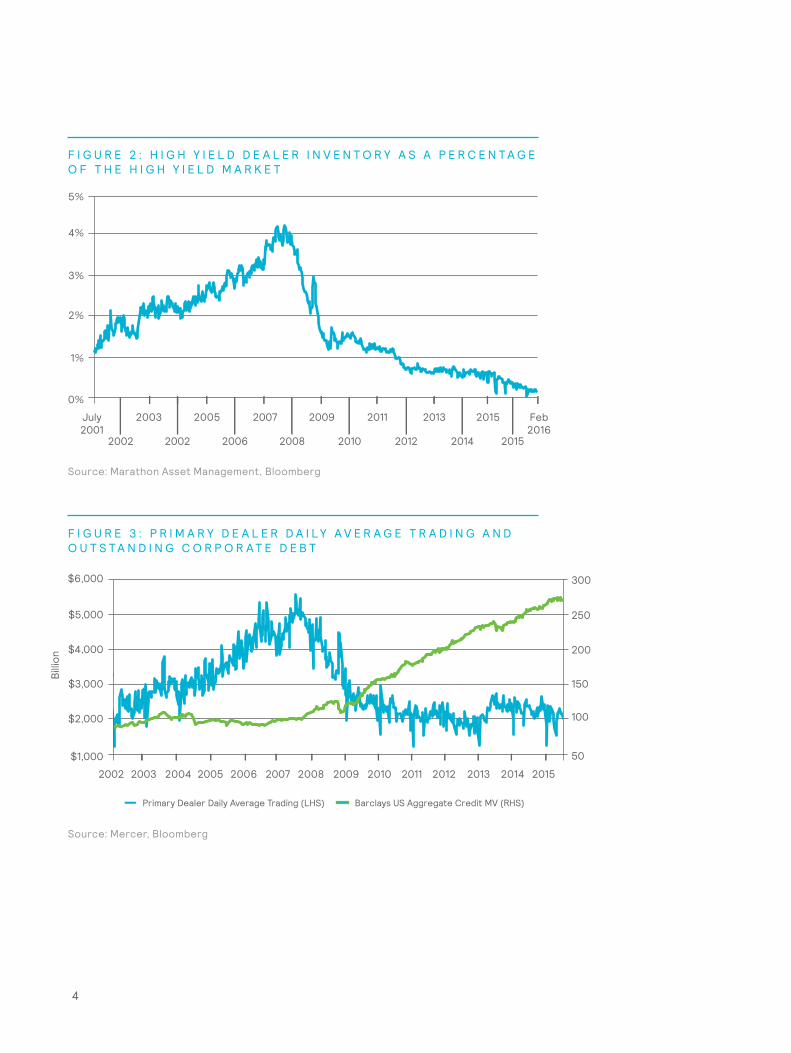
This shift to an environment with less liquidity has exacerbated the volatility in credit trading, leading to dramatic swings in otherwise less volatile and relatively more liquid positions. The headline risks increased and contagion in the credit market continued throughout the latter half of the year. Weaker prices begot more selling, stop/losses were triggered, and redemptions caused a general panic, resulting in selling by retail investors — who make up approximately 25% of the High Yield market. Many bonds experienced unprecedented gaps in intraday and intra-month trading prices.
F I G U R E 4 : N U M B E R O F U S H I G H Y I E L D B O N D S E X P E R I E N C I N G M O R E T H A N A 1 0 % P R I C E L O S S I N A M O N T H
Source: BlueBay Asset Management, BAML
6
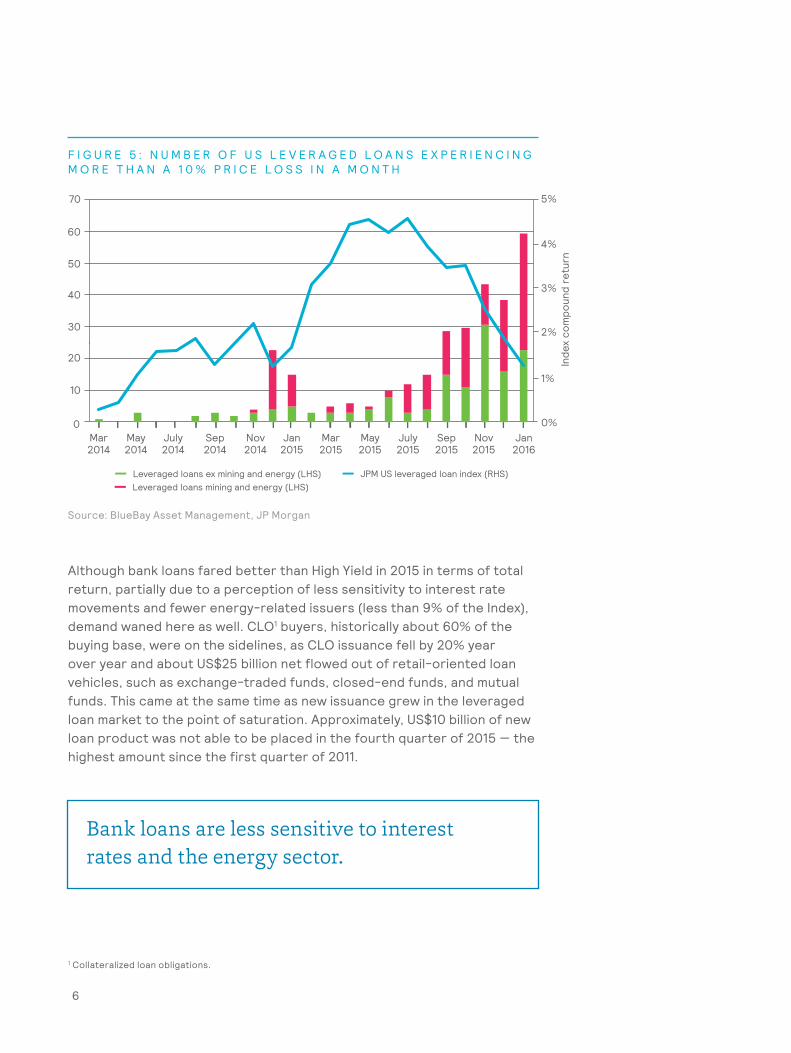
Although bank loans fared better than High Yield in 2015 in terms of total return, partially due to a perception of less sensitivity to interest rate movements and fewer energy-related issuers (less than 9% of the Index), demand waned here as well. CLO1 buyers, historically about 60% of the buying base, were on the sidelines, as CLO issuance fell by 20% year over year and about US$25 billion net flowed out of retail-oriented loan vehicles, such as exchange-traded funds, closed-end funds, and mutual funds. This came at the same time as new issuance grew in the leveraged loan market to the point of saturation. Approximately, US$10 billion of new loan product was not able to be placed in the fourth quarter of 2015 — the highest amount since the first quarter of 2011.
1 Collateralized loan obligations.
F I G U R E 5 : N U M B E R O F U S L E V E R A G E D L O A N S E X P E R I E N C I N G M O R E T H A N A 1 0 % P R I C E L O S S I N A M O N T H
Source: BlueBay Asset Management, JP Morgan
Bank loans are less sensitive to interest rates and the energy sector.
0
1%
4%
3%
2%
5%
Mar2014
May2014
July 2014
Sep2014
Nov2014
Jan2015
Mar 2015
May2015
July2015
Sep2015
Nov 2015
Jan 2016
Inde
x co
mpo
und
retu
rn
Leveraged loans ex mining and energy (LHS) JPM US leveraged loan index (RHS)Leveraged loans mining and energy (LHS)
0%
70
10
20
30
40
50
60
7
($10)
($5)
0
$10
$5
$15
L O A N M U T U A L F U N D F L O W S A N D C L O I S S U A N C E
Bill
ion
Loan fund flows US dollar CLOs
Jan2011
April2011
July2011
Oct2011
Jan2012
April2012
July2012
Oct2012
Jan2013
April2013
July2013
Oct2013
Jan2014
April2014
July2014
Oct2014
Jan2015
April2015
July2015
Oct2015
Jan2016
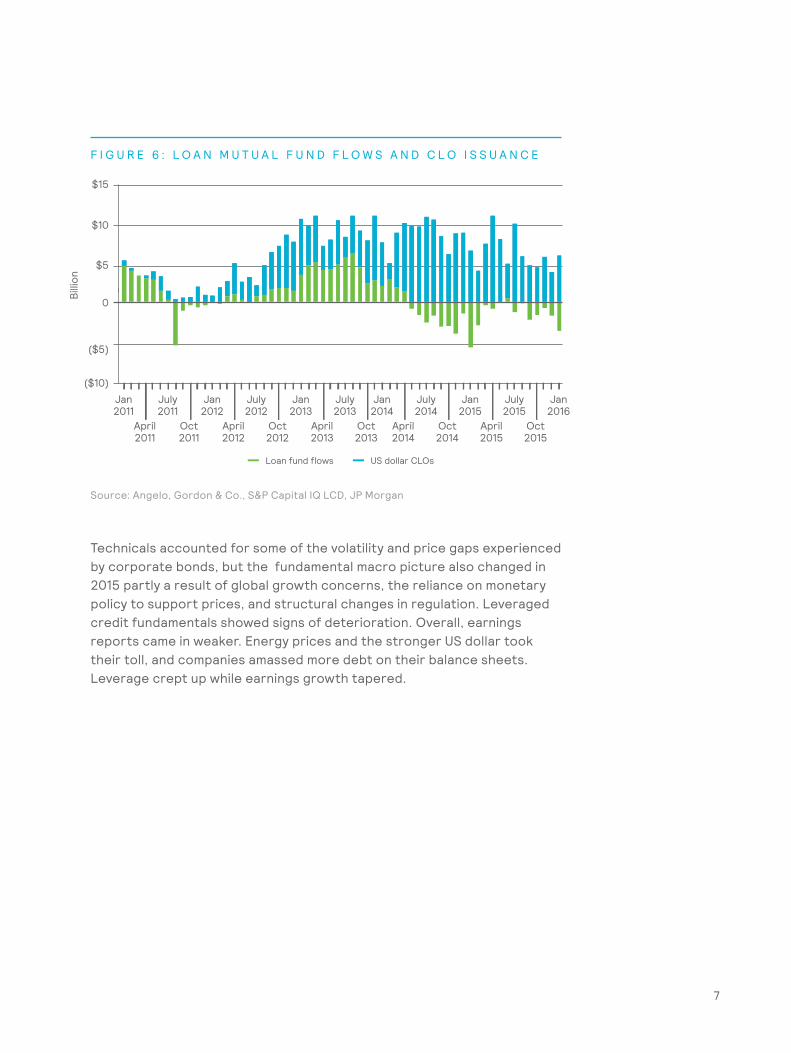
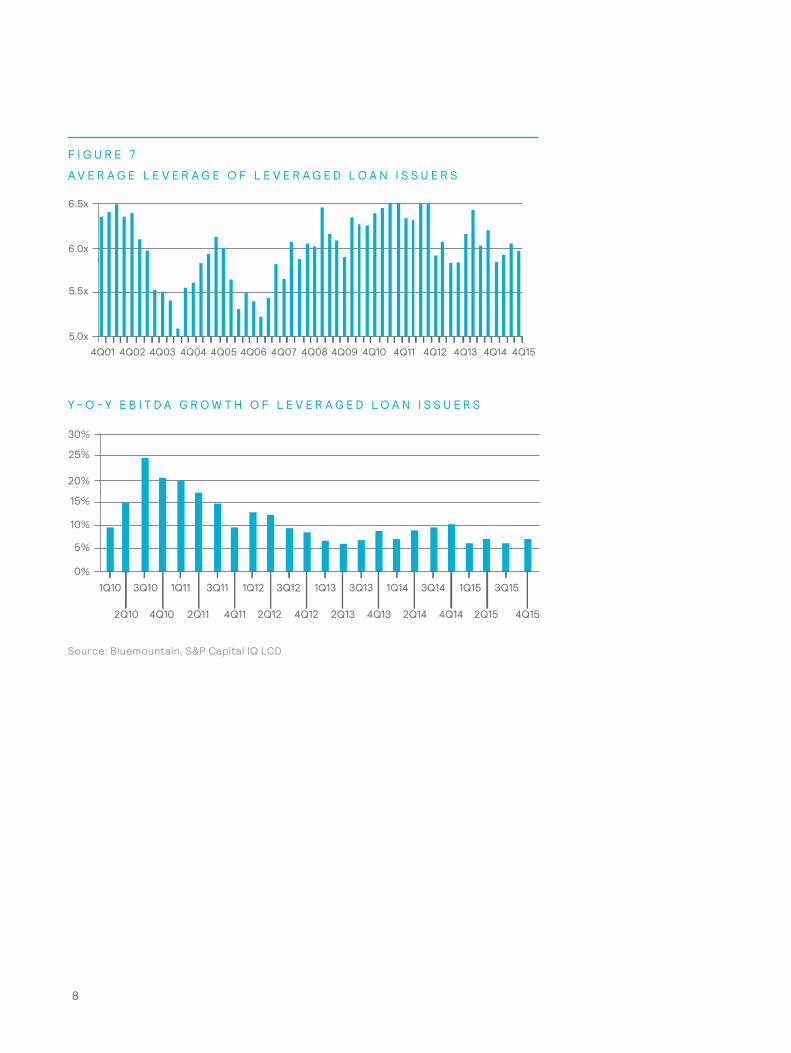
Technicals accounted for some of the volatility and price gaps experienced by corporate bonds, but the fundamental macro picture also changed in 2015 partly a result of global growth concerns, the reliance on monetary policy to support prices, and structural changes in regulation. Leveraged credit fundamentals showed signs of deterioration. Overall, earnings reports came in weaker. Energy prices and the stronger US dollar took their toll, and companies amassed more debt on their balance sheets. Leverage crept up while earnings growth tapered.
F I G U R E 6 : L O A N M U T U A L F U N D F L O W S A N D C L O I S S U A N C E
Source: Angelo, Gordon & Co., S&P Capital IQ LCD, JP Morgan
8
F I G U R E 7
Source: Bluemountain, S&P Capital IQ LCD
A V E R A G E L E V E R A G E O F L E V E R A G E D L O A N I S S U E R S
Y - O - Y E B I T D A G R O W T H O F L E V E R A G E D L O A N I S S U E R S
5.0x
5.5x
6.5x
6.0x
4Q01 4Q02 4Q03 4Q04 4Q05 4Q06 4Q07 4Q08 4Q09 4Q10 4Q11 4Q12 4Q13 4Q14 4Q15
0%
10%
30%
20%
5%
15%
25%
1Q10
2Q10
3Q10
4Q10
1Q11
2Q11
3Q11
4Q11
1Q12
2Q12
3Q12
4Q12
1Q13
2Q13
3Q13
4Q13
1Q14
2Q14
3Q14
4Q14
1Q15
2Q15 4Q15
3Q15
9
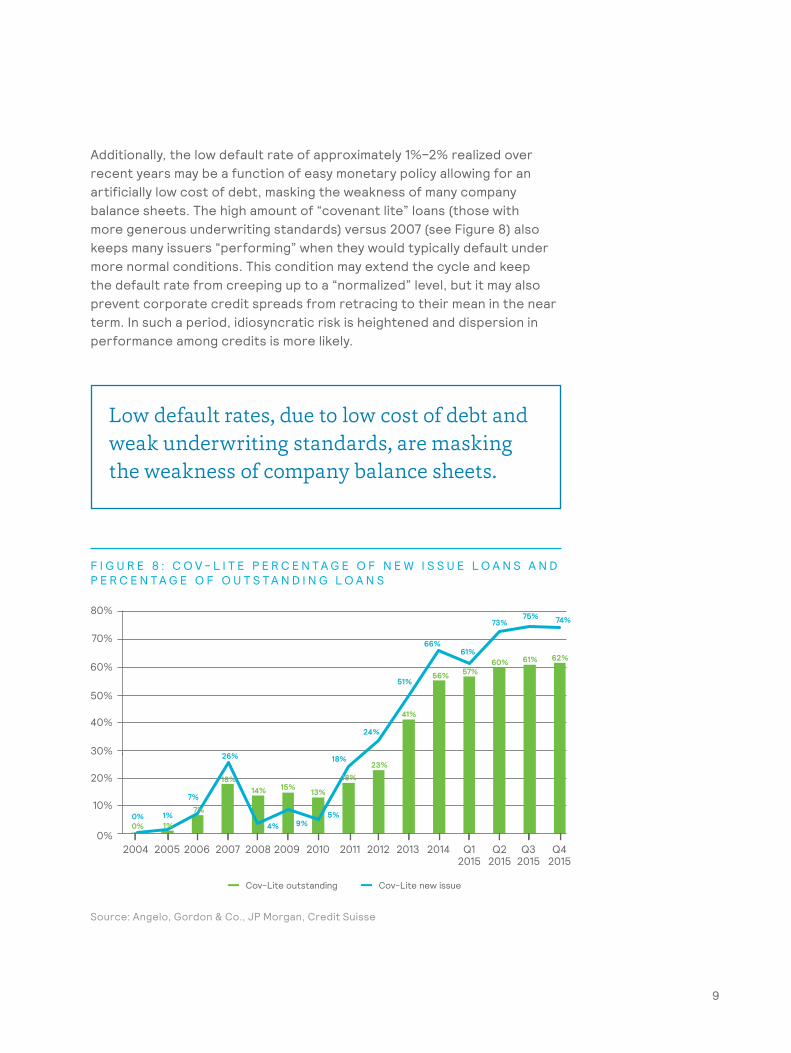
Additionally, the low default rate of approximately 1%–2% realized over recent years may be a function of easy monetary policy allowing for an artificially low cost of debt, masking the weakness of many company balance sheets. The high amount of “covenant lite” loans (those with more generous underwriting standards) versus 2007 (see Figure 8) also keeps many issuers “performing” when they would typically default under more normal conditions. This condition may extend the cycle and keep the default rate from creeping up to a “normalized” level, but it may also prevent corporate credit spreads from retracing to their mean in the near term. In such a period, idiosyncratic risk is heightened and dispersion in performance among credits is more likely.
F I G U R E 8 : C O V - L I T E P E R C E N T A G E O F N E W I S S U E L O A N S A N D P E R C E N T A G E O F O U T S T A N D I N G L O A N S
Source: Angelo, Gordon & Co., JP Morgan, Credit Suisse
0%
20%
10%
70%
50%
40%
30%
60%
80%
2004 2005 2006 2007 2008 2009 2010 2011 2012 2013 2014 Q12015
Q22015
Q32015
Q4 2015
Cov-Lite outstanding Cov-Lite new issue
0% 1%
7%
18%14% 15%
9%4%
26%
7%
1%0%
13%
5%
18%23%
24%
41%
51%56%
66%
57%
61%60%
73%
61%
75%
62%
74%
18%
Low default rates, due to low cost of debt and weak underwriting standards, are masking the weakness of company balance sheets.
10
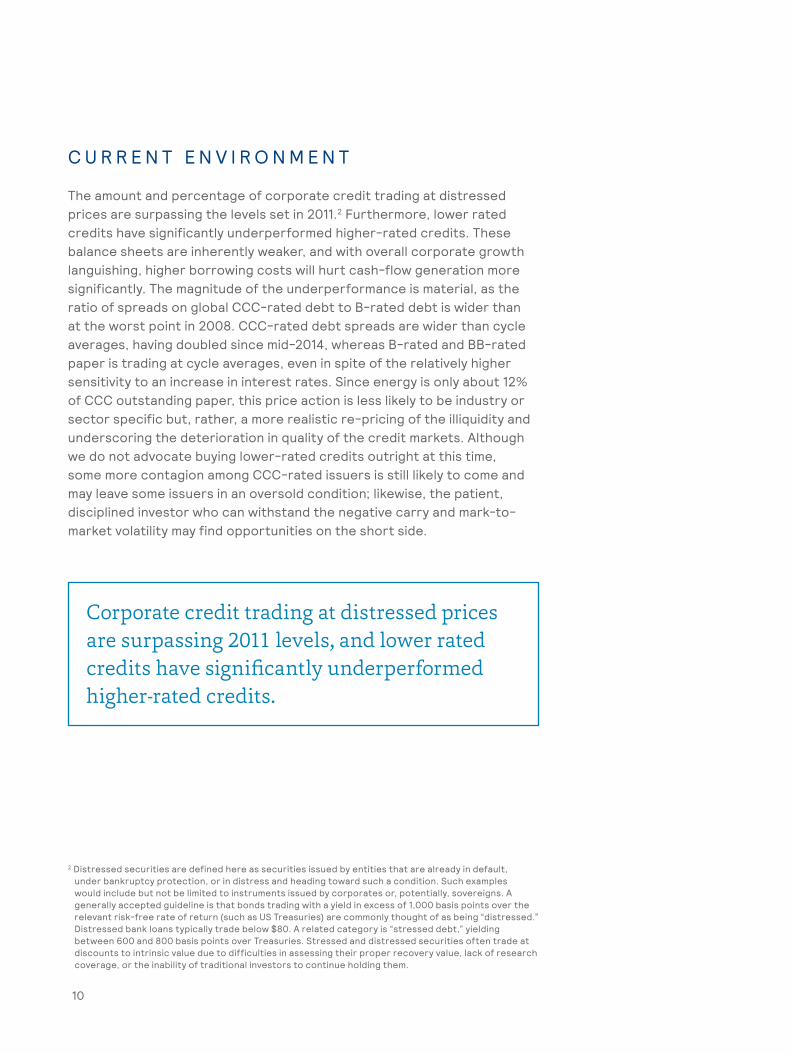
C U R R E N T E N V I R O N M E N T
The amount and percentage of corporate credit trading at distressed prices are surpassing the levels set in 2011.2 Furthermore, lower rated credits have significantly underperformed higher-rated credits. These balance sheets are inherently weaker, and with overall corporate growth languishing, higher borrowing costs will hurt cash-flow generation more significantly. The magnitude of the underperformance is material, as the ratio of spreads on global CCC-rated debt to B-rated debt is wider than at the worst point in 2008. CCC-rated debt spreads are wider than cycle averages, having doubled since mid-2014, whereas B-rated and BB-rated paper is trading at cycle averages, even in spite of the relatively higher sensitivity to an increase in interest rates. Since energy is only about 12% of CCC outstanding paper, this price action is less likely to be industry or sector specific but, rather, a more realistic re-pricing of the illiquidity and underscoring the deterioration in quality of the credit markets. Although we do not advocate buying lower-rated credits outright at this time, some more contagion among CCC-rated issuers is still likely to come and may leave some issuers in an oversold condition; likewise, the patient, disciplined investor who can withstand the negative carry and mark-to-market volatility may find opportunities on the short side.
2 Distressed securities are defined here as securities issued by entities that are already in default, under bankruptcy protection, or in distress and heading toward such a condition. Such examples would include but not be limited to instruments issued by corporates or, potentially, sovereigns. A generally accepted guideline is that bonds trading with a yield in excess of 1,000 basis points over the relevant risk-free rate of return (such as US Treasuries) are commonly thought of as being “distressed.” Distressed bank loans typically trade below $80. A related category is “stressed debt,” yielding between 600 and 800 basis points over Treasuries. Stressed and distressed securities often trade at discounts to intrinsic value due to difficulties in assessing their proper recovery value, lack of research coverage, or the inability of traditional investors to continue holding them.
Corporate credit trading at distressed prices are surpassing 2011 levels, and lower rated credits have significantly underperformed higher-rated credits.
11
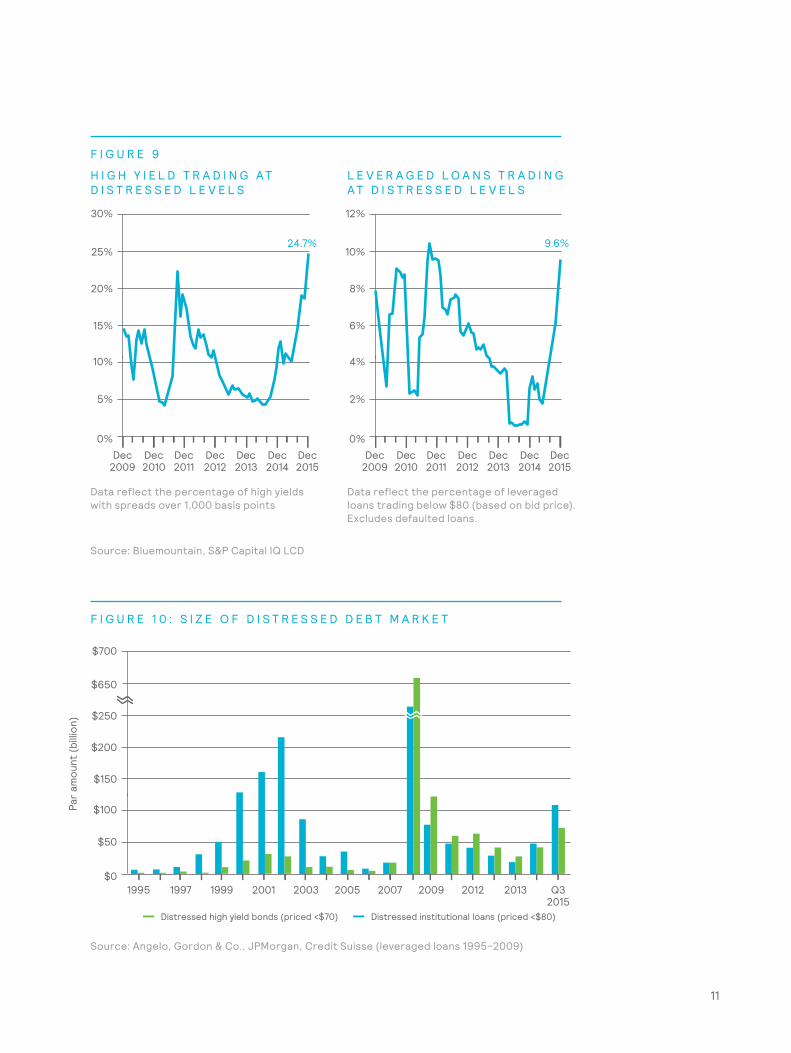
F I G U R E 9
H I G H Y I E L D T R A D I N G A T D I S T R E S S E D L E V E L S
L E V E R A G E D L O A N S T R A D I N G A T D I S T R E S S E D L E V E L S
F I G U R E 1 0 : S I Z E O F D I S T R E S S E D D E B T M A R K E T
Data reflect the percentage of high yields with spreads over 1,000 basis points
Data reflect the percentage of leveraged loans trading below $80 (based on bid price). Excludes defaulted loans.
Source: Angelo, Gordon & Co., JPMorgan, Credit Suisse (leveraged loans 1995–2009)
Source: Bluemountain, S&P Capital IQ LCD
0%
10%
5%
25%
20%
15%
24.7%
30%
Dec2009
Dec 2010
Dec2011
Dec 2012
Dec2013
Dec 2014
Dec2015
0%
4%
2%
10%
8%
6%
12%
Dec2009
Dec 2010
Dec2011
Dec 2012
Dec2013
Dec 2014
Dec2015
9.6%
$0
$100
$50
$250
$200
$150
$700
$650
1995 1997 1999 2001 2003 2005 2007 2009 2012 2013 Q3 2015
Distressed high yield bonds (priced <$70) Distressed institutional loans (priced <$80)
Par
amou
nt (b
illio
n)
12
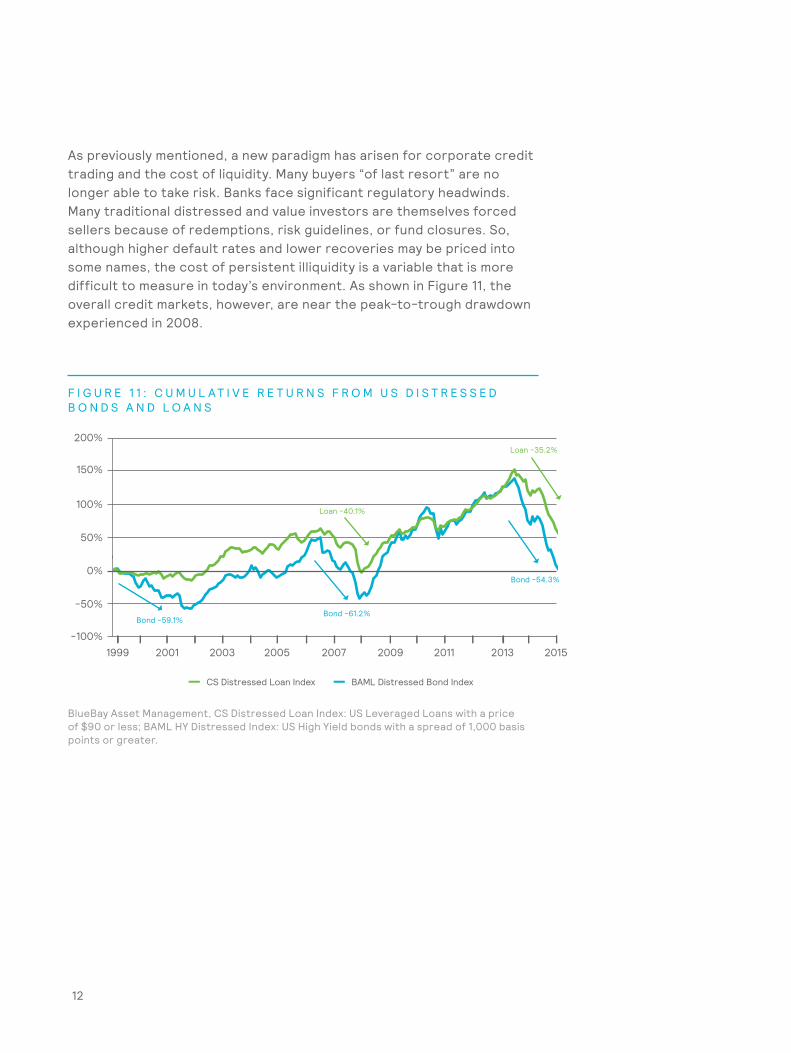
As previously mentioned, a new paradigm has arisen for corporate credit trading and the cost of liquidity. Many buyers “of last resort” are no longer able to take risk. Banks face significant regulatory headwinds. Many traditional distressed and value investors are themselves forced sellers because of redemptions, risk guidelines, or fund closures. So, although higher default rates and lower recoveries may be priced into some names, the cost of persistent illiquidity is a variable that is more difficult to measure in today’s environment. As shown in Figure 11, the overall credit markets, however, are near the peak-to-trough drawdown experienced in 2008.
F I G U R E 1 1 : C U M U L A T I V E R E T U R N S F R O M U S D I S T R E S S E D B O N D S A N D L O A N S
BlueBay Asset Management, CS Distressed Loan Index: US Leveraged Loans with a price of $90 or less; BAML HY Distressed Index: US High Yield bonds with a spread of 1,000 basis points or greater.
-100%
-50%
0%
100%
150%
50%
200%
CS Distressed Loan Index
Loan -40.1%
Loan -35.2%
Bond -54.3%
Bond -61.2%Bond -59.1%
BAML Distressed Bond Index
1999 2001 2003 2005 2007 2009 2011 20152013

W H E R E T O G O ?
Many macro risks are likely to persist. The stability of the capital markets depends on the gentle hand of the US Fed and fewer missteps by other central banks. Geopolitical risks abound. The China growth story, emerging markets weakness, and commodities/dollar pressure are all looming. The technicals for the corporate credit markets are poor. Defaults will eventually rise. Spread volatility is unlikely to abate.
However, amid all this negativity are opportunities. Although we do not believe we are near an absolute “buy signal,” it is worth remembering that credit spreads will often overshoot and price in an excessively negative outcome, such that a rally occurs once the event or default is realized. We are unlikely to be in a 2008-style scenario. Leverage is manageable, and although some industries are stressed, it is likely that access to capital will remain relatively accommodative. A general snap-up in prices is unlikely. Structural shifts in liquidity providers and Fed policy along with easier underwriting may extend the cycle and postpone the uptick in defaults or any lasting relief rally. Our base case is for a slow grind wider in spread or sideways trading rather than a quick retracement or mean reversion of the asset class. It is now, more than ever before, a “market of credits” rather than a “credit market,” affording those with rigorous research coupled with patience, capital, and flexibility the potential to generate very attractive returns.
It is at the darkest hour that opportunities present themselves. We therefore believe that it is time to begin to consider the structural changes and dislocations in the corporate credit markets and how best to capture the upside going forward. Through this process, the debt of stressed and distressed issuers will end up with owners best matched with the instruments’ risk.
First and foremost, the level of market liquidity has materially reduced for the foreseeable future. What was previously less liquid is no longer. Best practices for implementation of a credit strategy is to ensure that assets and liabilities are as closely matched as possible. In this environment, this calls for more patient capital and, often, longer locked vehicles, which allow for more flexibility. In fixed income, funds with a relatively unconstrained mandate may need to offer less liquidity to the end investor. In very distressed and event-driven scenarios and strategies, a committed capital drawdown vehicle better allows managers to be both more nimble and disciplined, allowing them to wait until sufficient compensation for the risk is evidenced. The fee arrangement providing a preferred return on many such committed capital structures also better aligns investors with managers — generally without a fee on undrawn capital. In traditional hedge funds, we advocate the use of managers who employ single-name longs and shorts and who adjust their net exposure to reduce the market cyclicality inherent in distressed investing, to increase diversification and potentially reduce the losses an interest rate increase would likely have in the higher rated securities.
Despite the uncertainty and volatility in credit markets, we believe it is an exciting time in which investors should focus on the risk and return characteristics of the underlying assets rather than just the structure and liquidity terms of the holding vehicle itself. Instruments that were previously bucketed in long-only, hedge fund, or private markets strategies are converging such that they might now be found in any of these structures.
13

C O N C L U S I O N
When assessing today’s credit markets, investors will need to consider carefully how they access the opportunity set, taking into account their return objectives, liquidity budget, time horizon, and threshold for mark-to-market losses. Although strategies targeting credit opportunities will vary significantly in their return objectives and liquidity terms, the following are some broad categories of strategies that may be worthy of consideration:
• Long-only “credit opportunities” funds. These strategies could be thought of as sitting farther up the risk/return spectrum and with less liquidity than traditional multi-asset credit funds. Some such funds may operate a private markets style drawdown arrangement for the investment of capital.
• Credit-oriented hedge funds. These strategies would have the flexibility to invest both long and short and may be described as “long/short credit,” “credit-oriented multi-strategy,” or “event driven” hedge funds. These strategies are likely to be less exposed to the “beta” of the opportunity and will rely to a greater extent on manager alpha than long-only credit opportunities funds.
• Private markets vehicles. Distressed debt funds will often form part of a diversified private markets portfolio, will typically focus on opportunities at the higher end of the risk/return spectrum, and will tend to offer the least liquidity to the end investor.
Return targets will vary significantly, but most of the strategies operating in this area will be aiming for high single-digit returns and above.
As credit conditions and the nature of the opportunity set evolve over the course of the year, we expect to remain active in researching the new strategies and structures that come to market. We look forward to discussing the opportunity and helping investors find the implementation route to suit their needs.
14

15
I M P O R TA N T N O T I C E S
© 2016 Mercer LLC. All rights reserved.
This contains confidential and proprietary information of Mercer and is intended for the exclusive use of the parties to whom it was provided by Mercer. Its content may not be modified, sold, or otherwise provided, in whole or in part, to any other person or entity without Mercer’s prior written permission.
This does not constitute an offer to purchase or sell any securities.Mercer does not provide tax or legal advice. You should contact your tax advisor, accountant, and/or attorney before making any decisions with tax or legal implications.
The findings, ratings, and/or opinions expressed herein are the intellectual property of Mercer and are subject to change without notice. They are not intended to convey any guarantees as to the future performance of the investment products, asset classes, or capital markets discussed. Past performance does not guarantee future results. Mercer’s ratings do not constitute individualized investment advice.
This does not contain investment advice relating to your particular circumstances. No investment decision should be made based on this information without first obtaining appropriate professional advice and considering your circumstances. Information contained herein has been obtained from a range of third-party sources. Although the information is believed to be reliable, Mercer has not sought to verify it independently. As such, Mercer makes no representations or warranties as to the accuracy of the information presented and takes no responsibility or liability (including for indirect, consequential, or incidental damages) for any error, omission, or inaccuracy in the data supplied by any third party.
For Mercer’s conflict of interest disclosures, contact your Mercer representative or see www.mercer.com/conflictsofinterest.

For further information, please contact your local Mercer office or visit our website atwww.mercer.com.
Copyright 2016 Mercer. All rights reserved. 21132-IC