health insurance coverage in oregon · health insurance coverage in oregon 2011 oregon health...
TRANSCRIPT
Office for Oregon Health Policy and Research
Health Insurance Coverage in Oregon 2011 Oregon Health Insurance Survey Statewide
Results
September 2011

Table of Contents
Executive Summary ................................................................................................................................ ii
2011 Health Insurance Coverage ........................................................................................................... 1
Figure 1: Oregon’s Rate of Uninsurance by Age Group ......................................................................... 1
Figure 2: Alternative Measures of Uninsurance in Oregon ..................................................................... 2
Figure 3: Sources of Insurance Coverage in Oregon .............................................................................. 3
Figure 4: Uninsurance Rate by Employment Status.................................................................................4
Figure 5: Uninsurance Rate by Age ........................................................................................................ 5
Figure 6: Uninsurance Rate by Family Income (FPL) ............................................................................. 5
Figure 7: Uninsurance Rate by Race & Ethnicity .................................................................................... 6
Figure 8: Uninsurance Rate by Educational Attainment of Non-Elderly Adult Oregonians ..................... 7
Appendix A: 2011 Statewide Coverage Statistics
Appendix B: About the Oregon Health Insurance Survey
Office for Oregon Health Policy and Research - Page i
Executive Summary The Oregon Health Authority’s Office for Health Policy & Research conducted a statewide population survey to study the health insurance coverage of Oregonians. This brief provides statewide results from the 2011 survey. Overall Oregonians continue to have a high rate of uninsurance in 2011, with 14.6 percent of the population being uninsured. The majority of those uninsured are adult Oregonians of working age (19 through 64), of whom one in five lack health insurance. Oregonians 18 years of age and under along with Oregonians 65 and over, who have more options for health insurance coverage, have far lower rates of uninsurance, 5.6 and 0.9 percent respectively. Health insurance coverage is primarily provided through ones employment and therefore it’s not surprising that nearly half of the unemployed are uninsured. However, employment does not guarantee health insurance with the survey finding that the majority of the uninsured being employed. With the exception of children (18 and under), the survey finds uninsurance rates decrease with increases in age and income. Racial/Ethnic disparities in health insurance coverage also persist. Nearly one in five Oregonians who self-identify as Black and one in four Oregonians who self-identify as Hispanic/Latino are uninsured, while one in seven self-identified White Oregonians are uninsured.
Page ii - Office for Oregon Health Policy and Research
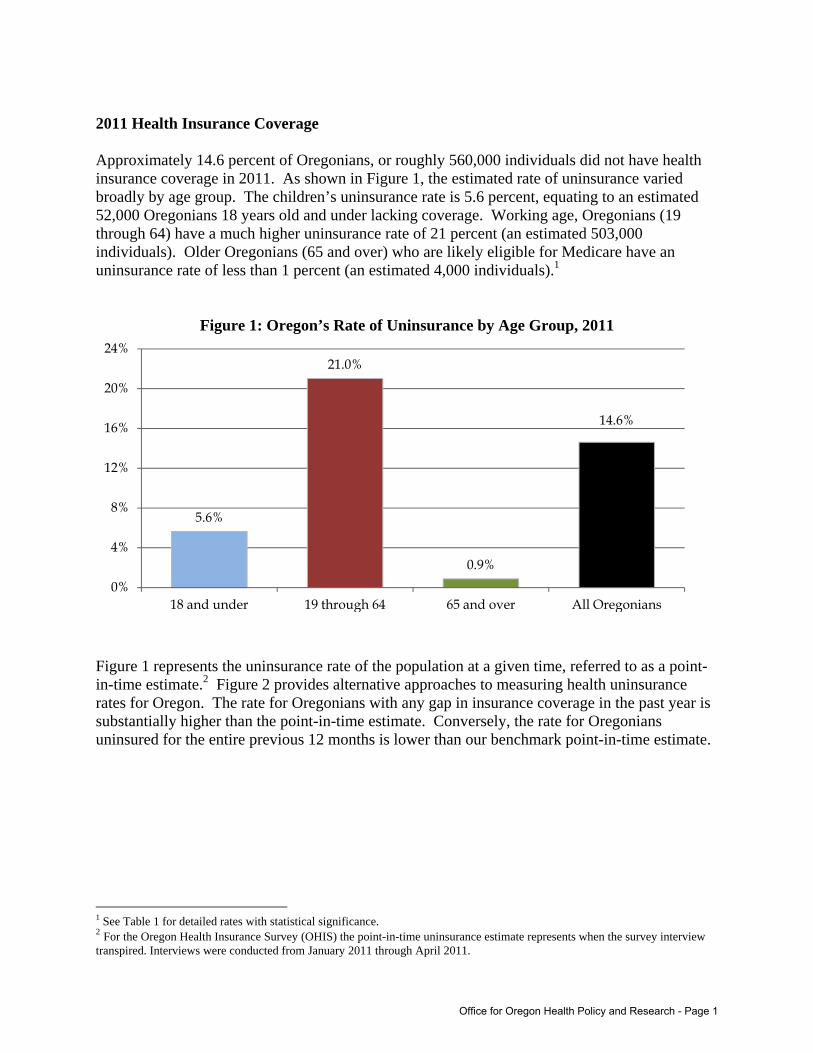
2011 Health Insurance Coverage Approximately 14.6 percent of Oregonians, or roughly 560,000 individuals did not have health insurance coverage in 2011. As shown in Figure 1, the estimated rate of uninsurance varied broadly by age group. The children’s uninsurance rate is 5.6 percent, equating to an estimated 52,000 Oregonians 18 years old and under lacking coverage. Working age, Oregonians (19 through 64) have a much higher uninsurance rate of 21 percent (an estimated 503,000 individuals). Older Oregonians (65 and over) who are likely eligible for Medicare have an uninsurance rate of less than 1 percent (an estimated 4,000 individuals).1
Figure 1: Oregon’s Rate of Uninsurance by Age Group, 2011
Figure 1 represents the uninsurance rate of the population at a given time, referred to as a point-in-time estimate.2 Figure 2 provides alternative approaches to measuring health uninsurance rates for Oregon. The rate for Oregonians with any gap in insurance coverage in the past year is substantially higher than the point-in-time estimate. Conversely, the rate for Oregonians uninsured for the entire previous 12 months is lower than our benchmark point-in-time estimate.
1 See Table 1 for detailed rates with statistical significance. 2 For the Oregon Health Insurance Survey (OHIS) the point-in-time uninsurance estimate represents when the survey interview transpired. Interviews were conducted from January 2011 through April 2011.
5.6%
21.0%
0.9%
14.6%
0%
4%
8%
12%
16%
20%
24%
18 and under 19 through 64 65 and over All Oregonians
Office for Oregon Health Policy and Research - Page 1
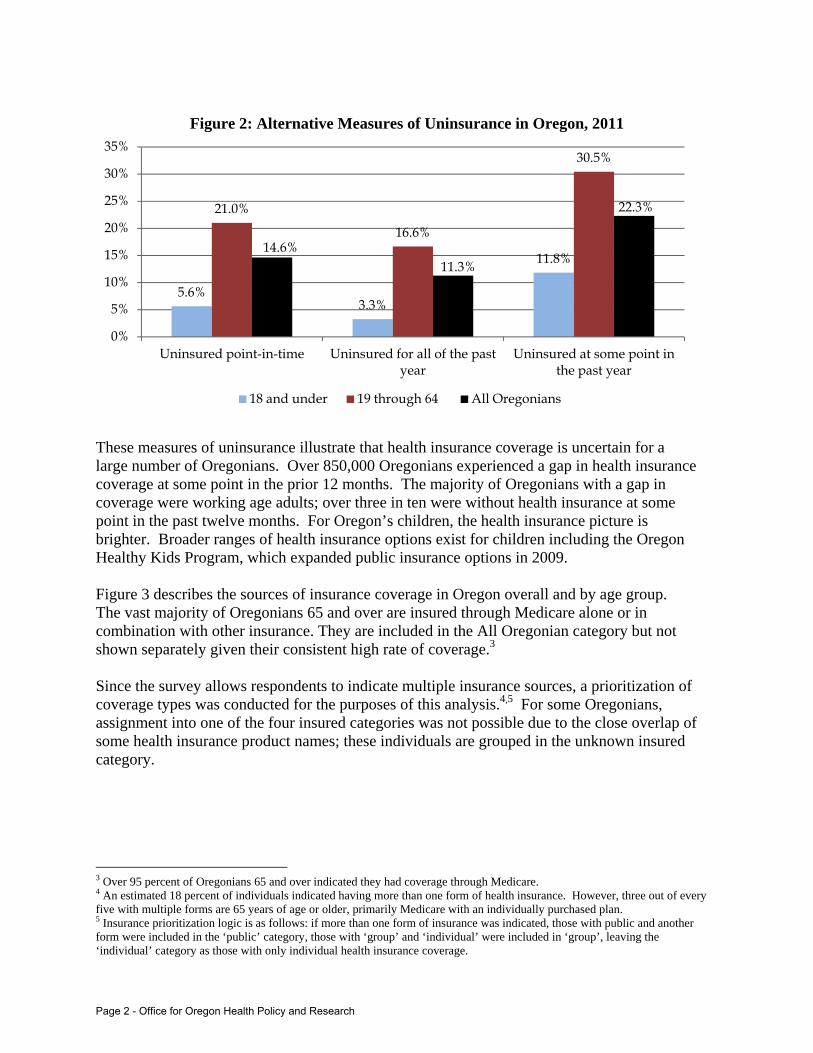
Figure 2: Alternative Measures of Uninsurance in Oregon, 2011
These measures of uninsurance illustrate that health insurance coverage is uncertain for a large number of Oregonians. Over 850,000 Oregonians experienced a gap in health insurance coverage at some point in the prior 12 months. The majority of Oregonians with a gap in coverage were working age adults; over three in ten were without health insurance at some point in the past twelve months. For Oregon’s children, the health insurance picture is brighter. Broader ranges of health insurance options exist for children including the Oregon Healthy Kids Program, which expanded public insurance options in 2009. Figure 3 describes the sources of insurance coverage in Oregon overall and by age group. The vast majority of Oregonians 65 and over are insured through Medicare alone or in combination with other insurance. They are included in the All Oregonian category but not shown separately given their consistent high rate of coverage.3 Since the survey allows respondents to indicate multiple insurance sources, a prioritization of coverage types was conducted for the purposes of this analysis.4,5 For some Oregonians, assignment into one of the four insured categories was not possible due to the close overlap of some health insurance product names; these individuals are grouped in the unknown insured category.
3 Over 95 percent of Oregonians 65 and over indicated they had coverage through Medicare. 4 An estimated 18 percent of individuals indicated having more than one form of health insurance. However, three out of every five with multiple forms are 65 years of age or older, primarily Medicare with an individually purchased plan. 5 Insurance prioritization logic is as follows: if more than one form of insurance was indicated, those with public and another form were included in the ‘public’ category, those with ‘group’ and ‘individual’ were included in ‘group’, leaving the ‘individual’ category as those with only individual health insurance coverage.
5.6%3.3%
11.8%
21.0%
16.6%
30.5%
14.6%11.3%
22.3%
0%
5%
10%
15%
20%
25%
30%
35%
Uninsured point-in-time Uninsured for all of the past year
Uninsured at some point in the past year
18 and under 19 through 64 All Oregonians
Page 2 - Office for Oregon Health Policy and Research
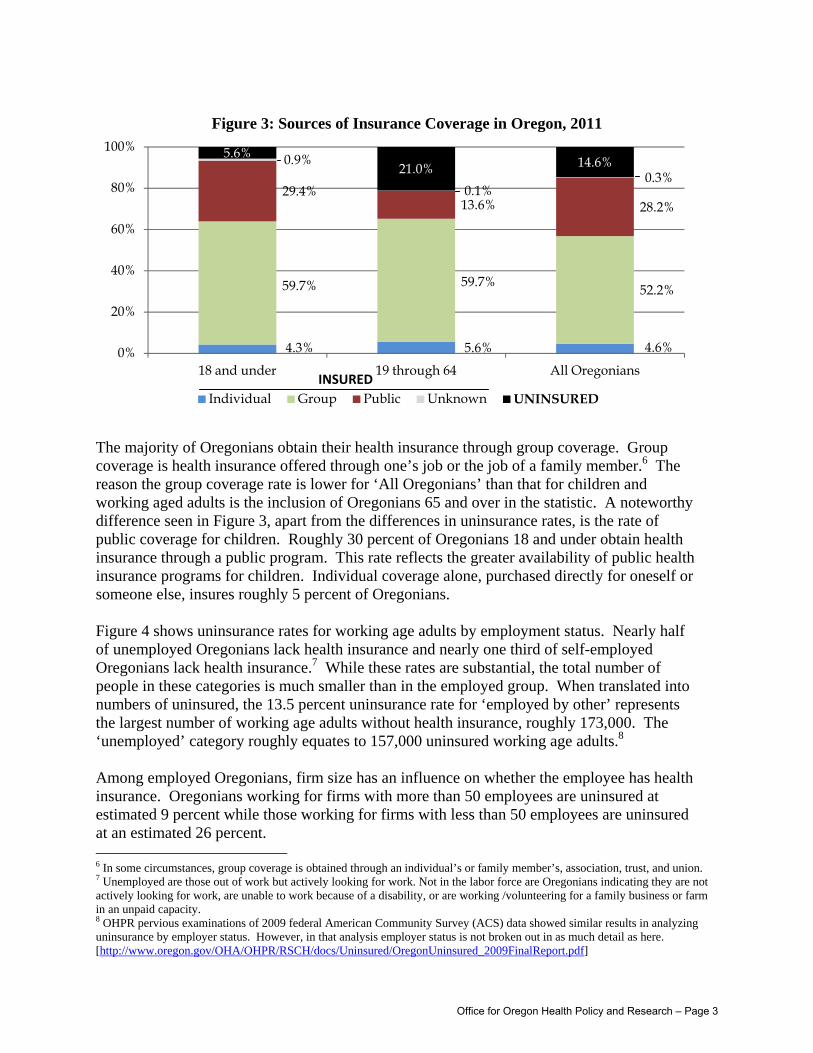
Figure 3: Sources of Insurance Coverage in Oregon, 2011
The majority of Oregonians obtain their health insurance through group coverage. Group coverage is health insurance offered through one’s job or the job of a family member.6 The reason the group coverage rate is lower for ‘All Oregonians’ than that for children and working aged adults is the inclusion of Oregonians 65 and over in the statistic. A noteworthy difference seen in Figure 3, apart from the differences in uninsurance rates, is the rate of public coverage for children. Roughly 30 percent of Oregonians 18 and under obtain health insurance through a public program. This rate reflects the greater availability of public health insurance programs for children. Individual coverage alone, purchased directly for oneself or someone else, insures roughly 5 percent of Oregonians. Figure 4 shows uninsurance rates for working age adults by employment status. Nearly half of unemployed Oregonians lack health insurance and nearly one third of self-employed Oregonians lack health insurance.7 While these rates are substantial, the total number of people in these categories is much smaller than in the employed group. When translated into numbers of uninsured, the 13.5 percent uninsurance rate for ‘employed by other’ represents the largest number of working age adults without health insurance, roughly 173,000. The ‘unemployed’ category roughly equates to 157,000 uninsured working age adults.8 Among employed Oregonians, firm size has an influence on whether the employee has health insurance. Oregonians working for firms with more than 50 employees are uninsured at estimated 9 percent while those working for firms with less than 50 employees are uninsured at an estimated 26 percent. 6 In some circumstances, group coverage is obtained through an individual’s or family member’s, association, trust, and union. 7 Unemployed are those out of work but actively looking for work. Not in the labor force are Oregonians indicating they are not actively looking for work, are unable to work because of a disability, or are working /volunteering for a family business or farm in an unpaid capacity. 8 OHPR pervious examinations of 2009 federal American Community Survey (ACS) data showed similar results in analyzing uninsurance by employer status. However, in that analysis employer status is not broken out in as much detail as here. [http://www.oregon.gov/OHA/OHPR/RSCH/docs/Uninsured/OregonUninsured_2009FinalReport.pdf]
4.3% 5.6% 4.6%
59.7% 59.7%52.2%
29.4%13.6% 28.2%
0.9%
0.1%0.3%
5.6%21.0% 14.6%
0%
20%
40%
60%
80%
100%
18 and under 19 through 64 All Oregonians
Individual Group Public Unknown UNINSURED INSURED
Office for Oregon Health Policy and Research – Page 3
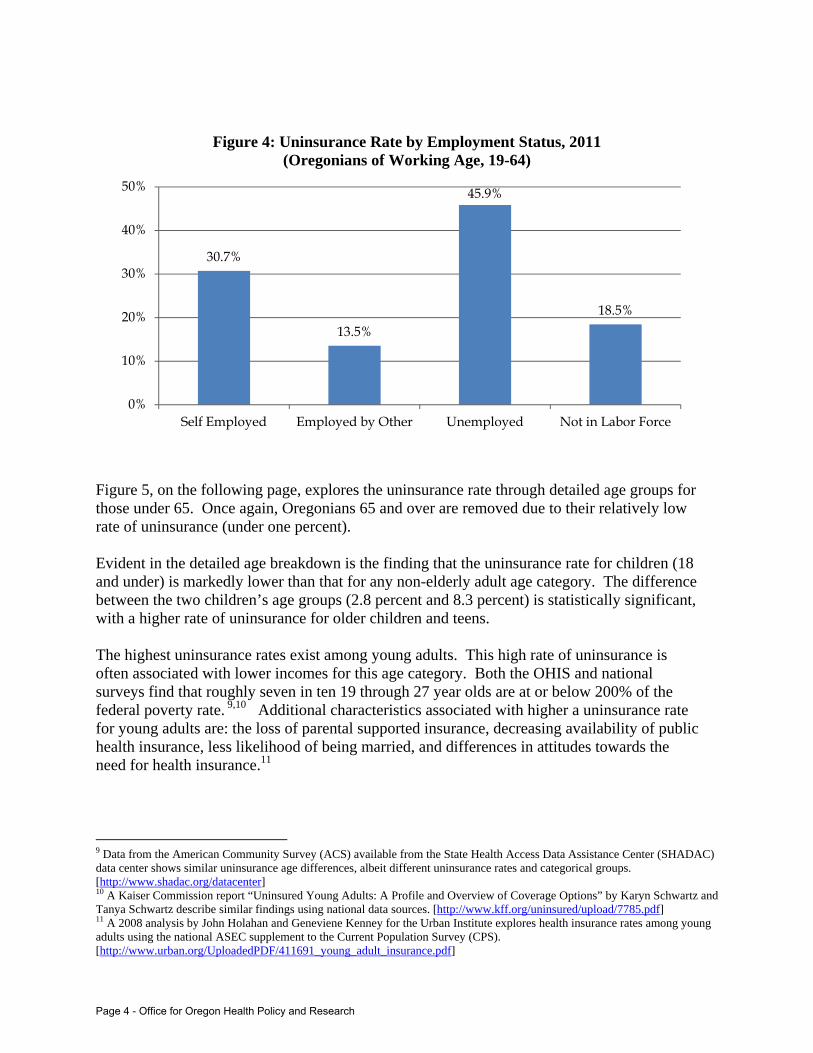
Figure 4: Uninsurance Rate by Employment Status, 2011 (Oregonians of Working Age, 19-64)
Figure 5, on the following page, explores the uninsurance rate through detailed age groups for those under 65. Once again, Oregonians 65 and over are removed due to their relatively low rate of uninsurance (under one percent). Evident in the detailed age breakdown is the finding that the uninsurance rate for children (18 and under) is markedly lower than that for any non-elderly adult age category. The difference between the two children’s age groups (2.8 percent and 8.3 percent) is statistically significant, with a higher rate of uninsurance for older children and teens. The highest uninsurance rates exist among young adults. This high rate of uninsurance is often associated with lower incomes for this age category. Both the OHIS and national surveys find that roughly seven in ten 19 through 27 year olds are at or below 200% of the federal poverty rate. 9,10 Additional characteristics associated with higher a uninsurance rate for young adults are: the loss of parental supported insurance, decreasing availability of public health insurance, less likelihood of being married, and differences in attitudes towards the need for health insurance.11
9 Data from the American Community Survey (ACS) available from the State Health Access Data Assistance Center (SHADAC) data center shows similar uninsurance age differences, albeit different uninsurance rates and categorical groups. [http://www.shadac.org/datacenter] 10 A Kaiser Commission report “Uninsured Young Adults: A Profile and Overview of Coverage Options” by Karyn Schwartz and Tanya Schwartz describe similar findings using national data sources. [http://www.kff.org/uninsured/upload/7785.pdf] 11 A 2008 analysis by John Holahan and Geneviene Kenney for the Urban Institute explores health insurance rates among young adults using the national ASEC supplement to the Current Population Survey (CPS). [http://www.urban.org/UploadedPDF/411691_young_adult_insurance.pdf]
30.7%
13.5%
45.9%
18.5%
0%
10%
20%
30%
40%
50%
Self Employed Employed by Other Unemployed Not in Labor Force
Page 4 - Office for Oregon Health Policy and Research
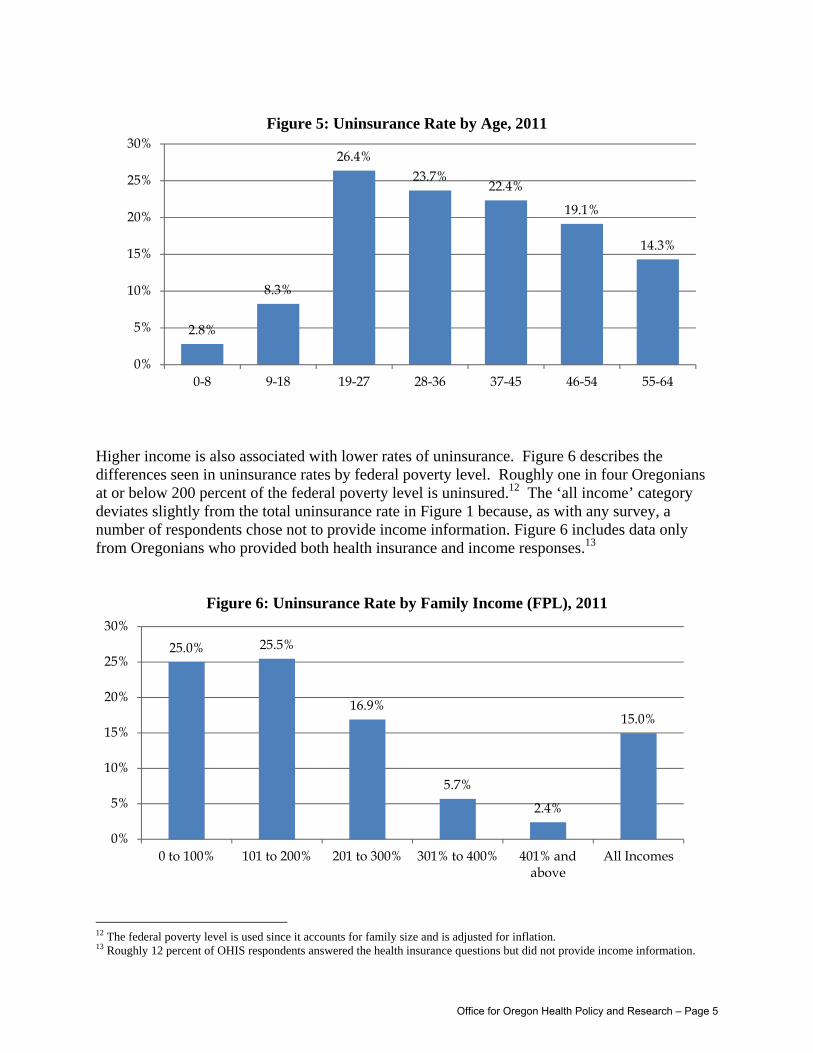
Figure 5: Uninsurance Rate by Age, 2011
Higher income is also associated with lower rates of uninsurance. Figure 6 describes the differences seen in uninsurance rates by federal poverty level. Roughly one in four Oregonians at or below 200 percent of the federal poverty level is uninsured.12 The ‘all income’ category deviates slightly from the total uninsurance rate in Figure 1 because, as with any survey, a number of respondents chose not to provide income information. Figure 6 includes data only from Oregonians who provided both health insurance and income responses.13
Figure 6: Uninsurance Rate by Family Income (FPL), 2011
12 The federal poverty level is used since it accounts for family size and is adjusted for inflation. 13 Roughly 12 percent of OHIS respondents answered the health insurance questions but did not provide income information.
2.8%
8.3%
26.4%23.7%
22.4%
19.1%
14.3%
0%
5%
10%
15%
20%
25%
30%
0-8 9-18 19-27 28-36 37-45 46-54 55-64
25.0% 25.5%
16.9%
5.7%
2.4%
15.0%
0%
5%
10%
15%
20%
25%
30%
0 to 100% 101 to 200% 201 to 300% 301% to 400% 401% and above
All Incomes
Office for Oregon Health Policy and Research – Page 5
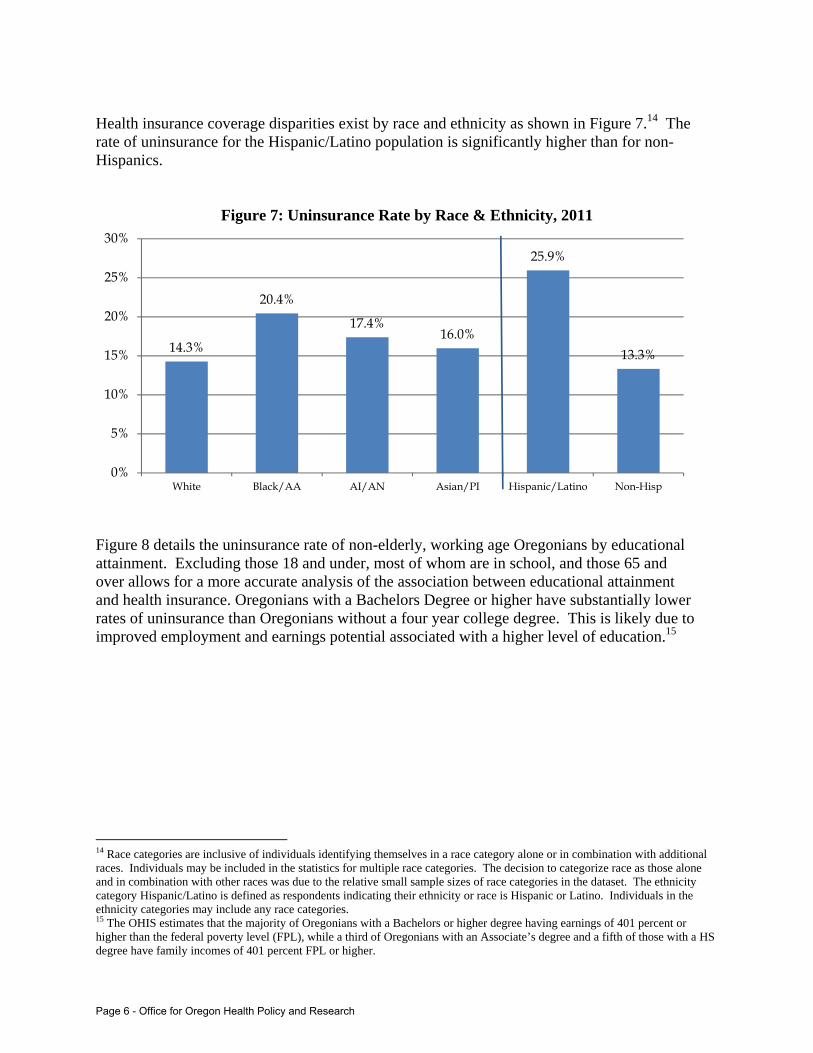
Health insurance coverage disparities exist by race and ethnicity as shown in Figure 7.14 The rate of uninsurance for the Hispanic/Latino population is significantly higher than for non-Hispanics.
Figure 7: Uninsurance Rate by Race & Ethnicity, 2011
Figure 8 details the uninsurance rate of non-elderly, working age Oregonians by educational attainment. Excluding those 18 and under, most of whom are in school, and those 65 and over allows for a more accurate analysis of the association between educational attainment and health insurance. Oregonians with a Bachelors Degree or higher have substantially lower rates of uninsurance than Oregonians without a four year college degree. This is likely due to improved employment and earnings potential associated with a higher level of education.15
14 Race categories are inclusive of individuals identifying themselves in a race category alone or in combination with additional races. Individuals may be included in the statistics for multiple race categories. The decision to categorize race as those alone and in combination with other races was due to the relative small sample sizes of race categories in the dataset. The ethnicity category Hispanic/Latino is defined as respondents indicating their ethnicity or race is Hispanic or Latino. Individuals in the ethnicity categories may include any race categories. 15 The OHIS estimates that the majority of Oregonians with a Bachelors or higher degree having earnings of 401 percent or higher than the federal poverty level (FPL), while a third of Oregonians with an Associate’s degree and a fifth of those with a HS degree have family incomes of 401 percent FPL or higher.
14.3%
20.4%
17.4%16.0%
25.9%
13.3%
0%
5%
10%
15%
20%
25%
30%
White Black/AA AI/AN Asian/PI Hispanic/Latino Non-Hisp
Page 6 - Office for Oregon Health Policy and Research
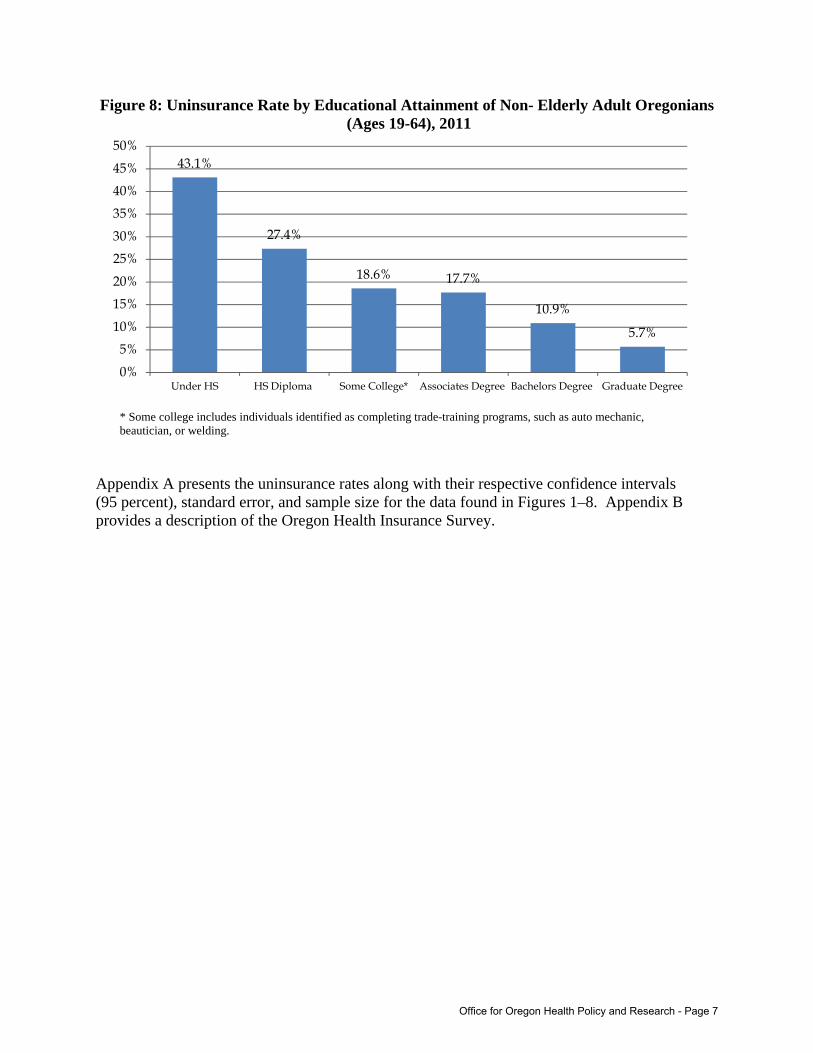
Figure 8: Uninsurance Rate by Educational Attainment of Non- Elderly Adult Oregonians (Ages 19-64), 2011
* Some college includes individuals identified as completing trade-training programs, such as auto mechanic,
beautician, or welding. Appendix A presents the uninsurance rates along with their respective confidence intervals (95 percent), standard error, and sample size for the data found in Figures 1–8. Appendix B provides a description of the Oregon Health Insurance Survey.
43.1%
27.4%
18.6% 17.7%
10.9%
5.7%
0%
5%
10%
15%
20%
25%
30%
35%
40%
45%
50%
Under HS HS Diploma Some College* Associates Degree Bachelors Degree Graduate Degree
Office for Oregon Health Policy and Research - Page 7

[THIS PAGE INTENTIONALLY LEFT BLANK]
Page 8 - Office for Oregon Health Policy and ResearchPage 8 - Office for Oregon Health Policy and Research
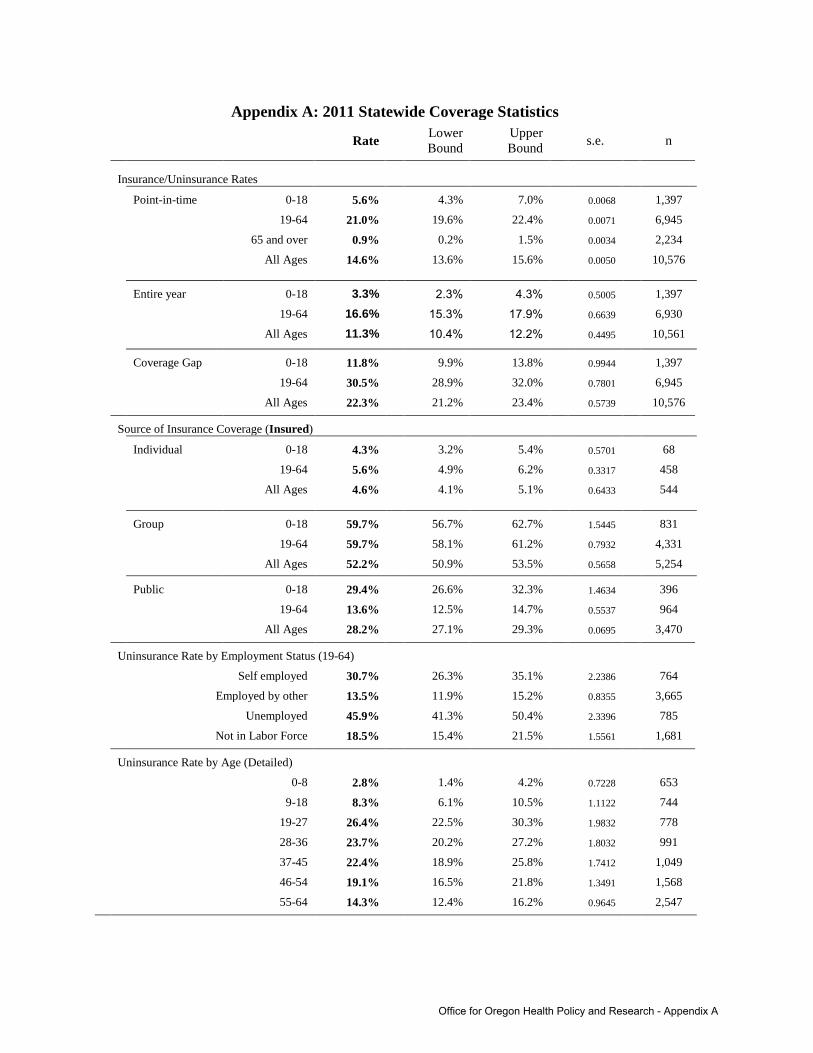
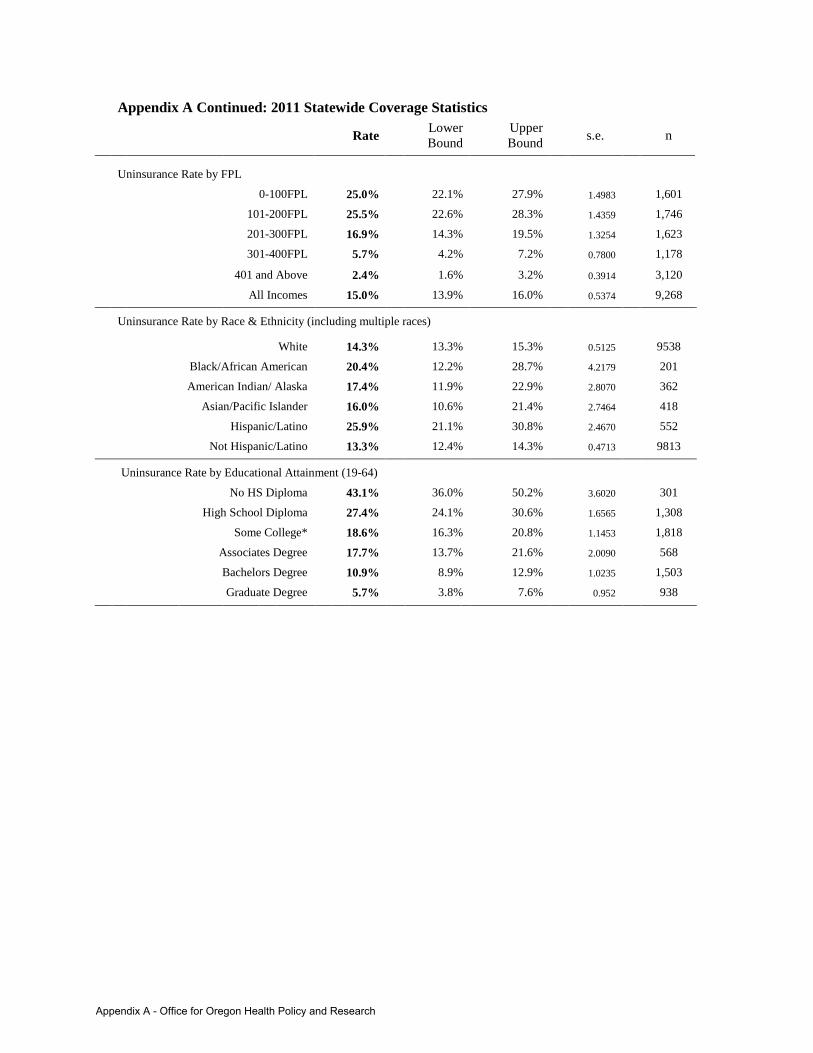
Appendix A: 2011 Statewide Coverage Statistics
Rate Lower Bound
Upper Bound s.e. n
Insurance/Uninsurance Rates
Point-in-time 0-18 5.6% 4.3% 7.0% 0.0068 1,397
19-64 21.0%
19.6% 22.4%
0.0071
6,945
65 and over 0.9%
0.2% 1.5%
0.0034
2,234
All Ages 14.6%
13.6% 15.6%
0.0050
10,576
Entire year 0-18 3.3%
2.3% 4.3%
0.5005
1,397
19-64 16.6%
15.3% 17.9%
0.6639
6,930
All Ages 11.3%
10.4% 12.2%
0.4495
10,561
Coverage Gap 0-18 11.8% 9.9% 13.8% 0.9944 1,397
19-64 30.5%
28.9% 32.0%
0.7801
6,945
All Ages 22.3%
21.2% 23.4%
0.5739
10,576
Source of Insurance Coverage (Insured)
Individual 0-18 4.3% 3.2% 5.4% 0.5701 68
19-64 5.6%
4.9% 6.2%
0.3317
458
All Ages 4.6%
4.1% 5.1%
0.6433
544
Group 0-18 59.7% 56.7% 62.7% 1.5445 831
19-64 59.7%
58.1% 61.2%
0.7932
4,331
All Ages 52.2%
50.9% 53.5%
0.5658
5,254
Public 0-18 29.4% 26.6% 32.3% 1.4634 396
19-64 13.6%
12.5% 14.7%
0.5537
964
All Ages 28.2%
27.1% 29.3%
0.0695
3,470
Uninsurance Rate by Employment Status (19-64)
Self employed 30.7%
26.3% 35.1%
2.2386
764
Employed by other 13.5%
11.9% 15.2%
0.8355
3,665
Unemployed 45.9%
41.3% 50.4%
2.3396
785
Not in Labor Force 18.5%
15.4% 21.5%
1.5561
1,681
Uninsurance Rate by Age (Detailed)
0-8 2.8%
1.4% 4.2%
0.7228
653
9-18 8.3%
6.1% 10.5%
1.1122
744
19-27 26.4%
22.5% 30.3%
1.9832
778
28-36 23.7%
20.2% 27.2%
1.8032
991
37-45 22.4%
18.9% 25.8%
1.7412
1,049
46-54 19.1%
16.5% 21.8%
1.3491
1,568
55-64 14.3%
12.4% 16.2%
0.9645
2,547
Office for Oregon Health Policy and Research - Appendix A
Appendix A Continued: 2011 Statewide Coverage Statistics
Rate Lower Bound
Upper Bound s.e. n
Uninsurance Rate by FPL
0-100FPL 25.0%
22.1% 27.9%
1.4983
1,601
101-200FPL 25.5%
22.6% 28.3%
1.4359
1,746
201-300FPL 16.9%
14.3% 19.5%
1.3254
1,623
301-400FPL 5.7%
4.2% 7.2%
0.7800
1,178
401 and Above 2.4%
1.6% 3.2%
0.3914
3,120
All Incomes 15.0%
13.9% 16.0%
0.5374
9,268
Uninsurance Rate by Race & Ethnicity (including multiple races)
White 14.3%
13.3% 15.3%
0.5125
9538
Black/African American 20.4%
12.2% 28.7%
4.2179
201
American Indian/ Alaska 17.4%
11.9% 22.9%
2.8070
362
Asian/Pacific Islander 16.0%
10.6% 21.4%
2.7464
418
Hispanic/Latino 25.9%
21.1% 30.8%
2.4670
552
Not Hispanic/Latino 13.3%
12.4% 14.3%
0.4713
9813
Uninsurance Rate by Educational Attainment (19-64)
No HS Diploma 43.1%
36.0% 50.2%
3.6020
301
High School Diploma 27.4%
24.1% 30.6%
1.6565
1,308
Some College* 18.6%
16.3% 20.8%
1.1453
1,818
Associates Degree 17.7%
13.7% 21.6%
2.0090
568
Bachelors Degree 10.9%
8.9% 12.9%
1.0235
1,503
Graduate Degree 5.7%
3.8% 7.6%
0.952
938
Appendix A - Office for Oregon Health Policy and Research
Appendix B: About the Oregon Health Insurance Survey The Oregon Health Insurance Survey (OHIS) is the largest survey of health insurance and health care access undertaken in Oregon. The survey, conducted over the first four months of 2011, interviewed a randomly selected sample of Oregonians. Over 10,500 Oregon households completed the survey, and the survey response rate was 40.4 percent. 16 The OHIS accounts for Oregon geographic, ethnic, and racially diverse populations via a complex sampling strategy including the use of 21 unique stratums. The survey questionnaire builds on the work of a number of other state surveys, most notably Minnesota and Massachusetts, which use similar questions in asking about detailed health insurance coverage.17 As an alternative to traditional telephone sampling and the difficulties with increased numbers of cell phone only households, the OHIS utilized a statewide address based sampling (ABS) design. Randomly chosen households were mailed letters indicating their residence had been chosen and were asked for their participation in the survey. Households could choose to take the survey over the phone, online, or via a written questionnaire. Phone surveys were conducted in English and Spanish. One randomly selected individual within the household provided detailed information on health insurance status, health care access and cost, and other health related topics. Additional household demographic information such as educational attainment, family income, housing tenure, and employment status was gathered. Statistical weights are used to ensure survey results are representative of Oregon’s population. Respondent data is weighted to be representative of the age, race/ethnicity, foreign-born, region, education attainment, and homeownership distribution of the state. For more information on the design, implementation, and methodology of the OHIS project please refer to the OHIS methodology report on the OHPR Health Insurance Coverage website. The Oregon Health Insurance Survey was funded through Oregon’s State Health Access Program grant from the U.S. Department of Health and Human Services, Health Resources and Services Administration.
16 A completed survey is defined as the respondents completing at a minimum the household health insurance question section of the survey. The response rate is constructed using the AAPOR RR4 calculation. 17 OHA worked closely with the State Health Access Data Assistance Center (SHADAC), utilizing many of the questions in their Coordinated State Coverage Survey (CSCS) in developing the OHIS. States using a similar health insurance question sequence include MN, CO, MA, and OK. SHADAC is an entity of the University of Minnesota and funded by The Robert Wood Johnson Foundation.
Office for Oregon Health Policy and Research - Appendix B