health impacts of air pollution in montenegro - un.org.me · health impacts of air pollution in...
TRANSCRIPT
5 January 2016
1
Healthimpactsofair
pollutioninMontenegro
Michal Krzyzanowski, Sc.D, Ph.D. Visiting Professor, King´s College London
Abstract
In the framework of collaboration between Montenegro and WHO, an analysis of existing national
data on air quality and health was performed to evaluate and quantify the impacts of air pollution on
health in Montenegro. The analysis focussed on cities of Podgorica, Niksic and Pljevlja, and used
health risk assessment methods recommended by WHO. This analysis indicates that over 250
premature deaths and 140 hospital admissions per year, and a number of other health outcomes are
associated with the exposure exceeding the level of particulate matter recommended by WHO air
quality guidelines. More than half of these effects are associated with elevated levels of pollution in
the winter caused mainly by combustion of solid fuels for heating. Occurrence of health effects of air
pollution in Pljevlja is more common than in the other two cities, but, due to larger population of
Podgorica and Niksic, absolute burden of pollution to health is similar in those cities to that in
Pljevlja. To reduce health effects of air pollution in cities of Montenegro, a significant decrease of
solid fuels combustion for household heating and cooking is necessary.
Contents
Introduction ..................................................................................................................................... 2
Methods for assessing health impacts of air pollution ................................................................... 4
Air quality in Montenegro ............................................................................................................... 6
Impacts of air pollution on health in Montenegro ........................................................................ 14
Discussion ...................................................................................................................................... 20
Conclusions .................................................................................................................................... 22
Acknowledgements ....................................................................................................................... 22
Annex 1. Additional PM10 and PM2.5 measurements in Podgorica ............................................ 23
Annex 2. Life expectancy loss by age ............................................................................................ 24
5 January 2016
2
Introduction Objectives of the assessment
Assessment of air quality conducted routinely by national authorities in Montenegro indicates that concentration of air pollution, especially of particulate matter, regularly exceeds legally allowed levels in Podgorica and in Pljevlja. This creates concern on the health effects of this pollution. WHO was requested to assist local authorities in evaluation and quantification of these effects in Montenegro, and in particular in Podgorica, Pljevlja and Niksic. This report summarizes the results of the assessment based on the analysis of existing data on air quality and on health status in those cities. Basic information on the evidence on health effects of air pollution and on methods for health risk assessment necessary for interpretation of the presented results is included in introductory parts of the report. The report summarizes also results of health impact assessment of air pollution in Montenegro published as a part of international analysis conducted by Global Burden of Disease project and by European Environment Agency.
Health effects of air pollution
Knowledge about health effects of low concentrations of common air pollutants has increased significantly over the last two decades. Recent WHO assessment of this evidence, conducted by the WHO project REVIHAAP1 concludes that a considerable amount of new scientific information on the adverse effects on health of particulate matter, ozone and nitrogen dioxide, observed at levels commonly present in Europe, has been published in recent years. This new evidence supports the scientific conclusions of the WHO air quality guidelines, last updated in 20052, and indicates that the effects in some cases occur at air pollution concentrations lower than those serving to establish these guidelines. It also provides scientific arguments for taking decisive actions to improve air quality and reduce the burden of disease associated with air pollution in Europe. Large body of evidence, emerging form tens of large cohort studies, other epidemiological and clinical research confirms the link between long and short term exposure to air pollution and health. Concentration of fine particulate matter (PM2.5, particles with diameter less than 2.5 µm) in ambient air appears to be an important indicator of air pollution health risks. Particulate matter causes development and progress of cardiovascular diseases, and increases mortality due to these diseases. It has been also found to be carcinogenic to humans and classified by IARC as Group 1 carcinogen. Coarse fraction of PM10 particles (PM10, particles less than 10 µm in diameter) increase incidence of respiratory diseases and contributes to increases in mortality. A variety of air pollution sources has been associated with various health effects. Coal and wood combustion for energy production by electric power plants or industrial boilers and in houses for residential heating belongs to major sources of pollution and of health problems associated with it3. Emissions form road transport, especially diesel engine exhausts, make important contribution to air pollution in cities increasing levels of particulate matter and nitrogen oxides (NO and NO2). Besides direct adverse effects of those gases on health, they contribute to creation of ozone (O3) in a chain of photochemical reactions occurring in the atmosphere. Ozone is a highly reactive gas and exposure to its increased levels has been associated with increases in mortality and morbidity. It has also a range of adverse
1 WHO 2013. http://www.euro.who.int/en/health-topics/environment-and-health/air-
quality/publications/2013/review-of-evidence-on-health-aspects-of-air-pollution-revihaap-project-final-technical-report 2 WHO 2006. http://www.euro.who.int/en/health-topics/environment-and-health/air-
quality/publications/pre2009/air-quality-guidelines.-global-update-2005.-particulate-matter,-ozone,-nitrogen-dioxide-and-sulfur-dioxide 3 WHO 2015 http://www.euro.who.int/en/health-topics/environment-and-health/air-
quality/publications/2015/residential-heating-with-wood-and-coal-health-impacts-and-policy-options-in-europe-and-north-america
5 January 2016
3
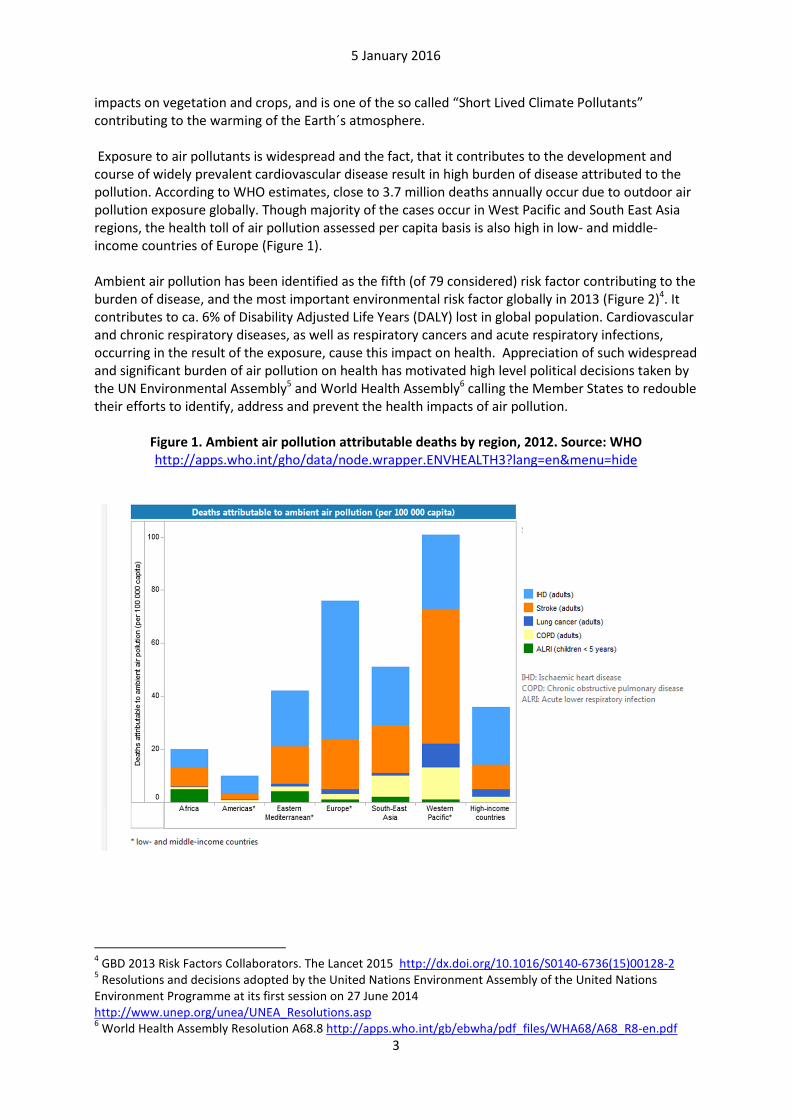
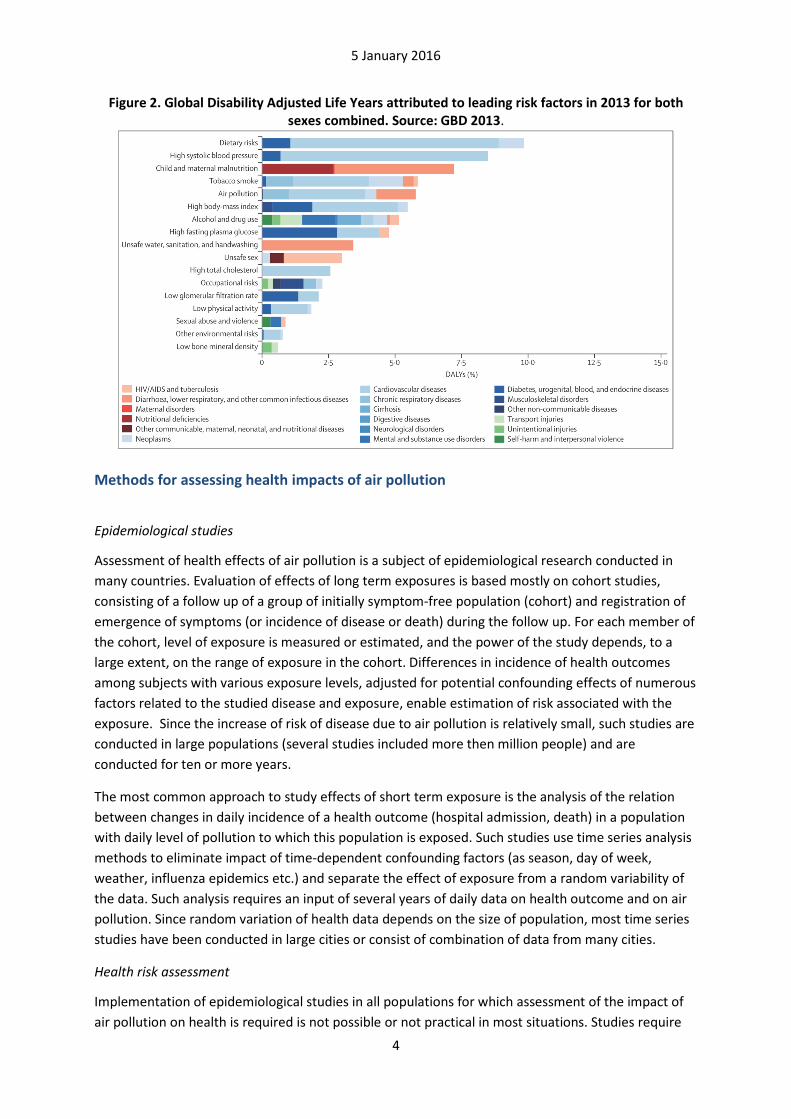
impacts on vegetation and crops, and is one of the so called “Short Lived Climate Pollutants” contributing to the warming of the Earth´s atmosphere. Exposure to air pollutants is widespread and the fact, that it contributes to the development and course of widely prevalent cardiovascular disease result in high burden of disease attributed to the pollution. According to WHO estimates, close to 3.7 million deaths annually occur due to outdoor air pollution exposure globally. Though majority of the cases occur in West Pacific and South East Asia regions, the health toll of air pollution assessed per capita basis is also high in low- and middle-income countries of Europe (Figure 1). Ambient air pollution has been identified as the fifth (of 79 considered) risk factor contributing to the burden of disease, and the most important environmental risk factor globally in 2013 (Figure 2)4. It contributes to ca. 6% of Disability Adjusted Life Years (DALY) lost in global population. Cardiovascular and chronic respiratory diseases, as well as respiratory cancers and acute respiratory infections, occurring in the result of the exposure, cause this impact on health. Appreciation of such widespread and significant burden of air pollution on health has motivated high level political decisions taken by the UN Environmental Assembly5 and World Health Assembly6 calling the Member States to redouble their efforts to identify, address and prevent the health impacts of air pollution.
Figure 1. Ambient air pollution attributable deaths by region, 2012. Source: WHO http://apps.who.int/gho/data/node.wrapper.ENVHEALTH3?lang=en&menu=hide
4 GBD 2013 Risk Factors Collaborators. The Lancet 2015 http://dx.doi.org/10.1016/S0140-6736(15)00128-2
5 Resolutions and decisions adopted by the United Nations Environment Assembly of the United Nations
Environment Programme at its first session on 27 June 2014 http://www.unep.org/unea/UNEA_Resolutions.asp 6 World Health Assembly Resolution A68.8 http://apps.who.int/gb/ebwha/pdf_files/WHA68/A68_R8-en.pdf
5 January 2016
4
Figure 2. Global Disability Adjusted Life Years attributed to leading risk factors in 2013 for both
sexes combined. Source: GBD 2013.
Methods for assessing health impacts of air pollution
Epidemiological studies
Assessment of health effects of air pollution is a subject of epidemiological research conducted in
many countries. Evaluation of effects of long term exposures is based mostly on cohort studies,
consisting of a follow up of a group of initially symptom-free population (cohort) and registration of
emergence of symptoms (or incidence of disease or death) during the follow up. For each member of
the cohort, level of exposure is measured or estimated, and the power of the study depends, to a
large extent, on the range of exposure in the cohort. Differences in incidence of health outcomes
among subjects with various exposure levels, adjusted for potential confounding effects of numerous
factors related to the studied disease and exposure, enable estimation of risk associated with the
exposure. Since the increase of risk of disease due to air pollution is relatively small, such studies are
conducted in large populations (several studies included more then million people) and are
conducted for ten or more years.
The most common approach to study effects of short term exposure is the analysis of the relation
between changes in daily incidence of a health outcome (hospital admission, death) in a population
with daily level of pollution to which this population is exposed. Such studies use time series analysis
methods to eliminate impact of time-dependent confounding factors (as season, day of week,
weather, influenza epidemics etc.) and separate the effect of exposure from a random variability of
the data. Such analysis requires an input of several years of daily data on health outcome and on air
pollution. Since random variation of health data depends on the size of population, most time series
studies have been conducted in large cities or consist of combination of data from many cities.
Health risk assessment
Implementation of epidemiological studies in all populations for which assessment of the impact of
air pollution on health is required is not possible or not practical in most situations. Studies require
5 January 2016
5
more time and resources than often available. Therefore health risk assessment (HRA) methods are
used instead. They consist of quantification of health impacts based on the knowledge of the level of
exposure in target population, relationship between health outcome and exposure (concentration-
response function, CRF) and baseline incidence of the health outcome of interest in the target
population. The review of the HRA methods has been recently conducted by WHO7. This review
contains also an evaluation of several software tools available for implementation of the analysis
including WHO software tool AirQ (which is currently updated and revised by WHO) as well as the
APHEKOM tool8. The latter has been used in the analysis estimating effects of the exposure to PM in
Podgorica, Niksic and Pljevlja conducted to prepare this report.
Epidemiological studies are the main source of risk estimates showing increase of the incidence of
health outcome per unit change in exposure level. These estimates are associated with an error of
assessment which only in part can be controlled by study design or in analysis. To minimize this error,
a systematic review of all available studies and a meta-analysis of their results is conducted
estimating an average risk (or concentration-risk functions, CRFs), based on all available evidence.
Recent WHO project summarized results of such systematic reviews and recommended CRFs to be
used in risk assessment of air pollution in Europe9. Based on the concentration-response function,
relative risk (RR) for the observed level of target population exposure is calculated.
Main outcome of the HRA is an estimate of proportion of disease attributable to the exposure in a
target population. In the simplest case, for an exposed population with risk of a disease RR in relation
to a population free of the exposure (or at a “reference” exposure level), attributable proportion is
calculated as:
AP= (RR-1)/RR
When the number of cases of the disease in the population, M, is known, number of cases
attributable to the exposure is AP*M.
Various assessments may use different input data on exposure or health effects, different CRFs and
make different assumptions concerning the reference exposure levels. This may result in different
estimates of the impact of exposure. Those differences should be always interpreted in the context
of the assumptions made. Furthermore, the parameters of HRA are usually estimated with certain
degree of uncertainty. If such uncertainty can be quantified, its magnitude can be used in estimation
of the impact. In such cases, the analysis results are presented as a range, instead of one central
value. The most commonly available is the confidence interval of the relative risk estimate, produced
by epidemiological studies or their meta-analysis. Less common, and rarely included in the analysis, is
the uncertainty or variance of the population exposure level. Such variance, however, exists in most
real situations, effectively increasing the uncertainty of the assessment and the range containing true
magnitude of the impact.
7 WHO 2014. http://www.euro.who.int/en/health-topics/environment-and-health/air-
quality/publications/2014/who-expert-meeting-methods-and-tools-for-assessing-the-health-risks-of-air-pollution-at-local,-national-and-international-level 8 http://www.aphekom.org/web/aphekom.org/publications
9 WHO 2013. http://www.euro.who.int/en/health-topics/environment-and-health/air-
quality/publications/2013/health-risks-of-air-pollution-in-europe-hrapie-project.-recommendations-for-
concentrationresponse-functions-for-costbenefit-analysis-of-particulate-matter,-ozone-and-nitrogen-dioxide
5 January 2016
6
Exposure of population to air pollution is assessed on the basis of data on air quality, usually
collected by national air quality monitoring networks. To reduce the risk that the exposure estimates
are biased, the data from urban background locations measuring pollution in residential areas are
preferred. Such data correspond the best with average exposure of the population.
Air quality in Montenegro Air quality in cities of Montenegro
This assessment is based on the data from the national air quality monitoring network operated by
the Center for Eco-Toxicological Research (CETI) in Podgorica. Daily data on concentrations ofPM10,
PM2.5, NO2, SO2 and ozone, as well as the levels of several metals and organic compounds in PM is
available for the period 2009-2014 though the set of parameters measured and periods of data
availability are different for various cities. In each of the cities, only one automatic station is
operated. This makes impossible an assessment of spatial variability of pollution within the city area
and makes the estimates of population exposure more vulnerable to the local conditions at the
monitoring location. Short visual evaluation of the monitoring locations performed during site visits
indicates that the measurements of pollutants in Podgorica and Niksic are probably not significantly
affected by local conditions and should reflect average levels of pollutants in the cities rather well10.
Monitoring station in Pljevlja is located in direct proximity to municipal boiler (ca 15 m from the
building, just under its 20 m high chimney). Such surrounding of the monitor may increase the error
in an estimate of average exposure level of Pljevlja population. On the other hand, the station is in
the very centre of the city and the smoke form the boiler´s chimney is directly affecting all houses
surrounding it. Since coal and wood are used in all houses (also apartment blocks), it can be assumed
that emissions from their chimneys cause similar exposure as that from the municipal boiler
chimney.
Annual mean concentration of PM10 in Pljevlja is ca. twice as high as in Podgorica or Bar.
Concentrations in Niksic are in the middle of the range, and only there a declining trend in
concentrations can be noticed. (Figure 3). WHO air quality guidelines level (20 µg/m³) is exceeded in
all cities.
In Pljevlja, Niksic and Podgorica, daily mean concentration of PM10 exceeded 50 µg/m³ on 64-217
days per year, markedly more often than allowed by EU AQ directive (35 days/year) or recommended
by WHO AQ guidelines (3 days/year) (Figure 4).
10
Short study was made by CETI in the end of October 2015 to compare the results of measurements done in fixed monitoring location and in urban background location in Podgorica. The results are shown in Annex 1.

5 January 2016
7
Figure 3. Annual mean PM10 levels based on data from national AQ monitoring network, 2009-
2014
Figure 4. Number of days per year with PM10>50 µg/m³ based on data from national AQ
monitoring network, 20012-2014
Also annual mean PM2.5 concentrations, measured in four cities (but not in Podgorica) in years 2012-
2014, markedly exceed WHO AQG level (10 µg/m³) (Figure 5). Concentrations in Pljevlja exceed also
EU limit value of 25 µg/m³.
0
20
40
60
80
100
120
2009 2010 2011 2012 2013 2014
An
nu
al
me
an
PM
10
, µ
g/m
³
Podgorica
Pljevlja
Niksic
Bar
0
50
100
150
200
250
Podgorica Pljevlja Niksic Bar
Nu
mb
er
of
da
ys
/ y
ea
r
2012
2013
2014
5 January 2016
8
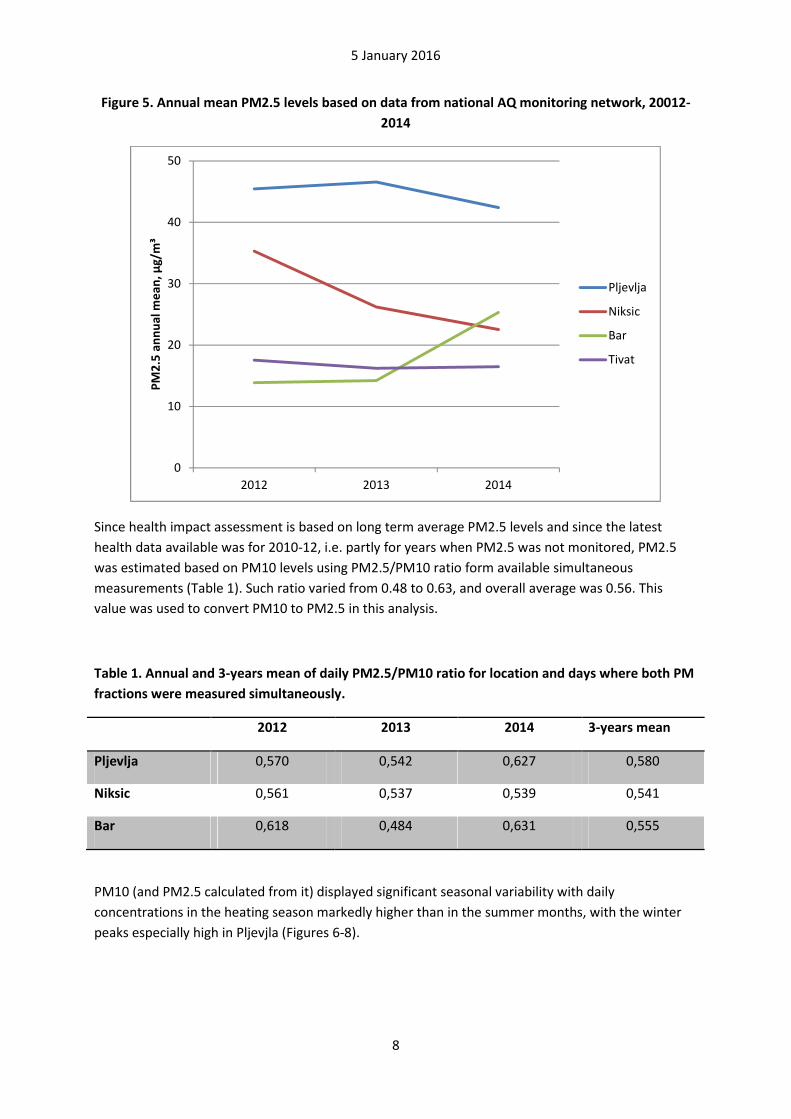
Figure 5. Annual mean PM2.5 levels based on data from national AQ monitoring network, 20012-
2014
Since health impact assessment is based on long term average PM2.5 levels and since the latest
health data available was for 2010-12, i.e. partly for years when PM2.5 was not monitored, PM2.5
was estimated based on PM10 levels using PM2.5/PM10 ratio form available simultaneous
measurements (Table 1). Such ratio varied from 0.48 to 0.63, and overall average was 0.56. This
value was used to convert PM10 to PM2.5 in this analysis.
Table 1. Annual and 3-years mean of daily PM2.5/PM10 ratio for location and days where both PM
fractions were measured simultaneously.
2012 2013 2014 3-years mean
Pljevlja 0,570 0,542 0,627 0,580
Niksic 0,561 0,537 0,539 0,541
Bar 0,618 0,484 0,631 0,555
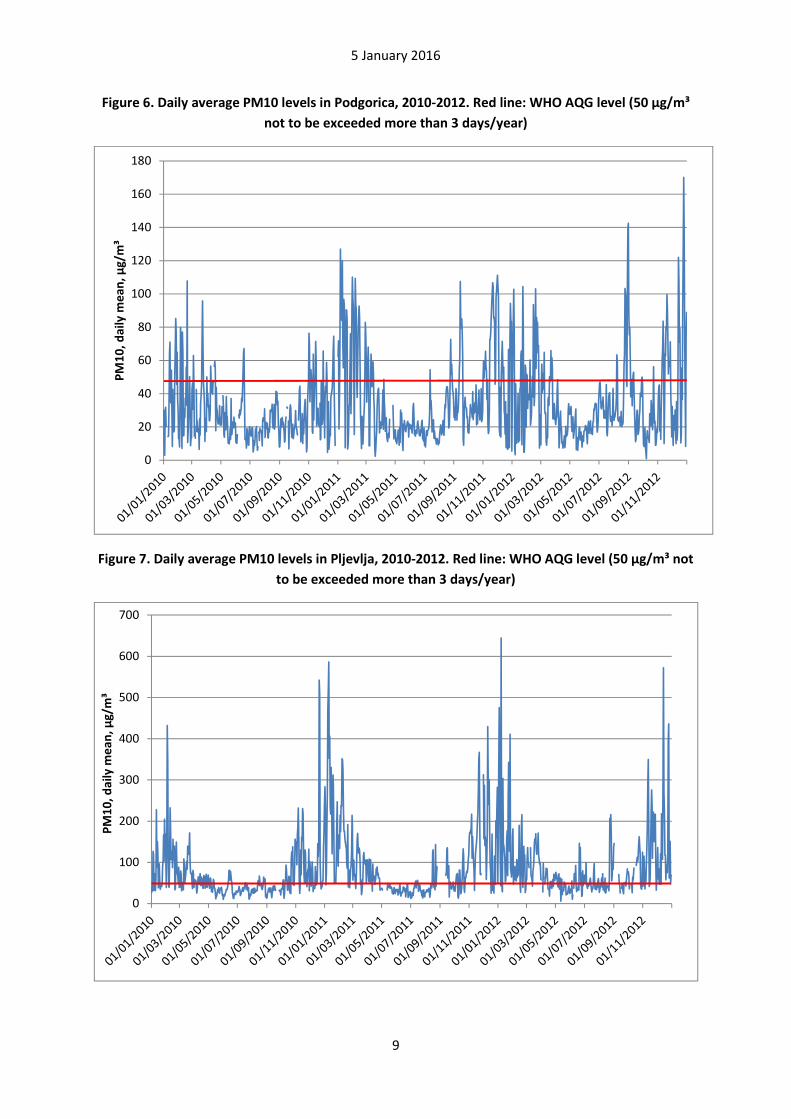
PM10 (and PM2.5 calculated from it) displayed significant seasonal variability with daily
concentrations in the heating season markedly higher than in the summer months, with the winter
peaks especially high in Pljevjla (Figures 6-8).
0
10
20
30
40
50
2012 2013 2014
PM
2.5
an
nu
al
me
an
, µ
g/m
³
Pljevlja
Niksic
Bar
Tivat
5 January 2016
9
Figure 6. Daily average PM10 levels in Podgorica, 2010-2012. Red line: WHO AQG level (50 µg/m³
not to be exceeded more than 3 days/year)
Figure 7. Daily average PM10 levels in Pljevlja, 2010-2012. Red line: WHO AQG level (50 µg/m³ not
to be exceeded more than 3 days/year)
0
20
40
60
80
100
120
140
160
180
PM
10
, d
ail
y m
ea
n,
µg
/m³
0
100
200
300
400
500
600
700
PM
10
, d
ail
y m
ea
n,
µg
/m³
5 January 2016
10
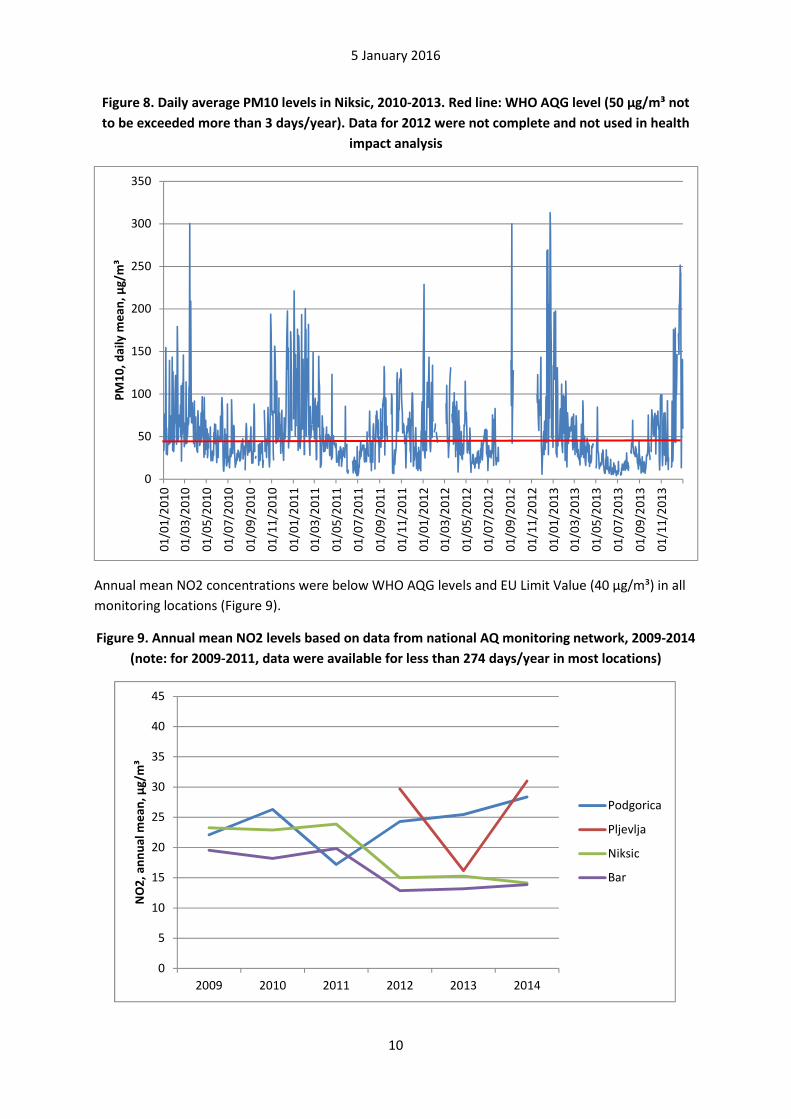
Figure 8. Daily average PM10 levels in Niksic, 2010-2013. Red line: WHO AQG level (50 µg/m³ not
to be exceeded more than 3 days/year). Data for 2012 were not complete and not used in health
impact analysis
Annual mean NO2 concentrations were below WHO AQG levels and EU Limit Value (40 µg/m³) in all
monitoring locations (Figure 9).
Figure 9. Annual mean NO2 levels based on data from national AQ monitoring network, 2009-2014
(note: for 2009-2011, data were available for less than 274 days/year in most locations)
0
50
100
150
200
250
300
350
01
/01
/20
10
01
/03
/20
10
01
/05
/20
10
01
/07
/20
10
01
/09
/20
10
01
/11
/20
10
01
/01
/20
11
01
/03
/20
11
01
/05
/20
11
01
/07
/20
11
01
/09
/20
11
01
/11
/20
11
01
/01
/20
12
01
/03
/20
12
01
/05
/20
12
01
/07
/20
12
01
/09
/20
12
01
/11
/20
12
01
/01
/20
13
01
/03
/20
13
01
/05
/20
13
01
/07
/20
13
01
/09
/20
13
01
/11
/20
13
PM
10
, d
ail
y m
ea
n,
µg
/m³
0
5
10
15
20
25
30
35
40
45
2009 2010 2011 2012 2013 2014
NO
2,
an
nu
al
me
an
, µ
g/m
³
Podgorica
Pljevlja
Niksic
Bar

5 January 2016
11
Concentration of sulfur dioxide has not exceeded daily mean of 20 µg/m³ (WHO AQG level) on more
than a few days in Podgorica, Niksic and Bar during all period when it was monitored. However in
Pljevlja, AQG level as well as the WHO Interim Target 2 of 50 µg/m³ were exceeded on many days in
all years when SO2 data was available (Table2). WHO Interim Target 1 (125 µg/m³) was not
exceeded.
Table 2. Sulfur dioxide concentrations in Pljevlja
2011 2013 2014
Annual mean (µg/m³) 13,76 26,9 29,9
Days >20 µm/m³ 77 122 168
Days >50 µm/m³ 11 50 54
Days >125 µm/m³ 0 0 0
High SO2 concentrations were noted mostly in winter season (Figure 10). This may reflect the impact
of coal combustion by the thermal power plant, communal and industrial boilers as well as
households, combined with the weather conditions reducing ventilation of the city area in winter
months. Daily mean SO2 concentrations were highly correlated with daily PM2.5 levels (R=0.67 in
2013-2014).
Figure 10. Daily mean SO2 concentrations measured by the monitoring station in Pljevlja, 2013-
2014. Red line: WHO AQG level for 24 h mean (20 µg/m³).
Concentration of lead and cadmium in PM10 samples collected in Podgorica, Pljevlja and Niksic were
clearly below WHO AQG levels. Annual mean concentrations of BaP (an indicator of polycyclic
0
20
40
60
80
100
120
140
01
/01
/20
13
01
/02
/20
13
01
/03
/20
13
01
/04
/20
13
01
/05
/20
13
01
/06
/20
13
01
/07
/20
13
01
/08
/20
13
01
/09
/20
13
01
/10
/20
13
01
/11
/20
13
01
/12
/20
13
01
/01
/20
14
01
/02
/20
14
01
/03
/20
14
01
/04
/20
14
01
/05
/20
14
01
/06
/20
14
01
/07
/20
14
01
/08
/20
14
01
/09
/20
14
01
/10
/20
14
01
/11
/20
14
01
/12
/20
14
SO
2,
da
ily
me
an
, µ
g/m
³
5 January 2016
12
aromatic hydrocarbons) were in the range 1-4 ng/m³. Such lifelong exposure creates risk of lung
cancer greater than one per 10 000.
Main sources of pollution
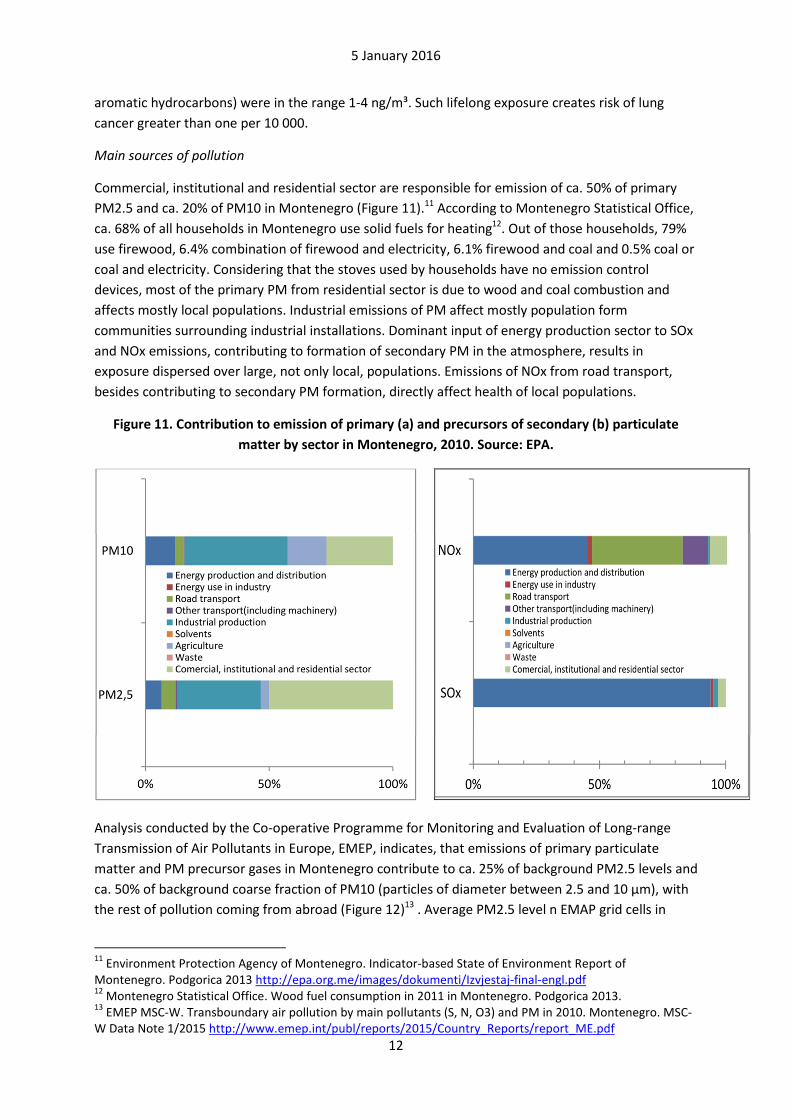
Commercial, institutional and residential sector are responsible for emission of ca. 50% of primary
PM2.5 and ca. 20% of PM10 in Montenegro (Figure 11).11 According to Montenegro Statistical Office,
ca. 68% of all households in Montenegro use solid fuels for heating12. Out of those households, 79%
use firewood, 6.4% combination of firewood and electricity, 6.1% firewood and coal and 0.5% coal or
coal and electricity. Considering that the stoves used by households have no emission control
devices, most of the primary PM from residential sector is due to wood and coal combustion and
affects mostly local populations. Industrial emissions of PM affect mostly population form
communities surrounding industrial installations. Dominant input of energy production sector to SOx
and NOx emissions, contributing to formation of secondary PM in the atmosphere, results in
exposure dispersed over large, not only local, populations. Emissions of NOx from road transport,
besides contributing to secondary PM formation, directly affect health of local populations.
Figure 11. Contribution to emission of primary (a) and precursors of secondary (b) particulate
matter by sector in Montenegro, 2010. Source: EPA.
Analysis conducted by the Co-operative Programme for Monitoring and Evaluation of Long-range
Transmission of Air Pollutants in Europe, EMEP, indicates, that emissions of primary particulate
matter and PM precursor gases in Montenegro contribute to ca. 25% of background PM2.5 levels and
ca. 50% of background coarse fraction of PM10 (particles of diameter between 2.5 and 10 µm), with
the rest of pollution coming from abroad (Figure 12)13 . Average PM2.5 level n EMAP grid cells in
11
Environment Protection Agency of Montenegro. Indicator-based State of Environment Report of Montenegro. Podgorica 2013 http://epa.org.me/images/dokumenti/Izvjestaj-final-engl.pdf 12
Montenegro Statistical Office. Wood fuel consumption in 2011 in Montenegro. Podgorica 2013. 13
EMEP MSC-W. Transboundary air pollution by main pollutants (S, N, O3) and PM in 2010. Montenegro. MSC-W Data Note 1/2015 http://www.emep.int/publ/reports/2015/Country_Reports/report_ME.pdf
5 January 2016
13
Montenegro range from 6 to 10 µg/m³. This indicates that that vast majority of particulate matter
measured in urban locations is of local origin.
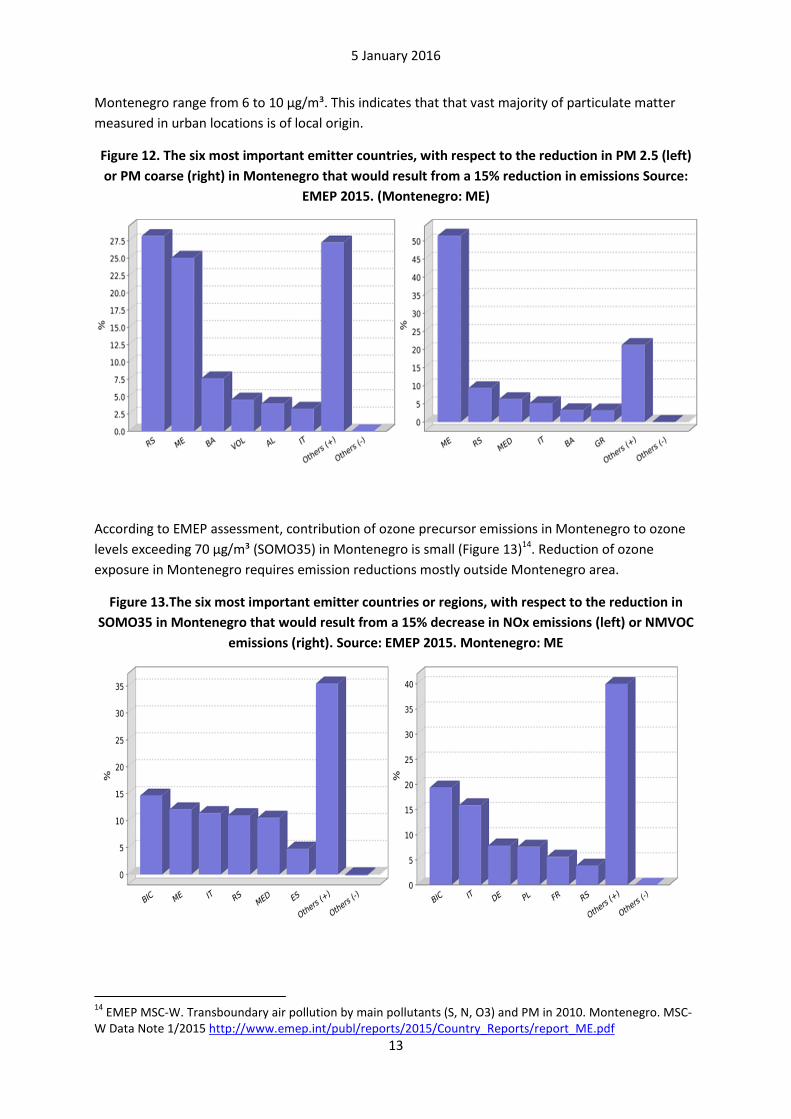
Figure 12. The six most important emitter countries, with respect to the reduction in PM 2.5 (left)
or PM coarse (right) in Montenegro that would result from a 15% reduction in emissions Source:
EMEP 2015. (Montenegro: ME)
According to EMEP assessment, contribution of ozone precursor emissions in Montenegro to ozone
levels exceeding 70 µg/m³ (SOMO35) in Montenegro is small (Figure 13)14. Reduction of ozone
exposure in Montenegro requires emission reductions mostly outside Montenegro area.
Figure 13.The six most important emitter countries or regions, with respect to the reduction in
SOMO35 in Montenegro that would result from a 15% decrease in NOx emissions (left) or NMVOC
emissions (right). Source: EMEP 2015. Montenegro: ME
14
EMEP MSC-W. Transboundary air pollution by main pollutants (S, N, O3) and PM in 2010. Montenegro. MSC-W Data Note 1/2015 http://www.emep.int/publ/reports/2015/Country_Reports/report_ME.pdf
5 January 2016
14
Impacts of air pollution on health in Montenegro
Published estimates of burden of disease attributed to air pollution in Montenegro
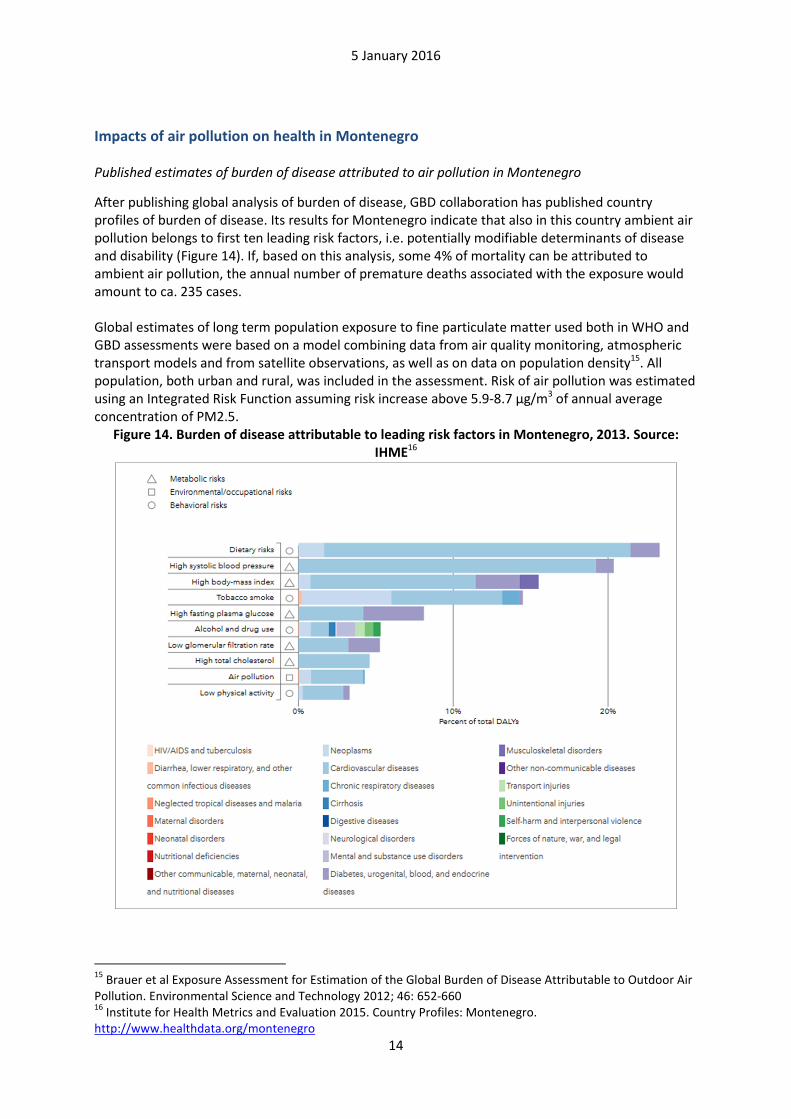
After publishing global analysis of burden of disease, GBD collaboration has published country profiles of burden of disease. Its results for Montenegro indicate that also in this country ambient air pollution belongs to first ten leading risk factors, i.e. potentially modifiable determinants of disease and disability (Figure 14). If, based on this analysis, some 4% of mortality can be attributed to ambient air pollution, the annual number of premature deaths associated with the exposure would amount to ca. 235 cases. Global estimates of long term population exposure to fine particulate matter used both in WHO and GBD assessments were based on a model combining data from air quality monitoring, atmospheric transport models and from satellite observations, as well as on data on population density15. All population, both urban and rural, was included in the assessment. Risk of air pollution was estimated using an Integrated Risk Function assuming risk increase above 5.9-8.7 µg/m3 of annual average concentration of PM2.5.
Figure 14. Burden of disease attributable to leading risk factors in Montenegro, 2013. Source:
IHME16
15
Brauer et al Exposure Assessment for Estimation of the Global Burden of Disease Attributable to Outdoor Air Pollution. Environmental Science and Technology 2012; 46: 652-660 16
Institute for Health Metrics and Evaluation 2015. Country Profiles: Montenegro. http://www.healthdata.org/montenegro
5 January 2016
15
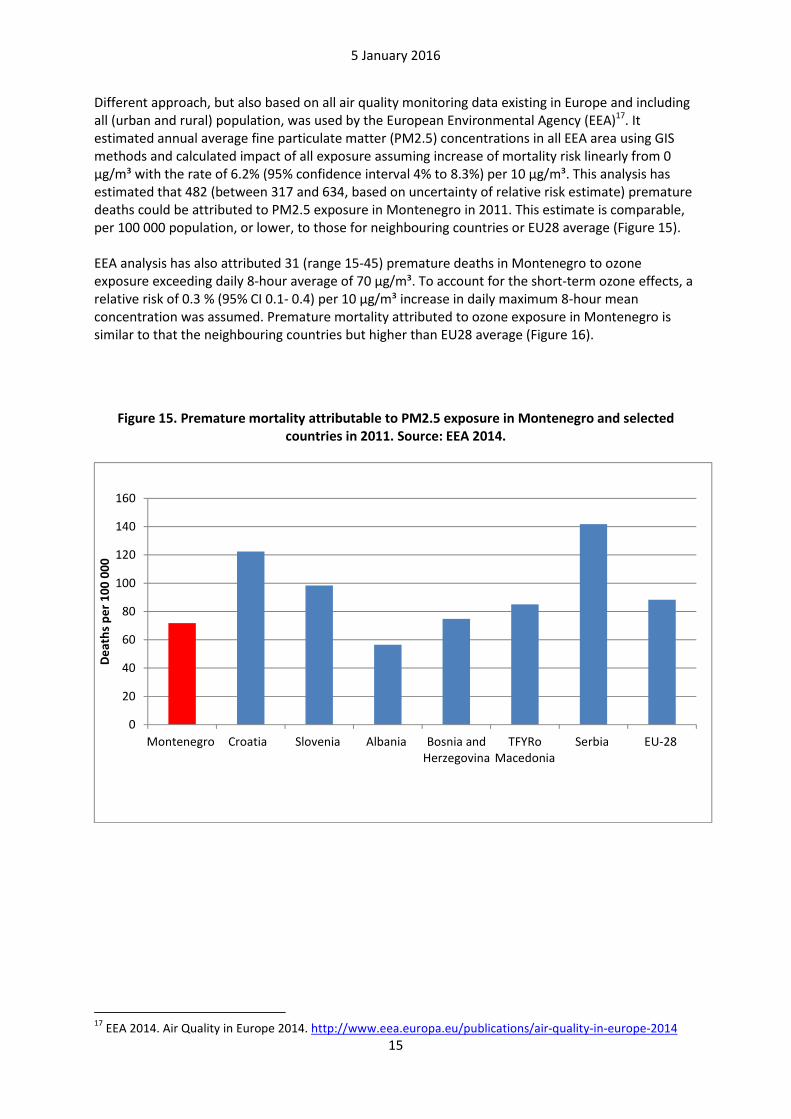
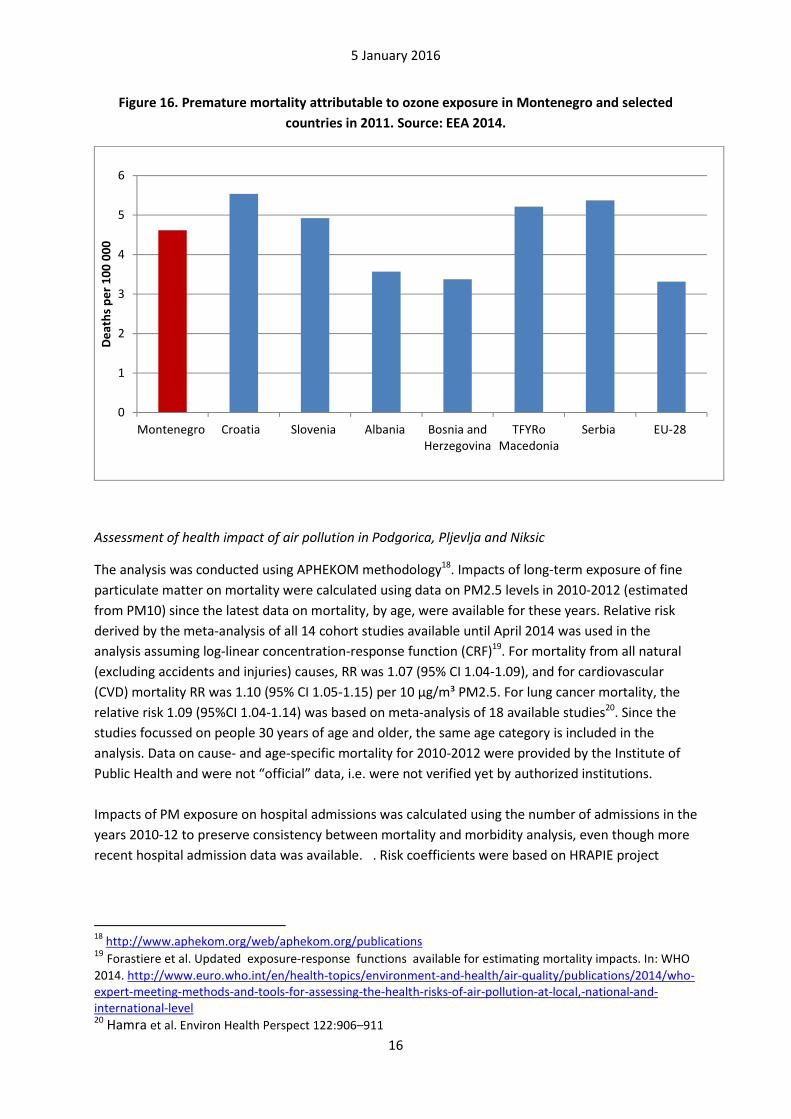
Different approach, but also based on all air quality monitoring data existing in Europe and including all (urban and rural) population, was used by the European Environmental Agency (EEA)17. It estimated annual average fine particulate matter (PM2.5) concentrations in all EEA area using GIS methods and calculated impact of all exposure assuming increase of mortality risk linearly from 0 µg/m³ with the rate of 6.2% (95% confidence interval 4% to 8.3%) per 10 µg/m³. This analysis has estimated that 482 (between 317 and 634, based on uncertainty of relative risk estimate) premature deaths could be attributed to PM2.5 exposure in Montenegro in 2011. This estimate is comparable, per 100 000 population, or lower, to those for neighbouring countries or EU28 average (Figure 15). EEA analysis has also attributed 31 (range 15-45) premature deaths in Montenegro to ozone exposure exceeding daily 8-hour average of 70 µg/m³. To account for the short-term ozone effects, a relative risk of 0.3 % (95% CI 0.1- 0.4) per 10 µg/m³ increase in daily maximum 8-hour mean concentration was assumed. Premature mortality attributed to ozone exposure in Montenegro is similar to that the neighbouring countries but higher than EU28 average (Figure 16).
Figure 15. Premature mortality attributable to PM2.5 exposure in Montenegro and selected
countries in 2011. Source: EEA 2014.
17
EEA 2014. Air Quality in Europe 2014. http://www.eea.europa.eu/publications/air-quality-in-europe-2014
0
20
40
60
80
100
120
140
160
Montenegro Croatia Slovenia Albania Bosnia andHerzegovina
TFYRoMacedonia
Serbia EU-28
De
ath
s p
er
10
0 0
00
5 January 2016
16
Figure 16. Premature mortality attributable to ozone exposure in Montenegro and selected
countries in 2011. Source: EEA 2014.
Assessment of health impact of air pollution in Podgorica, Pljevlja and Niksic
The analysis was conducted using APHEKOM methodology18. Impacts of long-term exposure of fine
particulate matter on mortality were calculated using data on PM2.5 levels in 2010-2012 (estimated
from PM10) since the latest data on mortality, by age, were available for these years. Relative risk
derived by the meta-analysis of all 14 cohort studies available until April 2014 was used in the
analysis assuming log-linear concentration-response function (CRF)19. For mortality from all natural
(excluding accidents and injuries) causes, RR was 1.07 (95% CI 1.04-1.09), and for cardiovascular
(CVD) mortality RR was 1.10 (95% CI 1.05-1.15) per 10 µg/m³ PM2.5. For lung cancer mortality, the
relative risk 1.09 (95%CI 1.04-1.14) was based on meta-analysis of 18 available studies20. Since the
studies focussed on people 30 years of age and older, the same age category is included in the
analysis. Data on cause- and age-specific mortality for 2010-2012 were provided by the Institute of
Public Health and were not “official” data, i.e. were not verified yet by authorized institutions.
Impacts of PM exposure on hospital admissions was calculated using the number of admissions in the
years 2010-12 to preserve consistency between mortality and morbidity analysis, even though more
recent hospital admission data was available. . Risk coefficients were based on HRAPIE project
18
http://www.aphekom.org/web/aphekom.org/publications 19 Forastiere et al. Updated exposure-response functions available for estimating mortality impacts. In: WHO
2014. http://www.euro.who.int/en/health-topics/environment-and-health/air-quality/publications/2014/who-expert-meeting-methods-and-tools-for-assessing-the-health-risks-of-air-pollution-at-local,-national-and-international-level 20 Hamra et al. Environ Health Perspect 122:906–911
0
1
2
3
4
5
6
Montenegro Croatia Slovenia Albania Bosnia andHerzegovina
TFYRoMacedonia
Serbia EU-28
De
ath
s p
er
10
0 0
00
5 January 2016
17
recommending RR =1.0091 (95% CI 1.0017-1.0166) per 10 µg/m³ PM2.5 for hospital admissions for
cardiovascular hospitalizations and 1.0190 (1-1.0402) for respiratory admissions. 21
Using the data on exposure to PM, the following approximations were made:
• Since the data on PM2.5 were not available for 2010-2012 in Podgorica and for 2010-11 in Pljevlja and Niksic, they were estimated from the available PM10 concentration assuming that PM2.5=0.56*PM10. The coefficient 0.56 was based on the ratio PM2.5/PM10 in Pljevlja and Niksic, where both pollutants were monitored simultaneously in 2012-2014.
• PM10 data for Niksic were incomplete in 2012 (measured in 235 days only). To avoid distortion of exposure data, the measurements from 2013 were used instead (done in 336 days).
Two different questions were considered in the analysis. The first concerned the burden of long term
exposure to PM exceeding WHO Air Quality Guidelines level of 10 µg/m³ of PM2.5. Achievement of
such PM2.5 levels would require reduction of PM2.5 annual mean concentration by 9.1µg/m³ in
Podgorica, by 19.5 µg/m³ in Niksic and by 37.2µg/m³ in Pljevlja.
The calculations indicate that close to 6% of all deaths in Podgorica, 12% in Niksic and 22% of deaths
in Pljevlja can be attributed to air pollution exceeding WHO AQG levels (Table 3). As could have been
expected on the basis of exposure levels, health burden of pollution expressed by the life expectancy
lost, number of premature deaths per capita and the proportion of mortality attributed to pollution,
is markedly higher in Pljevlja than in the other two cities. However, due to larger population,
numbers of premature deaths attributable to the exposure are similar in all cities. Loss of life
expectancy at various ages associated with the exposure is presented in Annex 2.
Ca. 80% of deaths attributed to air pollution was due to cardiovascular diseases in Podgorica and
Niksic. For Pljevlja this share was ca 60%.
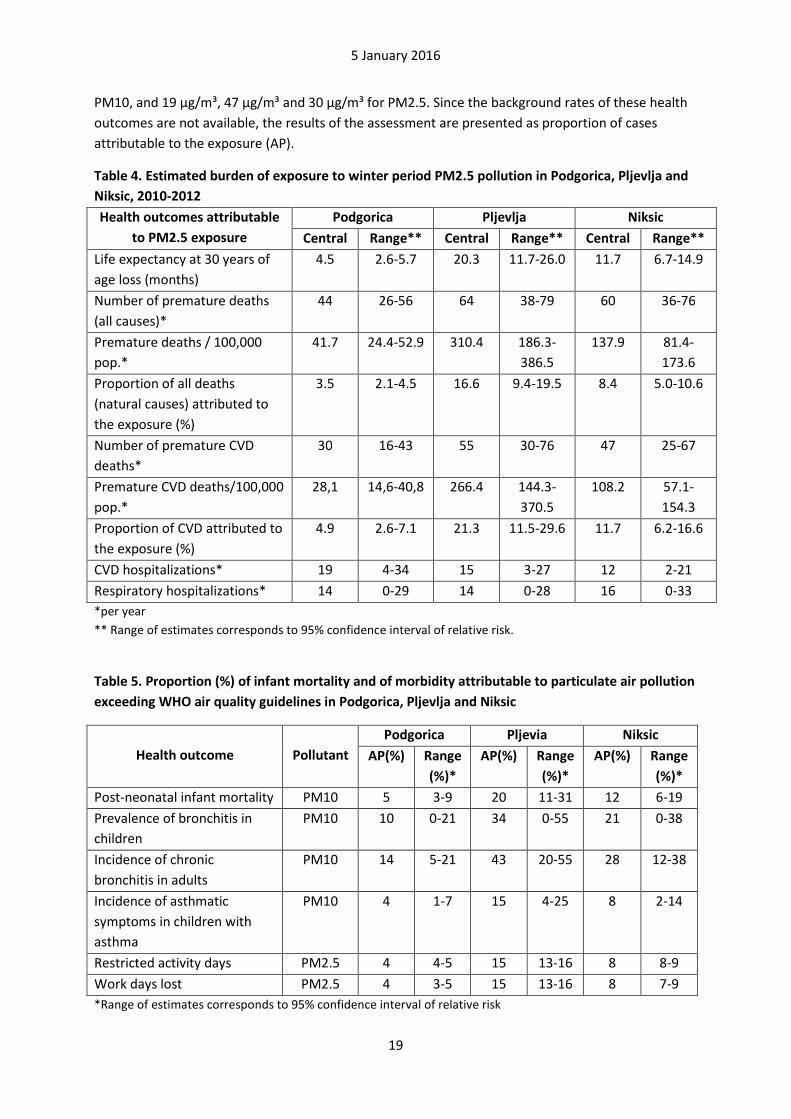
The second analysis evaluated the burden to health of winter period pollution. It was conducted
calculating the impact of PM2.5 exceeding average level of PM2.5 observed in each of the cities in
the summer periods of 2010-2012. This level was calculated for each city separately from PM10
measurements conducted from 1 May to 30 September in the years 2010-2014 and converted to
PM2.5 levels using the formula PM2.5=0.56*PM10. This calculation resulted in the summer period
average PM2.5 of 13.8 µg/m³ (lower than annual average by 5.3 µg/m³) in Podgorica, 16.5 µ/m³ in
Niksic (lower than annual average by 11.7 µg/m³) and 21.9 µg/m³ (lower than annual average by 25.3
µg/m³) in Pljevlja. Results of this analysis are presented in Table 4.
21
WHO 2013. http://www.euro.who.int/en/health-topics/environment-and-health/air-quality/publications/2013/health-risks-of-air-pollution-in-europe-hrapie-project.-recommendations-for-concentrationresponse-functions-for-costbenefit-analysis-of-particulate-matter,-ozone-and-nitrogen-dioxide

5 January 2016
18
Table 3. Estimated health burden of exposure to PM2.5 exceeding WHO AQG level in Podgorica,
Pljevlja and Niksic, 2010-2012
Health outcomes attributable
to PM2.5 exposure
Podgorica Pljevlja Niksic
Central Range** Central Range** Central Range**
Life expectancy at 30 years of
age loss (months)
7.7 4.5-9.9 30.2 17.3-38.8 17.6 10.1-22.6
Number of premature deaths
(all causes)*
75 44-95 90 55-111 88 53-111
Premature deaths / 100,000
pop.*
70.7 41.5-89.3 439.9 268.3-
542.3
202.3 120.5-
253.2
Proportion of all deaths
(natural causes) attributed to
the exposure (%)
6.0 3.5-7.5 22.2 13.5-27.3 12.4 7.4-15.5
Number of premature CVD
deaths*
51 26-73 76 42-104 69 39-97
Premature CVD
deaths/100,000 pop.*
47,5 24,8-68,2 371.9 206.7-
505.3
157.4 84.2-
221.4
Proportion of CVD attributed
to the exposure (%)
8.3 4.3-11.9 29.7 16.5-40.4 17.0 9.1-23.9
Number of premature lung
cancer deaths*
1 0-1 3 1-4 6 3-8
Premature lung cancer
deaths/100,000 pop.*
0.8 0.4-1.2 13,4 6,9-18,3 12,7 6.1-18.2
Proportion of lung cancer
attributed to the exposure (%)
7 3-11 25 13-34 15 7-21
CVD hospitalizations* 33 6-59 22 4-40 17 3-31
Respiratory hospitalizations* 24 0-50 20 0-40 24 0-48
* per year
** Range of estimates corresponds to 95% confidence interval of relative risk.
Reducing annual average particulate air pollution to the levels observed in summer period would
result in elimination of substantial proportion of impact of pollution on life expectancy (58% in
Podgorica, 66% in Niksic and 67% in Pljevlja). However, significant impact on health would still
remain, especially in Pljevlja, with ca. 10 months of life expectancy lost due to pollution markedly
exceeding WHO AQG levels also in the summer. This pollution is probably due to the emissions from
the Thermal Power Plant and mining-related activities, including emissions from the mining
machinery and trucks transporting mined materials.
Besides impacts on adult´s mortality, air pollution affects infant mortality as well as occurrence of
respiratory and cardiovascular diseases in children and adults. Table 5 presents the results of
assessment of the impact on those outcomes of particulate matter exceeding WHO air quality
guidelines levels for PM (20 µg/m³ for PM10 or 10 µg/m³ for PM2.5). Relative risk of each of the
considered outcomes recommended by WHO HRAPIE project is used to estimate the proportion of
cases attributable to the exposure. Calculations were made using average PM levels in Podgorica,
Pljevja and Niksic for the period 2010-2012: 34 µg/m³, 84 µg/m³ and 53 µg/m³, respectively, for
5 January 2016
19
PM10, and 19 µg/m³, 47 µg/m³ and 30 µg/m³ for PM2.5. Since the background rates of these health
outcomes are not available, the results of the assessment are presented as proportion of cases
attributable to the exposure (AP).
Table 4. Estimated burden of exposure to winter period PM2.5 pollution in Podgorica, Pljevlja and
Niksic, 2010-2012
Health outcomes attributable
to PM2.5 exposure
Podgorica Pljevlja Niksic
Central Range** Central Range** Central Range**
Life expectancy at 30 years of
age loss (months)
4.5 2.6-5.7 20.3 11.7-26.0 11.7 6.7-14.9
Number of premature deaths
(all causes)*
44 26-56 64 38-79 60 36-76
Premature deaths / 100,000
pop.*
41.7 24.4-52.9 310.4 186.3-
386.5
137.9 81.4-
173.6
Proportion of all deaths
(natural causes) attributed to
the exposure (%)
3.5 2.1-4.5 16.6 9.4-19.5 8.4 5.0-10.6
Number of premature CVD
deaths*
30 16-43 55 30-76 47 25-67
Premature CVD deaths/100,000
pop.*
28,1 14,6-40,8 266.4 144.3-
370.5
108.2 57.1-
154.3
Proportion of CVD attributed to
the exposure (%)
4.9 2.6-7.1 21.3 11.5-29.6 11.7 6.2-16.6
CVD hospitalizations* 19 4-34 15 3-27 12 2-21
Respiratory hospitalizations* 14 0-29 14 0-28 16 0-33
*per year
** Range of estimates corresponds to 95% confidence interval of relative risk.
Table 5. Proportion (%) of infant mortality and of morbidity attributable to particulate air pollution
exceeding WHO air quality guidelines in Podgorica, Pljevlja and Niksic
Health outcome
Pollutant
Podgorica Pljevia Niksic
AP(%) Range
(%)*
AP(%) Range
(%)*
AP(%) Range
(%)*
Post-neonatal infant mortality PM10 5 3-9 20 11-31 12 6-19
Prevalence of bronchitis in
children
PM10 10 0-21 34 0-55 21 0-38
Incidence of chronic
bronchitis in adults
PM10 14 5-21 43 20-55 28 12-38
Incidence of asthmatic
symptoms in children with
asthma
PM10 4 1-7 15 4-25 8 2-14
Restricted activity days PM2.5 4 4-5 15 13-16 8 8-9
Work days lost PM2.5 4 3-5 15 13-16 8 7-9
*Range of estimates corresponds to 95% confidence interval of relative risk
5 January 2016
20
Discussion
Analysis of data on population exposure to particulate matter in Podgorica, Pljevlja and Niksic
indicates that air pollution creates significant burden to health in cities of Montenegro. Present
results are consistent with earlier country-level assessments conducted in the framework of
European or global projects. When expressed per capita, the burden of pollution is markedly greater
in Pljevlja than in other cities. However, absolute level of effects, expressed in number of premature
deaths, years of life lost or number of hospitalizations attributed to the exposure is similar in all three
analysed cities.
Growing evidence indicates that impacts of exposure to fine particulate matter occur even at PM2.5
concentrations below current WHO Air Quality Guidelines levels which were used as a reference level
in this analysis. Therefore, the estimates of burden presented here under-estimate real burden of
pollution in the three cities of Montenegro.
Substantial part of the burden can be attributed to the excessive air pollution occurring in winter
months. This high pollution can be due both to the combustion of solid fuels (wood and, mainly in
Pljevlja, coal) for households heating and to weather conditions reducing dispersion of the pollution.
Combustion of solid fuels for cooking and heating is also significantly increasing total exposure to air
pollution of residents of houses using solid fuel for cooking and heating due to direct emission of
pollution to indoor spaces. This would result in additional health effects of air pollution, which are
not quantified in this analysis.
Particulate matter is the most important indicator of health-relevant pollution in all Montenegro. In
Pljevlja, also SO2 is reaching high levels and may promote respiratory symptoms. These effects
overlap with those of PM since both types of pollution, emitted from combustion of coal, are highly
correlated. Adverse effects of ozone exposure are an order of magnitude smaller than those of PM
and occur mostly outside of urban areas. Direct effects of NO2 exposure on all population are not
significant though might be higher among people leaving on streets with intensive traffic. These
effects could not be quantified with available data but should be assessed in the future.
To illustrate the magnitude of impacts of air pollution on health, the estimates of present analysis
can be compared with indicators commonly used to evaluate health status of population, such as life
expectancy. Life expectancy at age 15 has increased by ca. 15 months between 2000 and 2009 in
Montenegro (at a rate comparable with average for WHO European Region)22. The 7.7 months of life
expectancy (at age of 30 years) lost due to pollution in Podgorica is ca. half of the life expectancy
increase in the decade. For Pljevlja, the loss of life expectancy due to pollution (30.2 months) could
be, potentially, compensated by the life expectancy growth at a rate observed for years 2000-2009
continuing over two decades. Another comparison can be made with mortality due to other causes.
Annual premature mortality associated with exposure to PM was ca 10-60 times greater than
mortality due to road traffic accidents or 2-20 times greater than mortality due to digestive system
diseases in Montenegro22.
22
WHO Health for All database http://data.euro.who.int/hfadb/
5 January 2016
21
The OECD estimate of the Value of Statistical Life for Montenegro is 1.45 million US$23. Based on this
estimate, economic value of premature deaths attributable to PM pollution exceeding WHO AQG
level is ca. 367 million US$ in the three analysed cities annually. This cost estimate does not include
costs of health services (hospitalizations, treatment of symptoms) or costs related to the restricted
activity or work days lost.
Evaluation of health impacts of the planned new block of the Thermal Power Plant Pljevlja indicates
that emissions from it could result in additional 16 deaths and 160 years of life lost pre year24. This is
less than 1/5 of the current impacts of air pollution in Pljevlja. While it is very important to avoid
additional pollution, and its health impacts, the priority should be elimination of current emissions
and population exposure to it.
Population exposure to ambient air pollution was determined in this analysis with the use of data on
concentration of particulate matter in one location in each city only. Such approach may, potentially,
be a source of error in health impact estimation. Its magnitude and direction (towards over- or
under-estimation) of real impacts can be assessed by evaluation of spatial variability of the pollution
in each city and its relation to the population distribution. Short (14 days only) study completed in
Podgorica indicates that PM10 levels measured in two compared locations are close to each other
but a longer study is needed to evaluate spatial variation of pollution in the city and confirm that
measurements done in one location properly reflect population exposure. It might be also
appropriate to consider a permanent operation of second PM10 and PM2.5 monitoring station in
Podgorica, located in “urban background” site as well as monitoring of PM2.5 in the currently
operated station.
Precision of health-related information is also an important factor influencing error of the burden of
disease estimates. Any changes in the data due to their verification will affect the presented
estimates. Lack of data on prevalence of respiratory symptoms precludes estimation of number of
cases of these diseases attributable to the pollution in Montenegro.
Reduction of emission of pollutants, especially from combustion of solid fuels for residential heating,
should be priority approach to the reduction of population exposure to air pollution and of its health
effects. Increase of energy efficiency through better insulation of homes, shift to cleaner fuels (gas,
electricity) for cooking and heating, and use of solar energy for heat and electricity production would
be beneficial to health and would have additional positive environmental effects in all Montenegro.
Special efforts to clean the air are needed for Pljevlja. Replacement of the present Thermal Power
Plant by the new block might contribute to the emission reductions if all currently available pollution
control technologies are applied in it. Use of the heat generated by the new block for heating of
houses in Pljevlja may eliminate the need for coal combustion for heating if the central heating is
made available and affordable to the residents. Reduction of pollution from the mining activities will
need to be addressed as well. Big health costs of current pollution justify public financing of these
measures.
23
WHO 2015. Economic costs of the health impact of air pollution in Europe. 24
NGO Green Home. Analysis of the effect of the Thermal Power Plant „Pljevlja“ on citizens of Pljevlja with prediction of the second block of the Thermal Power Plant “Pljevlja” on health. December 2013
5 January 2016
22
Conclusions Available data enabled identification of the magnitude of health burden of air pollution in Podgorica,
Plevlja and Niksic. More than 250 premature deaths and 140 hospital admissions per year, and a
number of other health outcomes are associated with the exposure exceeding the level of particulate
matter recommended by WHO air quality guidelines. More than half of these effects are associated
with elevated levels of pollution in the winter caused mainly by combustion of solid fuels for heating.
Occurrence of health effects of air pollution in Pljevlja is more common than in the other cities, but
absolute burden of pollution to health is similar in Podgorica and Niksic to that in Pljevlja. Health
effects of present air pollution in Pljevlja are five times greater than those potentially associated with
emissions from the planned 2nd block of the Thermal Power Plant. To reduce health effects of air
pollution in cities of Montenegro, a significant decrease of solid fuels combustion for household
heating and cooking is necessary. Further studies are necessary to estimate exposure of urban
population to traffic-related pollution and its health impacts.
Acknowledgements This assessment has been conducted in the framework of the Bi-annual Collaboration Agreement
between the Republic of Montenegro and the World Health Organization. It was organized be the
WHO Country Office in Montenegro in collaboration with the Ministry of Health of Montenegro and
Ministry of Sustainable Development and Tourism of Montenegro. Dr Borko Baijc and Ms Nataša
Terzić, MSc, of Institute of Public Health of Montenegro provided assistance and access to health
data. Dr Danijela Sukovic and Radomir Žujović of the Center for Eco-Toxicological Research in
Podgorica provided air quality data and assisted in understanding of air quality monitoring in
Montenegro. Representatives of the Ministry of Health, Ministry of Sustainable Development and
Tourism, Environmental Protection Agency, Institute of Public Health, presidents of Pljevlja and
Niksic, staff of UNDP Montenegro Office and representatives of several NGO provided important
information regarding local situation enabling scoping and development of the present assessment.
5 January 2016
23
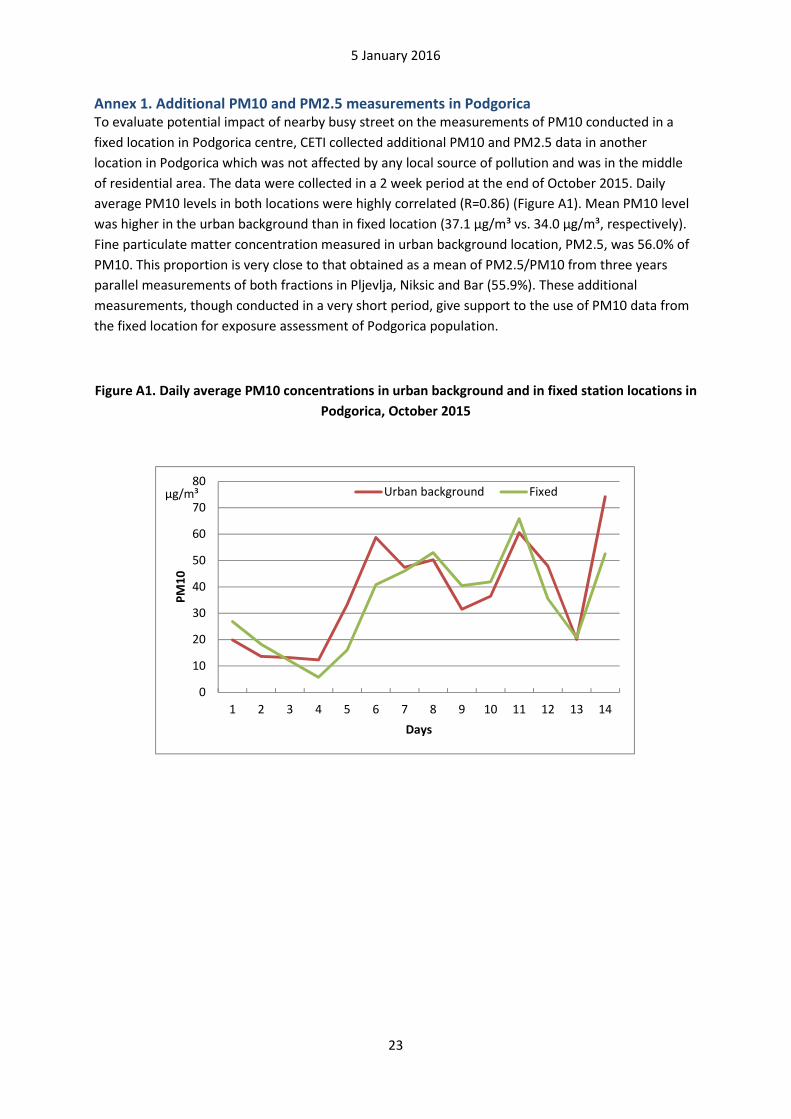
Annex 1. Additional PM10 and PM2.5 measurements in Podgorica To evaluate potential impact of nearby busy street on the measurements of PM10 conducted in a
fixed location in Podgorica centre, CETI collected additional PM10 and PM2.5 data in another
location in Podgorica which was not affected by any local source of pollution and was in the middle
of residential area. The data were collected in a 2 week period at the end of October 2015. Daily
average PM10 levels in both locations were highly correlated (R=0.86) (Figure A1). Mean PM10 level
was higher in the urban background than in fixed location (37.1 µg/m³ vs. 34.0 µg/m³, respectively).
Fine particulate matter concentration measured in urban background location, PM2.5, was 56.0% of
PM10. This proportion is very close to that obtained as a mean of PM2.5/PM10 from three years
parallel measurements of both fractions in Pljevlja, Niksic and Bar (55.9%). These additional
measurements, though conducted in a very short period, give support to the use of PM10 data from
the fixed location for exposure assessment of Podgorica population.
Figure A1. Daily average PM10 concentrations in urban background and in fixed station locations in
Podgorica, October 2015
0
10
20
30
40
50
60
70
80
1 2 3 4 5 6 7 8 9 10 11 12 13 14
PM
10
Days
Urban background Fixedµg/m³

5 January 2016
24
Annex 2. Life expectancy loss by age Estimated life expectancy loss (months) at various ages associated with exposure to PM2.5
exceeding WHA AQG level in Podgorica, Pljievlja and Niksic, 2010-2012
Age Podgorica Pljevlja Niksic
Central Range Central Range Central Range
30 7.7 4.5-9.9 30.2 17.3-38.8 17.6 10.1-22.6
35 7.7 4.4-9.8 29.9 17.1-38.4 17.5 10.1-22.5
40 7.6 4.4-9.6 29.3 16.7-37.7 17.3 9.9-22.2
45 7.4 4.3-9.5 28.7 16.4-37.0 17.0 9.8-21.8
50 7.1 4.1-9.1 27.6 15.7-35.6 16.4 9.4-21.1
55 6.9 4.0-8.8 26.7 15.2-34.5 15.7 9.0-20.2
60 6.4 3.7-8.2 25.0 14.1-32.2 14.8 8.5-19.1
65 6.0 3.5-7.7 23.3 13.2-30.2 13.7 7.8-17.7
70 5.3 3.1-6.8 20.6 11.5-26.8 12.3 7.0-15.8
75 4.9 2.8-6.3 19.1 10.6-25.0 11.4 6.4-14.7
80 4.4 2.5-5.6 17.0 9.4-22.3 10.4 5.9-13.5
85+ 4.1 3.4-5.3 15.8 8.7-20.9 9.9 5.6-12.9